the Creative Commons Attribution 4.0 License.
the Creative Commons Attribution 4.0 License.
 | 29 Aug 2019
Aerosol radiative effects with MACv2
Stefan Kinne
Monthly global maps for aerosol properties of the Max Planck Aerosol Climatology version 2 (MACv2) are applied in an offline radiative transfer model to determine aerosol radiative effects. This model setup cannot address rapid adjustments by clouds, but current evidence suggests their contribution to be small when compared to the instantaneous radiative forcing. Global maps are presented to detail the regional and seasonal variability associated with (annual) global averages. Radiative effects caused by the aerosol presence (direct effects) and by aerosol modified clouds (indirect effects) are examined. Direct effects are determined for total aerosol, anthropogenic aerosol and extracted individual aerosol components. Indirect effects cover the impact of reduced cloud drop sizes by anthropogenic aerosol.
Present-day global annual radiative effects for anthropogenic aerosol yield (1) a climate cooling of −1.0 W m−2 at the top of the atmosphere (TOA); (2) a surface net-flux reduction of −2.1 W m−2; and, by difference; (3) an atmospheric effect of +1.1 W m−2. This atmospheric solar heating is almost entirely a direct effect. On a global basis, indirect effects (−0.65 W m−2) dominate direct effects (−0.35 W m−2) for the present-day climate response at the TOA, whereas the present-day surface radiative budget is more strongly reduced by direct effects (−1.45 W m−2) than by indirect effects (−0.65 W m−2).
Natural aerosols are on average less absorbing and larger in size. However, their stronger solar TOA cooling efficiency is offset by a non-negligible infrared (IR) greenhouse warming efficiency. In the sum the global average annual direct forcing efficiencies (per unit AOD) for natural and anthropogenic aerosol are similar: −12 W m−2 per unit AOD for all-sky conditions and −24 W m−2 per unit AOD for clear-sky conditions.
The present-day direct TOA impact by all soot (BC) is +0.55 W m−2, when globally and annually averaged. Between +0.25 and +0.45 W m−2 of that can be attributed to anthropogenic sources, depending on assumptions for the preindustrial BC reference state. Similarly, the preindustrial fine-mode reference uncertainty has a strong influence not just on the direct effect but even more on the indirect effect. Present-day aerosol TOA forcing is estimated to stay within the −0.7 to −1.6 W m−2 range (with the best estimate at −1.0 W m−2).
Calculations with scaled temporal changes to anthropogenic AOD from global modeling indicate that the global annual aerosol forcing has not changed much over the last decades, despite strong shifts in regional maxima for anthropogenic AOD. These regional shifts explain most solar insolation (brightening or dimming) trends that have been observed by ground-based radiation data.
- Article
(39998 KB) - Full-text XML
- BibTeX
- EndNote


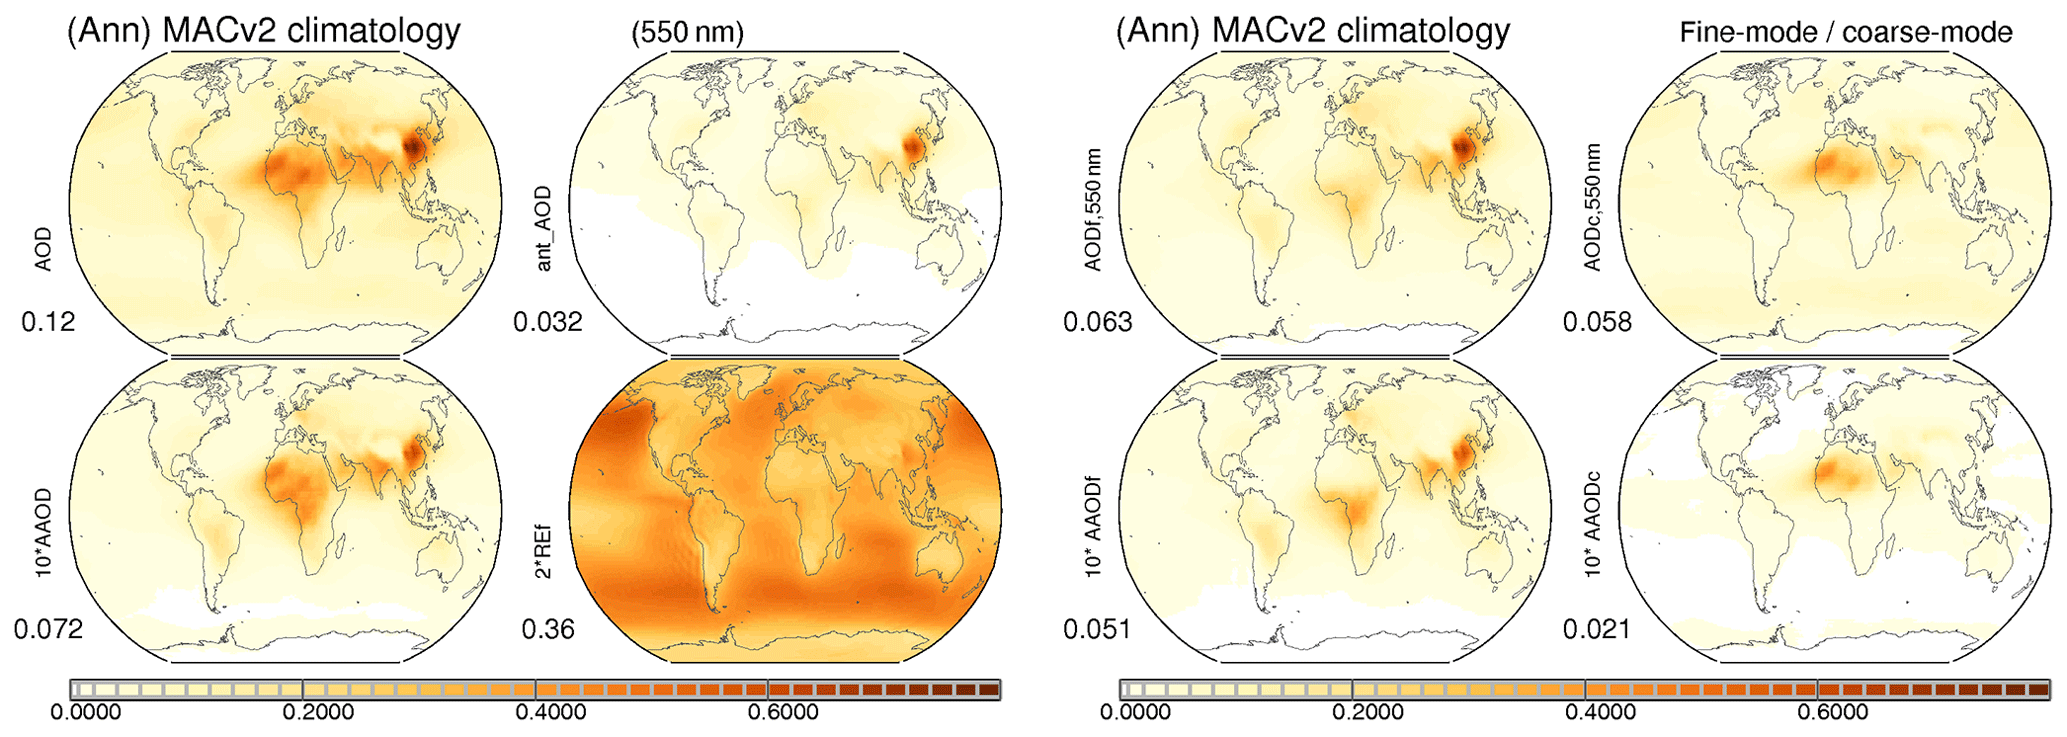
Figure 1Annual average maps of the MACv2 aerosol climatology. Global distributions are presented for present-day column properties of aerosol amount (AOD), absorption (AAOD×10), anthropogenic AOD and fine-mode effective radius (REf×2) in micrometers (µm). Also presented are the midvisible AOD and AAOD split into fine-mode (radii <0.5 µm) and coarse-mode (radii >0.5 µm) contributions. Labels indicate global averages.
Atmospheric aerosol modulates the radiative energy budget directly (by the aerosol presence) and indirectly (by modifying the properties of clouds). Such impacts are of interest for climate change predictions, because part of today's atmospheric aerosol is anthropogenic. A quantification of aerosol impacts on global scales, however, is difficult. Tropospheric aerosol is highly variable in space and time, and the needed preindustrial reference for anthropogenic impacts is poorly defined. The determination of aerosol impacts requires two simulations: one with aerosol and one with less or no aerosol. Usually complex “bottom-up” simulations with global models are applied, in which emissions of different aerosol sources are chemically and/or cloud processed, mixed, transported and removed. Further assumptions for size and water uptake are needed to determine associated aerosol optical properties. These in turn are needed to estimate aerosol radiative impacts in broadband radiative transfer applications. This path involves many uncertainties. And many repeated simulations are generally needed to constrain natural variability (mainly by clouds). These bottom-up simulations are essential to account for feedbacks and delayed or spatially detached responses in the climate system. Fortunately, for aerosol radiative impacts feedbacks are secondary in strength (Fiedler et al., 2019). Thus, offline radiative transfer applications to determine an instantaneous impact via a dual-call mode seem sufficient. Hereby, selected properties of aerosol (for direct radiative impacts) and/or of (aerosol modified) clouds (for total/indirect radiative impacts) are modified with respect to a reference simulation. And baseline properties for aerosol and its environment are prescribed by monthly global maps linked to observational data. Aerosol properties are prescribed by the MACv2 aerosol climatology (Kinne, 2019). MACv2 defines global (monthly, gridded) maps for aerosol optical and radiative properties. Aerosol component detail is derived in a (reverse processing) “top-down” approach to define the spectrally resolved aerosol single scattering properties (needed for broadband radiative transfer). By prescribing optical properties for aerosol and clouds (with strong links to observations), simulated aerosol radiative impacts are faster, more precise and more direct than with bottom-up approaches. First the assumed MACv2 and environmental properties are presented. Then the applied radiative transfer scheme is outlined. And finally radiative impacts are presented for total and anthropogenic aerosol – also as a function of time.
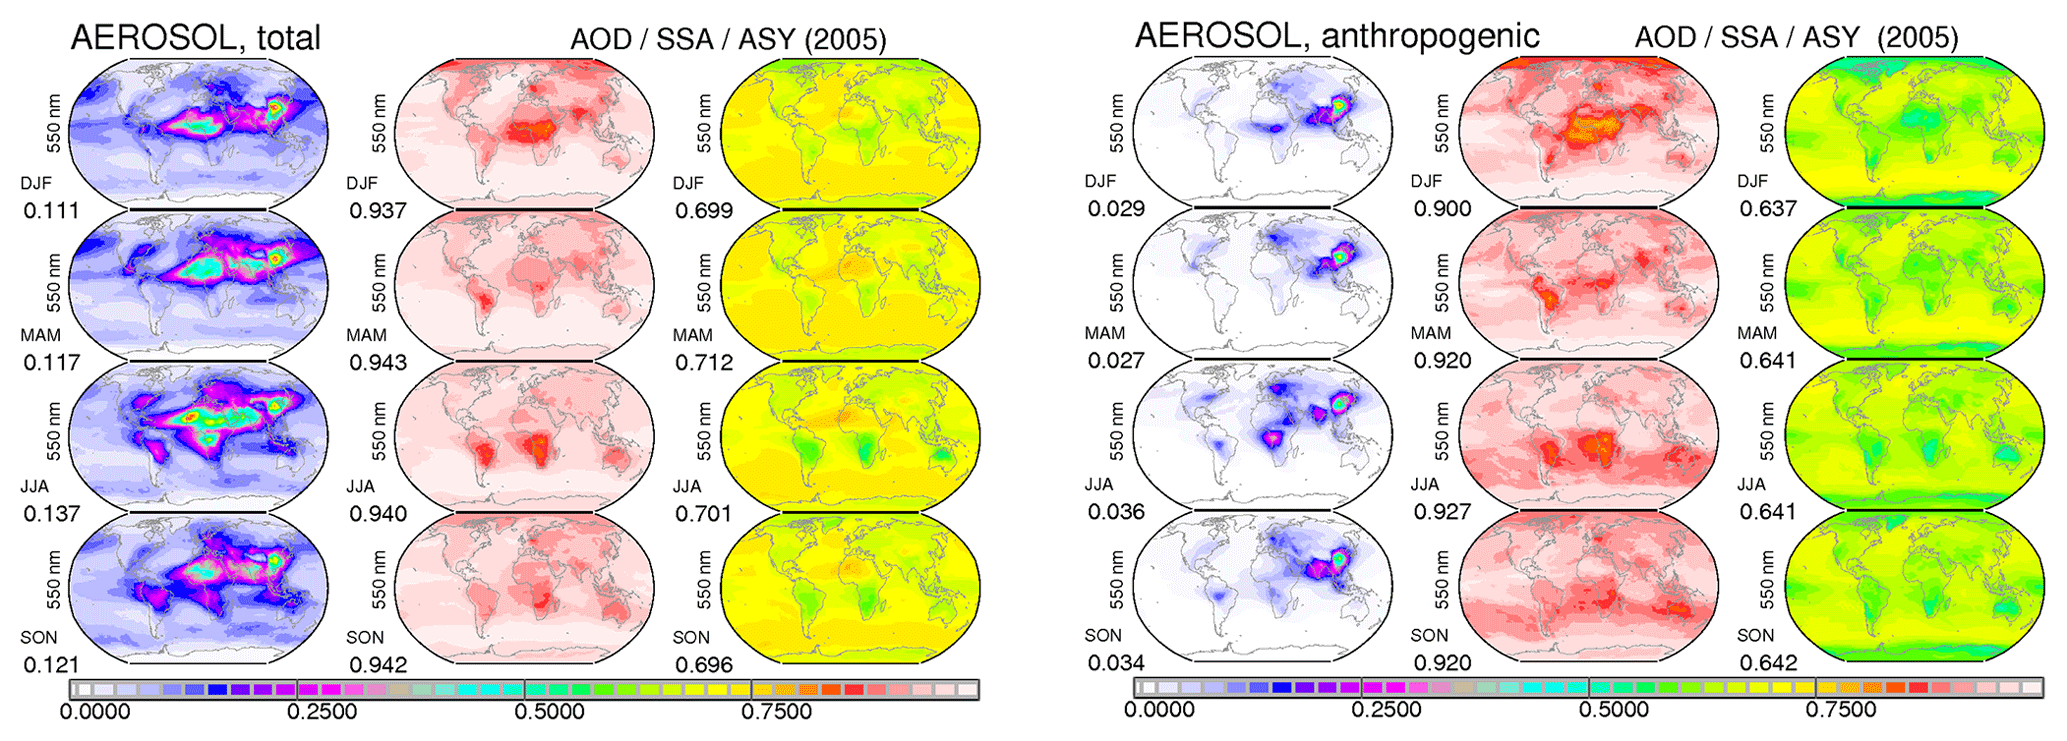
Figure 2Seasonal maps of MACv2 associated present-day midvisible (550 nm) radiative (or single scattering) properties (AOD, SSA, ASY) for total aerosol (left frame) and for anthropogenic aerosol (right frame). Global averages for each season are indicated below the labels.
The MAC aerosol climatology (with M for Max Planck Institute) in its second version (Kinne, 2019) defines spectrally resolved monthly global fields for aerosol properties with global coverage (at a lat–long spatial resolution). Annual averages of defining MACv2 aerosol properties are shown in Fig. 1.
Table 1Global annual averages of radiative properties for present-day (tropospheric) MACv2 aerosol.

* Anthropogenic SSA and ASY in MACv2 are those of the fine mode.
These global fields are the result of a data merging process for midvisible (at 550 nm) properties of aerosol optical depth (AOD, column amount) and absorption aerosol optical depth (AAOD, column absorption). This merging was done separately for fine-mode (radii <0.5 µm) sizes (AODf, AAODf) and coarse-mode (radii >0.5 µm) sizes (AODc, AAODc), as well as for the fine-mode effective radius (REf). In the merging process, regional distributions of monthly background maps are adjusted based on local matches to trusted monthly statistics by ground-based solar photometry observations. Background maps in MACv2 are median properties of 14 different global models with detailed aerosol modules (Kinne et al., 2006) in the framework of AeroCom phase 1 simulations. Applied photometry monthly statistics are sun and sky samples by CIMEL instruments of the AERONET network (Holben et al., 2001; Dubovik et al., 2002) and sun samples of by-hand-operated MICROTOPS instruments of the Maritime Aerosol Network, MAN (Smirnov et al., 2009). The needed spectrally varying single scattering properties for broadband radiative transfer simulations are set by local mixtures of spectrally predefined (via refractive index and size) aerosol components. Local component mixture weights are chosen such that their combined local AODf, AODc, AAODf, AAODc and REf values are consistent with MACv2 data. In MACv2 on a global annual basis about 50 % of the total AOD at 550 nm (of 0.12) each is contributed by fine-mode and coarse-mode sizes, whereas the total absorption AAOD at 550 nm (of 0.0072) has stronger fine-mode contributions, at 70 %. Still, the other 30 % contributions by coarse-mode sizes to absorption are significant and are associated with larger mineral dust sizes near sources.
Figure 1 also presents MACv2 estimates for the distribution of anthropogenic AOD at present-day conditions (at the midvisible wavelength of 550 nm). Anthropogenic AOD in MACv2 allows only contributions by smaller fine-mode (radii <0.5 µm) aerosol sizes, with major contributions from pollution and fires. The anthropogenic AOD is determined by applying to the AODf map of MACv2 (local, monthly) scaling factors [=(AODf,pd − AODf,pi)∕AODf,pd)] based on AeroCom phase 2 simulations with present-day (pd) and preindustrial (pi) emissions (as defined for the Coupled Model Intercomparison Project Phase 5 (CMIP5) by Lamarque et al., 2010). Anthropogenic coarse-mode (radii >0.5 µm) contributions (e.g., due to land-use change) are ignored, because (1) their AOD is relatively small (see Fig. E1 in Appendix E), (2) their solar and IR forcing effects largely cancel each other (as shown later), and (3) increases to aerosol concentrations via the coarse mode (for indirect effects) are minor.
For radiative transfer simulations three wavelength-dependent aerosol radiative properties are needed: aerosol optical depth (AOD), single scattering albedo (SSA) and asymmetry factor (ASY). Present-day global annual averages of these MACv2 aerosol radiative properties are summarized in Table 1 for four selected wavelengths. Corresponding seasonal maps in the midvisible spectral region (at 550 nm) for total aerosol and anthropogenic aerosol radiative properties are presented in Fig. 2.
In simulations of aerosol radiative effects the relative aerosol altitude distribution with respect to clouds is important. In MACv2 an AOD fractional scaling is applied based on multiyear simulations with the ECHAM-HAM global model (Zhang et al., 2012). This scaling is done independently for fine-mode AOD (AODf) and coarse-mode AOD (AODc). With the AOD scaling by size modes, a vertical scaling for SSA and ASY seems secondary and is ignored. For anthropogenic aerosol only the fine-mode vertical scaling is relevant, because anthropogenic aerosol in MACv2 has only contributions by fine-mode-size aerosols. AOD, AODc and AODf distributions with four altitude regions are illustrated in Fig. 3.

Figure 3Annual maps for fractional contributions of total, fine-mode and coarse-mode AOD (left frame) for four altitude regimes (0–1, 1–3, 3–6, >6 km above sea level) and for anthropogenic AOD (550 nm) for different years from 1865 to 2085 (right frame). Values below the label indicate global averages.
Figure 3 also presents time slices (1865, 1885, 1905, 1925, 1945, 1965, 1985, 2005, 2025, 2045, 2065, 2085) for the anthropogenic AOD (antAOD). Temporal changes in anthropogenic AOD are based on local scaling factors (antAOD,year/antAOD,pd) by ECHAM-HAM (Stier et al., 2006; Zhang et al., 2012) simulations with temporally changing emissions according to historic data and future projections.
The resulting anthropogenic AOD maps in Fig. 3 display globally highly uneven distributions.
From the late 19th century into the 20th century anthropogenic AOD steadily increased over Europe and the eastern US. Only since the middle of the 20th century have other continental regions also started to display anthropogenic AOD. Increases over southeastern Asia were particularly strong. Over the last three decades (since 1985) the anthropogenic AOD maxima declined over Europe and the eastern US, and maxima over southeastern Asia and more recently over southern Asia began to dominate. With the shift in regional maxima the present-day global average anthropogenic AOD appears to have reached a plateau, which is probably a maximum, as future emission scenarios suggest a decline in global anthropogenic AOD.
The environmental properties in radiative transfer simulations are represented by monthly averages to describe seasonal variations in solar insolation, atmospheric state, and properties of clouds and the surface. Monthly mean of the sun's latitudinal position defines variations in TOA solar irradiance. Surface temperatures (Hansen et al., 2010) via multiannual monthly local averages help in choices for standard atmospheric profiles (Anderson et al., 1986; McClatchey et al., 1972). Local combinations of these standard profiles define local monthly atmospheric state and trace-gas concentrations. For clouds, multiannual monthly average ISCCP data (Rossow et al., 1993) define scene optical depth and the cloud cover at low (>680 hPa), middle and high (<440 hPa) altitudes. For surface properties an IR emittance of 0.96 is assumed. Surface solar albedo data over land are based on Moderate Resolution Imaging Spectroradiometer (MODIS) sensor data for the ultraviolet/visible (UV/VIS) and near-infrared (nIR) spectral regions (Schaaf et al., 2002). Over oceans, solar albedo data account for a solar elevation dependence (Taylor et al., 1996). Seasonal means of the applied VIS and nIR solar surface albedo and the ISCCP cloud cover by altitude are presented in Fig. 4.
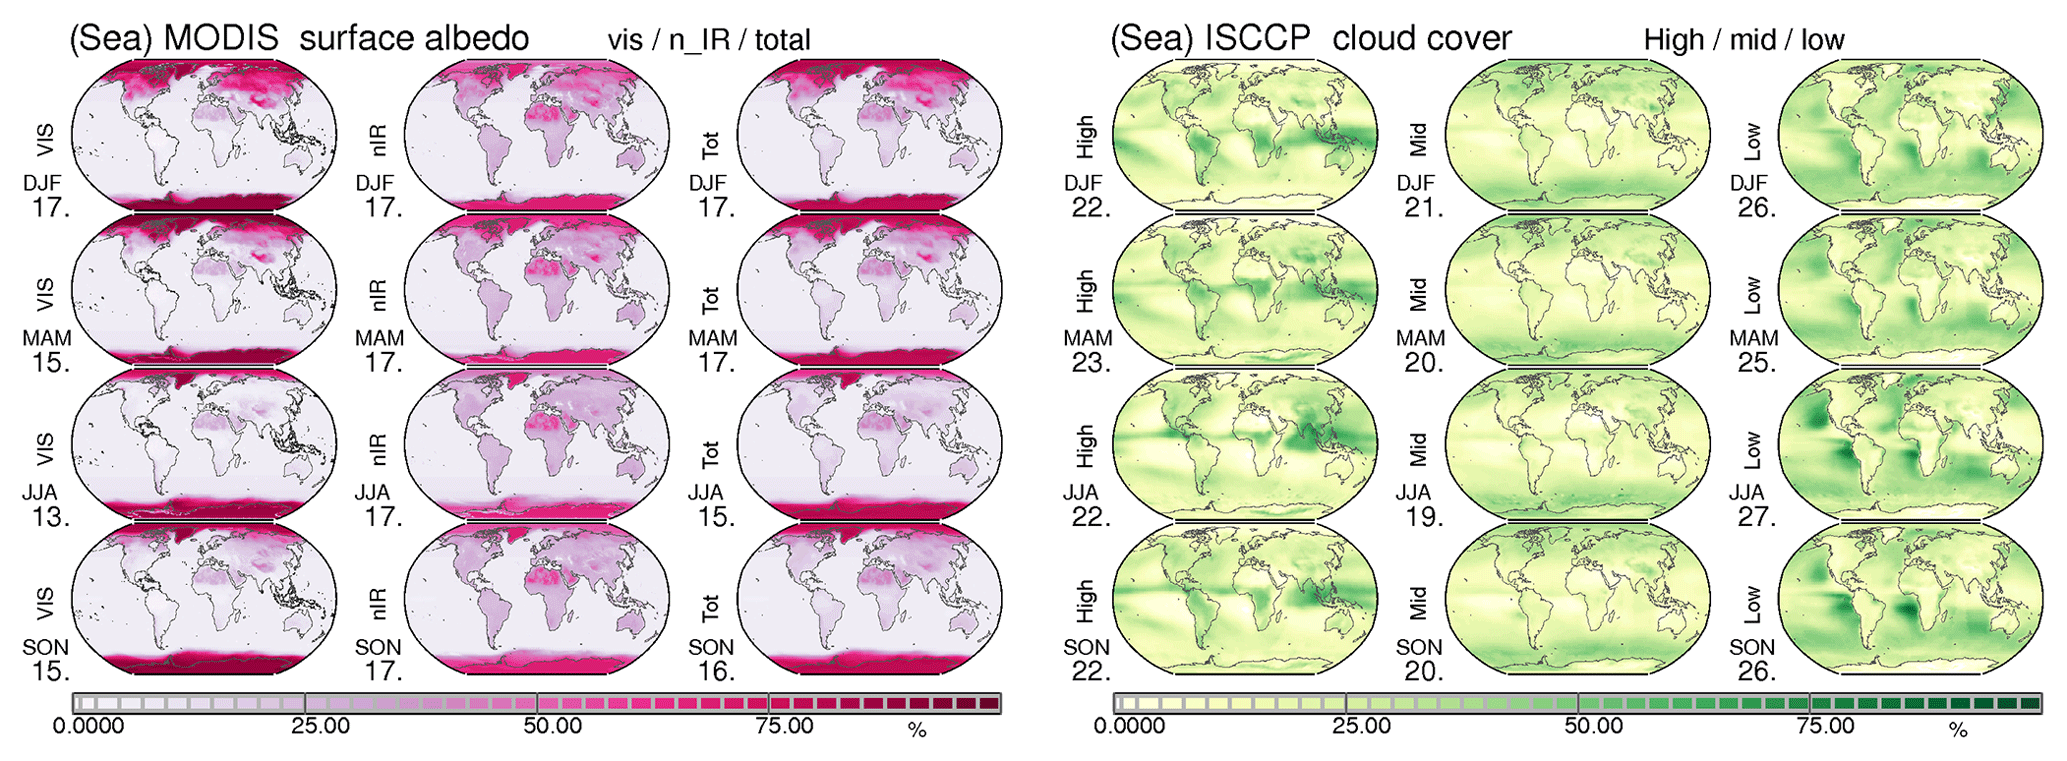
Figure 4Seasonal averages for applied environmental properties to (1) solar surface albedo (left frame) for the UV/VIS, the near-IR and the total spectral range based on MODIS satellite sensor data and (2) ISCCP-based cloud cover (right frame) for high (<440 hPa), middle (440–680 hPa) and low (>680 hPa) altitudes.
The atmospheric radiative transfer simulations apply a two-stream radiative transfer scheme (Meador and Weaver, 1980). Spectral variability is captured by 8 solar and 12 infrared bands with a total of 120 exponential terms to represent atmospheric trace-gas absorption. Vertical variability of the atmosphere is represented by 20 plane-parallel homogenous layers, and atmospheric state and trace-gas properties are defined via standard atmospheres (McClatchey et al., 1972). Independent simulations at each (of the 64 800) grid location are performed for each month with monthly averages. Hereby, daily average solar radiative effects are based on weighted individual simulations at nine different solar zenith angles. Simulations with (ISCCP) clouds always involve simulations at all eight possible permutations for high-, mid- and low-altitude cloud combinations, assuming random overlap, and for satellite-view-corrected local cloud cover data in the three altitude regimes. Radiative impacts in the atmosphere are defined by differences of two simulations between a modified and a standard configuration. These dual-call radiative transfer applications investigate
-
extra aerosol presence (direct effect – with a focus on individual aerosol components),
-
reduced water droplet radii due to extra aerosol (first indirect effect) and
-
a combination of both effects.
The resulting changes to broadband solar and infrared radiative net fluxes are particularly relevant
-
at the top of the atmosphere (TOA) – for the overall climate impact,
-
at the surface – for impacts on surface processes, and
-
in the atmosphere (by TOA minus surface impact differences) – for impact on dynamics.
Dual-call radiative transfer cannot consider climate feedbacks. Long-term Earth system model (ESM) simulations with a fixed sea-surface temperature (SST), however, indicated that atmospheric feedbacks (Fiedler et al., 2017, 2019 – there referred to as “rapid adjustments”) modulate the aerosol radiative impacts at most on the order of 10 %. Thus by ignoring radiative forcing feedbacks, no major extra errors are introduced. It also should be pointed out that a dual-call scheme offers more precise answers, as internal (cloud) variability of independent ESM simulations is avoided (Fiedler et al., 2019).
Aerosol direct radiative effects are changes to the atmospheric energy distribution from the aerosol (or the extra aerosol) presence. These effects are quantified by the difference of one simulation with all aerosols and one simulation with no or less aerosol. The anthropogenic aerosol impact, for instance, is defined by the difference of radiative effects of a simulation with present-day (pd) and preindustrial (pi) conditions. Only coarse-mode aerosol sizes are large enough for infrared radiative effects. As only smaller fine-mode aerosols contribute to the anthropogenic AOD in MACv2, only solar impacts for anthropogenic aerosol need to be investigated. Annual average maps of present-day direct aerosol radiative effects are summarized in Fig. 5 for cloud-free conditions (clear-sky, “clr”) and with tropospheric clouds (all-sky, “all”) – for both total and anthropogenic aerosol at the TOA and surface.
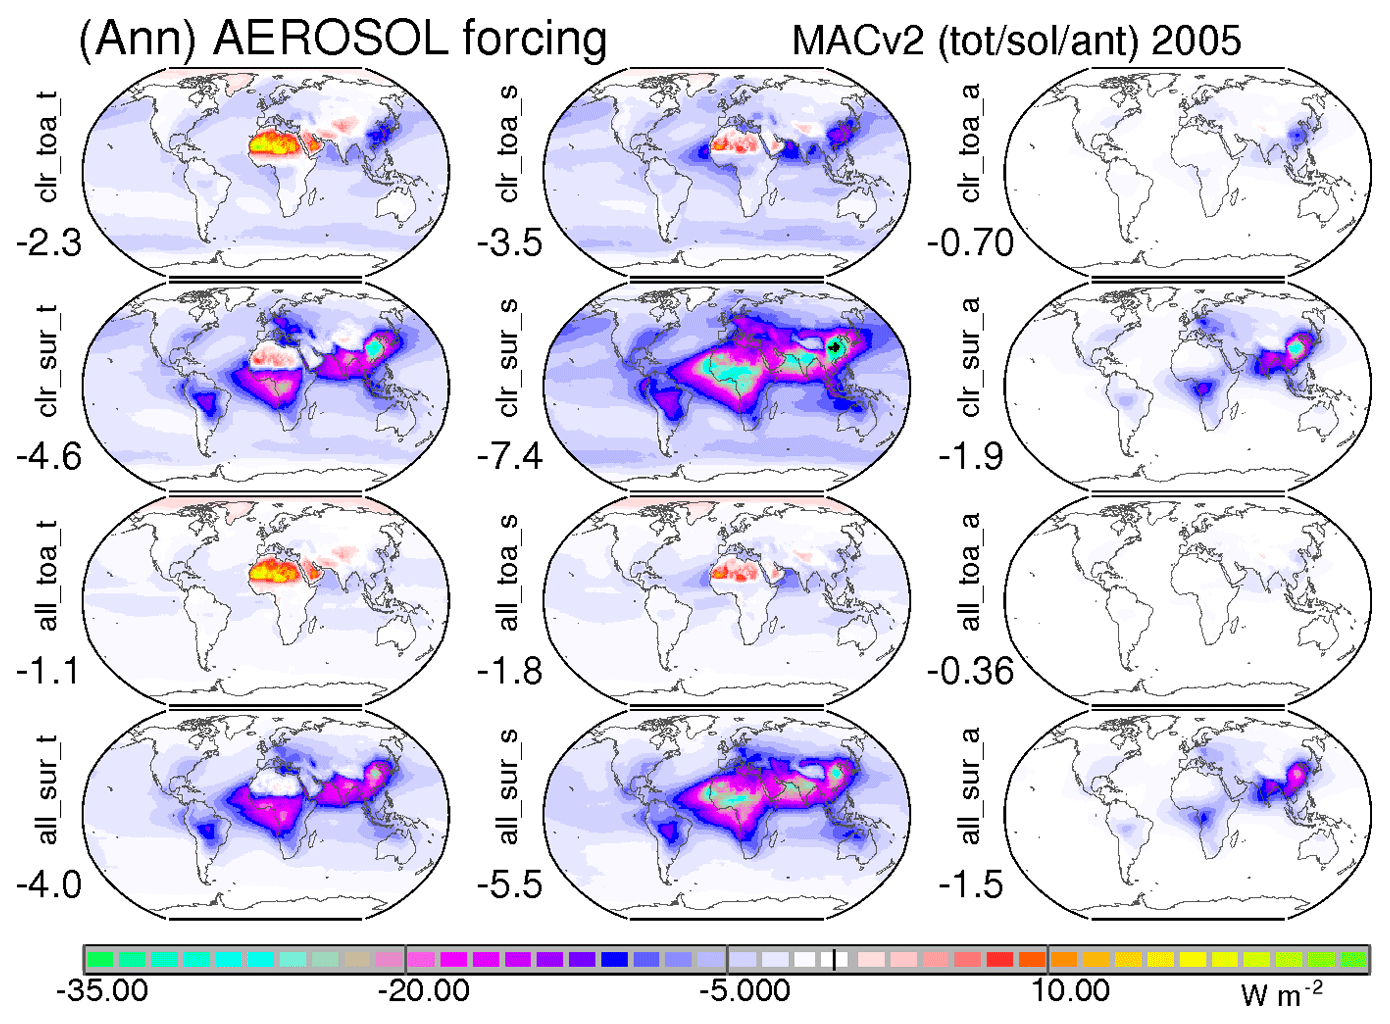
Figure 5Annual maps for direct radiative effects of present-day total aerosol (left column), its solar effect (center column) and of present-day anthropogenic aerosol. Clear-sky effects are presented in the upper two rows: at the TOA (row 1) and at the surface (row 2). All-sky effects (with ISCCP clouds) are presented in the lower two rows: at the TOA (row 3) and at the surface (row 4). Note that values for the anthropogenic direct forcing (column 3, row 3) are relatively small. More detail is given in Fig. 6. Blue colors indicate radiative net-flux losses (or a “cooling”), and red colors indicate radiative net-flux gains (or a “warming”). Values below the labels indicate global averages.
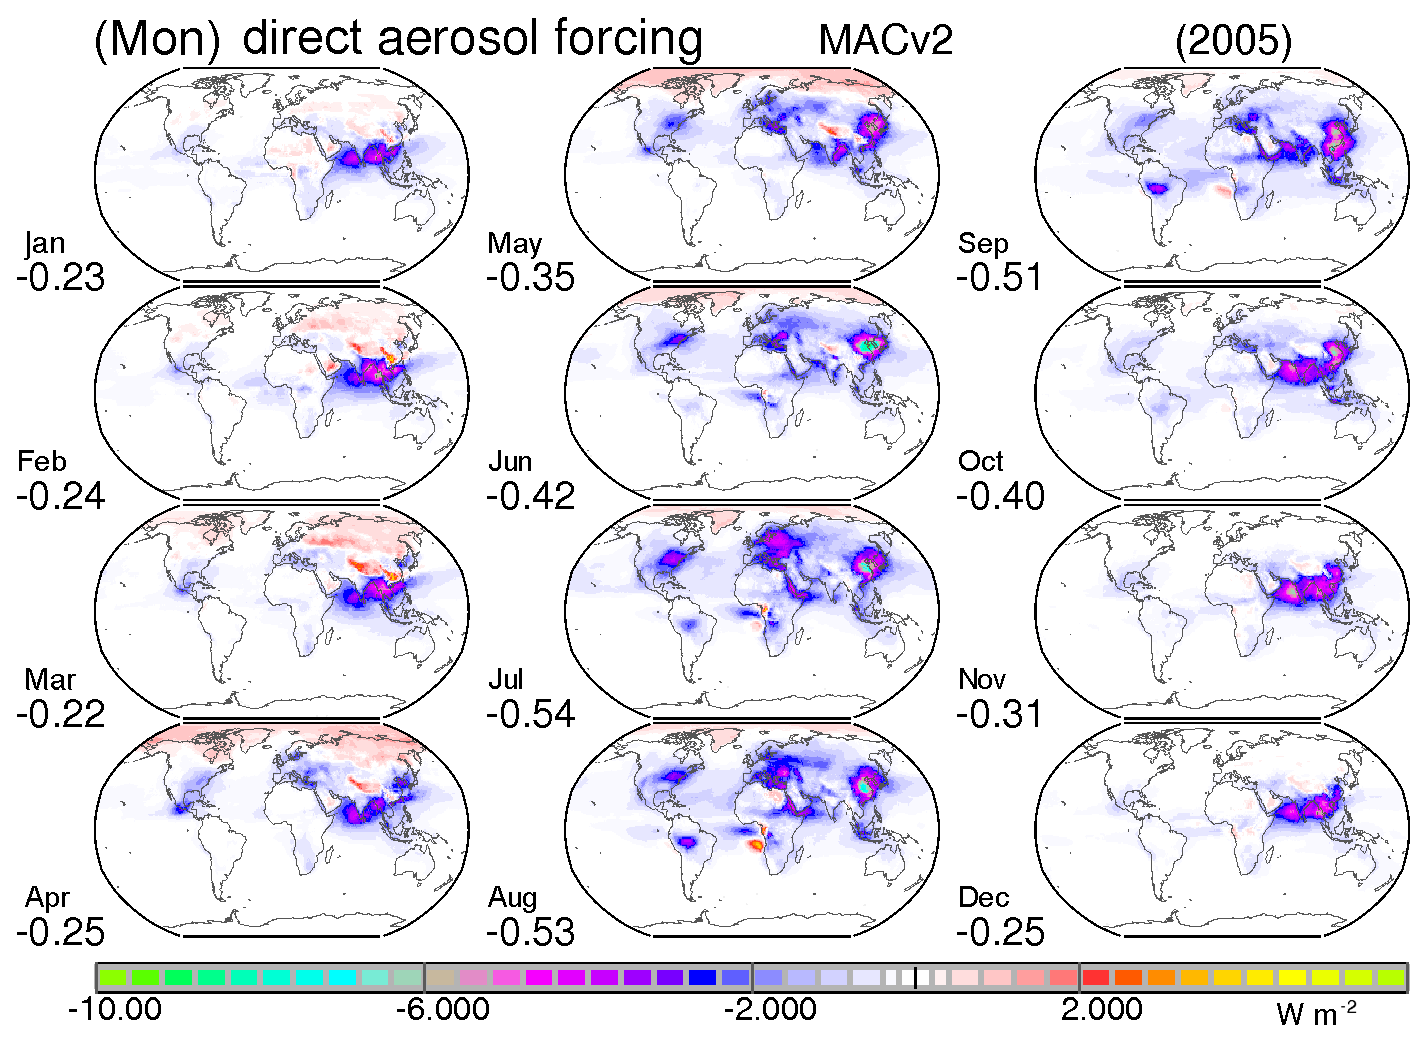
Figure 6Monthly maps for present-day aerosol direct forcing with MACv2 aerosol properties.
For the aerosol-associated net flux (down minus upward fluxes) changes in Fig. 5, negative values (blue to purple to light blue) indicate regions with a tendency to cool, whereas positive values (red to yellow) display regions that experience a tendency to warm. Global averages for all maps of Fig. 5 are negative. Thus present-day total (left column in Fig. 5) and anthropogenic aerosol (right column in Fig. 5) on average cool. Hereby, global averages of aerosol radiative effects are more negative at the surface than at the TOA, because some aerosol types also absorb in the atmosphere. Radiative effects are usually more negative for clear-sky than for all-sky conditions, because reflecting clouds above aerosol prevent aerosol interactions with solar radiation. This clear-sky-minus-all-sky difference is much larger at the TOA than at the surface, because elevated absorbing aerosols above clouds dim the reflection of clouds to space for a relative warming. All direct radiative effects are spatially unevenly distributed.

Figure 7Annual maps for present-day fine-mode (left frame) and anthropogenic (right frame) effects in MACv2. Aerosol radiative effects at the TOA (top row) and at the surface (bottom row) are presented for clear-sky conditions (left column in each block) and all-sky conditions (right column in each block). Blue to red colors indicate a cooling and pink colors indicate weak warming. Values below the labels show global averages.
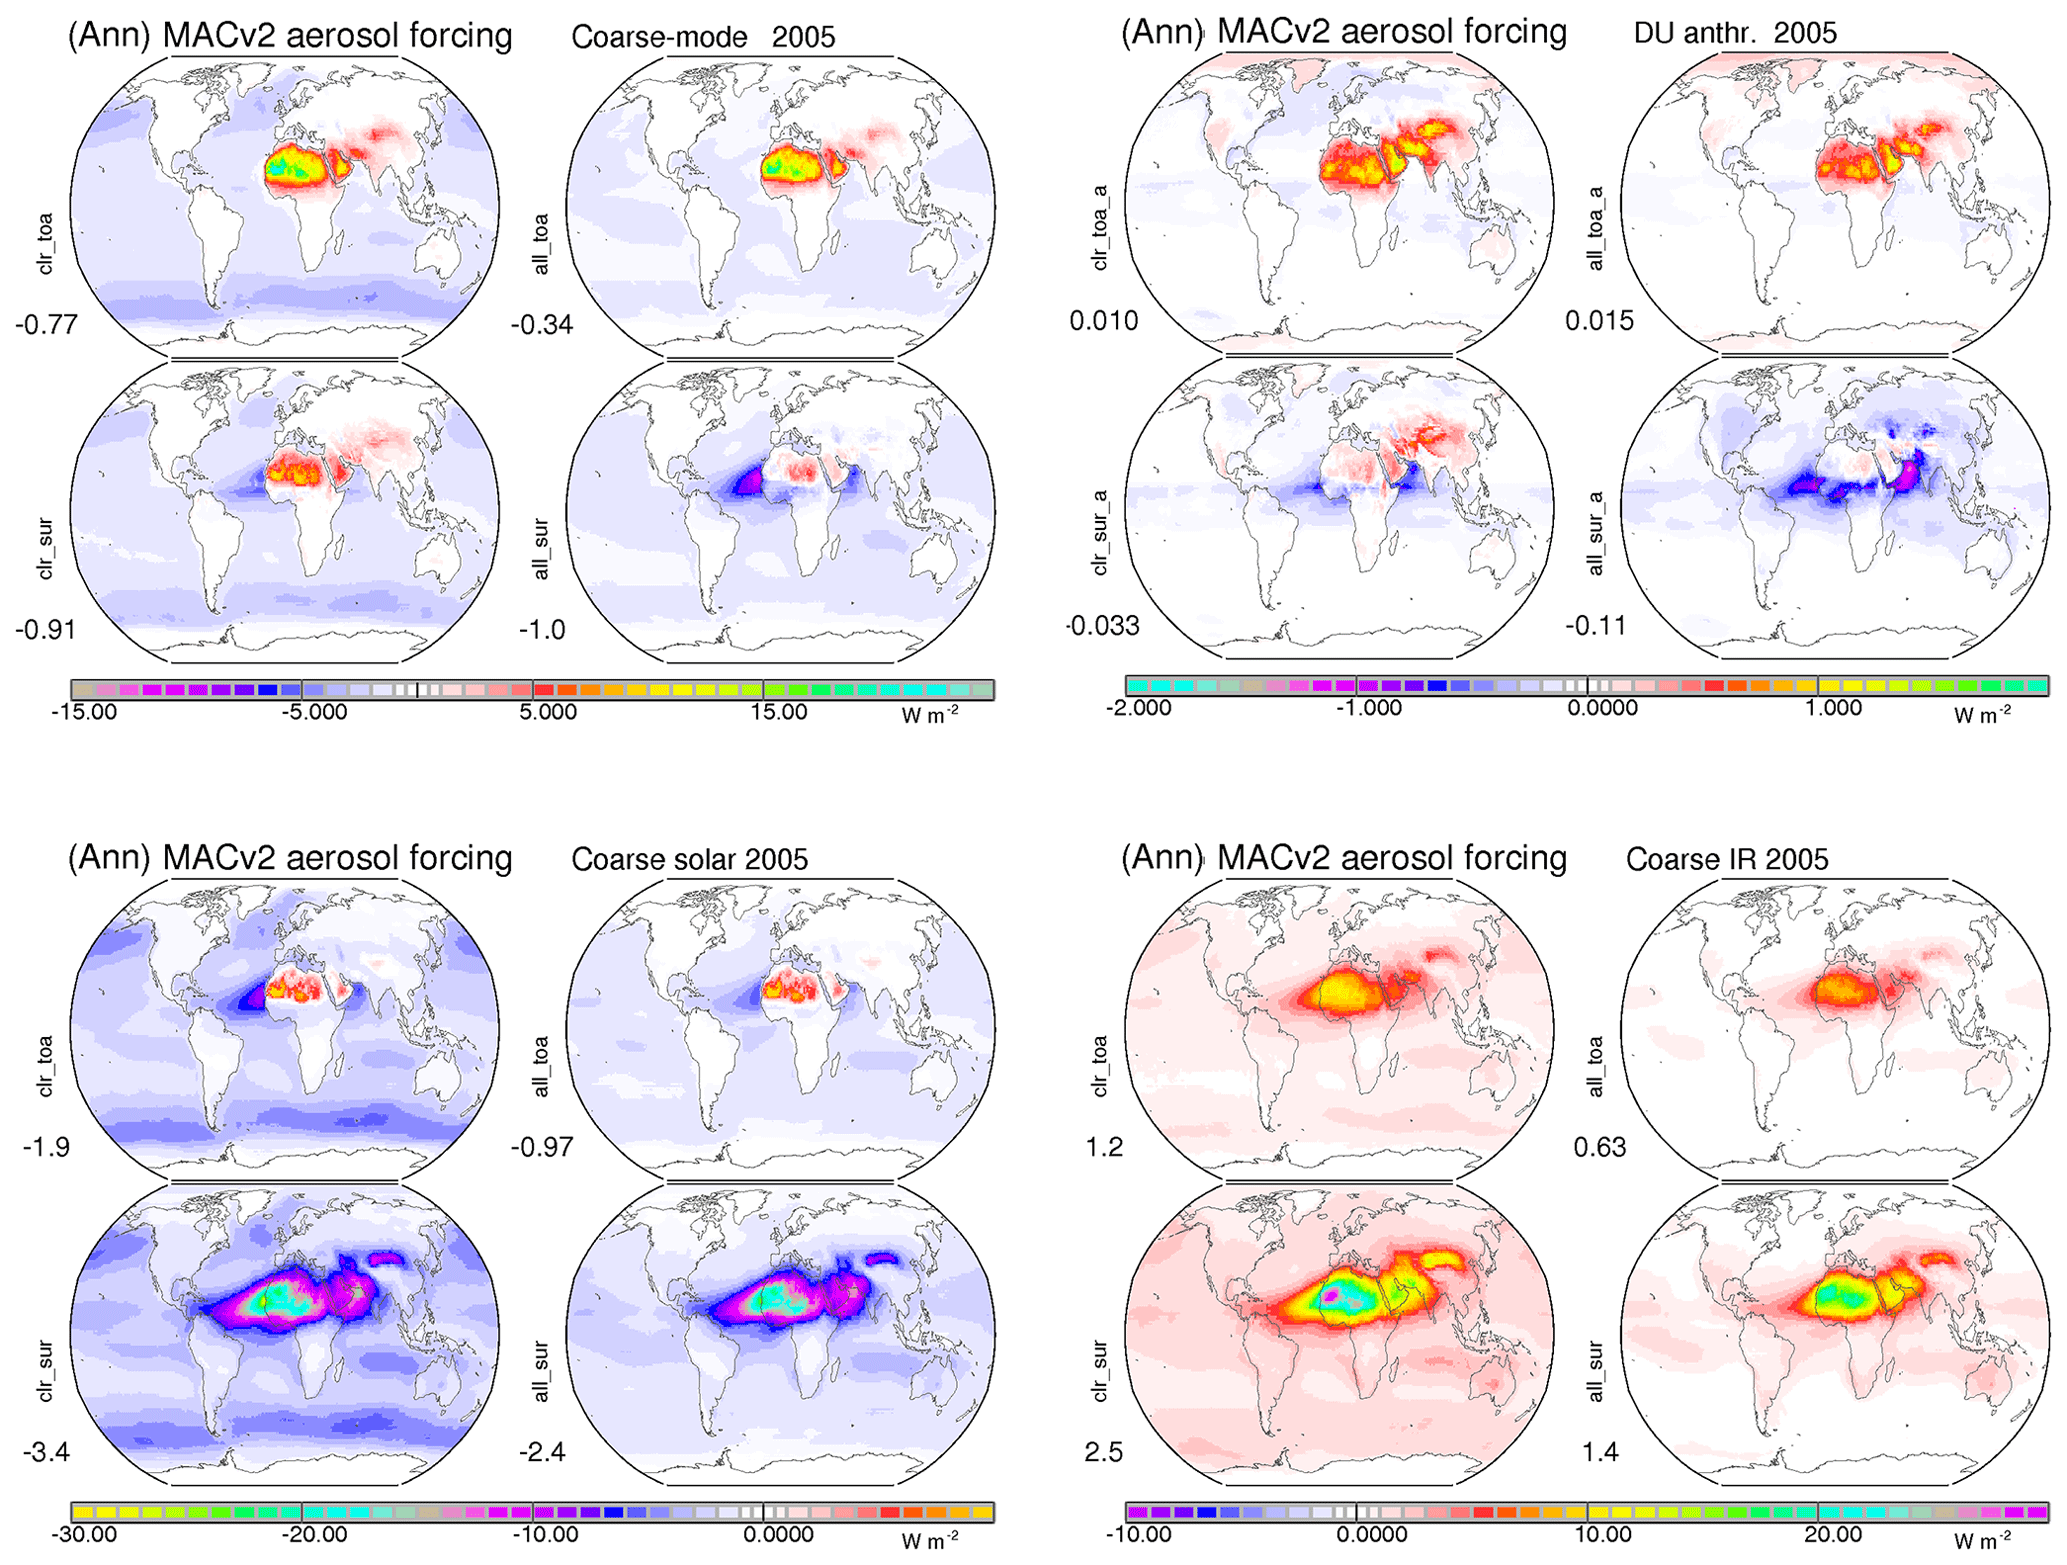
Figure 8Annual maps for the coarse-mode aerosol direct radiative effects at the TOA (top) and surface (bottom) for clear-sky (left) and all-sky (right) conditions. Coarse-mode effects (top left frame) are compared to potential anthropogenic contributions (top right frame, note its 10 times smaller color-scale range). Blue to purple colors indicate a cooling and red to yellow colors a warming. In addition, solar (bottom left frame) and IR contributions (right bottom frame) to the coarse-mode aerosol direct radiative effects are presented. Note the different scales. Values below the labels indicate global averages.
For total aerosol (in the left column of Fig. 5) the negative forcing in most regions is partially offset by regional warming over northern Africa and Arabia, especially for TOA effects. To understand this response, it should be recalled that the dominating mineral dust aerosol particles in those regions are relatively large, elevated (off the ground) and absorbing. For solar-only effects (in the center column of Fig. 5) absorbing mineral dust aerosol over the bright desert surface causes a relative TOA warming by dimming the surface solar reflection to space. And there are also infrared effect, because mineral dust sizes are relative large. As mineral dust (unlike sea salt) is often elevated and strongly absorbing, mineral dust also contributes to a significant greenhouse effect. This greenhouse effect adds to the solar warming at the TOA and offsets with infrared reradiation the solar cooling at the surface. On a global average basis ca. 35 % of the solar energy losses by present-day aerosol are compensated for by IR energy gains. In other regions, where smaller fine-mode sizes dominate, aerosol cools at the TOA (unless surfaces are bright, as with snow or lower clouds) and always cools at the surface. Hereby, the local surface cooling is much more negative than the local TOA response, when fine-mode aerosol is strongly absorbing, as over biomass burning regions over Africa and South America and pollution of southeastern Asia.
For anthropogenic aerosol MACv2 only allows submicrometer-size contributions. Thus only solar radiative impacts matter. For present-day anthropogenic aerosol (for climate change relevant), aerosol direct forcing (the direct radiative effects by anthropogenic aerosol for all-sky conditions at the TOA) yields a global cooling at −0.36 W m−2. This direct forcing signal is on average more than a magnitude smaller than detectable solar radiation reductions at the surface or satellite detectable planetary albedo increases over oceans for total aerosol. More details on seasonal variability for the present-day direct forcing for anthropogenic aerosol (at an adjusted finer scale) are presented in Fig. 6.
On a global average basis the present-day aerosol direct forcing causes a cooling during the entire year. The TOA cooling is strongest from July to September mainly due to more sun hours and higher AOD values at northern midlatitudes. Higher AODs are in part caused by increased water uptake. The TOA cooling is weakest from December to April also due to regional warming over snow cover in the Northern Hemisphere (e.g., Asia, Arctic). The regional warming over the southeastern Atlantic in August–September is due to lower cloud reflection dimming by elevated biomass burning aerosol. The spatial distribution also illustrates the location of forcing maxima: May–October over eastern Asia, June–August over the EU and the eastern US, and September to April over southern Asia. More details on present-day direct radiative effects are provided by investigating contributions by the (submicrometer) fine-mode sizes in Fig. 7 and by (supermicrometer) coarse-mode size in Fig. 8.
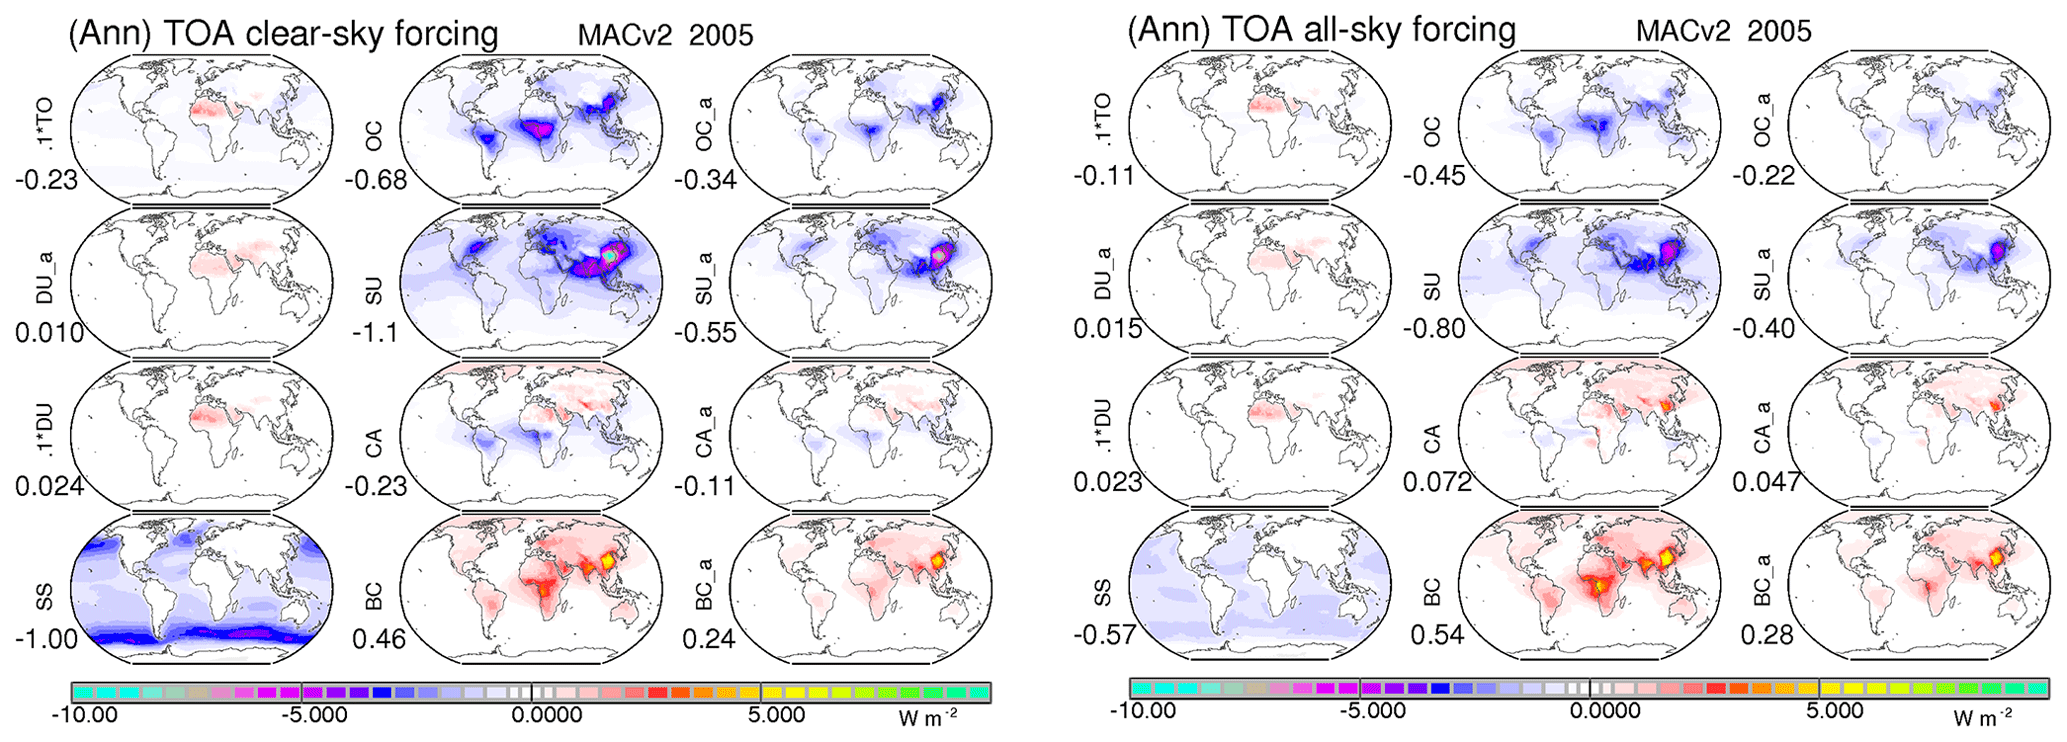
Figure 9Annual maps for today's direct forcing at the TOA for clear-sky (left frame) and for all-sky conditions (right frame) by total aerosol (TO, divided by 10 to fit common scale) and by coarse-mode components of anthropogenic dust (DU_a), dust (DU, divided by 10 to fit common scale) and sea salt (SS) in the left column; by fine-mode components of nonabsorbing sulfate (SU), of weakly absorbing organic matter (OC), of strong absorbing soot (BC) and of the combined carbon (CA = OC+BC) component in the center column; and by the anthropogenic contributions of all fine-mode components in the right column. Global averages for the annual direct aerosol component TOA effects are presented below the labels.
Fine-mode and coarse-mode radiative effects differ in their regional contributions. On average fine-mode contributions to TOA cooling are stronger than coarse-mode contributions, despite a stronger solar fine-mode absorption (in the atmosphere). This is explained by regional greenhouse contributions of coarse-mode aerosols (over northern Africa, Arabia and Asia). The partially offsetting local solar and infrared contributions to coarse-mode direct radiative effects at the TOA and surface are shown in Fig. 8.
Also compared in Figs. 7 and 8 are size-mode contributions by anthropogenic aerosol to present-day direct radiative effects. For the fine mode on average 50 % of present-day fine-mode radiative effects can be considered anthropogenic (with the other 50 % already contributing at preindustrial times). Anthropogenic coarse-mode mineral dust (due to land-use change) contributes about 10 % to the dust AOD and to radiative effects at the surface. At the TOA the coarse-mode radiative effect contributions are only at 5 % at the TOA due to partially offsetting solar and infrared effects.
Based on a comparison of present-day direct aerosol forcing contributions of −0.36 W m−2 for the fine mode and +0.02 W m−2 for the coarse mode, the more-than-a-magnitude-smaller coarse-mode contributions to the anthropogenic AOD are ignored in MACv2.
With the AOD attributions in MACv2 into radiatively defined components via their midvisible absorption properties (Kinne, 2019) and via the anthropogenic definition in MACv2, present-day direct aerosol radiative effects of components and of their anthropogenic contributions could be determined. For smaller fine-mode aerosol, direct radiative effects are contributed by nonabsorbing aerosol represented by sulfate (SU), by weakly absorbing organic matter (OC) and by strongly absorbing soot (BC). Also the combined carbon (CA = OC+BC) effect is examined to illustrate the BC impact, when coemitters of soot are included. For coarse-mode aerosol, direct radiative effects are contributed by nonabsorbing sea salt (SS) and weakly absorbing mineral dust (DU). Hereby, stronger coarse-mode absorption translates into larger mineral dust sizes. Annual maps for present-day-component TOA radiative effects for clear-sky and all-sky conditions (forcing) are shown in Fig. 9. More details on component direct radiative effects are presented in Appendix E.
Table 2Annual average MACv2 climatology associated aerosol radiative effects for today's tropospheric aerosol at the top of the atmosphere (TOA), at the surface and (by difference) for the atmosphere. Aside from total aerosol (in row 1), effects of components and if applicable their anthropogenic (Anthr.) contributions are also indicated. Considered fine-mode components are sulfate (SU), organic matter (OC), soot (BC) and the combined carbon (OC+BC). Considered coarse-mode components are sea salt (SS) and dust (DU).
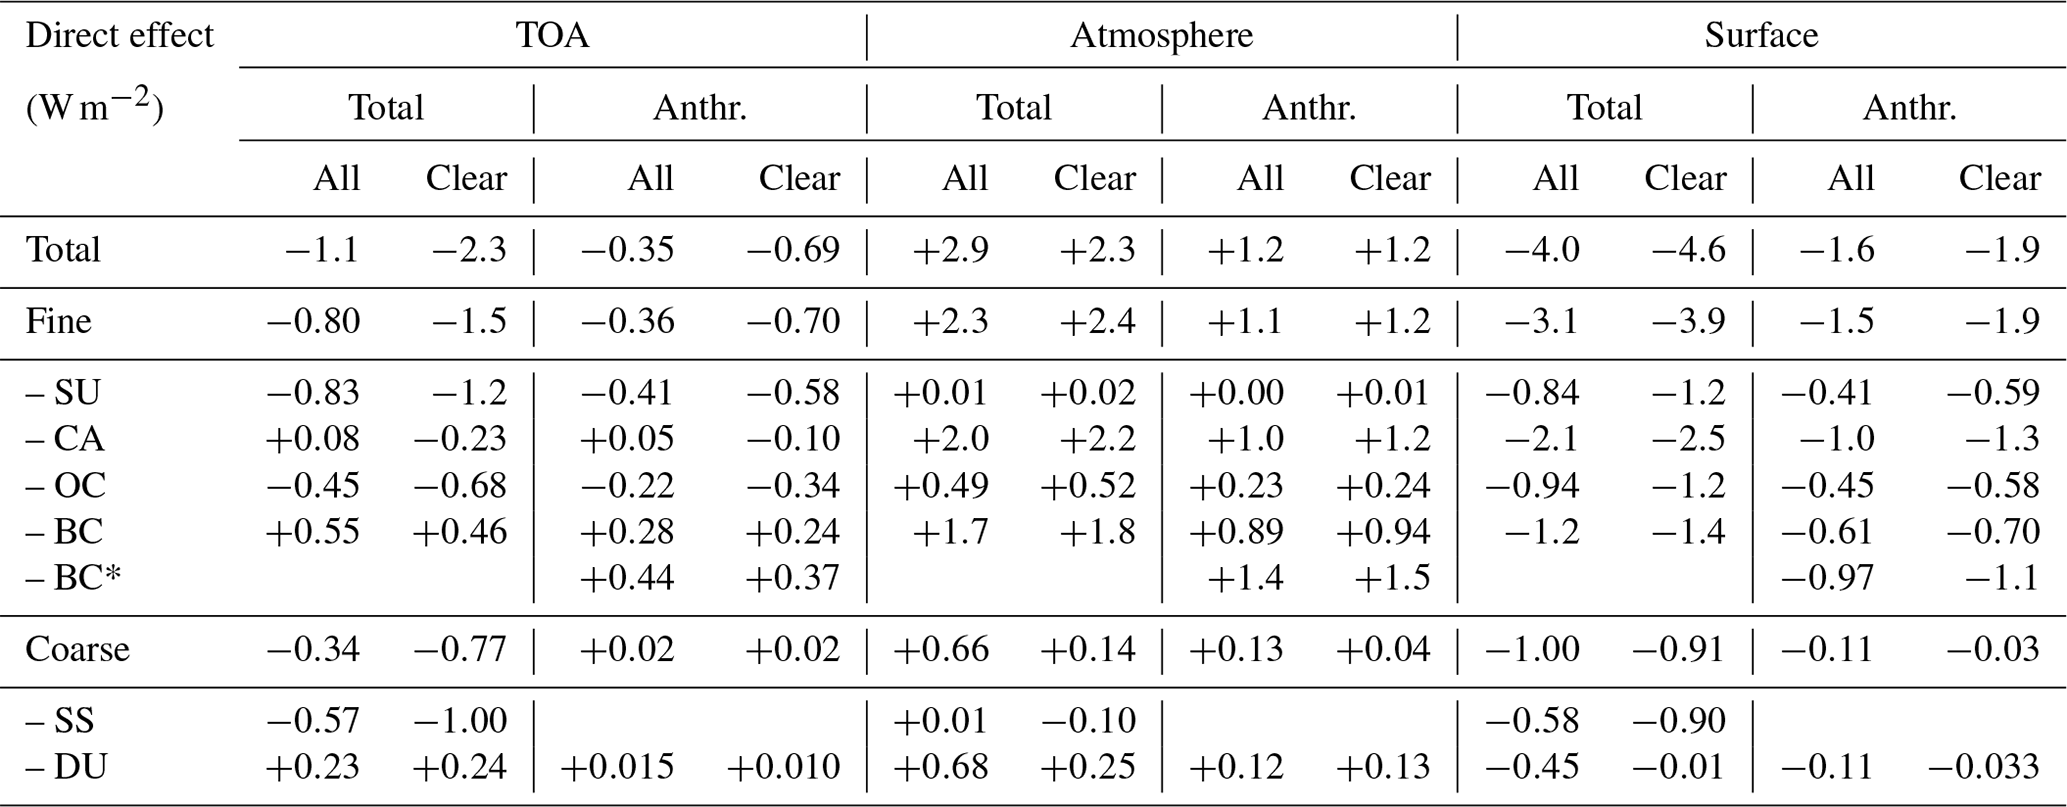
* Based on AeroCom 1 – reference year 1750 (and not AeroCom 2 – reference year 1850) anthropogenic BC fine-mode fractions.
Table 3Annual average MACv2 climatology associated aerosol radiative effects for today's tropospheric aerosol at the top of the atmosphere (TOA) and at the surface, by separating solar and IR contributions. Aside from the total aerosol (in row 1), effects are also presented for components with an IR impact, such as sea salt (SS), dust (DU) and anthropogenic dust (aDU).

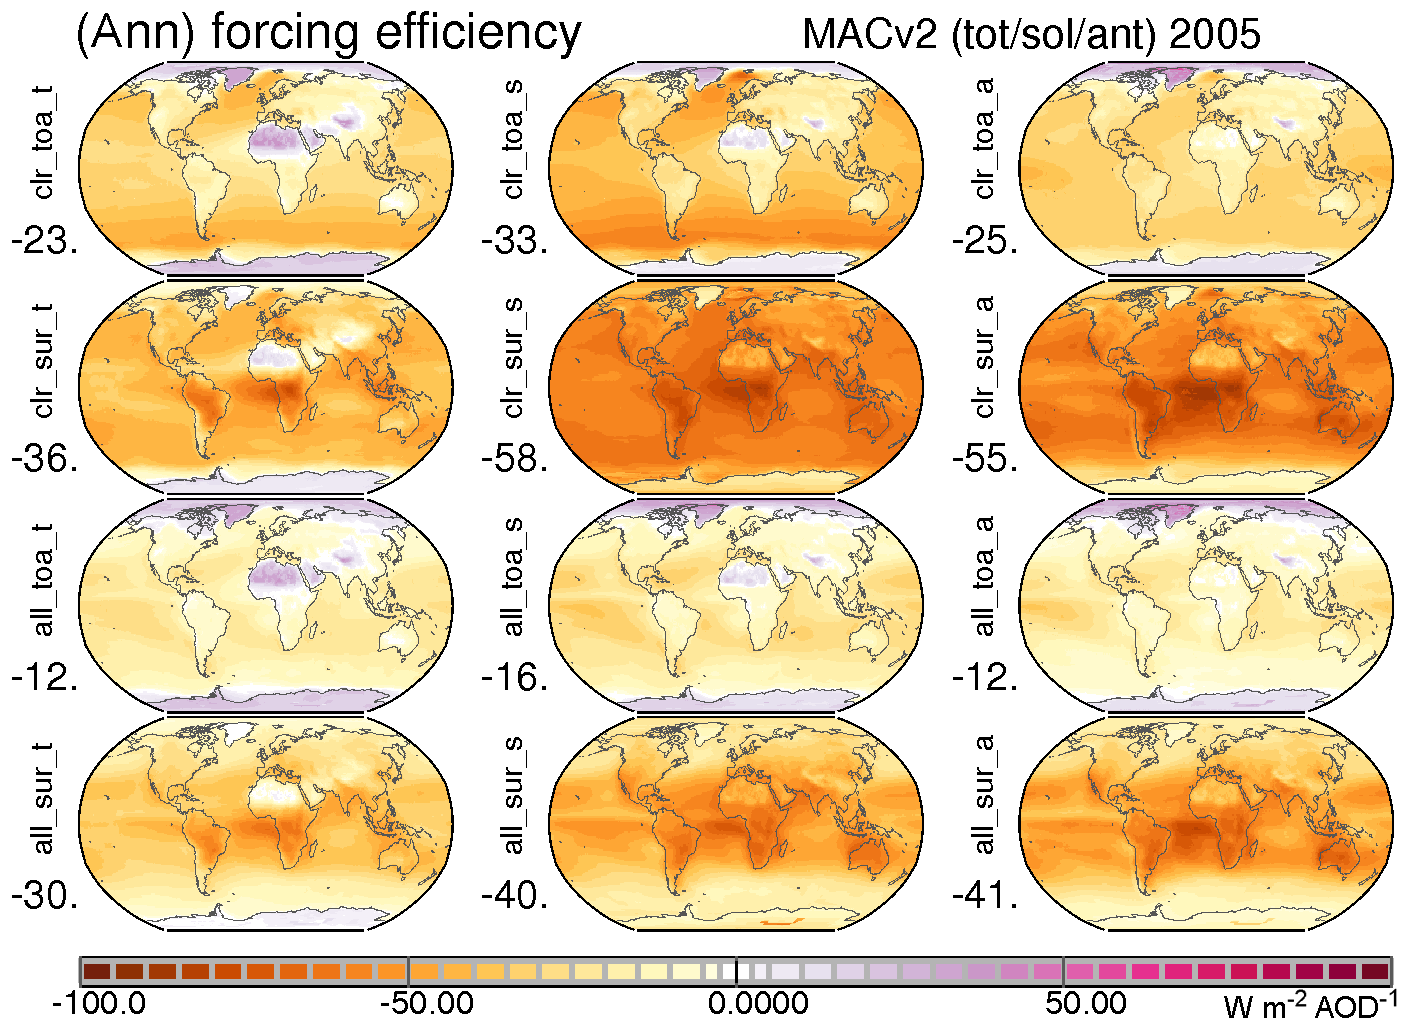
Figure 10Annual maps for aerosol direct radiative effect efficiencies (per unit AOD) of present-day all aerosol (left column), its solar effect only (center column) and of present-day anthropogenic aerosol (right column). All maps correspond to the direct radiative effects in Fig. 5. Clear-sky efficiencies are presented in the upper rows: at the TOA (row 1) and at the surface (row 2). All-sky efficiencies (with ISCCP clouds) are presented in the lower rows: at the TOA (row 3) and at the surface (row 4). Values indicate global averages.
The radiative TOA direct radiative effects of individual components are quite diverse. Climate cooling by sulfate (SU), sea salt (SS), organic matter (OC) and dust (DU-o) over oceans is on average stronger than climate warming by soot (BC) and dust (DU-c) over continents. As MACv2 only considers anthropogenic contributions to the fine mode, investigations of anthropogenic impacts can be reduced to cooling by nonabsorbing SU and weakly absorbing OC and to warming by strongly absorbing BC. The combined carbon (CA) approximates the impacts of coemitted gases that quickly condensate on existing particles (including soot) to increase scattering on existing particles (also in the context of an upper limit near 2 for a soot absorption increase via a scattering shell). The combined CA forcing is near neutral (+0.05 W m−2). This suggests that for approximate estimates for the global average direct forcing only changes in fine-mode nonabsorbing AOD since preindustrial times should be considered.
The CA near-neutral response, however, only applies if the BC anthropogenic fraction is that of the fine-mode AOD fraction. With a higher soot (BC) anthropogenic fraction (especially near pollution regions), as assumed in the BC assessment (Bond et al., 2013), the present-day BC forcing increases to +0.44 W m−2 as shown in Appendix E. This added BC warming (with an alternate present-day CA warming near +0.20 W m−2) would reduce the present-day total direct aerosol forcing to −0.20 W m−2 climate cooling. However, as this higher alternate fine-mode anthropogenic fraction for BC is also linked to a year 1750 reference (Dentener et al., 2006), such a large BC anthropogenic fraction seems unlikely for the year 1850. Still, given the uncertainty regarding the BC preindustrial state an overall present-day aerosol direct forcing of −0.25 W m−2 (down from −0.36 W m−2) cannot be easily ruled out.
The consideration of coemitted gas soot (BC) removal processes may not have the often attributed potential for short-term climate warming mitigations. Thus, the singled out present-day warming +0.55 W m−2 for all soot (BC) with estimated anthropogenic contributions between +0.25 and +0.40 W m−2 is deceiving as coemitters also have to be considered in removal processes.
Annual averages of MACv2 aerosol-associated direct radiative effects for present-day atmospheric conditions are summarized in Tables 2 and 3. Table 2 compares radiative effects at the TOA, atmosphere and surface for all aerosol, for fine-mode aerosol, for coarse-mode aerosol and for individual aerosol components. Table 3 compares solar and infrared contributions of components with non-negligible infrared impacts. Global maps for component radiative effects of Table 2 are presented in Appendix D.
Forcing efficiencies offer a shortcut to radiative effects without actually performing radiative transfer simulations. Radiative forcing modulations by local monthly environmental properties (such as surface albedo, solar insolation and even clouds) are already included. For instance, a satellite-retrieved AOD value or an anthropogenic AOD enhancement is then quickly associated with a radiative effect simply by multiplying the AOD value with the appropriate forcing efficiency. In such applications even information on the likely aerosol composition is included. Applying environmental assumptions and MACv2 aerosol properties in (radiative transfer) offline simulations, aerosol direct forcing efficiencies are presented with respect to the midvisible AOD at 550 nm (as this particular AOD value is frequently used in conjunction with satellite retrievals and global modeling). Annual maps for forcing efficiencies per unit AOD for total and anthropogenic aerosol (corresponding to the radiative effects of Fig. 5) are presented in Fig. 10. Seasonal variations of global averages are small, as shown in Appendix D.
at the TOA, global average direct aerosol radiative efficiencies (per unit AOD) are at −24 W m−2 per unit AOD for cloud-free (clear-sky) conditions and at −12 W m−2 per unit AOD for more realistic conditions with clouds (all-sky). These global forcing efficiencies are almost identical for total and anthropogenic aerosol. This is a coincidence. The on average 30 % stronger solar TOA cooling efficiencies for total aerosol are offset by coarse-mode associated IR warming efficiencies – mainly by elevated mineral dust. Spatially, however, there are large differences associated with aerosol properties (e.g., absorption and size) and background reflectance data (e.g., surface albedo, lower-altitude cloud cover).
At the surface global average only solar direct aerosol radiative efficiencies (per unit AOD) agree for total and anthropogenic aerosol at −56 W m−2 per unit AOD for clear-sky and at −41 W m−2 per unit AOD for all-sky conditions. For combined (solar and IR) direct forcing efficiencies those for total aerosol are ca. 30 % less negative, due to positive infrared reradiation (greenhouse effect) contributions.
With the AOD attributions in MACv2 into radiatively predefined aerosol types (Kinne, 2019) also TOA efficiencies for individual aerosol components are determined. TOA forcing efficiencies for the SU, OC, BC, DU and SS components are presented for clear-sky and all-sky conditions in Fig. 11.
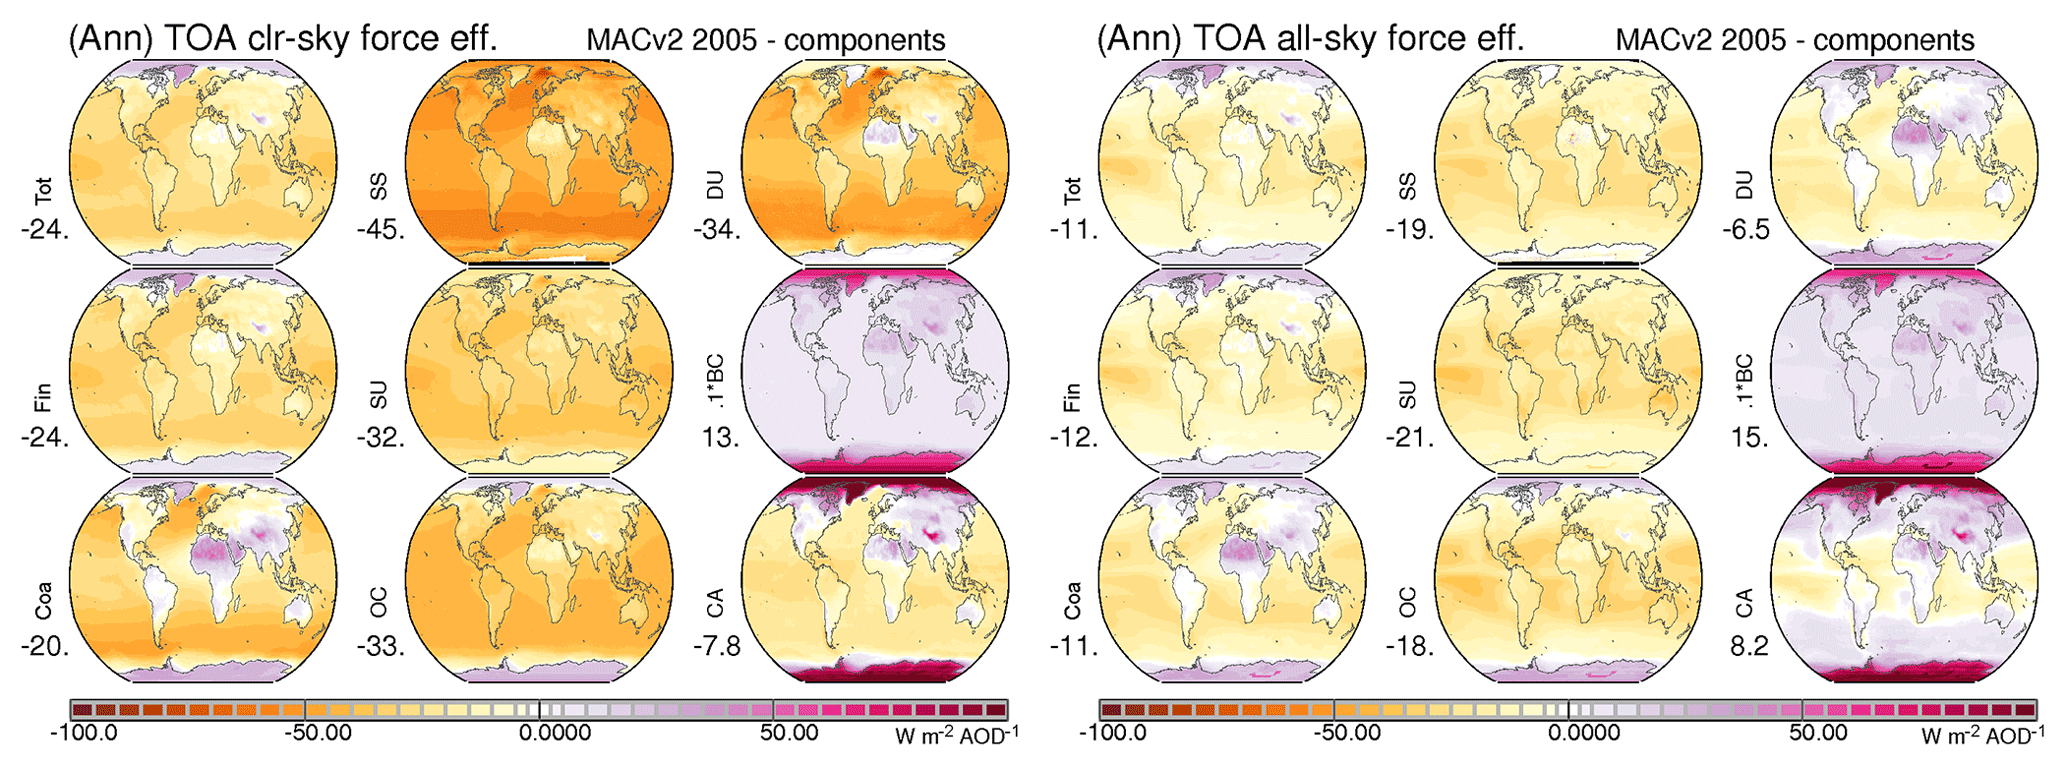
Figure 11Annual maps for present-day direct component forcing efficiencies (per unit AOD) at the TOA for clear-sky (left frame) and for all-sky conditions (right frame) for total, coarse-mode and fine-mode aerosols (left column), for mainly scattering components (center column) of sea salt (SS), fine mode (SU) and organic matter (OC) (center column) as well as components with absorption (right column) of dust (DU), soot (BC) and for the combined carbon (CA = OC+BC). The large positive forcing efficiencies for BC (130 W m−2 per unit AOD for clear sky and 150 W m−2 per unit AOD for all sky) are divided by 10 to fit the common color scale. Global averages are presented below the labels.
Direct radiative TOA forcing efficiencies for scattering fine-mode (SU) and coarse-mode (SS) components are strongly negative and usually more negative over the darker background of oceans. This also applies for weakly absorbing organic matter (OC) – except over (brighter) polar regions. The efficiencies are at least −30 W m−2 per unit AOD for clear-sky and near −20 W m−2 per unit AOD for all-sky conditions.
Direct radiative TOA forcing efficiencies for coarse-mode absorbing dust (DU) are also much more negative for clear-sky conditions compared to all-sky conditions. The clear-sky forcing efficiencies over oceanic regions are almost as negative as for sea salt but less negative over continents and continental outflow regions and even slightly positive near source regions. The all-sky forcing efficiency for dust displays only weak negative forcing efficiencies over oceans and usually positive forcing efficiencies over continents. Over major dust source regions (e.g., northern Africa and Arabia) all-sky forcing efficiencies for mineral dust (DU) are particular strong at +40 W m−2 per unit AOD.
Direct radiative TOA forcing efficiencies for strongly absorbing soot (BC) are even more positive (than the all-sky forcing for dust near sources) and high everywhere over the globe, with maxima over (bright) polar surfaces. Unlike for other components, BC forcing efficiencies near +150 W m−2 per unit AOD are larger for all-sky conditions than for clear-sky conditions (with +120 W m−2 per unit AOD). This is explained by BC aerosol dimming of solar reflection from lower-altitude clouds.
Direct radiative TOA forcing efficiencies for combined carbon (BC+OC) represent the presence of mainly scattering BC coemitters. Now, the high BC efficiencies are reduced to −10 W m−2 per unit AOD for clear-sky and to +10 W m−2 per unit AOD for all-sky conditions. Thus, by ignoring scattering coemitters, climate warming potential of BC is overrated.
Extra atmospheric aerosol loads (as from anthropogenic sources) modulate the atmospheric energy distribution not only directly and but also indirectly. Indirect effects are contributed through aerosol-imposed changes to other atmospheric properties, most importantly to properties of clouds. An important aspect is that added aerosols (relatively numerous from anthropogenic fine-mode sources) increase the concentrations of those aerosols that can serve as cloud condensation nuclei (CCN). With more available CCN at a condensation event, the available supersaturated water vapor is distributed onto more aerosol nuclei, so that the resulting water cloud droplets are more numerous and smaller in size – assuming that no changes to the cloud liquid water content (LWC) occur. With smaller drop sizes the solar reflection of a water cloud and along with it the planetary albedo increases (Twomey, 1974) for an added climate cooling. Examples are so-called “ship tracks”, when satellite sensors detect increases in planetary albedo of low-altitude clouds above the path of polluting ships. But there are further impacts associated with smaller droplets affecting both cloud cover and cloud water content. The mixing with dryer air at cloud boundaries reduces the cloud lifetime (especially if the cloud cover is low), whereas the delay in the onset of precipitation extends the cloud lifetime (especially if cloud cover is high). In addition, there are potential but less investigated aerosol impacts involving mixed-phase and ice clouds.

Figure 12Annual maps of indirect (Twomey) effects for present-day anthropogenic aerosol based on year 1850 anthropogenic fine-mode fractions of AeroCom 2 (left frame) and on 1750 anthropogenic fine-mode fractions of AeroCom 1 (right frame). Compared in each block are solar (left column) and infrared (right column) radiative effects at the TOA (top row) and at the surface (bottom row). Blue colors indicate a cooling and red colors a warming. Values below the labels are global averages.
The strongest observational evidence for aerosol indirect effects involves low-altitude water clouds. In contrast, likely aerosol impacts are small for mixed-phase clouds (Christensen et al., 2016), and for ice clouds model simulation cannot even agree on the sign of overall impacts (Penner et al., 2018).
With a focus on aerosol modifications to lower-altitude water clouds, there remains the question of whether changes to cloud lifetime and/or cloud cover matter in comparison reductions in cloud droplet sizes (the Twomey effect). A recent satellite retrieval analysis involving a large sulfate aerosol anomaly over the northern Atlantic (Mallavelle et al., 2017) confirms the dominance of the Twomey effect. It was found that sharply increased sulfate aerosol concentrations strongly reduced the cloud droplet sizes. However, no significant changes to the cloud liquid water content were retrieved.
It seems straightforward to convert MACv2 suggested CCN increases due to anthropogenic AOD in cloud droplet number concentration (CDNC) increases (and subsequently in associated cloud droplet size reductions, assuming that the cloud water content did not change). Unfortunately, MACv2-based CCN estimates (derived from fine-mode composition and fine-mode extinction, Kinne, 2019) depend strongly on assumptions for the supersaturation (or vertical winds at cloud base), which are neither known nor can be appropriately represented by averages. To make matters worse, uncertainties affect not only current CCN but also background CCN estimates, as both are needed to derive CDNC changes – due to CCN saturation effects.
Thus, a simpler approach based on satellite retrievals was selected which directly links aerosol number with cloud droplet number, as explained in more detail in Appendix A. It involves retrievals of the same satellite sensor for fine-mode AOD (AODf) as a proxy for aerosol number and for CDNC at the cloud tops of low-altitude clouds as proxy for cloud droplet number. Based on multispectral sensor data both properties can be retrieved but not simultaneously at the same time and location. Here it is now stipulated that regional associations of monthly averages between AODf and CDNC offer meaningful statistical constraints on aerosol–cloud interactions. Combining all monthly local matches over oceans, where both quality (no side-viewing retrieval, no broken cloud scenes) CDNC retrievals and sufficiently large AODf retrievals (greater 0.05) were available, the AOD size bin median associations are best captured by a logarithmic relationship (more details are provided in Appendix A).
The relationship predicts a CDNC increase factor due to extra AODf. Hereby the CDNC increase depends not only on extra AODf from anthropogenic sources but also on the AODf background (as at preindustrial times). The factor 3 in the formula accounts for CDNC associated with coarse-mode aerosols, which are important to be included at very clean background conditions.
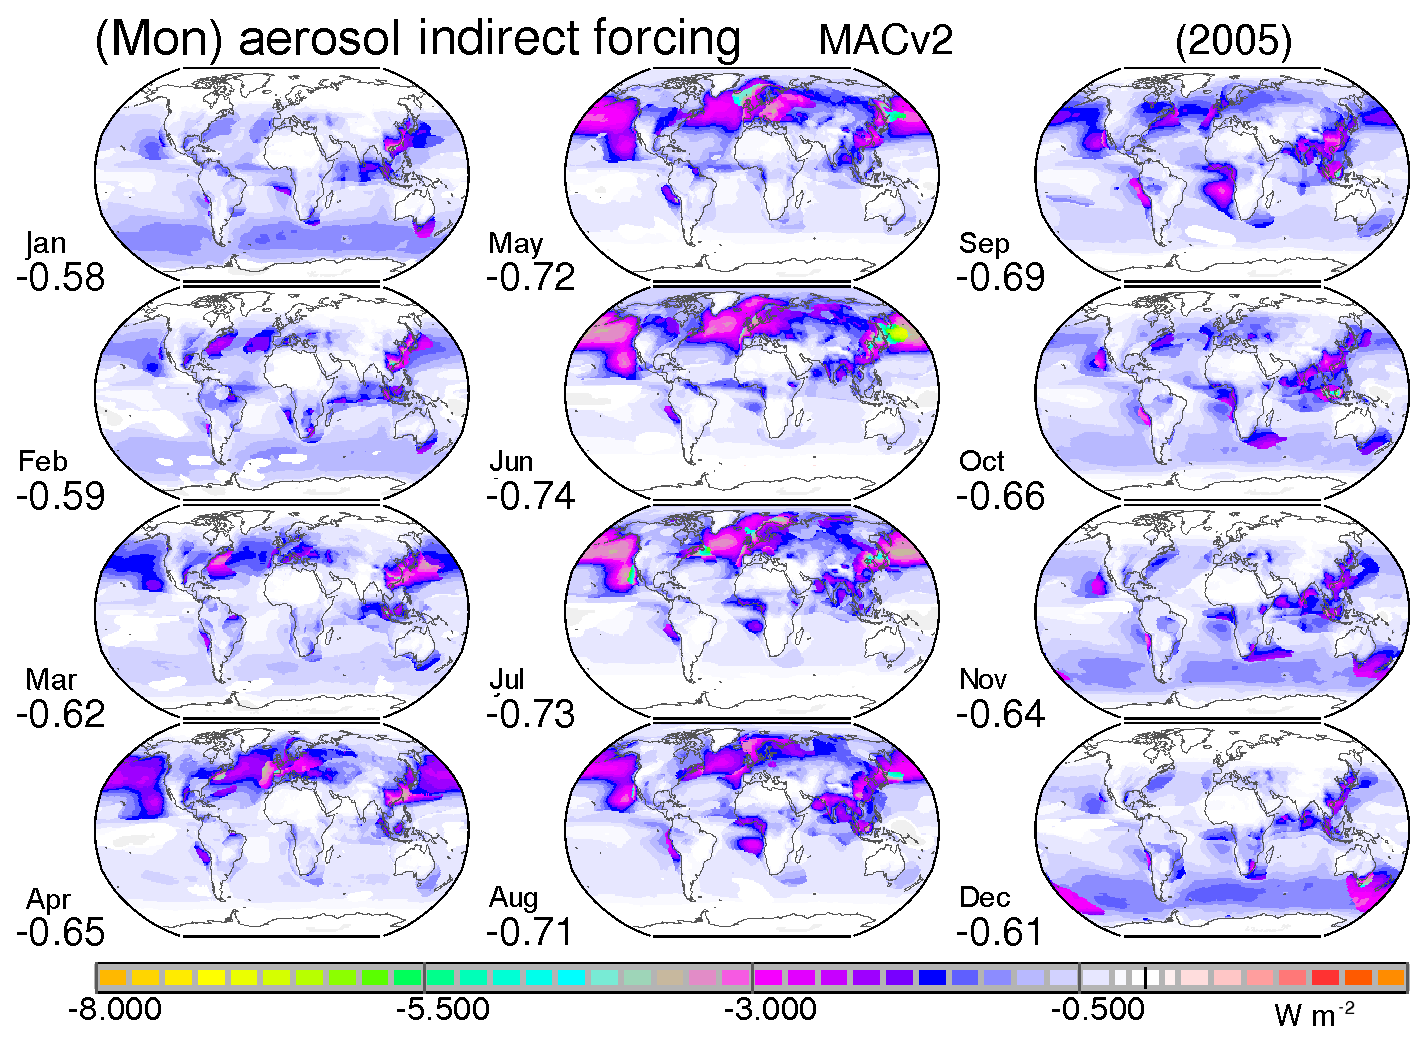
Figure 13Monthly maps for today's indirect (Twomey) forcing by present-day anthropogenic aerosol.
The CDNC–AODf relationship associated with observational statistics did not change significantly with the use of different satellite sensor data (as illustrated in Appendix A). In contrast, the CDNC factor increases in AeroCom global modeling were found to be more variable and on average much stronger (as shown in Appendix A). In other words, if observational associations can be trusted, then in most AeroCom models (with detailed aerosol schemes) the Twomey effect (associated with extra anthropogenic aerosol) is overparameterized. Note that for better comparison the modeling data were subsampled at locations of contributing CDNC vs. AODf retrieval pairs.
For estimates of the aerosol first indirect effect in MACv2 the satellite-retrieval-based CDNC increase factors were applied for every month and grid point, thus also over continents where no and not sufficiently accurate satellite retrievals were available. After CDNC increases are converted into cloud droplet radius reductions (dd(CDNC)1∕3, assuming no changes to the cloud liquid water content, two scenarios were simulated in an offline radiative transfer code: one scenario applied reduced cloud droplet sizes according to the CDNC increases and the other scenario used the baseline droplet size. The differences of these two simulations define aerosol indirect effects in MACv2. Present-day annual average indirect effects for the solar and the infrared spectral region at the TOA and surface are presented for local anthropogenic AOD in the context of preindustrial fine-mode AOD in Fig. 12.
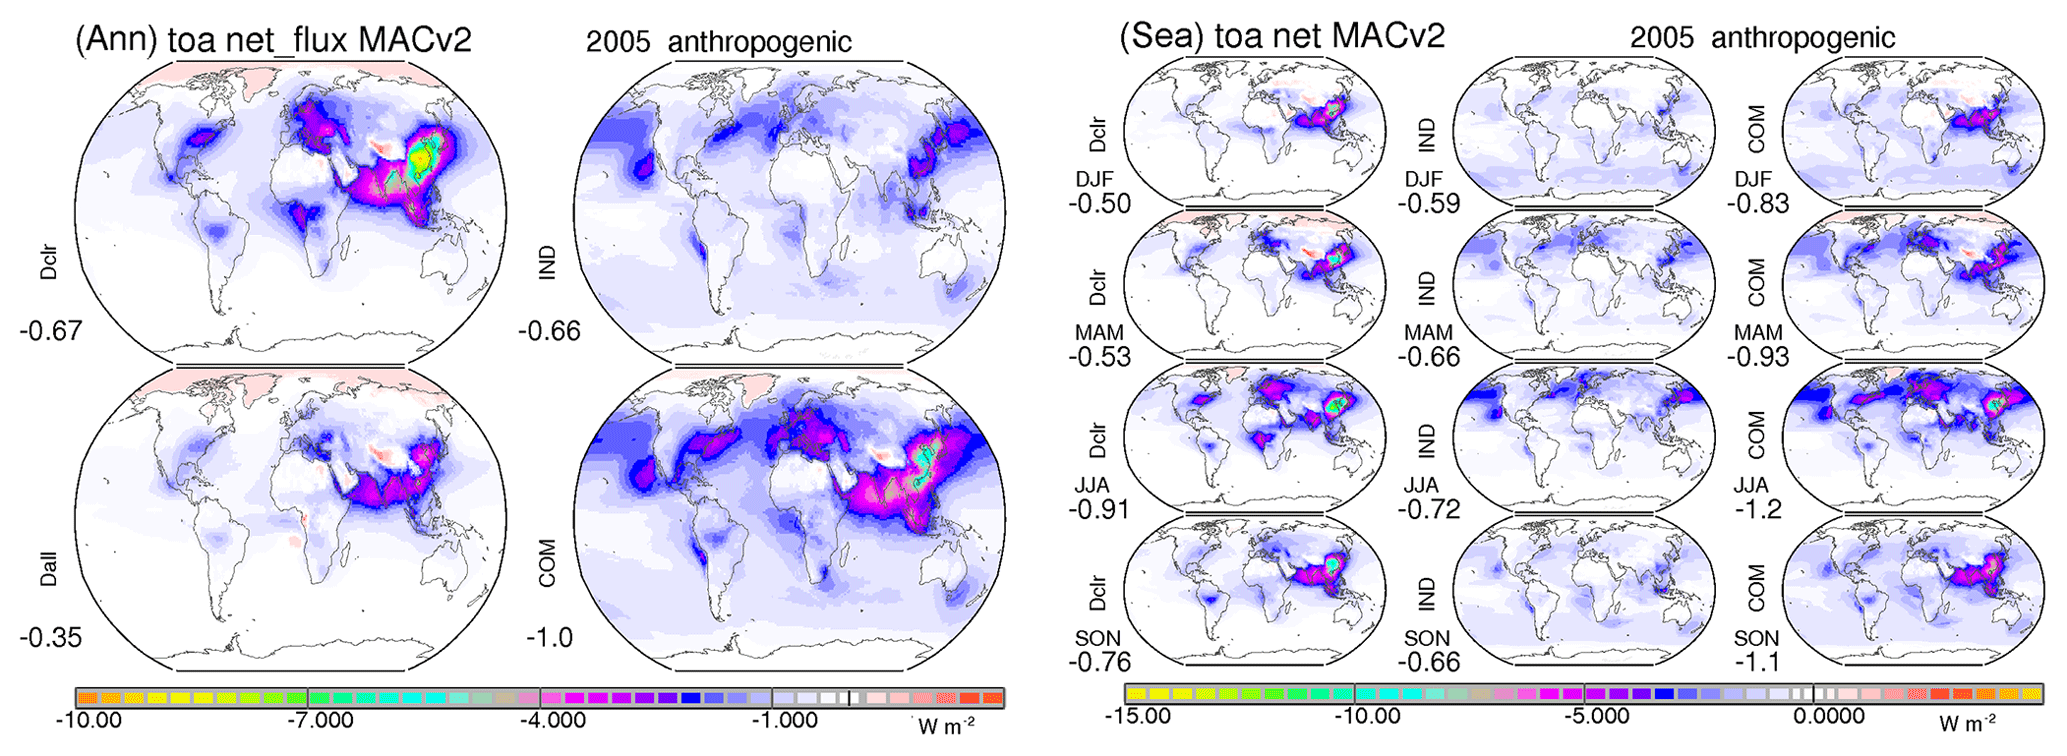
Figure 14TOA radiative effects by present-day anthropogenic aerosol. Annual (left frame) and seasonal maps (right frame) compare direct radiative effects for clear-sky conditions (Dclr) and all-sky conditions (Dall), aerosol indirect (Twomey) effects through modified clouds (IND) and the combined (direct and indirect) effect (COM). Blue colors indicate cooling net-flux losses and (rare) red colors indicate warming net-flux gains. Values below the labels indicate global averages.
Figure 12 compares the impacts for two different estimates for the present-day anthropogenic AOD. One definition is based on the year 1850 and CMIP5 emissions (Lamarque et al., 2010), the MACv2 standard. The other definition applies 1750 as reference year and AeroCom phase 1 emissions (Dentener et al., 2006). Global annual associated anthropogenic AOD maps are given in Appendix E in Fig. E1.
The aerosol first indirect radiative effect is mainly a solar response with increases to the planetary albedo and complementary decreases to the solar surface net fluxes. There is a lot of spatial variability with the largest contributions over (dark) oceans and the Northern Hemisphere. On a global annual average basis (with the preindustrial year 1850 as reference and CMIP5 emissions) the low cloud solar cooling at −0.70 W m−2 dominates its infrared (greenhouse) warming at +0.04 W m−2. With the alternate (ca. 30 % larger) anthropogenic AOD the low cloud solar cooling increases by 50 % to −1.1 W m−2. The strong response is explained for two reasons: aside from the increase to the anthropogenic AOD, the (preindustrial) background is also reduced. And with the reduced background (via the logarithmic relationship) the CDNC response is stronger with respect to the same AODf perturbation. Thus, the indirect aerosol forcing is very sensitive to anthropogenic assumptions. Atmospheric radiative effects (e.g., solar heating) are small, as cloud impacts at the TOA and surface are almost identical.
Spatial variations on a monthly basis for simulated present-day aerosol TOA indirect forcing of MACv2 (with the year 1850 as reference and CMIP5 data) are presented in Fig. 13. Figure 13 illustrates that the aerosol indirect forcing (via the Twomey effect) is not just influenced by anthropogenic aerosol and background aerosol conditions but also by environmental properties. Important elements are solar energy, sun elevation, solar surface albedo, likelihood of single-layer low-altitude clouds and a moderate low cloud optical depth for highest susceptibility. The indirect forcing via smaller cloud drops is strongest over midlatitude oceans (with relative dark surfaces), during spring and summer (with longer sunshine hours), and mainly the Northern Hemisphere (where most anthropogenic aerosol is found). Indirect effects over stratocumulus regions are relative moderate.
Extra analysis of local environmental potential for a Twomey effect and maps for indirect forcing efficiencies is provided in Appendix F. Due to very low aerosol natural background conditions, indirect forcing efficiencies over the southern oceans can be very high. Overall, however, contributions from those regions are minor. Nonetheless, possible indirect effect overestimates in these regions cannot be ruled out, also because the AODf vs. CDNC relationship is not observationally constrained at very low AODf.
MACv2 associated aerosol present-day direct and indirect radiative effects are now compared. Annual maps for TOA direct radiative effects for clear-sky conditions, for direct forcing (with clouds), indirect forcing and the combined forcing (direct and indirect), are presented in Fig. 14.
At the TOA, climate cooling by the present-day indirect effect (globally averaged at −0.66 W m−2) is about twice as large as the present-day direct effect (globally averaged at −0.35 W m−2). However, the spatial variability of the direct forcing is much more diverse, including regions with local warming (via dimming over snow, over lower clouds or during polar nights). The direct effect dominates near continental sources while the indirect effect has stronger impacts over oceanic regions off sources. The combined climate impact is a cooling (globally averaged at −1.0 W m−2) with cooling everywhere except over Greenland. The present-day clear-sky cooling is about 60 % of the combined (direct and indirect) cooling.
Figure 14 also compares seasonal variations. With larger AOD, less snow cover and more sunshine, both indirect and direct effects have maximum impacts during the northern hemispheric summer season.
Annual maps for radiative effects at the surface and for the atmosphere are shown in Fig. 15. Compared are (as in Fig. 14) direct radiative effects with and without clouds, indirect radiative effects and the combined effects (direct with clouds and indirect).
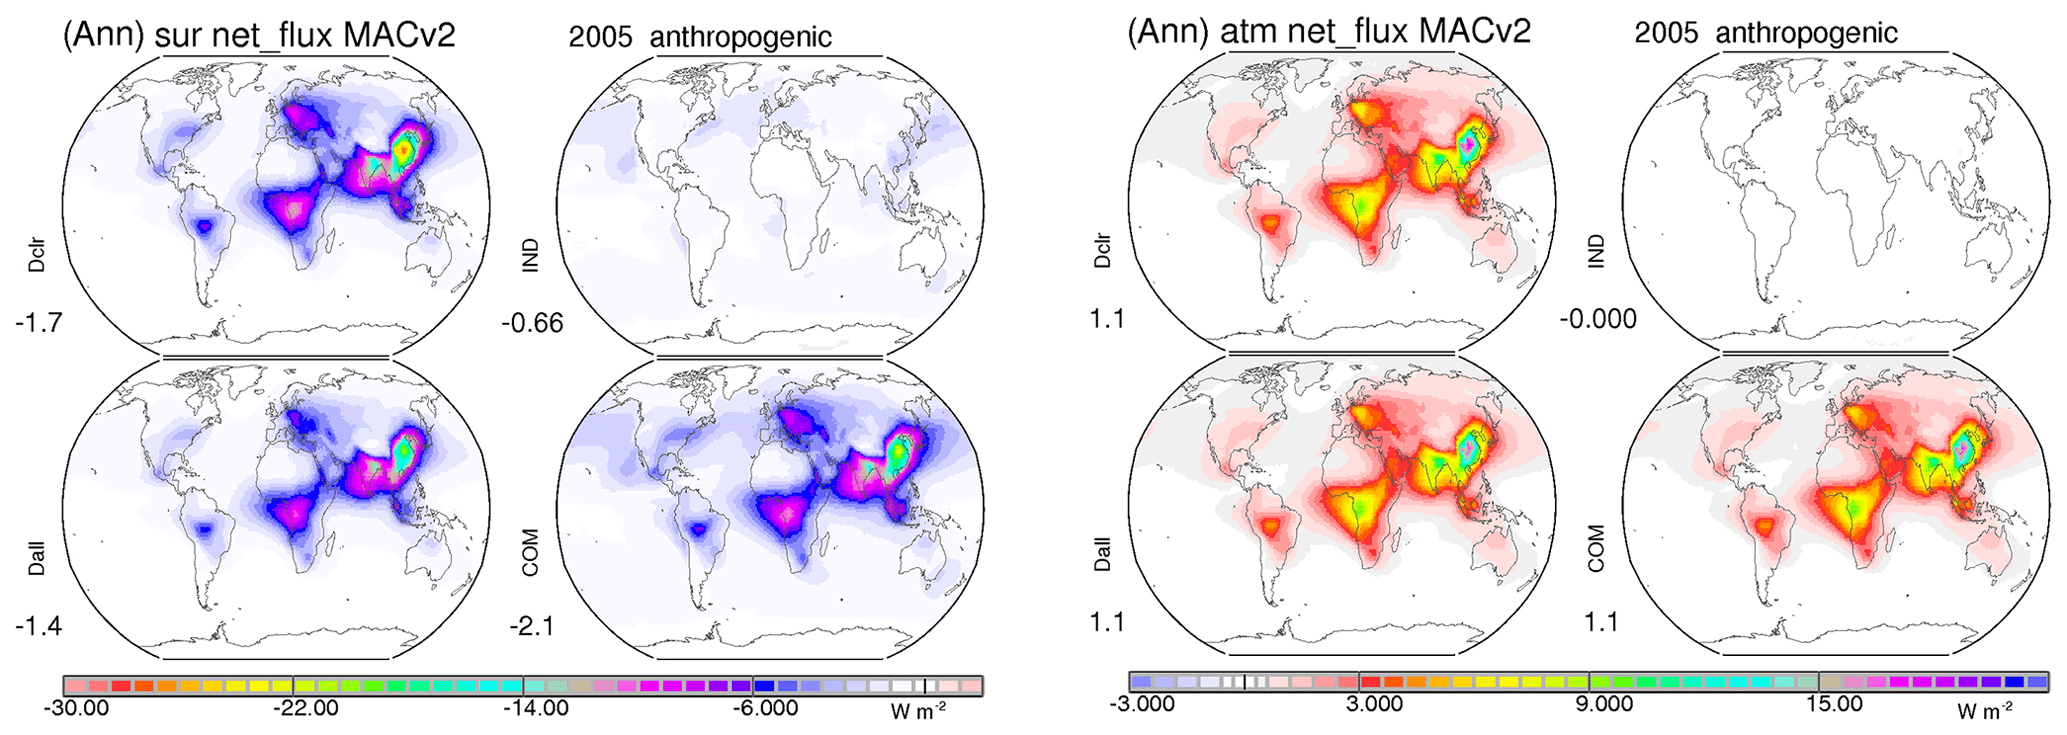
Figure 15Annual radiative effects by present-day anthropogenic aerosol at the surface (left frame) and for the atmosphere (right frame). Maps compare direct effects for clear-sky conditions (Dclr) and all-sky conditions (Dall), indirect (Twomey) effects through modified clouds (IND) and the combined (direct and indirect) effect (COM). Blue colors indicate cooling net-flux losses and red colors indicate warming net-flux gains. Values below the labels indicate global averages.
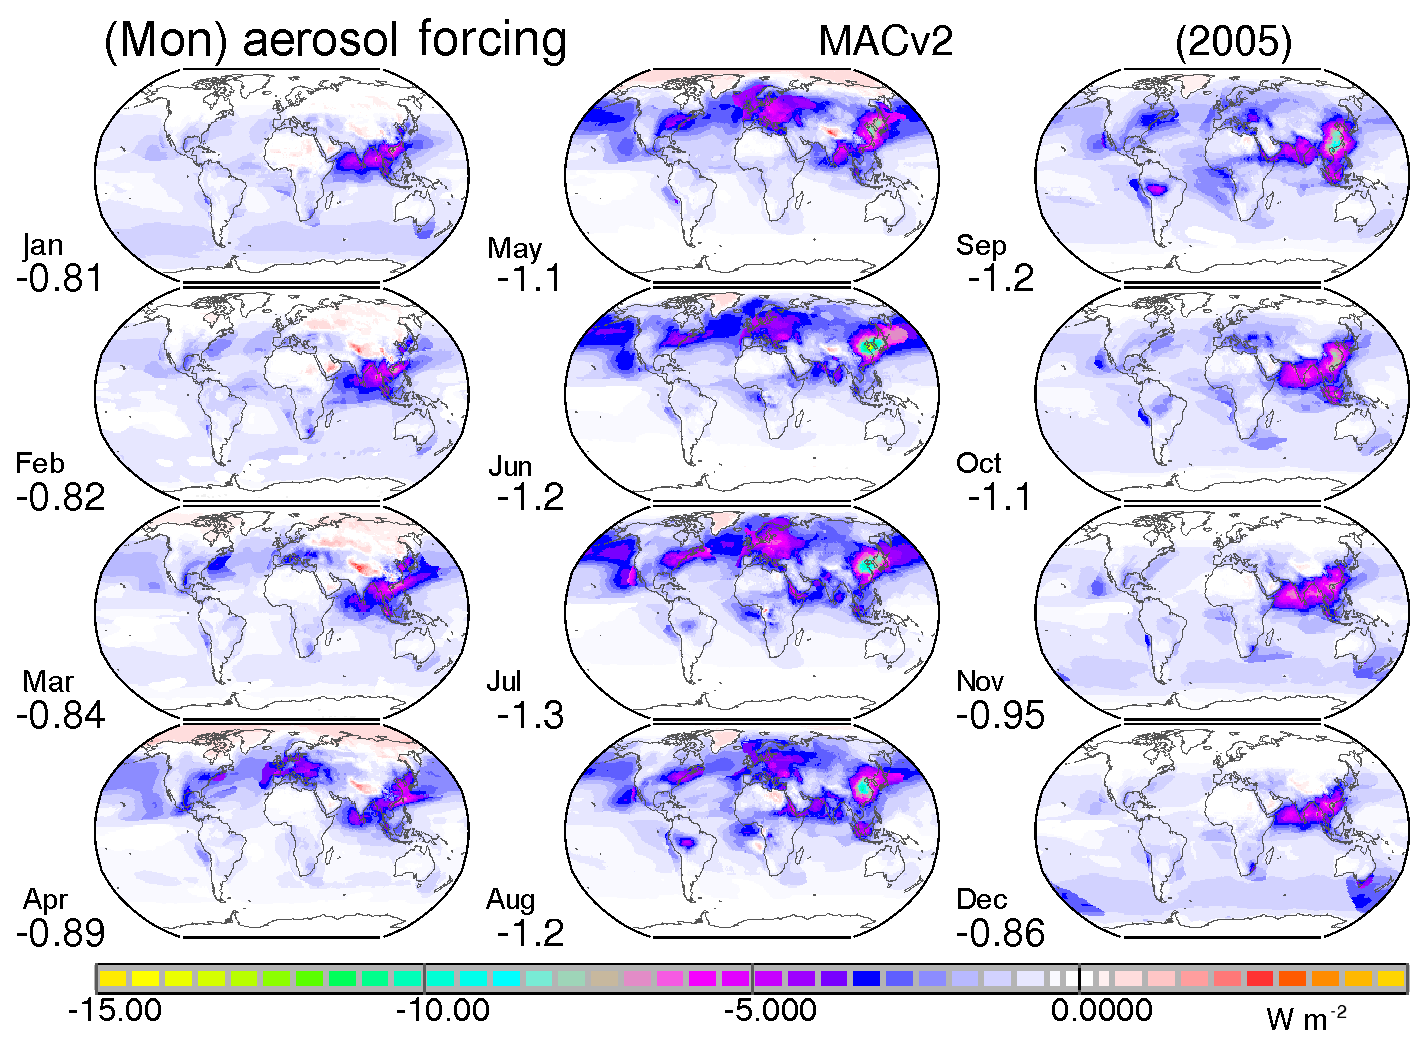
Figure 16Monthly maps for today's total forcing by present-day anthropogenic aerosol.
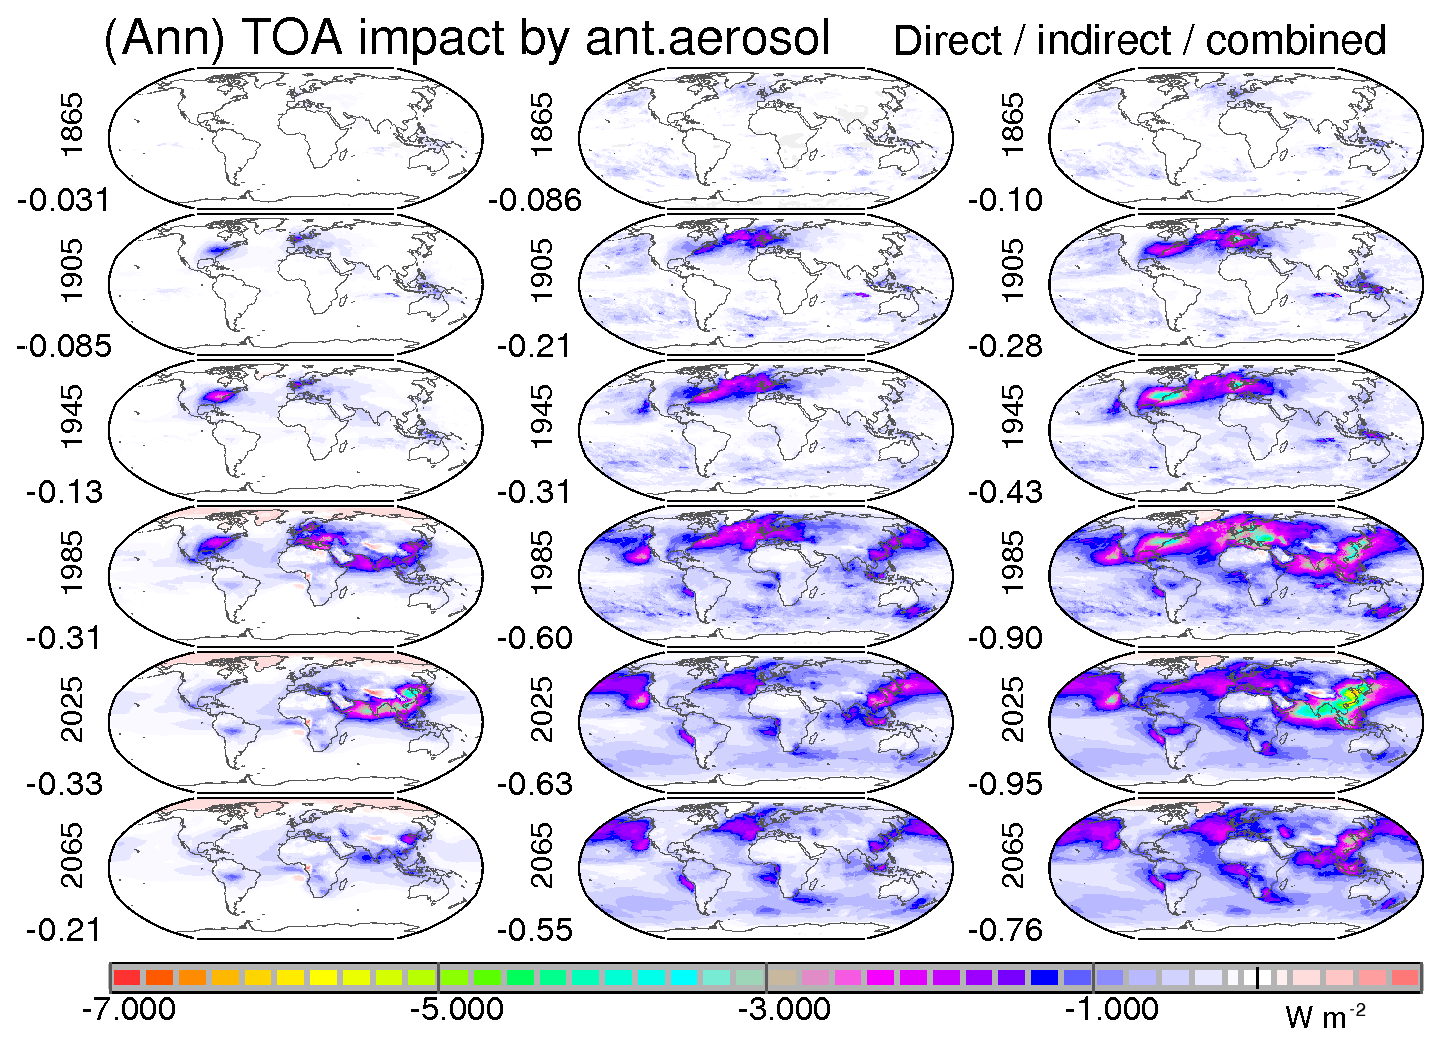
Figure 17Temporal evolution of the climate forcing by anthropogenic aerosol. For selected years (1865, 1905, 1945, 1985, 2025 and 2065) annual maps or the direct (column 1), the first indirect (column 2) and the combined effect (column 3) are compared. Values below the labels indicate global averages.
In the atmosphere, present-day anthropogenic aerosol warms the atmosphere – on average +1.1 W m−2. The atmospheric warming is highly uneven with warming in excess of 10 W m−2 near sources of pollution (e.g., southern Asia, eastern Asia) and wildfire regions (e.g., central Africa). The associated solar heating is almost entirely a direct effect. Thus, aerosol direct effects control the atmospheric response.
At the surface the present-day direct effect yields, due to atmospheric losses, a more negative radiative effect than at the TOA. The present-day direct effect reduces the (solar) flux on average by about −1.45 W m−2 . This is stronger than the flux reductions of about −0.66 W m−2 for the indirect effect. Thus, on a global annual average basis, at the surface net-flux losses by aerosol are dominated by direct effects.
Monthly maps for the present-day combined (direct and indirect) TOA forcing are shown in Fig. 16. More maps on TOA forcing including fractional contributions of clear-sky regions and cloudy-sky regions are presented in Appendix C.
Interestingly global averages of the clear-sky direct impact at the TOA (in Fig. 14) and at the surface (in Fig. 15) resemble that of the combined (direct and indirect) impact in magnitude and regional distribution. Thus, for rough estimates on the aerosol impacts, already clear-sky radiative simulations could provide rough estimates for global averages for aerosol climate impacts.
The MACv2 aerosol climatology offers global maps for changing anthropogenic AOD over time (Kinne, 2019, Fig. 8). Hereby, the historic scaling back to year 1850 is based on transient bottom-up ECHAM simulation (Stier et al., 2006) with NIES emissions, while future scaling is based on regionally simulated responses to changing sulfate emissions of the IPCC 5 RCP 8.5 future scenario. Results of radiative transfer simulations that apply these changing anthropogenic AOD data over time are presented in Fig. 17. Maps for selected years (from 1865 to 2065) compare in 40-year steps the annual forcing of the direct, the indirect (Twomey) and the combined (direct and indirect) effect.

Figure 18Seasonal changes over 20-year periods (1945–1905, 1985–1945, 2025–1985) in aerosol forcing (left frame) and to solar downward fluxes by anthropogenic aerosol (right frame). Blue colors indicate time periods of increased cooling aerosol or a dimming (decreases to the solar surface fluxes), while red colors indicate time periods of a reduced cooling by aerosol or a brightening (increases the solar surface fluxes). Values below the labels indicate global average changes for the selected time periods.
The forcing time slices show that in the early years of the industrial revolution the fractional forcing contributions by indirect effects were relatively high. This is a consequence of a stronger indirect response at lower background conditions, which is predicted by the applied logarithmic relationship.
The temporal time slice maps demonstrate that early into the industrial period mainly the US and Europe where affected by aerosol cooling. By 1985 southeastern Asia had emerged as the third affected region. Since then the aerosol cooling over southeastern Asia kept on growing while aerosol cooling by over Europe and the US declined, also due to successful mitigations efforts. With these opposing regional shifts during the last decades the global average aerosol cooling stayed relatively stable at just below −1.0 W m−2. As in the meantime (by 2015) anthropogenic aerosol loads had reached their regional maximum over eastern Asia (while not yet over southern Asia), no further increases in future aerosol cooling are expected, even if future emission scenarios project the development of a new maximum over western Africa.
A different way to illustrate changes and regional shifts associated with extra anthropogenic aerosols is forcing difference over selected time periods. Total TOA forcing differences and changes to the downward solar flux at the surface are presented by season for three 40-year intervals in Fig. 18.
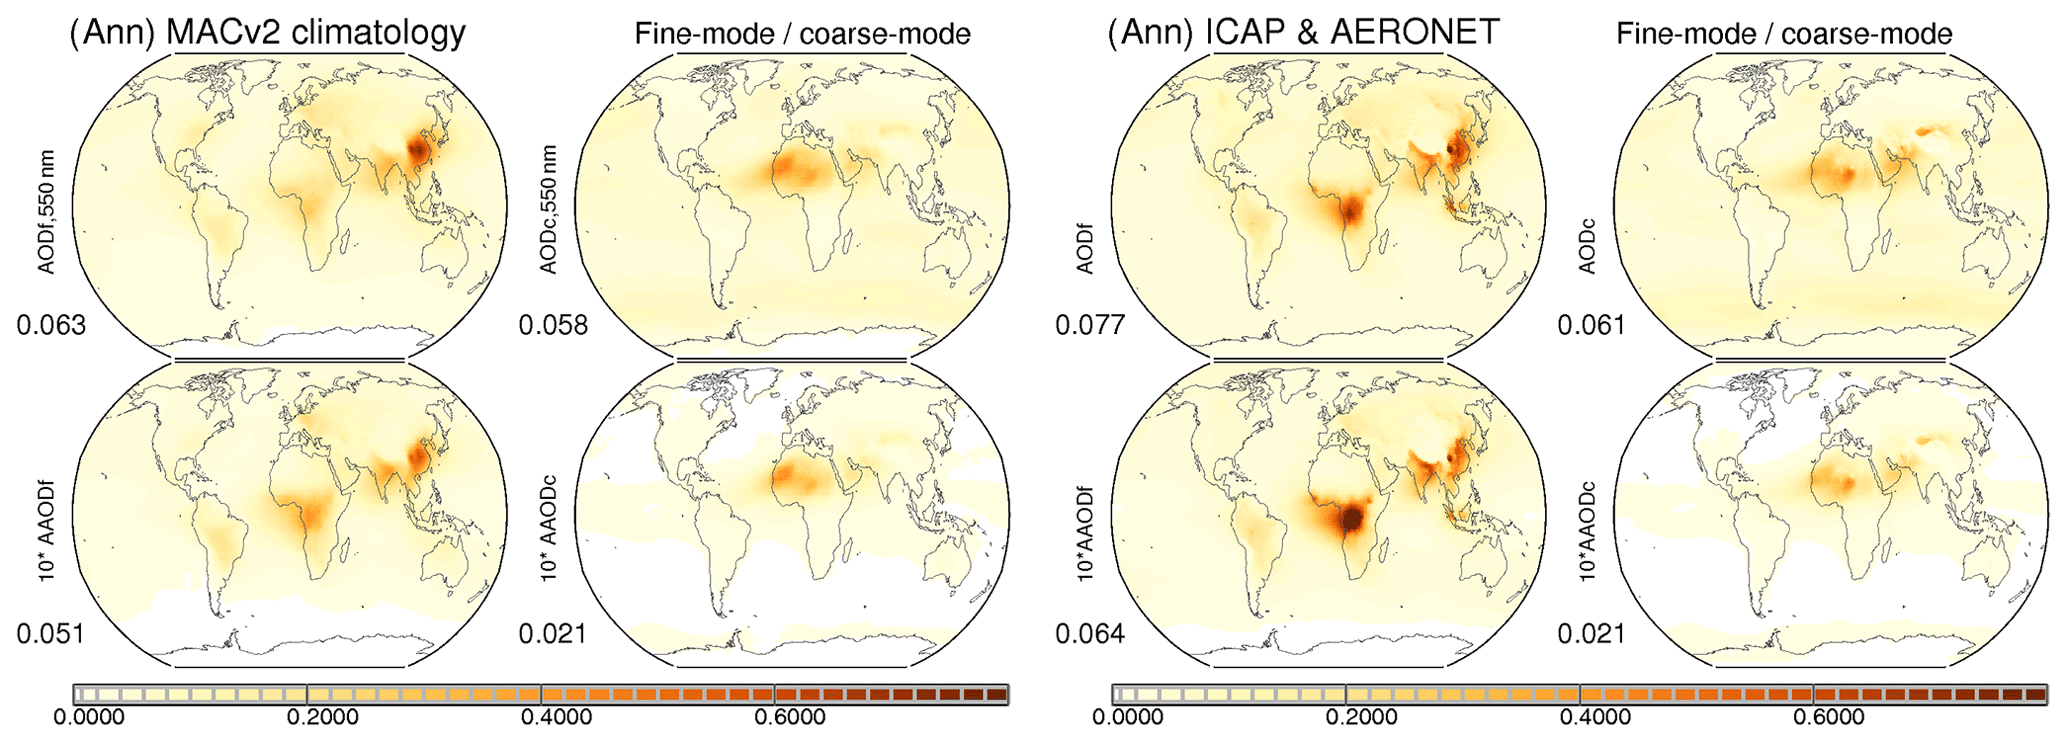
Figure 19Estimates of today's annual maps for tropospheric AODf, AODc, AAODf and AAODc by combining AERONET data with an AeroCom1 median (left frame) and with satellite AOD data assimilating ICAP averages (right frame). AAOD data are multiplied by 10. Values below labels show global averages.
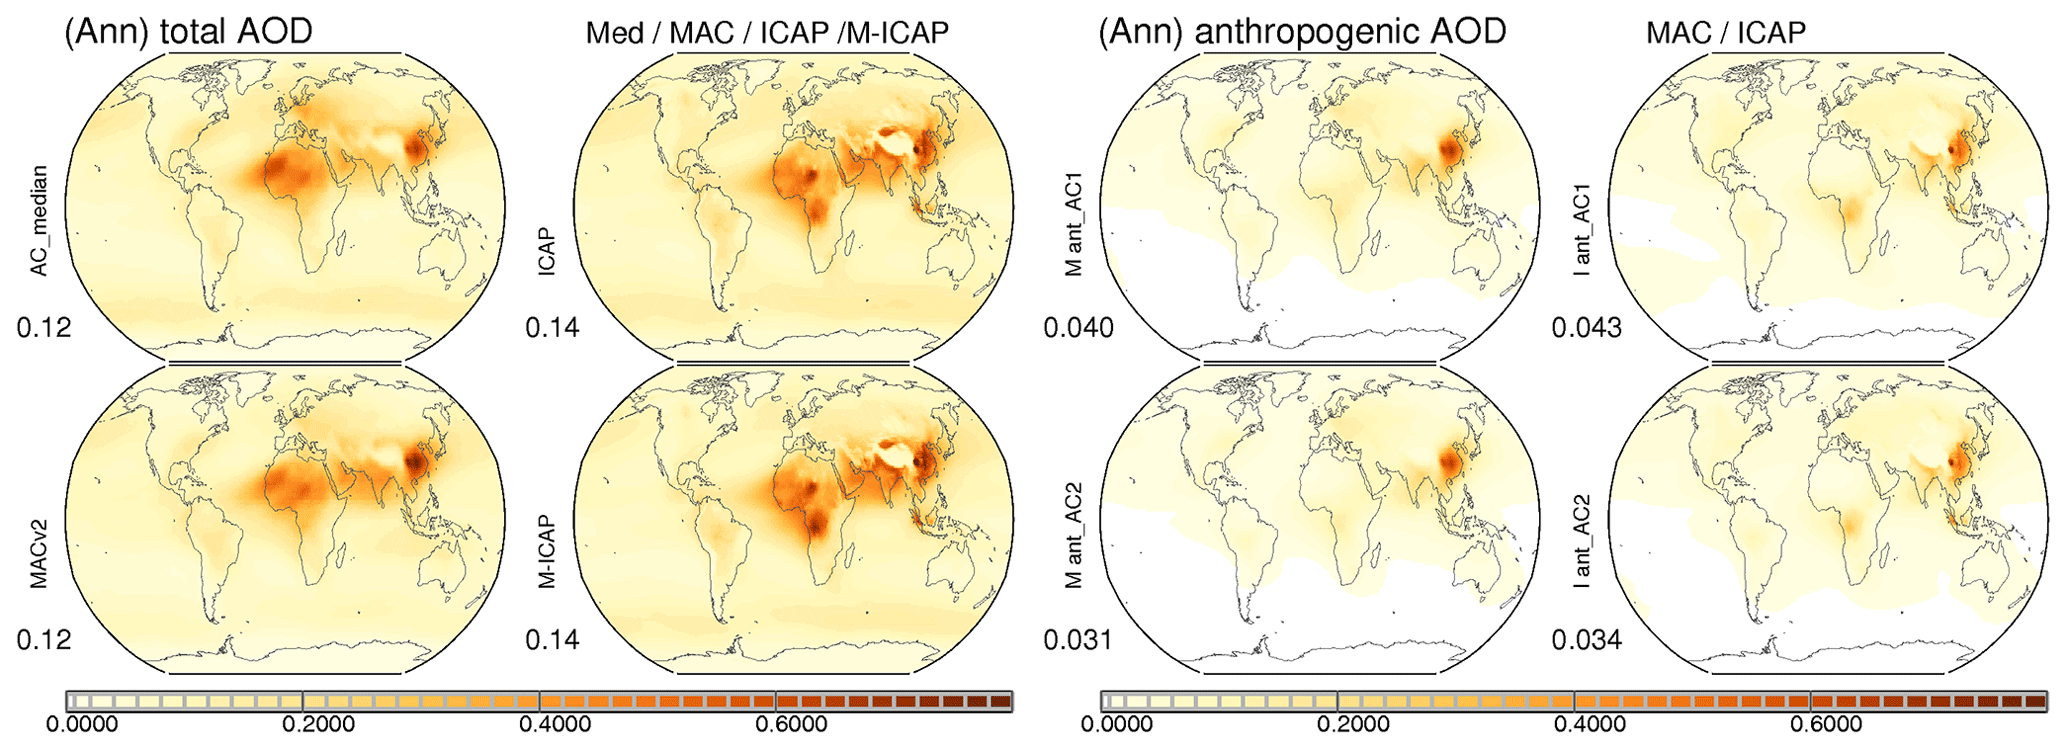
Figure 20Uncertainty estimates for present-day total and anthropogenic AOD from different realizations. Annual maps for tropospheric total AOD (left frame) and for anthropogenic AOD (right frame) are shown. Total AOD maps compare model ensemble data of AeroCom1 experiments (left column) and ICAP satellite data assimilations (right column), before (top) and after (bottom) the data merging with sun-photometer data. Anthropogenic AOD maps are the result of applying the two different anthropogenic fractions (based on emissions by Dentener – AC1 – and Lamarque – AC2) to the fine-mode AOD of the AERONET adjusted maps. Values below the label show global averages.
Between 1945 and 1905 TOA cooling occurred mainly over the eastern US during summers. Between 1985 and 1945 TOA cooling strongly increased during summer near Europe and over eastern Asia as well as during the (dry) fall season over southern Asia. Between now and 1985, the (mainly summer) TOA cooling strongly decreased over Europe and the eastern US but kept increasing over southeastern Asia.
Also shown in Fig. 18 are MACv2 aerosol simulated changes to the downward solar fluxes. These temporal regional and seasonal changes are consistent with observations by ground-based radiation (Wild, 2016). These results strongly suggest that the observed long-term average dimming (until 1985) following a long-term average brightening (since 1985) can be mainly attributed to anthropogenic aerosol.
The calculations of the aerosol radiative effects and the aerosol radiative forcing include many uncertainties. The focus here is on uncertainties in the aerosol fields of the MACv2 (although also approximations in the radiative transfer model, simplifications to environmental data and the application of monthly averages will contribute). An initial test in Fig. 19 compares the impact of different background maps for AODf and AODc in developing the MACv2 aerosol climatology.
As an alternate modeling background in the data merging of MACv2, ICAP ensemble data (Peng et al., 2018) from the satellite AOD assimilation community are used. Three-hourly data of years 2015 and 2016 for averages of up to seven assimilations are combined into local monthly mean AODf and AODc. Global maps of these aerosol properties replace AODf and AODc maps of the AeroCom phase 1 background data in the merging with the sun-photometer statistics. All other properties (e.g., the absorption strength of each size mode) remain identical.
The climatology with the ICAP background yields on average ca. 15 % larger values for the midvisible AOD. Patterns are slightly shifted but the major differences are much stronger AODf and AAODf maxima over central Africa. It is difficult to judge if these differences are the result of (in assimilations applied by MODIS) satellite AOD retrieval overestimates in that region or due to overlooked emissions in modeling. Unfortunately, there are no AERONET reference sites in that region. Globally the AODf is ca. 25 % larger. Fortunately, most of this extra AODf has a strong natural component so that anthropogenic AOD is increased by just 10 % as shown in Fig. 20.
The assumed preindustrial reference states to define “anthropogenic” contributions introduce probably the largest uncertainty. To illustrate this point, the standard anthropogenic AODf fraction based on a reference year 1850 and CMIP5 emissions (Lamarque et al., 2010) was replaced by an alternate approach based on a reference year 1750 and AeroCom emissions (Dentener et al., 2006). Figure 20 shows that with the alternate approach the anthropogenic AOD in MACv2 increases (globally averaged) by 30 % from 0.031 to 0.040. Considering the uncertainty in AOD but limiting the reference to the year 1850, then the range for anthropogenic AOD (at 550 nm) is between 0.030 and 0.038. Another big uncertainty is the anthropogenic fraction for the soot (BC) component, which dominates the absorption. The present-day anthropogenic BC component warming is uncertain between +0.25 and 0.45 W m−2. If all of the present-day BC is considered anthropogenic then there is a +0.55 W m−2 upper ceiling. Thus, there is no support for larger present-day BC direct warming contributions (as in Bond et al., 2013).
The neglect of larger coarse-mode aerosol in the anthropogenic definition in MACv2 seems less important. Potential coarse-mode anthropogenic contributions via mineral dust (e.g., due to land-use change) seem secondary, especially as anthropogenic dust forcing is near neutral, with solar and infrared radiative effects largely canceling each other.
Sensitivity studies in Appendix B demonstrate that a 25 % larger anthropogenic AOD means a 25 % stronger direct forcing and a 40 % larger indirect forcing. An alternate ICAP background in the data merging of MACv2 increases the total AOD for an up to 15 % stronger aerosol direct and aerosol indirect forcing. And a likely BC anthropogenic fraction that is larger than the fine-mode anthropogenic fraction will contribute to a less negative direct effect. Also the treatment of the indirect effect makes many assumptions and is highly simplified. Finally all presented results refer to an instantaneous impact. Short-term cloud adjustments are not included, but they are much smaller (on the order of 10 %) in comparison (Fiedler et al., 2019), with a tendency to reduce the aerosol radiative effects.
Considering all contributing uncertainties, a −0.7 to −1.6 W m−2 range is estimated for present-day global annual average aerosol forcing (assuming a 1850 preindustrial reference year) and a most likely value near −1.0 W m−2. Note that the less negative lower bound (−0.7 W m−2) is more certain than the more negative (−1.6 W m−2) upper bound.
The main argument towards the upper bound (−1.6 W m−2) is that the anthropogenic fine-mode fraction could be larger. The upper bound of the direct effect at −0.45 W m−2 is much better constrained than the upper bound for the indirect effect. An alternate anthropogenic scaling using AeroCom phase 1 emissions raised indirect effects (from −0.65) to −1.1 W m−2 and direct effects (from −0.35) to −0.50 W m−2 for a combined −1.6 W m−2 cooling. However, this alternate larger anthropogenic fine-mode fraction applies an earlier preindustrial reference year (1750). Thus, such a negative aerosol forcing is unlikely for a year 1850 reference. Also the simplicity in describing the aerosol indirect effects in MACv2 is very simple. There are calls for a more-process-based modeling treatment or observational approaches which better distinguish specific aerosol and cloud properties (Grandey and Stier, 2010). However, since the eventual global patterns for the indirect radiative forcing are already well matched (as environmental properties play a big role), a more-detailed indirect effect treatment may come at the expense of added uncertainty. Another argument for an upper bound of −1.6 W m−2 is that such a strong cooling potential by anthropogenic AOD at the middle of the 20th century would have caused global climate cooling which was not observed (Kretzschmar et al., 2016).
The main argument for the lower bound (−0.7 W m−2) is that the lower bound of the direct effect (which is better constrained than the indirect effect) is estimated at −0.2 W m−2. This lower value can be explained with a possibly higher anthropogenic fraction for absorbing BC AOD (than simply applying the anthropogenic fine-mode AOD for anthropogenic BC). For the present-day indirect effect there remains uncertainty; however, at least a cooling of −0.5 W m−2 should be expected for the reduced drop size effect. (In that context it should be noted that the less negative indirect effects of MACv2-SP in Appendix B do not qualify due to their incomplete global coverage for anthropogenic AOD).
To reduce the aerosol forcing range (−0.7 to −1.6 W m−2) progress in quantifying the indirect effect(s) and preindustrial references for all aerosol components are needed.
The MACv2 global monthly aerosol climatology, tied to observational monthly statistics on aerosol amount, absorption and size from sun/sky photometry, was applied in dual-call offline radiative transfer to determine aerosol effects on atmospheric radiation. The direct (added presence) effects of present-day aerosol and the climate-change-relevant effects of anthropogenic contributions (since preindustrial times) are determined. Hereby, results are usually presented via global annual and even monthly maps to visualize regional and temporal detail, as not only aerosol properties but also influential environmental properties have strong regional and seasonal signatures. Still, for simplicity, most discussions below apply resulting global annual averages. Hereby, radiative net-flux changes are examined at the climate-relevant TOA location, at the surface for exchange processes near the ground and for the atmospheric dynamics (via the TOA minus surface impact). Radiative net-flux losses refer to a cooling and radiative net-flux gains refer to a warming.
Present-day total aerosol by its presence (direct effect) reduces net fluxes by −1.1 W m−2 at the TOA and by −4.0 W m−2 at the surface, so that the energy in the atmosphere is increased by +2.9 W m−2. Hereby, the net-flux losses are composed of larger solar losses and partly offsetting smaller infrared gains, at −1.8 and +0.7 W m−2 at the TOA and −5.5 and +1.5 W m−2 at the surface, while atmospheric solar warming of +3.7 W m−2 is reduced by −0.8 W m−2 in atmospheric IR cooling.
Anthropogenic aerosol is only considered to contribute to submicrometer aerosol sizes so that only solar direct radiative effects matter (and potential IR radiative effects can be neglected). Present-day anthropogenic aerosols by their added atmospheric presence (direct effect) are estimated to reduce solar TOA net fluxes by −0.36 W m−2 and surface net fluxes by −1.5 W m−2. By difference the atmosphere is warmed by +1.1 W m−2. In addition, the major aerosol-induced impacts to water clouds are considered (the first indirect effect). More numerous aerosols reduce the cloud droplet sizes. This Twomey effect is implemented via satellite-retrieval-based associations between aerosol and drop concentrations. The present-day first indirect effect reduces mainly solar radiative net fluxes at the TOA and at the surface by −0.65 W m−2. Thus, the combined direct and indirect effect yields a cooling of −1.0 W m−2 at the TOA and of −2.1 W m−2 at the surface. On average, the indirect effect dominates the (TOA) climate cooling, the direct effect dominates the cooling at the surface and the direct effect determines the atmospheric heating. Spatially both direct and indirect effects are strongest during the NH summer. Direct effects are strongest near continental sources. Indirect effects are stronger away from sources over (dark) oceans.
Uncertainties with respect to the aerosol properties should consider that the total AOD could be 15 % larger than in MACv2 and that a 25 % larger fine-mode anthropogenic fraction than MACv2 is possible. Simulations with a 30 % larger anthropogenic fraction yield a 30 % larger direct effect and an even 50 % larger indirect effect. Thus, the uncertainty for present-day forcing (the anthropogenic impact at the TOA) is very likely between −0.7 and −1.6 W m−2, with −1.0 W m−2 as the best estimate. Hereby, the direct effect is much better constrained (−0.20 to −0.45 W m−2) than the indirect effect (−0.5 to −1.1 W m−2). A better estimate for preindustrial references (for fine mode, the BC component and even for dust) would help in reducing these uncertainties. And also the rather simple representation of the indirect effect needs to be validated.
MACv2 optical properties also allow one to attribute direct radiative effects to components. The top-down component estimates of this presentation for present-day forcing agree with those from bottom-up modeling, as summarized in Appendix G. Present-day total soot (BC) warms at the TOA with +0.55 W m−2. At least 50 % and at most 85 % could be attributed to BC, depending on the definition for the anthropogenic BC fraction, but certainly not more than 100 %. With the possibility that the anthropogenic fraction for soot (BC) is larger than for the fine-mode anthropogenic fraction (in other words that there was relatively more absorbing BC at preindustrial times than at the present day), the assigned warming by anthropogenic BC would increase – from +0.28 W m−2 now to +0.38 W m−2 at a 70 % fraction or even +0.45 W m−2 at an 85 % fraction. This is turn would reduce the present-day (all component) direct aerosol forcing from −0.36 W m−2 to −0.26 W m−2 (at 70 % anthropogenic BC) or just −0.19 W m−2 (at 85 % anthropogenic BC). Thus, not only accurate information on the preindustrial state of the fine-mode AOD but also on its composition is needed for more certain aerosol forcing estimates.
Thus, not only accurate information on the preindustrial state of the fine-mode AOD but also on its components, mainly that of the BC component, at that time (e.g., soot properties) is needed.
The combined carbon (BC and OC) component, which approximates the effect of BC coemitters, has a near-neutral radiative forcing behavior. Thus, short-term climate warming mitigation concepts via a soot removal may not be very effective as also mainly scattering aerosol resulting from coemitted trace gases would be removed. The climate impact for mineral dust (while showing strong warming over continents, yet strong cooling over oceans) behaves globally almost climate neutral. Thus, potential anthropogenic impacts from dust, as a result of land-use change, as uncertain as they are, seem less importance for climate change considerations. Thus in the end it is the (in the midvisible) nonabsorbing submicrometer-size aerosol (mainly sulfate and nitrate) that regulates the anthropogenic AOD.
Calculations with model-predicted temporal changes to the anthropogenic AOD indicate that qualitatively the anthropogenic aerosol forcing has not changed much over the last decades and is not likely to increase over the following decades, despite strong regional shifts. These regional shifts explain most solar insolation (brightening or dimming) trends that have been locally observed by decadal time-series ground-based radiation, especially over Europe and the US.
MACv2 properties are accessible at ftp://ftp-projects.zmaw.de/aerocom/climatology/MACv2_2018/ (last access: 21 August 2019).
The data are placed in several subdirectories and a README file describes
the data content of file names. The subdirectories are listed with a short description as follows.
| /550 nm | (midvisible) aerosol properties at 550 nm wavelength |
| /CCN | lower cloud-base condensation nuclei and critical radii at different supersaturation |
| /detail | ancillary data for radiative transfer simulations |
| /documents | some documentation and figures |
| /forcing | MACv2 associated radiative effects |
| /program | fortran code and ancillary data to create MACv2 aerosol properties |
| /program_force | fortran code and ancillary data to determine MAC aerosol radiative effects |
| /retrieval | MACv2 fields for underdetermined solar-reflection-based AOD retrievals |
| /spectral | 2005 optical data at three different spectral resolutions – 20, 30 (RRTM), 31 bands |
| /time | same as in /spectral but data for different years (from 1850 to 2100) |
Observational relationships which employ regional associations between satellite-retrieved properties for fine-mode AOD (AODf) and cloud droplet number concentration (CDNC) allow one to associate increases in AODf from anthropogenic sources with increases in CDNC. For selected AODf ranges the median CDNC value is determined and then all median CDNC values are combined to result in a logarithmic curve fit. By applying the curve twice locally, once for the present-day AODf and once for the preindustrial AODf, an associated CDNC increase in determined. Hereby, the CDNC increase depends on the AODf difference and on the AODf (preindustrial) background. Further assuming that the cloud water of the affected cloud remains constant, CDNC increases are easily converted into drop size reductions, the needed input to simulate associated increases to the planetary albedo, the Twomey effect (Twomey, 1974), in offline radiative transfer simulations.
AODf and CDNC cannot be retrieved by the same sensor at the same time. However, spatial associations within larger regions are expected to offer insights on potential relationships. Retrieval averages are matched for relatively large in latitude–longitude regions. This is in part done to avoid exaggerations in associations, as local indirect effects (e.g., ship pollution impacts) are usually weaker in the context of larger spatial scales (Coakley and Walsh, 2002). For better statistics also only monthly averages are matched. Their use seems justified, because at these large spatial scales monthly associations are almost identical to those using daily data instead (Matt Christensen, personal communication, 2015).

Figure A1Annual maps (top) and a JJA seasonal maps (bottom) for AODf (left frame) and CDNC (right frame) for different retrievals with MODIS and ATSR sensor data.
Associations between AODf and CDNC were only considered over oceanic regions (where satellite retrievals for both properties are more reliable due to the dark background) and only when both sufficient signal and quality could be assured. Thus, only CDNC retrievals for overcast conditions under near-nadir views are considered. The investigated matches include two different MODIS-sensor-based CDNC retrievals for an entire year (collection 5.1 for year 2007 provided by Dan Grosvenor, Leeds; and collection 6.0 for year 2008 provided by John Rausch, Vanderbilt) with matching AODf data from NASA's Level-1 and Atmosphere Archive and Distribution System (LAADS) site and an Along Track Scanning Radiometer (ATSR)-sensor-based CDNC retrieval (for year 2008 provided by Matt Christensen) for a single season with matching AODf data by Rutherford Labs ORAC retrieval. The regions with valid matches between AODf and CDNC data are illustrated in Fig. A1.
Between the three different retrievals for CDNC and AODf there are often large absolute differences. The more important relative differences (as expressed by the logarithmic shapes, constructed from connection median CDNC points in AODf sub-bins), however, are smaller. The resulting logarithmic fits along with the data scatter are presented in Fig. A2. In that figure the AODf to CDNC associations of all available months and locations are combined in a single plot.
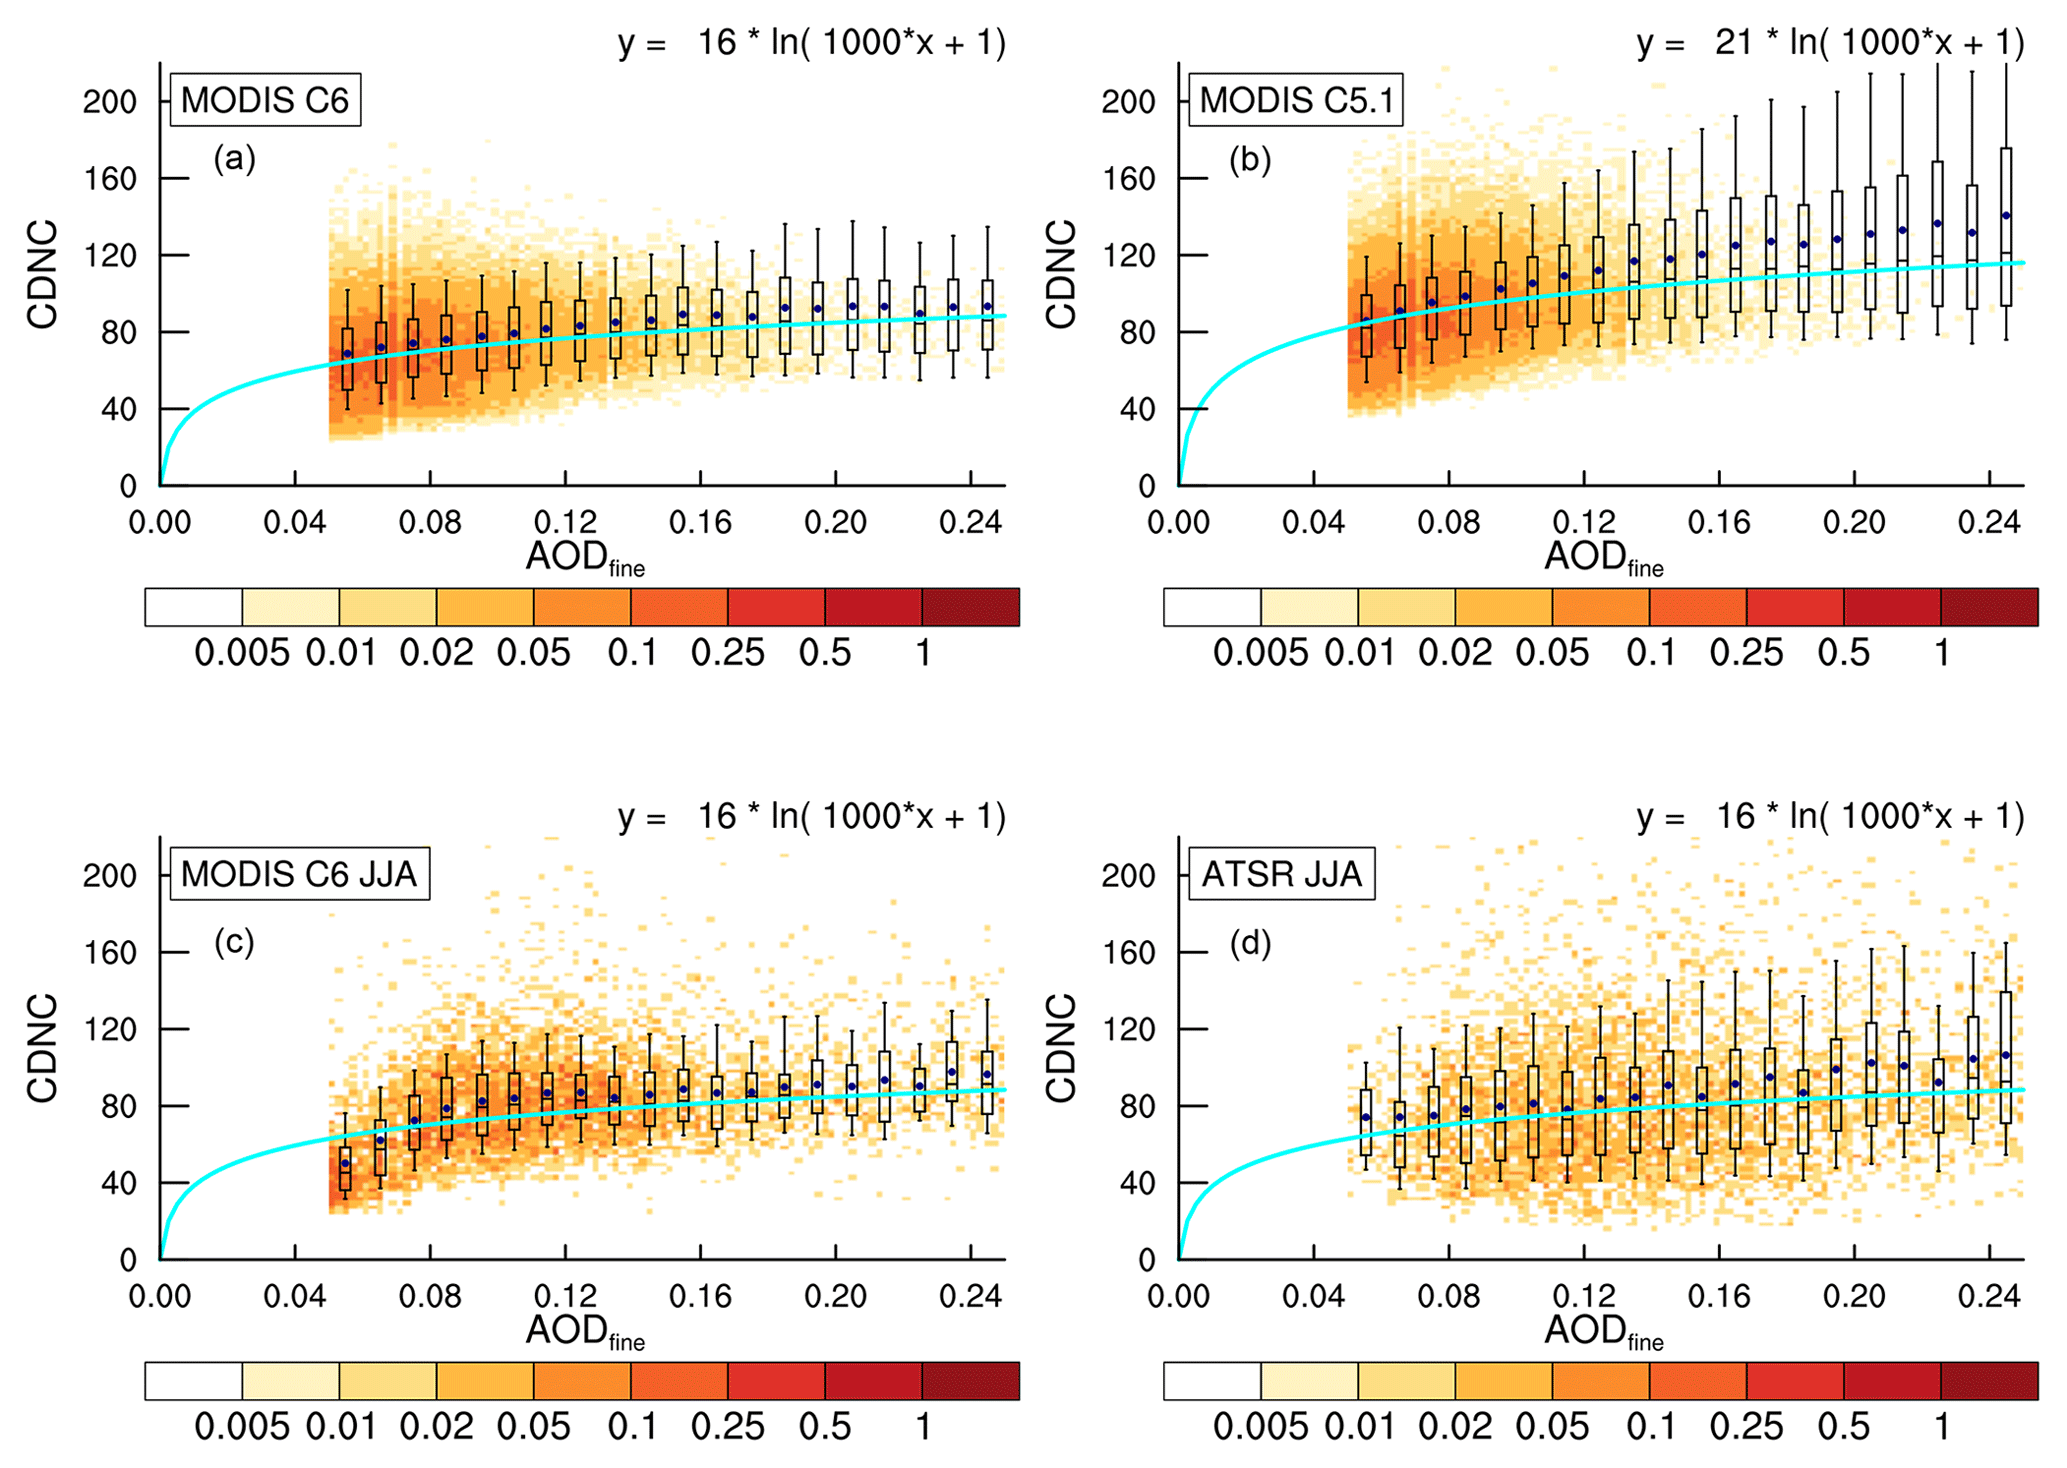
Figure A2AODf vs. CDNC relationships for MODIS 6 (year 2008, a), for MODIS 5.1 (year 2007, b), for MODIS 6 (JJA of year 2008, c) and ATSR (JJA of year 2008, d). Matches were removed for midvisible AODf values smaller than 0.05 (due to too-poor signal-to-noise ratios) and larger than 0.25 (due to poor statistics). For individual AOD bins box boundaries indicate the upper and lower quartiles, star symbols indicate averages and horizontal lines indicate median values. Logarithmic functions (displayed on top and illustrated by light blue lines) were fitted to the median bin values.
The fits for the four scatterplots follow an expected log-normal fit as for a given AODf increase the associated CDNC increase will be smaller the higher the background AODf is due to nuclei saturation. While there are differences compared to the prefactors of the fitting functions, the multipliers for AODf (x) are identical (actually the same multiplier of 1000 applies well for all sensor data). The prefactor cancels out when determining CDNC increase factors, because these increase factor are based on the ratio of two applications: (1) a CDNC determination for total AODf [preindustrial+anthropogenic] and (2) a CDNC determination for only the preindustrial AODf [preindustrial]). Thus, in summary, retrievals from different satellite sensors suggest almost identical CDNC factor increases – for a given AODf change and a given AODf (nonzero) background.
The agreement for the (observational) fit functions for different satellite sensor data is quite in contrast to the diversity and to an (on average) much stronger Twomey effect in global modeling. These results are based on an analysis of output from nine global models with complex aerosol schemes that participated in the AeroCom (http://aerocom.met.no, last access: 21 August 2019) indirect experiment. For the comparisons, the model-simulated output for AODf and CDNC was subsampled at the same locations of the satellite matches. Scatterplots and associated fit functions between observational data (here MODIS collection 6) and the AeroCom model ensemble average are presented in Fig. A3.

Figure A3AODf vs. CDNC relationships as in Fig. A2 but here based on a satellite retrieval (a, here MODIS 6) and on the AeroCom model ensemble average (b). Note the much steeper slope in global modeling (dark blue lines) which indicates a much stronger Twomey effect by global modeling than by satellite-retrieval-based observations (light blue lines).
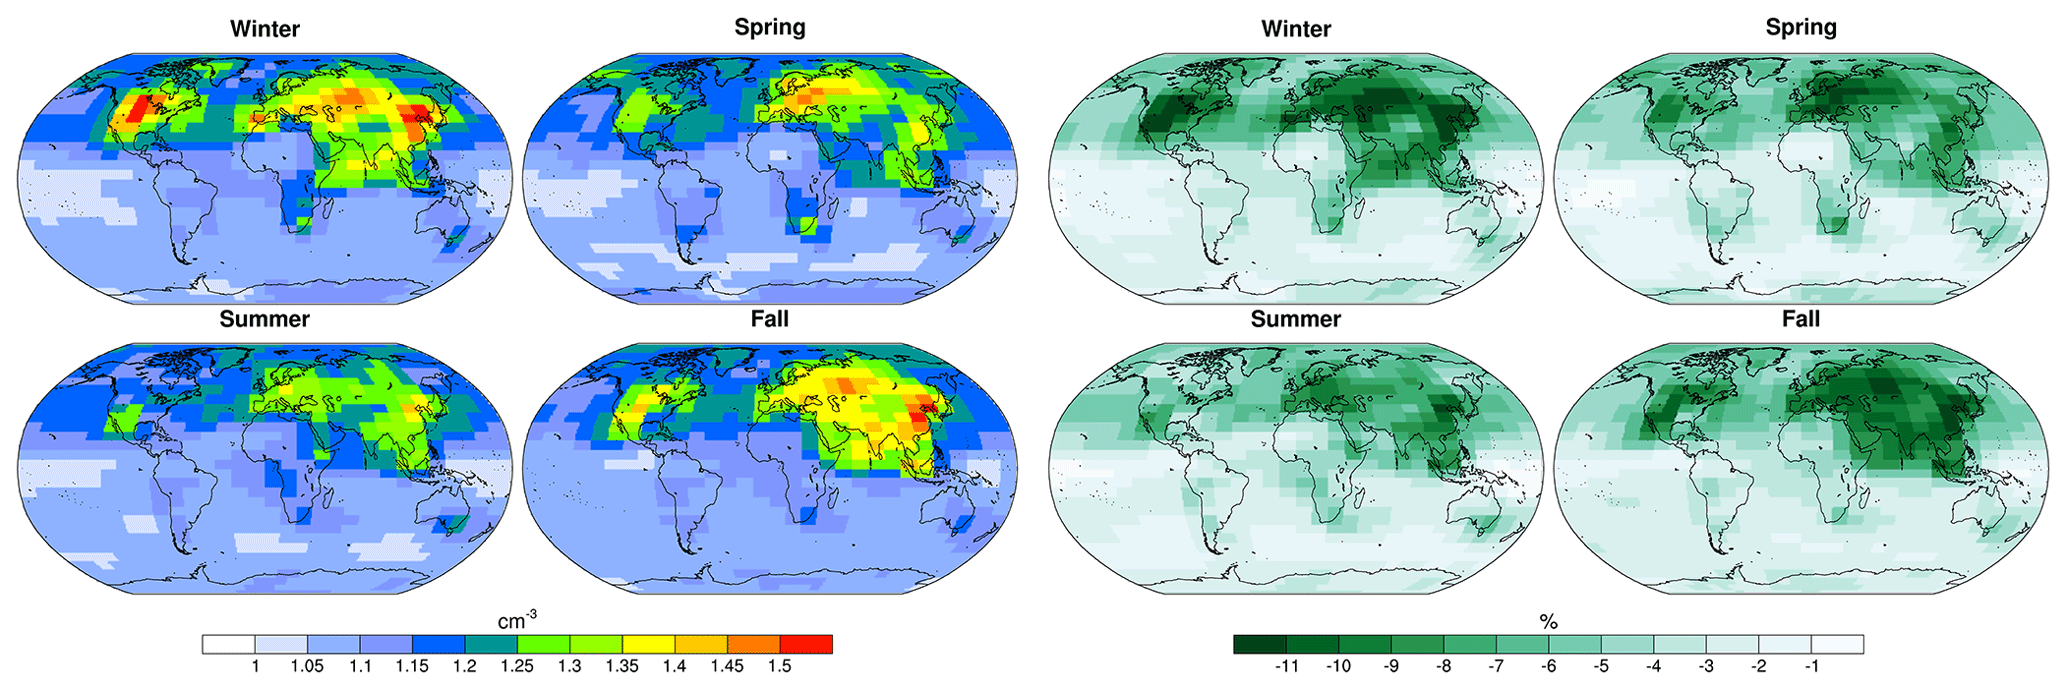
Figure A4Seasonal CDNC factor increases (left frame) and associated droplet radius reductions in percent (right frame) due to today's anthropogenic aerosol and the preindustrial fine-mode background as defined by MACv2.
The +1 security value in the logarithmic fit (to avoid negative CDNC values) for the fine-mode AOD relationship to CDNC is raised +3 to account for additional nuclei from coarse-mode aerosol. These contributions are particularly important in fine-mode aerosol sparse regions over the southern oceans to avoid potential overestimate for CDNC factor increases. Thus,
Applying today's total (preindustrial and anthropogenic) fine-mode AOD and only the preindustrial AOD of MACv2, the CDNC increase factors due to anthropogenic aerosol are determined. And with the assumptions that the water content remains unchanged these CDNC increases are easily converted into droplet radius reductions.
The seasonal averages for CDNC factor increases and water cloud droplet radius reductions (in %) associated with today's anthropogenic aerosol in the context of preexisting aerosol are presented in Fig. A4. There larger cloud droplet radius reductions are on the order of 10 %.
There are different MAC climatology flavors for aerosol optical properties in circulation. As impact differences are of interest, radiative effects at the TOA by today's anthropogenic AOD of the MACv2 climatology are compared to those when applying in offline simulations (1) aerosol optical properties of the older MACv1 climatology (Kinne et al., 2013) or (2) aerosol optical properties of the plume approximation for anthropogenic AOD (Stevens et al., 2017; Fiedler et al., 2019) instead. Annual maps for direct (clear-sky and all-sky) aerosol effects at the TOA are compared in Fig. B1.
For the offline simulations with the MACv2-SP data two different natural background conditions are assumed: one with a lower MACv1 natural background (M_SP_1) and one with a higher MACv2 natural background (M_SP_2).
The MACv2-SP plume approximation yields MACv2 similar cooling patterns for present-day anthropogenic aerosol. However, MACv2-SP maxima are stronger (e.g., China) and weaker (e.g., South America). In the MACv2-SP plume approximation, contributions in remote regions are lower or completely missing, as individual plumes with limited spatial domains (even when combined) do not cover the entire globe. The impact by using different natural backgrounds in MACv2-SP (once using MACv1 natural aerosol and once using MACv2 natural aerosol) has only a small impact on the direct forcing. Globally averaged, both clear-sky and all-sky TOA cooling in MACv2-SP are ca. 10 % smaller than in MACv2, mainly as the midvisible global average midvisible anthropogenic AOD in MACv2-SP is only 0.028 compared to 0.031 in MACv2.
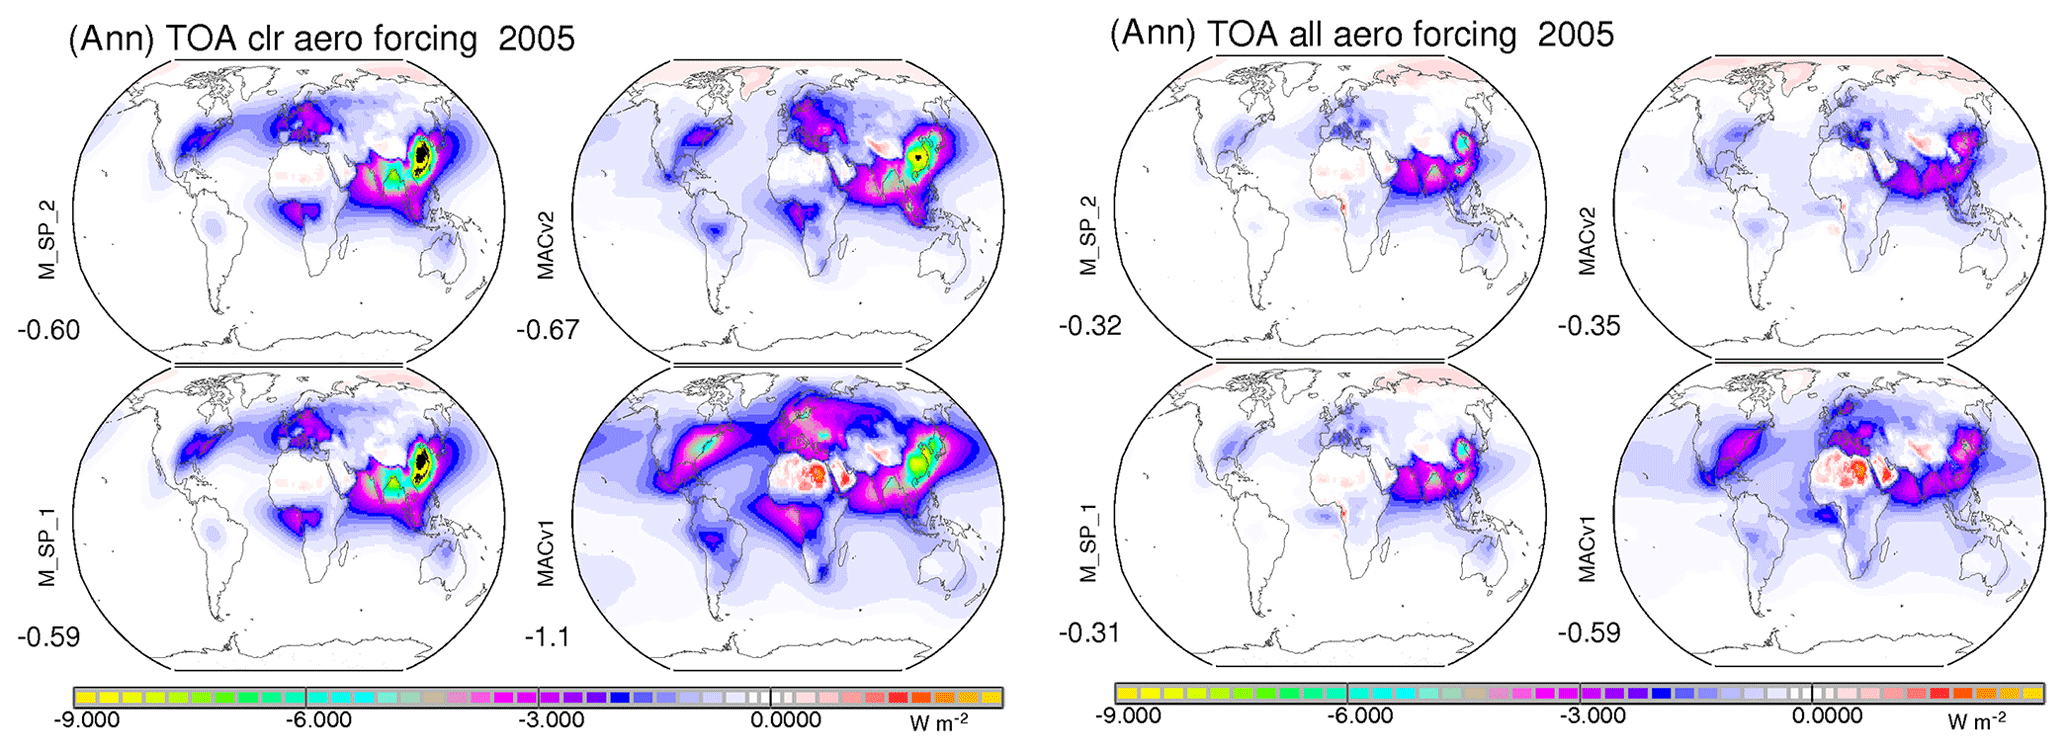
Figure B1Annual maps for present-day aerosol direct radiative forcing in watts per square meter (W m−2) at the TOA for clear-sky conditions (left frame) and for all-sky conditions (right frame) for MACv2-SP with MACv1 natural background (upper left) and with MACv2 natural background (lower left), for MACv2 (upper right) and MACv1 (lower right). Blue colors represent climate cooling and red colors indicate climate warming. Values below the labels indicate global averages.
In the MACv1 climatology, regional contributions for the direct forcing differ from MACv2 mainly due to differences in anthropogenic AOD regional strengths. MACv1 falsely allowed significant anthropogenic aerosols over the Sahara (associated with significant warming over the bright desert) along with too much anthropogenic aerosol over the US and Europe (for extra cooling). In MACv1 also anthropogenic aerosol over southeastern Asia is likely too low (for missing cooling). Globally averaged though, the direct forcing between MACv2 and MACv1 is similar as effects of a larger anthropogenic AOD of 0.040 in MACv1 (compared to 0.031 in MACv2) are compensated for by significant warming over the Sahara.
Annual maps for today's indirect effects at the TOA by anthropogenic aerosol are compared in Fig. B2.
In all approaches, only indirect (Twomey) cooling effects at the TOA are considered and approximated based on the observed satellite relationship between AODf and CDNC as explained in Appendix A. The fit function is applied twice, for natural AODf and for total AODf (anthropogenic plus natural), to extract a CDNC increase factor. In MACv2 and MACv1 required AODf values (natural AODf and total AODf) are defined by the climatology. In MACv2-SP only anthropogenic AODf maps and already precalculated associated CDNC increase factors are provided with simplified assumptions for the natural AODf background (Stevens et al., 2017). In MACv2-SP the anthropogenic AOD has no global coverage so that in regions with no anthropogenic AOD also no indirect aerosol effects are possible. This is the main reason that the globally averaged indirect TOA cooling in MACv2-SP is only ca. 65 % of the indirect TOA cooling by MACv2 (despite a much stronger MACv2-SP indirect response over the Pacific). For MACv1, in contrast, the indirect TOA cooling is ca. 40 % larger than in MACv2. The main reason here is the larger anthropogenic AODf in combination with a reduced natural AODf. Both factors lead to larger CDNC increase factors and stronger indirect TOA cooling when applying the (retrieval-based) fit function.
In Fig. B2 also annual maps for the predicted combined (direct and indirect) TOA cooling by today's anthropogenic AOD are compared. The MACv2 climatology suggests (when globally averaged) a combined present-day climate cooling near −1.0 W m−2, with the larger contribution from indirect effects. The associated uncertainty involves a −0.7 to −1.6 W m−2 range for the present-day aerosol forcing. To lower that range a more certain the preindustrial reference and a better representation of indirect effect are needed.
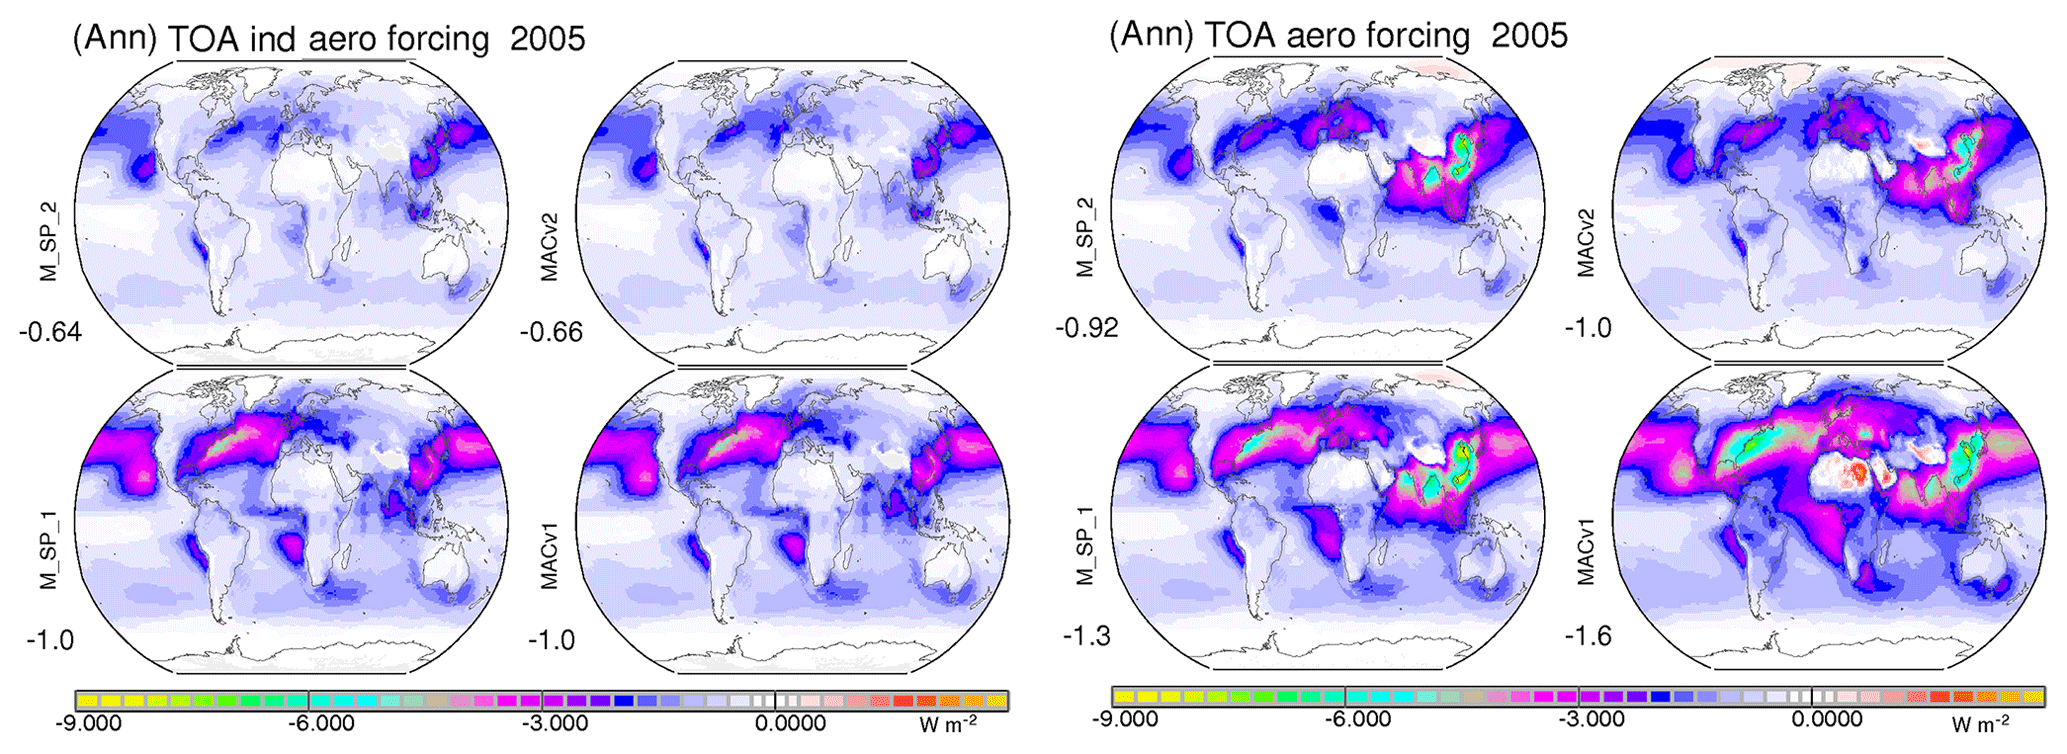
Figure B2Annual maps for present-day aerosol indirect radiative forcing in watts per square meter (W m−2) at the TOA at (left frame) and for the combined direct and indirect radiative forcing (right frame) for MACv2-SP with MACv1 natural background (upper left) and with MACv2 natural background (lower left), for MACv2 (upper right) and MACv1 (lower right). Values below the labels indicate global averages.
The main argument for a more negative bound (−1.6 W m−2) is that the anthropogenic fine-mode fraction could be larger. An alternate anthropogenic scaling based on the AeroCom phase 1 emission increases indirect effects (from −0.65) to −1.1 W m−2 and direct effects (from −0.35) to −0.50 W m−2 for a combined −1.6 W m−2 cooling. However, the alternate larger anthropogenic fine-mode fraction applies a year 1750 reference. Thus, such a negative aerosol forcing is very unlikely for a year 1850 reference.
The main argument for the less negative bound (−0.7 W m−2) is that the lower bound of the direct effect (which is better constrained than the indirect effect) is estimated at −0.2 W m−2 and that the lower bound for the indirect effect is estimated at −0.5 W m−2. For the present-day direct effect a less negative −0.2 W m−2 cooling can be explained with a higher anthropogenic fraction of absorbing BC AOD than applied for the fine-mode AOD. For the present-day indirect effect there is a lot of uncertainty. If only the first indirect effect is considered at least a cooling of −0.5 W m−2 should be expected (in that context it should be noted that the less negative indirect effect MACv2-SP does not qualify as lower bound due to its incomplete global coverage for anthropogenic AOD).
Monthly maps illustrate typical variations over the year for present-day aerosol radiative effects at the top of the atmosphere (TOA) for total aerosol in Fig. C1 and anthropogenic aerosol in Fig. C2.
Figure C1 presents for total aerosol the MACv2 associated radiative TOA effects. Monthly maps are presented for clear-sky (cloud-free) and all-sky conditions. Note that the effects in Fig. C1 include infrared greenhouse effects by elevated coarse-mode dust. For total aerosol, the global average effect is a climate cooling, despite intense climate warming over the Sahara, especially from April to September. The presented aerosol effects for all-sky conditions do not include anthropogenic indirect effects which would increase the TOA cooling by an additional −0.65 W m−2.
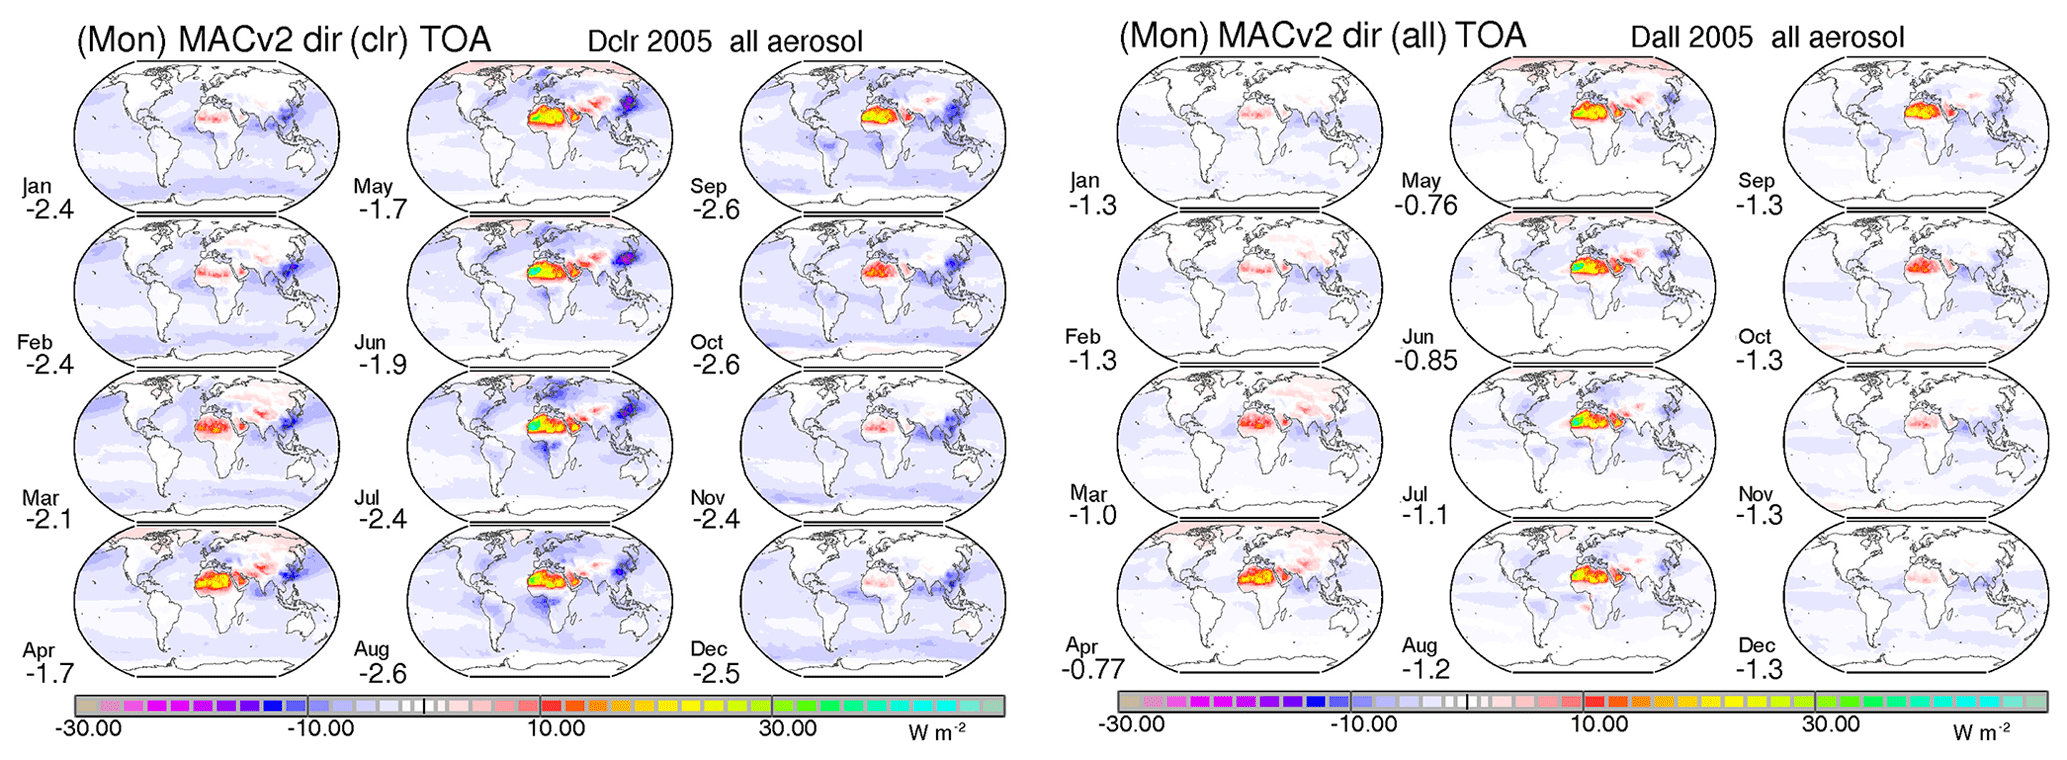
Figure C1Monthly maps for the direct radiative forcing at the TOA by present-day total aerosol under clear-sky conditions (left frame) and all-sky conditions (right frame). Blue colors indicate climate cooling and red colors indicate climate warming. The infrared greenhouse effects by elevated coarse-mode mineral dust aerosol are included. Values below the labels indicate global averages.
Figure C2 presents for anthropogenic aerosol the MACv2 associated radiative TOA effects.
Monthly maps are presented for the direct effect at cloud-free condition (Dclr) and all-sky conditions (direct forcing, Dall) for a (Twomey-based) indirect forcing (IND) and for the combined (direct and indirect) forcing (TOT). In Fig. C2 monthly maps were given the same scale for easier comparisons. They illustrate that for present-day aerosol forcing indirect contributions (IND) dominate over direct contributions (Dall) and that contributions are largest for the NH summer season, with indirect effects globally slightly larger from May to August and direct effects globally largest from July to September.
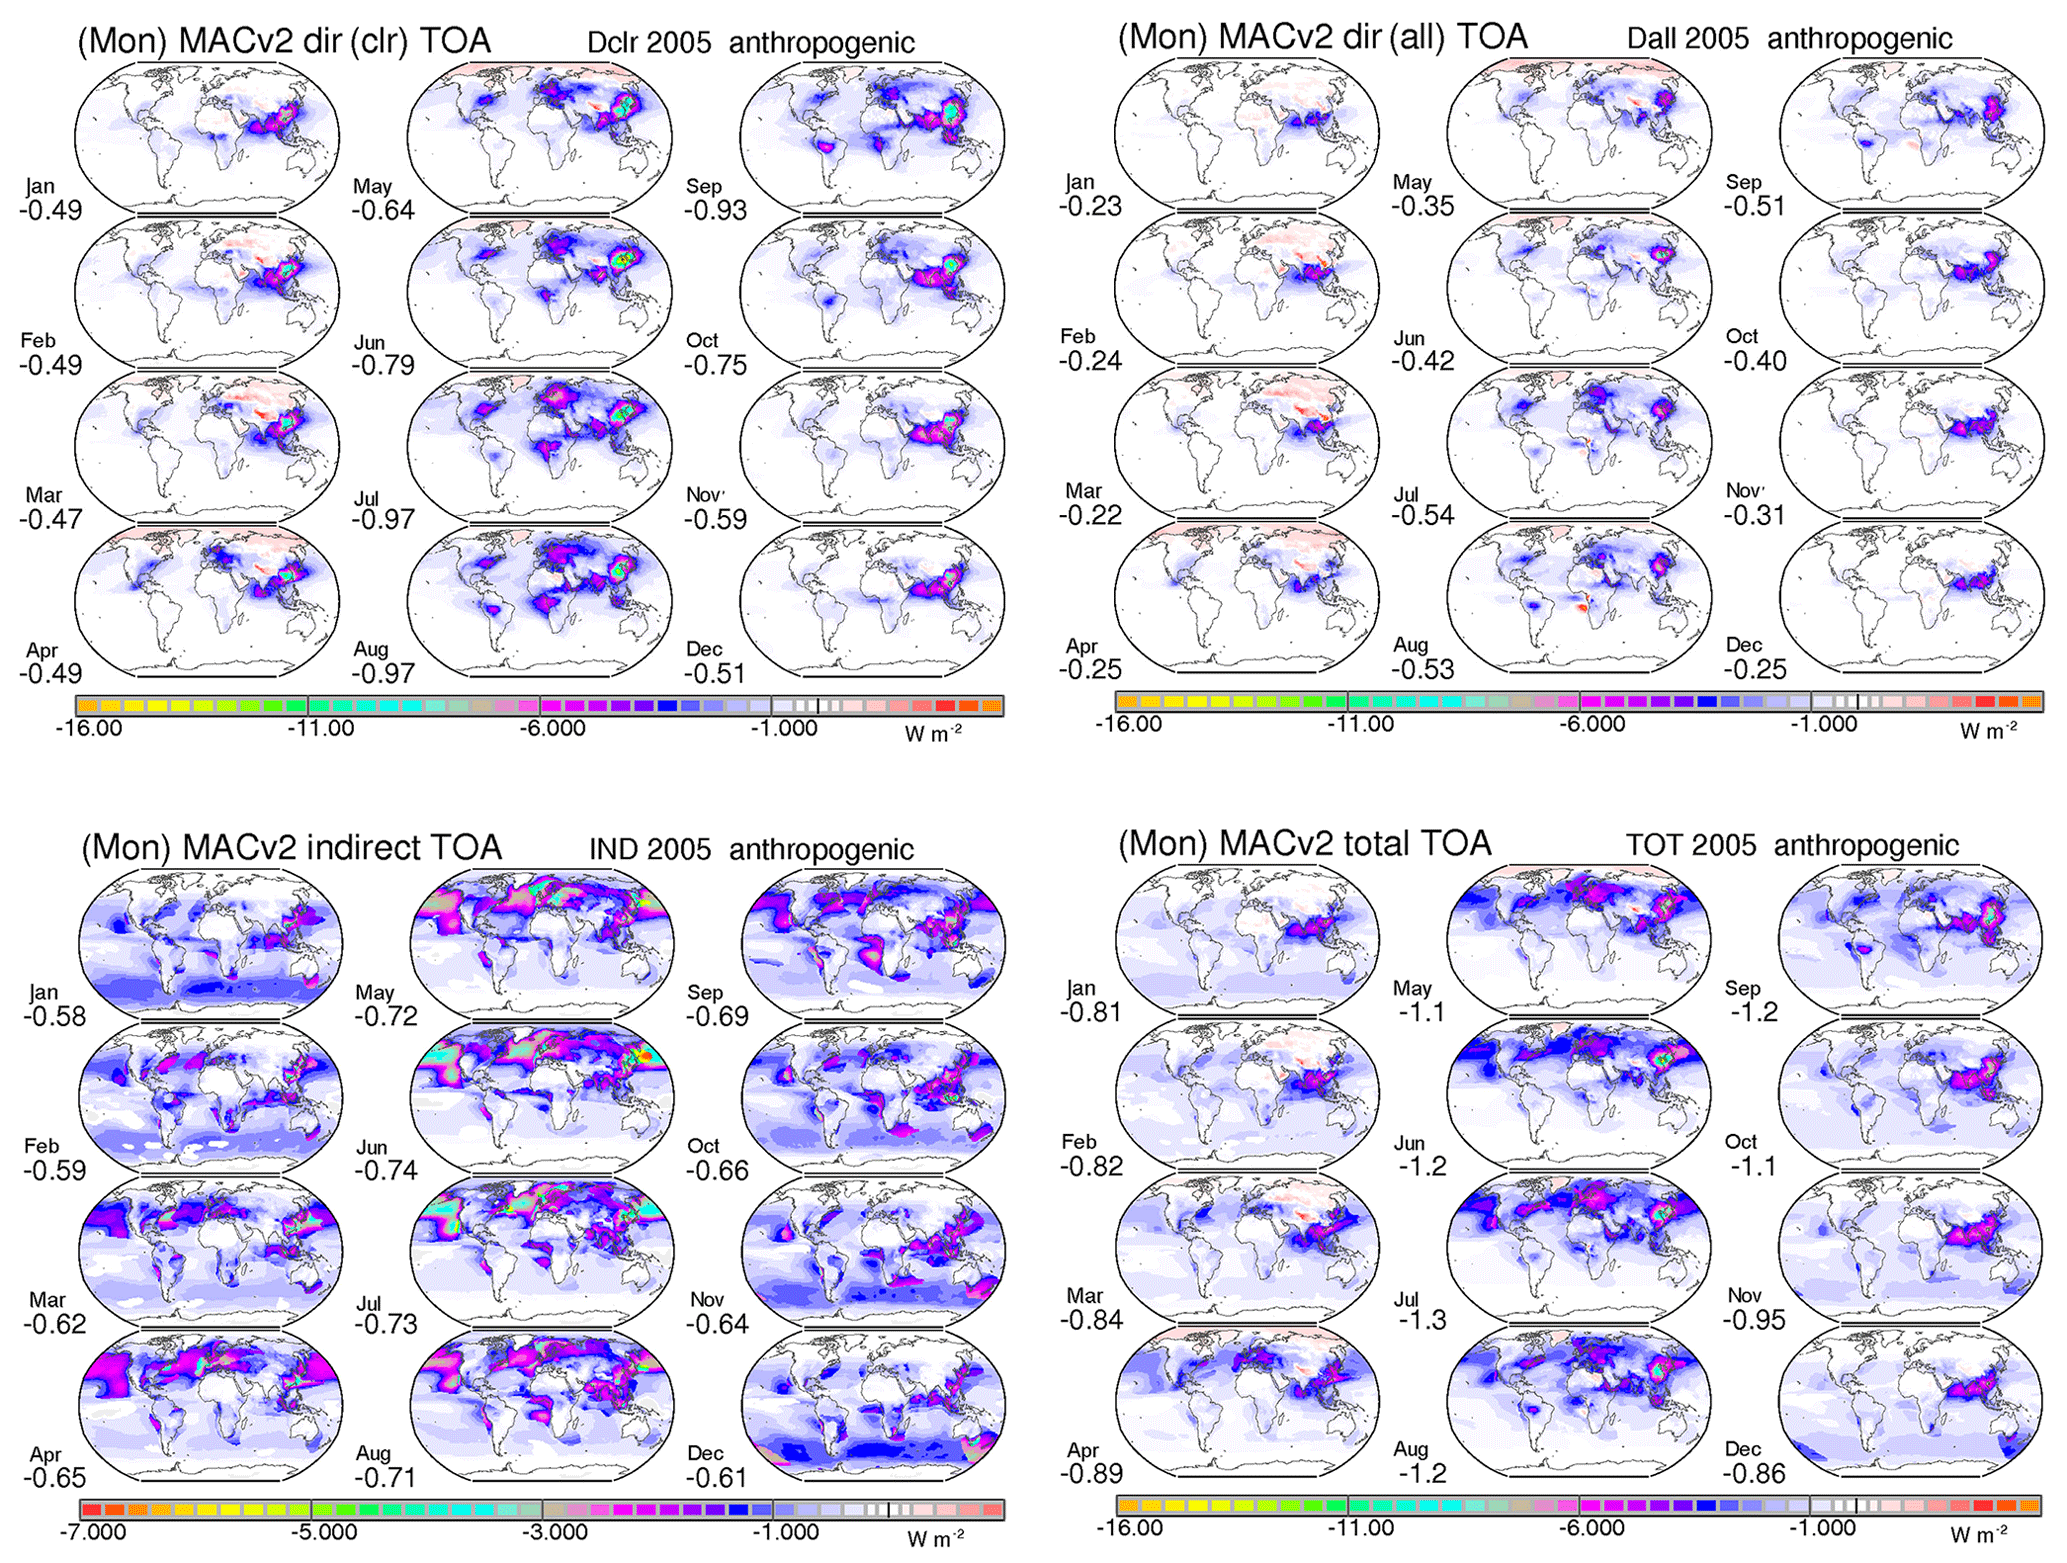
Figure C2monthly maps for radiative effects by present-day anthropogenic aerosol. Compared are direct radiative forcing by today's anthropogenic aerosol under clear-sky conditions (top left frame), direct radiative effects under all-sky conditions (top right frame), indirect effect (bottom left frame) and the combined (direct and indirect) effect (bottom right frame). Blue colors indicate climate cooling and red colors indicate climate warming. Scales of all four blocks are identical to better compare contributions and seasonal dependencies. Values below the labels indicate global averages.
In terms of the aerosol radiative forcing some applications prefer to separate between clear-sky and cloudy-sky contributions. A requirement for such a separation is the cloud-free fraction of Fig. C3. Figure C3 also presents the clear-sky present-day contributions to the (direct) all-sky or to the combined (direct + indirect) forcing with MACv2. The corresponding cloudy-sky contributions to the present-day (direct) all-sky and to the combined (direct + indirect) forcing are presented in Fig. C4.
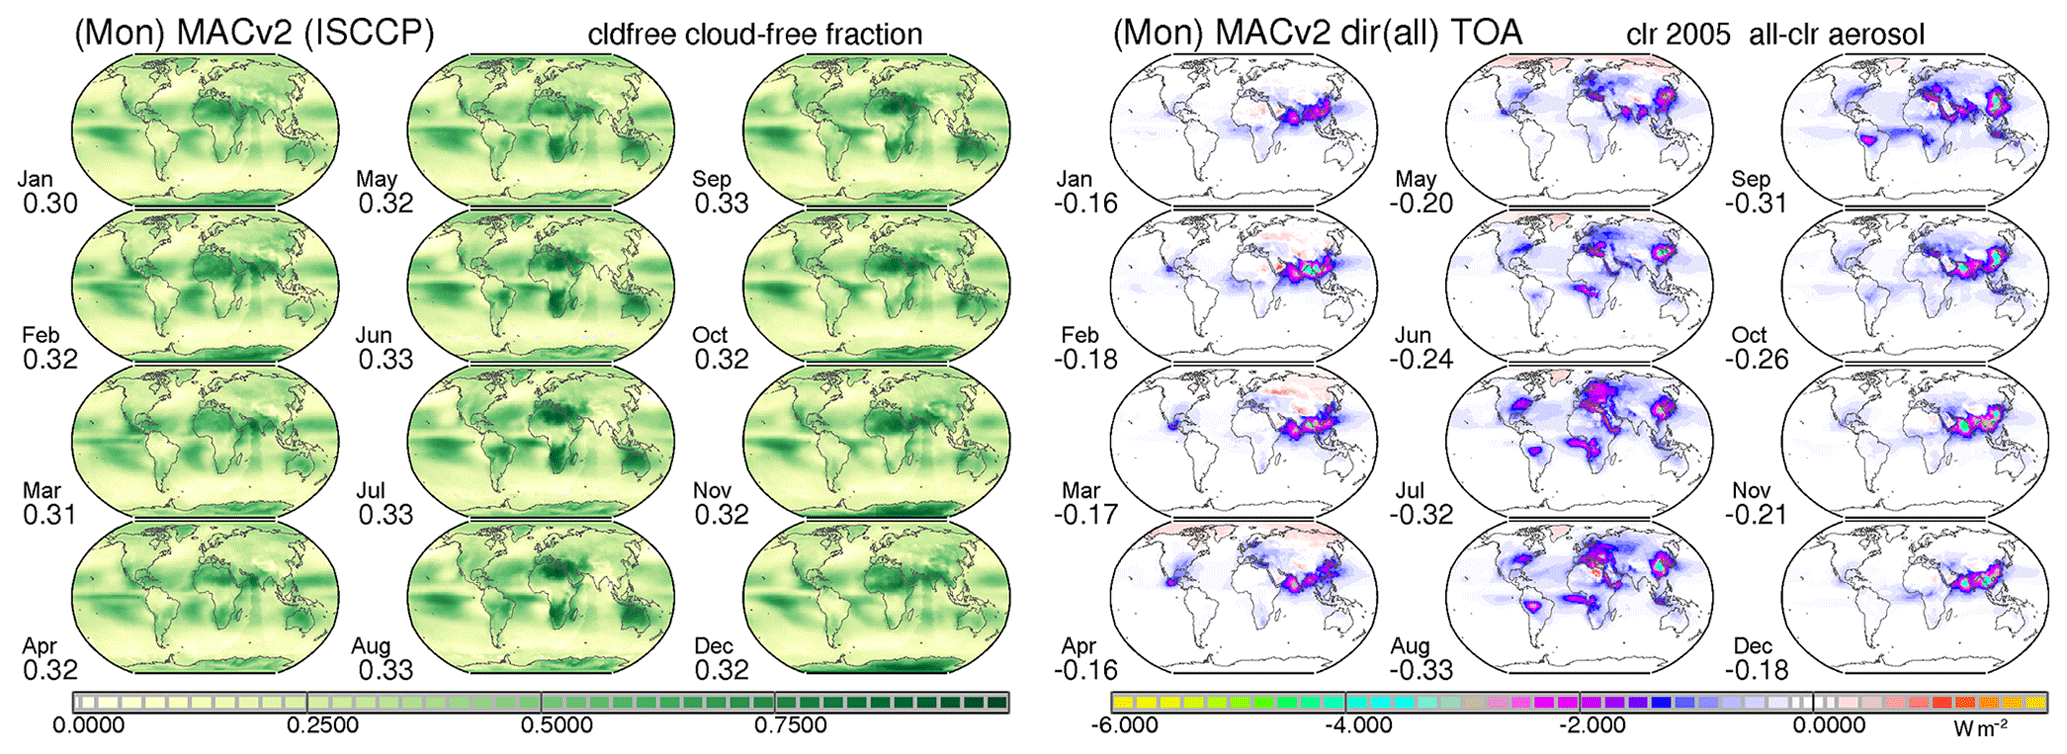
Figure C3Monthly maps for the clear-sky fraction (left frame) and monthly maps for the present-day clear-sky radiative TOA radiative forcing that contributes to the all-sky forcing.
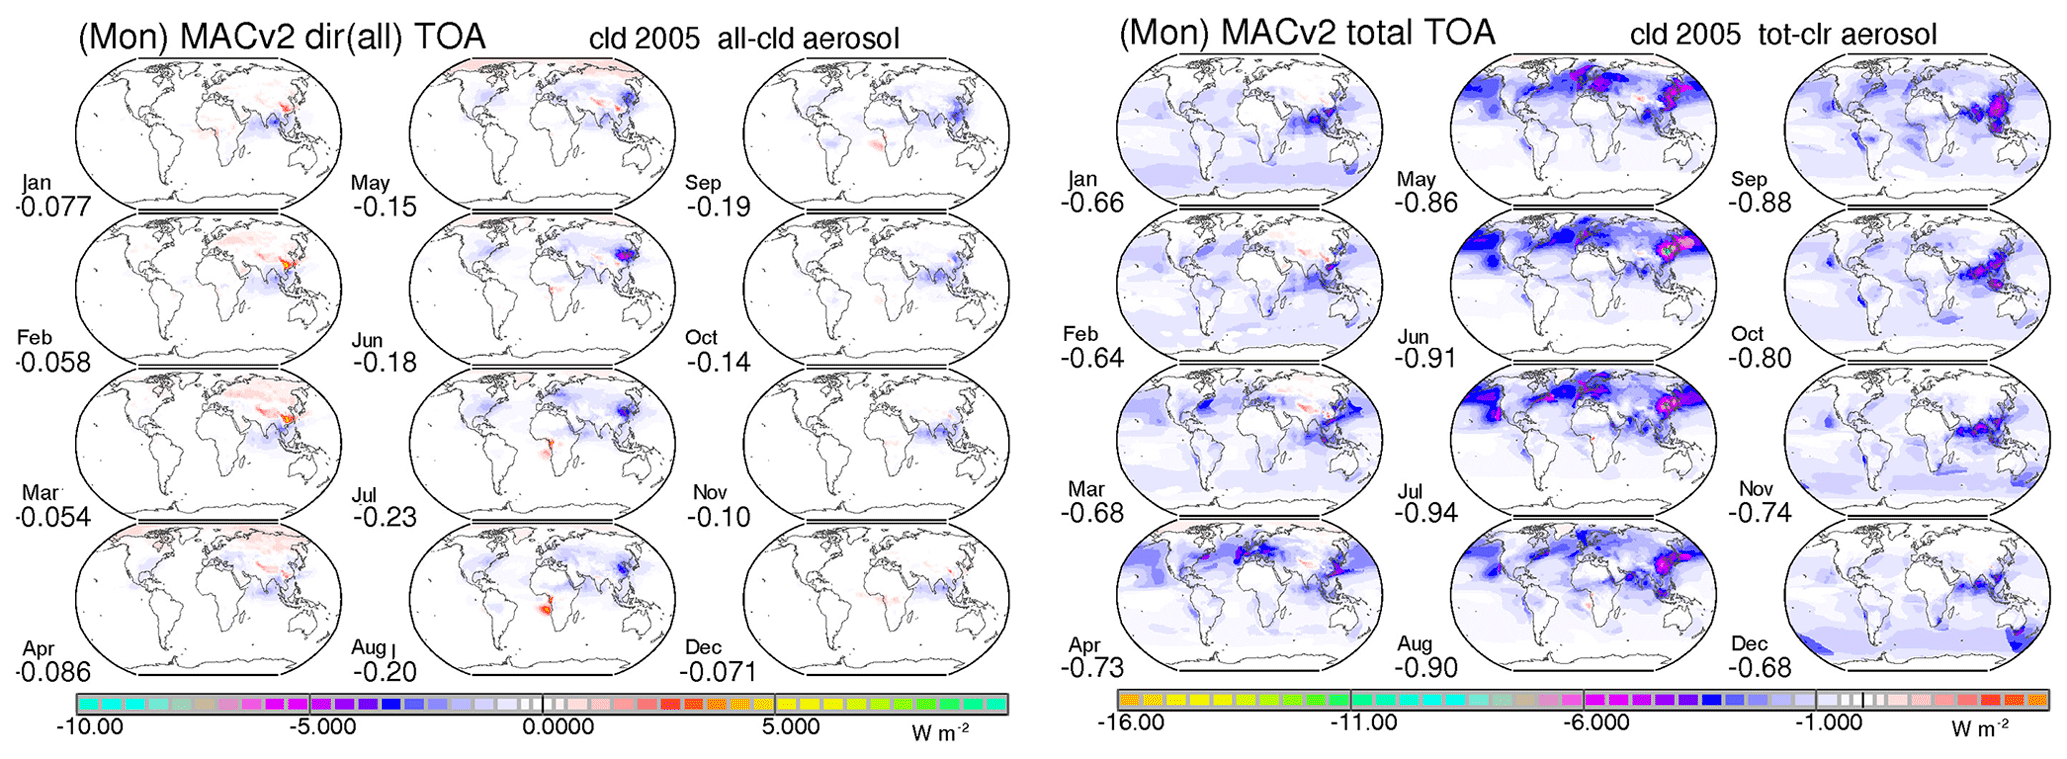
Figure C4Monthly maps for the present-day cloudy-sky TOA radiative forcing that contributes to the all-sky forcing (left frame) and to the combined (direct and indirect) forcing.
The radiative forcing in cloudy regions (both with and without the first indirect effect) is much larger during the boreal summer season compared to the boreal winter. The absolute global average seasonal range is similar for the direct and for the indirect effect, with more sunshine, less low-altitude cloud decks and more anthropogenic aerosol loads during higher-latitude summer seasons.
Monthly maps for present-day TOA forcing efficiencies (per unit AOD) for clear-sky and all-sky conditions are shown for total aerosol in Fig. D1 and for anthropogenic aerosol in Fig. D2.

Figure D1Monthly maps for the direct radiative forcing efficiency (per unit AOD) at the TOA by present-day total aerosol for clear-sky (left frame) and all-sky conditions (right frame). Blue colors indicate climate cooling potential and red colors warming potential. Values below the labels indicate global averages.
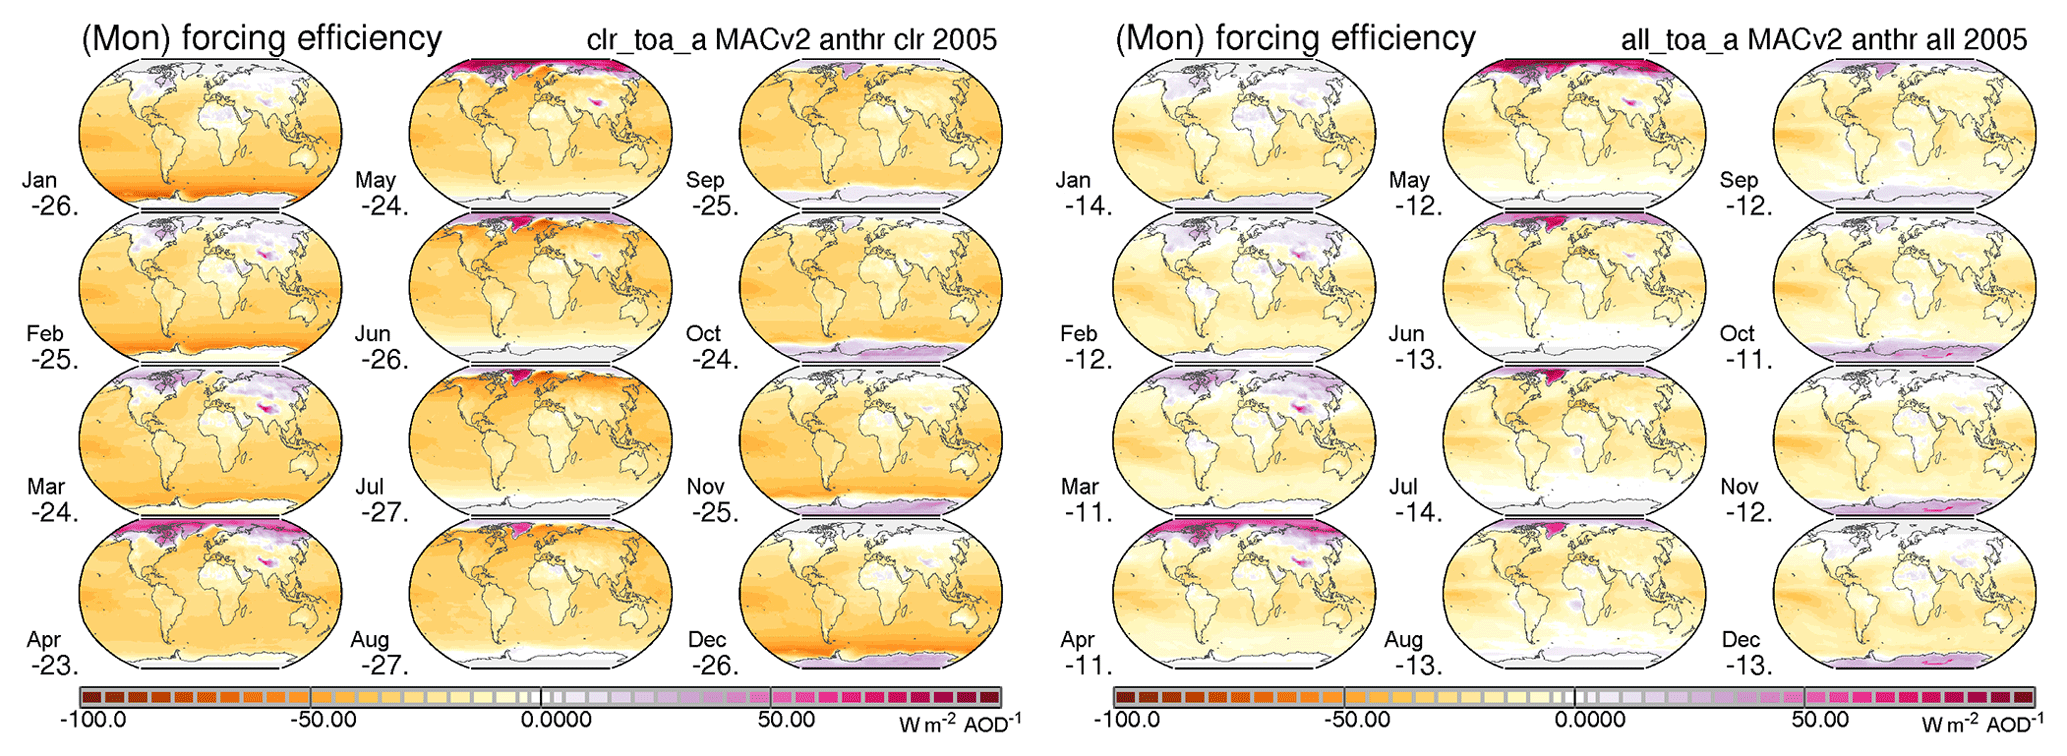
Figure D2Monthly maps for the direct radiative forcing efficiency (per unit AOD) at the TOA by present-day anthropogenic aerosol for clear-sky (left frame) and all-sky conditions (right frame). Blue colors indicate climate cooling potential and red colors warming potential. Values indicate global averages.
The global average forcing efficiencies (per unit AOD) for total and anthropogenic aerosol are similar and not only in their global averages (near −22 W m−2 for clear-sky conditions and near −11 W m−2 for all-sky conditions) but also in their spatial patterns, which are relatively stable over the year. Noteworthy is the switch in sign over Asia to positive values during the winter and spring due to snow cover and only for total aerosol the strong positive values over northern Africa.
With the attribution of optical and microphysical properties to (via size and refractive index) predefined aerosol types, type (or component) contributions are assigned such that their mixture is consistent with (local monthly data for) size-mode associated MACv2 midvisible aerosol properties for AOD and AAOD. The resulting MACv2 component AOD distributions are presented in Fig. E1.

Figure E1Annual average AOD maps for present-day tropospheric aerosol for total aerosol (top left) and contributions by fine-mode sizes (top center) and coarse-mode sizes (top right). In addition, consistent with midvisible absorption data, component AOD values were assigned for each size mode. Fine-mode AOD is divided into contributions by BC (soot, here multiplied by 10), OC (organic matter) and SU (where SU represents nonabsorbing fine-mode aerosols). The coarse-mode AOD is split into contributions by sea salt and dust. In addition, annual AOD maps are presented for total carbon (OC+BC), for present-day anthropogenic dust (aDU, here multiplied by 10) and estimates for present-day anthropogenic (fine-mode) AOD: ant AC2 of MACv2 and ant AC1 of MACv1. Lower-left values indicate global averages.
The considered components for the fine mode are sulfate (SU – representing the fine-mode nonabsorbing type), organic matter (OC) and soot (BC) and for the coarse-mode sea salt (SS) and mineral dust (DU). Hereby, the size for SU and DU is allowed to vary, to satisfy MACv2 prescribed data for the fine-mode effective radius and the coarse-mode absorption, respectively (Kinne, 2019). Also presented are two present-day estimates for (fine-mode) anthropogenic AOD based on fine-mode fraction scaling with processed emissions in global models [=(AODf,pd − AODf,pi)∕AODf,pd)]. One estimate (antAC1) applies a fine-mode AOD fraction map based on AeroCom phase 1 emission data (Dentener et al., 2006), which is tied to a year 1750 reference and applied in MACv1 (Kinne et al., 2013). The other estimate (antAC2) applies a fine-mode AOD fraction map based on CMIP5 (AeroCom phase 2) emission data (Lamarque et al., 2010), which is tied to a year 1850 reference and applied in MACv2 (Kinne, 2019). In addition, an estimate for present-day anthropogenic (coarse-mode) dust (aDU) is presented by applying a present-day anthropogenic dust AOD fraction map based on a satellite data analysis (Ginoux et al., 2012) to the dust AOD of MACv2. This AOD for anthropogenic dust (multiplied by 10 in Fig. E1) is an average almost an order of magnitude smaller than estimates for the fine-mode anthropogenic AOD. And since, in addition, solar and infrared contributions to the radiative forcing by dust largely cancel, coarse-mode anthropogenic contributions were ignored for MACv2. Still, even with anthropogenic dust, the present-day fine-mode anthropogenic AOD (0.03 to 0.04) is highly uncertain due to differences in choices for reference strength, including the reference year.
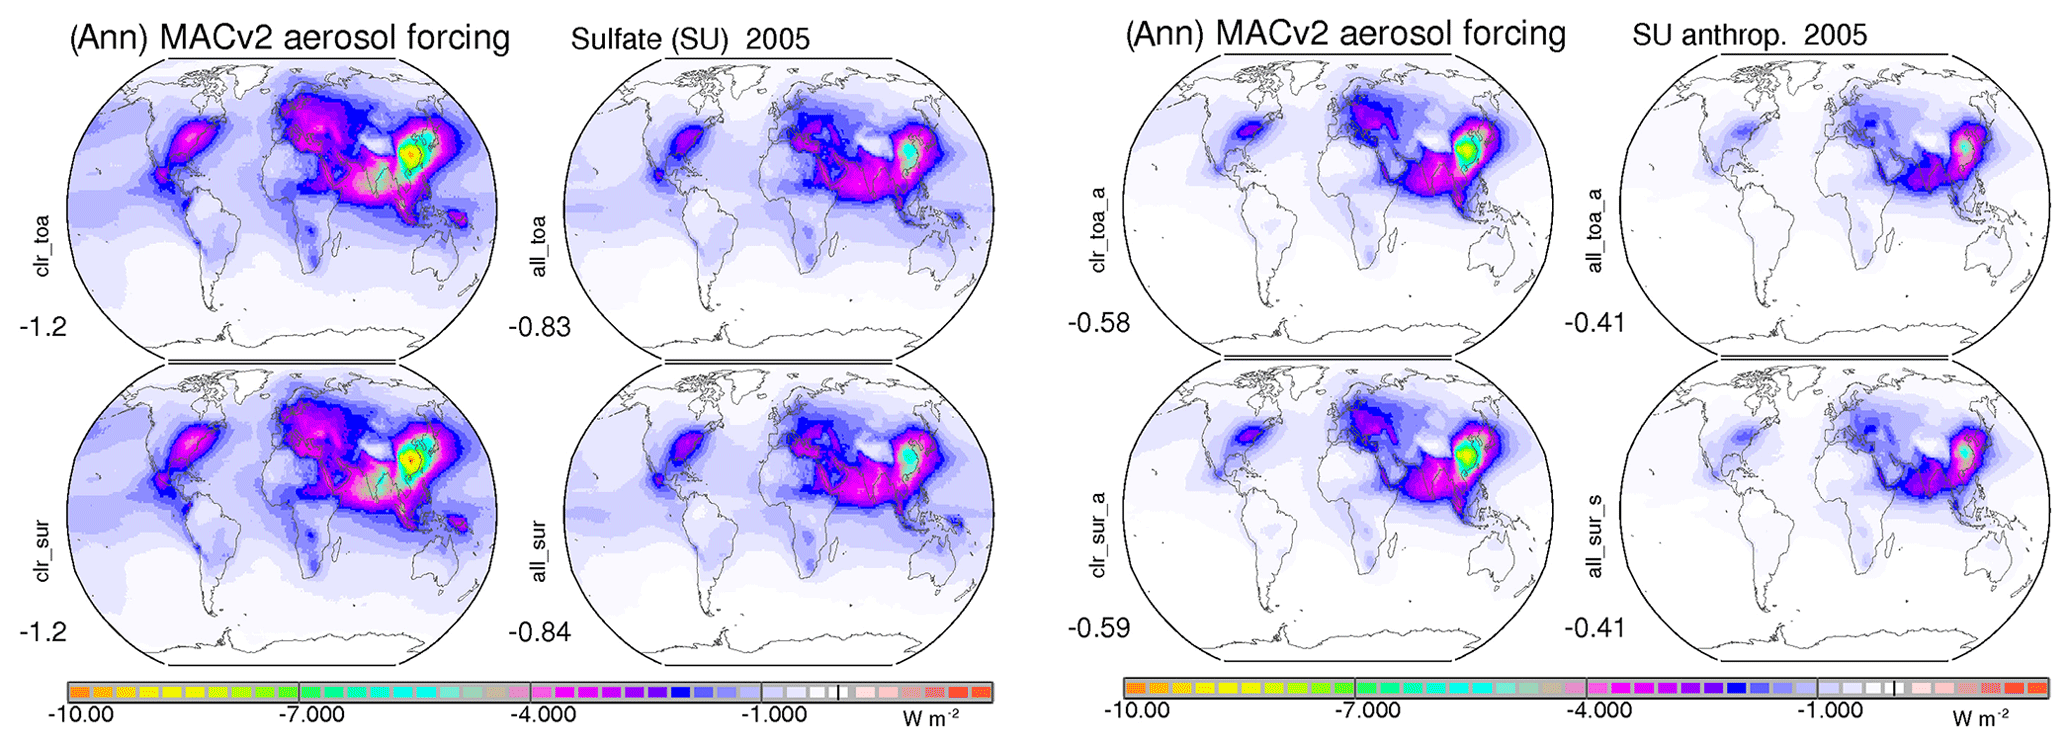
Figure E2Annual maps for present-day radiative effects of total (left frame) and anthropogenic (right frame) for scattering fine-mode aerosol (SU). Each block displays impacts for clear-sky (left column) and all-sky conditions (right column) at both TOA (top row) and surface (bottom row). Blue to purple, green, yellow and red colors indicate an increasing cooling. Values below the labels are global averages.
E1 SU (nonabsorbing fine mode)
Annual maps by present-day total and anthropogenic nonabsorbing fine-mode aerosol (SU – to cover impacts mainly from sulfate and nitrate but also from small-size sea salt) are shown in Fig. E2. Anthropogenic SU direct forcing (−0.41 W m−2) is unevenly distributed and stronger near sources. Local radiative effects at the TOA and surface are basically identical, due to a lack of relevant solar absorption.
E2 OC (organic matter)
Annual maps by present-day total and anthropogenic organic matter are presented in Fig. E3. Anthropogenic OC direct forcing (−0.22 W m−2) is unevenly distributed and relatively strong near sources of pollution and wildfire regions. Due to assumed solar absorption in the visible and especially towards and in the UV, the cooling at the surface is larger than the cooling at the TOA.

Figure E3Annual average maps for present-day radiative effects of total (left frame) and anthropogenic (right frame) organic matter (OC). Each block displays impacts for clear-sky (left column) and all-sky conditions (right column) at both TOA (top row) and surface (bottom row). Blue to purple, green and yellow indicate an increasing cooling. Values below the labels are global averages.
E3 BC (soot)
Annual maps for TOA warming and surface cooling by present-day total and anthropogenic soot (BC) are shown in Fig. E4. Anthropogenic BC direct radiative effects are larger over wildfire and pollution regions. TOA warming with clouds (all sky) is larger, as BC dims the reflection of lower clouds.
The seasonality of the TOA all-sky BC forcing and the BC radiative effects for an alternate larger BC anthropogenic fraction (raised from 50 % to 75 % of the total BC) are presented in Fig. E5.

Figure E4Annual maps for present-day radiative effects of total (left frame) and anthropogenic (right frame) for soot (or BC). Each block displays impacts for clear-sky (left column) and all-sky conditions (right column) at both TOA (top row) and surface (bottom row). Blue colors indicate a cooling (at the surface) and red colors a warming (at the TOA). Values below the labels are global averages.
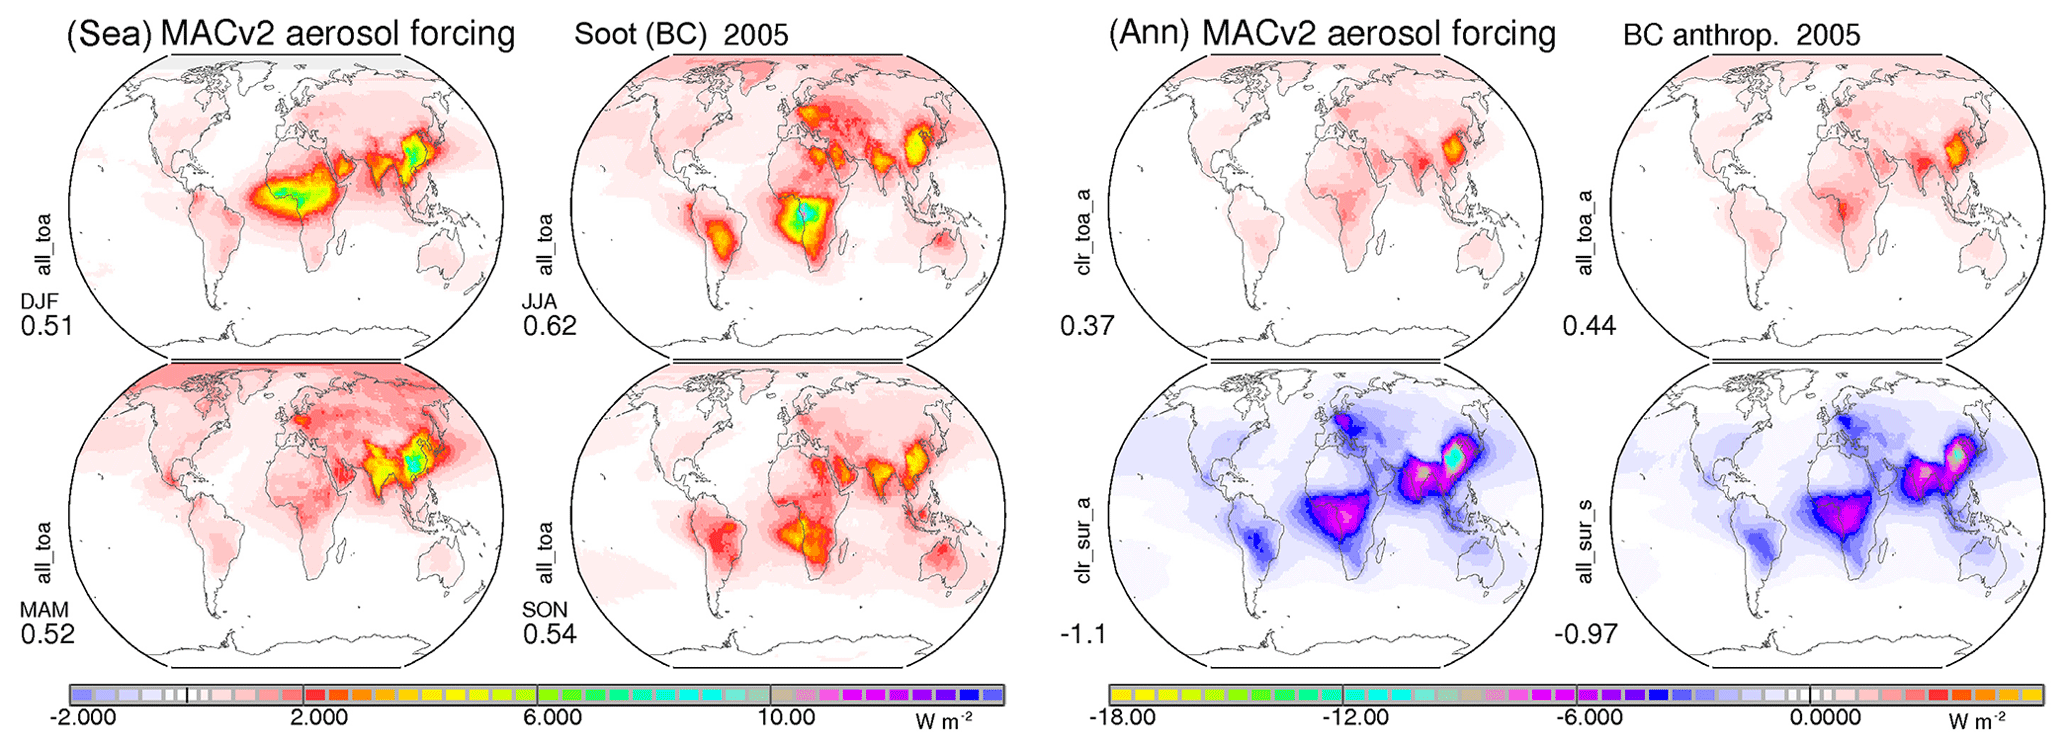
Figure E5Seasonal maps for present-day total BC radiative TOA all-sky effects (left frame) and annual maps for radiative effects at TOA and surface by enhanced anthropogenic BC contributions (right frame, now with a higher BC anthropogenic fraction of 75 % compared to the 50 % BC anthropogenic fraction of Fig. E4). Values below the labels are global averages.
Many regional aerosol absorption maxima have a strong seasonal flavor often associated with wildfire seasons (e.g., DJF over western Africa, and JJA and SON over central Africa and South America) and pollution (e.g., MAM over southern Asia and eastern Asia prior to the monsoon season). The applied larger anthropogenic BC fraction raised the TOA forcing by BC from +0.28 to +0.44 W m−2.
E4 CA ()
Annual maps for present-day direct radiative effects by total and anthropogenic carbon are shown in Fig. E6. The anthropogenic carbon TOA response (+0.05 W m−2) is almost climate neutral.
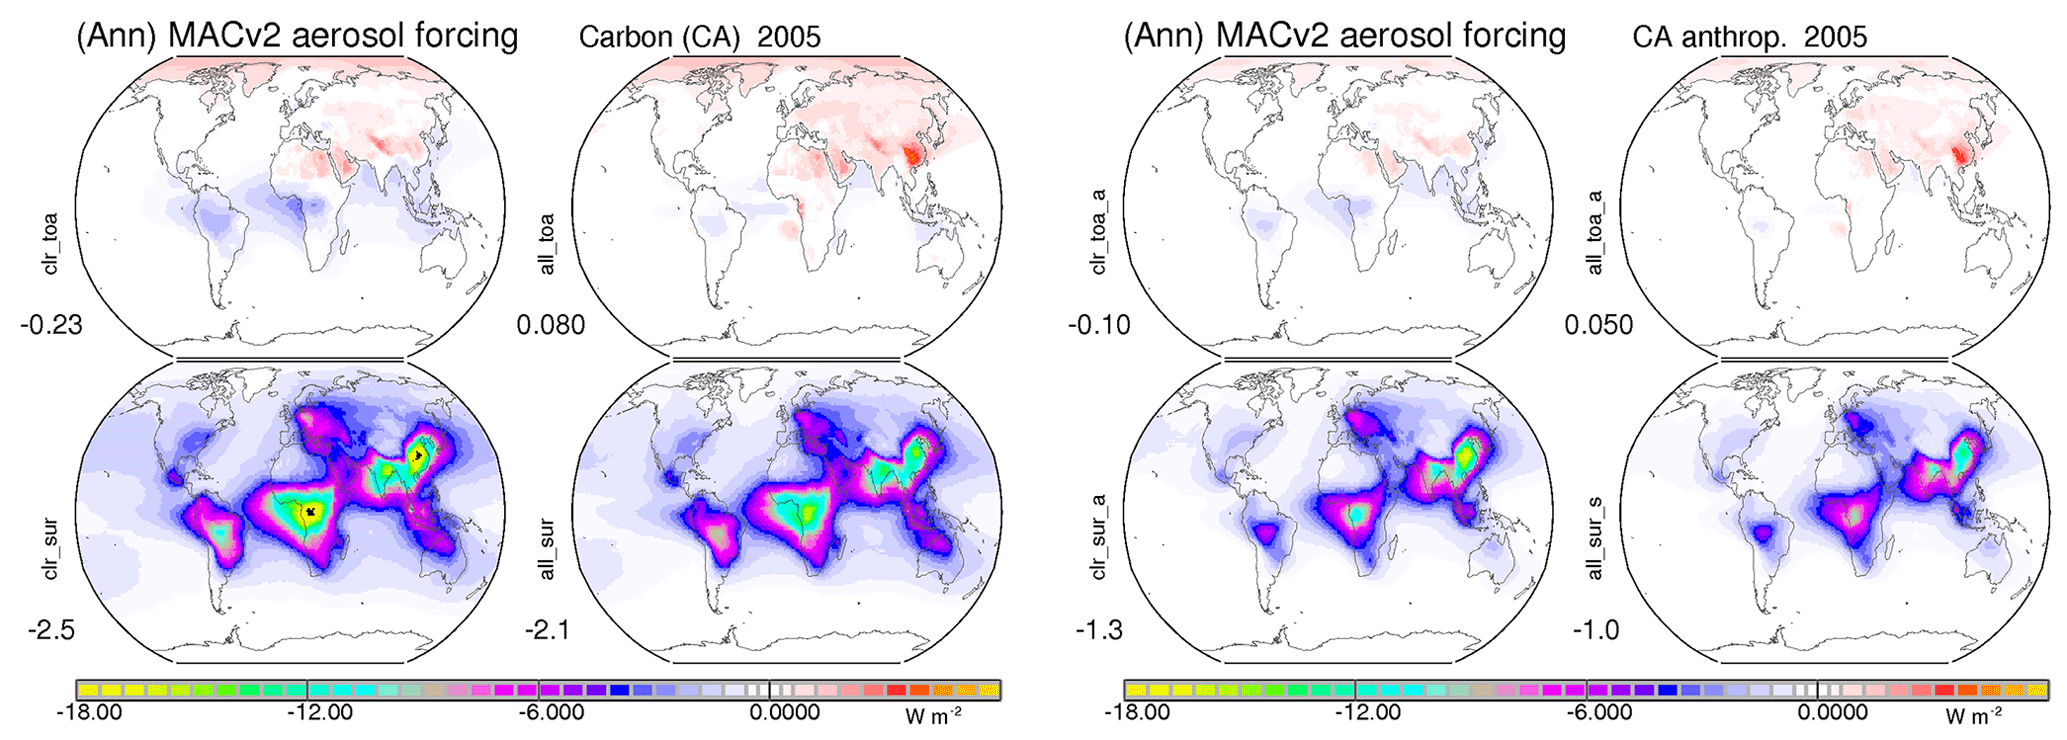
Figure E6Annual maps for present-day radiative effects of total (left frame) and anthropogenic (right frame) soot (or carbon (BC+OC). Each block displays impacts for clear-sky (left column) and all-sky conditions (right column) at both TOA (top row) and surface (bottom row). Blue colors indicate a cooling (at the surface) and red colors a warming (at the TOA). Values below the labels are global averages.
E5 SS (sea salt) and DU (dust)
Annual maps for direct radiative effects by coarse-mode (natural) components of sea salt and mineral dust are compared in Fig. E7. For sea salt cooling, maxima at the TOA and surface are sharply reduced with the presence of clouds. Thus the direct forcing associated with sea salt is relatively small. Mineral dust displays a strong TOA warming over the Sahara. Even at the surface a net-flux increase is indicated. Both effects are associated with relatively large mineral dust AOD and dust particle sizes.
Mineral dust effects are better understood by looking at solar and infrared contributions in Fig. E8.
The mineral dust radiative effects are created by partially offsetting solar cooling and the infrared warming effect. Solar warming is only created by larger dust sizes over bright (Sahara) surfaces.
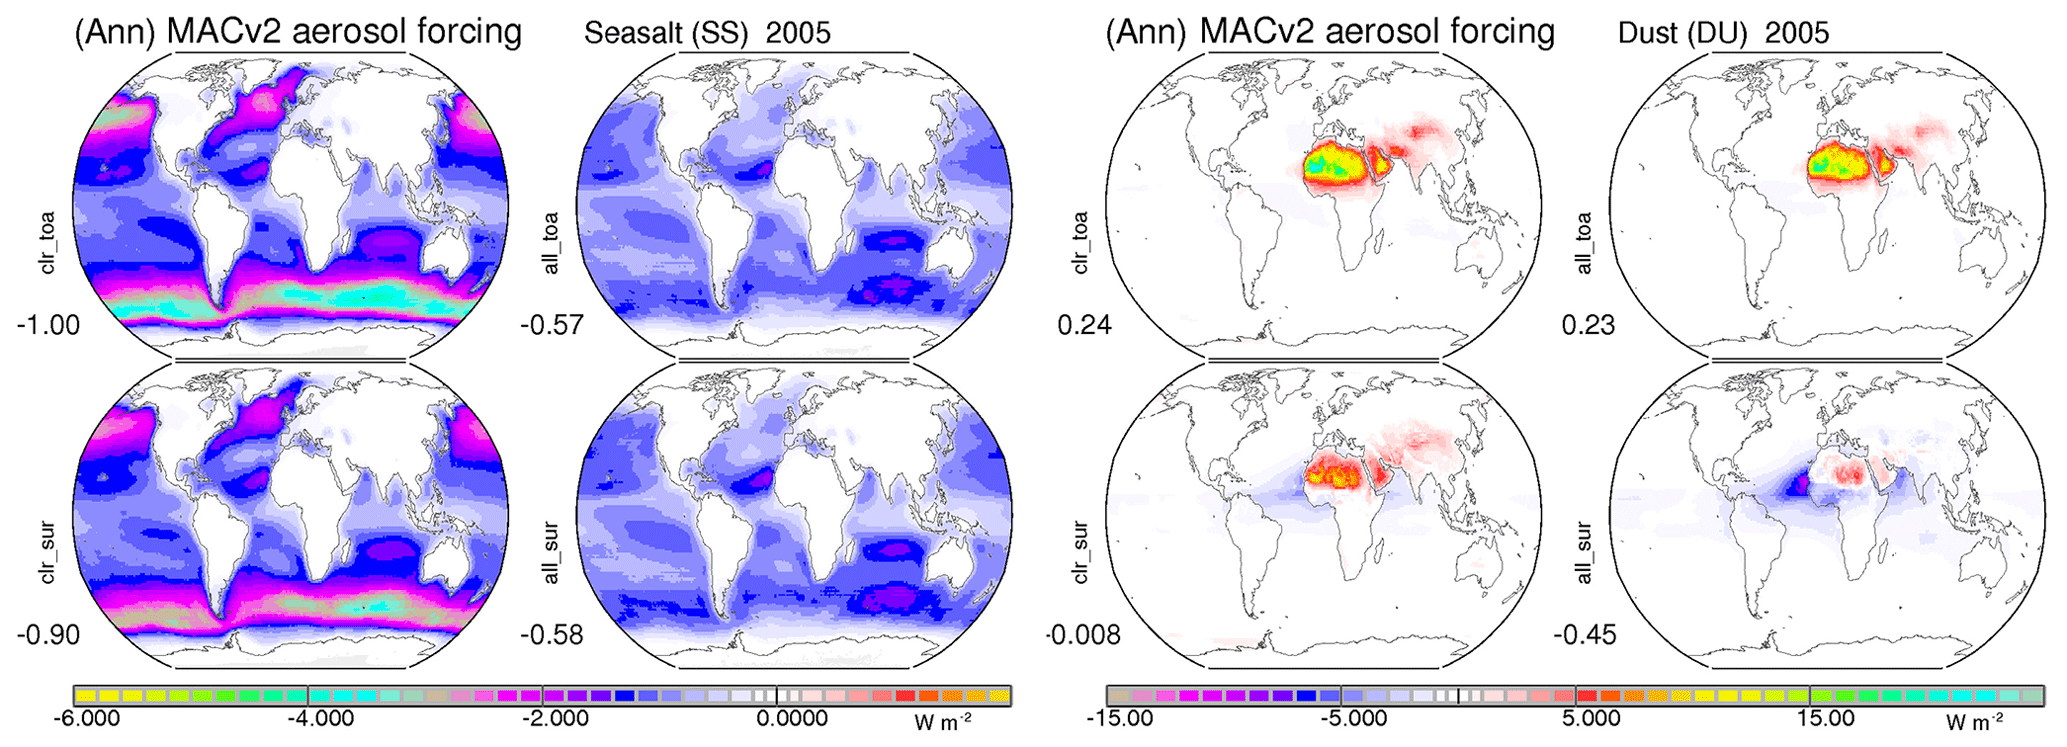
Figure E7Annual maps for present-day TOA radiative effects of coarse-mode sea salt (SS, left frame) and coarse-mode mineral dust (DU, right block) for clear-sky (left column) and all-sky conditions (right column) both at the TOA (top row) and surface (bottom row). Blue to purple colors indicate a cooling and red to yellow and green colors show a warming. Values below the labels are global averages. Note that the color scale for sea salt is 10 times smaller than the color scale for dust.
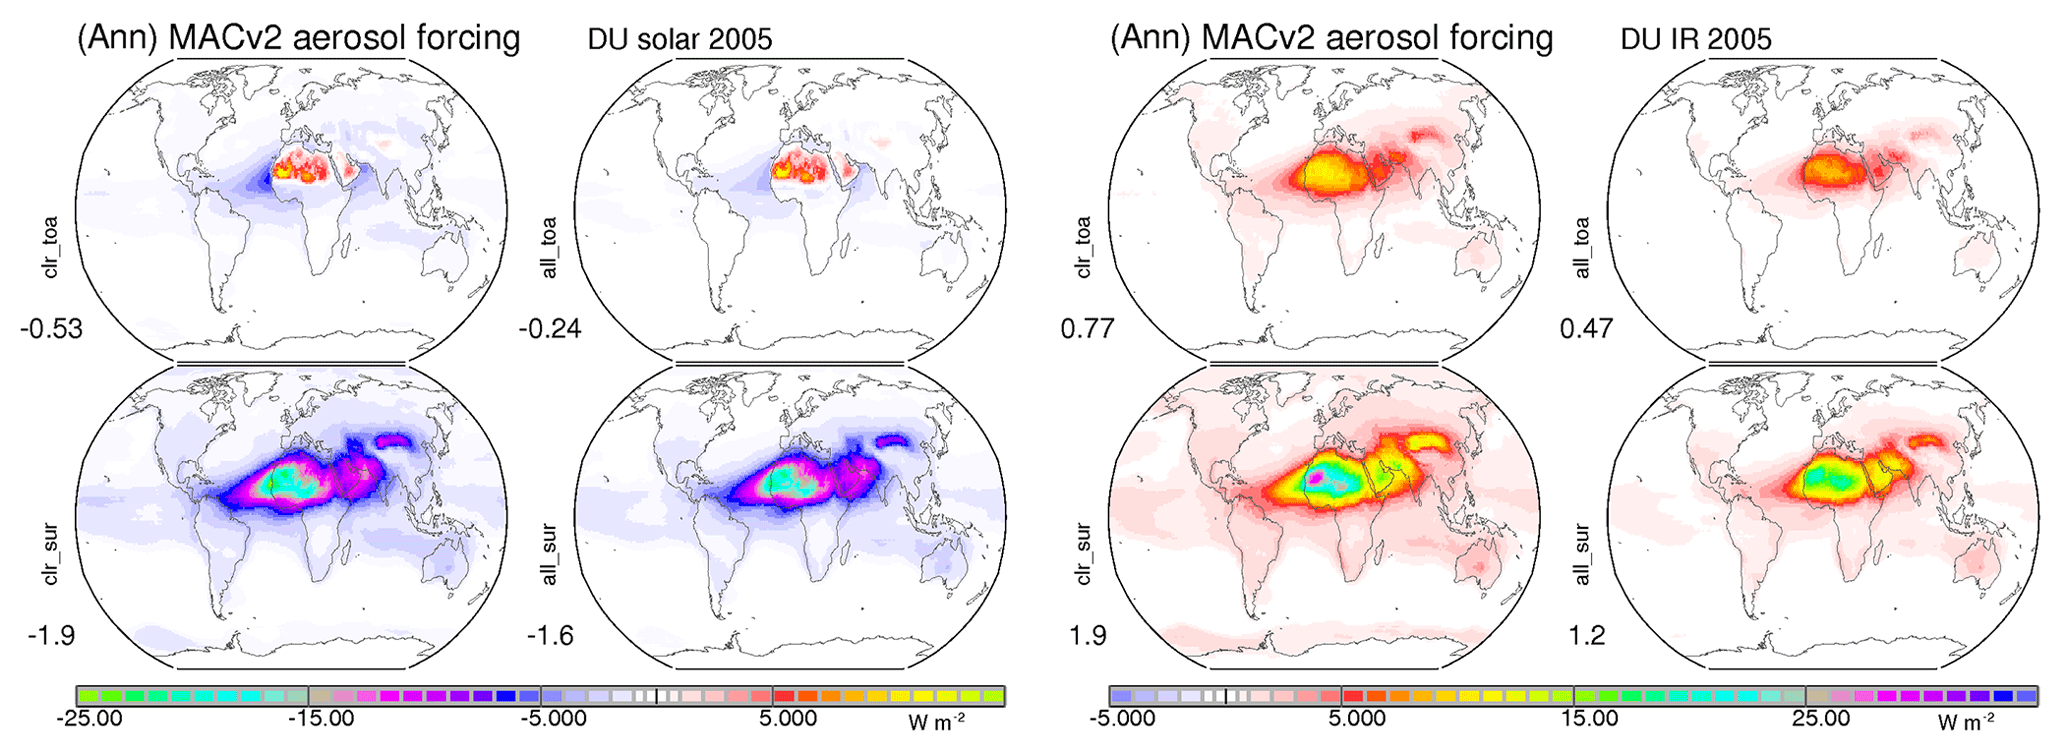
Figure E8Annual average maps for present-day radiative effects of coarse-mode mineral dust (DU) in the solar spectral (left frame) and the infrared spectral region (right block). Aerosol impacts are shown for clear-sky (left column) and all-sky conditions (right column) for both TOA (top row) and surface (bottom row). Blue colors indicate a cooling and red colors a warming. Values below the labels are global averages.
For the climatically relevant TOA response at the top of the atmosphere the present-day global average is a −0.24 W m−2 cooling, despite the regional solar warming over the Sahara (as stronger-absorbing larger mineral dust sizes dim the bright desert solar albedo). The infrared greenhouse effect at +0.47 W m−2 is much larger, so the global average response for mineral dust is a +0.23 W m−2 warming. The greenhouse effect looses (on average) its dominance for anthropogenic dust, as anthropogenic aerosol involves more moderate sizes. In addition, anthropogenic aerosol loads are closer to the surface. Thus extra anthropogenic dust on average behaves almost climate neutral.
Aerosol indirect radiative effects show spatial distribution patterns, which may be surprising as the strongest impacts (e.g., mainly the increase in planetary albedo) are usually not at locations where anthropogenic AOD values are largest. The aerosol indirect effects or forcing is strongly influenced by environmental properties. A lower surface albedo, a high percentage of low-altitude cloud cover without higher-altitude clouds, a moderate optical depth for highest susceptibility and the available sun hours during a day all favor a stronger indirect response. Based on these factors as summarized in Table F1 monthly indirect forcing potential maps are presented in Fig. F1 along with monthly maps for MACv2 indirect forcing efficiency per unit anthropogenic AOD.
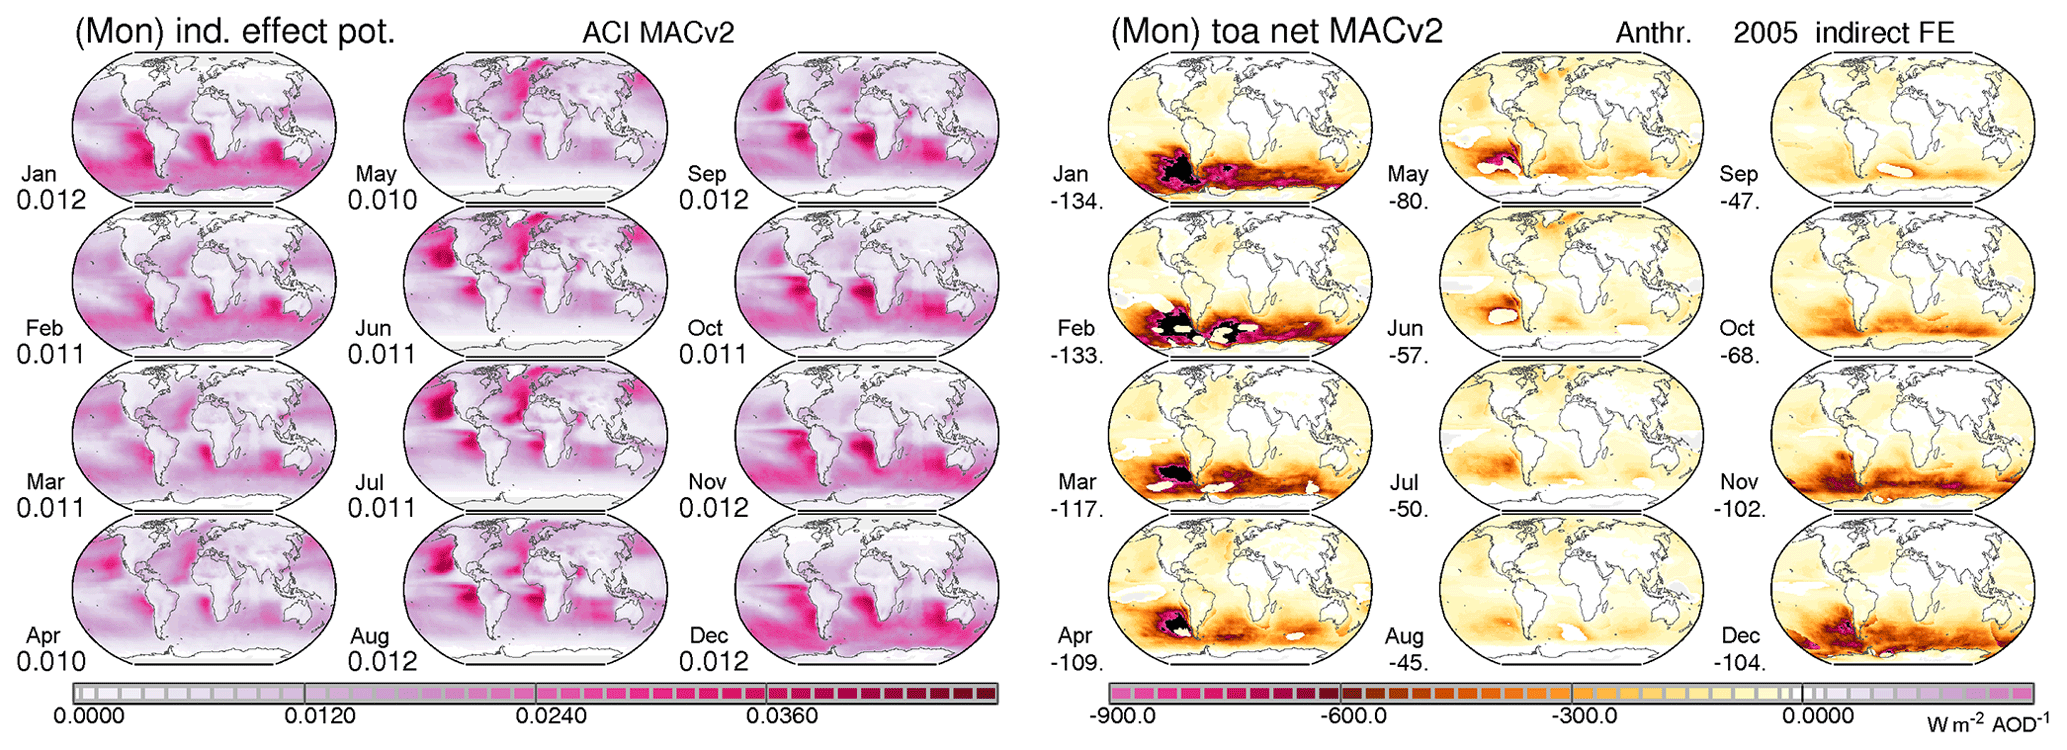
Figure F1Monthly maps for environmental potential for aerosol indirect effects (left frame) considering low cloud cover, reflection and susceptibility, surface albedo, sunshine hours and sun elevation, and the indirect forcing efficiency (left frame).
Table F1Assumed properties for the indirect environmental potential.

The highest environmental potential for indirect effects is at oceanic stratocumulus regions off western continental coasts in the subtropics and at mid-to-high-latitude oceanic regions during spring and summer seasons with longer sunshine periods. The aerosol indirect forcing efficiency (indirect forcing per unit anthropogenic AOD) displays a very high sensitivity over the southern oceans, where anthropogenic contributions, however, are very low. As this high sensitivity is caused by the part of the logarithmic fit that is not well constrained by observations (see Appendix A), indirect effects are possibly overestimated over aerosol sparse regions, although absolute contributions to the MACv2 indirect forcing from these very clean regions are relatively small.
The present-day aerosol properties and associated direct radiative effects of MACv2 are here compared to complementary results from bottom-up global modeling. More detail is provided by investigating component contributions in bottom-up global modeling with assigned component data of the top-down approach in MACv2.
First, midvisible AOD and AAOD differences between a MACC reanalysis of assimilated MODIS AOD data in an ECMWF simulation (Bellouin et al., 2013) to MACv2 are investigated by comparing annual averages in Table G1.
With the MODIS data assimilation in MACC (Bellouin et al., 2013) the global average AOD is 50 % higher. Thus it is a likely overestimate as updated Multiangle Imaging Spectroradiometer (MISR) retrievals (Mike Garay, personal communication, 2018) and even the ICAP satellite assimilation ensemble (Peng et al., 2013) indicate and upper ceiling of 0.14 for the present-day global midvisible AOD. The (for anthropogenic impacts relevant) fine-mode AOD MACC has a smaller relative contribution of the total AOD but is still larger than in MACv2. More of a concern is the large anthropogenic fraction of the fine-mode AOD in MACC, so that the present-day anthropogenic AOD is more than 2.5 times larger than in MACv2 – as all wildfires are incorrectly considered as anthropogenic in MACC. The MACC anthropogenic AOD has a slightly smaller absorption potential, and the absorption potential of mineral dust is way too small, mainly due to a simplified dust size treatment in MACC. Differences in associated aerosol radiative effects are expected and shown in Table G2.
Table G1Comparison of properties for present-day midvisible (550 nm) AOD and AAOD data between the MACv2 aerosol climatology and the MACC reanalysis data.
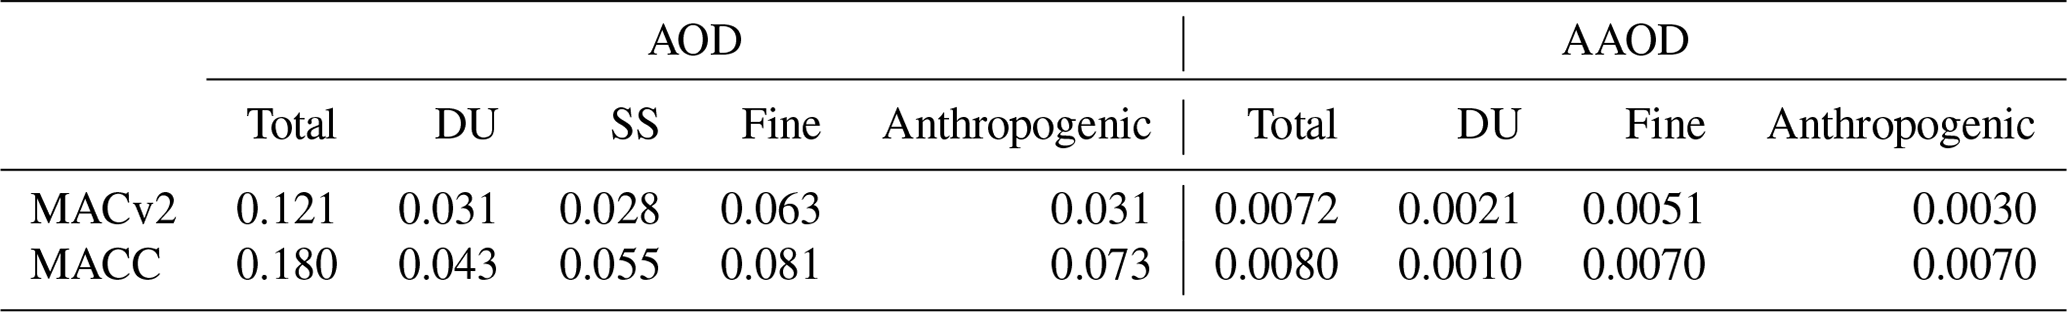
Table G2Comparison of present-day aerosol-associated aerosol radiative effects between the MACv2 aerosol climatology and the MACC reanalysis data (in W m−2)
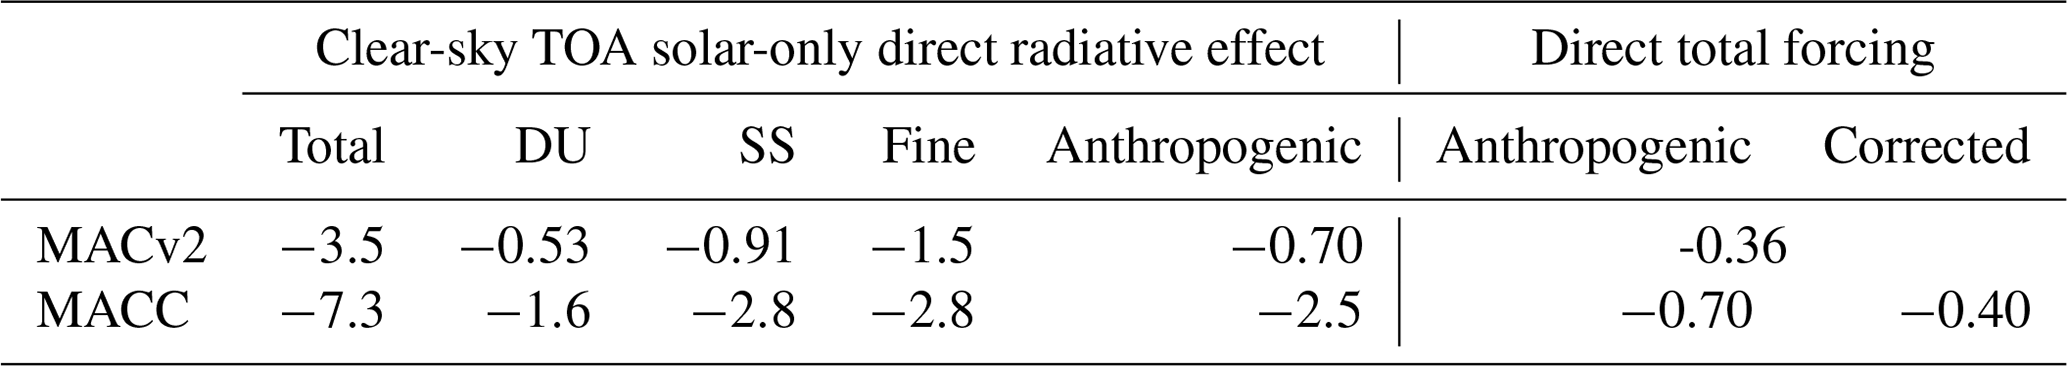
The MACC total aerosol present-day effect is too large, mainly because the total AOD is too large but also as the stronger cooling coarse mode (missing mineral dust absorption/size) has a larger AOD fraction (too much sea salt).
The MACC aerosol present-day direct forcing of −0.7 W m−2 is too large as it includes wildfire contributions (Nicolas Bellouin, personal communication, 2018). When removing those contributions the aerosol forcing is corrected downward to an agreeable −0.4 W m−2 cooling. Still, the contributing large reduction from clear sky to all sky (from −2.5 to −0.7) in MACC raises proper cloud impact treatment questions.
Focusing on the fine-mode aerosol an its anthropogenic contributions, the present-day aerosol direct forcing, along with component contributions of MACv2, was compared to bottom-up ensemble averages of AeroCom (Schulz et al., 2006) and CMIP5 modeling (Myhre et al., 2013) in Table G3.
There is surprising good agreement for direct forcing estimates, even on a component basis. It is also shown that if the prescribed fine-mode anthropogenic fraction in MACv2 is raised for soot (BC), then extra BC warming shifts the overall aerosol direct forcing to less negative values in MACv2. Thus, the possibility of a lower MACv2 direct effect cannot be ruled out. Here, again, it is the limited understanding of the preindustrial reference that introduces uncertainty.
Table G3Comparisons of present-day aerosol direct radiative forcing (TOA, all sky) in watts per square meter (W m−2).

MACv2 values with higher-than-fine-mode present-day anthropogenic BC fractions are in parenthesis.
| AAOD | absorption aerosol optical depth (AOD associated with absorption) |
| AOD | aerosol optical depth (spectral exp. attenuation coefficient by atmospheric aerosol) |
| ASY | asymmetry factor (spectral scattering behavior describing quantity) |
| ATSR | Along Track Scanning Radiometer (a sensor on ESA satellites) |
| BC | black carbon (strong solar radiation absorbing) aerosol component |
| CA | carbon component (combined BC and OC) |
| CCI | Climate Change Initiative of ESA for Essential Climate Variables (ECVs) |
| CDNC | cloud droplet number concentration |
| CMIP5 | Coupled Model Intercomparison Project Phase 5 |
| DU | mineral dust aerosol component |
| ECHAM-HAM | Max Planck Institute climate model with an aerosol processing HAM module |
| ESM | Earth System coupled global Model |
| ICAP | International Cooperative for Aerosol Prediction |
| IR | (far-) infrared (thermal spectral region) |
| ISCCP | International Satellite Cloud Climatology Project |
| LAADS | NASA’s Level-1 and Atmosphere Archive and Distribution System |
| MAC | Max Planck Institute aerosol climatology |
| MACC | Monitoring Atmospheric Composition and Climate (an EU project) |
| MAN | Maritime Aerosol Network (a subgroup of NASA's AERONET sun photometer network) |
| MISR | Multiangle Imaging Spectroradiometer (a sensor on a NASA satellite) |
| MODIS | Moderate Resolution Imaging Spectroradiometer (a sensor on NASA satellites) |
| OC | organic (weakly solar radiation absorbing) aerosol component |
| ORAC | optimal retrieval for aerosol and clouds of RAL (Rutherford Appleton Laboratory) |
| RE | effective radius (radiatively characteristic particle radius of a size distribution) |
| SS | sea salt aerosol component |
| SST | sea-surface temperature |
| SSA | single scattering albedo (spectral ratio of scattering attenuation and total attenuation) |
| SU | sulfate aerosol component (here representing the fine-mode VIS scattering aerosol) |
| TOA | top of the atmosphere |
| VIS | visible (solar spectral region) |
| UV | ultraviolet (solar spectral region) |
The author declares that there is no conflict of interest.
This article is part of the special issue “BACCHUS – Impact of Biogenic versus Anthropogenic emissions on Clouds and Climate: towards a Holistic UnderStanding (ACP/AMT/GMD inter-journal SI)”. It is not associated with a conference.
This study relied on observational data when possible. Central to the effort are data provided by the ground-based sun-photometer network of AERONET led by Brent Holben and the MAN network led by Alexander Smirnov. Also satellite data of the MODIS and AATSR sensors were applied to quantify aerosol indirect effects. Hereby in particular CDNC retrievals contributed by Dan Grosvenor, John Rausch, and Matt Christensen and analysis work by Jobst Müsse, who created all figures in Appendix A, are acknowledged. Another essential element to this study is global model output from simulations with bottom-up processing in aerosol modules as part of the AeroCom initiative led by Michael Schulz and Mian Chin. An ensemble median provides data on spatial context, estimates on aerosol anthropogenic fractions (also as a function of time) and aerosol vertical distribution. Thus, all modeling groups contributing to AeroCom experiments are acknowledged. Finally this work was supported by EU projects, in particular the FP7 EU Bacchus project (603445) led by Ulrike Lohmann, and by ESA's climate initiative, in particular the aerosol-CCI effort led by Thomas Popp and Gerrit de Leeuw and coordinated by Simon Pinnock.
The article processing charges for this open-access publication were covered by the Max Planck Society.
This paper was edited by Athanasios Nenes and reviewed by Stephen E. Schwartz and two anonymous referees.
Anderson, G., Clough, S., Kneizys, F., Chetwynd, J., and Shettle, E.: AFGL Atmospheric Constituent Profiles (0.120 km) Air Force Geophysics Lab, Hanscom AFB, MA, 1986.
Bellouin, N., Quaas, J., Morcrette, J.-J., and Boucher, O.: Estimates of aerosol radiative forcing from the MACC re-analysis, Atmos. Chem. Phys., 13, 2045–2062, https://doi.org/10.5194/acp-13-2045-2013, 2013.
Bond, T., Doherty, S., Fahey, D., Forster, P., Berntsen, T., DeAngelo, B., Flanner, M., Ghan, S., Kärcher, B., Koch, D., Kinne, S., Kondo, Y., Quinn, P., Sarofim, M., Schultz, M., Schulz, M., Venkataraman, C., Zhang, H., Zhang, S., Bellouin, N., Guttikunda, S., Hopke, P., Jacobson, M., Kaiser, J., Klimont, Z., Lohmann, U., Schwarz, J., Shindell, D., Storelvmo, T., Warren, S., and Zender, C.: Bounding the role of black carbon in the climate system: A scientific assessment, J. Geophys. Res.-Atmos., 118, 5380–5552, https://doi.org/10.1002/jgrd.50171, 2013.
Christensen, M., Suzuki, K., Zambri, B., and Stephens, G. L.: Ship track observations of a reduced shortwave aerosol indirect effect in mixed-phase clouds, Geophys. Res. Lett., 41, 6970–6977, 2016.
Coakley, J. and Walsh C.: Limits to the Aerosol Indirect Radiative Effect Derived from Observations of Ship Tracks, J. Atmos. Sci. 58, 668-680, 2002.
Dentener, F., Kinne, S., Bond, T., Boucher, O., Cofala, J., Generoso, S., Ginoux, P., Gong, S., Hoelzemann, J. J., Ito, A., Marelli, L., Penner, J. E., Putaud, J.-P., Textor, C., Schulz, M., van der Werf, G. R., and Wilson, J.: Emissions of primary aerosol and precursor gases in the years 2000 and 1750 prescribed data-sets for AeroCom, Atmos. Chem. Phys., 6, 4321–4344, https://doi.org/10.5194/acp-6-4321-2006, 2006.
Dubovik, O., Holben, B., Eck, T., Smirnov, A., Kaufman, Y., King, M., Tanre, D., and Slutsker, I.: Variability of Absorption and Optical Properties of Key Aerosol Types Observed in Worldwide Locations, J. Atmos. Sci., 38, 580–608, 2002.
Fiedler, S., Stevens, B., and Mauritzen, T.: On the sensitivity of anthropogenic aerosol forcing to model-internal variability and parameterizing a Twomey effect, J. Adv. Model. Earth Sy., J. Adv. Model. Earth Sy., 9, 1325–1341, https://doi.org/10.1002/2017MS000932, 2017.
Fiedler, S., Kinne, S., Huang, W. T. K., Räisänen, P., O'Donnell, D., Bellouin, N., Stier, P., Merikanto, J., van Noije, T., Makkonen, R., and Lohmann, U.: Anthropogenic aerosol forcing – insights from multiple estimates from aerosol-climate models with reduced complexity, Atmos. Chem. Phys., 19, 6821–6841, https://doi.org/10.5194/acp-19-6821-2019, 2019.
Ginoux, P., Prospero, J., Gill, T., Hsu, C., and Zhao, M.: Global-scale attribution of anthropogenic and natural dust sources and their emission rates based on MODIS Deep Blue aerosol products, Rev. Geophys., 50, RG3005, https://doi.org/10.1029/2012RG000388, 2012.
Grandey, B. S. and Stier, P.: A critical look at spatial scale choices in satellite-based aerosol indirect effect studies, Atmos. Chem. Phys., 10, 11459–11470, https://doi.org/10.5194/acp-10-11459-2010, 2010.
Hansen, J., Ruedy, R., Sato, M., and Lo, K.: Global surface temperature change, Rev. Geophys., 48, RG4004, https://doi.org/10.1029/2010RG000345, 2010.
Holben, B., Tanre, D., Smirnov, A., Eck, T., Slutsker, I., Abuhassan, N., Newcomb, W., Schafer, J., Chatenet, B., Lavenue, F., Kaufman, Y., Vande Castle, J., Setzer, A., Markham, B., Clark, D., Frouin, R., Halthore, R., Karnieli, A., O'Neill, N., Pietras, C., Pinker, R., Voss, K., and Zibordi, G.: An emerging ground-based aerosol climatology: Aerosol Optical Depth from AERONET, J. Geophys. Res., 106, 12067–12097, 2001.
Kinne, S.: The MACv2 Aerosol Climatology, Tellus B, 71, 1–21, 2019.
Kinne, S., Schulz, M., Textor, C., Guibert, S., Balkanski, Y., Bauer, S. E., Berntsen, T., Berglen, T. F., Boucher, O., Chin, M., Collins, W., Dentener, F., Diehl, T., Easter, R., Feichter, J., Fillmore, D., Ghan, S., Ginoux, P., Gong, S., Grini, A., Hendricks, J., Herzog, M., Horowitz, L., Isaksen, I., Iversen, T., Kirkevåg, A., Kloster, S., Koch, D., Kristjansson, J. E., Krol, M., Lauer, A., Lamarque, J. F., Lesins, G., Liu, X., Lohmann, U., Montanaro, V., Myhre, G., Penner, J., Pitari, G., Reddy, S., Seland, O., Stier, P., Takemura, T., and Tie, X.: An AeroCom initial assessment – optical properties in aerosol component modules of global models, Atmos. Chem. Phys., 6, 1815–1834, https://doi.org/10.5194/acp-6-1815-2006, 2006.
Kinne, S., O'Donnel, D., Stier, P., Kloster, S., Zhang, Z., Schmidt, H., Rast, S., Giorgetta, M., Eck, T., and Stevens, B.: MAC-v1: A new global aerosol climatology for climate studies, J. Adv. Model. Earth Sy., 5, 704–740, 2013.
Kretzschmar J., Salzmann, M., and Mülmenstädt, J.: Rethinking the Lower Bound on Aerosol Radiative Forcing, J. Climate, 16, https://doi.org/10.1175/JCLI-D-14-00656.1, 2016.
Lamarque, J.-F., Bond, T. C., Eyring, V., Granier, C., Heil, A., Klimont, Z., Lee, D., Liousse, C., Mieville, A., Owen, B., Schultz, M. G., Shindell, D., Smith, S. J., Stehfest, E., Van Aardenne, J., Cooper, O. R., Kainuma, M., Mahowald, N., McConnell, J. R., Naik, V., Riahi, K., and van Vuuren, D. P.: Historical (1850–2000) gridded anthropogenic and biomass burning emissions of reactive gases and aerosols: methodology and application, Atmos. Chem. Phys., 10, 7017–7039, https://doi.org/10.5194/acp-10-7017-2010, 2010.
Mallavelle, F., Hayward, J., Jones, A., Gettelman, A., Clarisse, L., Bauduin, S., Allan, R., Karset, I. , Kristjánsson, J., Oreopoulos, L., Cho, N., Dongmin Lee, D., Bellouin, N., Boucher, O., Grosvenor, D., Carslaw, K., Dhomse, S., Mann, G., Schmidt, A., Hugh Coe, H., Hartley, M., Dalvi, M., Hill, A., Johnson, B., Johnson, C., Jeff R. Knight, J., O'Connor, F., Partridge, D., Stier, P., Myhre, G., S., Stephens, G., Hanii Takahashi, H., and Thordarson, T.: Strong constraints on aerosol-cloud interactions from volcanic eruptions, Nature, 546, 485–491, 2017.
McClatchey, R., Fenn, R., Selby, J., Volz, F., and Garing, J.: Optical properties of the atmosphere, Environ. Res. Paper, 411, AFCRL-72-0497, p. 108, 1972.
Meador, W. and Weaver, W.: Two-stream approximation to radiative transfer in planetary atmospheres: a unified description of existing methods and new improvement, J. Atmos. Sci., 37, 630–643, 1980.
Myhre, G., Samset, B. H., Schulz, M., Balkanski, Y., Bauer, S., Berntsen, T. K., Bian, H., Bellouin, N., Chin, M., Diehl, T., Easter, R. C., Feichter, J., Ghan, S. J., Hauglustaine, D., Iversen, T., Kinne, S., Kirkevåg, A., Lamarque, J.-F., Lin, G., Liu, X., Lund, M. T., Luo, G., Ma, X., van Noije, T., Penner, J. E., Rasch, P. J., Ruiz, A., Seland, Ø., Skeie, R. B., Stier, P., Takemura, T., Tsigaridis, K., Wang, P., Wang, Z., Xu, L., Yu, H., Yu, F., Yoon, J.-H., Zhang, K., Zhang, H., and Zhou, C.: Radiative forcing of the direct aerosol effect from AeroCom Phase II simulations, Atmos. Chem. Phys., 13, 1853–1877, https://doi.org/10.5194/acp-13-1853-2013, 2013.
Peng, Y., Reid, J., Hyer, E., Sampson, C., Rubin, J., Ades, M., Asencio, N., Basart, S., Benedetti, A., Bhattacharjee, P., Brooks, M., Colarco, P., Da Silva, A., Eck, T., Guth, J., Jorba, O., Kouznetsov, R., Kipling, Z., Sofiev, M., Perez, C., Pradhan, Y., Tanaka, T., Wang, J., Westphal, D., Yumimoto, K., Zhang, J.: Current state of the global operational aerosol multi-model ensemble: an update from the International Cooperative for Aerosol Prediction (ICAP), Q. J. Roy. Meteor. Soc., 1–34, https://doi.org/10.1002/qj.3497, 2018.
Penner J., Zhou, C., Garnier, A., and Mitchell, D.: Anthropogenic Aerosol Indirect Effects in Cirrus Clouds, J. Geophys. Res.-Atmos., 123, 11652–11677, 2018.
Rossow, W., Walker, A., and Garder, C.: Comparison of ISCCP and other cloud amounts, J. Climate, 6, 2394–2418, 1993.
Schaaf, C., Gao, F., Strahler, A., Lucht, W., Li, X., Trang, T., Strucknell, N., Zhang, X., Jin, Y., Mueller, J., Lewis, P., Barnsley, M., Hobson, P., Disney, M., Roberts, G., Dunderdale, M., D'Entremont, R., Hu, B., Liang, S.,Privette, J., and Roy, D.: First oberservational BRDF, albedo and nadir reflectance from MODIS, Remote Sens. Environ., 83, 135–148, 2002.
Schulz, M., Textor, C., Kinne, S., Balkanski, Y., Bauer, S., Berntsen, T., Berglen, T., Boucher, O., Dentener, F., Guibert, S., Isaksen, I. S. A., Iversen, T., Koch, D., Kirkevåg, A., Liu, X., Montanaro, V., Myhre, G., Penner, J. E., Pitari, G., Reddy, S., Seland, Ø., Stier, P., and Takemura, T.: Radiative forcing by aerosols as derived from the AeroCom present-day and pre-industrial simulations, Atmos. Chem. Phys., 6, 5225–5246, https://doi.org/10.5194/acp-6-5225-2006, 2006.
Smirnov, A., Holben, B., Slutsker, I., Giles, D., McClain, C., Eck, T., Sakerin, S., Macke, A., Croot, P., Zibordi, G., Quinn, P., Sciare, J., Kinne, S., Harvey, M., Smyth, T., Piketh, S., Zielinski, T., Proshutinsky, A., Goes, J., Nelson, N., Larouche, P., Radionov, V., Goloub, P., Moorthy, K., Matarrese, R., Robertson, E., and Jourdin, F.: Maritime Aerosol Network as a component of Aerosol Robotic Network, J. Geophys. Res.-Atmos., 114, D06204, https://doi.org/10.1029/2008JD011257, 2009.
Stevens, B., Fiedler, S., Kinne, S., Peters, K., Rast, S., Müsse, J., Smith, S. J., and Mauritsen, T.: MACv2-SP: a parameterization of anthropogenic aerosol optical properties and an associated Twomey effect for use in CMIP6, Geosci. Model Dev., 10, 433–452, https://doi.org/10.5194/gmd-10-433-2017, 2017.
Stier, P., Feichter, J., Roeckner, E., Kloster, S., and Esch, M.: The evolution of the global aerosol system in a transient climate simulation from 1860 to 2100, Atmos. Chem. Phys., 6, 3059–3076, https://doi.org/10.5194/acp-6-3059-2006, 2006.
Taylor, J., Edwards, J., Glew, M., Hignett, P., and Slingo, A.: Studies with a flexible new radiation code. II: Comparisons with aircraft shortwave observations, Q. J. Roy. Meteor. Soc., 122, 839–861, 1996.
Twomey, S.: Pollution and the planetary albedo, Atmos. Environ., 8, 1251–1256, 1974.
Wild, M.: Decadal changes in radiative fluxes at land and ocean surfaces and their relevance for global warming, WIREs Clim. Change, 7, 91–107, 2016.
Zhang, K., O'Donnell, D., Kazil, J., Stier, P., Kinne, S., Lohmann, U., Ferrachat, S., Croft, B., Quaas, J., Wan, H., Rast, S., and Feichter, J.: The global aerosol-climate model ECHAM-HAM, version 2: sensitivity to improvements in process representations, Atmos. Chem. Phys., 12, 8911–8949, https://doi.org/10.5194/acp-12-8911-2012, 2012.
- Abstract
- Introduction
- MACv2 aerosol properties
- Environmental properties
- Radiative transfer method
- Direct aerosol effects
- Direct forcing efficiencies
- Indirect aerosol effects
- Direct vs. indirect
- Forcing over time
- Uncertainty
- Summary
- Data availability
- Appendix A: The satellite-based AODf vs. CDNC relationship
- Appendix B: MACv2 vs. MACv1 and MACv2 vs. MACv2-SP
- Appendix C: Monthly TOA forcing
- Appendix D: Monthly TOA direct forcing efficiencies
- Appendix E: Component direct radiative effects
- Appendix F: Aerosol indirect radiative forcing sensitivity
- Appendix G: Comparisons to other published aerosol direct radiative effects
- Appendix H: Abbreviations
- Competing interests
- Special issue statement
- Acknowledgements
- Financial support
- Review statement
- References