the Creative Commons Attribution 4.0 License.
the Creative Commons Attribution 4.0 License.
 | 29 Aug 2019
Characterization of aerosol properties at Cyprus, focusing on cloud condensation nuclei and ice-nucleating particles
Heike Wex
Thomas Müller
Alfred Wiedensohler
Kristina Höhler
Konrad Kandler
Nan Ma
Barbara Dietel
Thea Schiebel
Ottmar Möhler
Frank Stratmann
As part of the A-LIFE (Absorbing aerosol layers in a changing climate: aging, LIFEtime and dynamics) campaign, ground-based measurements were carried out in Paphos, Cyprus, to characterize the abundance, properties, and sources of aerosol particles in general and cloud condensation nuclei (CCN) and ice-nucleating particles (INP) in particular. New particle formation (NPF) events with subsequent growth of the particles into the CCN size range were observed. Aitken mode particles featured κ values of 0.21 to 0.29, indicating the presence of organic materials. Accumulation mode particles featured a higher hygroscopicity parameter, with a median κ value of 0.57, suggesting the presence of sulfate and maybe sea salt particles mixed with organic carbon. A clear downward trend of κ with increasing supersaturation and decreasing dcrit was found. Super-micron particles originated mainly from sea-spray aerosol (SSA) and partly from mineral dust.
INP concentrations (NINP) were measured in the temperature range from −6.5 to −26.5 ∘C, using two freezing array-type instruments. NINP at a particular temperature span around 1 order of magnitude below −20 ∘C and about 2 orders of magnitude at warmer temperatures ( ∘C). Few samples showed elevated concentrations at temperatures ∘C, which suggests a significant contribution of biological particles to the INP population, which possibly could originate from Cyprus. Both measured temperature spectra and NINP probability density functions (PDFs) indicate that the observed INP (ice active in the temperature range between −15 and −20 ∘C) mainly originate from long-range transport. There was no correlation between NINP and particle number concentration in the size range >500 nm (N>500 nm). Parameterizations based on N>500 nm were found to overestimate NINP by about 1 to 2 orders of magnitude. There was also no correlation between NINP and particle surface area concentration. The ice active surface site density (ns) for the polluted aerosol encountered in the eastern Mediterranean in this study is about 1 to 3 orders of magnitude lower than the ns found for dust aerosol particles in previous studies. This suggests that observed NINP PDFs such as those derived here could be a better choice for modeling NINP if the aerosol particle composition is unknown or uncertain.
- Article
(8496 KB) - Full-text XML
-
Supplement
(1481 KB) - BibTeX
- EndNote


The Mediterranean region is one of the hotspot areas of the globe being severely threatened by climate change (Giorgi and Lionello, 2008), with the direct and indirect effects of aerosol particles therein still remaining unclear. The Mediterranean region is rich in a variety of aerosols (fuel combustion, biomass burning, secondary biogenic, sea spray, and mineral dust aerosols) from both continental and marine sources (Chester et al., 1993; Piazzola and Despiau, 1997; Lelieveld et al., 2002). The sensitivity of this region, together with the large number of influencing factors, makes it a difficult task to understand all ongoing processes and their interconnections. This, however, is needed in order to better be able to protect the region or mitigate upcoming changes. Our goal in this framework is to better understand the varied aerosol that occurs in this region. In the next paragraphs, we will start by giving an overview of what is known about the Mediterranean aerosol.
Regarding anthropogenic sources of aerosol particles, Sciare et al. (2003) found that the major contributions in the eastern Mediterranean were from Turkey and central Europe. Central Europe was identified as the major source of black carbon over the eastern Mediterranean. In the Po Valley, which is in the western Mediterranean, but which we still consider here, due to the comparable climatic conditions, Sandrini et al. (2016) found that particles in the size range from 50 to 140 nm were mainly from traffic emissions. The photochemical oxidation of inorganic and organic gaseous precursors was identified as the important mechanism of secondary aerosol formation, which caused the accumulation mode (420–1200 nm) aerosol particles to be constituted mainly of ammonium nitrate, organic carbon, and sulfate. Bougiatioti et al. (2013) found that organic carbon and element carbon concentrations made up 2∕3 of the PM1, with organic carbon being mostly secondary and therefore highly oxidized and water-soluble to a great extent.
Biomass burning is another important anthropogenic aerosol source over the Mediterranean, and it was mainly observed in the driest months of the year, July and August (Pace et al., 2005). Long-term observations of absorbing aerosol particles have clearly shown that they originated from agriculture waste burning (post-harvest wheat residual) in the countries surrounding the Black Sea (Sciare et al., 2008). Bougiatioti et al. (2016) examined in the eastern Mediterranean potential cloud condensation nuclei (CCN) and hygroscopicity properties and found that an increased organic content in the aerosol particles decreased the values of the hygroscopicity parameter κ for all particle sizes. Furthermore, they observed CCN concentrations (NCCN) to be enhanced by a factor from 1.6 to 2.5 during biomass burning plumes compared to background conditions.
Natural aerosol particles such as mineral dust and sea salt are however the major contributing factors to particle mass in the Mediterranean (Rodríguez et al., 2002). Mineral dust particles from the Sahara Desert were regularly observed at different locations across the Mediterranean. A record-breaking dust storm originating from desert regions in northern Syria and Iraq occurred over the eastern Mediterranean in September 2015. The PM10 concentrations were close to 8000 µg m−3 and the observed meteorological optical range (MOR) was reduced to 300–750 m (Mamouri et al., 2016). By using the Weather Research and Forecasting model in a Sahara outflow region, Smoydzin et al. (2012) found that the presence of mineral dust can enhance the CCN concentration and formation of ice crystals.
Sea-spray aerosols (SSA) are another main natural aerosol type observed in the Mediterranean. Claeys et al. (2017) found that primary marine aerosols mass concentration reached up to 6.5 µg m−3, representing more than 40 % of the total PM10 mass in the western Mediterranean. Salameh et al. (2007) reported AOD around 0.15–0.20 (at 865 nm) within a SSA plume during strong wind events with wind speeds up to 18 m s−1.
Clouds in the atmosphere form when water vapor condenses on aerosol particles that serve as CCN. Clouds in the atmosphere glaciate at temperatures above −38 ∘C if droplet freezing is initiated by aerosol particles called ice-nucleating particles (INP) or at temperatures below −38 ∘C, also through homogeneous freezing (without INP) (Pruppacher and Klett, 2010). Therefore, a change in atmospheric aerosol particles, especially CCN and INP, is bound to impact cloud properties, precipitation, and cloud radiative effects (Fan et al., 2016). Even though clouds are omnipresent in the Earth's atmosphere, and play an important role in regulating the radiative budget of the planet, the response of clouds to climate change remains highly uncertain, in particular with regard to aerosol–cloud interactions and feedback mechanisms.
In situ observations of CCN on Crete were reported by Kalivitis et al. (2015), highlighting new particle formation (NPF) as a source of CCN. At Finokalia, Crete, Bougiatioti et al. (2011) found that air masses originating from central eastern Europe tend to be associated with higher NCCN, and slightly lower hygroscopicity (κ=0.18), than other air masses.
Rarely have measurements of INP been carried out in the Mediterranean. Excluding situations characterized by high-altitude transport of dust plumes, Rinaldi et al. (2017) found that at a measurement station in the Po Valley basin, INP number concentration (NINP) was roughly double that of what they observed at the top of an Apennine mountain. Schrod et al. (2017) found that mineral dust, or a constituent related to dust, was a major contributor to INP on Cyprus. However, due to Sahara dust plumes travelling at several kilometers in altitude, NINP at higher altitudes were 10 times higher than at ground level (height ∼700 m).
As outlined above, the aerosol in the Mediterranean region represents a complex mixture of primary and secondary aerosol particles from both natural and anthropogenic sources, with these sources being non-uniformly distributed across the greater Mediterranean region. Most regional and global climate simulations have investigated impacts of global warming on the Mediterranean climate without detailed considerations of possible radiative influences and climatic feedback from different types of Mediterranean aerosols (Mallet et al., 2016). Besides, to the best of our knowledge, seldom have studies paid attention to the CCN and INP simultaneously, which both have an effect on climate. The aim of this study is to provide a quantitative understanding concerning the abundance, properties and source of CCN and INP in the eastern Mediterranean.
2.1 Sampling site and campaign setup
Measurements were performed from 2 to 30 April 2017, on the island of Cyprus, as part of the A-LIFE (Absorbing aerosol layers in a changing climate: aging, LIFEtime and dynamics) project, which had the purpose of investigating properties of absorbing aerosols during their atmospheric lifetime, and their distribution throughout the tropospheric column. Cyprus, an island located in the eastern Mediterranean region, is approximately 100 km south of the Turkish mainland, 100 km west of the Syrian coast, and 300 km north of the Egyptian coast. This geographical location makes Cyprus an unique spot in the eastern Mediterranean Sea, where different and complex aerosol mixtures occur. On the one hand, the Sahara Desert in the southwest, and the desert of the Arabian Peninsula in the southeast favor a regular occurrence of mineral-dust-rich air masses. One the other hand, Cyprus is influenced by anthropogenic emissions from southeastern Europe, as well as the Middle East, and, of course, local pollution. This exposure to diverse air masses makes Cyprus an ideal place for investigating the abundance and properties of climate relevant aerosol particles in general, and CCN and INP in particular. As shown in Fig. 1, the measurement site was located in Paphos, Cyprus (34∘43′ N, 32∘29′ E). The measurements took place at the side of a fairly calm coastal highway, facing the Mediterranean Sea. On the northeastern side of the measurement site, 1 km away, is Paphos International Airport.
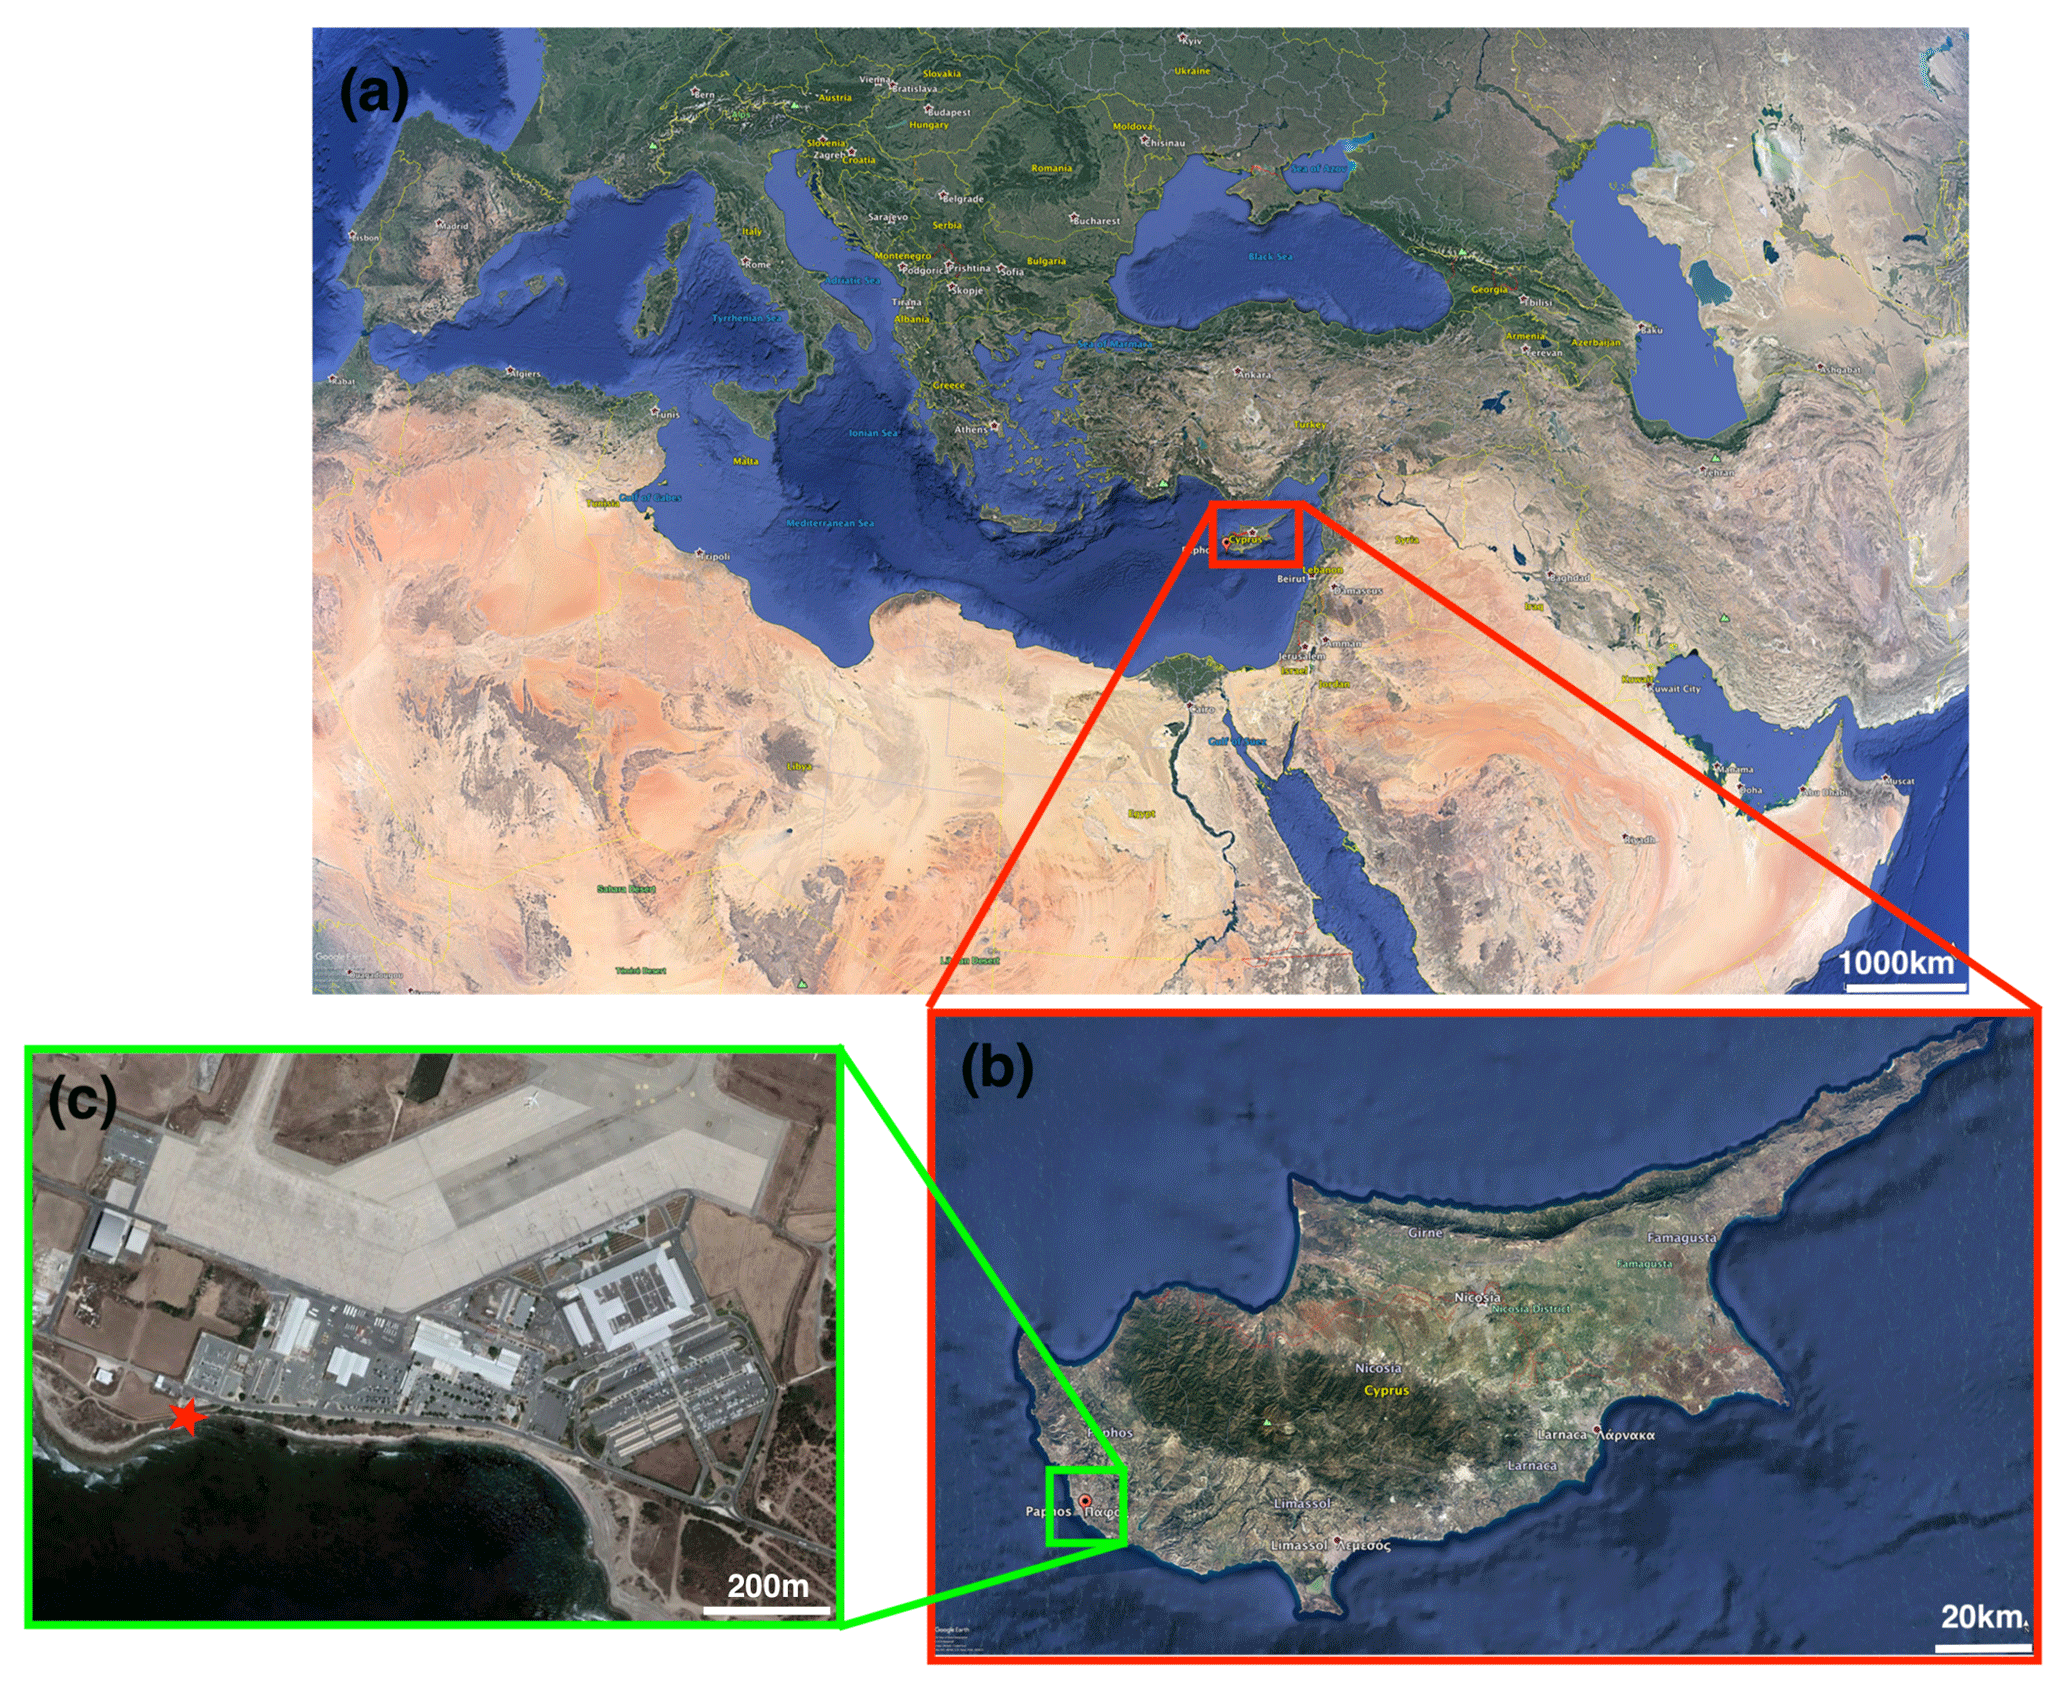
Figure 1Maps of the Mediterranean region, Cyprus, and the sampling location. (a) Position of Cyprus in the Mediterranean region. (b) Position of Paphos in Cyprus. (c) The sampling site is displayed as a red star. Northeast of the sampling site is Paphos International Airport.
The instrumental setup used for these investigations is shown in Fig. S1 in the Supplement. An aerosol PM10 inlet, employed to remove particles larger than 10 µm in aerodynamic diameter, was installed on top of a measurement container. Downstream of the PM10 inlet, a vertical tube (inner diameter of 1.65 cm) and a diffusion dryer (130 cm) were arranged before the aerosol was led into the measurement container. The diffusion dryer was installed vertically to avoid gravitational losses of larger particles. Downstream of the dryer and inside the container, the sampled aerosol was split to supply the aerosol to various instruments, measuring particle number size distribution (PNSD), number concentration, as well as hygroscopic and optical (not discussed in this paper) properties.
For the measurement of NINP, two different filter-based sampling systems were utilized. For one set of samples, total suspended particles were collected with a flow rate of ∼10 L min−1. For a second set of samples, a separate PM10 inlet was used as the inlet, and an air flow of ∼15 L min−1 was sampled onto the filters. No dryer was arranged in the filter sampling system.
The CCN hygroscopicity was derived from NCCN combined with the PNSD. INP freezing behavior and NINP were determined by filter sampling and off-line analysis using freezing array-type instruments. In the following, we will briefly introduce the different measurement techniques applied in this study, including calibrations, measurements, and data processing.
And lastly, to get additional information on the presence of super-micron particles, depositing aerosol particles were collected at ambient conditions outside of the measurement container.
2.2 Particle number size distribution
PNSDs were measured in the size range from 10 nm to 10 µm using a TROPOS-type MPSS (Mobility Particle Size Spectrometer) (Wiedensohler et al., 2012), and an APS (Aerodynamic Particle Sizer, model 3321, TSI Inc., St. Paul, MN, USA). For the multiple charge correction (Wiedensohler, 1988) of the MPSS data, the APS data were accounted for in the inversion of the measured PNSD (Pfeifer et al., 2016). The combined PNSD is then given on the basis of the volume-equivalent particle diameter, where a dynamic shape factor of 1.17 was used for particles >1 µm, based on Schladitz et al. (2011). More details about the combined MPSS and APS PNSD can be found in Schladitz et al. (2011). Size-dependent particle losses due to diffusion, deposition, and sedimentation within the inlet were corrected for utilizing the empirical particle loss calculator (von der Weiden et al., 2009), as shown in Fig. S2. Total particle number concentrations (Ntotal) were calculated from the measured PNSDs and the size-dependent particle losses. The calibration of the MPSS before, during, and after the intensive field study was done following the recommendations given in Wiedensohler et al. (2018).
2.3 Cloud condensation nuclei
NCCN was measured using a Cloud Condensation Nuclei counter (CCNc, Droplet Measurement Technologies (DMT), Boulder, USA). The CCNc is a cylindrical continuous-flow thermal-gradient diffusion chamber, establishing a constant streamwise temperature gradient to adjust a quasi-constant centerline supersaturation. The sampled aerosol particles are guided within a sheath flow through this chamber and can become activated into droplets, depending on the supersaturation and the particles' ability to act as CCN. The details of the CCNc are described in Roberts and Nenes (2005).
During our study, the supersaturation was varied from ∼0.08 % to ∼0.77 % at a constant total flow rate of 0.5 L min−1. To ensure stable column temperatures, the first 5 min and the last 30 s of the 12 min long measurement at each supersaturation were excluded from the data analysis. The remaining data points were averaged. A supersaturation calibration (following the protocol by Gysel and Stratmann, 2013) was done at the cloud laboratory of the Leibniz Institute for Tropospheric Research (TROPOS) prior to and after the measurement campaign to determine the relationship between the temperature gradient along the column and the effective supersaturation. Calibrated supersaturation set points were 0.08 %, 0.19 %, 0.31 %, 0.54 %, and 0.77 %. These calibrated values were used for further calculations.
According to Köhler theory (Köhler, 1936), whether or not a particle can act as CCN depends on its dry size, chemical composition, and the maximum supersaturation it encounters. Petters and Kreidenweis (2007) presented a method to describe the water activity term in the Köhler equation by utilizing the hygroscopicity parameter κ. The κ values reported in this study were calculated as follows, assuming the surface tension of the examined solution droplets σs∕α to be that of pure water:
with
where dcrit is the critical diameter above which all particles activate into cloud droplets for a given supersaturation. Mw and ρw are the molar mass and density of water, while R and T are the ideal gas constant and the absolute temperature, respectively. To derive dcrit, simultaneously measured NCCN and PNSD are used. Thereto, it is assumed that all particles in the neighborhood of a given particle diameter have a similar κ, meaning that the aerosol particles are internally mixed. At a given supersaturation, a particle can be activated to a droplet once its dry size is equal to or larger than dcrit. Therefore, dcrit is the diameter at which NCCN is equal to the value of cumulative particle number concentration, determined via integration from the upper towards the lower end of the PNSD. Hygroscopicity κ can be calculated with dcrit and the corresponding supersaturation, based on Eq. (1). Note that the particle losses inside the CCNc (discussed in Rose et al., 2008) are also considered before κ is calculated. More details about the correction method and data processing can be found in the previous literature (Kristensen et al., 2016; Herenz et al., 2018).
2.4 Ice-nucleating particles
We used two setups to sample airborne particles for further analysis. With the first setup, particles were collected on 200 nm pore size polycarbonate filters (Nuclepore Track-Etch Membrane, Whatman) with ∼20 h time resolution and a flow rate of ∼10 L min−1. As shown in Fig. S1, we used a computer-based system to switch between filters based on wind directions. Two sectors were distinguished, i.e., the ocean sector comprising wind directions from 120 to 240∘ and the land sector covering the remaining directions. During the campaign, we collected 4 filters with air from the ocean sector, 17 from the land sector, and 2 blind filter samples in total. All of the filters were stored at −18 ∘C on Cyprus and cooled below 0 ∘C during transportation. The start and end times of sampling, flow rates, duration, and total sample volumes are shown in Table S1 in the Supplement. These filters were transported to TROPOS for analysis. At TROPOS, all filters were stored at −18 ∘C until they were prepared for the measurement. Each filter was immersed into 1 mL ultrapure water (Type 1, Millipore) and shaken for 25 min to wash off the particles. The resulting water samples were characterized with the Leipzig Ice Nucleation Array (LINA). It should be mentioned that results from separate tests using 1 and 10 mL of washing water were well in agreement (see Fig. S3). LINA is based on the freezing array technique and follows the design described in Budke and Koop (2015). Briefly, 90 droplets with a volume of 1 µL are pipetted from the water samples onto a thin hydrophobic glass slide, with the droplets being separated from each other inside individual compartments. The compartments are sealed at the top with another glass slide to minimize evaporation of the droplets and to prevent ice seeding from neighboring droplets. The bottom glass slide is cooled with a Peltier element with a cooling rate of 1 K min−1. A camera takes pictures every 6 s, corresponding to a temperature resolution of 0.1 K. The number of frozen versus unfrozen droplets was derived automatically. More details concerning the experimental parameters and temperature calibration of LINA can be found in Chen et al. (2018).
For the second filter-based sampling system, 200 nm pore size polycarbonate filters (Nuclepore Track-Etch Membrane, Whatman) were pre-treated with 10 % H2O2 solution, washed with particle free ultrapure water, and dried prior to insertion into the filter holder. Daily filter samples with an air flow rate of ∼15 L min−1 for ∼8 h were taken. In total 25 d time and two blind filter samples were collected. All of the filters were stored at −18 ∘C in Cyprus and cooled below 0 ∘C during transportation. The start and end times of sampling, flow rates, and duration are shown in Table S2. These filters were transported to the Karlsruhe Institute of Technology (KIT) for analysis with the Ice Nucleation SpEctrometer of the Karlsruhe Institute of Technology (INSEKT). INSEKT is a droplet freezing device, the design of which was inspired by the Colorado State University Ice Spectrometer (Hiranuma et al., 2015). For the analysis, each filter was washed with 8 mL ultrapure water which had been passed through a 0.1 µm filter (Nuclepore Track-Etch Membrane, Whatman); 50 µL samples of the resulting suspension/solution were pipetted into 24 to 36 sections of two 96-well PCR trays. Other wells of the trays were filled with 15- and 225-fold (and for some samples also 3375-fold) dilutions of the filter washing water. Also, in each experiment at least 24 wells were filled with pure and particle-free water to be able to account for impurities resulting from the washing water and PCR tray surfaces. The PCR trays were then placed into aluminum cooling blocks. Those blocks have been customized by drilling channels into the bulk aluminum, through which the cooling agent thermostated by means of an external chiller (LAUDA PROLINE RP 855) is directed. The temperature of the cooling agent is then lowered by 0.33 K min−1 and monitored by eight calibrated temperature sensors inserted into the aluminum blocks. The number of frozen versus unfrozen wells was derived visually in 0.5 K steps.
For both measurement systems, the cumulative concentration of INP per air volume as a function of temperature can be calculated based on Vali (1971):
where Nt is the number of droplets/wells and N(θ) is the number of unfrozen droplets/wells at temperature θ. V means the volume (at 0 ∘C and 1013 hPa) of air distributed into each droplet/well.
The background freezing signal of ultrapure water and water samples resulting from washing of blind filters is determined for the two sampling systems as well. Measured NINP is corrected by subtracting the background concentrations determined for the blind filters and the ultrapure water.
Due to the usually small number (order of tens and lower per examined droplet/well) of INP present in the washing water and the limited number of droplets/wells considered in our measurements, statical errors need to be considered in the data evaluation. Therefore, confidence intervals for the frozen fraction (fice) were determined using the method suggested by Agresti and Coull (1998). More details about the background subtraction and measurement uncertainties can be found in the Supplement.
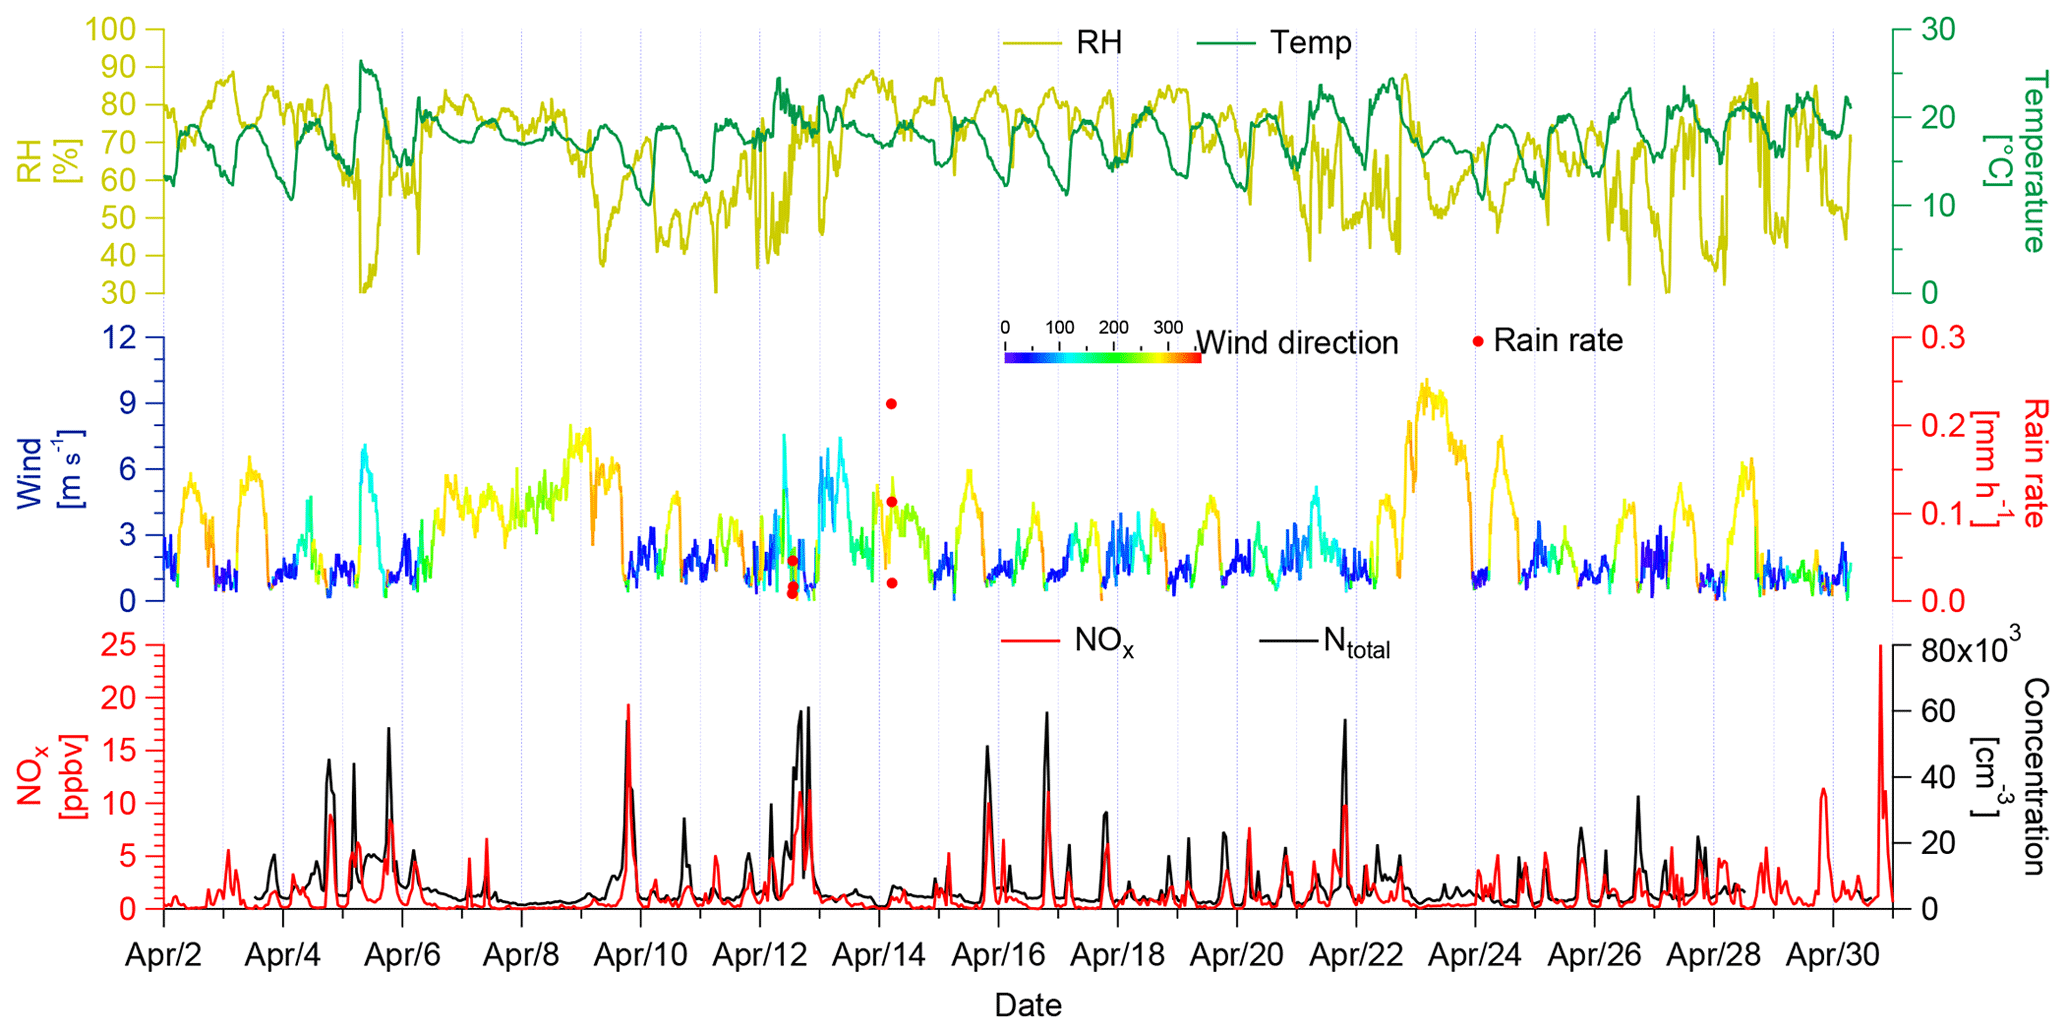
Figure 2Time series of RH, temperature, wind speed, and wind direction with 10 min resolution, NOx, and Ntotal with 1 h resolution.
2.5 Chemical composition
Aerosol particle dry deposition was collected with a flat-plate-type sampler (Ott and Peters, 2008) on carbon adhesive mounted on standard electron microscopy stubs. Sample substrates were exposed for approximately 24 h, collecting particles approximately between 1 and 100 µm particle diameter at ambient conditions. Samples were subject to automated electron microscopy single-particle analysis, yielding the particle size (projected area diameter) and average elemental composition for each particle. Particles were classified according to the composition in groups based on a static rules set. For more information on sampling, analysis, and data processing, refer to Kandler et al. (2018). In this study, we calculated the particle mass deposition rate in the size range from 1 to 8 µm.
3.1 Overview of the meteorology and air quality
Time series of meteorological and air quality parameters as measured from 2 to 30 April are shown in Fig. 2. The relative humidity (RH), temperature, wind speed, wind direction, NOx, and Ntotal (retrieved from MPSS- and APS-measured PNSD) were determined at the measurement site. Note that all times presented here are in UTC (corresponding to local time −3).
RH exhibited large variability throughout the campaign, varying from 22.6 % to 89.2 %, with a mean of 68.4 %. Temperature varied from 10.0 to 26.5 ∘C, with a mean of 17.5 ∘C. The local wind speeds ranged from 0.1 to 10.1 m s−1, with a mean of 2.8 m s−1. Figure S4 shows the wind rose plot based on a 10 min mean of wind speed and wind direction. It is clear that winds are mainly from northwest, west, and northeast. The winds from northwest and west featured higher wind speeds, while winds from northeast featured lower wind speeds.
NOx varied from 0.0027 to 25 ppbv, with a median of 0.67 ppbv. Ntotal varied from 658 to 61 308 cm−3, with a median of 3954 cm−3. The NOx and Ntotal were relatively low during most of the campaign. However, sharp increases in NOx and Ntotal were observed frequently, and extremely high concentrations (NOx>1.6 ppbv, Ntotal>8000 cm−3) only occurred for a few hours. A good correlation (R2=0.62) was found between such extremely high concentrations of NOx and Ntotal (Fig. S5), indicating a nearby pollution source. The extremely high concentrations of NOx and Ntotal together with the wind direction typically connected to their occurrences suggest the nearby airport as the source of these pollutions, as will be discussed in more detail in Sect. 3.2.
To get indications concerning possible particle sources, we studied the air mass origin and transport by means of backward trajectory analysis. The calculations were performed with the HYSPLIT (HYbrid Single-Particle Lagrangian Integrated Trajectory) model (Stein et al., 2015; Rolph, 2003). Figure 3a shows the 6 d backward trajectories with 1 h time resolution ending at 500 m above the measurement site. Figure 3b shows the relative frequency of backward trajectories. The majority (more than 30 %) of the trajectories featured paths over central and southern Europe. Around 10 % of the trajectories were traced back to the northern Atlantic Ocean and travelled through the western Mediterranean Sea to the site. Approximately 5 % of the trajectories touched the Sahara Desert and the desert regions in Syria and Iraq, indicating that mineral dust particles could have been transported to Cyprus during the campaign.
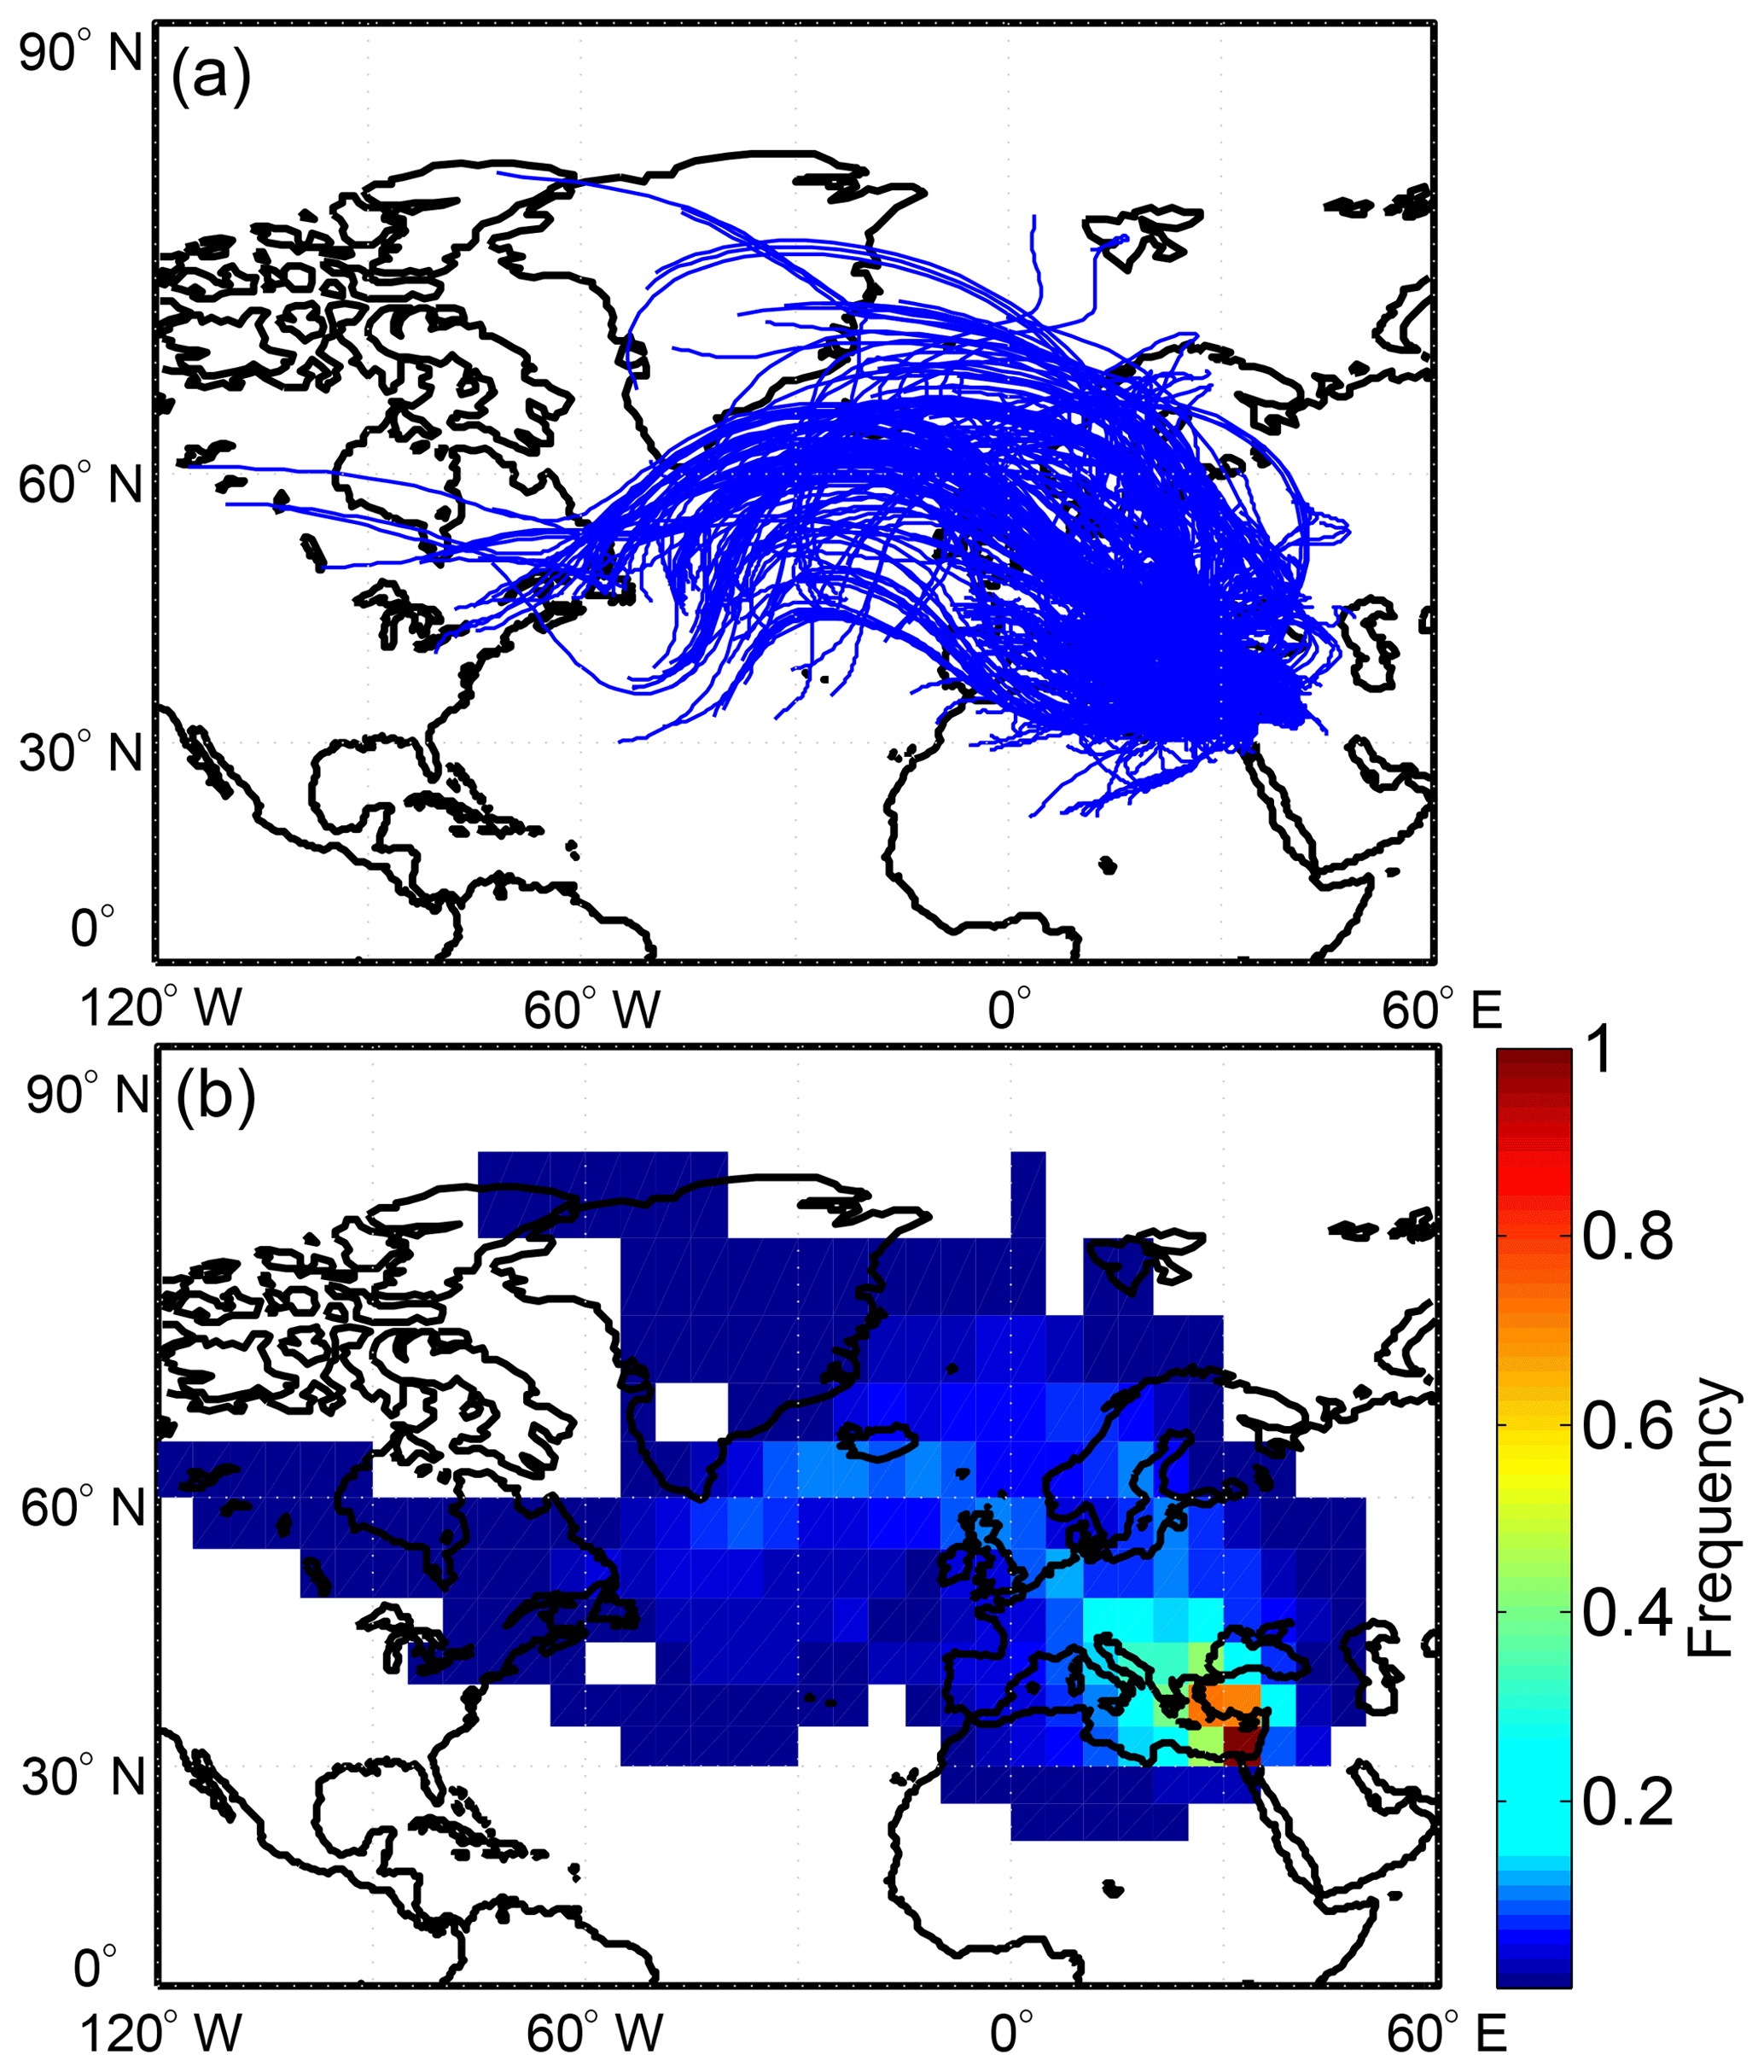
Figure 3(a) 6 d backward trajectories (blue lines) ended at 500 m above the measurement station with 1 h resolution. (b) Relative frequency of trajectories arriving at the station, based on a 5∘ by 5∘ grid size.
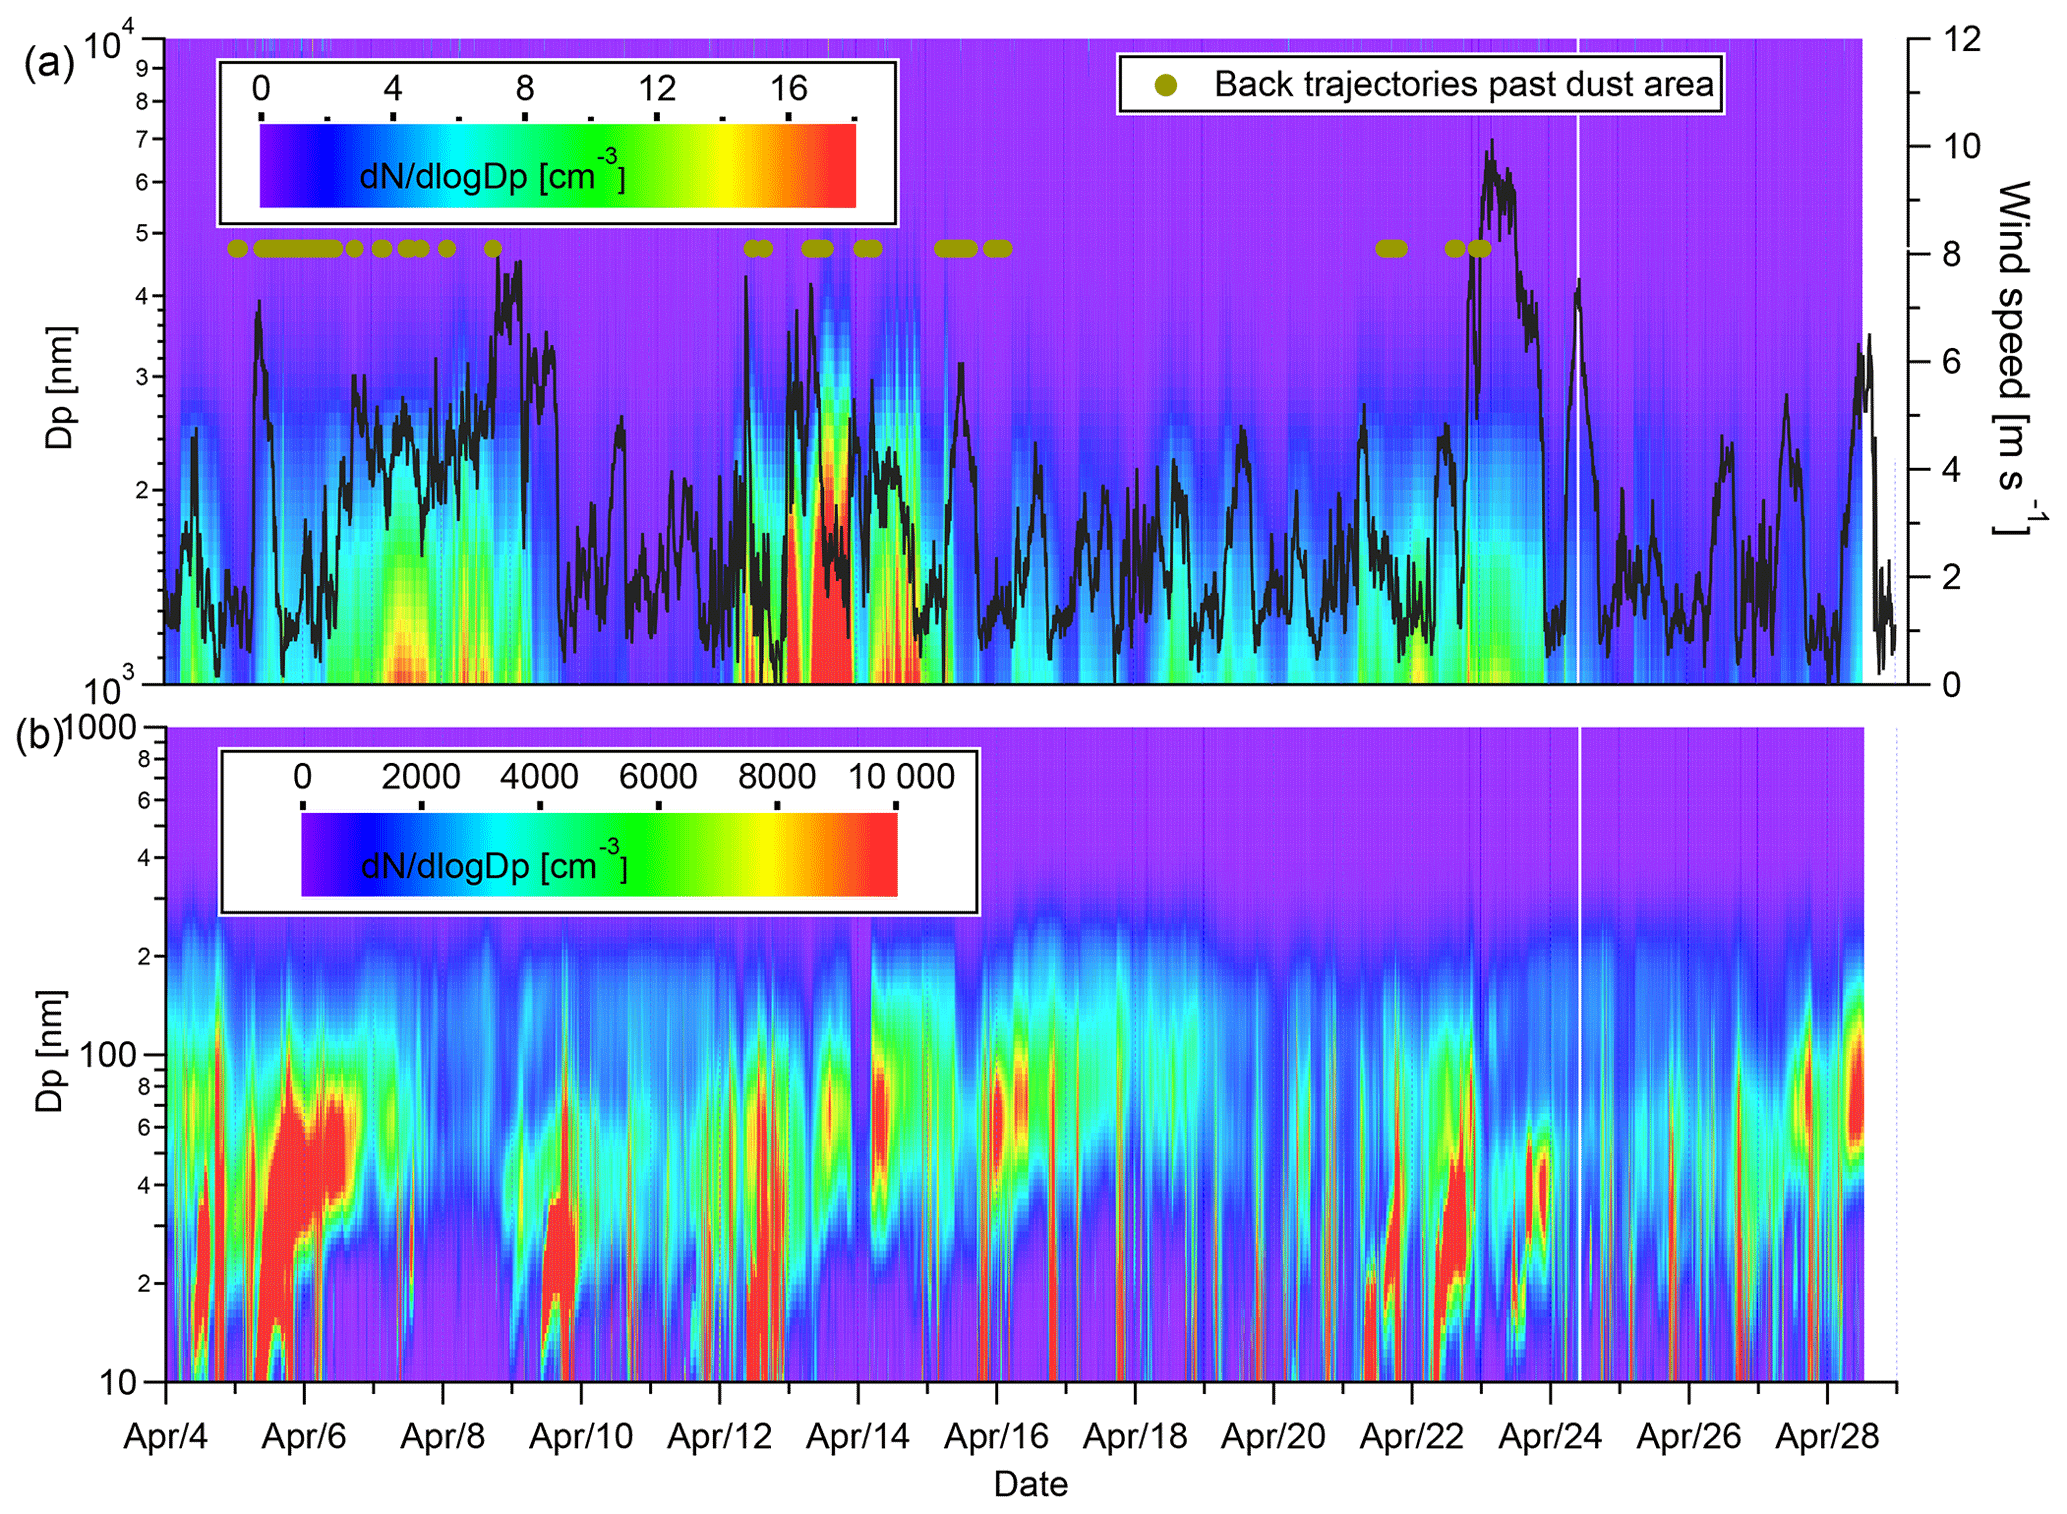
Figure 4Contour plots for PNSDs during the whole campaign. The color scale indicates dN∕dlog Dp in cm−3. (a) Contour plots for PNSDs of 1000 to 10 000 nm. Black line shows time series of wind speed and the brown dots show the time when backward trajectories passed the dust area. (b) Contour plots for PNSDs of 10 to 1000 nm.
3.2 Particle number size distribution and sources
Particles of different sizes have different formation pathways, sources, and behaviors. Figure 4a presents measured super-micron PNSDs as a contour plot, together with wind speed information. The super-micron particle concentration varied from 0 to 11 cm−3, with a mean of 2 cm−3. Figure 5 shows the time series of particle mass deposition rates for different compounds at Cyprus, for particles between 1 and 8 µm dry diameter. Overall, sea salt accounted for more than 60 % of the super-micron particle mass throughout the whole campaign.

Figure 5Time series of the dry mass deposition rate for different compounds for particles between 1 and 8 µm dry diameter. The “Dust” class includes silicate and carbonate particles, and the “Other” class mainly consists of sodium sulfate. Mixed particles are evenly distributed between the respective groups.
Higher super-micron particle number concentrations were mainly observed from 6 to 7, 12 to 14, and 21 to 22 April, with the corresponding air masses originating from dust areas, as shown in Fig. 4a by brown dots. As shown in Fig. 5, high dust deposition rates of ∼1 were also observed during these periods. Therefore, mineral dust was another important constituent of super-micron particle mass during these periods. However, the observed super-micron particle concentrations were relatively low compared to those reported in previous studies (Mamouri et al., 2016; Schrod et al., 2017) for Cyprus during dust plumes. Low concentrations of super-micron particles were observed on 15 April, although the respective backward trajectories featured paths over the Sahara dust region. In summary, the super-micron particles observed during the campaign were a mixture of ∼ 60 % sea salt, ∼32 % mineral dust, and ∼8 % others (mainly sodium sulfate), with the relative contributions being dependent on the actual meteorological conditions and source regions.
Figure 4b presents contour plots of PNSDs observed for submicron particles. Extremely high concentrations of ultrafine particles (pronounced mode with a maximum at about 15 nm, median dN∕dlog Dp value larger than 104 cm−3) were frequently observed throughout the whole campaign. When ultrafine particles featured high concentrations, extremely high concentrations of NOx were also observed. An exemplary case is shown in Fig. S6. Such kinds of behavior usually appeared from 03:00 to 06:00 UTC and 17:00 to 22:00 UTC. A wind rose plot shown in the Supplement indicates that during these periods, winds were from the northeast (Fig. S7), i.e., the direction where Paphos International Airport is located. This is highly suggestive of the airport being the origin of the observed ultrafine particles and NOx. Figure 6 shows the comparison of medians of PNSDs observed during airport-affected (PNSDa) and non-affected time periods. The error bars indicate the range between the 25 % and 75 % percentiles. It is clearly seen that airport-affected PNSDa exhibit a very pronounced ultrafine particle mode with a maximum at diameters of about 15 nm. Such a mode is indicative of a nearby particle source, such as the combustion of fuel at the airport. Previous studies found that airport-emitted particles featured similar PNSDs (Hudda and Fruin, 2016; Jasinski and Przylebska, 2018). Therefore, in the following, time periods affected by pollution from the airport were excluded from further analysis. The pollution-free median PNSD (black line in Fig. 6) features clear Atiken, accumulation, and coarse modes, with the Hoppel minimum (Hoppel et al., 1986) being located at approximately 80 nm.
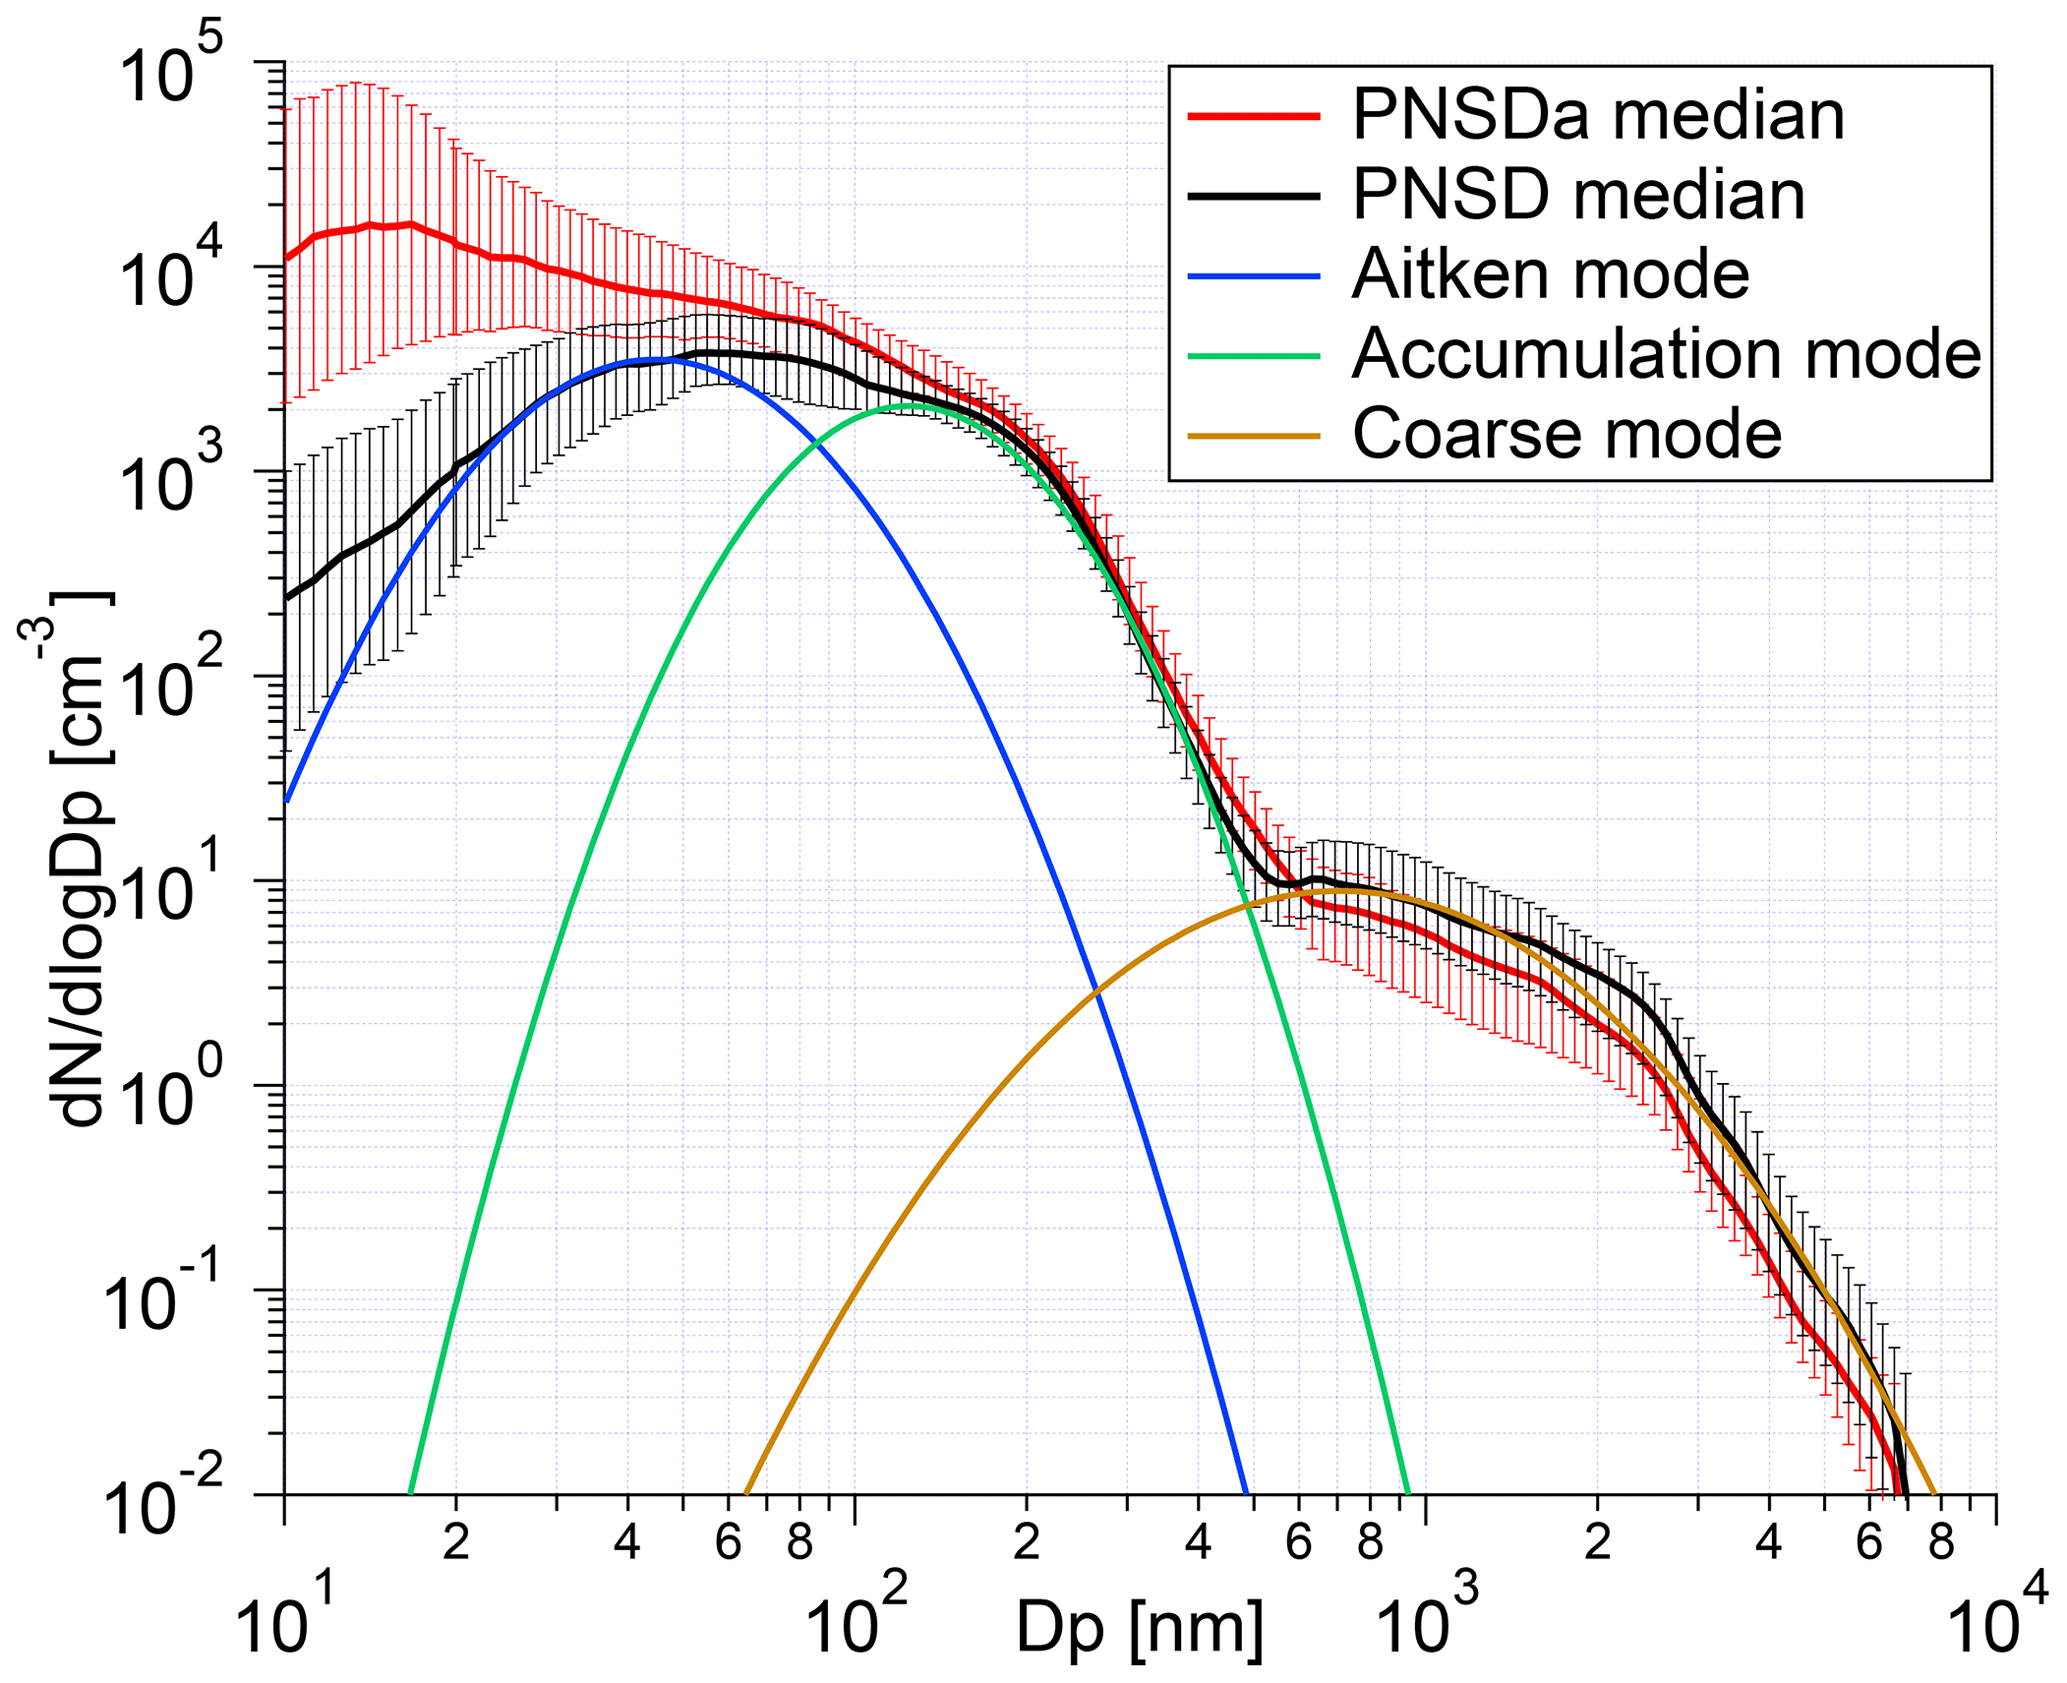
Figure 6Comparison of the median PNSD during airport-affected (red line) and non-affected (black line) time periods. The error bar indicates the range between the 25 % and 75 % percentiles. Aitken, accumulation, and coarse modes are fitted with log-normal distribution, displayed in blue, green, and brown lines, respectively.
Based on the criteria reported by Dal Maso et al. (2005), we identified several NPF and growth events during the campaign. The criteria are, first of all, the appearance of a distinct new mode (in the nucleation mode size range) in the size distribution. Secondly, the mode must prevail over a time span of hours. Lastly, the new mode must show signs of growth. For example, newly formed particles occurred at 07:00 UTC, 5 April, 08:00 UTC, 12 April, and 07:00 UTC, 22 April, with subsequent particle growth in the next few hours up to days. All observed NPF started during daytime, suggesting that photochemistry products were likely to contribute to the formation of the new particles. The NPF events, which occurred at 07:00 UTC, 5 April and 07:00 UTC, 22 April, featured continuous particle growth up to several tens of nanometers. The NPF event occurring at 08:00 UTC, 12 April exhibits a more complicated time evolution. Around 15:30 UCT, 12 April, the PNSDs were affected by pollution from the airport due to the wind direction shifting to the northeast. Around 00:00 UTC, 13 April, the wind speed increased and wind directions were from the clean ocean; i.e., clean air mass weakened the particle growth process. Later on, i.e., at 01:00 UTC, 14 April, precipitation occurred. This influenced the evolution of the NPF and growth event, but the growing trend in particle size is still to be seen. The observed particle growth events show that newly formed particles can grow up to sizes where they can act as CCN. However, there are several more NPF and growth events which we do not discuss here, because particles did not grow up to sizes making them potential CCN.
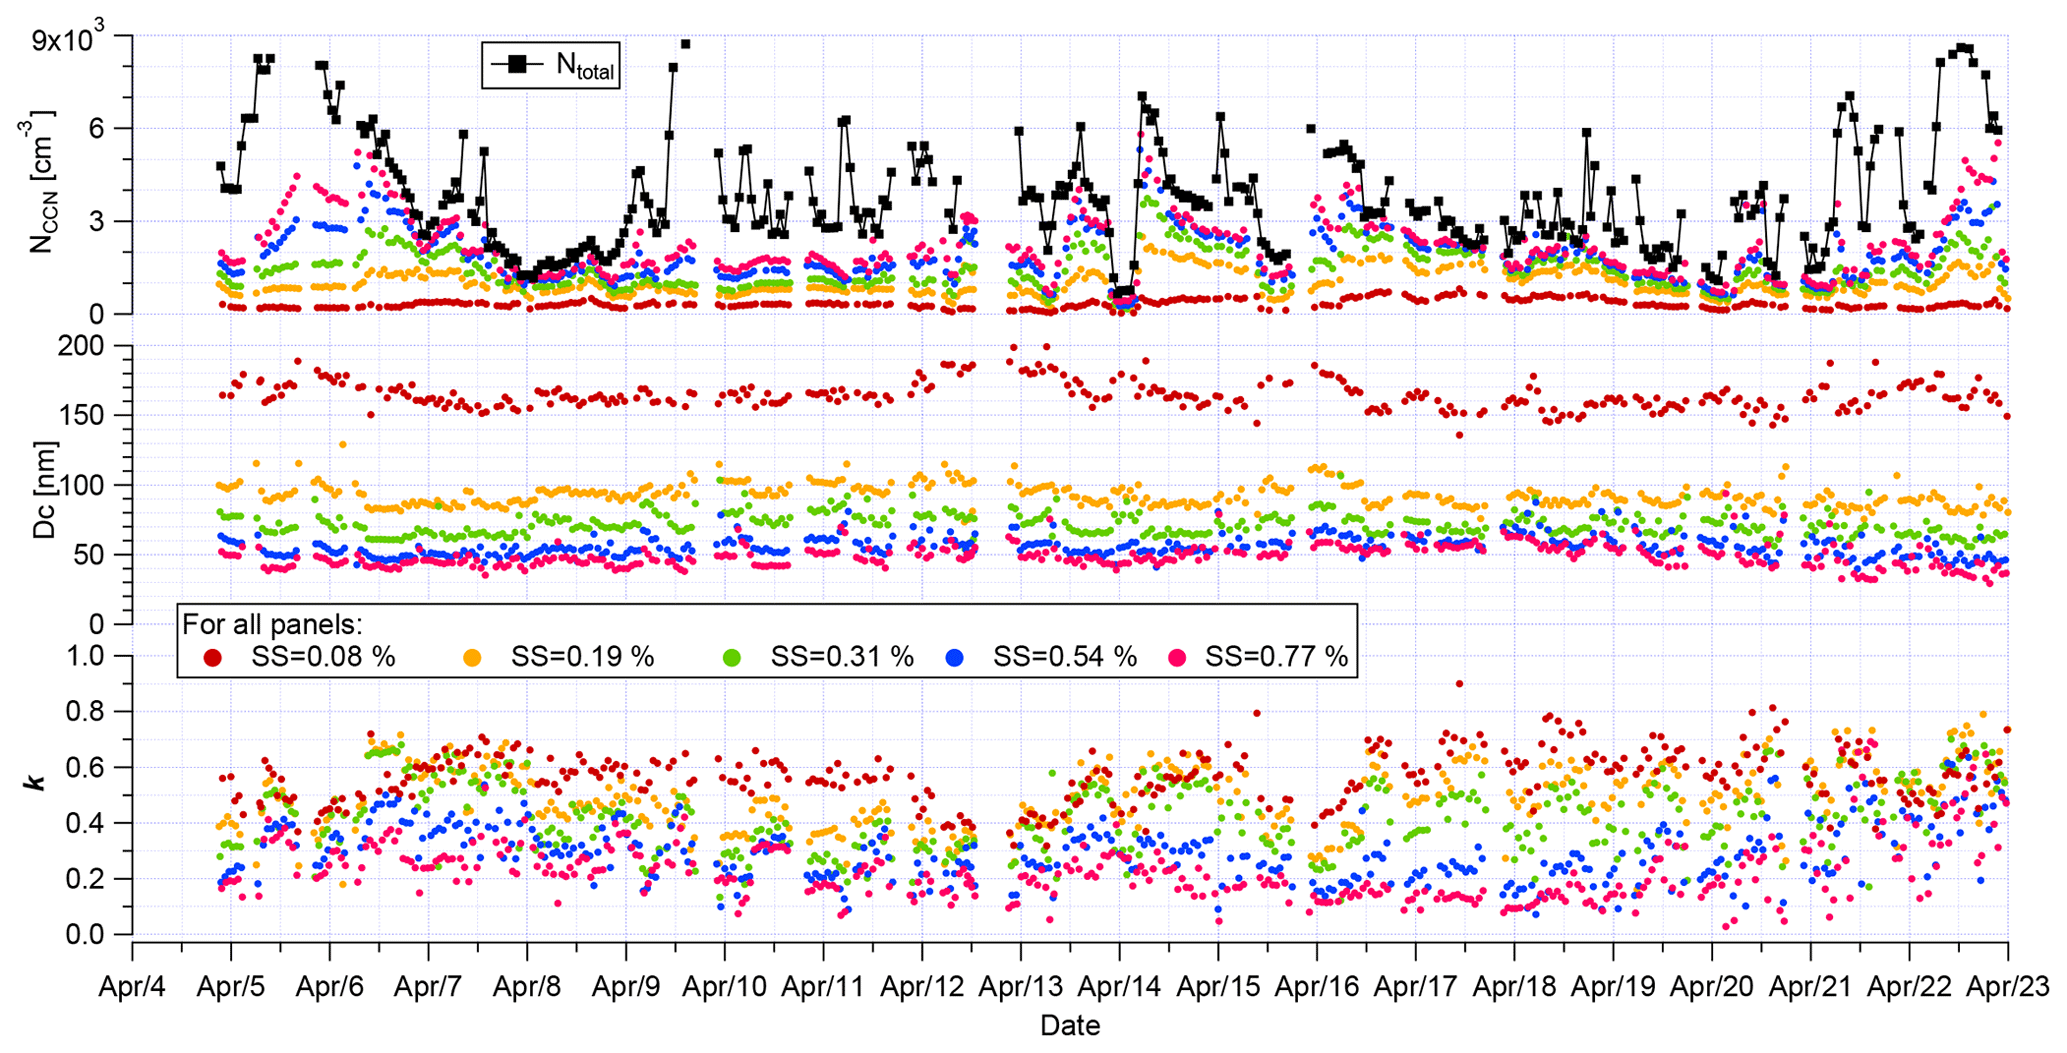
Figure 7Time series of Ntotal, NCCN, the inferred dcrit, and κ values at different supersaturations.
3.3 CCN and particle hygroscopicity
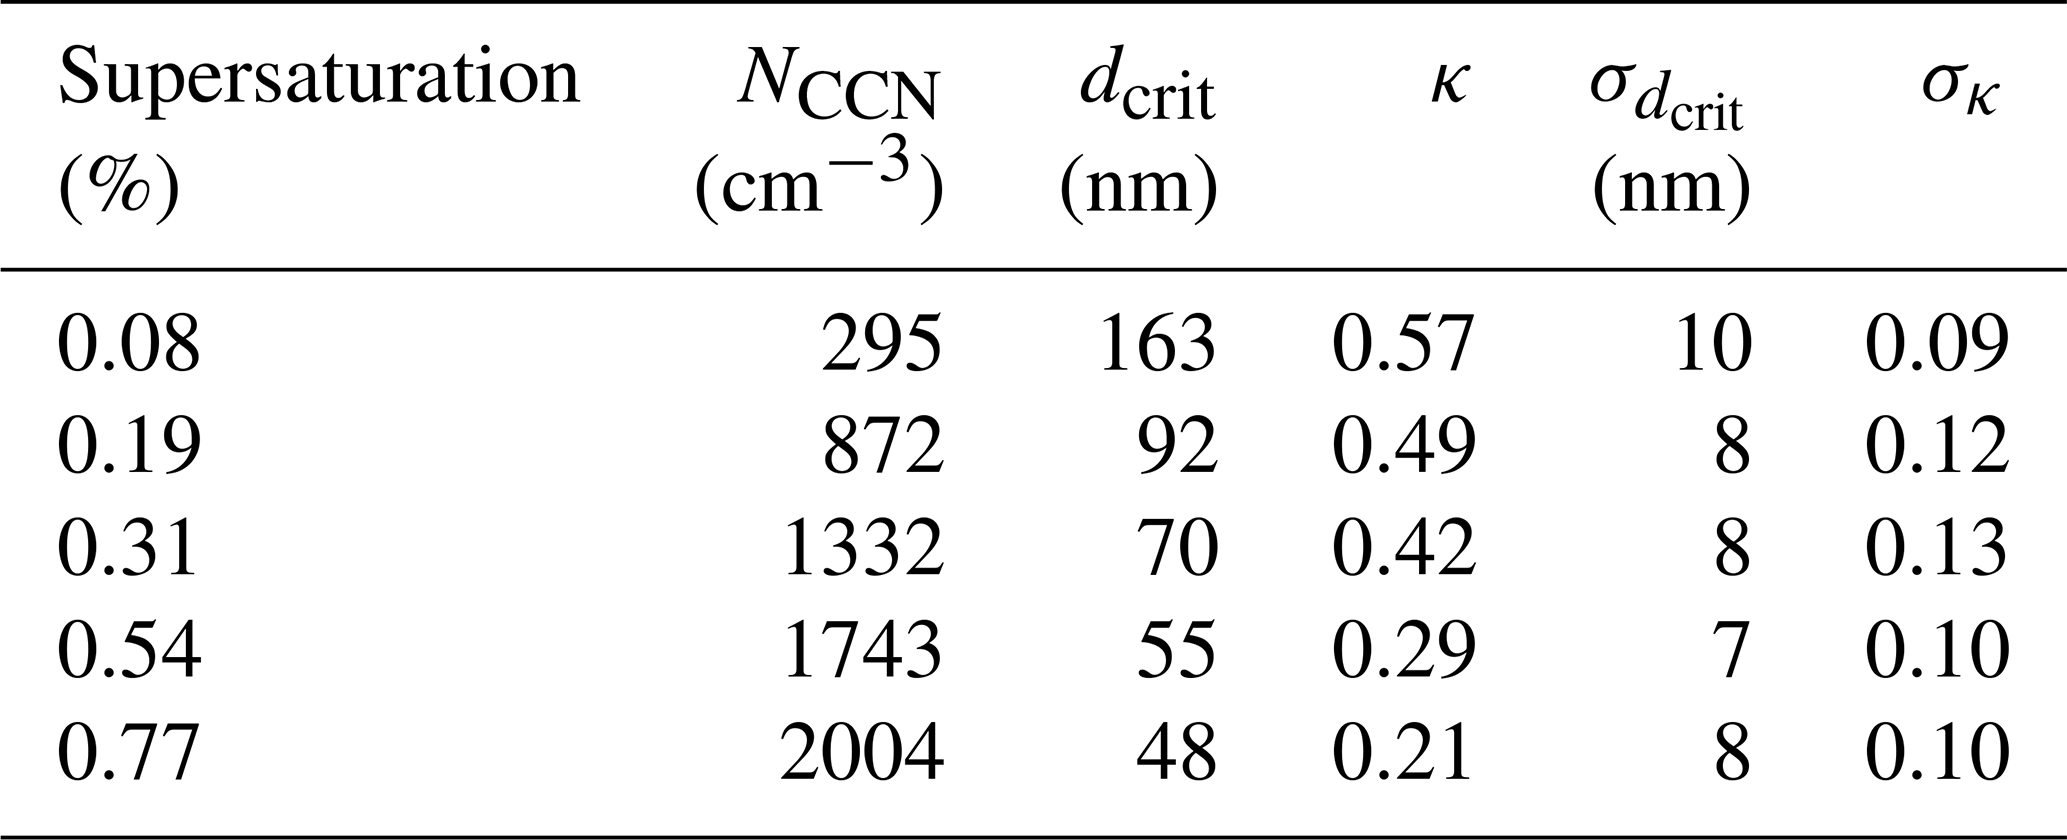
Figure 7 shows time series of Ntotal and NCCN (corrected with particle losses) in the upper panel, dcrit in the middle panel, and κ in the lower panel. NCCN exhibit large variability throughout the campaign, including a few remarkably elevated concentrations (maximum value ∼3730 cm−3 at supersaturation of 0.31 %), and one exceptionally low concentration (minimum value ∼170 cm−3 at supersaturation of 0.31 %). The median values of NCCN at different supersaturations are given in Table 1 and vary from 295 cm−3 for a supersaturation of 0.08 % to 2004 cm−3 for a supersaturation of 0.77 %.
Table 1Median values of NCCN, dcrit, κ, and 1 standard deviation of dcrit and κ at different supersaturations.
The low NCCN around 03:00 UTC, 14 April were associated with precipitation, as can be seen in Fig. 2. Most of the time, high NCCN are associated with NPF and growth events. For example, around 09:00 UTC, 5 April, NCCN at higher supersaturations (0.54 % and 0.77 %) started to increase. The NCCN at lower supersaturations (0.19 % and 0.31 %) followed at 04:00 UTC, 6 April. However, NCCN at the lowest supersaturation (corresponding to the dcrit around 163 nm) did not increase in connection with the NPF and growth event. Newly formed particles did not grow into that size range; i.e., NCCN at the lowest supersaturation was not affected. The same behavior was observed from 08:00 UTC, 22 April to 00:00 UTC, 23 April. From 13 to 14 April, the NPF and growth were affected by changing wind directions and precipitation. NCCN also show respective influences, but the overall trend still can be seen.
The probability density functions (PDFs) of NCCN at different supersaturations are shown in the upper panel of Fig. 8. As discussed, NCCN at the lowest supersaturation was not affected by the NPF and growth events, so a unimodal PDF was observed. However, the PDFs of NCCN at other supersaturations are bimodal, with the larger mode (higher concentrations) representing the NPF and growth events. Kalivitis et al. (2015) also found that CCN production resulted from NPF in the eastern Mediterranean during the summertime. The small modes (lower concentrations) of the PDFs are representative of the time periods without NPF and growth events.
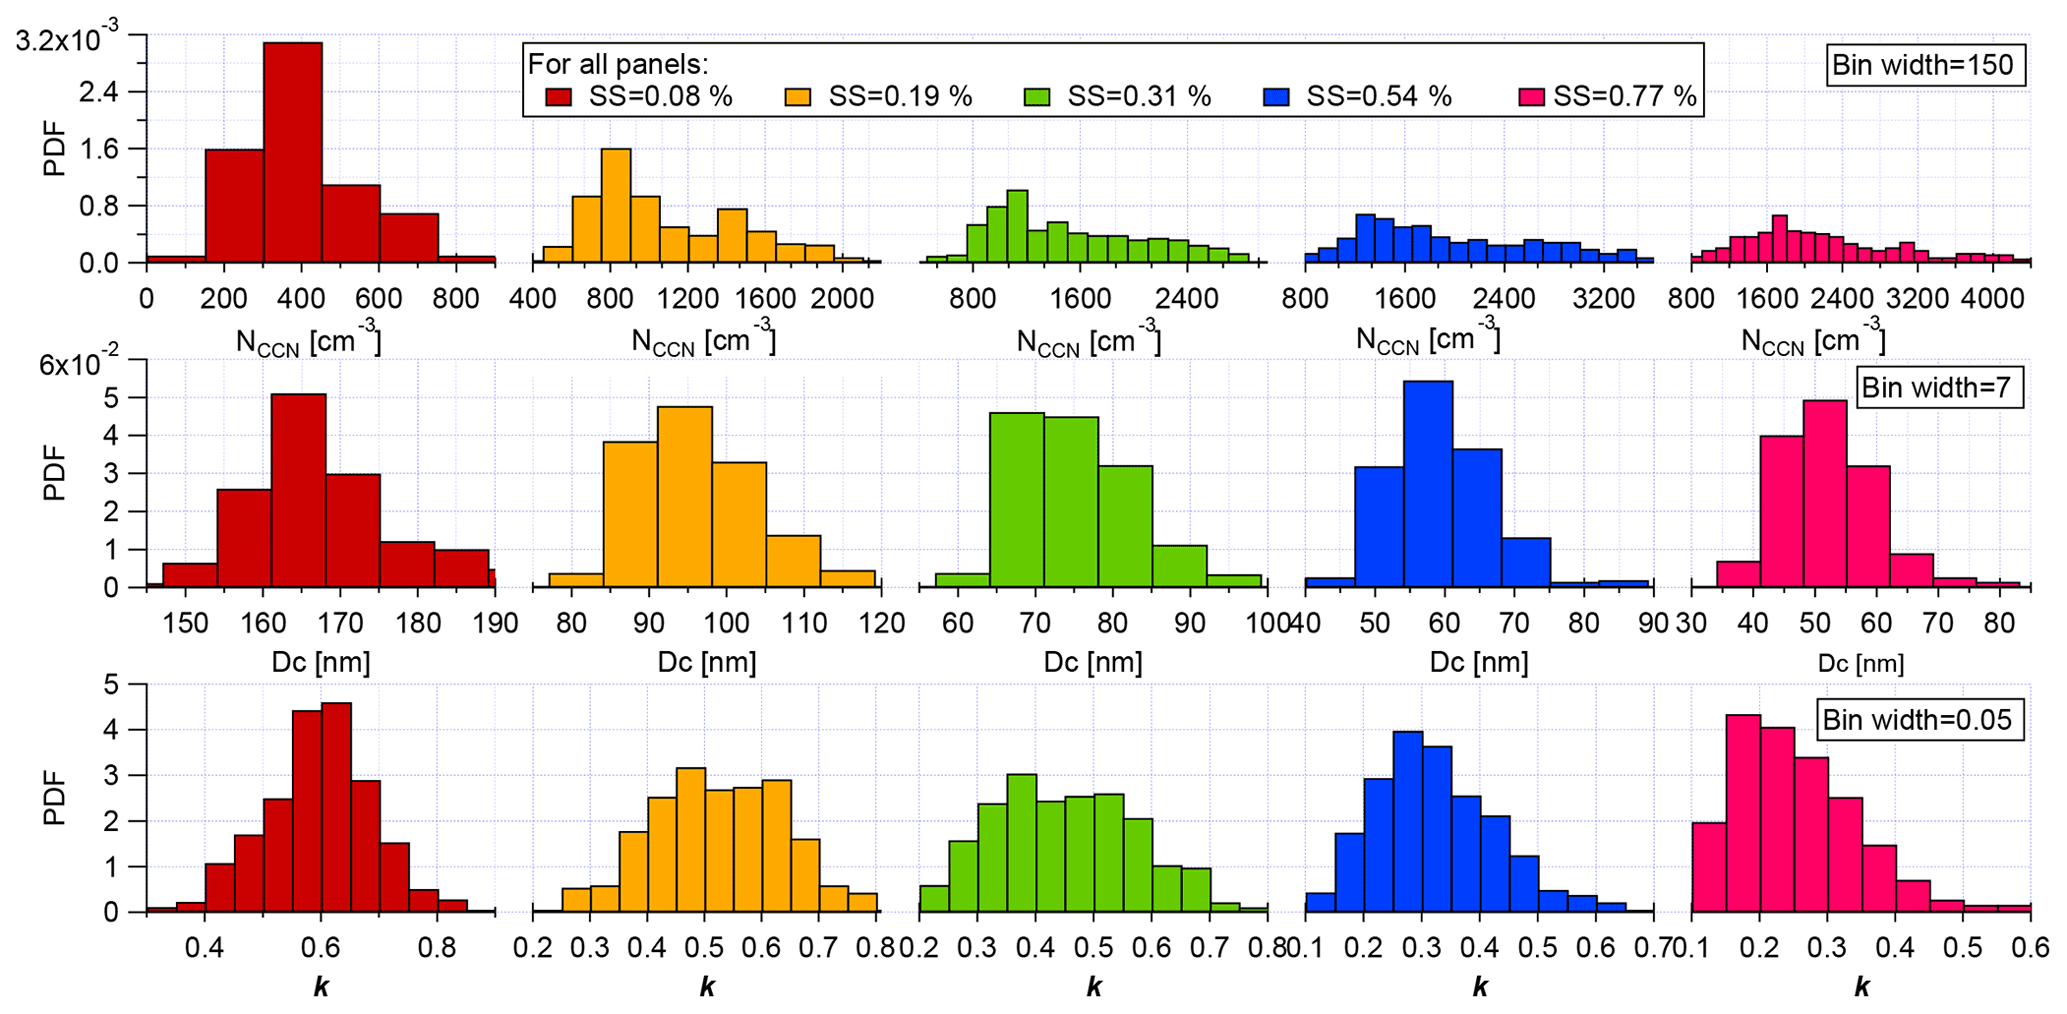
The dcrit at different supersaturations were almost constant throughout the campaign, even during the NPF events. The PDFs of dcrit are unimodal, as shown in Fig. 8. The dcrit at different supersaturations and the standard deviations of their PDFs are included in Table 1. For the supersaturations of 0.77 % and 0.54 %, the dcrit were below 60 nm, i.e., inside the Aitken mode. However, for the lowest supersaturation of 0.08 %, dcrit is located in the accumulation mode. Consequently, hygroscopicities derived at these supersaturations can be assumed to be representative of the Aitken (at supersaturations of 0.77 % and 0.54 %) and accumulation (at a supersaturation of 0.08 %) modes, respectively.
The particle hygroscopicity, expressed as κ, can be seen as a measure for average particle chemical composition. Time series of calculated κ values are depicted in the lower panel of Fig. 7. The κ values at different supersaturations show little variability over time, with 1 standard deviation from 0.09 to 0.13; i.e., there is no clear trend in κ over time during the campaign. At the supersaturations of 0.54 % and 0.77 %, corresponding to dcrit of 40±8 and 55±7 nm (median±1 standard deviation), the medians of κ are 0.21±0.10 and 0.29±0.10, respectively. These low κ values in Aitken mode suggest the presence of organic material, which has also been observed in previous studies (Kalivitis et al., 2015; Kristensen et al., 2016). At the lowest supersaturation of 0.08 %, corresponding to the dcrit of 163±10 nm, the median of κ is 0.57±0.09. Particles in this size range are members of the accumulation mode and have undergone cloud processing and aging. This results in higher amounts of sulfates being present, and consequently higher hygroscopicities. A few sea salt particles mixed with organic carbon might also be present in the accumulation mode, according to a previous study (Prather et al., 2013). But the absolute number concentration of sea salt mixed with organic carbon particles in the size range <200 nm is likely limited. A clear downward trend of κ is observed with increasing supersaturations and decreasing dcrit (Fig. 9). The κ values in the Aitken and accumulation modes are clearly different, with the error bars considered, indicating significant differences in particle chemical composition for the two modes.
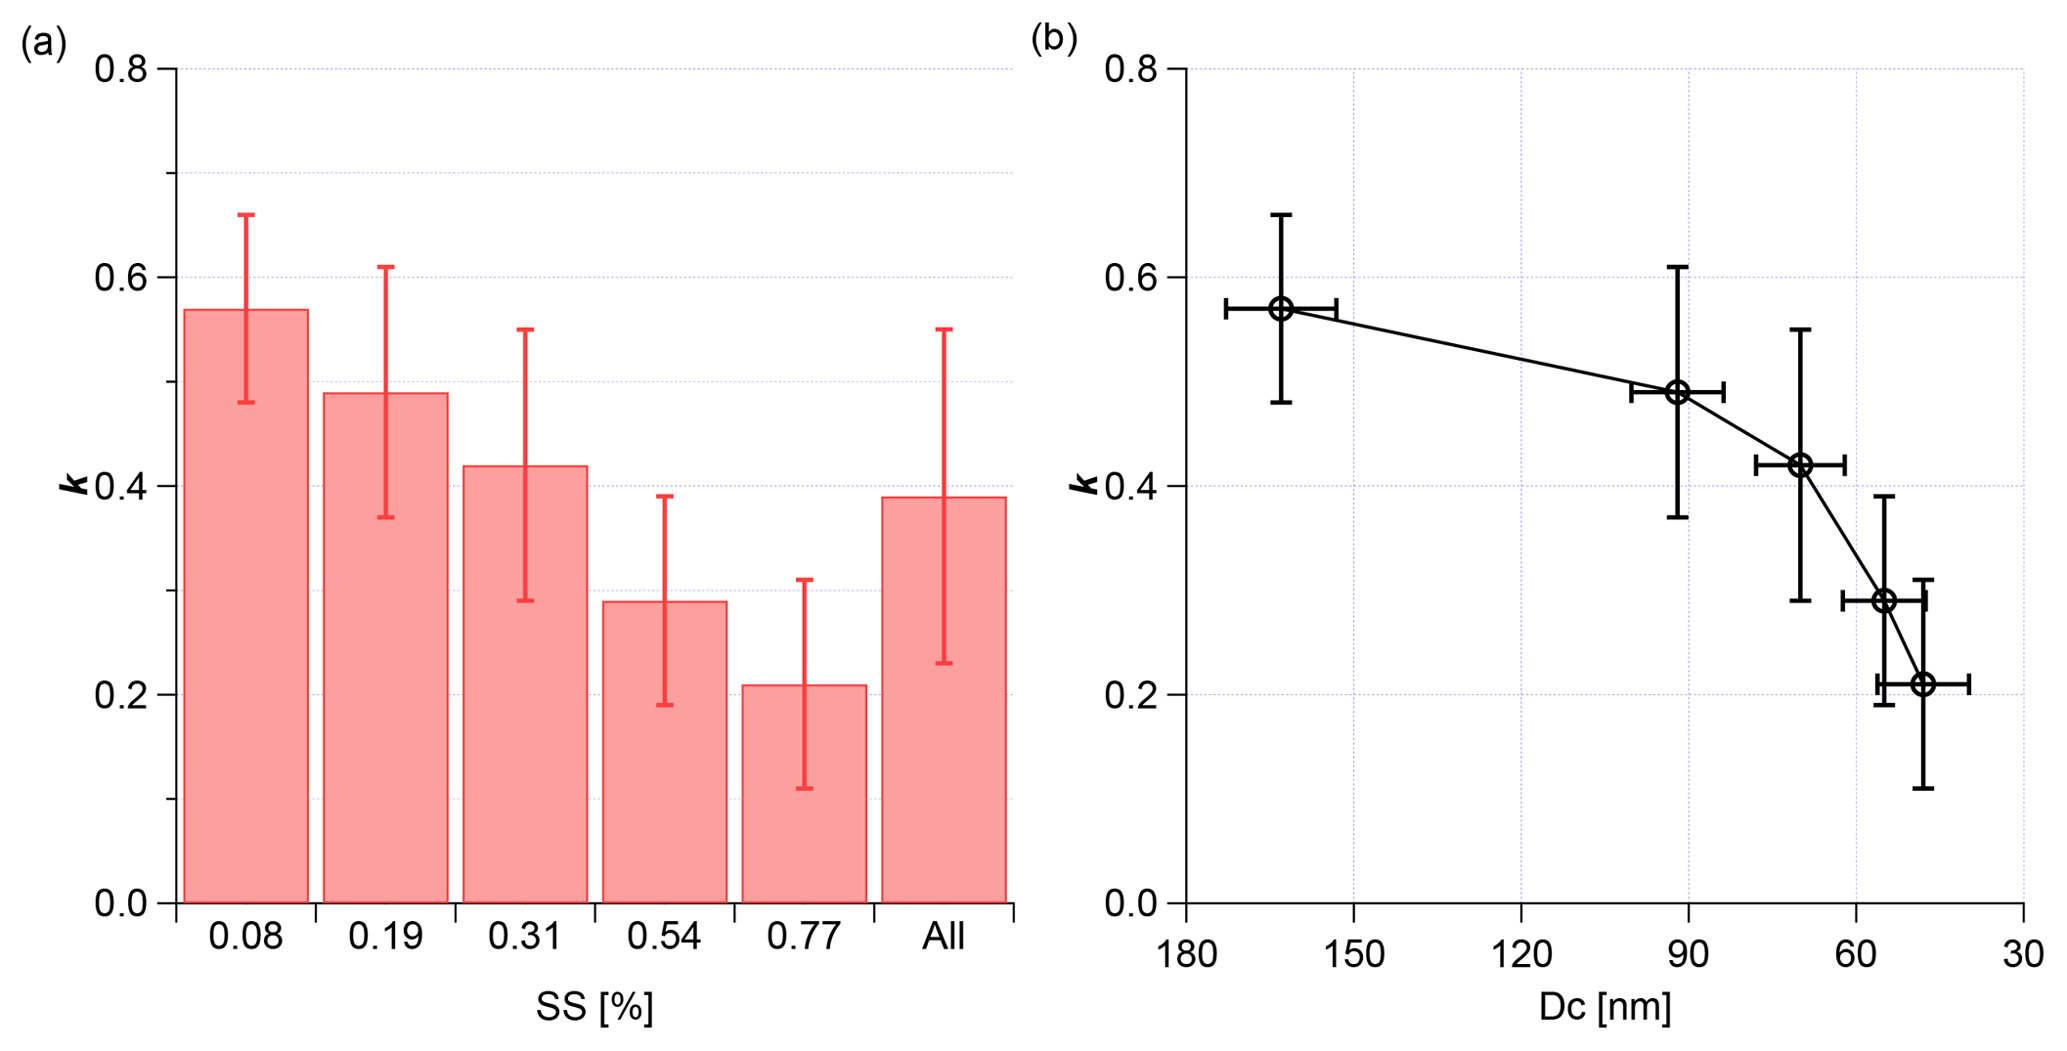
Figure 9(a) Derived κ values at different supersaturations. (b) κ values as a function of the corresponding dcrit. Error bar represents the 1 standard deviation.
The PDFs of κ change from unimodal to bimodal to unimodal with decreasing supersaturation. As mentioned above, the κ values at supersaturations of 0.77 % and 0.54 % are representative for the Aitken mode particles, while the κ values at supersaturation of 0.08 % are a measure for the accumulation mode particles. Therefore, the κ values at these supersaturations feature unimodal distributions. κ at supersaturations of 0.31 % and 0.19 %, corresponding to dcrit of 92±8 and 70±8 nm, respectively, exhibit bimodal distributions. These κ values are influenced by both Aitken and accumulation mode particles, indicating an external mixture of particles in that size range.
The determined particle hygroscopicities confirm those given in previous studies. For example, Kalivitis et al. (2015) reported that κ values in the Aitken mode were 0.20–0.40 lower than those in the accumulation mode during the NPF events in the eastern Mediterranean, and highlighted NPF as a source of CCN. Pringle et al. (2010) used an atmospheric chemistry model to derive global distributions of effective particle hygroscopicity κ. The annual mean value at the surface of the eastern Mediterranean was roughly 0.45, with an annual cycle ranging from 0.35 in December to 0.50 in February. For April, the period of this study, a value of 0.40 was reported, which is consistent with what we obtained (κ=0.39) for this campaign.
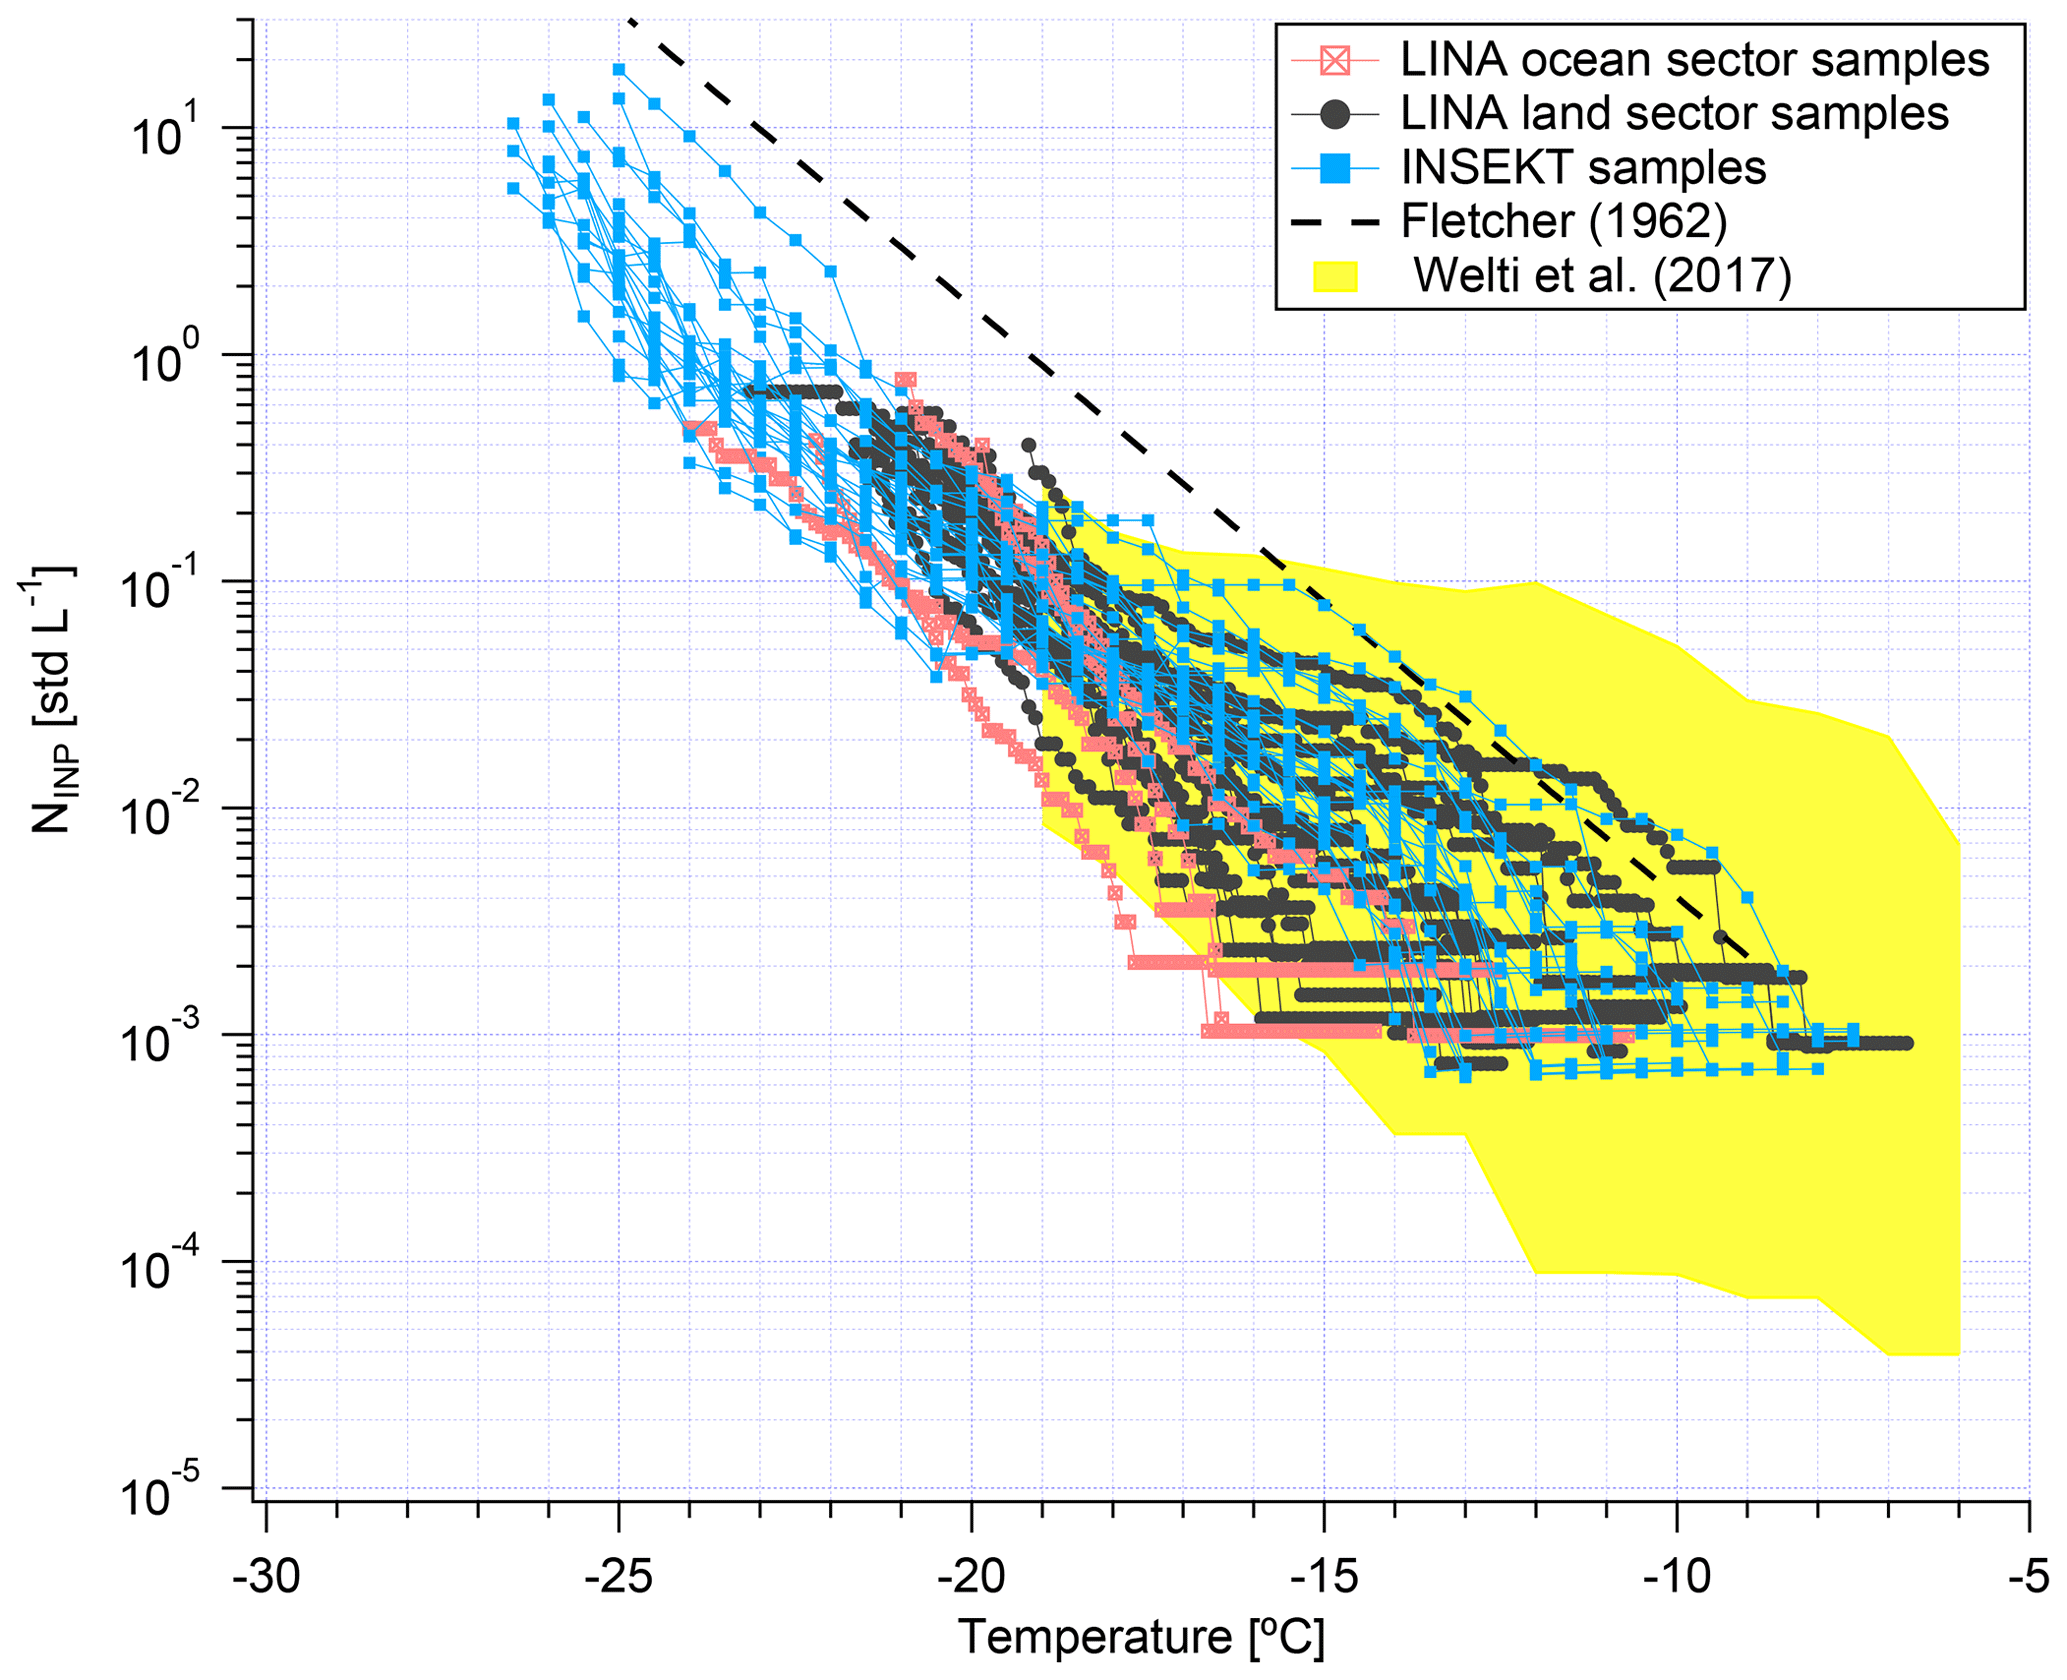
Figure 10NINP (measured by LINA and INSEKT) as a function of temperature. Parameterization from Fletcher (1962) in the valid temperature range is given for comparison, as shown in dashed line. The yellow shadow represents the measured NINP from a ground-based station at CVAO (Welti et al., 2018).
3.4 Ice-nucleating particles
3.4.1 Temperature spectra of cumulative NINP
Ice fractions (fice) as determined with both LINA and INSEKT are shown in Fig. S8. The corresponding NINP from both instruments are shown in Fig. 10 as a function of temperature. Samples collected from the land and ocean sectors (measured by LINA) are represented by black circles and red rectangles, respectively. These filter samples were all active at −16 ∘C and the highest freezing temperature was found to be −6.5 ∘C. Samples collected during daytime (measured by INSEKT) are represented by blue rectangles. With two or three dilution steps, by measuring suspensions with different aerosol concentrations, the INSEKT measurements cover a larger temperature range from −7.5 to −26.5 ∘C. The measurement uncertainty for both instruments is shown in Fig. S9. As mentioned in the experimental section, filters examined with LINA were switched according to the wind direction. From Fig. 10, it is obvious that there is no very pronounced difference in NINP between the land and ocean sectors. It is, however, noticeable that the freezing curves from the ocean sector are rather at the lower end of the measured curves. To test whether there was a pronounced contribution to INP from the land sector, we examined the INSEKT data in more depth. Figure S10 shows the NINP from the INSEKT measurements in dependence on the fraction of time sampled from the ocean sector. No clear trend was found. A source apportionment for INP examined in this study is therefore difficult to do. Considering that Cyprus is only a small island surrounded by the Mediterranean Sea, its effect might be limited. Besides, for a location such as Cyprus, it is difficult to determine sources for different air masses only based on wind direction alone.
The measured NINP in this study are within the NINP range presented by Welti et al. (2018), who characterized INP sampled at the Cape Verde Atmospheric Observatory (CVAO) over a time period of 4 years (shown in Fig. 10 as yellow shadow). This is surprising as those atmospheric aerosols at CVAO and Cyprus should be expected to be different. It might, however, point towards a similar background of INP worldwide. NINP are lower than those proposed in Fletcher (1962), while the slope is similar to that of the Fletcher (1962) line. NINP increased exponentially from −10 to −25 ∘C, indicating the presence of a broad variety of INP, featuring, e.g., different size, composition, and ice active surface sites.
NINP at a particular temperature span about 1 order of magnitude below −20 ∘C and about 2 orders of magnitude at the warmer temperatures ( ∘C). This is consistent with the previous study of O'Sullivan et al. (2018), who carried out field measurement in northwestern Europe. Few samples (LINA sample05, 20, 22 and INSEKT sample01, 06, 12, 13, 19, 28) showed elevated concentrations at temperatures above −15 ∘C. Biological particles (e.g., bacteria, fungal spores, pollen, viruses, and plant fragments) usually contributed to the INP at these moderate supercooling temperatures (Kanji et al., 2017; O'Sullivan et al., 2018). These high signals observed in both instruments might have been caused by biogenic INP, originating from Cyprus, as such high signals did not occur for the four samples from the ocean sector. However, as there are only four samples from the ocean sector, and as no additional tests were possible with the limited amount of sampled material, it should suffice to express this hypothesis here.
Overall, NINP of the land samples are not clearly different from those of the ocean samples, besides for some samples at ∘C for which a biogenic contribution is expected. Therefore, a contribution of INP from pollution from the airport is not expected. This would be in line with Chen et al. (2018), who found that aerosol in Beijing did not contain higher NINP during strong pollution events, compared with clean phases.
3.4.2 Time series and PDFs
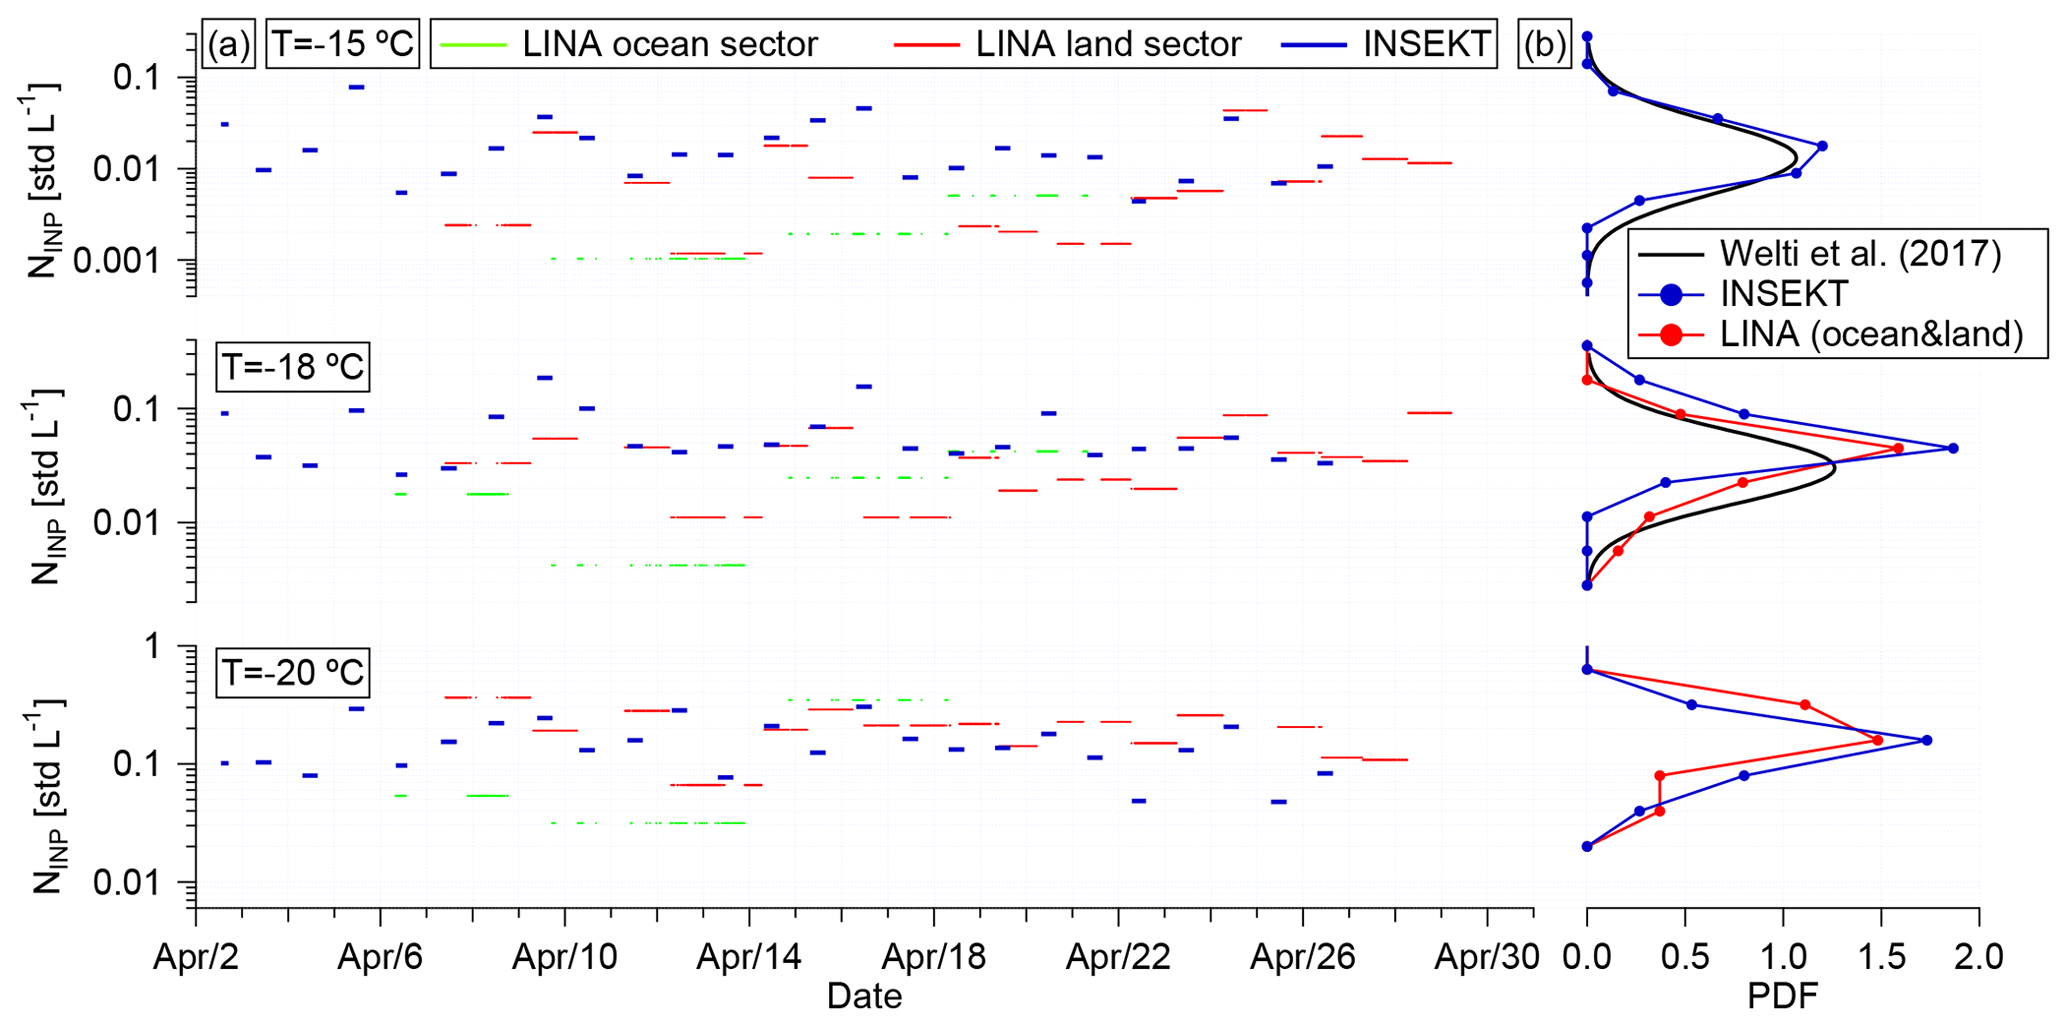
Figure 11a shows the time series of NINP during the campaign. Here we present NINP derived from LINA (ocean sector in green and land sector in red) and INSEKT (in blue) measurements at −15, −18, and −20 ∘C. NINP varied from 0.001 to 0.1, 0.004 to 0.2, and 0.03 to 0.4 std L−1 at −15, −18, and −20 ∘C, respectively. NINP varies non-synchronously at different temperatures. Here we compared data from different temperatures with each other and determined a regression line between them. Taking, e.g., the results from the LINA measurements, the coefficients of determination (R2) are 0.45, 0.26, and 0.0033 for −15 to −18, −18 to −20, and −15 to −20 ∘C, indicating the different natures and origins of the INP active at different temperatures.
Welti et al. (2018) found that log-normal distributions best approximate the measured variability in concentrations at each individual temperature. Here we used two methods to test our NINP frequency distributions, which are both described in more detail in the Supplement. Both methods indicate that the INP distributions at −15, −18, and −20 ∘C are indeed log-normally distributed. This analysis was only done for these temperatures, as only in this temperature range did almost all samples contribute data. As log-normally distributed NINP are indicative of the observed INP population having undergone a series of random dilutions while being transported (Welti et al., 2018), the performed tests yield proof of the INP (ice active at ∘C) sampled during our measurements originating from long-range transport rather than local sources, as the proximity of sources would cause a more strongly skewed frequency distribution (Ott, 1990; Welti et al., 2018).
Figure 11b depicts the PDFs of NINP at different temperatures. Thereby, a PDF is shown if at the particular temperature most of the investigated samples featured a quantifiable () freezing behavior. For example, there were three LINA-measured samples which did not freeze at −15 ∘C (fice=0); therefore, we do not show the PDF of LINA-measured NINP at −15 ∘C. At −20 ∘C the data from Welti et al. (2018) are omitted, because more than half of all the samples were fully frozen (fice=1). As can be seen from Fig. 11b, our results are comparable to those given in Welti et al. (2018) (black curves) derived from long-term measurement at CVAO. Note that it is not possible to directly compare the NINP measured by LINA and INSEKT, as they always had different sampling times and INSEKT always sampled air from all directions, whereas LINA got it from the different sectors separately. But in general, no systematic deviation can be seen, as can be seen when looking at the PDFs. To the best of our knowledge, the only in situ observations at −20 ∘C for supersaturated conditions (101 %) in the eastern Mediterranean were reported by Schrod et al. (2017) during a heavy dust plume at high altitude with 0.03 to 3 std L−1.
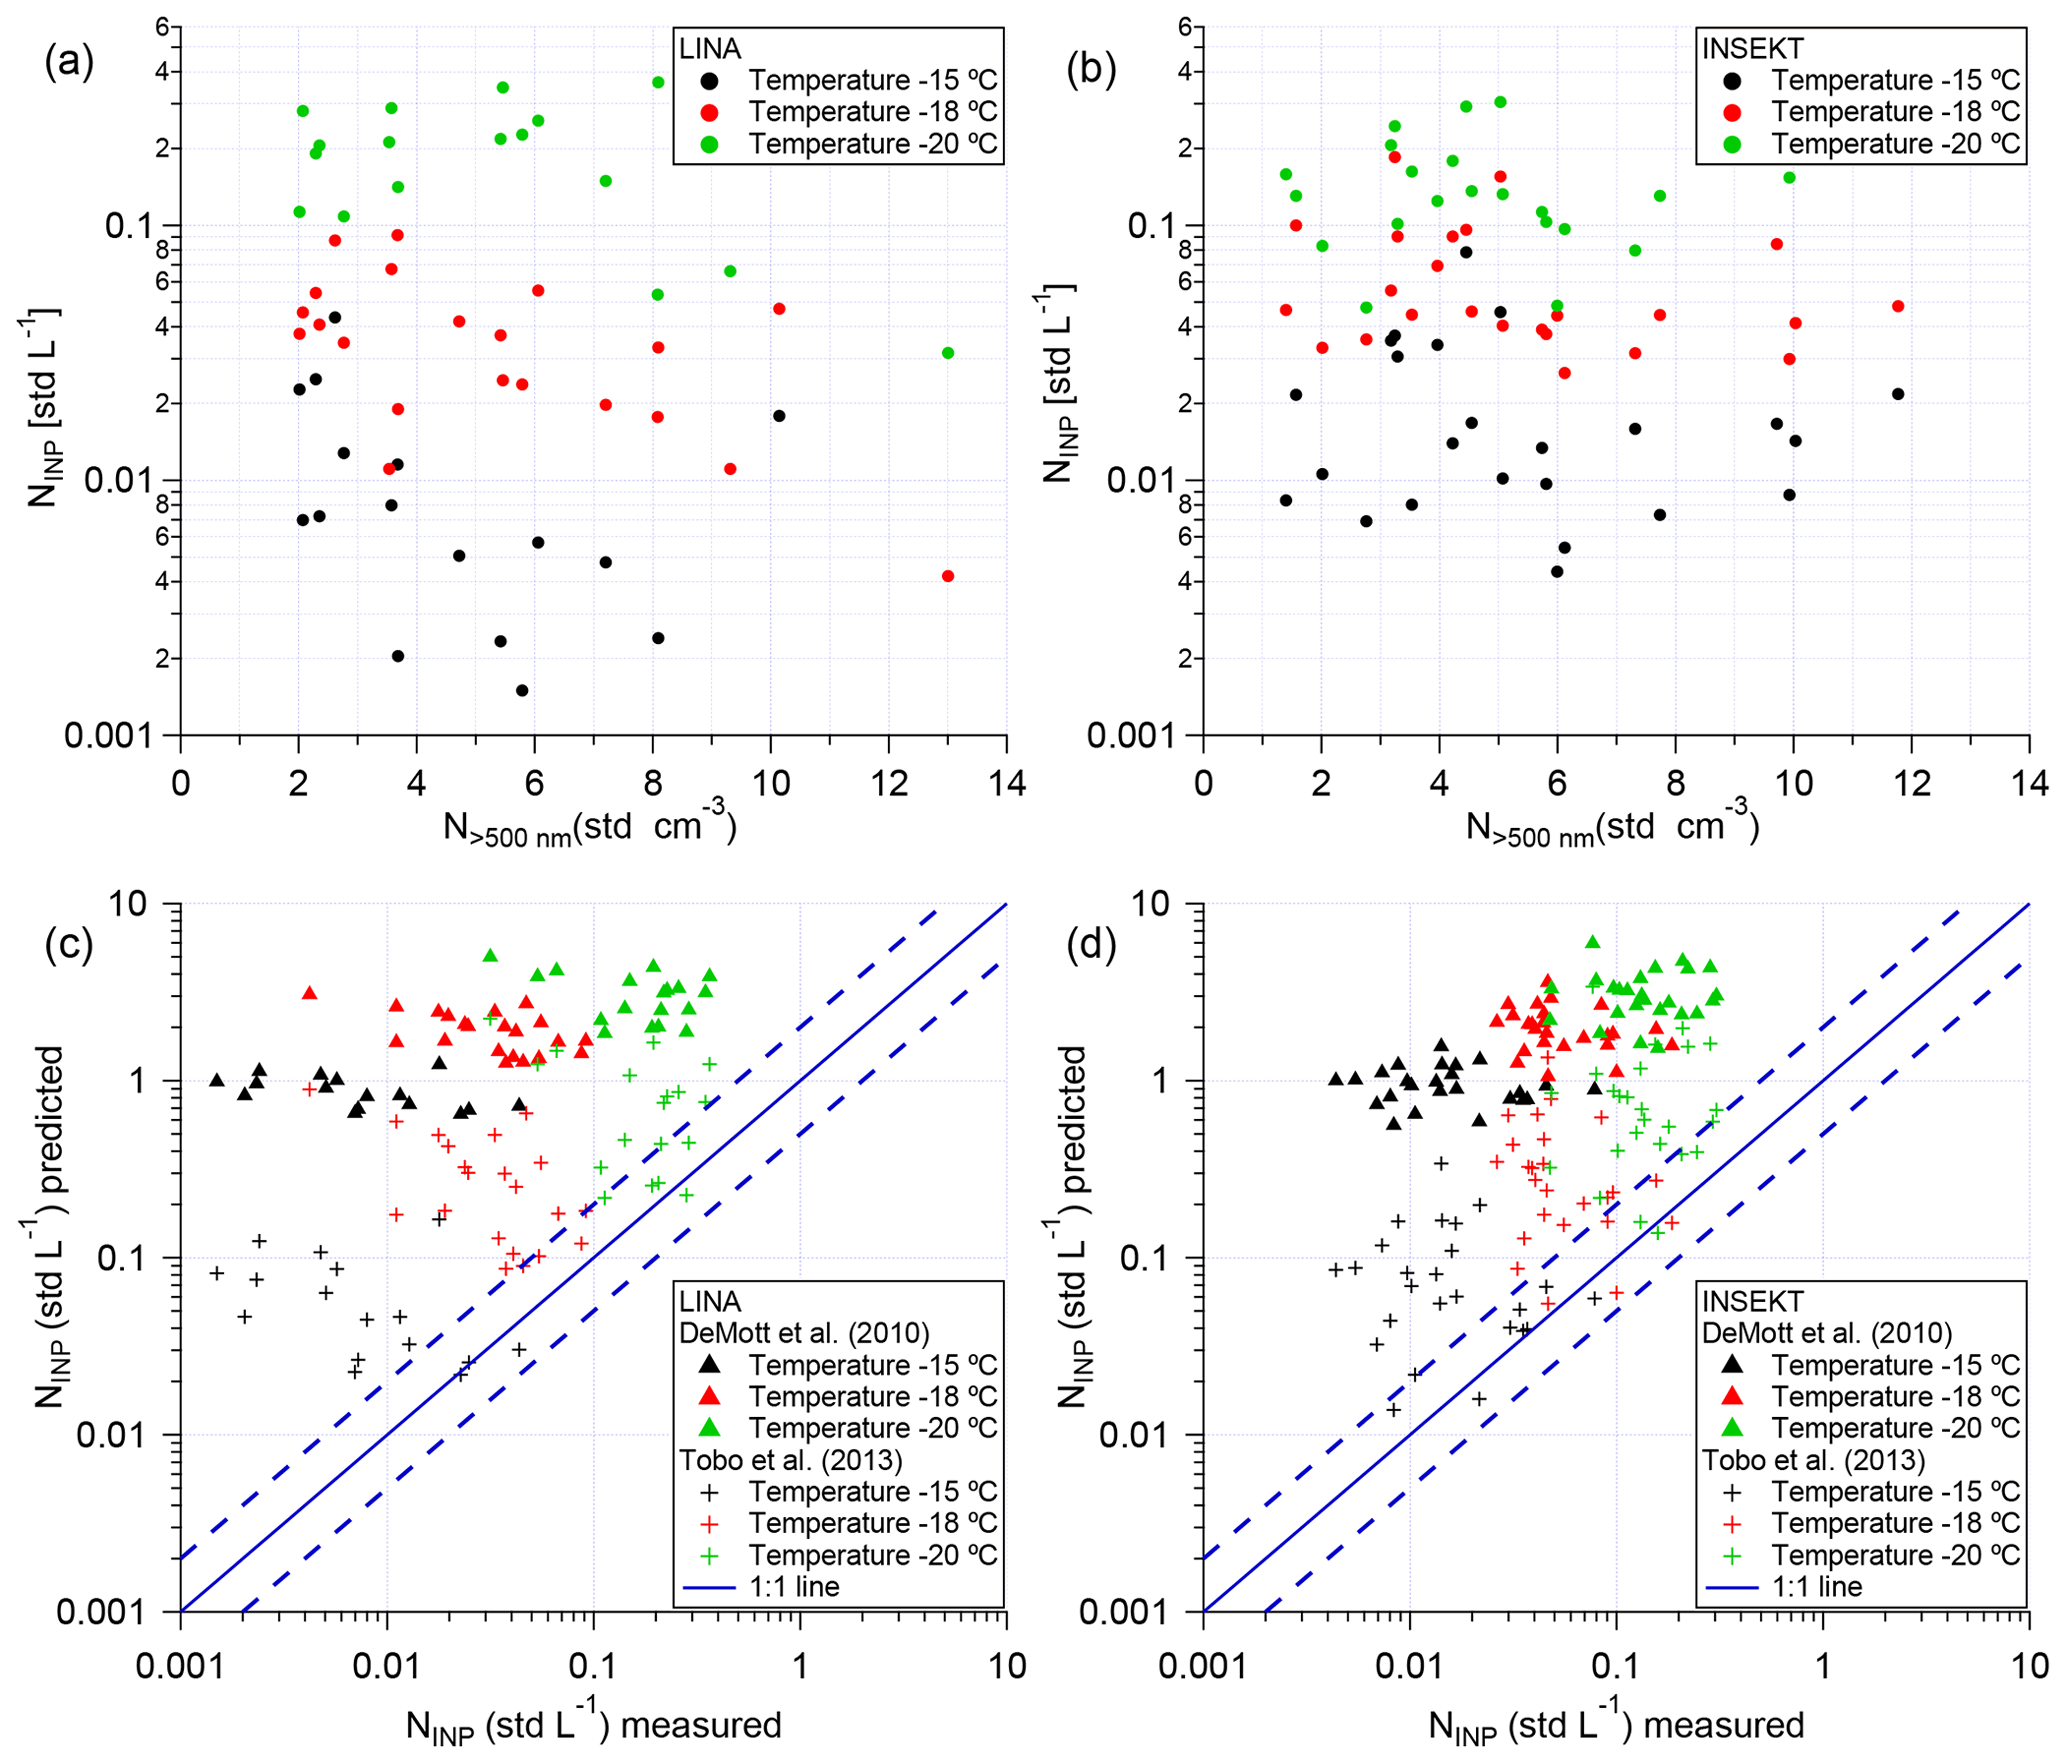
Figure 12Scatter plot of NINP measured by LINA (a) and INSEKT (b) against N>500 nm. Scatter plot of NINP measured by LINA (c) and INSEKT (d) against the NINP predicted by DeMott et al. (2010) and Tobo et al. (2013). The dashed lines outline a range of a factor of 2 about the 1:1 line (solid line).
3.4.3 Correlation of NINP with particle number/surface area concentration and parameterization
Scatter plots of LINA- and INSEKT-measured NINP at temperatures of −15, −18, and −20 ∘C against particle number concentration in the size range >500 nm (N>500 nm) are shown in Fig. 12a and b. The averaged N>500nm during each filter sample varied from 2 to 14 cm−3. The N>500 nm in this study is much lower than that observed during the dust plume period in Cyprus (maximum 75 cm−3 Schrod et al., 2017). The R2 between N>500 nm and NINP are shown in Table S4. The R2 were all below 0.25, indicating no correlation between NINP and N>500 nm.
Based on nine field studies occurring at a variety of locations over 14 years, DeMott et al. (2010) proposed a parameterization of the “global” average INP distribution. Besides, Tobo et al. (2013) present a similar parameterization method with adjusted coefficients to predict INP populations in a forest ecosystem. Figure 12c and d compare the NINP we measured with LINA and INSEKT to the predicted NINP on the basis of the DeMott et al. (2010) and Tobo et al. (2013) parameterizations. As can be seen, the DeMott et al. (2010) parameterization overestimates the observed values by about 2 orders of magnitude on average. The Tobo et al. (2013) parameterization can reproduce only 24 % and 25 % of the NINP measured by LINA and INSEKT within a factor of 2, respectively. The Tobo et al. (2013) parameterization overestimates the observed values by about 1 order of magnitude on average. This, together with NINP not being correlated with N>500 nm (see Table S4), indicates that the application of parameterizations in connection with measured particle number concentrations has to be done with extreme caution, as the encountered particle populations may significantly differ from those considered when developing the parameterizations.
Figure S12 shows the median particle surface area size distribution (PSSD) for the whole campaign (excluding the airport pollution events). Two different modes were observed, i.e., a small mode (20–500 nm) and a larger mode (500–7000 nm). Based on the PSSD, the concentrations for the total surface area of the small mode (S<500 nm), the large mode (S>500 nm), and for both modes combined (Sall) were calculated. The S<500 nm is about 4 times higher than S>500 nm. Scatter plots of LINA- and INSEKT-measured NINP against S<500 nm, S>500 nm, and Sall are shown in Fig. S13a and b. The R2 between NINP and particle surface area concentration are shown in Table S5. The R2 are all below 0.20, indicating no correlation between NINP and particle surface area concentration.
The ice-nucleating properties of aerosol particles may be characterized by its ice active surface site density (ns). The ns is a measure of how well an aerosol acts as a seed surface for ice nucleation. The ns can be calculated as
where S is the particle surface area concentration.
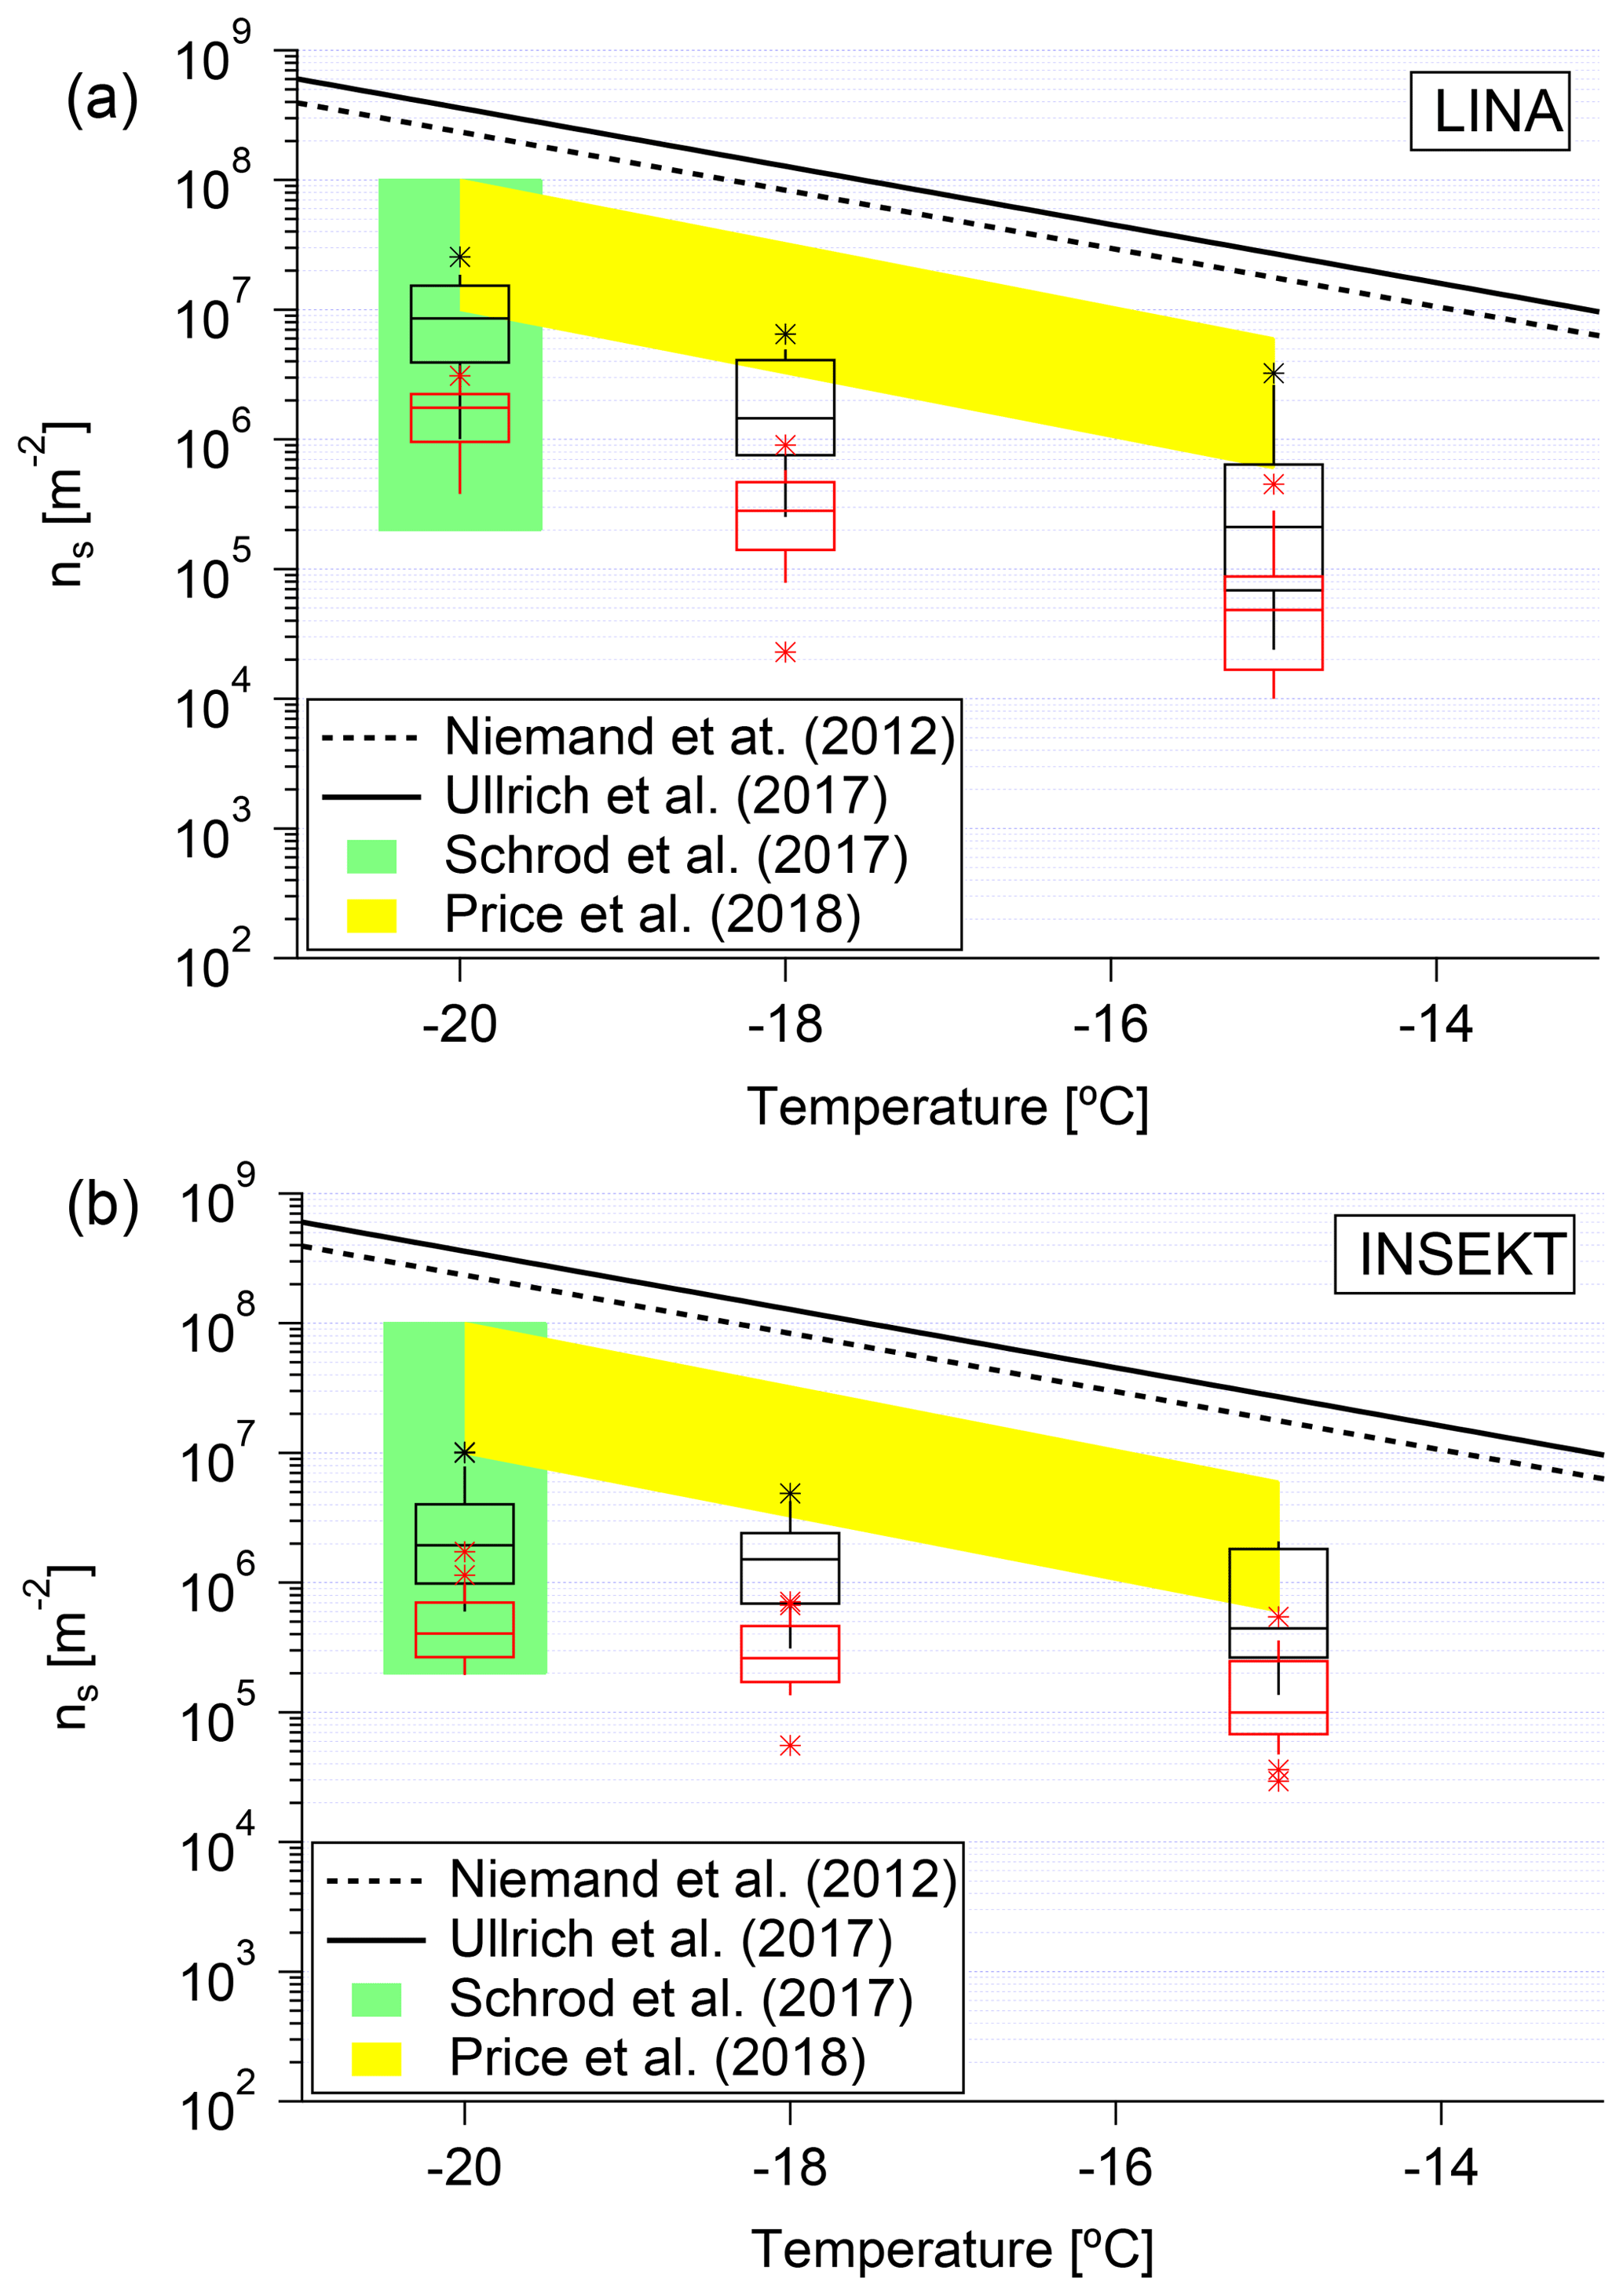
Figure 13ns>500 nm (black box plot) and ns_all (red box plot) as a function of temperature. The results were determined based on LINA-measured NINP in panel (a) and INSEKT-measured NINP in panel (b). The boxes represent the interquartile range. Data not included between the whiskers are plotted as an outlier with a star. Two ns parameterizations (Niemand et al., 2012; Ullrich et al., 2017) for desert dust are shown in dashed and solid line. We also compare this to recent data from airborne measurement by Schrod et al. (2017) and Price et al. (2018), as shown in green and yellow shadow, respectively.
Depending on which particle size range was investigated, previous studies calculated ns based on either the total surface area concentration (Sall) or on the surface area concentration of particles larger than 500 nm (S>500 nm). Here, both approaches were used, resulting in ns_all and ns>500 nm, respectively. Figure 13 shows the ns>500 nm as a black box plot and the ns_all as a red box plot at −15, −18, and −20 ∘C. As can be seen, ns increases towards lower temperature, which is expected. The ns results, calculated using LINA- and INSEKT-measured NINP, are shown in Fig. 13a and b, respectively. The ns values determined from LINA measurements are consistent with those from INSEKT measurements.
To the best of our knowledge, many studies dealt with the ns for dust aerosol particles, while no study investigated the ns for the type of polluted aerosol we encountered in the eastern Mediterranean. In the following, we compare our ns_all for the polluted aerosol on Cyprus, with ns_all based on existing parameterizations (Niemand et al., 2012; Ullrich et al., 2017) for dust aerosols (Fig. 13). However, the ns_all values from the parameterizations are more than 2 orders of magnitude larger than the ns_all found in this study. Price et al. (2018) carried out an airborne measurement in dust-laden air over the tropical Atlantic. The ns_all reported in Price et al. (2018) (shown in Fig. 13 as yellow shadow) is about 1 to 2 orders of magnitude higher than our results. Based on airborne measurement, Schrod et al. (2017) found that the ns>500 nm at Cyprus ranged between 105 and 108 m−2 at ∘C, RHwater=101 %, shown as green shadow in Fig. 13.
In short summary, parameterizations purely based on N>500 nm or particle surface area concentration in mineral-dust-dominated model systems overestimate the NINP of the polluted aerosol we encountered on Cyprus. Although we cannot clearly say to which extent the aerosol we observed was influenced by anthropogenic pollution, our results here fit to what was found in a different context, anthropogenically polluted air masses in Beijing (Chen et al., 2018), and is based on the fact that more strongly polluted air masses have larger numbers of particles in the size range above 500 nm than natural ones.
The A-LIFE campaign took place in April 2017 on the island of Cyprus to investigate the aerosols prevailing in the eastern Mediterranean region. As part of the A-LIFE campaign, ground-based measurements were carried out in Paphos, Cyprus, to characterize the abundance, properties (size distribution, hygroscopicity, ice activity), and sources of aerosol particles in general, CCN and INP in particular.
During these activities, NPF and growth events were observed. Following NPF, during some events, on timescales of a few hours to days, particles grew into the CCN size range. In fact, the highest observed NCCN were connected with NPF and growth events, which confirms the importance of NPF as a source of CCN in the eastern Mediterranean.
Usually, trimodal (Aitken, accumulation, coarse mode) PNSDs were observed. Aitken mode particles featured low hygroscopicities (κ values about 0.21 to 0.29), indicating the presence of organic materials. Accumulation mode particles featured higher κ values of about 0.57, indicating that particles in the accumulation mode underwent cloud processing and aging, resulting in higher amounts of sulfate being present. A few sea salt particles mixed with organic carbon might also be present in the accumulation mode. The super-micron particles were mainly from SSA and partly mineral dust.
PDFs of κ in both the Aitken and accumulation modes exhibit a unimodal structure, while the κ-PDFs for particle sizes close to the Hoppel minimum feature a bimodal shape. This indicates the presence of both non-cloud-processed (Aitken mode) and cloud-processed (accumulation mode) particles in the size range around the Hoppel minimum. The average observed κ of 0.39 confirms values found in previous field measurements (Kalivitis et al., 2015) and in model results (Pringle et al., 2010) for the Mediterranean region.
Atmospheric NINP were determined in the temperature range from −6.5 to −26.5 ∘C, using two freezing array type instruments (LINA, TROPOS, and INSEKT, KIT). NINP at a particular temperature span around 1 order of magnitude below −20 ∘C and about 2 orders of magnitude at warmer temperatures ( ∘C). Few samples showed elevated concentrations at temperatures ∘C, which suggests a significant contribution of biological particles to the INP population, which might have originated from Cyprus. No significant differences in NINP were found when selectively sampling wind directions from the land or sea sector for INP that were ice active in the temperature range between −15 and −20 ∘C. PDFs of NINP at a particular temperature follow log-normal distributions. For example, at −18 ∘C, the NINP ranged from 0.004 to 0.2 std L−1 during the campaign, which is consistent with the previous study of Welti et al. (2018). This indicates that these sampled INP which are ice active below −15 ∘C originate from long-range transport rather than local sources.
No correlations were found between NINP and N>500 nm. Parameterizations (DeMott et al., 2010; Tobo et al., 2013) based on N>500 nm were found to overestimate the NINP by about 1 to 2 orders of magnitude. There was also no correlation between NINP and particle surface area concentration. The ns for the polluted aerosol we encountered on Cyprus was found to be 1 to 3 orders of magnitude lower than the ns for dust aerosol particles resulting from previous studies (Niemand et al., 2012; Ullrich et al., 2017; Price et al., 2018). This clearly highlights that usage of such parameterizations just based on measured particle number or surface area size distributions is not always feasible for predicting NINP, as the parameterizations were derived for particular aerosol types. In other words, basing modeling efforts on, e.g., PDFs from observed NINP, rather than on parameterizations, might be the method of choice if the aerosol particle and/or INP composition are unknown.
The data will be available through the World Data Center PANGAEA (https://doi.pangaea.de/10.1594/PANGAEA.904758, Gong et al., 2019) in the near future. A link to the data can be found under this paper's assets tab on ACP's journal website.
The supplement related to this article is available online at: https://doi.org/10.5194/acp-19-10883-2019-supplement.
XG wrote the manuscript with contributions from HW, FS, KH, KK, TM, and AW. NM and TM performed particle number size distribution measurement and XG performed data evaluation. Chemical composition measurements and data evaluation were performed by KK. CCN measurements and data analysis were performed by XG. LINA measurements and data evaluation were performed by XG. INSEKT measurements and data evaluation were performed by BD, TS, KH, and XG. XG, HW, and FS discussed the results and did further analysis after the campaign. All the co-authors proofread and commented on the manuscript.
The authors declare that they have no conflict of interest.
The works were carried out in the framework of the A-LIFE project. This project has received funding from the European Research Council (ERC) under the European Union's Horizon 2020 research and innovation program under grant agreement no. 640458. We would like to thank Umar Javed from the Institute of Energy and Climate Research, Troposphere (IEK-8), and Anywhere Tsokankunku from the Max Planck Institute for Chemistry for providing the NOx data. Konrad Kandler is funded by the Deutsche Forschungsgemeinschaft (DFG, German Research Foundation) – 264907654, 264912134, 378741973, 416816480.
The publication of this article was funded by the Open Access Fund of the Leibniz Association.
This paper was edited by Pedro Jimenez-Guerrero and reviewed by two anonymous referees.
Agresti, A. and Coull, B. A.: Approximate is Better than “Exact” for Interval Estimation of Binomial Proportions, The American Statistician, 52, 119–126, https://doi.org/10.1080/00031305.1998.10480550, 1998. a
Bougiatioti, A., Nenes, A., Fountoukis, C., Kalivitis, N., Pandis, S. N., and Mihalopoulos, N.: Size-resolved CCN distributions and activation kinetics of aged continental and marine aerosol, Atmos. Chem. Phys., 11, 8791–8808, https://doi.org/10.5194/acp-11-8791-2011, 2011. a
Bougiatioti, A., Zarmpas, P., Koulouri, E., Antoniou, M., Theodosi, C., Kouvarakis, G., Saarikoski, S., Mäkelä, T., Hillamo, R., and Mihalopoulos, N.: Organic, elemental and water-soluble organic carbon in size segregated aerosols, in the marine boundary layer of the Eastern Mediterranean, Atmos. Environ., 64, 251–262, https://doi.org/10.1016/j.atmosenv.2012.09.071, 2013. a
Bougiatioti, A., Bezantakos, S., Stavroulas, I., Kalivitis, N., Kokkalis, P., Biskos, G., Mihalopoulos, N., Papayannis, A., and Nenes, A.: Biomass-burning impact on CCN number, hygroscopicity and cloud formation during summertime in the eastern Mediterranean, Atmos. Chem. Phys., 16, 7389–7409, https://doi.org/10.5194/acp-16-7389-2016, 2016. a
Budke, C. and Koop, T.: BINARY: an optical freezing array for assessing temperature and time dependence of heterogeneous ice nucleation, Atmos. Meas. Tech., 8, 689–703, https://doi.org/10.5194/amt-8-689-2015, 2015. a
Chen, J., Wu, Z., Augustin-Bauditz, S., Grawe, S., Hartmann, M., Pei, X., Liu, Z., Ji, D., and Wex, H.: Ice-nucleating particle concentrations unaffected by urban air pollution in Beijing, China, Atmos. Chem. Phys., 18, 3523–3539, https://doi.org/10.5194/acp-18-3523-2018, 2018. a, b, c
Chester, R., Nimmo, M., Alarcon, M., Saydam, C., Murphy, K., Sanders, G., and Corcoran, P.: Defining the chemical character of aerosols from the atmosphere of the Mediterranean-Sea and surrounding regions, Oceanol. Acta, 16, 231–246, 1993. a
Claeys, M., Roberts, G., Mallet, M., Arndt, J., Sellegri, K., Sciare, J., Wenger, J., and Sauvage, B.: Optical, physical and chemical properties of aerosols transported to a coastal site in the western Mediterranean: a focus on primary marine aerosols, Atmos. Chem. Phys., 17, 7891–7915, https://doi.org/10.5194/acp-17-7891-2017, 2017. a
Dal Maso, M., Kulmala, M., Riipinen, I., Wagner, R., Hussein, T., Aalto, P. P., and Lehtinen, K. E.: Formation and growth of fresh atmospheric aerosols: eight years of aerosol size distribution data from SMEAR II, Hyytiala, Finland, Boreal Environ. Res., 10, 323–336, 2005. a
DeMott, P. J., Prenni, A. J., Liu, X., Kreidenweis, S. M., Petters, M. D., Twohy, C. H., Richardson, M. S., Eidhammer, T., and Rogers, D. C.: Predicting global atmospheric ice nuclei distributions and their impacts on climate, P. Natl. Acad. Sci. USA, 107, 11217–11222, https://doi.org/10.1073/pnas.0910818107, 2010. a, b, c, d, e
Fan, J., Wang, Y., Rosenfeld, D., and Liu, X.: Review of Aerosol–Cloud Interactions: Mechanisms, Significance, and Challenges, J. Atmos. Sci., 73, 4221–4252, https://doi.org/10.1175/jas-d-16-0037.1, 2016. a
Fletcher, N. H.: The physics of rainclouds, Cambridge University Press, New York, 1962. a, b, c
Giorgi, F. and Lionello, P.: Climate change projections for the Mediterranean region, Global Planet. Change, 63, 90–104, https://doi.org/10.1016/j.gloplacha.2007.09.005, 2008. a
Gong, X. Wex, H., Müller, T., Wiedensohler, A., Höhler, K., Kandler, K., Ma, N., Dietel, B., Schiebel, T., Möhler, O., Stratmann, F.: Ground-based measurements on aerosol particles at Paphos, Cyprus, in March–April 2017, PANGAEA, https://doi.pangaea.de/10.1594/PANGAEA.904758, last access: 16 August 2019. a
Gysel, M. and Stratmann, F.: WP3 – NA3: In-situ chemical, physical and optical properties of aerosols, Deliverable D3.11: Standardized protocol for CCN measurements, Tech. rep., available at: http://www.actris.net/Publications/ACTRISQualityStandards/tabid/11271/language/en-GB/Default.aspx (last access: 18 August 2019), 2013. a
Herenz, P., Wex, H., Henning, S., Kristensen, T. B., Rubach, F., Roth, A., Borrmann, S., Bozem, H., Schulz, H., and Stratmann, F.: Measurements of aerosol and CCN properties in the Mackenzie River delta (Canadian Arctic) during spring–summer transition in May 2014, Atmos. Chem. Phys., 18, 4477-4496, https://doi.org/10.5194/acp-18-4477-2018, 2018. a
Hiranuma, N., Augustin-Bauditz, S., Bingemer, H., Budke, C., Curtius, J., Danielczok, A., Diehl, K., Dreischmeier, K., Ebert, M., Frank, F., Hoffmann, N., Kandler, K., Kiselev, A., Koop, T., Leisner, T., Möhler, O., Nillius, B., Peckhaus, A., Rose, D., Weinbruch, S., Wex, H., Boose, Y., DeMott, P. J., Hader, J. D., Hill, T. C. J., Kanji, Z. A., Kulkarni, G., Levin, E. J. T., McCluskey, C. S., Murakami, M., Murray, B. J., Niedermeier, D., Petters, M. D., O'Sullivan, D., Saito, A., Schill, G. P., Tajiri, T., Tolbert, M. A., Welti, A., Whale, T. F., Wright, T. P., and Yamashita, K.: A comprehensive laboratory study on the immersion freezing behavior of illite NX particles: a comparison of 17 ice nucleation measurement techniques, Atmos. Chem. Phys., 15, 2489–2518, https://doi.org/10.5194/acp-15-2489-2015, 2015. a
Hoppel, W., Frick, G., and Larson, R.: Effect of nonprecipitating clouds on the aerosol size distribution in the marine boundary layer, Geophys. Res. Lett., 13, 125–128, https://doi.org/10.1029/GL013i002p00125, 1986. a
Hudda, N. and Fruin, S. A.: International Airport Impacts to Air Quality: Size and Related Properties of Large Increases in Ultrafine Particle Number Concentrations, Environ. Sci. Technol., 50, 3362–3370, https://doi.org/10.1021/acs.est.5b05313, 2016. a
Jasinski, R. and Przylebska, K.: Analysis of the particle size distribution near the civil airport runway, IOP Conference Series: Materials Science and Engineering, 421, 042030, https://doi.org/10.1088/1757-899x/421/4/042030, 2018. a
Kalivitis, N., Kerminen, V.-M., Kouvarakis, G., Stavroulas, I., Bougiatioti, A., Nenes, A., Manninen, H. E., Petäjä, T., Kulmala, M., and Mihalopoulos, N.: Atmospheric new particle formation as a source of CCN in the eastern Mediterranean marine boundary layer, Atmos. Chem. Phys., 15, 9203–9215, https://doi.org/10.5194/acp-15-9203-2015, 2015. a, b, c, d, e
Kandler, K., Schneiders, K., Ebert, M., Hartmann, M., Weinbruch, S., Prass, M., and Pöhlker, C.: Composition and mixing state of atmospheric aerosols determined by electron microscopy: method development and application to aged Saharan dust deposition in the Caribbean boundary layer, Atmos. Chem. Phys., 18, 13429–13455, https://doi.org/10.5194/acp-18-13429-2018, 2018. a
Kanji, Z. A., Ladino, L. A., Wex, H., Boose, Y., Burkert-Kohn, M., Cziczo, D. J., and Krämer, M.: Overview of Ice Nucleating Particles, Meteor. Mon., 58, 1.1–1.33, https://doi.org/10.1175/amsmonographs-d-16-0006.1, 2017. a
Köhler, H.: The nucleus in and the growth of hygroscopic droplets, T. Faraday Soc., 32, 1152–1161, 1936. a
Kristensen, T. B., Müller, T., Kandler, K., Benker, N., Hartmann, M., Prospero, J. M., Wiedensohler, A., and Stratmann, F.: Properties of cloud condensation nuclei (CCN) in the trade wind marine boundary layer of the western North Atlantic, Atmos. Chem. Phys., 16, 2675–2688, https://doi.org/10.5194/acp-16-2675-2016, 2016. a, b
Lelieveld, J., Berresheim, H., Borrmann, S., Crutzen, P. J., Dentener, F. J., Fischer, H., Feichter, J., Flatau, P. J., Heland, J., Holzinger, R., Korrmann, R., Lawrence, M. G., Levin, Z., Markowicz, K. M., Mihalopoulos, N., Minikin, A., Ramanathan, V., de Reus, M., Roelofs, G. J., Scheeren, H. A., Sciare, J., Schlager, H., Schultz, M., Siegmund, P., Steil, B., Stephanou, E. G., Stier, P., Traub, M., Warneke, C., Williams, J., and Ziereis, H.: Global Air Pollution Crossroads over the Mediterranean, Science, 298, 794–799, https://doi.org/10.1126/science.1075457, 2002. a
Mallet, M., Dulac, F., Formenti, P., Nabat, P., Sciare, J., Roberts, G., Pelon, J., Ancellet, G., Tanré, D., Parol, F., Denjean, C., Brogniez, G., di Sarra, A., Alados-Arboledas, L., Arndt, J., Auriol, F., Blarel, L., Bourrianne, T., Chazette, P., Chevaillier, S., Claeys, M., D'Anna, B., Derimian, Y., Desboeufs, K., Di Iorio, T., Doussin, J.-F., Durand, P., Féron, A., Freney, E., Gaimoz, C., Goloub, P., Gómez-Amo, J. L., Granados-Muñoz, M. J., Grand, N., Hamonou, E., Jankowiak, I., Jeannot, M., Léon, J.-F., Maillé, M., Mailler, S., Meloni, D., Menut, L., Momboisse, G., Nicolas, J., Podvin, T., Pont, V., Rea, G., Renard, J.-B., Roblou, L., Schepanski, K., Schwarzenboeck, A., Sellegri, K., Sicard, M., Solmon, F., Somot, S., Torres, B., Totems, J., Triquet, S., Verdier, N., Verwaerde, C., Waquet, F., Wenger, J., and Zapf, P.: Overview of the Chemistry-Aerosol Mediterranean Experiment/Aerosol Direct Radiative Forcing on the Mediterranean Climate (ChArMEx/ADRIMED) summer 2013 campaign, Atmos. Chem. Phys., 16, 455–504, https://doi.org/10.5194/acp-16-455-2016, 2016. a
Mamouri, R.-E., Ansmann, A., Nisantzi, A., Solomos, S., Kallos, G., and Hadjimitsis, D. G.: Extreme dust storm over the eastern Mediterranean in September 2015: satellite, lidar, and surface observations in the Cyprus region, Atmos. Chem. Phys., 16, 13711–13724, https://doi.org/10.5194/acp-16-13711-2016, 2016. a, b
Niemand, M., Möhler, O., Vogel, B., Vogel, H., Hoose, C., Connolly, P., Klein, H., Bingemer, H., DeMott, P., Skrotzki, J., and Leisner, T.: A Particle-Surface-Area-Based Parameterization of Immersion Freezing on Desert Dust Particles, J. Atmos. Sci., 69, 3077–3092, https://doi.org/10.1175/jas-d-11-0249.1, 2012. a, b, c
O'Sullivan, D., Adams, M. P., Tarn, M. D., Harrison, A. D., Vergara-Temprado, J., Porter, G. C. E., Holden, M. A., Sanchez-Marroquin, A., Carotenuto, F., Whale, T. F., McQuaid, J. B., Walshaw, R., Hedges, D. H. P., Burke, I. T., Cui, Z., and Murray, B. J.: Contributions of biogenic material to the atmospheric ice-nucleating particle population in North Western Europe, Sci. Rep.-UK, 8, 13821, https://doi.org/10.1038/s41598-018-31981-7, 2018. a, b
Ott, D. K. and Peters, T. M.: A Shelter to Protect a Passive Sampler for Coarse Particulate Matter, PM10−2.5, Aerosol Sci. Technol., 42, 299–309, https://doi.org/10.1080/02786820802054236, 2008. a
Ott, W. R.: A Physical Explanation of the Lognormality of Pollutant Concentrations, J. Air Waste Manage. Assoc., 40, 1378–1383, https://doi.org/10.1080/10473289.1990.10466789, 1990. a
Pace, G., Meloni, D., and Di Sarra, A.: Forest fire aerosol over the Mediterranean basin during summer 2003, J. Geophys. Res.-Atmos., 110, https://doi.org/10.1029/2005JD005986, 2005. a
Petters, M. D. and Kreidenweis, S. M.: A single parameter representation of hygroscopic growth and cloud condensation nucleus activity, Atmos. Chem. Phys., 7, 1961–1971, https://doi.org/10.5194/acp-7-1961-2007, 2007. a
Pfeifer, S., Müller, T., Weinhold, K., Zikova, N., Martins dos Santos, S., Marinoni, A., Bischof, O. F., Kykal, C., Ries, L., Meinhardt, F., Aalto, P., Mihalopoulos, N., and Wiedensohler, A.: Intercomparison of 15 aerodynamic particle size spectrometers (APS 3321): uncertainties in particle sizing and number size distribution, Atmos. Meas. Tech., 9, 1545–1551, https://doi.org/10.5194/amt-9-1545-2016, 2016. a
Piazzola, J. and Despiau, S.: Contribution of marine aerosols in the particle size distributions observed in Mediterranean coastal zone, Atmos. Environ., 31, 2991–3009, https://doi.org/10.1016/S1352-2310(97)00088-5, 1997. a
Prather, K. A., Bertram, T. H., Grassian, V. H., Deane, G. B., Stokes, M. D., DeMott, P. J., Aluwihare, L. I., Palenik, B. P., Azam, F., Seinfeld, J. H., Moffet, R. C., Molina, M. J., Cappa, C. D., Geiger, F. M., Roberts, G. C., Russell, L. M., Ault, A. P., Baltrusaitis, J., Collins, D. B., Corrigan, C. E., Cuadra-Rodriguez, L. A., Ebben, C. J., Forestieri, S. D., Guasco, T. L., Hersey, S. P., Kim, M. J., Lambert, W. F., Modini, R. L., Mui, W., Pedler, B. E., Ruppel, M. J., Ryder, O. S., Schoepp, N. G., Sullivan, R. C., and Zhao, D.: Bringing the ocean into the laboratory to probe the chemical complexity of sea spray aerosol, P. Natl. Acad. Sci. USA, 110, 7550–7555, https://doi.org/10.1073/pnas.1300262110, 2013. a
Price, H. C., Baustian, K. J., McQuaid, J. B., Blyth, A., Bower, K. N., Choularton, T., Cotton, R. J., Cui, Z., Field, P. R., Gallagher, M., Hawker, R., Merrington, A., Miltenberger, A., Neely III, R. R., Parker, S. T., Rosenberg, P. D., Taylor, J. W., Trembath, J., Vergara-Temprado, J., Whale, T. F., Wilson, T. W., Young, G., and Murray, B. J.: Atmospheric Ice-Nucleating Particles in the Dusty Tropical Atlantic, J. Geophys. Res.-Atmos., 123, 2175–2193, https://doi.org/10.1002/2017JD027560, 2018. a, b, c, d
Pringle, K. J., Tost, H., Pozzer, A., Pöschl, U., and Lelieveld, J.: Global distribution of the effective aerosol hygroscopicity parameter for CCN activation, Atmos. Chem. Phys., 10, 5241–5255, https://doi.org/10.5194/acp-10-5241-2010, 2010. a, b
Pruppacher, H. and Klett, J.: Microphysics of Clouds and Precipitation, vol. 18, Springer Science & Business Media, Dordrecht, 2010. a
Rinaldi, M., Santachiara, G., Nicosia, A., Piazza, M., Decesari, S., Gilardoni, S., Paglione, M., Cristofanelli, P., Marinoni, A., Bonasoni, P., and Belosi, F.: Atmospheric Ice Nucleating Particle measurements at the high mountain observatory Mt. Cimone (2165 m a.s.l., Italy), Atmos. Environ., 171, 173–180, https://doi.org/10.1016/j.atmosenv.2017.10.027, 2017. a
Roberts, G. C. and Nenes, A.: A Continuous-Flow Streamwise Thermal-Gradient CCN Chamber for Atmospheric Measurements, Aerosol Sci. Technol., 39, 206–221, https://doi.org/10.1080/027868290913988, 2005. a
Rodríguez, S., Querol, X., Alastuey, A., and Plana, F.: Sources and processes affecting levels and composition of atmospheric aerosol in the western Mediterranean, J. Geophys. Res.-Atmos., 107, AAC 12-1–AAC 12-14, https://doi.org/10.1029/2001JD001488, 2002. a
Rolph, G.: Real-time environmental applications and display system (READY) website, available at: https://www.ready.noaa.gov/index.php (last access: 15 August 2019), 2003. a
Rose, D., Gunthe, S. S., Mikhailov, E., Frank, G. P., Dusek, U., Andreae, M. O., and Pöschl, U.: Calibration and measurement uncertainties of a continuous-flow cloud condensation nuclei counter (DMT-CCNC): CCN activation of ammonium sulfate and sodium chloride aerosol particles in theory and experiment, Atmos. Chem. Phys., 8, 1153–1179, https://doi.org/10.5194/acp-8-1153-2008, 2008. a
Salameh, T., Drobinski, P., Menut, L., Bessagnet, B., Flamant, C., Hodzic, A., and Vautard, R.: Aerosol distribution over the western Mediterranean basin during a Tramontane/Mistral event, Ann. Geophys., 25, 2271–2291, https://doi.org/10.5194/angeo-25-2271-2007, 2007. a
Sandrini, S., van Pinxteren, D., Giulianelli, L., Herrmann, H., Poulain, L., Facchini, M. C., Gilardoni, S., Rinaldi, M., Paglione, M., Turpin, B. J., Pollini, F., Bucci, S., Zanca, N., and Decesari, S.: Size-resolved aerosol composition at an urban and a rural site in the Po Valley in summertime: implications for secondary aerosol formation, Atmos. Chem. Phys., 16, 10879–10897, https://doi.org/10.5194/acp-16-10879-2016, 2016. a
Schladitz, A., Müller, T., Nowak, A., Kandler, K., Lieke, K., Massling, A., and Wiedensohler, A.: In situ aerosol characterization at Cape Verde, Tellus B, 63, 531–548, https://doi.org/10.1111/j.1600-0889.2011.00569.x, 2011. a, b
Schrod, J., Weber, D., Drücke, J., Keleshis, C., Pikridas, M., Ebert, M., Cvetković, B., Nickovic, S., Marinou, E., Baars, H., Ansmann, A., Vrekoussis, M., Mihalopoulos, N., Sciare, J., Curtius, J., and Bingemer, H. G.: Ice nucleating particles over the Eastern Mediterranean measured by unmanned aircraft systems, Atmos. Chem. Phys., 17, 4817–4835, https://doi.org/10.5194/acp-17-4817-2017, 2017. a, b, c, d, e, f
Sciare, J., Bardouki, H., Moulin, C., and Mihalopoulos, N.: Aerosol sources and their contribution to the chemical composition of aerosols in the Eastern Mediterranean Sea during summertime, Atmos. Chem. Phys., 3, 291–302, https://doi.org/10.5194/acp-3-291-2003, 2003. a
Sciare, J., Oikonomou, K., Favez, O., Liakakou, E., Markaki, Z., Cachier, H., and Mihalopoulos, N.: Long-term measurements of carbonaceous aerosols in the Eastern Mediterranean: evidence of long-range transport of biomass burning, Atmos. Chem. Phys., 8, 5551–5563, https://doi.org/10.5194/acp-8-5551-2008, 2008. a
Smoydzin, L., Teller, A., Tost, H., Fnais, M., and Lelieveld, J.: Impact of mineral dust on cloud formation in a Saharan outflow region, Atmos. Chem. Phys., 12, 11383–11393, https://doi.org/10.5194/acp-12-11383-2012, 2012. a
Stein, A. F., Draxler, R. R., Rolph, G. D., Stunder, B. J. B., Cohen, M. D., and Ngan, F.: NOAA's HYSPLIT Atmospheric Transport and Dispersion Modeling System, B. Am. Meteorol. Soc., 96, 2059–2077, https://doi.org/10.1175/bams-d-14-00110.1, 2015. a
Tobo, Y., Prenni, A. J., DeMott, P. J., Huffman, J. A., McCluskey, C. S., Tian, G., Pöhlker, C., Pöschl, U., and Kreidenweis, S. M.: Biological aerosol particles as a key determinant of ice nuclei populations in a forest ecosystem, J. Geophys. Res.-Atmos., 118, 10100–10110, https://doi.org/10.1002/jgrd.50801, 2013. a, b, c, d, e, f
Ullrich, R., Hoose, C., Möhler, O., Niemand, M., Wagner, R., Höhler, K., Hiranuma, N., Saathoff, H., and Leisner, T.: A New Ice Nucleation Active Site Parameterization for Desert Dust and Soot, J. Atmos. Sci., 74, 699–717, https://doi.org/10.1175/jas-d-16-0074.1, 2017. a, b, c
Vali, G.: Quantitative Evaluation of Experimental Results an the Heterogeneous Freezing Nucleation of Supercooled Liquids, J. Atmos. Sci., 28, 402–409, https://doi.org/10.1175/1520-0469(1971)028<0402:qeoera>2.0.co;2, 1971. a
von der Weiden, S.-L., Drewnick, F., and Borrmann, S.: Particle Loss Calculator – a new software tool for the assessment of the performance of aerosol inlet systems, Atmos. Meas. Tech., 2, 479–494, https://doi.org/10.5194/amt-2-479-2009, 2009. a
Welti, A., Müller, K., Fleming, Z. L., and Stratmann, F.: Concentration and variability of ice nuclei in the subtropical maritime boundary layer, Atmos. Chem. Phys., 18, 5307–5320, https://doi.org/10.5194/acp-18-5307-2018, 2018. a, b, c, d, e, f, g, h
Wiedensohler, A.: An approximation of the bipolar charge distribution for particles in the submicron size range, J. Aerosol Sci., 19, 387–389, https://doi.org/10.1016/0021-8502(88)90278-9, 1988. a
Wiedensohler, A., Birmili, W., Nowak, A., Sonntag, A., Weinhold, K., Merkel, M., Wehner, B., Tuch, T., Pfeifer, S., Fiebig, M., Fjäraa, A. M., Asmi, E., Sellegri, K., Depuy, R., Venzac, H., Villani, P., Laj, P., Aalto, P., Ogren, J. A., Swietlicki, E., Williams, P., Roldin, P., Quincey, P., Hüglin, C., Fierz-Schmidhauser, R., Gysel, M., Weingartner, E., Riccobono, F., Santos, S., Grüning, C., Faloon, K., Beddows, D., Harrison, R., Monahan, C., Jennings, S. G., O'Dowd, C. D., Marinoni, A., Horn, H.-G., Keck, L., Jiang, J., Scheckman, J., McMurry, P. H., Deng, Z., Zhao, C. S., Moerman, M., Henzing, B., de Leeuw, G., Löschau, G., and Bastian, S.: Mobility particle size spectrometers: harmonization of technical standards and data structure to facilitate high quality long-term observations of atmospheric particle number size distributions, Atmos. Meas. Tech., 5, 657–685, https://doi.org/10.5194/amt-5-657-2012, 2012. a
Wiedensohler, A., Wiesner, A., Weinhold, K., Birmili, W., Hermann, M., Merkel, M., Müller, T., Pfeifer, S., Schmidt, A., Tuch, T., Velarde, F., Quincey, P., Seeger, S., and Nowak, A.: Mobility particle size spectrometers: Calibration procedures and measurement uncertainties, Aerosol Sci. Technol., 52, 146–164, https://doi.org/10.1080/02786826.2017.1387229, 2018. a