the Creative Commons Attribution 4.0 License.
the Creative Commons Attribution 4.0 License.
 | 14 Aug 2019
Winter 2018 major sudden stratospheric warming impact on midlatitude mesosphere from microwave radiometer measurements
Yuke Wang
Valerii Shulga
Gennadi Milinevsky
Aleksey Patoka
Oleksandr Evtushevsky
Andrew Klekociuk
Wei Han
Asen Grytsai
Dmitry Shulga
Valery Myshenko
Oleksandr Antyufeyev
The impact of a major sudden stratospheric warming (SSW) in the Arctic in February 2018 on the midlatitude mesosphere is investigated by performing the microwave radiometer measurements of carbon monoxide (CO) and zonal wind above Kharkiv, Ukraine (50.0∘ N, 36.3∘ E). The mesospheric peculiarities of this SSW event were observed using a recently designed and installed microwave radiometer in eastern Europe for the first time. Data from the ERA-Interim and MERRA-2 reanalyses, as well as the Aura microwave limb sounder measurements, are also used. Microwave observations of the daily CO profiles in January–March 2018 allowed for the retrieval of mesospheric zonal wind at 70–85 km (below the winter mesopause) over the Kharkiv site. Reversal of the mesospheric westerly from about 10 m s−1 to an easterly wind of about −10 m s−1 around 10 February was observed. The local microwave observations at our Northern Hemisphere (NH) midlatitude site combined with reanalysis data show wide-ranging daily variability in CO, zonal wind, and temperature in the mesosphere and stratosphere during the SSW of 2018. The observed local CO variability can be explained mainly by horizontal air mass redistribution due to planetary wave activity. Replacement of the CO-rich polar vortex air by CO-poor air of the surrounding area led to a significant mesospheric CO decrease over the station during the SSW and fragmentation of the vortex over the station at the SSW start caused enhanced stratospheric CO at about 30 km. The results of microwave measurements of CO and zonal wind in the midlatitude mesosphere at 70–85 km altitudes, which still are not adequately covered by ground-based observations, are useful for improving our understanding of the SSW impacts in this region.
- Article
(5346 KB) - Full-text XML
-
Supplement
(1090 KB) - BibTeX
- EndNote


Major sudden stratospheric warming (SSW) events, which happen roughly every other year in the North Pole region, are produced by strong planetary wave activity according to the model developed by Matsuno (1971) which is supported by numerous observations (Alexander and Shepherd, 2010; Kuttippurath and Nikulin, 2012; Tao et al., 2015). A major SSW event is accompanied by a sharp increase in the stratosphere temperature up to 50 K and the reversal of the zonal wind from climatological westerlies to easterlies over a period of several days (Charlton and Polvani, 2007; Chandran and Collins, 2014; Hu et al., 2014; Tripathi et al., 2016; Butler et al., 2017; Karpechko et al., 2018; Taguchi, 2018; Rao et al., 2018). The primary definition of a SSW event provided by the World Meteorological Organization requires a stratosphere temperature increase and an accompanying zonal wind reversal to easterlies at the 10 hPa pressure level (approximately 30 km altitude) and 60∘ latitude (WMO, 1978). This definition was broadened and detailed in recent papers (Butler et al., 2015; Butler and Gerber, 2018; Rao et al., 2019). The summarizing paper, where a SSW database is described, was published in Butler et al. (2017). This useful tool (https://www.esrl.noaa.gov/csd/groups/csd8/sswcompendium/, last access: 15 July 2019) allows for analysis of the conditions in the stratosphere, troposphere, and at the surface before, during, and after each SSW event representing its evolution, structure, and impact on winter surface climate. The compendium is based on data from six different reanalysis products; covers the 1958–2014 period; and includes global daily anomaly fields, full fields, and derived products for each SSW event (Butler et al., 2017).
The source of the SSW is planetary wave activity born in the troposphere that propagates upward through the tropopause to the stratosphere (Matsuno, 1971; Alexander and Shepherd, 2010; Butler et al., 2015). The enhanced wave activity results in the rapid warming of the polar stratosphere and the breakdown of the stratospheric polar vortex (Matsuno, 1971; de la Torre et al., 2012; Chandran and Collins, 2014; Pedatella et al., 2018). The important feature of a SSW event is its impact on lower altitudes, when temperature and wind anomalies descend downward into the high- and midlatitude troposphere during the following weeks to month and influence the surface weather (Baldwin and Dunkerton, 2001; Zhou et al., 2002; Butler et al., 2015; Yu et al., 2018). The major SSW events may also impact the atmospheric composition of the whole Northern Hemisphere (NH) stratosphere including midlatitudes (Solomon et al., 1985; Allen et al., 1999; Tao et al., 2015).
During the SSW, vertical coupling covers not only the troposphere but extends upward to the mesosphere. Mesospheric responses to the SSW are observed as enhancement in planetary wave amplitude, zonal wind reversal, and significant air cooling (Shepherd et al., 2014; Zülicke and Becker, 2013; Stray et al., 2015; Zülicke et al., 2018); substantial depletion of the metal layers (Feng et al., 2017; Gardner, 2018); and mesosphere-to-stratosphere descent of trace species (Manney et al., 2009; Salmi et al., 2011). The SSW events are also accompanied by the rapid descent of the stratopause into the stratosphere at the SSW onset, followed by formation of the elevated stratopause in the lower mesosphere and gradual stratopause lowering toward its typical position in the SSW recovery phase (Manney et al., 2009; Chandran et al., 2011; Salmi et al., 2011; Tomikawa et al., 2012; Limpasuvan et al., 2016; Orsolini et al., 2010, 2017). The elevated stratopause events provide evidence for the coupling between the stratosphere and the mesosphere.
Among the trace gases, the CO molecule is a good tracer of winter polar vortex dynamics in the upper stratosphere and mesosphere due to its long photochemical lifetime (Solomon et al., 1985; Allen et al., 1999; Rinsland et al., 1999; Shepherd et al., 2014). The CO mixing ratio generally increases with height in the upper stratosphere and mesosphere and increases with latitude toward the winter pole. This is due to the mean meridional circulation which transports CO from the source region in the summer hemisphere and the tropics to the extratropical winter mesosphere and stratosphere (Shepherd et al., 2014). Therefore, large abundances of CO appear in the winter polar regions under conditions of large-scale planetary wave activity. Downward meridional transport causes descent of CO between the mesosphere and stratosphere and this process is sensitive to planetary wave amplitudes, and particularly the wave amplitude changes that occur during SSWs (Rinsland et al., 1999; Manney et al., 2009; Kvissel et al., 2012). Due to the large-scale descent, high CO values of mesospheric origin are observed at stratospheric altitudes down to 25–30 km (Engel et al., 2006; Huret et al., 2006; Funke et al., 2009). At NH midlatitudes, CO also exhibits significant variability during periods of planetary wave activity associated with SSWs, when the polar vortex splits and displaces off the pole (Solomon et al., 1985; Allen et al., 1999; Funke et al., 2009).
Recent atmospheric models are being extended up to 80–150 km and are used for the study of SSWs (de la Torre et al., 2012; Chandran and Collins, 2014; Shepherd at al., 2014; Limpasuvan et al., 2016; Newnham et al., 2016). For example, de la Torre et al. (2012) applied the Whole Atmosphere Community Climate Model (WACCM) and Shepherd at al. (2014) used the Canadian Middle Atmosphere Model (CMAM) for SSW modeling. The reference wind profiles for the models are mainly retrieved from observations of the radiation of the mesospheric ozone molecules, which allow robust measurements at altitudes up to approximately 65 km (e.g., Hagen et al., 2018). These data are generally consistent with the most commonly used reanalysis products. However, there are still insufficient observations of middle atmospheric winds at altitudes between 60 and 85 km made with a high vertical resolution to verify atmospheric models and possible long-term trends (Keuer et al., 2007; Hagen et al., 2018; Rüfenacht et al., 2018). This altitude range, where temperature generally decreases with height, which causes inherent vertical instability, is situated below the winter mesopause region at 95–100 km (e.g., Xu et al., 2009) and plays a significant role in the mass and energy exchange between the stratosphere and the mesosphere (Shepherd et al., 2014; Limpasuvan et al., 2016; Gardner, 2018).
Microwave radiometry is a ground-based technique that can provide vertical profiles of CO, H2O, and O3 atmospheric gases and wind data in the upper stratosphere and mesosphere (Rüfenacht et al., 2012; Scheiben et al., 2012; Forkman et al., 2016). The upper stratosphere–mesosphere zonal winds at the 30–85 km altitude region can be measured using the Doppler shift between different observation directions in simultaneously measured spectra of transition lines of carbon monoxide at 115.3 GHz and ozone O3 at 110.8 GHz (Rüfenacht et al., 2012; Forkman et al., 2016). Due to the high-altitude CO residence region, the simultaneous zonal wind measurements using both O3 and CO provide independent data that extend the wind measurement from stratospheric to mesospheric altitudes (Forkman et al., 2016; Piddyachiy et al., 2017).
The first ground-based microwave measurements of CO were made in the 1970s and they confirmed theoretical estimations of the vertical CO profile (Waters et al., 1976; Goldsmith et al., 1979). Since the 1990s, ground-based microwave radiometers measuring CO have been installed in the Northern Hemisphere at high and middle latitudes to provide measurements on a regular basis. Microwave radiometers are operating in Onsala and Kiruna, Sweden, since 2008. The results are described in Hoffmann et al. (2011) and in Forkman et al. (2012). The microwave radiometer operated in Bern, Switzerland, since 2010 aims to contribute to the significant gap that exists in the middle atmosphere between 40 and 70 km altitude for wind data (Rüfenacht et al., 2012). In the Arctic, O3, N2O, HNO3, and CO spectra were recorded using the Ground-Based Millimetre-wave Spectrometer (GBMS; Muscari et al., 2007; Di Biagio et al., 2010).
Since 2014, the microwave measuring system for CO observations has been operated in Kharkiv, Ukraine (Piddyachiy et al., 2010, 2017). Microwave radiometer measurements of CO are used to retrieve mesospheric winds near the mesopause region (70–85 km). Methods deriving the wind speed from mesospheric CO measurements are based on the determination of CO and O3 line emission Doppler shift (Eriksson et al., 2011; Hagen et al., 2018).
Our observations in February 2018 using the new microwave radiometer at the midlatitude Kharkiv station have recorded the mesospheric effects of a major SSW. In mid-February 2018, the stratospheric polar vortex in the Arctic split into two sister vortices (Fig. 1), the zonal wind reversed in the stratosphere–mesosphere from westerly to easterly, and warm air penetrated into the polar cap regions (Rao et al., 2018; Karpechko et al., 2018; Vargin and Kiryushov, 2019). This caused large-scale disturbances in the middle atmosphere of the polar and middle latitudes. The major SSW in 2018 is not yet widely discussed in publications (Rao et al., 2018; Karpechko et al., 2018; Vargin and Kiryushov, 2019) and in this paper we give a detailed description of the observed mesospheric CO and zonal wind variations.
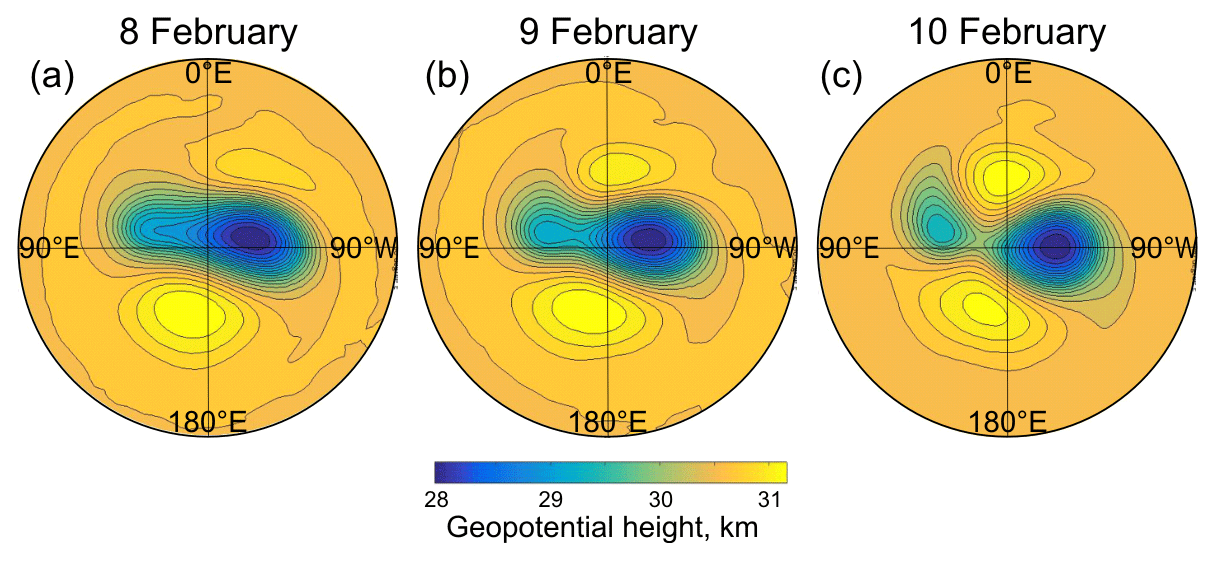
Figure 1The polar vortex split at the 10 hPa pressure level during the SSW event in February 2018. Geopotential heights are calculated from ERA-Interim reanalysis data.
In Sect. 2, the microwave radiometer and data processing software are briefly described. The SSW event in February 2018 is considered in Sect. 3. The effects of the SSW on midlatitude mesosphere–stratosphere conditions in the Ukrainian longitudinal sector are presented in Sect. 4. Discussion is given in Sect. 5 followed by conclusions in Sect. 6.
The microwave radiometer dataset registered during the 2017/2018 winter campaign in Kharkiv (50.0∘ N, 36.3∘ E) is used in this study to investigate local effects of the winter 2018 sudden stratospheric warming on the mesosphere and stratosphere. Since the ground-based microwave measurements are spatially limited by instrument coverage, data on air temperature, zonal wind, and geopotential height were used from reanalyses and satellite databases to interpret the CO profile and the zonal wind microwave observations and to describe the SSW effects in the atmosphere of the surrounding midlatitude region (48–52∘ N, 30–40∘ E).
2.1 Microwave radiometer, method, and midlatitude data description
The microwave radiometer (MWR) with high sensitivity, installed at Kharkiv, Ukraine, is designed for continuous observations of the atmospheric CO profiles and zonal wind speed in the mesosphere using emission lines at 115.3 GHz. The radiometer can continuously provide vertical profiles up to the mesopause region during day and night, even in cloudy conditions (Hagen et al., 2018). However, precipitation, such as strong rain or snow, can prevent the measurements.
The receiver of the radiometer has a double-sideband noise temperature of 250 K at an ambient temperature of 10 ∘C (Piddyachiy et al., 2010, 2017). The radiometer was tested during the 2014–2015 period for observation of the CO emission lines in the mesosphere over Kharkiv. These tests proved the reliability of the receiver system, on which further details are provided in Piddyachiy et al. (2017). Since 2015, the radiometer has been used for continuous microwave measurements of CO profiles and mesospheric wind investigations. The first observations of the atmospheric CO spectral lines over Kharkiv have confirmed seasonal variations in the CO abundance (Piddyachiy et al., 2017). Operation of the MWR in a double-sideband mode allows for retrieval of wind speed from the Doppler shift of the CO line emission at the 115.3 GHz. Two methods are used to determine wind speed. Firstly the observed line shape is fitted by a Voigt profile and the center frequency is determined (Piddyachiy et al., 2017). Secondly radiative transfer calculations for a horizontally layered atmosphere are used to determine the wind profiles with the Qpack package, version 1.0.93 (Eriksson et al., 2005, 2011), which is specifically designed to work with the forward model of the Atmospheric Radiative Transfer Simulator (ARTS; ARTS Qpack, 2019; Buehler et al., 2018; http://www.radiativetransfer.org/, last access: 18 February 2019). The results obtained by both methods were almost the same within the error limits. In this paper, both methods were used and provided average values of the zonal wind speed for altitudes of 70–85 km. The time interval of the data used here was 1 January–31 March 2018, which covers the main phases of the SSW 2018 event.
2.2 Data from other sources
In this study, daily datasets from the ERA-Interim global atmospheric reanalysis of European Centre for Medium-Range Weather Forecasts (ECMWF; ECMWF, 2019; Dee et al., 2011) were downloaded from (https://www.ecmwf.int/en/forecasts/datasets/archive-datasets/reanalysis-datasets/era-interim, last access: 27 February 2019) and have been used for comparison with MWR observations. The ERA-Interim data were used to create temperature and zonal wind velocity profiles and to calculate geopotential height at the stratospheric pressure levels in order to compare with the data measured over the Kharkiv site. Aura microwave limb sounder (MLS) measurements of the air temperature were analyzed as well (Aura MLS, 2019; Xu et al., 2009; https://mls.jpl.nasa.gov/data/readers.php (last access: 15 May 2019); see details in the Supplement).
Zonal wave amplitudes in geopotential height were analyzed using the National Oceanic and Atmospheric Administration, National Centers for Environmental Prediction, Global Data Assimilation System–Climate Prediction Center (NOAA NCEP GDAS–CPC) data (Okamoto and Gerber, 2006) at https://www.cpc.ncep.noaa.gov/products/stratosphere/strat-trop/ (last access: 15 May 2019) and the MERRA-2 data (MERRA-2, 2019; Gelaro et al., 2017) from the National Aeronautics and Space Administration, Goddard Space Flight Center, Atmospheric Chemistry and Dynamics Laboratory (NASA GFC ACDL) site at https://acd-ext.gsfc.nasa.gov/Data_services/met/ann_data.html (last access: 12 July 2019). A detailed description of the data used for analysis is given in the Supplement.
Descending air masses are observed throughout the mesosphere and stratosphere of the winter polar region (Orsolini et al., 2010; Chandran and Collins, 2014; Limpasuvan et al., 2016; Zülicke et al., 2018). From Aura MLS vertical profiles, a layered descending sequence of alternating cool and warm anomalies over the polar cap was observed in the 2017/2018 winter (Fig. 2a). The SSW event in Fig. 2a is identified by a rapid warming in the stratosphere and cooling in the mesosphere (upward arrow) starting from 10 February 2018 (left vertical line).
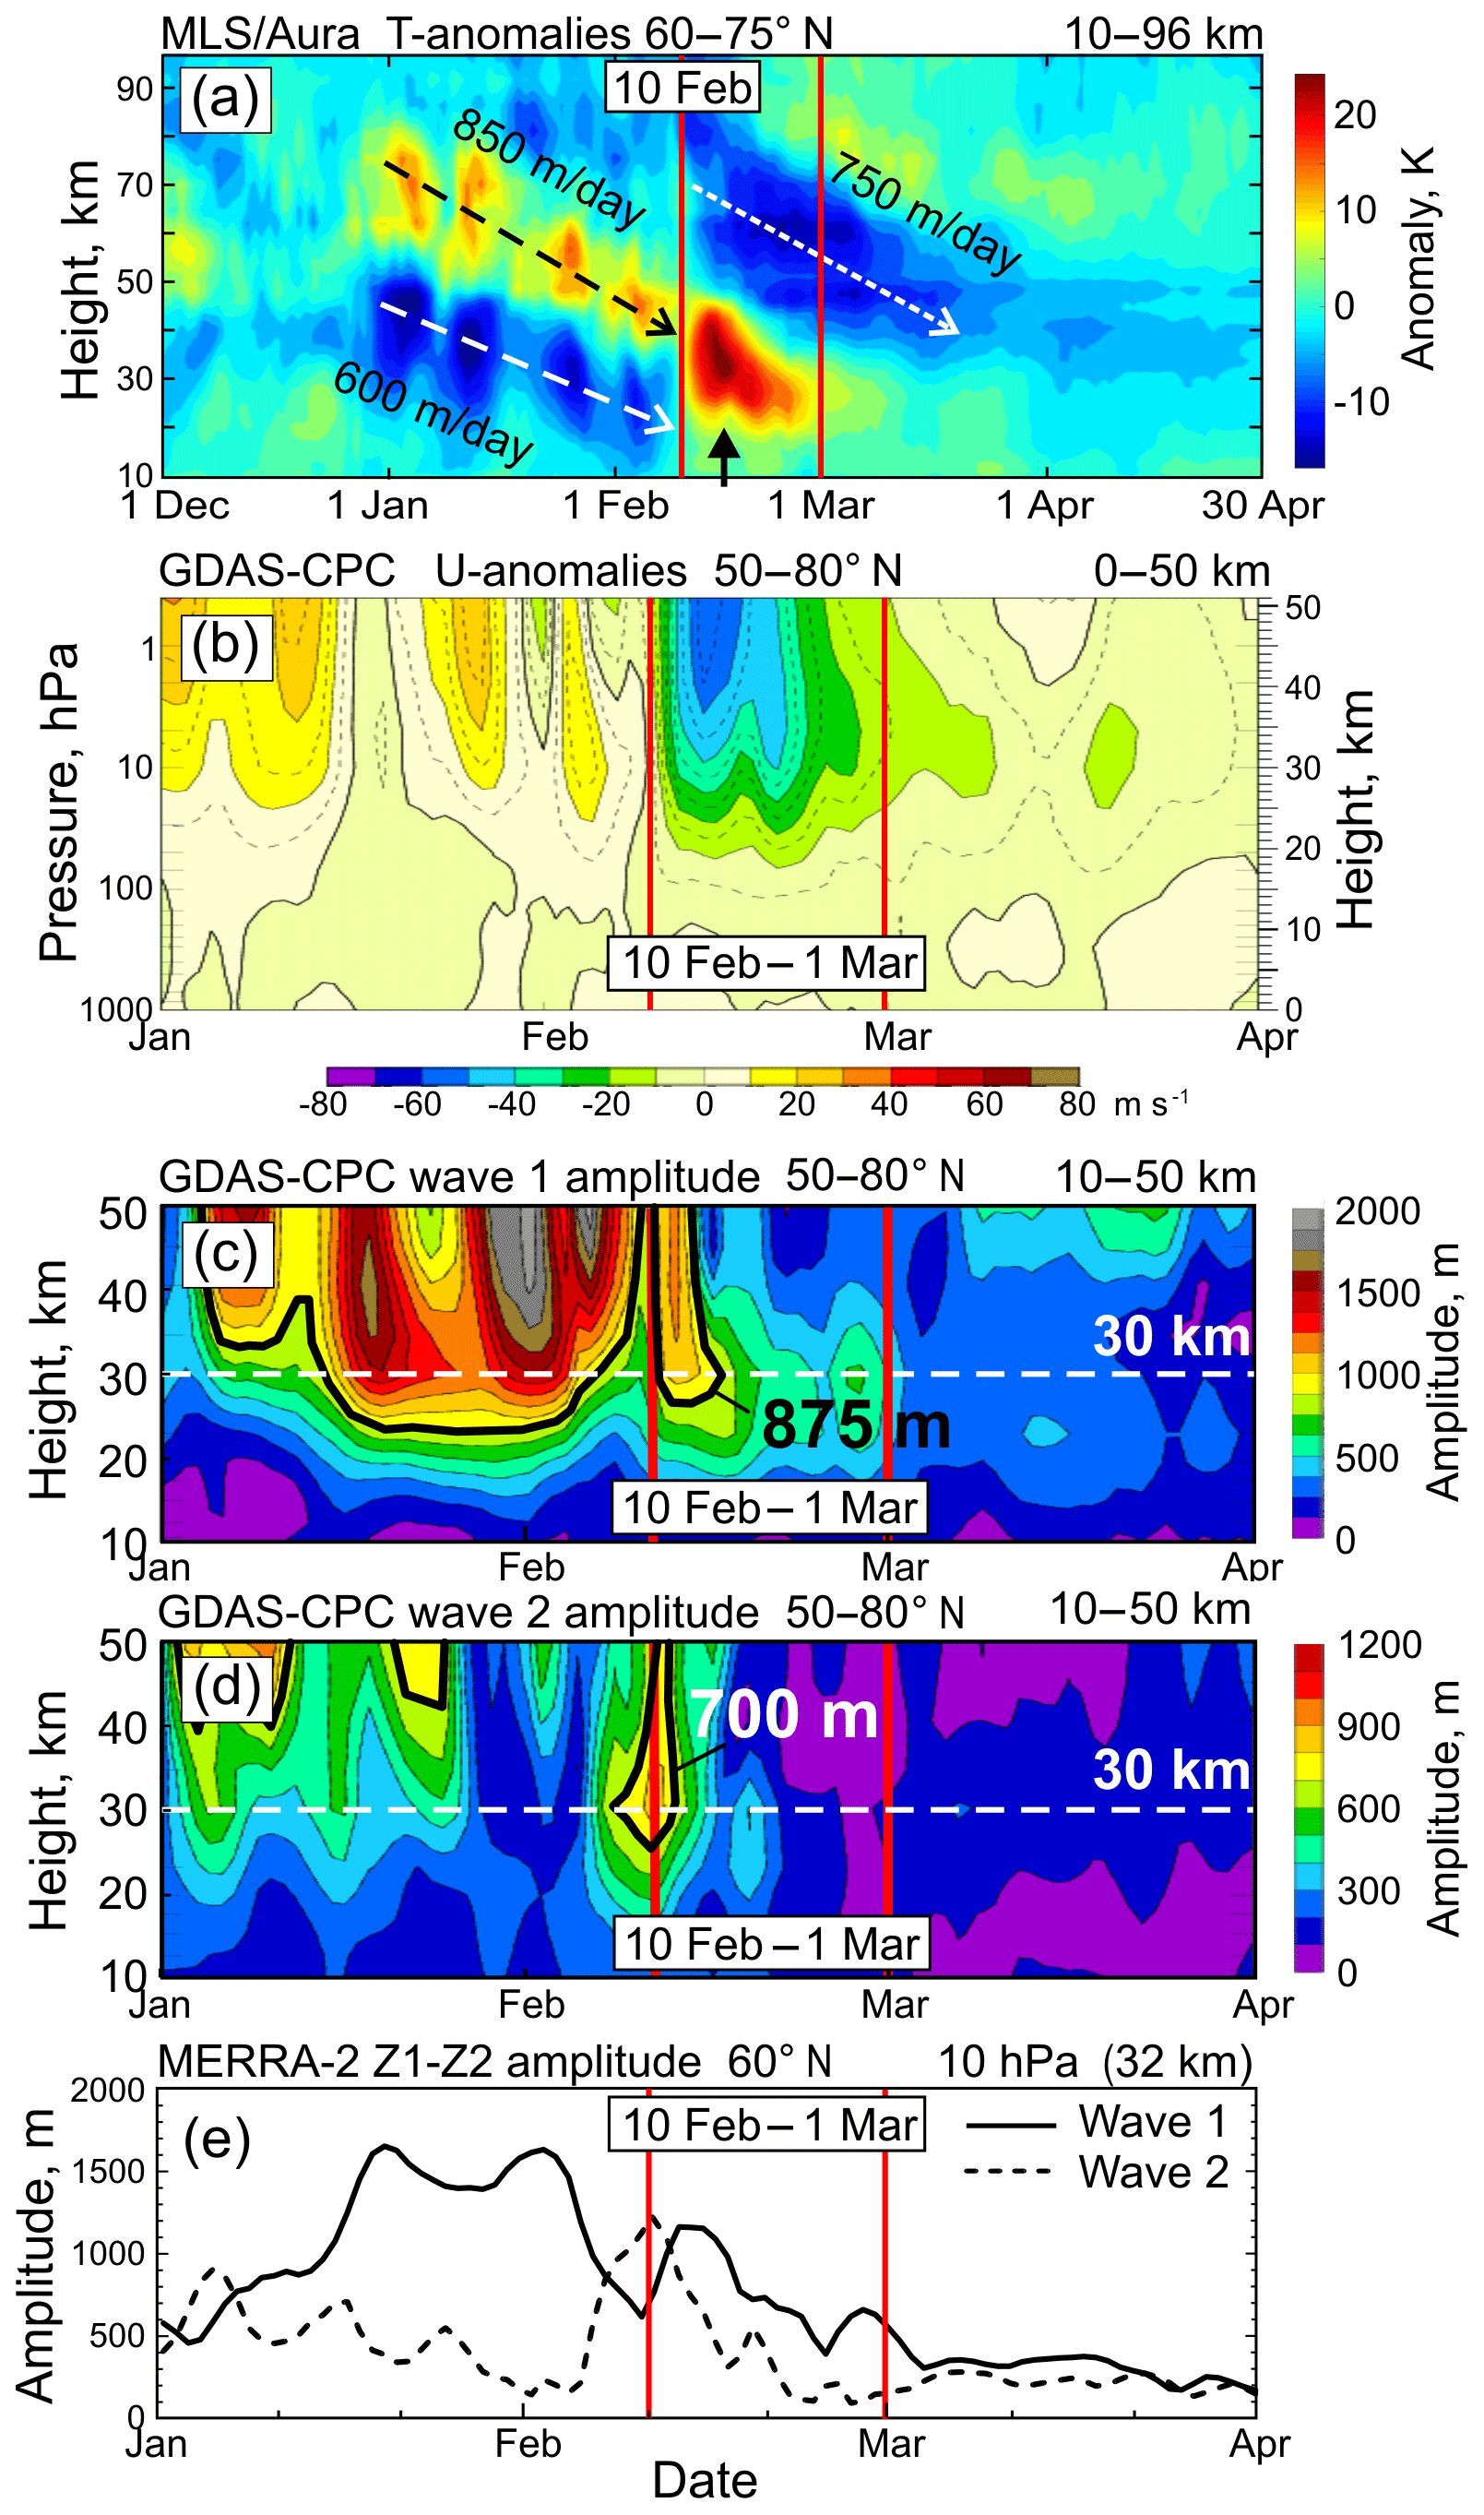
Figure 2The development of the SSW in 2018 from the vertical profiles of (a) Aura MLS temperature anomalies in December 2017–April 2018 at polar zone 60–75∘ N (with respect to the mean climatology 2005–2017), (b) zonal mean zonal wind anomalies, (c) wave 1 and (d) wave 2 amplitudes in geopotential height in January–March by NOAA NCEP GDAS–CPC data (climatology 1981–2010). (e) Zonal wave 1 and wave 2 amplitudes in geopotential height at 10 hPa, 60∘ N, by the MERRA-2 time series from the NASA GFC ACDL data. The SSW-related anomalous variability between 10 February and 1 March 2018 is bounded by red vertical lines.
This event was preceded by progressively descending warm and cold anomalies that formed in January (black and white dashed arrows, respectively). Oscillations in the intensity of the anomalies indicate that they were formed under the influence of large-amplitude planetary waves of zonal wave numbers 1 and 2 (Fig. 2c–e). From 1 January to 10 February (during 41 d), descending warm anomalies with a velocity of −850 m d−1 were apparent in the mesosphere and the upper stratosphere (75 to 40 km; black dashed arrow in Fig. 2a). Below the warm anomaly, a cold anomaly descended between the upper and lower stratosphere (45 to 20 km) with a velocity of −600 m d−1 (white dashed arrow in Fig. 2a), while a cold mesospheric anomaly in February–March descended with average velocity of −750 m d−1 (white dotted arrow in Fig. 2a). Our velocity estimates are similar to those of Salmi et al. (2011), who found that mesospheric NOx anomalies during the major SSW of 2009 were transported from 80 to 55 km in about 40 d, i.e., with a velocity of −600 m d−1.
The splitting of the polar vortex (Fig. 1) and the zonal wind reversal (Fig. 2b) started at the time of the wave 2 pulse on 10 February (Fig. 2d and dashed curve in Fig. 2e). Note that this is close to the SSW timing in Rao et al. (2018) and Vargin and Kiryushov (2019), where the SSW onset date was 11 February. As seen from Fig. 2c and solid curve in Fig. 2e, the increasing wave 1 amplitude contributed to the destabilization of the polar vortex during January to early February and to temperature and zonal wind oscillations in the mesosphere and stratosphere (Fig. 2a and b). These oscillations are usually associated with the propagation of planetary waves in the stratosphere and mesosphere (Limpasuvan et al., 2016; Rüfenacht et al., 2016). As noted in an earlier study (Manney et al., 2009; Rao et al., 2018), wave 1 amplitudes were also larger prior to the SSW in 2009, suggesting a role of preconditioning. During 10–15 February, the easterly zonal wind anomaly at the stratopause (about 1 hPa, ∼50 km) increased to −60 m s−1 (Fig. 2b). At the same time, warming in the polar stratosphere with the largest temperature anomaly of about 20 K was observed between 25 and 45 km in the same time interval (upward arrow in Fig. 2a). Both anomaly peaks are close in time to the wave 1 pulse after the SSW start (Fig. 2c and e). The descending negative temperature anomaly in the mesosphere between 50 and 90 km persisted during and after the SSW and reached −15 K (dotted arrow in Fig. 2a).
4.1 CO variability
Local variability in the conditions of the atmosphere during the microwave measurements in January–March 2018 at Kharkiv (50.0∘ N, 36.3∘ E) is shown in Figs. 3–6. The sharp changes occurred in the 20 d interval from 10 February to 1 March coinciding with the SSW event of 2018, as indicated by red vertical lines in Figs. 3, 5, and 6. At this time the polar vortex divided into two parts producing two smaller vortices over the longitudinal sectors of North America and Eurasia (Fig. 1). Due to the planetary wave influence (Fig. 2c–e), the two subvortices shifted zonally and meridionally, so that the SSW effects were observed not only in the polar region but also in the middle latitudes (Fig. 4).
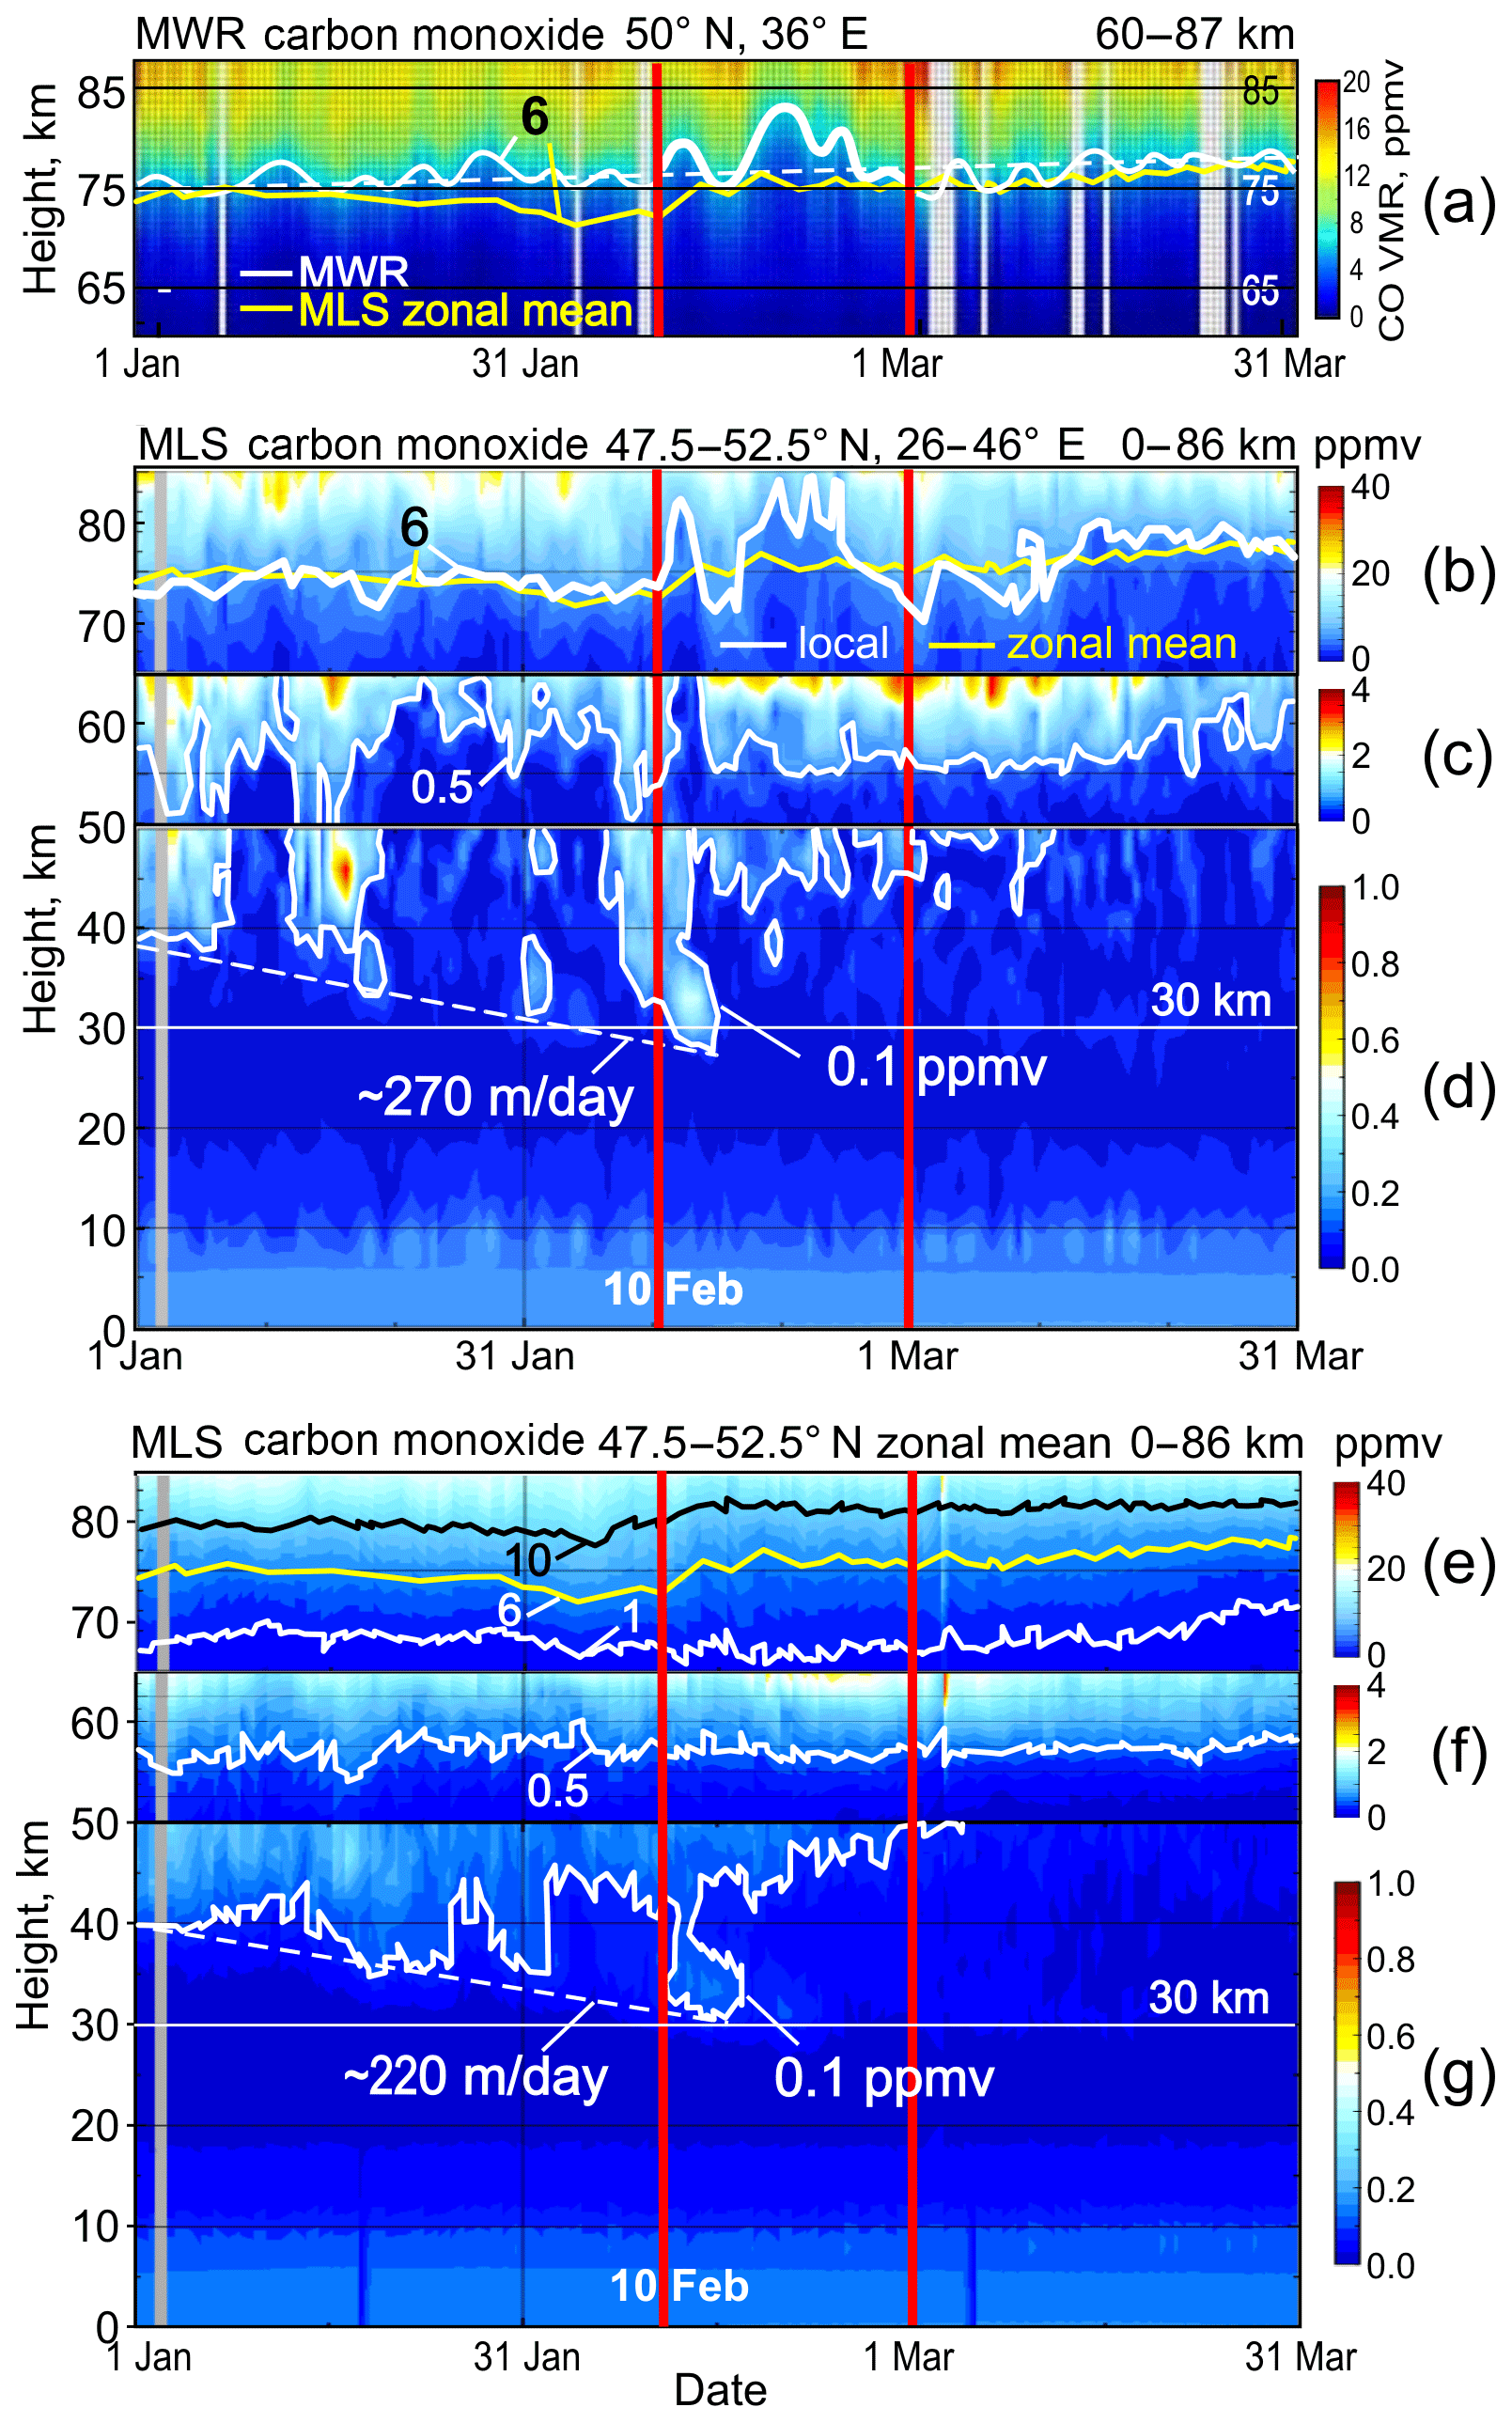
Figure 3(a) Mesospheric CO profile from microwave measurements over Kharkiv averaged in altitude range 70–85 km, and vertical CO profile from the MLS measurements averaged over latitudes 47.5–52.5∘ N and longitudes (b–d) 26–46∘ E centered at the Kharkiv MWR site (50∘ N, 36∘ E) and (e–g) 0–360∘ E for zonal mean. Selected CO levels are highlighted by white, black, and yellow contours (see text for details). Data for January–March 2018 are presented and the time interval of significant variations in the atmosphere parameters due to the SSW event (from 10 February to 1 March 2018) is bounded by red vertical lines.
The CO molecule volume mixing ratio (VMR) near the mesopause at 75–80 km decreased from 10 ppmv of a background level to 4 ppmv on 19–21 February (Fig. 3a), when the sharp vertical CO gradient at the lower edge of the CO layer near 6 ppmv increased in height by about 8 km (between 75 and 83 km, thick part of the white curve in Fig. 3a). For comparison, the pre- and post-SSW vertical variations in the 6 ppmv contour were observed in a range 2–3 km (white curve in Fig. 3a). Moreover, similar variations in the zonal mean 6 ppmv level are much weaker (yellow curve in Fig. 3e). This indicates that the local and regional mesosphere over the MWR site was disturbed by some source active during the SSW, which is identified below. We take here the 6 ppmv contour as a conditional lower edge of the CO layer since the CO gradients sharply increase from 0.2–0.3 ppmv km−1 in a 10 km layer below to 0.6–0.8 ppmv km−1 in a 10 km layer above (below and above the white curve in Fig. 3a). The similar gradient change is a characteristic of the mesospheric CO profiles in boreal winter from ground-based and satellite observations (Fig. 4 in Koo et al., 2017; Fig. 5 in Ryan et al., 2017).
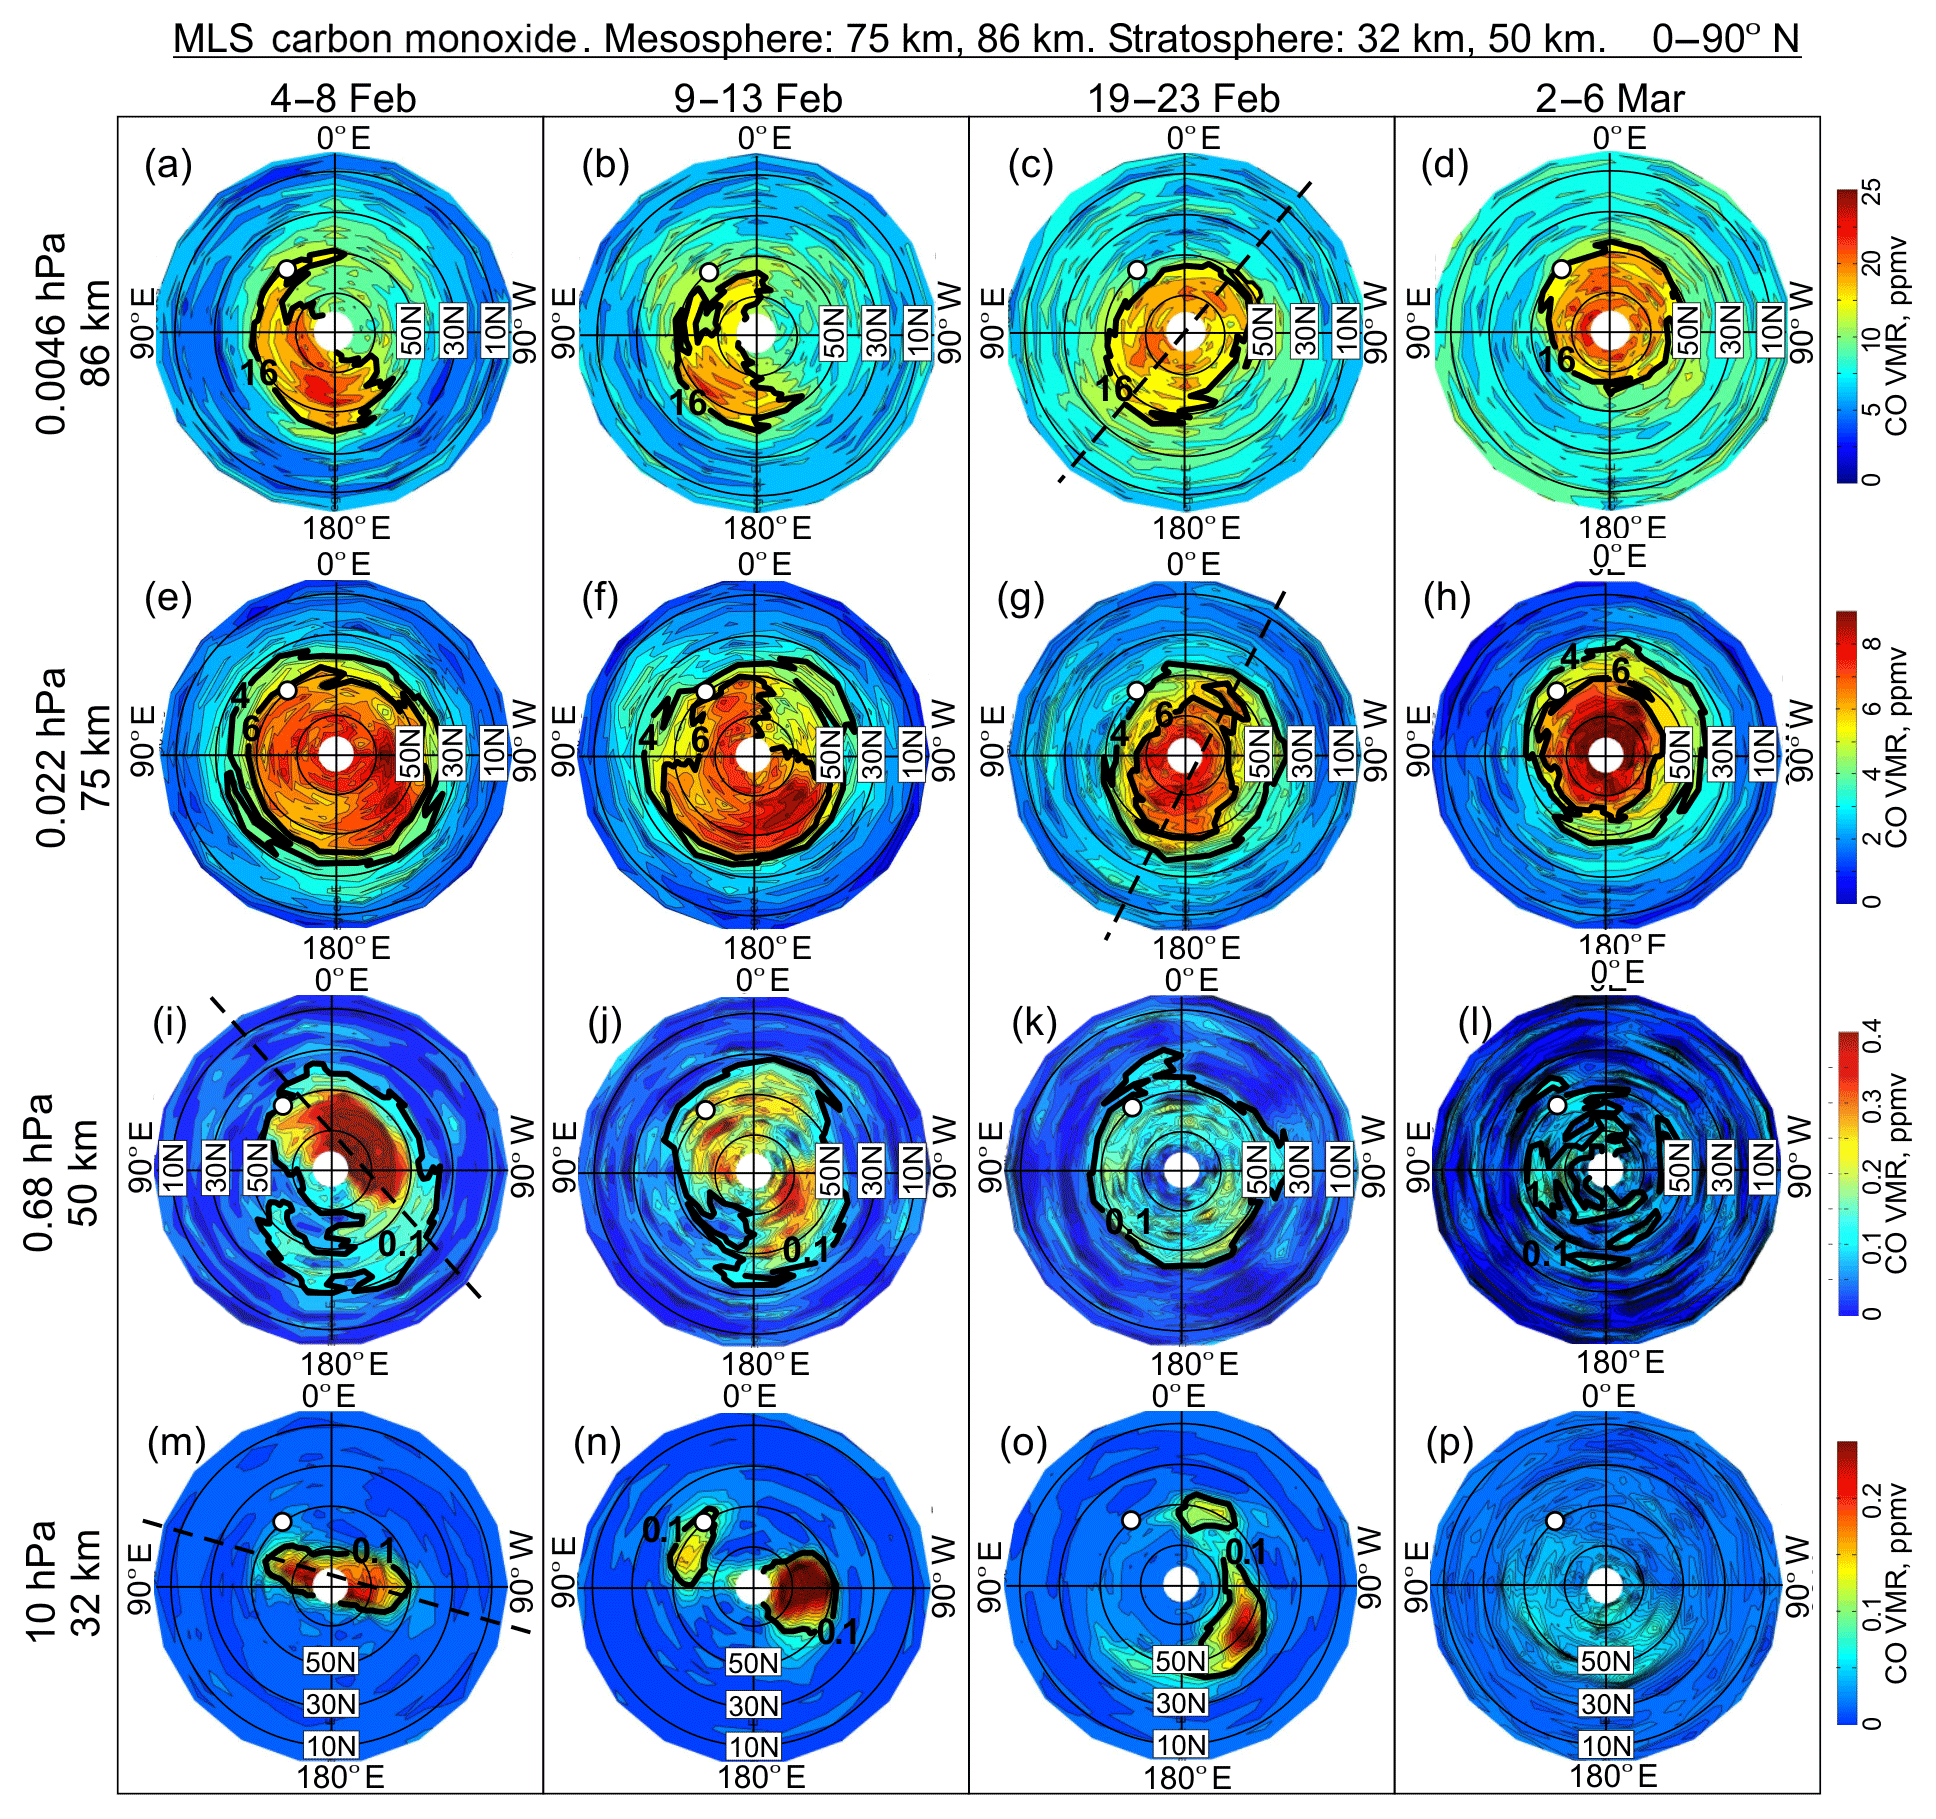
Figure 4The 5 d mean CO field over the NH (0–90∘ N) from the MLS measurements at the two mesospheric (75 and 86 km) and stratospheric (32 and 50 km) levels before (4–8 February), during (9–13 and 19–23 February), and after (2–6 March) the SSW 2018. White circle shows the location of the MWR site, Kharkiv, relative to the high/low CO amounts marked off by black contours. Dashed lines indicate clockwise rotation of the elongated polar vortex with altitude as manifestation of upward propagation of planetary waves with their westward tilt with altitude.
The local mesospheric CO variability from the MWR observations over Kharkiv agrees with the regional one from the MLS data averaged over the adjacent area 47.5–52.5∘ N, 26–46∘ E (Fig. 3b, the white curve for 6 ppmv). However, the zonal mean CO profiles in the same zone do not show an anomalous decrease in the mesospheric CO during the SSW (yellow curve in Fig. 3a, b, and e).
Unlike the mesosphere, the CO descent and an increase in CO abundance is observed in the stratosphere from both regional and zonal mean MLS data shortly after the SSW start (contour 0.1 ppmv in Fig. 3d and g, respectively). The CO-rich air of 0.1–0.5 ppmv, which is typical for the lower mesosphere (Fig. 3c) descended down to about 30 km (Fig. 3d and g), far exceeding typical stratospheric CO mixing ratios on the order of about 0.01–0.02 ppmv (Engel et al., 2006; Huret et al., 2006; Funke et al., 2009). The CO-rich stratospheric anomaly is close in time to the wave 1 peak on 10–15 February (solid curve in Fig. 2e), that was observed through the stratosphere down to the 30 km altitude (Fig. 2c).
Horizontal distributions of the CO VMR in the Northern Hemisphere at the stratospheric and mesospheric altitudes in Fig. 4 suggest causes for the different CO variability in the stratosphere and mesosphere in Fig. 3. The dynamical deformation, elongation, and displacements of the polar vortex relative to the pole lead to temporal shifts between the low and high CO amounts over the MWR site at Kharkiv (white circle in Fig. 4). The tendency of the planetary wave westward tilt with altitude (dashed lines in Fig. 4, see also Figs. S1 and S2 in the Supplement for more details) also contributes to a relative zonal shift between the stratosphere and the mesosphere of the low and high CO amounts over Kharkiv.
The observed decrease in the local CO in the mesosphere during the SSW (white curve in Fig. 3a) is consistent with regional data from the satellite observations (white curve in Fig. 3b). The decrease is due to the displacement of the CO-rich air to the west relative to Kharkiv (white circle and contours outlined the CO-rich area in Fig. 4a–c and e–g). This is a result of the dominance of easterlies during the SSW that led to placing of the CO-poor air over Kharkiv with the lowest CO levels on 19–23 February (Fig. 4c and g) in correspondence with the MWR (Fig. 3a) and MLS (Fig. 3b) measurements. Recovery to the westerly regime in early March reversed the rotation of the vortex (2–6 March in Fig. 4d and h) and caused recovery of high CO levels over Kharkiv (since about 1 March in Fig. 3a and b).
The polar vortex split influenced the local CO change in the middle stratosphere (Fig. 4m–o). The low CO level at ∼30 km before the SSW start (Fig. 3d) is associated with the relatively distant location of the CO-rich vortex from Kharkiv (Fig. 4m). The vortex split and easterly circulation caused displacement of the small vortex fragment with the CO level higher than 0.1 ppmv to Kharkiv just at the SSW start (9–13 February in Fig. 4n) and corresponding sharp CO increase over the Kharkiv region around 30 km altitude (contour 0.1 ppmv in a few days after 10 February in Fig. 3d). Vertical CO profiles in Fig. 3c and d show that downward penetration of the mesospheric CO-rich air into the stratosphere took place around 10 February. As seen from Fig. 4f, j, and n, the mesospheric CO-rich air appears to be contained inside the small subvortex over Kharkiv. The large subvortex (Fig. 4n and o) contributed to the stratospheric CO increase after 10 February in the zonal mean CO profile near 30 km (Fig. 3g). The two subvortices in Fig. 4n and o provided a longer duration for the mesospheric intrusion in the zonal mean (Fig. 3g) than a short-time influence of the single subvortex in regional data (Fig. 3d).
It should be noted that the lower edge of the midlatitude CO-rich air descended in January to mid-February (dashed lines in Fig. 3d and g) similarly to the temperature anomaly in the polar region (Fig. 2a). Descent velocity was about −270 and −220 m d−1 in the case of the regional and zonal mean data, respectively. This is a few times lower than in the vortex region; nevertheless, it is in the range of the winter descent velocity noted above (Ryan et al., 2018).
Note also that the vortex split in the CO distribution can be identified only in the middle and upper stratosphere (Figs. 4n and o and S1j and S1k), but not at the stratopause level (Fig. 4j and k) or in the mesosphere (Fig. S2, second and third columns for 9–13 and 19–23 February 2018, respectively).
4.2 Zonal wind variability
The reversal of the local zonal wind estimated from the CO measurements at the Kharkiv MWR site near the mesopause region was observed. The averaged wind velocity in the altitude range 70–85 km changed between 10 and −10 m s−1 around 10 February (Fig. 5a). After the active phase of the SSW, the zonal wind recovers to the westerly wind and enhances to 20 m s−1 reaching the highest velocity observed in January–March (Fig. 5a). This zonal wind peak in early March is accompanied by the CO peak at 18 ppmv around 85 km that is also the highest CO abundance over January–March (Fig. 3a). This is closely consistent with the MLS measurements at the 86 km altitude: Kharkiv being located on the 16 ppmv contour in early March (2–6 March in Fig. 4d).

Figure 5(a) Mesospheric zonal wind microwave measurements over Kharkiv (averaged in altitude range 70–85 km, vertical bars are standard deviations) compared to (b) time–altitude local zonal wind from the ERA-Interim reanalysis data averaged over latitudes 48–52∘ N and longitudes 34–38∘ E (centered at the Kharkiv microwave radiometer site; 50∘ N, 36∘ E). The time interval of significant variations in the atmosphere parameters due to the SSW event (from 10 February to 1 March 2018) is bounded by red vertical lines.
During the SSW event, local zonal wind over the station became easterly between the lower stratosphere and lower mesosphere (−30 up to −40 m s−1, white contours in Fig. 5b). Note that westerly zonal wind at the stratopause level (∼50 km) in January 2018 (mid-winter, the pre-SSW conditions) sometimes increased to more than 100 m s−1 (black contours in Fig. 5b).
The recovery of the local westerly wind in the upper mesosphere began in late February (Fig. 5a) and later, in early March, in the lower mesosphere–stratosphere (Fig. 5b). The longer persistence of the westerly anomaly in the stratosphere than at the stratopause level is also seen in the polar region (Fig. 2b). This is a manifestation of the downward migration of the circulation anomalies in the SSW recovery phase, while a near-instantaneous vertical coupling is observed at the SSW start on 10 February (Figs. 2a–d and 5).
4.3 Temperature changes
The MLS temperature profiles show that high temperature variability over the Kharkiv region concentrated at the stratopause level, particularly before and during the SSW of 2018 (Fig. 6). As known, the SSW events are accompanied by polar stratopause descent to 30–40 km, by stratopause breakdown, and subsequent reformation at very high altitudes of about 70–80 km (Manney et al., 2009; Chandran et al., 2011; Limpasuvan et al., 2016; Orsolini et al., 2017). The midlatitude stratopause exhibits less sharp, but significant, oscillations between 40 and 50 km in January to the first half of February 2018 (dotted curve in Fig. 6) and the highest temperature near −5 ∘C after the SSW start on 12–13 February. The short-time stratopause elevation to the lower-mesospheric altitude of ∼60 km was observed near 20 February, i.e., close in time to the maximum elevation of the 6 ppmv CO level in the mesosphere (Fig. 3a and b). Note that wave 1 and wave 2 (Fig. 2c–e), and zonal wind (Fig. 5), do not demonstrate strong anomalies this time. The post-SSW stratopause stabilized at the 50 km altitude and warmed from about −20 to −10 ∘C (Fig. 6b).
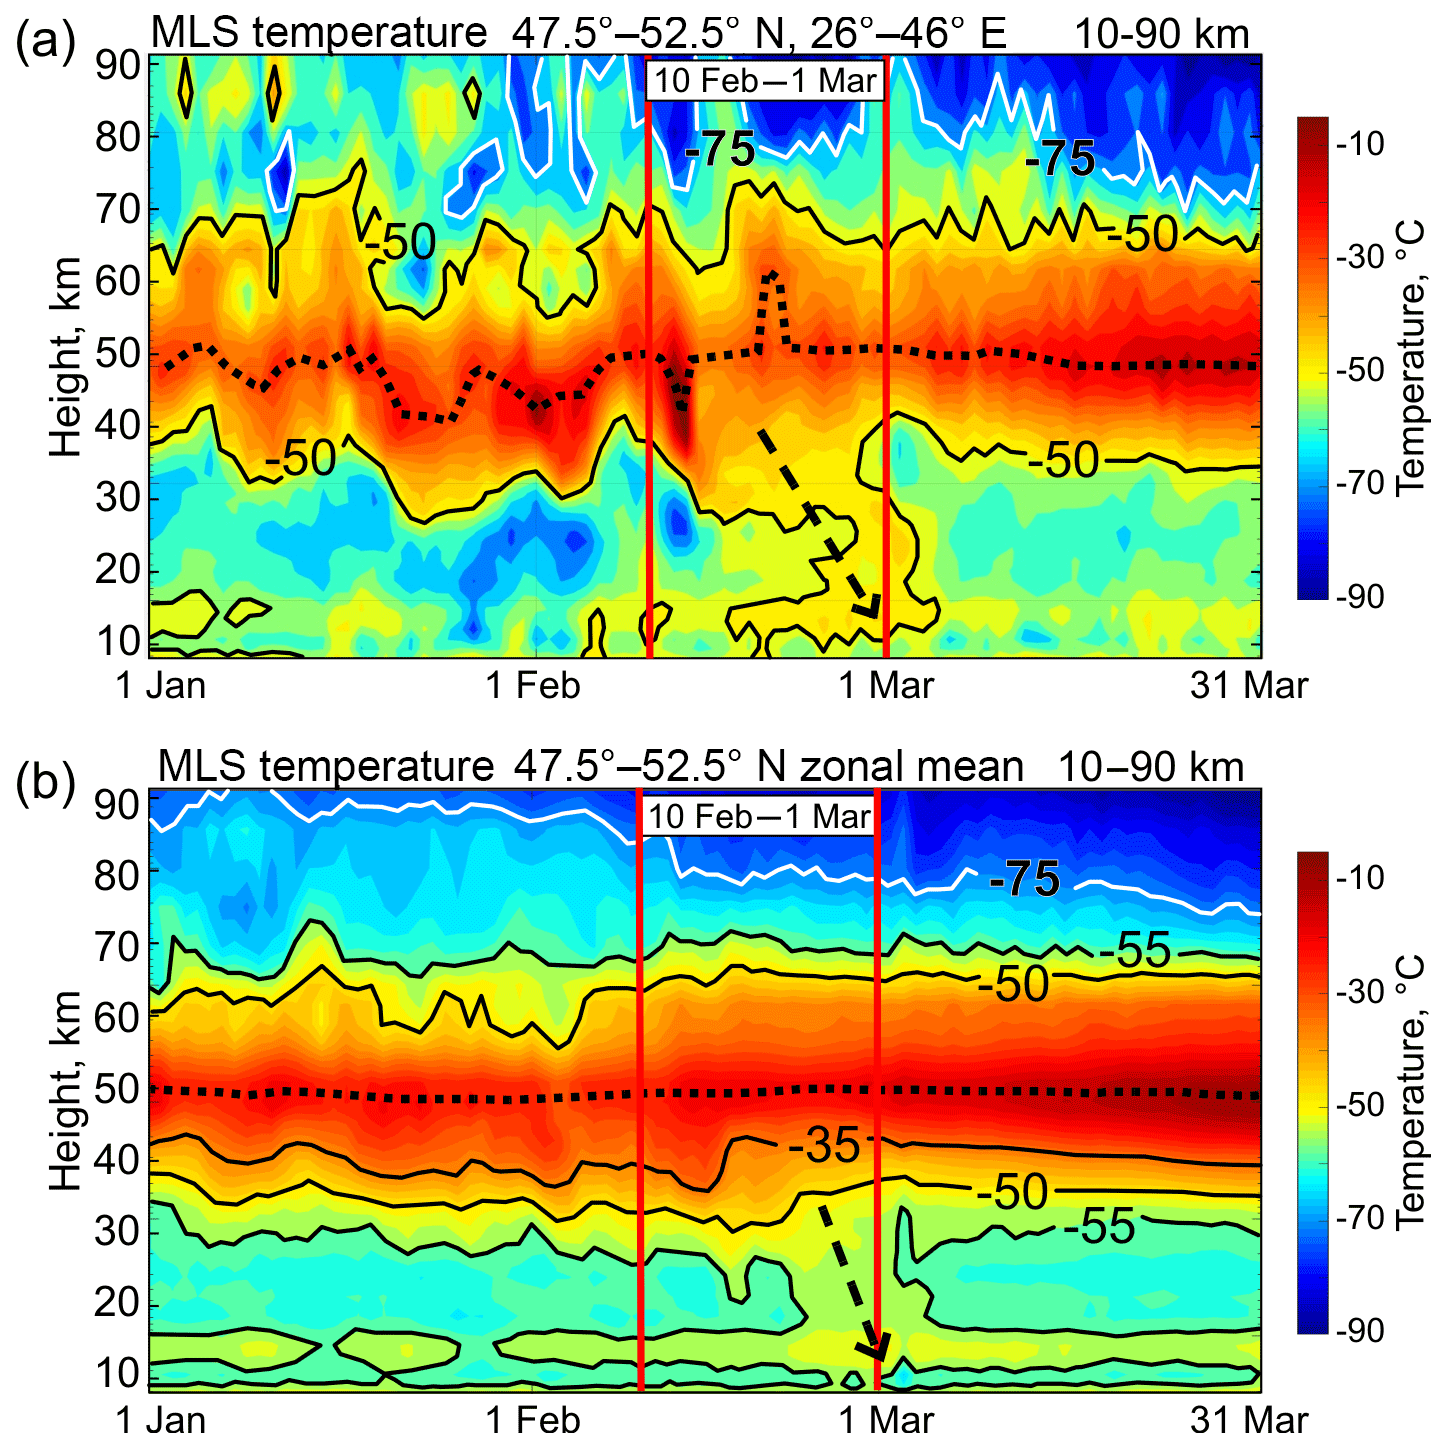
Figure 6MLS temperature profiles (a) over the Kharkiv region and (b) zonal average in the zone 47.5–52.5∘ N. Dashed arrows indicate downward warming.
Similarly to the CO profile in Fig. 3, the zonal mean temperature variability is much lower above the stratopause than the regional one (Fig. 6b and a, respectively). The stratosphere is equally disturbed in both regional and zonal mean characteristics (Figs. 3d and g and 6a and b). This difference may be associated with the influence of the split (non-split) polar vortex in the stratosphere (mesosphere). The vortex fragments introduce higher local, regional, and zonal mean variability in the stratosphere, whereas the vortex region is more uniform in the mesosphere (Fig. 4). That results in the weaker zonal mean variability.
During the SSW, the regional stratospheric temperature in Fig. 6a was warmer by 10–15 ∘C in comparison with the pre- and post-SSW temperature. This local warming is about 2 times lower than in the polar region (Fig. 2a) and about 3 times lower than it is typically observed during the SSWs (see Sect. 1). It should be noted that this warm stratospheric anomaly in Fig. 6a (contour −50 ∘C) rapidly descended between the upper and lower stratosphere (dashed arrow) in about 10 d. A similar tendency is seen in Fig. 6b from the zonal mean (contour −55 ∘C) but with a descent within a few days (arrow). So, the SSW start in the midlatitude stratosphere is not accompanied by a near-instantaneous vertical coupling as observed in the polar region (Fig. 2a–d). Midlatitude stratospheric warming in February 2018 occurred with increasing time lag between the upper and lower stratosphere.
As is known, upward propagation of the tropospheric planetary waves into the stratosphere is limited in the easterly zonal wind (Charney and Drazin, 1961). In the changed state of a zonal flow, the critical line for planetary waves (zero wind line) in the polar region descents in a few days that looks like downward propagation of an anomaly from above (Matsuno, 1971; Zhou et al., 2002). Possibly, this process may be delayed in the midlatitudes, as seen from Fig. 6.
The observations of the major SSW effects in February 2018 in the NH midlatitude mesosphere by microwave radiometer at the Kharkiv site, northern Ukraine (50.0∘ N, 36.3∘ E), are provided. The CO altitude profiles in the mesosphere are measured by the MWR with 1 d time resolution. Using the CO molecule as a tracer, the wind speed was retrieved from the Doppler shift of the CO 115.3 GHz emission and mesospheric winds reversing from westerly to easterly below the winter mesopause region (70–85 km) was detected. A few ground-based observations in the mesosphere by the same method were undertaken at midlatitudes (Sect. 1). The zonal wind and CO profile variability during the major SSW were compared with the daily zonal wind, temperature, and zonal wave 1 or wave 2 datasets from the MLS data, the ERA-Interim, and MERRA-2 reanalyses. The SSW started with the polar vortex split around 10 February (Fig. 1), zonal wind reversal in the mesosphere and stratosphere (Figs. 2b and 5), and enhanced stratosphere warming and mesosphere cooling (Fig. 2a).
5.1 Wave patterns and CO level
As noted in Sect. 1, CO abundance in the extratropical mesosphere increases with latitude toward the winter pole due to meridional transport. CO accumulation results in the formation of the CO layer with a sharp vertical gradient at its lower edge (Solomon et al., 1985; Shepherd et al., 2014). Because of the horizontal CO gradient at the polar vortex edge, its split and displacement during the SSW cause a significant CO variability at the NH midlatitudes (Solomon et al., 1985; Allen et al., 1999; Funke et al., 2009; Shepherd et al., 2014).
In Sect. 4a, based on the MWR observations, we have defined the lower CO edge at 6 ppmv and this edge uplifted during the SSW by about 8 km (between 75 and 83 km, thick part of the white curve in Fig. 3a). This uplifting noticeably stands out against the pre- and post-SSW variations of the 6 ppmv level occurring within 2–3 km (Fig. 4a). The MLS CO measurements show similar variations in the 6 ppmv level over the Kharkiv region (white curve in Fig. 3b) and their absence in the corresponding zonal mean (yellow curve in Fig. 3a, b, and e).
Mesospheric CO profile uplifting is usually associated with the stratopause elevation during the SSW, when air, poor in CO, enters the mesospheric CO layer from below (Kvissel et al., 2012; Shepherd et al., 2014). Similar ascending motions in the stratopause and mesopause regions were observed in the 2013 SSW from nitric oxide (NO) and showed that the NO contours deflected upwards throughout the mesosphere (Orsolini et al., 2017). Our analysis reveals that the local CO profile variations during the SSW of 2018 were closely associated with the changes in the planetary wave patterns in the mesosphere.
The MLS CO distribution demonstrates how deformation, elongation (wave 2 effect), and rotation of the CO-rich polar area influence the local CO level over Kharkiv (white circle with respect to the CO contours in Figs. 4a–h and S1). The highest elevation of the 6 ppmv CO level in Fig. 3a and b corresponds to the lowest CO level over Kharkiv on 19–23 February, when the most distant displacement of the CO contours 16 and 6 ppmv off the Kharkiv location was observed (Fig. 4c and g, respectively; see also the third column in Fig. S1). As known, the strong vertical CO gradient in the winter mesosphere is found at the higher altitudes in the tropics than in the extratropics (Solomon et al., 1985; Allen et al., 1999; Garcia et al., 2014). Then, poleward displacement of the low-latitude air masses is accompanied by the CO abundance decrease and vertical CO gradient elevation at the middle latitudes, as is observed in Fig. 3a and b. A similar effect related to the wave 1 influence was observed during the 2003–2004 Arctic warming (Funke et al., 2009): the vortex has shifted from the pole toward the western sector and midlatitude air poor in CO filled the eastern sector (0–90∘ E) over 50–80∘ N and even over the pole.
The results of Figs. 4 and S1 show that meridional displacements of the low-latitude CO-poor mesospheric air to the Kharkiv region occurred under the planetary wave influence and caused the local CO profile variations in the SSW of 2018 (Fig. 3a and b). These results, thus, confirm that latitudinal displacements due to wave effects may dramatically affect the local densities of the atmospheric species (Solomon et al., 1985). Figure 6a demonstrates that the local stratopause elevation in February 2018 to about 60 km was relatively small in comparison with the elevation that is characteristic for the polar region, up to 70–80 km (Chandran et al., 2011; Tomikawa et al., 2012; Limpasuvan et al., 2016; Orsolini et al., 2010, 2017). No significant stratopause elevation was observed in the zonal mean for 47.5–52.5∘ N (Fig. 6b). Therefore, the meridional (poleward) and zonal displacements of the CO-rich air masses enclosed within the polar vortex (Solomon et al., 1985; Allen et al., 1999; Funke et al., 2009), rather than stratopause elevation (Kvissel et al., 2012; Shepherd et al., 2014), may be the dominant cause of the CO profile uplift observed in the NH midlatitudes during the SSW of 2018.
In March 2018, after the SSW, the vertical CO profile was re-established (Fig. 3a and b) according to the recovery phase following the SSW (Shepherd et al., 2014; Limpasuvan et al., 2016). In the MWR data, the SSW recovery phase in the mesosphere in early March started with the short-term but anomalously high peaks in the local CO (Fig. 3a) and westerly wind (Fig. 5a). These peaks reached the highest values in daily variations in CO and zonal wind over the 3 months of the observations (January–March). By analogy with the low-CO episode in February discussed above, the high-CO peak in early March 2018 caused a change in the vortex shape and the return of the CO-rich vortex edge region to the Kharkiv location (compare 2–6 March in Fig. 4d and h with 19–23 February in Fig. 4c and g; see also the same dates in Fig. S2).
Wind measurements using the CO layer provide a further means to evaluate the validity of the modeled winds. Furthermore, by combining the measurements with ray tracing of gravity wave propagation (e.g., Kogure et al., 2018), this type of measurement may provide specific insights into wave–mean flow interactions, particularly where local temperature inversions alter gravity wave filtering (Hocke et al., 2018; Fritts et al., 2018).
5.2 Descent of the midlatitude stratospheric anomalies
An alternating altitudinal sequence of warm and cool anomalies progressively descending through the mesosphere and stratosphere of the polar region was observed in January–March 2018 (Fig. 2a) in consistency with many observations (Zhou et al., 2002; Orsolini et al., 2010; Shepherd et al., 2014; de Wit et al., 2014; Zülicke et al., 2018). The warm anomaly sharply intensified in the stratosphere between 20 and 50 km with simultaneous strong cooling in the mesosphere in the active phase of SSW since 10 February (vertical arrow in Fig. 2a). Unlike this, the midlatitude temperature anomalies do not show a similar vertical arrangement and regular descent with respect to the same mean climatology 2005–2017 (Fig. S3).
During the SSW of 2018, the upper (lower) stratosphere over the Kharkiv region was cooler (warmer) up to 20 ∘C (10 ∘C) than climatological mean with stepwise descent relative to the pre-SSW one (Fig. S3a). However, excluding unstable anomalies at different altitudes, the air temperature through the mesosphere and stratosphere was close to the climatology during most of the time in January–March 2018 (light blue in Fig. S3a). The zonal mean temperature anomalies in Fig. S3b show steady warming of the air in the stratosphere and lower mesosphere and a distinct tendency for the anomaly to descend between about 40 and 20 km during the SSW (20 d, km d−1). It could be concluded that the temperature anomaly profile observed in the NH midlatitudes may vary in time depending on the observing location and individual SSW event and, thus, differ from climatologically warm (cold) stratospheric (mesospheric) anomaly typical for the SSWs in the NH polar region (e.g., Chandran and Collins, 2014; their Fig. 1g).
The CO profiles in Fig. 3 demonstrate opposite tendencies in the vertical shift of the CO-rich air in the NH midlatitudes. The CO descent in the stratosphere occurred during January–February with velocities of about 270 and 220 m d−1 in the case of regional and zonal mean data, respectively (Fig. 3d and g). In general, this is in a range of the winter descent velocities observed in the polar vortex (Funke et al., 2009; Salmi et al., 2011; Ryan et al., 2018) but a few times lower than in the polar vortex in the winter 2017–2018 (Fig. 2a). The deepest penetration of the mesospheric CO levels (0.1–0.5 ppmv) to ∼30 km was observed immediately after the SSW onset (Fig. 3d and g). Although this coincides with the peaks in the wave 1 and wave 2 amplitudes (Fig. 2e), the main reason for the CO increase in the stratosphere over Kharkiv is the location of the small subvortex of the split polar vortex (9–13 February, Fig. 4n).
The MLS CO maps in Fig. 4 show that the high CO amount is concentrated inside the polar vortex and its fragments after splitting. This is a result of meridional and downward transport of CO that is strongest in the winter polar vortex (Rinsland et al., 1999; Manney et al., 2009; Kvissel et al., 2012; Shepherd et al., 2014). Before (4–8 February), during (19–23 February), and after (2–6 March) the SSW, Kharkiv was outside the stratospheric vortex or subvortex edge (Fig. 4m, o, and p, respectively) and the CO amount was at low level typical for the midlatitude stratosphere (of about 0.01–0.02 ppmv; Engel et al., 2006; Huret et al., 2006; Funke et al. 2009). Descent of the 0.1 ppmv contour marked by dashed lines in Fig. 3d and g is observed due to the episodic shift of the vortex edge toward the Kharkiv region or to the corresponding zone 47.5–52.5∘ N, respectively.
Figure 4 demonstrates that the CO amount inside the polar vortex or its fragments is much higher than in the surrounding area not only in the mesosphere but also in the stratosphere. This leads to the possibility of the enhanced CO appearance even in the stratosphere at about 25–30 km (Engel et al., 2006; Huret et al., 2006; Funke et al., 2009). By analogy, the vortex edge shift beyond the Kharkiv region (Fig. 4c and g) resulted in lowering of the regional CO mixing ratios in the mesosphere consistent with both ground-based and satellite observations (Fig. 3a and b, respectively). Meridional structure of the mesospheric CO (Sect. 1) provided the uplift of the 6 ppmv level during the SSW relative to pre- and post-SSW levels (Fig. 3a and b).
The impact of a major sudden stratospheric warming (SSW) in February 2018 on the midlatitude mesosphere was investigated using microwave radiometer measurements in Kharkiv, Ukraine (50.0∘ N, 36.3∘ E). The zonal wind reversal has been revealed below the winter mesopause region at 70–85 km altitudes during the SSW using the CO profiles. The reverse of the mesospheric westerly from about 10 m s−1 to easterly wind of about −10 m s−1 around 10 February has been documented. The data from the ERA-Interim and MERRA-2 reanalyses and the Aura MLS temperature profiles have been used for the analysis of stratosphere–mesosphere behavior under the SSW conditions. Our local microwave observations in the NH midlatitude combined with the reanalysis data show wide ranges of daily variability in CO, zonal wind, and temperature in the mesosphere and stratosphere during the SSW of 2018.
Among the most striking SSW manifestations over the midlatitude station in February 2018, there were (i) zonal wind reversal throughout the mesosphere–stratosphere; (ii) oscillations in the vertical profiles of CO, zonal wind and temperature; (iii) descent of the stratospheric CO, and temperature anomalies on the timescale of days to months; (iv) wave 2 peak at the vortex split date; and (v) strong mesospheric CO and westerly peaks at the start of the SSW recovery phase. Generally, the midlatitude SSW effects are known from many event analyses and in most cases they are associated with zonal asymmetry and polar vortex split and displacements relative to the pole (Solomon et al., 1985; Allen et al., 1999; Yuan et al., 2012; Chandran and Collins, 2014). Our results show that the local midlatitude atmosphere variability in the SSW of 2018 includes both the large-scale changes in the zonal circulation and temperature typical for the SSWs and local evolution of the altitude-dependent planetary wave patterns in the individual vortex split event.
The observed local CO variability can be explained mainly by horizontal air mass redistribution due to planetary wave activity with the replacement of the CO-rich air by CO-poor air and vice versa, in agreement with other studies. The MLS CO fields show that the CO-rich air masses are enclosed within the polar vortex. Horizontal (meridional and zonal) displacements of the edge of the vortex or vortex fragments relative to the ground-based midlatitude station may be a dominant cause of the observed CO profile variations during the SSW of 2018. The small subvortex located over the station at the SSW start caused the appearance of the enhanced CO level not only in the mesosphere but also in the stratosphere at about 30 km. This indicates that the polar vortex contains the CO-rich air masses with much higher CO amount than in the surrounding area and this takes place over the stratosphere–mesosphere altitude range.
Microwave observations show that a sharp altitudinal CO gradient below the mesopause could be used to define the lower edge of the CO layer and to evaluate oscillation and significant elevation of the lower CO edge during the SSW and its trend on a seasonal timescale. The presented results of microwave measurements of CO and zonal wind in the midlatitude mesosphere at 70–85 km altitudes, which is still not adequately covered by ground-based observations (Hagen et al., 2018; Rüfenacht et al., 2018), are suitable for evaluating and potentially improving atmospheric models. Simulations show that planetary wave forcing by westward-propagating wave 1 dominates between 40 and 80 km in the winter polar region during the SSW (Limpasuvan et al., 2016). Our spectral analysis reveals that the westward wave 1 during the SSW of 2018 is a dominant wave component through the midlatitude upper stratosphere–mesosphere. Instability of the westward polar jet suggested in previous studies (e.g., Limpasuvan et al., 2016) should be analyzed in the context of the westward wave 1 generation in the midlatitude upper stratosphere–mesosphere.
Our observation of variability in the CO layer during the SSW deserves further study, particularly in relation to the implications for modeling of wave dynamics and vertical coupling (Ern et al., 2016; Martineau et al., 2018) and chemical processes (Garcia et al., 2014) in the mesosphere.
The majority of the data used in this study can be obtained from the ERA-Interim reanalysis of the European Centre for Medium-Range Weather Forecasts (ECMWF; Dee et al., 2011; https://www.ecmwf.int/en/forecasts/datasets/archive-datasets/; ECMWF, 2019), from the National Oceanic and Atmospheric Administration, National Centers for Environmental Prediction, Global Data Assimilation System–Climate Prediction Center (Okamoto and Gerber, 2006; https://www.cpc.ncep.noaa.gov/products/stratosphere/strat-trop; last access: 15 May 2019). The MERRA-2 data (Gelaro et al., 2017) are available from the National Aeronautics and Space Administration, Goddard Space Flight Center, Atmospheric Chemistry and Dynamics Laboratory website at https://acd-ext.gsfc.nasa.gov/Data_services/met/ann_data.html (MERRA-2, 2019). The Aura microwave limb sounder (MLS) data (Xu et al., 2009) can be obtained at https://mls.jpl.nasa.gov/data/readers.php (Aura MLS, 2019). The datasets collected from the microwave radiometer measurements above Kharkiv, Ukraine, are available from Valerii Shulga (shulga@rian.kharkov.ua) upon request. The microwave radiometer data have been processed using the Atmospheric Radiative Transfer Simulator (ARTS) and Qpack software packages (Buehler et al., 2018) available at http://www.radiativetransfer.org (ARTS Qpack, 2019).
The supplement related to this article is available online at: https://doi.org/10.5194/acp-19-10303-2019-supplement.
GM coordinated and led the efforts for this article. VS initiated the microwave measurements during the SSW event in Kharkiv. VS, DS, VM, and AA developed equipment and provided microwave measurements with data processing by AP and DS. GM, VS, YW, OE, AK, and AG analyzed the results and provided interpretation. GM, OE, AK, YW, VS, and WH wrote the paper with input from all authors.
The authors declare that they have no conflict of interest.
We acknowledge the Institute of Radio Astronomy of the National Academy of Sciences of Ukraine for providing operation of the MWR facility. GM, VS, and YW acknowledge the College of Physics, International Center of Future Science, Jilin University, China, for hosting them during data analysis and paper preparation. The microwave radiometer data have been processed using ARTS and Qpack software packages (http://www.radiativetransfer.org/, last access: 18 February 2019). Daily datasets from ERA-Interim reanalysis of the European Centre for Medium-Range Weather Forecasts (ECMWF) were downloaded from https://www.ecmwf.int/en/forecasts/datasets/archive-datasets/reanalysis-datasets/era-interim (last access: 27 February 2019). The Aura microwave limb sounder (MLS) measurements of air temperature and CO were obtained from https://mls.jpl.nasa.gov/data/readers.php (last access: 15 May 2019). Zonal waves were analyzed using the National Oceanic and Atmospheric Administration, National Centers for Environmental Prediction, Global Data Assimilation System–Climate Prediction Center (NOAA NCEP GDAS–CPC) data at https://www.cpc.ncep.noaa.gov/products/stratosphere/strat-trop/ (last access: 15 May 2019) and the MERRA-2 data from the National Aeronautics and Space Administration, Goddard Space Flight Center, Atmospheric Chemistry and Dynamics Laboratory (NASA GFC ACDL) site at https://acd-ext.gsfc.nasa.gov/Data_services/met/ann_data.html (last access: 12 July 2019). Authors thank the two anonymous reviewers for their valuable comments and useful suggestions.
This research has been supported in part by the Taras Shevchenko National University of Kyiv, Ukraine (grant no. 19BF051-08).
This paper was edited by Farahnaz Khosrawi and reviewed by two anonymous referees.
Alexander, S. P. and Shepherd, M. G.: Planetary wave activity in the polar lower stratosphere, Atmos. Chem. Phys., 10, 707–718, https://doi.org/10.5194/acp-10-707-2010, 2010.
Allen, D. R., Stanford, J. L., López-Valverde, M. A., Nakamura, N., Lary, D. J., Douglass, A. R., Cerniglia, M. C., Remedios, J. J., and Taylor F. W.: Observations of middle atmosphere CO from the UARS ISAMS during the early northern winter 1991/92, J. Atmos. Sci., 56, 563–583, 1999.
ARTS Qpack: available at: http://www.radiativetransfer.org, last access: 18 February 2019.
Aura MLS, Aura microwave limb sounder: EOS MLS Data Readers, available at: https://mls.jpl.nasa.gov/data/readers.php, last access: 15 May 2019.
Baldwin, M. P. and Dunkerton, T. J.: Stratospheric harbingers of anomalous weather regimes, Science, 294, 581–584, https://doi.org/10.1126/science.1063315, 2001.
Buehler, S. A., Mendrok, J., Eriksson, P., Perrin, A., Larsson, R., and Lemke, O.: ARTS, the Atmospheric Radiative Transfer Simulator – version 2.2, the planetary toolbox edition, Geosci. Model Dev., 11, 1537–1556, https://doi.org/10.5194/gmd-11-1537-2018, 2018.
Butler, A. H. and Gerber, E. P. Optimizing the definition of a sudden stratospheric warming, J. Climate, 31, 2337–2344, https://doi.org/10.1175/JCLI-D-17-0648.1, 2018.
Butler, A. H., Seidel, D. J., Hardiman, S. C., Butchart, N., Birner, T., and Match, A.: Defining sudden stratospheric warmings, B. Am. Meteorol. Soc., 96, 1913–1928, https://doi.org/10.1175/bams-d-13-00173.1, 2015.
Butler, A. H., Sjoberg, J. P., Seidel, D. J., and Rosenlof, K. H.: A sudden stratospheric warming compendium, Earth Syst. Sci. Data, 9, 63–76, https://doi.org/10.5194/essd-9-63-2017, 2017.
Chandran, A. and Collins, R. L.: Stratospheric sudden warming effects on winds and temperature in the middle atmosphere at middle and low latitudes: a study using WACCM, Ann. Geophys., 32, 859–874, https://doi.org/10.5194/angeo-32-859-2014, 2014.
Chandran, A., Collins, R. L., Garcia, R. R., and Marsh, D. R.: A case study of an elevated stratopause generated in the Whole Atmosphere Community Climate Model, Geophys. Res. Lett., 38, L08804, https://doi.org/10.1029/2010GL046566, 2011.
Charlton, A. J. and Polvani, L. M.: A new look at stratospheric sudden warmings. Part I: Climatology and modeling benchmarks, J. Climate, 20, 449–469, https://doi.org/10.1175/JCLI-D-11-00348.1, 2007.
Charney, J. G. and Drazin, P. G.: Propagation of planetary-scale disturbances from the lower into the upper atmosphere, J. Geophys. Res., 66, 83–109, https://doi.org/10.1029/JZ066i001p00083, 1961.
Dee, D. P., Uppala, S. M., Simmons, A. J., Berrisford, P., Poli, P., Kobayashi, S., Andrae, U., Balmaseda, M. A., Balsamo, G., Bauer, P., Bechtold, P., Beljaars, A. C. M., van de Berg, L., Bidlot, J., Bormann, N., Delsol, C., Dragani, R., Fuentes, M., Geer, A. J., Haimberger, L., Healy, S. B., Hersbach, H., Hólm, E. V., Isaksen, L., Kållberg, P., Köhler, M., Matricardi, M., McNally, A. P., Monge-Sanz, B. M., Morcrette, J.-J., Park, B. K., Peubey, C., de Rosnay, P., Tavolato, C., Thépaut, J.-N., and Vitart, F.: The ERA-Interim reanalysis: configuration and performance of the data assimilation system, Q. J. Roy. Meteor. Soc., 137, 553–597, https://doi.org/10.1002/qj.828, 2011.
de la Torre, L., Garcia, R. R., Barriopedro, D., and Chandran, A.: Climatology and characteristics of stratospheric sudden warmings in the Whole Atmosphere Community Climate Model, J. Geophys. Res., 117, D04110, https://doi.org/10.1029/2011JD016840, 2012.
de Wit, R. J., Hibbins, R. E., Espy, P. J., Orsolini, Y. J., Limpasuvan, V., and Kinnison, D. E.: Observations of gravity wave forcing of the mesopause region during the January 2013 major Sudden Stratospheric Warming, Geophys. Res. Lett., 41, 4745–4752, https://doi.org/10.1002/2014GL060501, 2014.
Di Biagio, C., Muscari, G., di Sarra, A., de Zafra, R. L., Eriksen, P., Fiocco, G., Fiorucci, I., and Fuà, D.: Evolution of temperature, O3, CO, and N2O profiles during the exceptional 2009 Arctic major stratospheric warming as observed by lidar and millimeter wave spectroscopy at Thule (76.5∘ N, 68.8∘ W), Greenland, J. Geophys. Res., 115, D24315, https://doi.org/10.1029/2010JD014070, 2010.
ECMWF, European Centre for Medium-Range Weather Forecasts: Access to archive data sets, available at: https://www.ecmwf.int/en/forecasts/datasets/archive-datasets/, last access: 27 February 2019.
Engel, A., Möbius, T., Haase, H.-P., Bönisch, H., Wetter, T., Schmidt, U., Levin, I., Reddmann, T., Oelhaf, H., Wetzel, G., Grunow, K., Huret, N., and Pirre, M.: Observation of mesospheric air inside the arctic stratospheric polar vortex in early 2003, Atmos. Chem. Phys., 6, 267–282, https://doi.org/10.5194/acp-6-267-2006, 2006.
Eriksson, P., Jiménez, C., and Buehler, S. A.: Qpack, a tool for instrument simulation and retrieval work, J. Quant. Spectrosc. Ra., 91, 47–64, https://doi.org/10.1016/j.jqsrt.2004.05.050, 2005.
Eriksson, P., Buehler, S. A., Davis, C. P., Emde, C., and Lemke, O.: ARTS, the atmospheric radiative transfer simulator, version 2, J. Quant. Spectrosc. Ra., 112, 1551–1558, https://doi.org/10.1016/j.jqsrt.2011.03.001, 2011.
Ern, M., Trinh, Q. T., Kaufmann, M., Krisch, I., Preusse, P., Ungermann, J., Zhu, Y., Gille, J. C., Mlynczak, M. G., Russell III, J. M., Schwartz, M. J., and Riese, M.: Satellite observations of middle atmosphere gravity wave absolute momentum flux and of its vertical gradient during recent stratospheric warmings, Atmos. Chem. Phys., 16, 9983–10019, https://doi.org/10.5194/acp-16-9983-2016, 2016.
Feng, W., Kaifler, B., Marsh, D. R., Höffner, J., Hoppe, U.-P., Williams, B. P., and Plane, J. M. C.: Impacts of a sudden stratospheric warming on the mesospheric metal layers, J. Atmos. Sol.-Terr. Phy., 162, 162–171, 2017.
Forkman, P., Christensen, O. M., Eriksson, P., Urban, J., and Funke, B.: Six years of mesospheric CO estimated from ground-based frequency-switched microwave radiometry at 57∘ N compared with satellite instruments, Atmos. Meas. Tech., 5, 2827–2841, https://doi.org/10.5194/amt-5-2827-2012, 2012.
Forkman, P., Christensen, O. M., Eriksson, P., Billade, B., Vassilev, V., and Shulga, V. M.: A compact receiver system for simultaneous measurements of mesospheric CO and O3, Geosci. Instrum. Method. Data Syst., 5, 27–44, https://doi.org/10.5194/gi-5-27-2016, 2016.
Fritts, D. C., Laughman, B., Wang, L., Lund, T. S., and Collins, R. L.: Gravity wave dynamics in a mesospheric inversion layer: 1. Reflection, trapping, and instability dynamics, J. Geophys. Res.-Atmos., 123, 626–648, https://doi.org/10.1002/2017JD027440, 2018.
Funke, B., López-Puertas, M., García-Comas, M., Stiller, G. P., von Clarmann, T., Höpfner, M., Glatthor, N., Grabowski, U., Kellmann, S., and Linden, A.: Carbon monoxide distributions from the upper troposphere to the mesosphere inferred from 4.7 µm non-local thermal equilibrium emissions measured by MIPAS on Envisat, Atmos. Chem. Phys., 9, 2387–2411, https://doi.org/10.5194/acp-9-2387-2009, 2009.
Garcia, R. R., López-Puertas, M., Funke, B., Marsh, D. R., Kinnison, D. E., Smith, A. K., and González-Galindo, F.: On the distribution of CO2 and CO in the mesosphere and lower thermosphere, J. Geophys. Res.-Atmos., 119, 5700–5718, https://doi.org/10.1002/2013JD021208, 2014.
Gardner, C. S.: Role of wave induced diffusion and energy flux in the vertical transport of atmospheric constituents in the mesopause region, J. Geophys. Res.-Atmos., 123, 6581–6604, https://doi.org/10.1029/2018JD028359, 2018.
Gelaro, R., McCarty, W., Suárez, M. J., Todling, R., Molod, A., Takacs, L., Randles, C. A., Darmenov, A., Bosilovich, M. G., Reichle, R., Wargan, K., Coy, L., Cullather, R., Draper, C., Akella, S., Buchard, V., Conaty, A., da Silva, A. M., Gu, W., Kim, G., Koster, R., Lucchesi, R., Merkova, D., Nielsen, J. E., Partyka, G., Pawson, S., Putman, W., Rienecker, M., Schubert, S. D., Sienkiewicz, M., and Zhao, B.: The Modern-Era Retrospective Analysis for Research and Applications, Version 2 (MERRA2), J. Climate, 30, 5419–5454, https://doi.org/10.1175/JCLI-D-16-0758.1, 2017.
Goldsmith, P. F., Litvak, M. M., Plambeck, R. L., and Williams, D. R.: Carbon monoxide mixing ratios in the mesosphere derived from ground-based microwave measurements, J. Geophys. Res., 84, 416–418, 1979.
Hagen, J., Murk, A., Rüfenacht, R., Khaykin, S., Hauchecorne, A., and Kämpfer, N.: WIRA-C: a compact 142-GHz-radiometer for continuous middle-atmospheric wind measurements, Atmos. Meas. Tech., 11, 5007–5024, https://doi.org/10.5194/amt-11-5007-2018, 2018.
Hocke, K., Lainer, M., Bernet, L., and Kämpfer, N.: Mesospheric inversion layers at mid-latitudes and coincident changes of ozone, water vapour and horizontal wind in the Middle Atmosphere, Atmosphere, 9, 171, https://doi.org/10.3390/atmos9050171, 2018.
Hoffmann, C. G., Raffalski, U., Palm, M., Funke, B., Golchert, S. H. W., Hochschild, G., and Notholt, J.: Observation of strato-mesospheric CO above Kiruna with ground-based microwave radiometry – retrieval and satellite comparison, Atmos. Meas. Tech., 4, 2389–2408, https://doi.org/10.5194/amt-4-2389-2011, 2011.
Hu, J., Ren, R., and Xu, H.: Occurrence of winter stratospheric sudden warming events and the seasonal timing of spring stratospheric final warming, J. Atmos. Sci., 71, 2319–2334, https://doi.org/10.1175/JAS-D-13-0349.1, 2014.
Huret, N., Pirre, M., Hauchecorne, A., Robert, C., and Catoire, V.: On the vertical structure of the stratosphere at midlatitudes during the first stage of the polar vortex formation and in the polar region in the presence of a large mesospheric descent, J. Geophys. Res., 111, D06111, https://doi.org/10.1029/2005JD006102, 2006.
Karpechko, A. Yu., Charlton-Perez, A., Balmaseda, M., Tyrrell, N., and Vitart, F.: Predicting sudden stratospheric warming 2018 and its climate impacts with a multimodel ensemble, Geophys. Res. Lett., 24, 13538–13546, https://doi.org/10.1029/2018GL081091, 2018.
Keuer, D., Hoffmann, P., Singer, W., and Bremer, J.: Long-term variations of the mesospheric wind field at mid-latitudes, Ann. Geophys., 25, 1779–1790, https://doi.org/10.5194/angeo-25-1779-2007, 2007.
Kogure, M., Nakamura, T., Ejiri, M. K., Nishiyama, T., Tomikawa, Y., and Tsutsumi, M.: Effects of horizontal wind structure on a gravity wave event in the middle atmosphere over Syowa (69∘ S, 40∘ E), the Antarctic, Geophys. Res. Lett., 45, 5151–5157. https://doi.org/10.1029/2018GL078264, 2018.
Koo, J.-H., Walker, K. A., Jones, A., Sheese, P. E., Boone, C. D., Bernath, P. F., and Manney, G. L.: Global climatology based on the ACE-FTS version 3.5 dataset: Addition of mesospheric levels and carbon-containing species in the UTLS, J. Quant. Spectrosc. Ra., 186, 52–62, https://doi.org/10.1016/j.jqsrt.2016.07.003, 2017.
Kuttippurath, J. and Nikulin, G.: A comparative study of the major sudden stratospheric warmings in the Arctic winters 2003/2004–2009/2010, Atmos. Chem. Phys., 12, 8115–8129, https://doi.org/10.5194/acp-12-8115-2012, 2012.
Kvissel, O. K., Orsolini, Y. J., Stordal, F., Limpasuvan, V., Richter, J., and Marsh, D. R.: Mesospheric intrusion and anomalous chemistry during and after a major stratospheric sudden warming, J. Atmos. Sol.-Terr. Phy., 78–79, 116–124, https://doi.org/10.1016/j.jastp.2011.08.015, 2012.
Limpasuvan, V., Orsolini, Y. J., Chandran, A., Garcia, R. R., and Smith, A. K.: On the composite response of the MLT to major sudden stratospheric warming events with elevated stratopause, J. Geophys. Res.-Atmos., 121, 4518–4537, https://doi.org/10.1002/2015JD024401, 2016.
Manney, G. L., Schwartz, M. J., Krüger, K., Santee, M. L., Pawson, S., Lee, J. N., Daffer, W. H., Fuller, R. A., and Livesey, N. J.: Aura Microwave Limb Sounder observations of dynamics and transport during the record-breaking 2009 Arctic stratospheric major warming, Geophys. Res. Lett., 36, L12815, https://doi.org/10.1029/2009GL038586, 2009.
Martineau, P., Son, S.-W., Taguchi, M., and Butler, A. H.: A comparison of the momentum budget in reanalysis datasets during sudden stratospheric warming events, Atmos. Chem. Phys., 18, 7169–7187, https://doi.org/10.5194/acp-18-7169-2018, 2018.
Matsuno, T.: A dynamical model of the stratospheric sudden warming, J. Atmos. Sci., 28, 1479–1494, https://doi.org/10.1175/1520-0469(1971)028<1479:ADMOTS>2.0.CO;2, 1971.
MERRA-2: Modern-Era Retrospective analysis for Research and Applications, Version 2, available at: https://acd-ext.gsfc.nasa.gov/Data_services/met/ann_data.html, last access: 12 July 2019.
Muscari, G., di Sarra, A., de Zafra, R. L., Lucci, F., Baordo, F., Angelini, F., and Fiocco, G.: Middle atmospheric O3, CO, N2O, HNO3, and temperature profiles during the warm Arctic winter 2001–2002, J. Geophys. Res., 112, D14304, https://doi.org/10.1029/2006JD007849, 2007.
Newnham, D. A., Ford, G. P., Moffat-Griffin, T., and Pumphrey, H. C.: Simulation study for measurement of horizontal wind profiles in the polar stratosphere and mesosphere using ground-based observations of ozone and carbon monoxide lines in the 230–250 GHz region, Atmos. Meas. Tech., 9, 3309–3323, https://doi.org/10.5194/amt-9-3309-2016, 2016.
Okamoto, K. and Derber, J. C.: Assimilation of SSM/I radiance in the NCEP global data assimilation system, Mon. Weather Rev., 134, 2612–2631, https://doi.org/10.1175/MWR3205.1, 2006.
Orsolini, Y. J., Urban, J., Murtagh, D. P., Lossow, S., and Limpasuvan, V.: Descent from the polar mesosphere and anomalously high stratopause observed in 8 years of water vapor and temperature satellite observations by the Odin Sub-Millimeter Radiometer, J. Geophys. Res., 115, D12305, https://doi.org/10.1029/2009JD013501, 2010.
Orsolini, Y. J., Limpasuvan, V., Pérot, K., Espy, P., Hibbins, R., Lossow, S., Larsson, K. R., and Murtagh, D.: Modelling the descent of nitric oxide during the elevated stratopause event of January 2013, J. Atmos. Sol.-Terr. Phy., 155, 50–61, https://doi.org/10.1016/j.jastp.2017.01.006, 2017.
Pedatella, N. M., Chau, J. L., Schmidt, H., Goncharenko, L. P., Stolle, C., Hocke, K., Harvey, V. L., Funke, B., and Siddiqui, T. A.: How sudden stratospheric warming affects the whole atmosphere, EOS, 99, 35–38, https://doi.org/10.1029/2018EO092441, 2018.
Piddyachiy, V., Shulga, V., Myshenko, V., Korolev, A., Antyufeyev, O., Shulga, D., and Forkman, P.: Microwave radiometer for spectral observations of mesospheric carbon monoxide at 115 GHz over Kharkiv, Ukraine, J. Infrared Milli. Te., 38, 292–302, https://doi.org/10.1007/s10762-016-0334-1, 2017.
Piddyachiy, V. I., Shulga, V. M., Myshenko, V. V., Korolev, A. M., Myshenko, A. V., Antyufeyev, A. V., Poladich, A. V., and Shkodin, V. I.: 3-mm wave spectroradiometer for studies of atmospheric trace gases, Radiophys. Quant. El., 53, 326–333, https://doi.org/10.1007/s11141-010-9231-y, 2010.
Rao, J., Ren, R., Chen, H., Yu, Y., and Zhou, Y.: The stratospheric sudden warming event in February 2018 and its prediction by a climate system model, J. Geophys. Res.-Atmos., 123, 13332–13345, https://doi.org/10.1029/2018JD028908, 2018.
Rao, J., Ren, R.-C., Chen, H., Liu, X., Yu, Y., and Yang, Y.: Sub-seasonal to seasonal hindcasts of stratospheric sudden warming by BCC_CSM1.1(m): A comparison with ECMWF, Adv. Atmos. Sci., 36, 479–494, https://doi.org/10.1007/s00376-018-8165-8, 2019.
Rinsland, C. P., Salawitch, R. J., Gunson, M. R., Solomon, S., Zander, R., Mahieu, E., Goldman, A., Newchurch, M. J., Irion, F. W., and Chang, A. Y.: Polar stratospheric descent of NOy and CO and Arctic denitrification during winter 1992–1993, J. Geophys. Res., 104, 1847–1861, 1999.
Rüfenacht, R., Kämpfer, N., and Murk, A.: First middle-atmospheric zonal wind profile measurements with a new ground-based microwave Doppler-spectro-radiometer, Atmos. Meas. Tech., 5, 2647–2659, https://doi.org/10.5194/amt-5-2647-2012, 2012.
Rüfenacht, R., Hocke, K., and Kämpfer, N.: First continuous ground-based observations of long period oscillations in the vertically resolved wind field of the stratosphere and mesosphere, Atmos. Chem. Phys., 16, 4915–4925, https://doi.org/10.5194/acp-16-4915-2016, 2016.
Rüfenacht, R., Baumgarten, G., Hildebrand, J., Schranz, F., Matthias, V., Stober, G., Lübken, F.-J., and Kämpfer, N.: Intercomparison of middle-atmospheric wind in observations and models, Atmos. Meas. Tech., 11, 1971–1987, https://doi.org/10.5194/amt-11-1971-2018, 2018.
Ryan, N. J., Palm, M., Raffalski, U., Larsson, R., Manney, G., Millán, L., and Notholt, J.: Strato-mesospheric carbon monoxide profiles above Kiruna, Sweden (67.8 ∘ N, 20.4∘ E), since 2008, Earth Syst. Sci. Data, 9, 77–89, https://doi.org/10.5194/essd-9-77-2017, 2017.
Ryan, N. J., Kinnison, D. E., Garcia, R. R., Hoffmann, C. G., Palm, M., Raffalski, U., and Notholt, J.: Assessing the ability to derive rates of polar middle-atmospheric descent using trace gas measurements from remote sensors, Atmos. Chem. Phys., 18, 1457–1474, https://doi.org/10.5194/acp-18-1457-2018, 2018.
Salmi, S.-M., Verronen, P. T., Thölix, L., Kyrölä, E., Backman, L., Karpechko, A. Yu., and Seppälä, A.: Mesosphere-to-stratosphere descent of odd nitrogen in February–March 2009 after sudden stratospheric warming, Atmos. Chem. Phys., 11, 4645–4655, https://doi.org/10.5194/acp-11-4645-2011, 2011.
Scheiben, D., Straub, C., Hocke, K., Forkman, P., and Kämpfer, N.: Observations of middle atmospheric H2O and O3 during the 2010 major sudden stratospheric warming by a network of microwave radiometers, Atmos. Chem. Phys., 12, 7753–7765, https://doi.org/10.5194/acp-12-7753-2012, 2012.
Shepherd, M. G., Beagley, S. R., and Fomichev, V. I.: Stratospheric warming influence on the mesosphere/lower thermosphere as seen by the extended CMAM, Ann. Geophys., 32, 589–608, https://doi.org/10.5194/angeo-32-589-2014, 2014.
Solomon, S., Garcia, R. R., Olivero, J. J., Bevilacqua, R. M., Schwartz, P. R., Clancy, R. T., and Muhleman, D. O.: Photochemistry and transport of carbon monoxide in the middle atmosphere, J. Atmos. Sci., 42, 1072–1083, 1985.
Stray, N. H., Orsolini, Y. J., Espy, P. J., Limpasuvan, V., and Hibbins, R. E.: Observations of planetary waves in the mesosphere-lower thermosphere during stratospheric warming events, Atmos. Chem. Phys., 15, 4997–5005, https://doi.org/10.5194/acp-15-4997-2015, 2015.
Taguchi, M.: Comparison of subseasonal-to-seasonal model forecasts for major stratospheric sudden warmings, J. Geophys. Res.-Atmos., 123, 10231–10247, https://doi.org/10.1029/2018jd028755, 2018.
Tao, M., Konopka, P., Ploeger, F., Grooß, J.-U., Müller, R., Volk, C. M., Walker, K. A., and Riese, M.: Impact of the 2009 major sudden stratospheric warming on the composition of the stratosphere, Atmos. Chem. Phys., 15, 8695–8715, https://doi.org/10.5194/acp-15-8695-2015, 2015.
Tomikawa, Y., Sato, K., Watanabe, S., Kawatani, Y., Miyazaki, K., and Takahashi, M.: Growth of planetary waves and the formation of an elevated stratopause after a major stratospheric sudden warming in a T213L256 GCM, J. Geophys. Res., 117, D16101, https://doi.org/10.1029/2011JD017243, 2012.
Tripathi, O. P., Baldwin, M., Charlton-Perez, A., Charron, M., Cheung, J. C. H., Eckermann, S. D., Gerber, E., Jackson, D. R., Kuroda, Yu., Lang, A., McLay, J., Mizuta, R., Reynolds, C., Roff, G., Sigmond, M., Son, S.-W., and Stockdale, T.: Examining the predictability of the stratospheric sudden warming of January 2013 using multiple NWP systems, Mon. Weather Rev., 144, 1935–1960, https://doi.org/10.1175/mwr-d-15-0010.1, 2016.
Vargin, P. N. and Kiryushov, B. M.: Major sudden stratospheric warming in the Arctic in February 2018 and its impacts on the troposphere, mesosphere, and ozone layer, Russian Meteorol. Hydrol., 44, 112–123, https://doi.org/10.3103/S1068373919020043, 2019.
Waters, J. W., Wilson, W. J., and Shimabukuro, F. I.: Microwave measurement of mesospheric carbon monoxide, Science, 191, 1174–1175, https://doi.org/10.1126/science.191.4232.1174, 1976.
WMO: Commission for Atmospheric Sciences, Abridged Final Report of the Seventh Session, Manila, 27 February–10 March, WMO-No. 509, 113 pp., available at: http://library.wmo.int/pmb_ged/wmo_509_en.pdf (last access: 18 January 2019), 1978.
Xu, X., Manson, A. H., Meek, C. E., Chshyolkova, T., Drummond, J. R., Hall, C. M., Riggin, D. M., and Hibbins, R. E.: Vertical and interhemispheric links in the stratosphere-mesosphere as revealed by the day-to-day variability of Aura-MLS temperature data, Ann. Geophys., 27, 3387–3409, https://doi.org/10.5194/angeo-27-3387-2009, 2009.
Yu, Y., Cai, M., Shi, C., and Ren, R.: On the linkage among strong stratospheric mass circulation, stratospheric sudden warming, and cold weather events, Mon. Weather Rev., 146, 2717–2739, https://doi.org/10.1175/MWR-D-18-0110.1, 2018.
Yuan, T., Thurairajah, B., She, C. Y., Chandran, A., Collins, R. L., and Krueger, D. A.: Wind and temperature response of midlatitude mesopause region to the 2009 Sudden Stratospheric Warming, J. Geophys. Res., 117, D09114, https://doi.org/10.1029/2011JD017142, 2012.
Zhou, S., Miller, A. J., Wang, J., and James, K. A.: Downward-propagating temperature anomalies in the preconditioned polar stratosphere, J. Climate, 15, 781–792, https://doi.org/10.1175/1520-0442(2002)015<0781:DPTAIT>2.0.CO;2, 2002.
Zülicke, C. and Becker, E.: The structure of the mesosphere during sudden stratospheric warmings in a global circulation model, J. Geophys. Res.-Atmos., 118, 2255–2271, https://doi.org/10.1002/jgrd.50219, 2013.
Zülicke, C., Becker, E., Matthias, V., Peters, D. H. W., Schmidt, H., Liu, H.-L., de la Torre Ramos, L., and Mitchell, D. M.: Coupling of stratospheric warmings with mesospheric coolings in observations and simulations, J. Climate, 31, 1107–1133, https://doi.org/10.1175/JCLI-D-17-0047.1, 2018.