the Creative Commons Attribution 4.0 License.
the Creative Commons Attribution 4.0 License.
 | 11 Jul 2018
Observations and source investigations of the boundary layer bromine monoxide (BrO) in the Ny-Ålesund Arctic
Yuhan Luo
Haijin Zhou
Ke Dou
Yi Liu
Wenqing Liu
During polar spring, the presence of reactive bromine in the polar boundary layer is considered to be the main cause of ozone depletion and mercury deposition. However, many uncertainties still remain regarding understanding the mechanisms of the chemical process and source of the bromine. As Arctic sea ice has recently been dramatically reduced, it is critical to investigate the mechanisms using more accurate measurements with higher temporal and spatial resolution. In this study, a typical process of enhanced bromine and depleted ozone in the Ny-Ålesund boundary layer in late April 2015 was observed by applying ground-based multi-axis differential optical absorption spectroscopy (MAX-DOAS) technique. The results showed that there were bromine monoxide (BrO) slant columns as high as 5.6 × 10¹⁴ molec cm−2 above the Kings Bay area on 26 April. Meanwhile, the boundary layer ozone and gaseous elemental mercury (GEM) were synchronously reduced by 85 and 90 %, respectively. Based on the meteorology, sea ice distribution and air mass history, the sea ice in the Kings Bay area, which emerged for only a very short period of time when the enhanced BrO was observed, was considered to be the major source of this bromine enhancement event. The oxidized GEM may be directly deposited onto snow/ice and thereby influence the polar ecosystem.
- Article
(5148 KB) - Full-text XML
-
Supplement
(2475 KB) - BibTeX
- EndNote


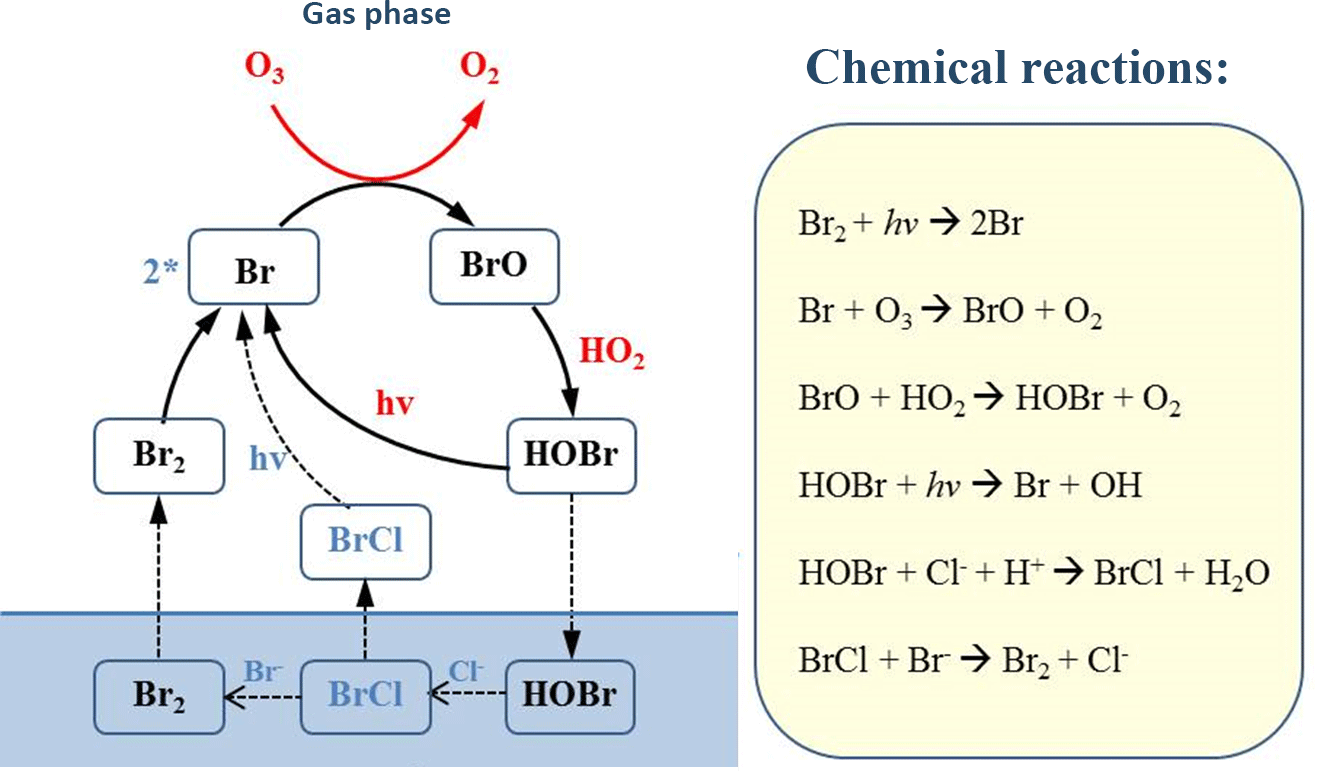
Bromine monoxide (BrO) is one of the key reactive halogen species that has profound impacts on the atmospheric chemistry of the polar boundary layer (PBL), especially the oxidative capacity of the troposphere (Saiz-Lopez and von Glasow, 2012). The presence of reactive bromine (in some situations called “bromine explosion”) is considered to be the main cause of the depletion of boundary layer ozone, known as “ozone depletion events” (ODEs) (Platt and Hönninger, 2003). Furthermore, halogens can efficiently oxidize gas-phase mercury, which can lead to a decrease of gaseous mercury, known as “atmospheric mercury depletion events” (AMDEs) (Lu et al., 2001; Ariya et al., 2002, 2004; Lindberg et al., 2002; Steffen et al., 2008). Enhanced BrO was first detected by long-path differential optical absorption spectroscopy (LP-DOAS) observations (Platt, 1994). Satellite measurements confirmed that the phenomenon of bromine enhancement covered larger areas of polar regions by deriving daily global BrO maps (Wagner et al., 2001; Richter et al., 1998; Platt and Wagner, 1998; Sihler et al., 2013). The primary source of reactive bromine has been explained by a series of photochemical and heterogeneous reactions at the surface of the frozen ocean during polar spring (Fan and Jacob, 1992). A typical heterogeneous reaction model between the gaseous and condensed phases is shown in Fig. 1. Bromine is released from ice surfaces to the atmosphere in an autocatalytic chemical mechanism that oxidizes bromide to reactive bromine. The reaction of HOBr is proposed to be the catalyst that drives the recycling reaction, which is an acid-catalyzed reaction (Simpson et al., 2007). Sea-ice (first year) surfaces, brine and frost flowers have been considered as possible sources (Kaleschke et al., 2004; Lehrer et al., 2004).
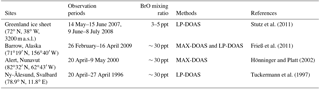
Table 1Comparisons of BrO mixing ratios at four main Arctic observation sites.
However, the actual situation is that the ODEs do not always occur concurrently with episodes of BrO enhancement. There are only few reports of Arctic ODEs that are assumed to have been observed primarily as a result of local-scale chemical mechanisms (Jacobi et al., 2006; Bottenheim et al., 2009). As the photochemical reactions happen quickly and the lifetimes of the intermediate products (e.g., the reactive bromine radicals) are quite short, more accurate data with a higher temporal resolution are needed to analyze the chemical process in the PBL and investigate the source of bromine.
The MAX-DOAS (multi-axis differential optical absorption spectrometer) technique has the advantage of being able to clearly separate the tropospheric and stratospheric portions of the atmospheric column and even derive a crude vertical profile (Frieß et al., 2011). When pointing to a direction slightly above the horizon, the spectrometer can obtain high sensitivities for the trace gases close to the ground due to the long light path through the trace gas layers. This technique is also an important calibration of satellite observations, which have lower spatial and temporal resolutions compared with ground-based measurements. In the Arctic area, ground-based MAX-DOAS observations have been made at Barrow, Alaska (71∘ N, 157∘ W), Alert, northern Canada (82.5∘ N, 62.3∘ W) and Ny-Ålesund, Svalbard (78.9∘ N, 11.8∘ E) (Table 1). Additionally, air-borne (Neuman et al., 2010; Pöhler et al., 2013) and ship-borne measurements (Jacobi et al., 2006; Leser et al., 2003; Wagner et al., 2007; Bottenheim et al., 2009) are important supplements for the analysis and modeling of bromine chemistry.
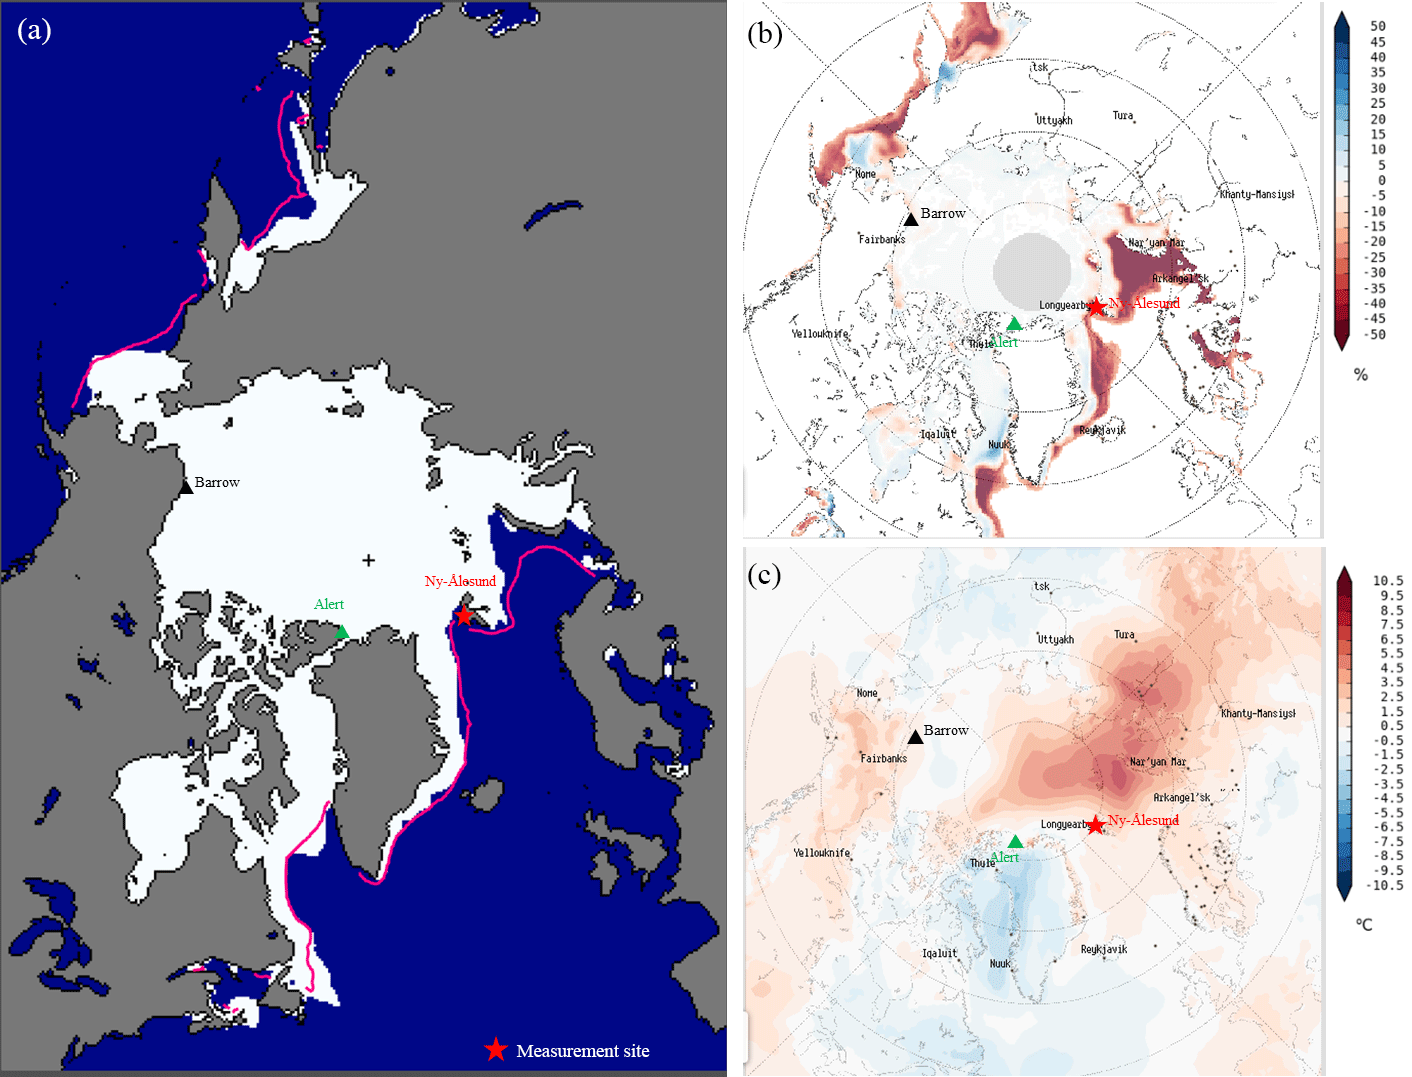
Figure 2(a) Sea ice extent on April 2015 in the Arctic area (data from http://nsidc.org/data/seaice_index/, last access: 9 July 2018). (b) Monthly mean sea ice concentration anomalies on April 2015 compared to averages from 1979 to 2015. (c)Two meter air temperature anomalies on April 2015 compared to averages from 1979 to 2015. (b and c data are from http://nsidc.org/soaclast access: 9 July 2018).
However, recently, Arctic sea ice coverage has dramatically reduced, especially in eastern Greenland and northern Europe. Influenced by the North Atlantic warm current (NAWC), the near-surface air temperatures and sea-surface temperatures (SST) are becoming higher in northern Europe (Fig. 2). In recent years, Kings Bay in Ny-Ålesund had ice-free open water all year round, which is a unique characteristic compared with other areas at the same latitude in the Arctic. Therefore, it is critical to gain a better understanding of the possible sources of reactive bromine and the impact of halogen activation on PBL ozone depletion and mercury deposition within a rapidly changing Arctic. In this study, an event of enhanced bromine and depleted ozone in Ny-Ålesund was caught in late April. The key role of bromine was confirmed by ground-based MAX-DOAS measurements. This event provides a rare opportunity to investigate the source of bromine and the process of ozone depletion in this area.
2.1 Instrument setup
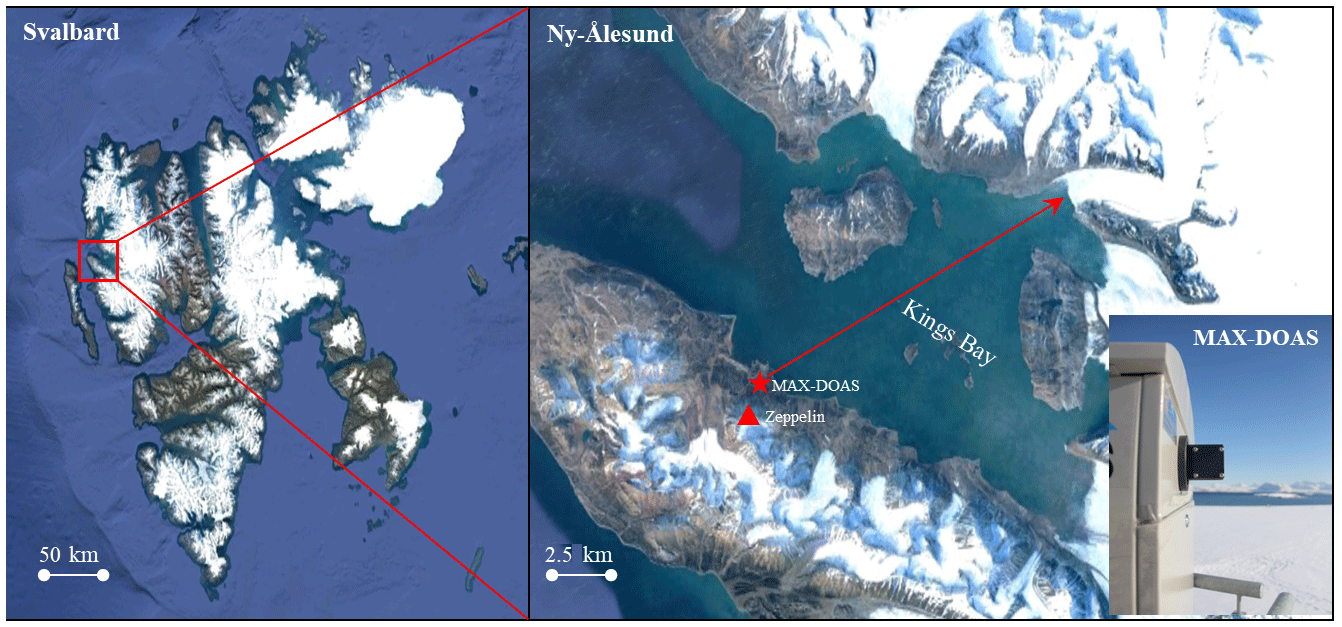
The MAX-DOAS measurement site is located at Yellow River station (78∘55′30 N, 11∘55′20 E) at Ny-Ålesund on the west coast of Spitsbergen. The observation position is shown in Fig. 3. To give a rough idea of the climate conditions, monthly mean sea ice concentration anomalies and air temperature anomalies during April 2015 are shown in Fig. 2. Observations were obtained from 25 April to 15 May 2015. Due to the wavelength adjustment, no data were available during a short period from 28 to 29 April.
The MAX-DOAS instrument operated at Ny-Ålesund consists of both indoor and outdoor conponents. The telescope receives scattered sunlight from multiple angles and is controlled by a stepper motor to adjust elevation angles from horizon (0∘) to zenith (90∘). The field of view of the telescope is approximately 1∘. The scattered sunlight is imported through the quartz fiber with a numerical aperture of 0.22 into the indoor spectrograph (Ocean Optics MAYA pro) with a one-dimensional CCD array (ILX511 linear array CCD) containing 2068 pixels. The wavelength range of the spectrograph is from 290 to 420 nm; thus, enabling the analysis of trace gases including O3, NO2, BrO, OClO, HCHO and O4. The spectral resolution is approximately 0.5 nm (FWHM). The CCD detector is cooled at −30 ∘C, while the whole spectrometer is thermally stabilized at +20 ∘C using a thermal controller. A computer sets the configuration of the system and controls the automatic measurements. The integration time (typically ranging from 100 to 2000 ms in multiples of 100 scans) of each measurement depends on the intensity of scattered light, which can be influenced by clouds and visibility. A standard mercury lamp is used for spectra calibration. Calibration measurements of dark current and offset are performed after each measurement.
The telescope is pointed towards the northeast, which covers the Kings Bay area (Fig. 3). Kings Bay is an inlet on the west coast of Spitsbergen, one part of the Svalbard archipelago in the Arctic Ocean. The inlet is 26 km long and 6 to 14 km wide. The range of MAX-DOAS measurement is an area with a radius of approximately 10 km, which covers the central area of the fjord. The sequence of the elevation angles is 2, 3, 4, 6, 8, 10, 15, 30 and 90∘ above the horizon.
2.2 Data evaluation
The spectra, measured with the setup described above, are analyzed using the well-established DOAS retrieving method (Platt, 1994). The wavelength calibration is performed using the QDOAS software developed by the Belgian Institute for Space Aeronomy (BIRA) by fitting the reference spectrum to a high-resolution Fraunhofer spectrum (Kurucz et al., 1988). The spectral analysis of BrO is performed at 340–359 nm, encompassing three BrO absorption bands, which improves the accuracy of the inversion. O3 (223, 243 K) (Bogumil et al., 2003; Vandaele et al., 1998), NO2 (298, 220 K) (Vandaele et al., 1998), O4 (Hermans et al., 2003), BrO (228 K) (Wilmouth et al., 1999), OClO (233 K) (Kromminga et al., 2003), and ring structure (Chance and Spurr, 1997) are involved in the inversion algorithm. The O4 retrieval is performed using the same set of cross sections as for BrO but in the wavelength interval of 340–370 nm. The high-resolution cross sections are convoluted with the instrument slit function, which is determined by measuring the emission line of a mercury lamp. A fifth-order polynomial is applied to eliminate the broad band structures in the spectra caused by Rayleigh and Mie scattering. Furthermore, a nonlinear intensity offset is included in the fit to account for possible instrumental stray light. A wavelength shift and stretch of the spectra are allowed in the fit in order to compensate for small changes in the spectral adjustment of the spectrograph.
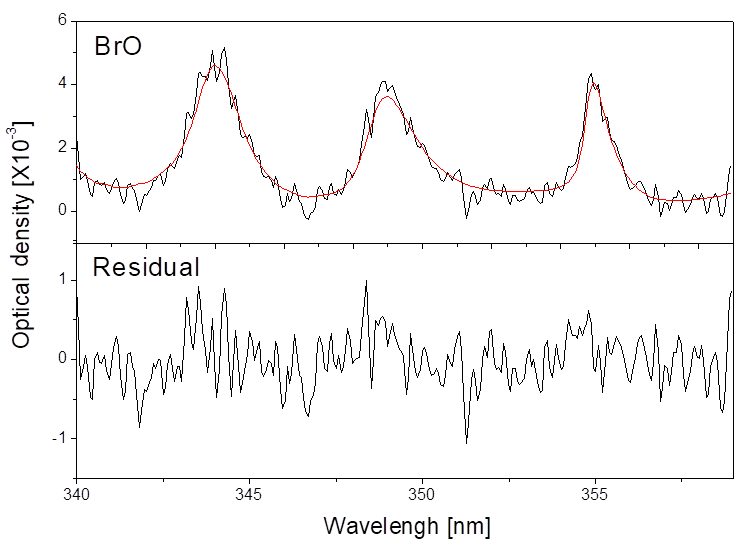
Figure 4Examples of spectral retrieval of BrO. The spectrum was recorded under clear sky conditions at 2∘ elevation on 26 April 2015, 19:59 UTC, SZA = 86∘. (Black lines represent retrieved spectral signatures fitted result for absorber, and red lines represent fitted cross sections).
The fit procedure yields differential slant column densities (DSCD) using zenith sky measurements of each sequence as a Fraunhofer reference for the analysis, which eliminates the influence of stratospheric BrO change. An example of the fit result of BrO is shown in Fig. 4. The spectrum was recorded on 26 April 2015 19:59 UTC (SZA = 86∘) at an elevation angle of 2∘. The BrO DSCD is 5.10 × 10¹⁴ molec cm−2. The residual root mean square is 4.59 × 10⁻⁴, resulting in a statistical BrO DSCD error of 1.63 × 10¹³ molec cm−2.
Since DSCDs are dependent on the light path, wavelength and observation geometry, DSCDs are then converted to vertical column density (VCD) by dividing by the differential air mass factor (DAMF), which is the averaged light path enhancement for solar light traveling through the atmosphere compared to a straight vertical path.
We perform the radiative transfer modeling (RTM) simulations using SCIATRAN software (Rozanov et al., 2005) to obtain the modeled DAMF using five different assumed BrO profiles with evenly distributed air masses: (a) 0–0.5 km; (b) 0–1 km; (c) 0–2 km; (d) 0.5–1 km; and (e) 1–2 km (Fig. 5a). The models are run under clear sky conditions with no aerosol input. Remarkable differences exist for different input profiles. For the BrO layers of 0–0.5, 0–1 and 0–2 km, the DAMFs all increase with decreasing elevation angles. However, for the BrO layers of 0.5–1 and 1–2 km, the dependence on the telescope elevation angle is weaker, especially at small elevation angles.
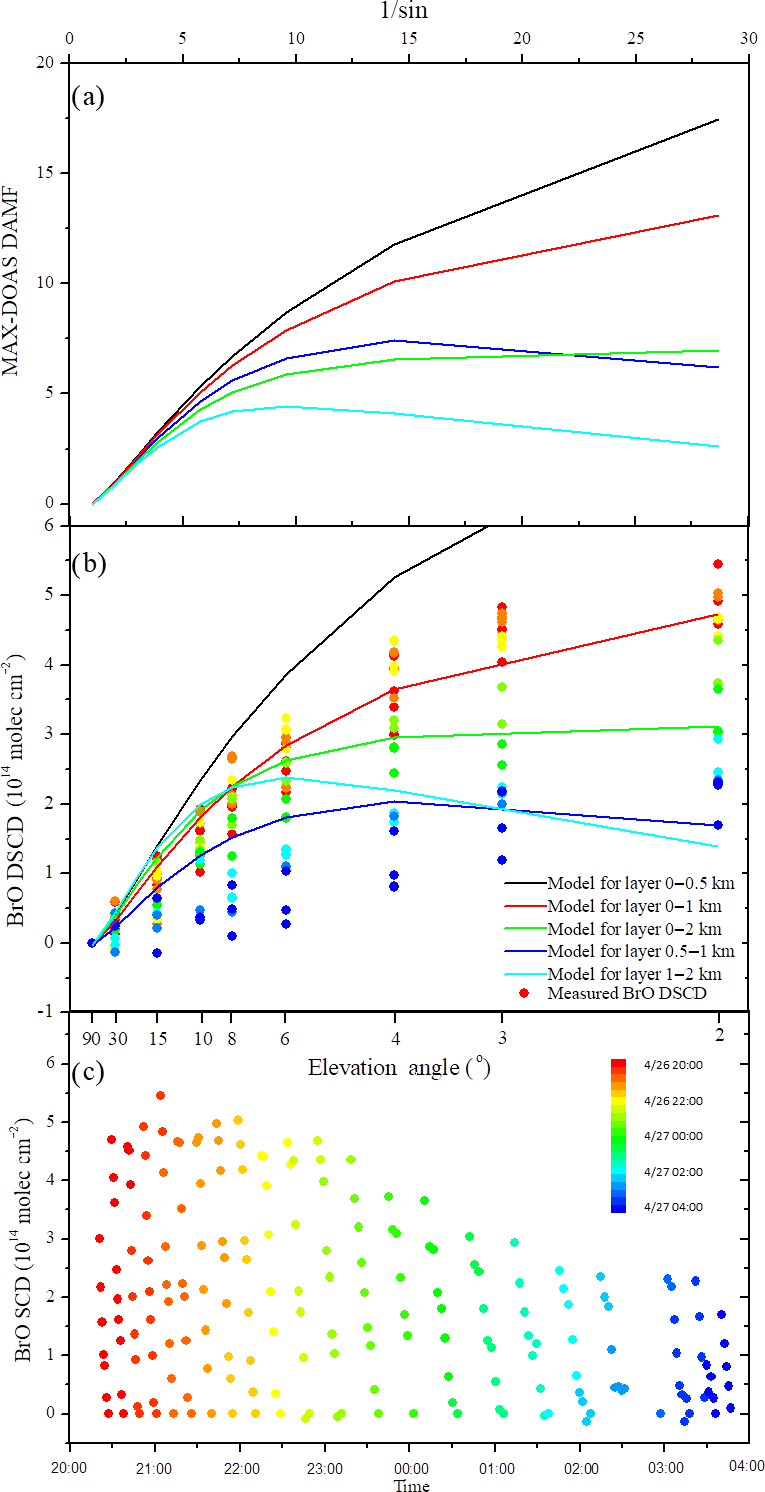
Figure 5Modeled DAMF (a) and BrO DSCD (b) using a radiative transfer modeling simulation. DAMF are the differences of air mass factor for low elevation angles and zenith direction. The models are performed assuming clear sky conditions with no aerosol. In (b), the tropospheric BrO VCD is 5 × 10¹³ molec cm−2. The measured BrO DSCDs during the event are also shown (solid dots). The color codes of the measured BrO DSCDs, which are also shown in (b) (solid dots), are put into a one-to-one correspondence with the dots in (c)
The modeled BrO DSCDs for different input BrO profiles are shown in Fig. 5b. The input BrO VCD is 5 × 10¹³ molec cm−2. The measured BrO DSCDs from 26 April 20:00 UTC to 27 April 04:00 UTC are also plotted (Fig. 5c). Since the inaccuracy of modeled BrO becomes larger at lower elevation angles, elevation angles of ≥ 8∘ should receive more attention. From Fig. 5b, we can obviously see that the measured BrO DSCDs are best reproduced by the model for layer 0–1 km before midnight. This suggests that the BrO layer between 0 and 1 km can be considered as the most likely distribution. Therefore, BrO volume mixing ratios (VMR) are calculated assuming a homogeneous BrO layer with a thickness of 1 km at the surface.
2.3 Complementary data
Ny-Ålesund is a science community hosting over fifteen permanent research stations. Atmospheric measurements have been measured continuously at Zeppelin station, Ny-Ålesund since 1990. Located on Zeppelin Mountain, with an altitude of 474 m a.s.l., it is a background atmosphere observatory operated by the Norwegian Polar Institute (NPI) and the Norwegian Institute for Air Research (NILU), which are part of the Global Atmosphere Watch (GAW) framework. At the Zeppelin station, surface ozone was measured by UV photometry, and gaseous mercury in the air was measured using a Tekran mercury detector. Hourly surface ozone and gaseous mercury data are downloaded from the EBAS database (Tørseth et al., 2012).
Meteorology data, including temperature, air pressure, relative humidity, wind direction and velocity, and global radiation data are recorded by the AWIPEV atmospheric observatory in Ny-Ålesund. According to the radiosonde records of temperature, humidity and wind speed from AWIPEV, the height of the troposphere is approximately 8000 m and the height of the boundary layer is approximately 1200 m at Ny-Ålesund.
A webcam on the 474 m Zeppelin Mountain records the sea ice change of Kings Bay and the cloud situation of Ny-Ålesund (https://data.npolar.no/_file/zeppelin/camera/, last access: 9 July 2018).
To roughly estimate the BrO distribution, BrO maps of the Northern Hemisphere by GOME-2 products are downloaded from http://www.iup.uni-bremen.de/doas/scia_data_browser.htm (last access: 9 July 2018). Stations overpass BrO vertical column densities for MetOp-A (GOME-2A) and MetOp-B (GOME-2B) in the Ny-Ålesund, Arctic are downloaded from https://avdc.gsfc.nasa.gov/index.php?site=580525926&id=97 (last access: 9 July 2018).
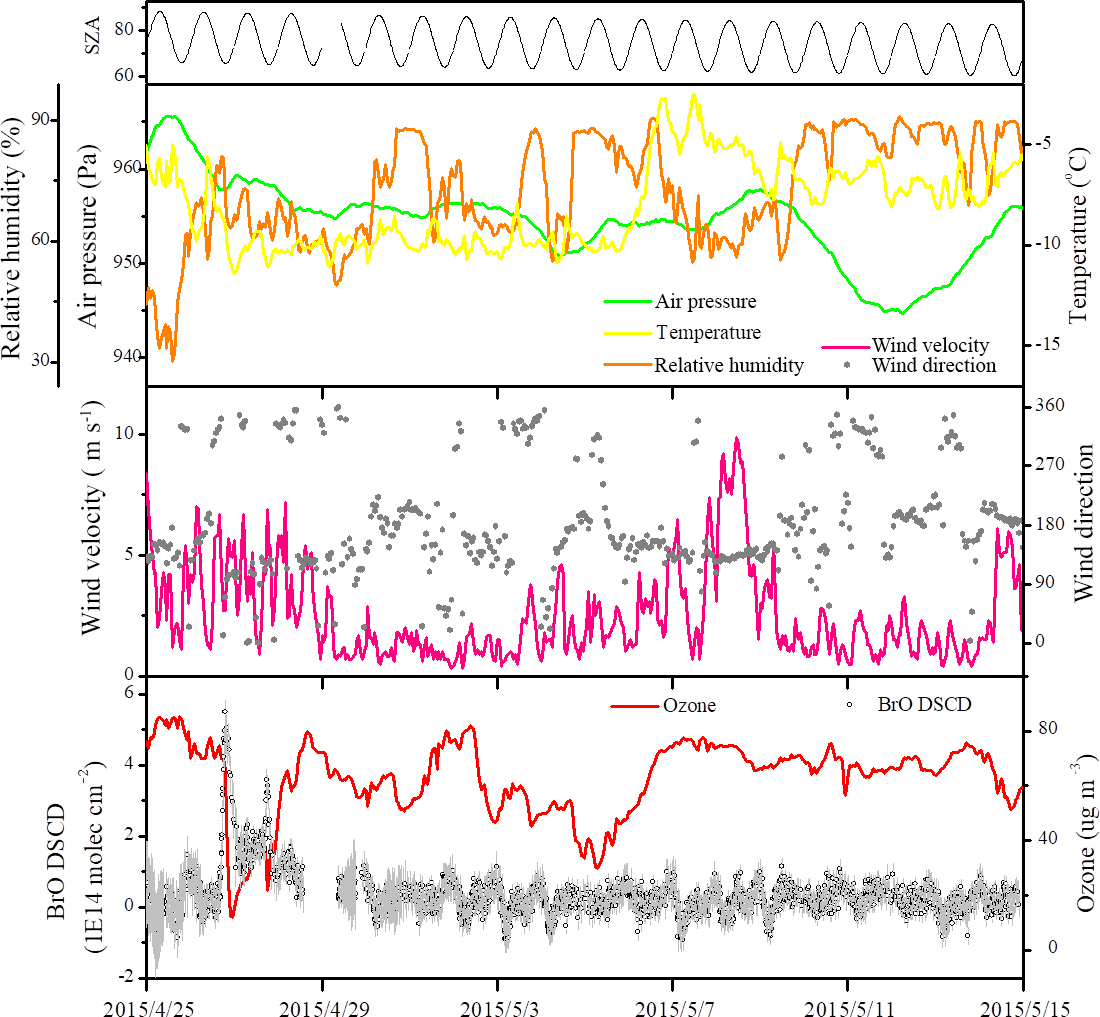
Figure 6Time series of BrO DSCDs at 2∘, surface ozone, solar zenith angle and meteorology data during the measurement.
Using the Hybrid Single Particle Lagrangian Integrated Trajectory (HYSPLIT) model via the NASA ARL READY website (http://ready.arl.noaa.gov/HYSPLIT_traj.php, last access: 9 July 2018) (Rolph et al., 2017; Stein et al., 2015), back trajectory analyses were carried out to determine the history of air masses. Back trajectories of 72 h were driven by meteorological fields from the NCEP Global Data Assimilation System (GDAS) model output.
The time series of BrO DSCDs at 2∘, surface ozone concentrations, solar zenith angle (SZA), air pressure, air temperature, relative humidity, wind velocity and wind direction from 25 April to 15 May are presented in Fig. 6. Starting from late afternoon on 26 April, BrO DSCDs clearly exceeded the background levels and peaked at 5.6 × 10¹⁴ molec cm−2. In the same period, surface ozone sharply decreased from ∼ 80 ppb to several ppb and did not recover to normal values until 29 April. During this period, the wind velocity frequently changed between 1 and 7 m s−1, with unstable wind directions and mixing heights. Over a period of one week, elevated BrO levels went back down to the detection limit (by 4 May) under a stable boundary layer. From the 4 to 5 May, partial ozone (not near the zero level) was depleted in the absence of BrO.
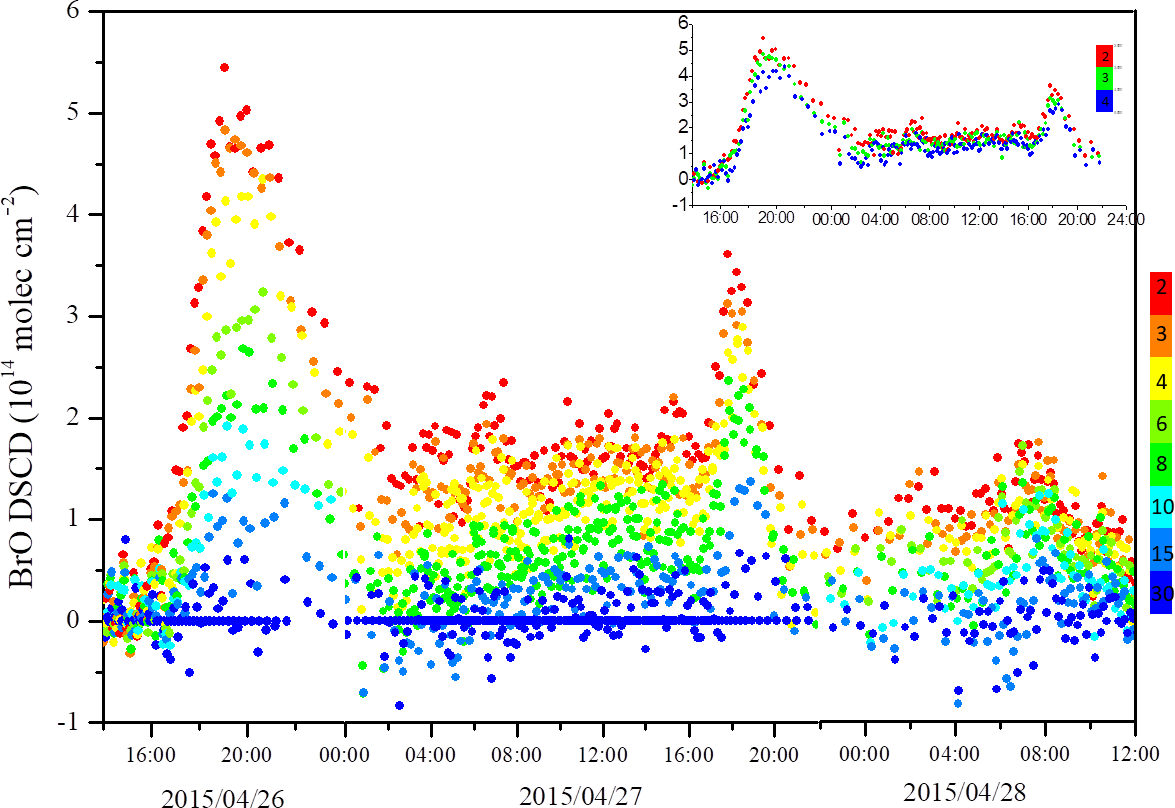
The time series of BrO DSCDs from 26 April 14:00 UTC to 28 April 12:00 UTC at every elevation angle (2, 3, 4, 6, 8, 10, 15 and 30∘) are plotted in Fig. 7. Results of different elevation angles were obviously distributed during the BrO enhancement period. However, the differences in the BrO DSCDs ≤ 4∘ are very small (upright plot in Fig. 7), indicating that the highest value of BrO is probably not above the surface. To better understand the vertical distribution of reactive bromine at the Arctic boundary layer, a comparison between the measured BrO DSCDs from the MAX-DOAS measurements with the modeled ones from the SCIATRAN model is performed (Fig. 5). The measured BrO DSCDs best match the model for the 0–1 km layer during the enhancement, which means that the BrO enhancement event was a regional rather than an in situ process.
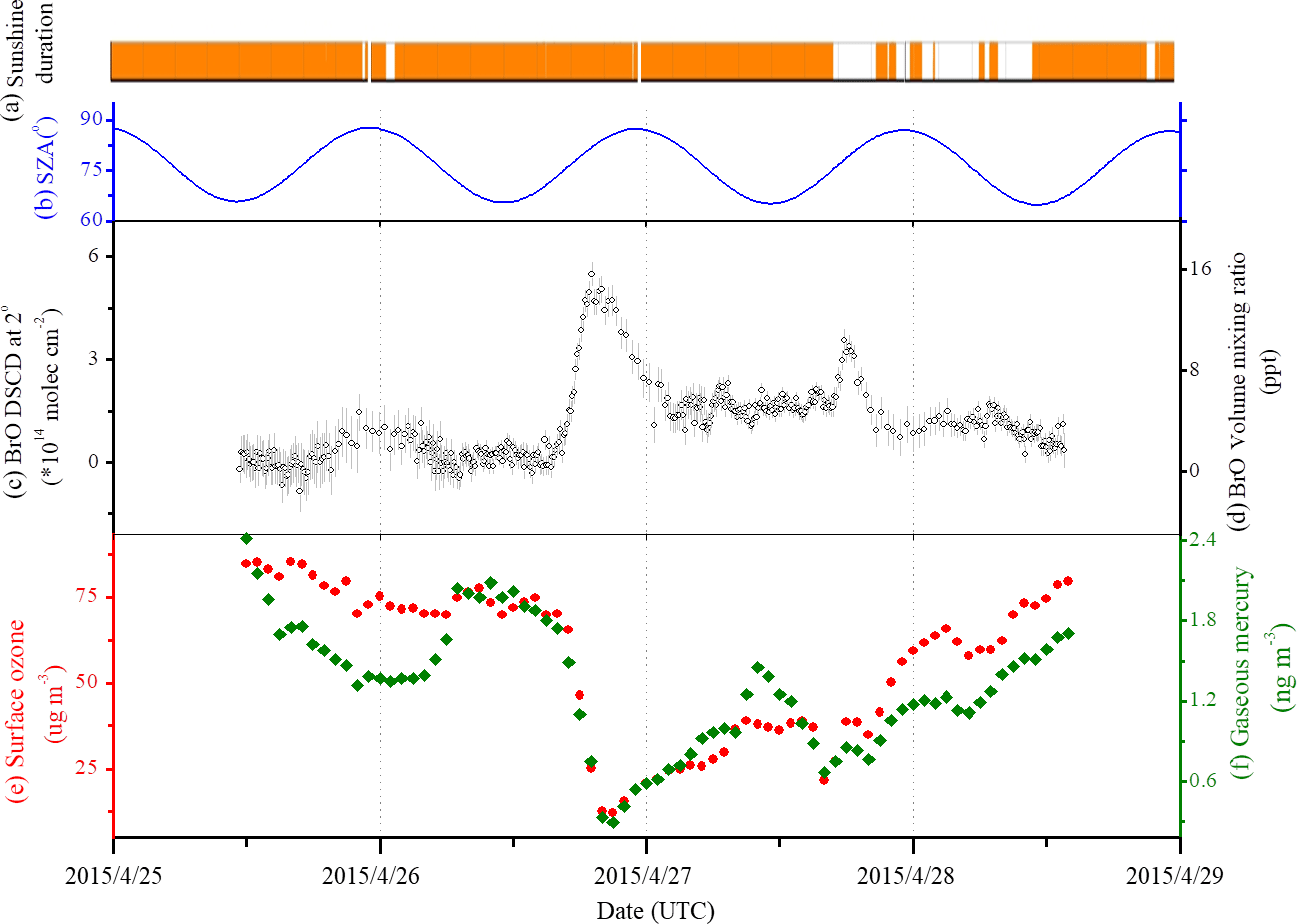
Figure 8(a) Sunshine duration; (b) solar zenith angle; (c) BrO DSCDs from MAX-DOAS at elevation angle of 2∘; (d) BrO VMR (ppt); (e) surface ozone (ug m−3); and (f) gaseous mercury (ng m−3) from 25 April at noon to 28 April at noon 2015. BrO mixing ratios are calculated assuming a homogeneous BrO layer of 0–1 km.
The sunshine duration, SZA, BrO DSCDs from the MAX-DOAS at a 2∘ elevation angle, BrO volume mixing ratio, surface ozone and gaseous mercury data from 26 to 28 April are plotted in Fig. 8. The BrO VMRs were calculated assuming a 0–1 km layer of the BrO profile. The highest BrO VMR is approximately 15 pptv during the ODE. Ozone, as well as gaseous mercury, dropped extremely fast right after the enhancement of BrO. However, there seems to be insufficient reactive bromine present locally in the boundary layer since the ozone slowly increases just four hours later (on 26 April at 21:00 UTC). Afterwards, both ozone and mercury have a slow recovery with a fluctuation on 27 April. A tiny increase of BrO occurs around 27 April at 20:00 UTC. This could be explained by the fact that Br ∕ BrO photochemical reactions are taking places where there is enough ozone to react. When ozone drops to the lower limit of the reaction, the reaction of Br + O3 → BrO + O2 would stop (i.e., the situation observed on the night of 26 April). When ozone recovers to a certain level, the reaction starts again.
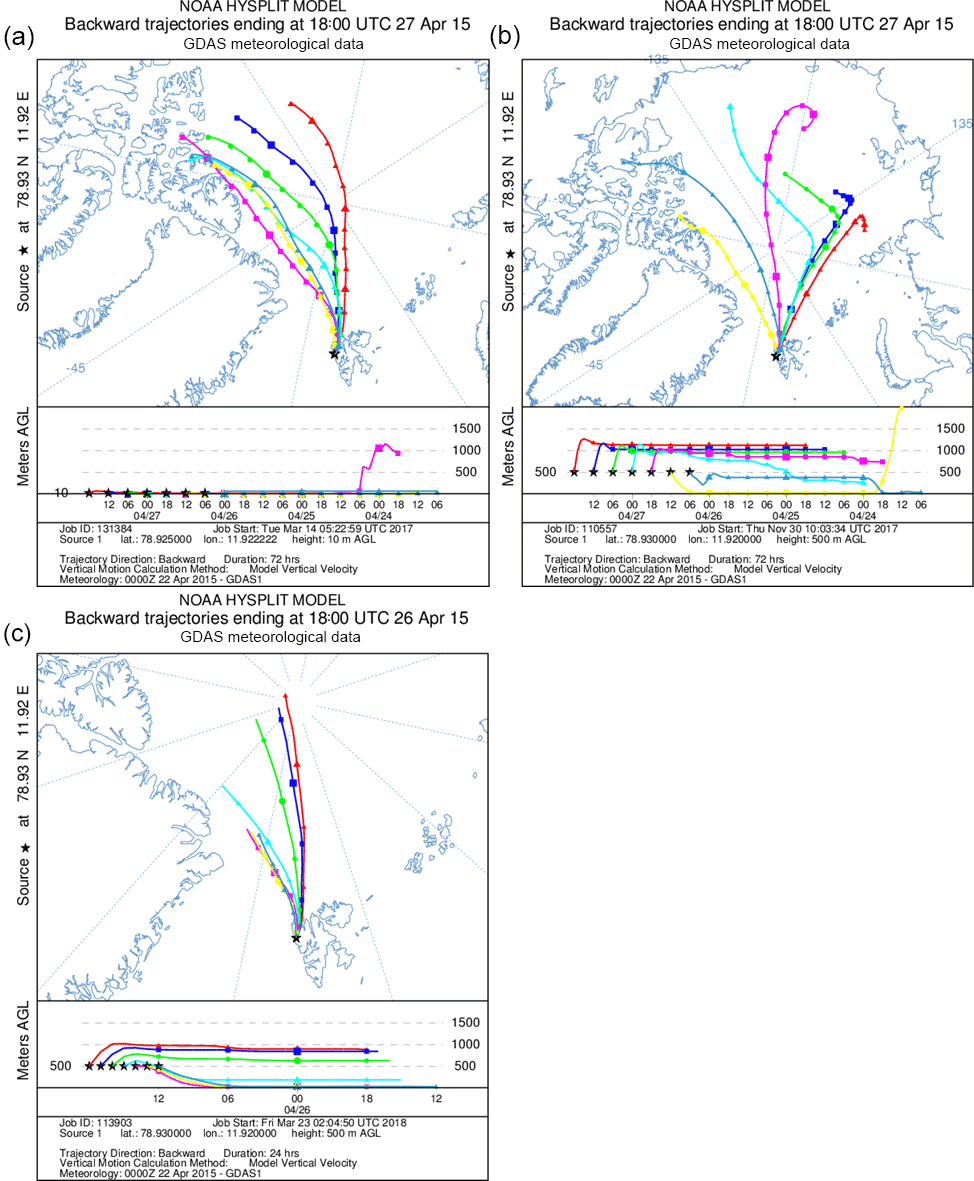
Figure 9Back trajectory model of air masses arriving at Ny-Ålesund ending on 27 April at 18:00 UTC at 10 (a) and 500 m a.s.l. (b). Every 6 h a new trajectory starts, and each trajectory runs for 72 h. Back trajectory model of air masses arriving at Ny-Ålesund ending on 26 April at 18:00 UTC and 500 m a.s.l. (c). Every 6 h a new trajectory starts.
In this research, high concentrations of tropospheric BrO have been detected using the ground-based MAX-DOAS technique. A BrO column as high as 5.6 × 10¹⁴ molec cm−2 was detected above Kings Bay, Ny-Ålesund. The retrieval shows that the enhancement occurred accompanied by severe ozone depletion and mercury deposition.
The possible sources of the reactive bromine are newly formed sea ice and frost flowers, which can provide highly concentrated saline surfaces, and also sea salt aerosol. The transport of air masses that already contain elevated BrO or precursors and depleted ozone, is another possible source of enhanced BrO. Therefore, we investigated the history of the air masses arriving at the measurement site using backward trajectories. Furthermore, the sea ice distribution and satellite BrO maps (Fig. 10) also provide important information.
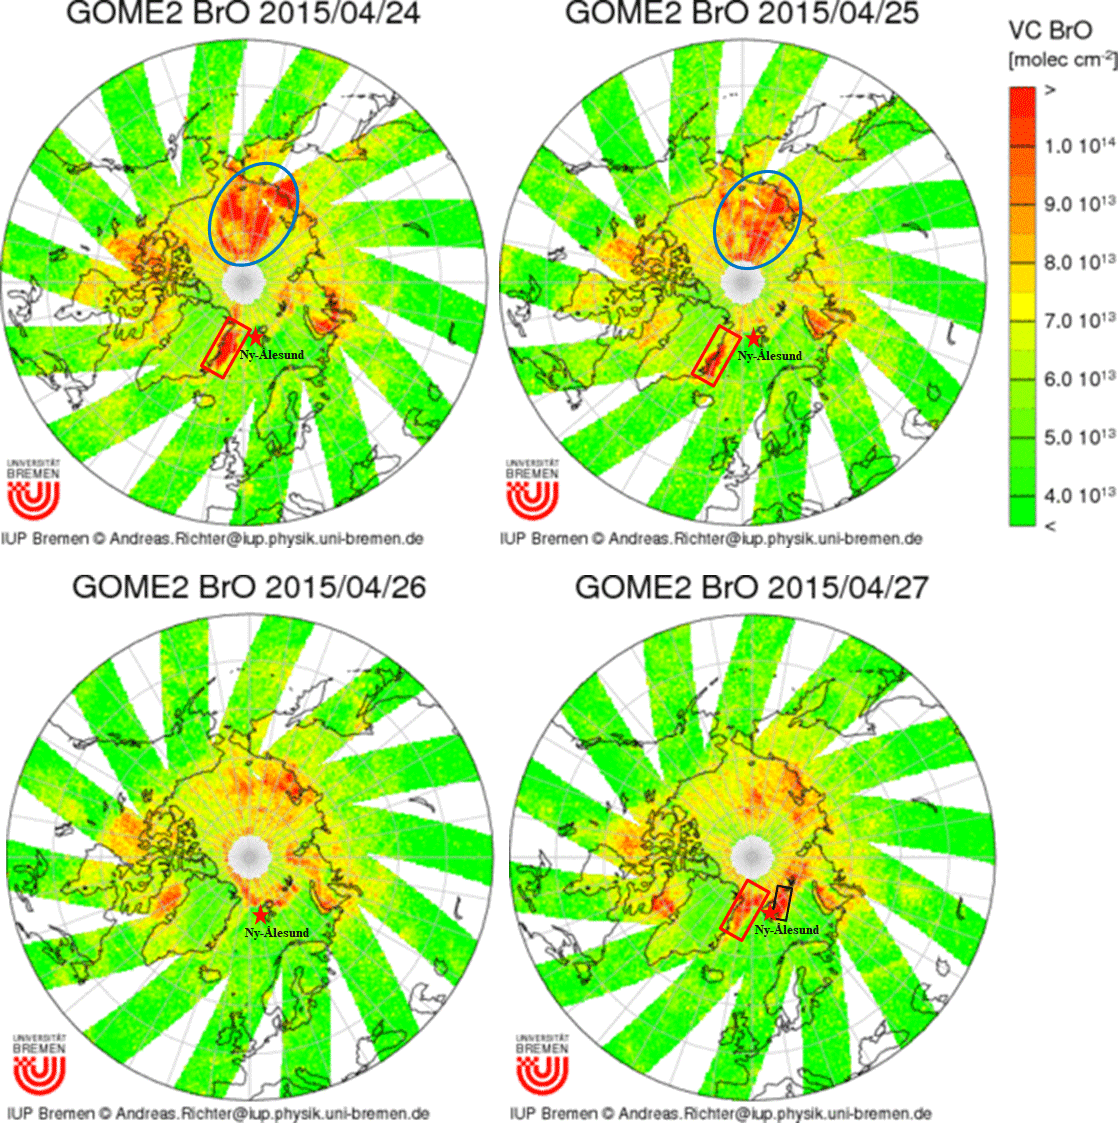
Figure 10Map of tropospheric BrO of the Northern Hemisphere by GOME-2 products from 24 April to 27 April. (cited from http://www.iup.uni-bremen.de/doas/scia_data_browser.htm, last access: 9 July 2018).
This enhancement event represented a good opportunity to investigate the source of the BrO and its impact on the environment of the Arctic boundary layer. These issues are discussed in detail in the following sections based on the air mass history, sea ice distribution and ozone loss and mercury deposition data.
4.1 History of air masses
To define the details of the air mass origin, 72 h backward trajectories at altitudes of 10 and 500 m a.s.l. ending on 27 April at 18:00 UTC were calculated every 6 h (Fig. 9a). This calculation shows that air masses at both altitudes have a discontinuous origin. We then calculated the air mass backward trajectory ending on 26 April at 18:00 UTC for every hour (Fig. 9b). This calculation shows that the air mass has a different origin before/after 26 April 15:00 UTC. The wind direction changed to the north and had a higher velocity. After this, the air mass had a relatively stable origin from a height of 1000 m. More trajectory calculations from 22 to 30 April are shown in Supplement Figs. S1 and S2 for purposes of comparisons. From the GOME-2 BrO VCD maps from 24 to 27 April (Fig. 10), we found that enhanced BrO was observed in the east of Greenland (red box), far north of Siberia (blue circle) and east of Spitsbergen (black box) during the period of interest and in the days before. The BrO maps from other days (20 April to 13 May 2015) are shown in Supplement Fig. S3.
Combining the GOME-2 BrO maps and the trajectory calculations, the source of air masses can be discussed in detail. First, trajectory calculations showed that transport from the east coast of Greenland and east coast of Spitsbergen is not possible. Thus, transport from these areas of enhanced BrO can most likely be ruled out. Second, trajectories also showed that after 26 April 16:00 UTC, transport from the north occurred, which means the high BrO in the blue circle might have influenced this event. However, (a) the altitude of the air mass reaches up to 1000 m; (b) there is no enhancement along the path; and (c) the time scale is unreasonable. The BrO enhancement we found by the ground-based MAX-DOAS, as well as the ozone loss, only lasted for several hours. However, the high level of BrO in the blue circle area lasted for more than one day. Additionally, the transport of air masses may be the reason that the BrO concentrations were slow to return to normal values until 3 May.
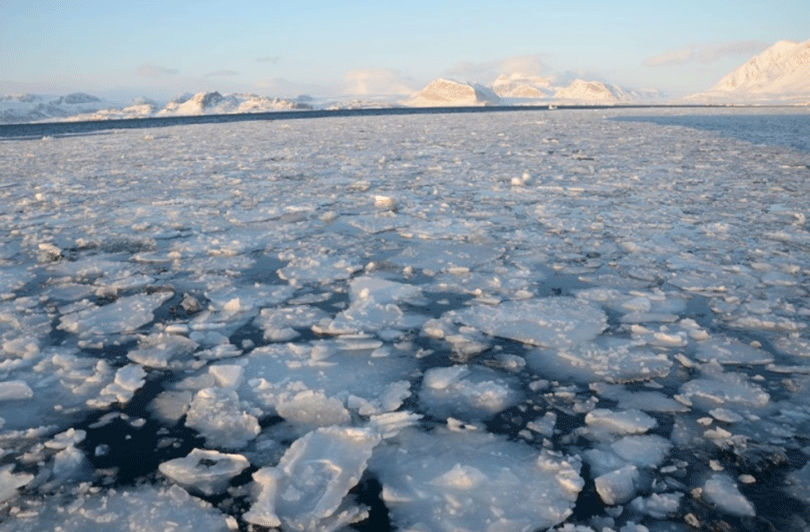
Figure 11Sea ice in Kings Bay, Ny-Ålesund on 26 April at 21:00 UTC, 2015 (at Ny-Ålesund Dock, photograph by Yuhan Luo).
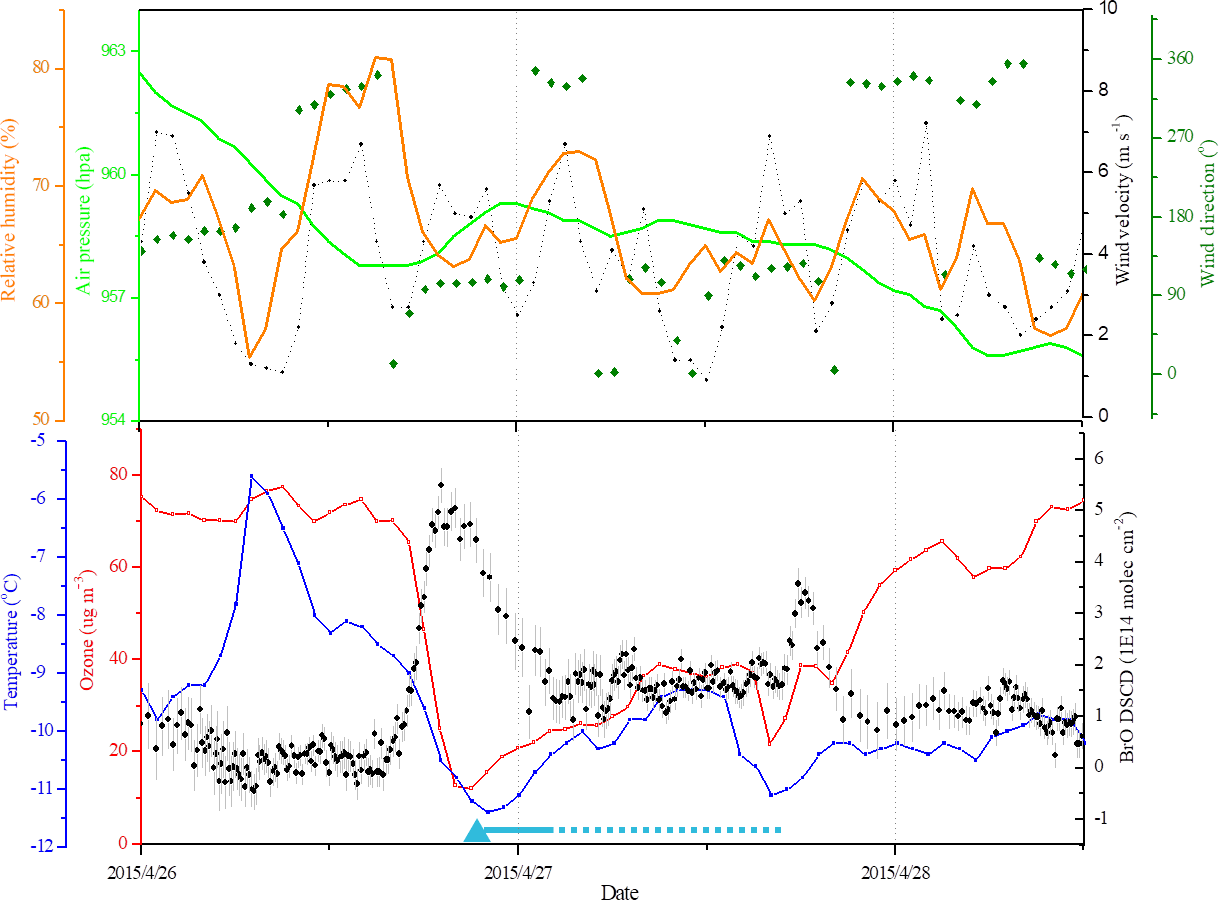
Figure 12Time series of chemical and meteorological changes during the BrO enhancement event; blue triangles represent the existence of sea ice in Kings Bay.
4.2 Sea ice distribution
The observations of sea ice concentration from the AMSR-E and Zeppelin webcams indicated that the water at Kings Bay was an ice-free area during the measurement period. However, large amounts of sea ice appeared at Kings Bay on 26 April (Fig. 11), pushed from the bay entrance by both wind and tidal forces, which is an unusual phenomenon in the fjord. The shape of sea ice comprised broken ice pieces with irregular borders. An ice–sea-water mixture filled in the gaps between sea ice. From the shape of the ice in Fig. 11, the sea ice did not look like newly formed because of its irregular pieces and corrugated edges. Therefore, we consider that the sea ice was formed before floating into the bay and transformed into the ice–water mixture after coming across a sharp temperature decrease.
The chemical and meteorological information from the start of 26 April to noon on 28 April are shown together in Fig. 12. When ozone depletion/BrO enhancement occurs, the air temperature continuously decreases, and the relative humidity drops from 80 to less than 65 %, with the wind direction switching from northwest to east. The concurrent changes in the chemical and meteorological variables demonstrate that changes in observed chemistry are evident because of changes in transport, albeit on a small scale.
It is also worth noting that the time periods when the sea ice existed and the time BrO started to become enhanced (and ozone was depleted) were not exactly the same. Figures 8 and 12 indicated that the ozone loss started from 26 April 14:00 UTC. As described above, the sea ice existed in the fjord after 26 April 20:00 UTC. This observation makes it reasonable to synchronize variations in BrO and ozone, as well as the 0–1 km distribution.
Therefore, this BrO enhancement event is more likely a regional process mainly influenced by the local environment. The sea ice is not totally fresh ice, but the low air and water temperatures during this period may have caused the formation of the brine ice mixture, which is the source of the bromine radicals. The surface ozone concentrations increased along with the melting of sea ice, which indicated that the life spans of the BrO radicals are very short. The reactive bromine radicals gradually transformed to soluble bromide (e.g., HOBr), which explained the sink of bromine (Fan and Jacob, 1992).
4.3 Mercury deposition
The deposition of gaseous mercury occurred concurrently with tropospheric ozone depletion, as well as the enhancement of BrO (Fig. 8), which indicates that the oxidation of GEM by reactive halogen species (Br atoms and BrO radicals) is the key process of mercury depletion. The GEM decreases from ∼ 2 ng m−3 to lower than 0.3 ng m−3 during the BrO enhancement event. The oxidized GEM may be directly deposited onto snow/ice or associated with particles in the air that can subsequently be deposited onto snow and ice surfaces, which threatens polar ecosystems and human health.
The typical process of enhanced bromine and depleted ozone in the Ny-Ålesund boundary layer was observed using ground-based MAX-DOAS techniques in late April 2015. BrO DSCDs as high as 5.6 × 10¹⁴ molec cm−2 were detected on 26–27 April. Meanwhile, severe ozone depletion and mercury deposition occurred under a BrO VMR of 15 pptv. The model showed enhanced BrO distributed at 0–1 km above the sea surface. By analyzing the air mass history and sea ice conditions, this BrO enhancement event was found more likely to be a regional process, driven by changes in sea ice and transport on a local scale.
Measurements and retrieval of BrO column densities over Ny-Ålesund, the Arctic, in 2015 used in this paper can be provided upon request to Yuhan Luo from AIOFM, CAS (yhluo@aiofm.ac.cn).
The supplement related to this article is available online at: https://doi.org/10.5194/acp-18-9789-2018-supplement.
YuL and FS conceived and planned the experiments. YuL carried out the experiments. YuL, HZ and KD designed the computational framework and model of the experiments and carried out the simulations. YuL, FS, HZ, KD and YiL contributed to the interpretation of the results. YuL took the lead in writing the paper. WL supervised the project. All authors provided critical feedback and helped shape the research, analysis and paper.
The authors declare that they have no conflict of interest.
We appreciate the valuable comments from three anonymous referees. This
research was financially supported by the National Natural Science
Foundation of China (Project numbers 41676184, 41306199 and U1407135). We
gratefully thank the Chinese Antarctic and Arctic Administration and
teammates from the 2015 Chinese Arctic Expedition. We are also grateful to
Ping Wang from KNMI and Yang Wang from MPIC for providing advice
about the BrO VMR calculation. We kindly acknowledge the AWIPEV Atmospheric
Observatory in Ny-Ålesund, the Norwegian Polar Institute (NPI) and the
Norwegian Institute for Air Research (NILU) for the complementary data.
Caroline Fayt, Thomas Danckaert and Michel van Roozendael from BIRA are
gratefully acknowledged for providing the QDOAS analysis software.
Meteorological, surface ozone and gaseous mercury data are provided by the
EBAS database. We gratefully acknowledge the NOAA Air Resources Laboratory (ARL)
for providing the HYSPLIT transport model and READY website
(http://www.ready.noaa.gov) used in this publication.
Edited by: Anna Jones
Reviewed by: three anonymous referees
Ariya, P. A., Alexei Khalizov, A., and Gidas, A.: Reactions of gaseous mercury with atomic and molecular halogens: Kinetics, product studies, and atmospheric implications, J. Phys. Chem. A, 106, 7310–7320, 2002.
Ariya, P. A., Dastoor, A. P., Marc, A., Schroeder, W. H., Leonard, B., Kurt, A., Farhad, R., Andrew, R., Didier, D., and Janick, L.: The arctic: A sink for mercury, Tellus, 56, 397–403, 2004.
Bogumil, K., Orphal, J., Homann, T., Voigt, S., Spietz, P., Fleischmann, O. C., Vogel, A., Hartmann, M., Kromminga, H., and Bovensmann, H.: Measurements of molecular absorption spectra with the sciamachy pre-flight model: Instrument characterization and reference data for atmospheric remote-sensing in the 230–380 nm region, J. Photoch. Photobio. A, 157, 167–184, 2003.
Bottenheim, J. W., Netcheva, S., Morin, S., and Nghiem, S. V.: Ozone in the boundary layer air over the Arctic Ocean: measurements during the TARA transpolar drift 2006–2008, Atmos. Chem. Phys., 9, 4545–4557, https://doi.org/10.5194/acp-9-4545-2009, 2009.
Chance, K. V. and Spurr, R. J. D.: Ring effect studies: Rayleigh scattering, including molecular parameters for rotational Raman scattering, and the Fraunhofer spectrum, Appl. Optics, 36, 5224–5230, 1997.
Fan, S. M. and Jacob, D. J.: Surface ozone depletion in arctic spring sustained by bromine reactions on aerosols, Nature, 359, 522–524, 1992.
Frieß, U., Hollwedel, J., König-Langlo, G., Wagner, T., and Platt, U.: Dynamics and chemistry of tropospheric bromine explosion events in the Antarctic coastal region, Comptes Rendus Des Séances De La Société De Biologie Et De Ses Filiales, 109, 1454–1456, 2004.
Frieß, U., Sihler, H., Sander, R., Pöhler, D., Yilmaz, S., and Platt, U.: The vertical distribution of bro and aerosols in the arctic: Measurements by active and passive differential optical absorption spectroscopy, J. Geophys. Res.-Atmos., 116, 597–616, 2011.
Hermans, C., Vandaele, A. C., Fally, S., Carleer, M., Colin, R., Coquart, B., Jenouvrier, A., and Merienne, M. F.: Absorption cross-section of the collision-induced bands of oxygen from the UV to the NIR, in: Weakly Interacting Molecular Pairs: Unconventional Absorbers of Radiation in the Atmosphere, NATO Science Series (Series IV: Earth and Environmental Sciences), edited by: Camy-Peyret C. and Vigasin A. A., Springer, Dordrecht, the Netherlands, 27, 193–202, 2003.
Hönninger, G. and Platt, U.: Observations of BrO and its vertical distribution during surface ozone depletion at Alert, Atmos. Environ., 36, 2481–2489, 2002.
Jacobi, H., Kaleschke, L., Richter, A., Rozanov, A., and Burrows, J. P.: Observation of a fast ozone loss in the marginal ice zone of the Arctic Ocean, J. Geophys. Res.-Atmos., 111, 3363–3375, 2006.
Kaleschke, L., Richter, A., Burrows, J., Afe, O., Heygster, G., Notholt, J., Rankin, A. M., Roscoe, H. K., Hollwedel, J., and Wagner, T.: Frost flowers on sea ice as a source of sea salt and their influence on tropospheric halogen chemistry, Geophys. Res. Lett., 31, 371–375, 2004.
Kromminga, H., Orphal, J., Spietz, P., Voigt, S., and Burrows, J. P.: New measurements of OClO absorption cross-sections in the 325–435 nm region and their temperature dependence between 213 and 293 k, J. Photochem. Photobio. A, 157, 149–160, 2003.
Kurucz, R. L., Furenlid, I., Brault, J., and Testerman, L.: Solar flux atlas from 296 to 1300 nm, National Solar Observatory Atlas, Sunspot, New Mexico: National Solar Observatory, 1988.
Lehrer, E., Hönninger, G., and Platt, U.: A one dimensional model study of the mechanism of halogen liberation and vertical transport in the polar troposphere, Atmos. Chem. Phys., 4, 2427–2440, https://doi.org/10.5194/acp-4-2427-2004, 2004.
Leser, H., Hönninger, G., and Platt, U.: MaxDOAS measurements of BrO and NO2 in the marine boundary layer, Geophys. Res. Lett., 30, 149–164, 2003.
Lindberg, S. E., Brooks, S., Lin, C. J., Scott, K. J., Landis, M. S., Stevens, R. K., Goodsite, M., and Richter, A.: Dynamic oxidation of gaseous mercury in the Arctic troposphere at polar sunrise, Environ. Sci. Technol., 36, 1245–1256, https://doi.org/10.1021/es0111941, 2002.
Lu, J. Y., Schroeder, W. H., Barrie, L. A., Steffen, A., Welch, H. E., Martin, K., Lockhart, L., Hunt, R. V., Boila, G., and Richter, A.: Magnification of atmospheric mercury deposition to polar regions in springtime: The link to tropospheric ozone depletion chemistry, Geophys. Res. Lett., 28, 3219–3222, 2001.
Neuman, J. A., Nowak, J. B., Huey, L. G., Burkholder, J. B., Dibb, J. E., Holloway, J. S., Liao, J., Peischl, J., Roberts, J. M., Ryerson, T. B., Scheuer, E., Stark, H., Stickel, R. E., Tanner, D. J., and Weinheimer, A.: Bromine measurements in ozone depleted air over the Arctic Ocean, Atmos. Chem. Phys., 10, 6503–6514, https://doi.org/10.5194/acp-10-6503-2010, 2010.
Pöhler, D., Stephan, G., Zielcke, J., Shepson, P. B., Sihler, H., Stirm, B. H., Frieß, U., Pratt, K. A., Walsh, S., and Simpson, W. R.: Horizontal and vertical distribution of bromine monoxide in northern Alaska during BROMEX derived from airborne imaging-doas measurements, EGU General Assembly Conference, 7–12 April 2013, Vienna, Austria, 2013.
Platt, U.: Differential optical absorption spectroscopy (DOAS), in: Air monitoring by spectroscopic techniques, edited by: Sigrist, M. W., Chem. Anal. Ser., 32, 327–333, 1994.
Platt, U. and Hönninger, G.: The role of halogen species in the troposphere, Chemosphere, 52, 325–338, 2003.
Platt, U. and Wagner, T.: Satellite mapping of enhanced bro concentrations in the troposphere, Nature, 395, 486–490, 1998.
Richter, A., Wittrock, F., Eisinger, M., and Burrows, J. P.: Gome observations of tropospheric bro in northern hemispheric spring and summer 1997, Geophys. Res. Lett., 25, 2683–2686, 1998.
Rolph, G., Stein, A., and Stunder, B.: Real-time Environmental Applications and Display sYstem: READY, Environ. Model. Softw., 95, 210–228, https://doi.org/10.1016/j.envsoft.2017.06.025, 2017.
Rozanov, A., Rozanov, V., Buchwitz, M., Kokhanovsky, A., and Burrows, J. P.: Sciatran 2.0 – A new radiative transfer model for geophysical applications in the 175–2400 nm spectral region, Adv. Space Res., 36, 1015–1019, 2005.
Saiz-Lopez, A. and von Glasow, R.: Reactive halogen chemistry in the troposphere, Chemi. Soc. Rev., 41, 6448–6472, https://doi.org/10.1039/c2cs35208g, 2012.
Sihler, H., Platt, U., Frieß, U., Doerner, S., and Wagner, T.: Satellite observation of the seasonal distribution of tropospheric bromine monoxide in the arctic and its relation to sea-ice, temperature, and meteorology, EGU General Assembly, 7–12 April 2013, Vienna, Austria, 2013.
Simpson, W. R., von Glasow, R., Riedel, K., Anderson, P., Ariya, P., Bottenheim, J., Burrows, J., Carpenter, L. J., Frieß, U., Goodsite, M. E., Heard, D., Hutterli, M., Jacobi, H.-W., Kaleschke, L., Neff, B., Plane, J., Platt, U., Richter, A., Roscoe, H., Sander, R., Shepson, P., Sodeau, J., Steffen, A., Wagner, T., and Wolff, E.: Halogens and their role in polar boundary-layer ozone depletion, Atmos. Chem. Phys., 7, 4375–4418, https://doi.org/10.5194/acp-7-4375-2007, 2007.
Steffen, A., Douglas, T., Amyot, M., Ariya, P., Aspmo, K., Berg, T., Bottenheim, J., Brooks, S., Cobbett, F., Dastoor, A., Dommergue, A., Ebinghaus, R., Ferrari, C., Gardfeldt, K., Goodsite, M. E., Lean, D., Poulain, A. J., Scherz, C., Skov, H., Sommar, J., and Temme, C.: A synthesis of atmospheric mercury depletion event chemistry in the atmosphere and snow, Atmos. Chem. Phys., 8, 1445–1482, https://doi.org/10.5194/acp-8-1445-2008, 2008.
Stein, A. F., Draxler, R. R., Rolph, G. D., Stunder, B. J. B., Cohen, M. D., and Ngan, F.: NOAA's HYSPLIT atmospheric transport and dispersion modeling system, B. Am. Meteorol. Soc., 96, 2059–2077, 2015.
Stutz, J., Thomas, J. L., Hurlock, S. C., Schneider, M., von Glasow, R., Piot, M., Gorham, K., Burkhart, J. F., Ziemba, L., Dibb, J. E., and Lefer, B. L.: Longpath DOAS observations of surface BrO at Summit, Greenland, Atmos. Chem. Phys., 11, 9899–9910, https://doi.org/10.5194/acp-11-9899-2011, 2011.
Tørseth, K., Aas, W., Breivik, K., Fjæraa, A. M., Fiebig, M., Hjellbrekke, A. G., Lund Myhre, C., Solberg, S., and Yttri, K. E.: Introduction to the European Monitoring and Evaluation Programme (EMEP) and observed atmospheric composition change during 1972–2009, Atmos. Chem. Phys., 12, 5447–5481, https://doi.org/10.5194/acp-12-5447-2012, 2012.
Tuckermann, M., Ackermann, R., Gölz, C., Lorenzen-Schmidt, H., Senne, T., Stutz, J., Trost, B., Unold, W., and Platt, U.: Doas observation of halogen radical atalysed arctic boundary layer ozone destruction during the arctoc ampaigns 1995 and 1996 in Ny-Ålesund, Spitsbergen, Tellus B, 49, 533–555, 1997.
Vandaele, A. C., Hermans, C., Simon, P. C., Carleer, M., Colins, R., Fally, S., Merienne, M. F., Jenouvrier, A., and Coquart, B.: Measurements of the no2 absorption cross section from 42 000 cm−1 to 10 000 cm−1 (238–1000 nm) at 220 k and 294 k, J. Quant. Spectrosc. Ra., 59, 171-184, 1998.
Wagner, T., Leue, C., Wenig, M., Pfeilsticker, K., and Platt, U.: Spatial and temporal distribution of enhanced boundary layer bro concentrations measured by the Gome instrument aboard ERS-2, J. Geophys. Res.-Atmos., 106, 106235, 225–224, 2001.
Wagner, T., Ibrahim, O., Sinreich, R., Frieß, U., von Glasow, R., and Platt, U.: Enhanced tropospheric BrO over Antarctic sea ice in mid winter observed by MAX-DOAS on board the research vessel Polarstern, Atmos. Chem. Phys., 7, 3129–3142, https://doi.org/10.5194/acp-7-3129-2007, 2007.
Wilmouth, D. M., Hanisco, T. F., And, N. M. D., and Anderson, J. G.: Fourier transform ultraviolet spectroscopy of the A 2Π3/2 ← X 2Π3/2 Transition of BrO, J. Phys. Chem. A, 103, 8935–8945, 1999.