the Creative Commons Attribution 4.0 License.
the Creative Commons Attribution 4.0 License.
 | 09 Jul 2018
An apportionment method for the oxidative potential of atmospheric particulate matter sources: application to a one-year study in Chamonix, France
Samuël Weber
Aude Calas
Florie Chevrier
Jean-Luc Besombes
Aurélie Charron
Dalia Salameh
Irena Ježek
Griša Močnik
Jean-Luc Jaffrezo
Inhaled aerosolized particulate matter (PM) induces cellular oxidative stress in vivo, leading to adverse health outcomes. The oxidative potential (OP) of PM appears to be a more relevant proxy of the health impact of the aerosol rather than the total mass concentration. However, the relative contributions of the aerosol sources to the OP are still poorly known. In order to better quantify the impact of different PM sources, we sampled aerosols in a French city for one year (2014, 115 samples). A coupled analysis with detailed chemical speciation (more than 100 species, including organic and carbonaceous compounds, ions, metals and aethalometer measurements) and two OP assays (ascorbic acid, AA, and dithiothreitiol, DTT) in a simulated lung fluid (SLF) were performed in these samples. We present in this study a statistical framework using a coupled approach with positive matrix factorization (PMF) and multiple linear regression to attribute a redox-activity to PM sources. Our results highlight the importance of the biomass burning and vehicular sources to explain the observed OP for both assays. In general, we see a different contribution of the sources when considering the OP AA, OP DTT or the mass of the PM10. Moreover, significant differences are observed between the DTT and AA tests which emphasized chemical specificities of the two tests and the need of a standardized approach for the future studies on epidemiology or toxicology of the PM.
- Article
(5884 KB) - Full-text XML
-
Supplement
(436 KB) - BibTeX
- EndNote


Exposure of the population to pollution by airborne particles is a growing concern due to its burden on human health, ranking as the 5th greatest risk factor for total deaths from all causes across ages and sexes in 2015 (Cohen et al., 2017). Such an impact is assessed through crossover studies based on health data and particulate matter (PM) mass concentrations (Pope III, 2004; Pope III and Dockery, 1999; WHO, 2016). However, the dominant fraction of the PM mass are ionic species or crustal elements and these contribute little to PM toxicity (Ayres et al., 2008). Therefore, new metrics are currently investigated in order to better quantify the effect of the population exposure. Among the different metrics, oxidative potential (OP) addresses the intrinsic capacity of PM to generate reactive oxygen species (ROS) able to oxidize the lungs. It has been proposed as a unifying factor for quantifying the effects of particulate exposure as it relies on surface area, size and PM composition (Ayres et al., 2008; Sauvain et al., 2009; Kelly and Fussell, 2012; Gehling and Dellinger, 2013; Sauvain et al., 2013; Fang et al., 2016; Crobeddu et al., 2017; Abrams et al., 2017).
Many methodologies to quantify OP exist, and none has become standard so far. As each OP methodology is somewhat specific to the precise type of ROS or ROS-inducer (Yang et al., 2014), a standard methodology should probably include several assays, in order to fully determine the ROS generation propensity (Janssen et al., 2015; Sauvain et al., 2013). Such a combination has not emerged yet, as the link between OP and chemical composition of PM is not fully understood, and OP drivers are not truly supported by evidence.
Investigating the link between OP and chemistry of PM is not simple, as particles chemical composition is unique in every sampling point. Moreover, univariate correlations can lead to false results. For example, strong OP correlation with polycyclic aromatic hydrocarbon (PAH) can be found within dithiothreitol (DTT) assay (Calas et al., 2018). This correlation is chemically impossible as DTT, a reducing agent, needs redox-active compounds to be depleted (Ntziachristos et al., 2007; Shirmohammadi et al., 2016). This correlation is now well explained as PAHs are co-emitted with quinones, oxy-PAH, which are redox-active and able to oxidize DTT (Charrier et al., 2015; Charrier and Anastasio, 2012). Linear multiple regression is not trivial to use in determining OP factors, as extreme outliers need to be removed, normal distributions are needed and negative contributions may be attributed to mathematically explain annual OP variations (Calas et al., 2018).
Another option is to consider the sources contribution instead of the chemical species (Verma et al., 2014; Bates et al., 2015; Fang et al., 2015, 2016). Indeed, working directly with chemical species involves assessing an exhaustive composition characterization. This is impossible, as many species in the complex mixture of aerosols remain unidentified. Moreover, if a detailed composition (which can sometimes include up to 150 species, see; Waked et al., 2014) is provided, at least the same number of samples for OP measurements is needed, otherwise, the system remains underdetermined. Reducing the system by direct truncation is not possible as species contributing to OP could be dropped, inducing some degree of unknown bias. Conversely, if the explanatory variables are the sources contributions, biases are mitigated. However, the sources dynamics need to be determined for a long period of time in order to reflect the climatology of the location. Moreover, the composition of a given named source may vary according to its location (Belis et al., 2013). To mitigate theses issues, we decide to use a PMF approach instead of a CMB model to better render the local specificities of the sources. Indeed, the CMB averages the sources profiles from different studies and is then locally biased. Furthermore, in this study a whole year of analysis is used as input of the PMF. We then have a climatological view of the sources dynamics.
The objective of this study is to present a methodology for the evaluation of the contributions of common sources of particles to the overall OP for a long time series of PM10 sample (PM with a diameter lower than 10 µm). The OP was measured on filter samples collected over a full year in the city of Chamonix (Alpine valley), using two OP protocols: the ascorbic acid (AA) and dithiothreitol (DTT) assays. An inversion procedure of these OP measurements was developed using source apportionment results obtained from an advanced source-receptor model PMF (Chevrier, 2016), in order to attribute both an intrinsic OP to the sources and the evolution of the sources contributions to OPs over the year.
This work takes advantage of an already existing database, based on Particulate Matter (PM10) samples collected during the DECOMBIO program (Chevrier et al., 2016), with the chemical analyses and the source apportionment of PM having already been conducted (Chevrier, 2016), and the OP measurements performed on the same samples (Calas et al., 2018). These are briefly presented below.
2.1 Site and sampling
Sampling took place in the city of Chamonix-Mont-Blanc (45∘55.358′ N, 6∘52.194′ E), in the Alpine Arve valley, below Mont Blanc (Fig. 1). The sampling site is located in the middle of the town, in a densely populated area, with the sampling cabin being close to a street. A one-year study was conducted from 14 November 2013 to 31 October 2014, with 24 h PM10 sampling taking place every third day, giving a series of 115 samples. These daily PM10 samples were collected with a high volume sampler (Digitel, DA80, 30 m3 h−1) on pre-fired quartz filters (Pall, Tissuquartz). All details concerning the site and the logistical aspects of the sampling procedure can be found in Chevrier (2016).

Figure 1Location of the sampling site in Chamonix, in the Arve valley, France (45∘55.358′ N, 6∘52.194′ E). ©PlaneteObserver, IGN
2.2 Chemical analyses
All filters were analyzed using a large array of methods for the quantification of chemical species including those important for the mass balance of the PM (EC, OC, ions…) and many organic and inorganic tracers of sources. The elements and components analyzed are as follows:
-
organic and elemental carbon (OC, EC), using a Sunset instrument and the EUSAAR2 protocol (Aymoz et al., 2004; Cavalli et al., 2016);
-
soluble anions and cations (, , Cl− and , Mg2+, Na+, Ca2+, K+) through ionic chromatography (Waked et al., 2014);
-
inorganic elements (Al, Fe, Ti, As, Ba Cd, Ce, Cr, Cu, La, Li, Mn, Mo, Ni, Pb, Rb, Sb, Sn, Sr, V, Zn and Zr) using ICP-MS (Waked et al., 2014);
-
sugar alcohols (arabitol, sorbitol and mannitol, also called polyols) and anhydrous monosaccharides (levoglucosan, mannosan and galactosan) using an HPLC-PAD method (Waked et al., 2014);
-
polar and nonpolar organic tracers (alkanes, hopanes, methoxyphenols and substituted derivatives or methyl-PAHs), polycyclic aromatic sulfur heterocycles (PASHs) using GC-MS and polycyclic aromatic hydrocarbons (PAHs) using HPLC-fluorescence (Golly et al., 2015).
Additionally, Black Carbon (BC) measurements were ongoing throughout the year, with wood burning BCbb and fossil fuel BCff fractions determined using an Athalometer AE33 and the so called “Aethalometer model” (Sandradewi et al., 2008; Drinovec et al., 2015). Although the BC measurements was performed on PM2.5 samples, we decided to use it as Jaffrezo et al. (2005); Cavalli et al. (2016) show that the amount of EC in PM10 and PM2.5 is almost equivalent.
All the procedures for these chemical analyses are described in detail in Chevrier (2016).
2.3 Source apportionment of PM10
The source apportionment was performed with Positive Matrix Factorization, using the US EPA software PMF 5.0 (US EPA, 2017), following the recommendations included in the european guideline book issued in the EU Fairmode program (Belis et al., 2014). However, in the environment of Alpine valleys, the local meteorology and frequent inversion layers in winter lead to strong covariations of the concentrations of many chemical species emitted from the valley bottom. Indeed, during temperature inversion in Alpine valley, pollutants are stuck into the atmospheric boundary layer (ABL) and cannot be removed by wind. Such inversion may be stable over several days. As a result, the different emission sources during that period of time add together and the dynamic from the different sources is masked. In other words, one sample does not integrate emissions only during the sampling time, but also emissions of the previous days. This ends up with chemical species in one sample that should not be present together, respect to the temporality of their respective sources. Thereby, their correlation is increased. The covariation of the different pollutants adversely influences the ability of PMF to distinguish different sources. Therefore, we developed an approach including several specificities, rarely applied in classic source apportionment, in order to overcome this methodological problem in the PMF (Chevrier, 2016).
First, many tracers were included as input parameters, including specific organic tracers. The benefit of such an approach was previously described (Golly, 2014; Waked et al., 2014; Srivastava et al., 2018). In our case, we included hopanes (thereafter named HOP), methoxyphenols, polyols (sum of mannitol, arabitol and sorbitol), levoglucosan and MSA (methane sulfonic acid). Instead of OC we used the difference (OC*) between the OC and the carbon equivalent of these previously analyzed species.
Second, elemental carbon (EC), which is an important species for the deconvolution of combustion sources was replaced in the PMF by BCbb and BCff obtained using the “Aethalometer model” by concurrent measurements with the Aethalometer AE33. This provides a very strong information on the sources, as already pointed out in other studies (Petit et al., 2015). No correction was introduced to compensate between EC and BC (Zanatta et al., 2016).
Finally, we took advantage of the possibilities of PMF 5.0 to apply constraints to the factor profiles, in order to better define the sources (Golly, 2014; Srivastava et al., 2018; Salameh, 2015). A minimal set of constraints based on prior and external geochemical knowledge of sources fingerprints was applied:
-
in the biomass burning factor, the contributions of levoglucosan, potassium, methoxyphenols and BCbb were increased, whereas the BCff and HOP were set to 0,
-
HOP was increased in the vehicular factor.
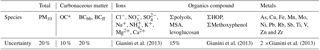
We increased the concentration of the species in the factors thanks to the “pull up maximally” option of the EPA PMF 5.0 software (US EPA, 2017), which tried to increase the contribution of the given species to the factor. Table 1 sums up the input chemistry species and respective uncertainties used in the PMF study.
Gianini et al. (2013)Gianini et al. (2013)Gianini et al. (2013)Table 1Selection of the chemical species used as input variables in the EPA PMF5.0 model and their relative uncertainties. Σpolyols refers to the sum of arabitol, sorbitol and mannitol and Σmethoxyphenol to the sum of the particulate methoxyphenols. The uncertainties in “%” are relative to the sample concentration for the species.
2.4 Measurements of the Oxidative Potential of PM
The methodology is described in detail in Calas et al. (2017). In brief, we performed the extraction of PM into the simulated lung fluid (SLF) solution to simulate the bio-accessibility of PM and to closer simulate exposure conditions. The extraction took place into SLF at iso-mass. All samples were analyzed at 10 µg mL−1 of PM, by adjusting the area of filter extracted. The filter extraction method includes both water soluble and insoluble species. After the SLF extraction, particles removed from filter are not filtrated; the whole extract is injected in the multiwall plate. Samples were processed using the AA and DTT assays. DTT depletion when in contact with PM extracts was determined by dosing the remaining amount of DTT with DTNB (dithionitrobenzoic acid) at different reaction times and absorbance was measured at 412 nm using a plate spectrophotometer (Tecan, M200). The AA assay is a simplified version of the synthetic respiratory tract lining fluid (RTFL) assay (Kelly and Mudway, 2003), where only AA is used. AA depletion is read continuously for 30 min from absorbance at 265 nm (TECAN, 200). The maximum depletion rate of AA is determined by linear regression of the linear section data. For both assays, the 96-wells plate is auto shaken for 3 s before each measurement and kept at 37 ∘C. Three filter blanks (laboratory blanks) are included in every plate (OP AA and OP DTT) of the protocol. The average values of these blanks are then subtracted from the sample measurement of this plate. LOD value is defined as three times of the standard deviation of laboratory blanks measurements (blank filters in Gamble+DPPC solution).
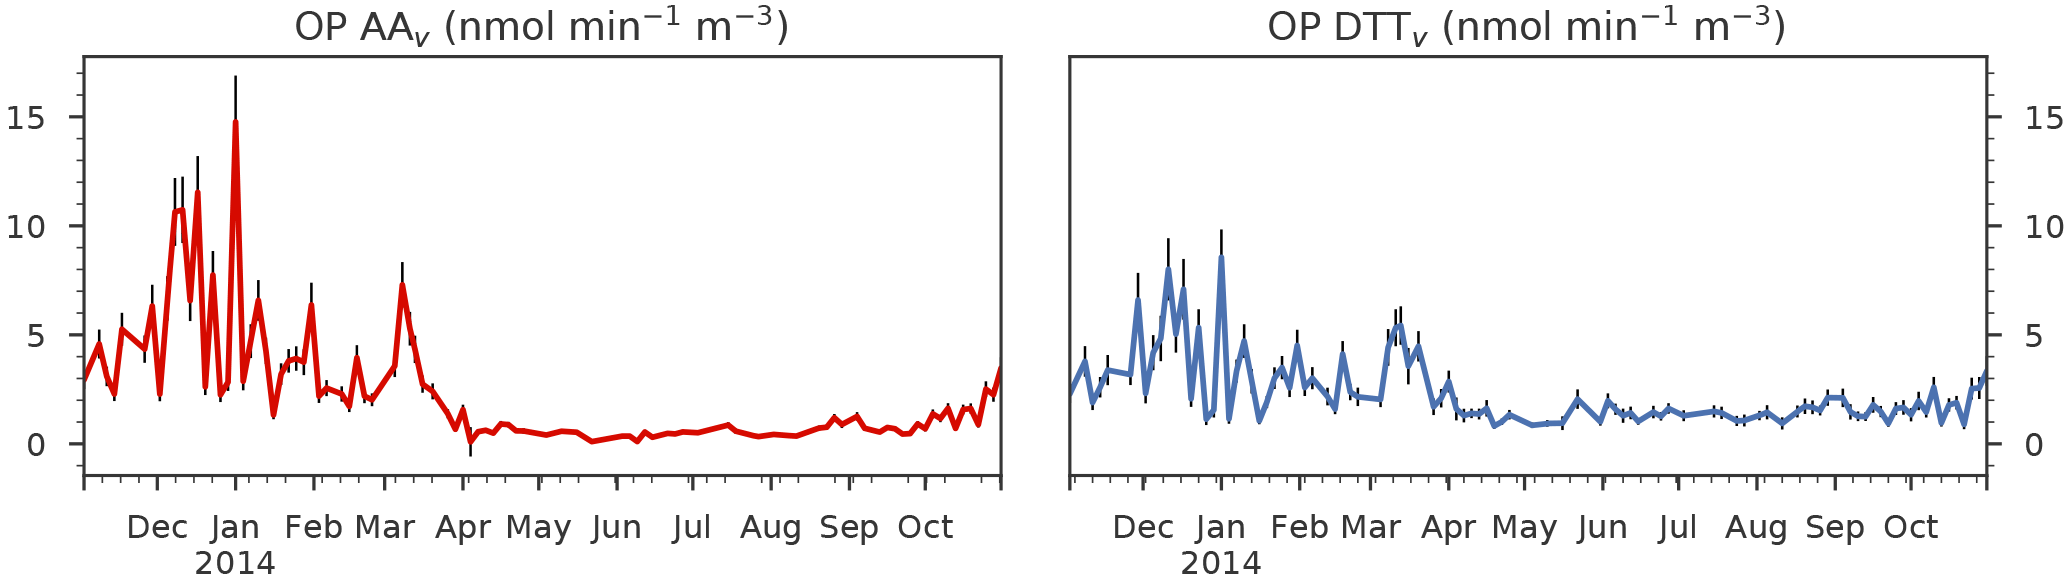
Figure 2OP AAv and OP DTTv variation from 2 November 2013 to 31 October 2014 (98 samples) at the Chamonix station. The error bars represent the uncertainties (standard deviation) of the measurement. The OP unit is normalized by volume and is expressed in .
The samples were stored 3 years before they were analyzed. As mentioned in Verma et al. (2015), the OP activity may be impacted by such storage time. However, in a previous program (ANSES ExPOSURE, 2017), still ongoing, we have been measuring the same filter over time. After one year, OP results for AA assay remain equivalents. DTT results showed a regular decrease of 15 % the first 6 months before stabilization.
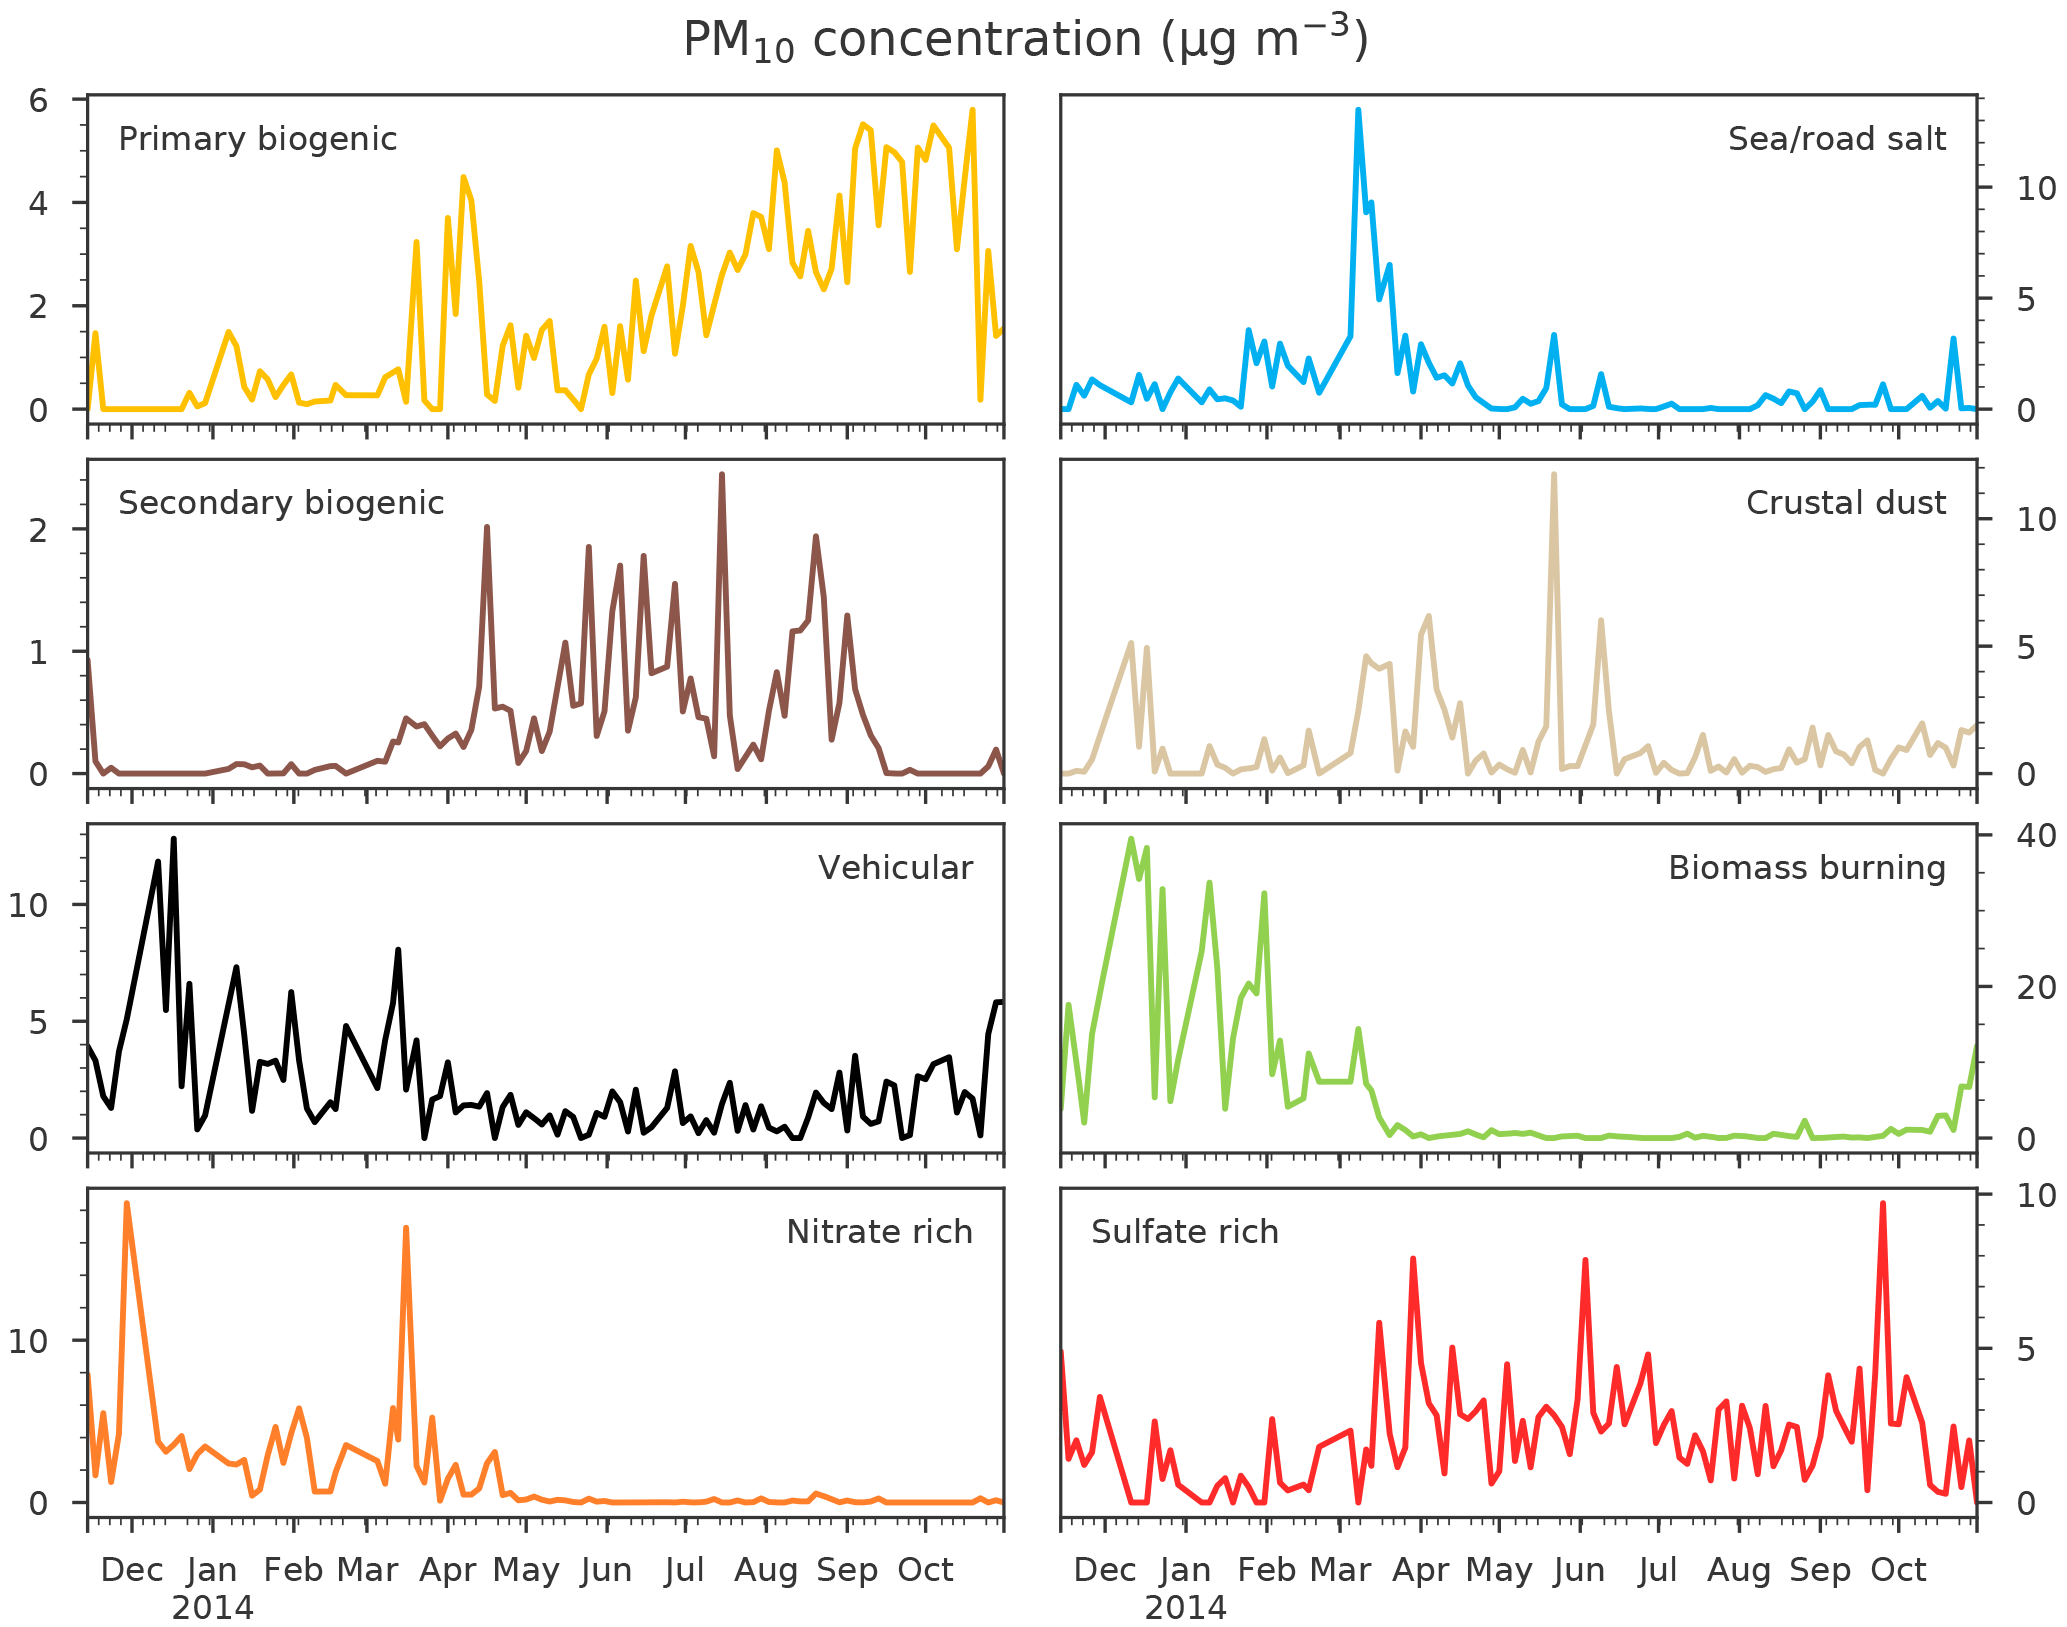
Figure 3Mass concentrations of the eight PMF sources as fractions of PM10 from 14 November 2013 to 31 October 2014 (107 samples) at the Chamonix station. Units are expressed in µg m−3. Note the different scales on the source contributions.
Only 98 samples out of the 115 collected were measured for OP, removing samples with insufficient PM mass concentration (< 5 µg m−3) that did not afford filter extraction at 10 µg mL−1. The oxidative potential (OP) unit is then expressed in nmol per minute per microgram of PM. However, the population exposition is (in the first order) proportional to the mass of the inhaled PM. Therefore, the OP per microgram was multiplied by the total mass concentration of PM (µg m−3) in order to express the OP in units of . However, we should keep in mind that this measurement of OP may not be the exact OP from PM inhaled by the population, since we suppose a linear relationship between the OP per µg of PM and the OP of the total amount of PM. Indeed, some cocktail effects like complexation or chelation may occur for PM concentrations higher than the one tested. It has been shown by Calas et al. (2017) that the result is generally a probable overestimation of the “true” OP. Hereafter, the OP normalized by volume is denoted with a subscribed “v” (OP AAv and OP DTTv).
3.1 Evolution of the OP
Both assays present a strong seasonality (Fig. 2), as already mentioned in Calas et al. (2017), and both the OP AAv and OP DTTv results show seasonality. The OPv remains high during winter and low during summer. This observation tends to emphasize the importance of PM sources that also show distinct seasonality. However, we can also observe fast variations from day to day, which may be related to a change in the PM chemistry or composition or a change in PM concentration related to sources or meteorological conditions.
Despite both assays following the same annual trend, some significant differences exist. For instance, during summer, OP DTTv shows larger values, whereas the values of OP AAv are close to 0. Moreover, the variation of the OP AAv seems smoother than that of OP DTTv, especially during summer and fall (May to November). This underlines that the assays are sensitive to different chemical species present in PM.
3.2 Evolution of the sources contributions
The PMF was already thoroughly discussed in Chevrier (2016). Briefly, eight sources were identified: biomass burning, crustal dust, nitrate rich, sulfate rich, primary biogenic emissions an secondary biogenic aerosol, salt and vehicular emissions. Their respective main chemical species and related information are provided in the Supplement (Sect. S1). We mainly see that metals (notably copper) and some organics species are highly correlated to both OP, together with many fractions of the carbonaceous matter (OC, BCbb and BCff, see Sect. S2). Figure 3 presents sources contributions to PM. The dominant PM source is biomass burning during winter with some daily concentrations exceeding 40 µg m−3. The primary and secondary biogenic sources are mainly active during summer, as is the sulfate rich source. The vehicular source is quite constant all over the year. Indeed, the higher concentration during winter may be attributed to accumulation in the ABL, and not to an increase of emission. The crustal dust contribution is sporadic and could include some Saharan episodes (Aymoz et al., 2004). Finally, the salt source is low but presents a high spike during March, possibly related to road salting at that time of the year. The correlation between the OP and the sources are presented and discussed in the Sect. S2. Briefly, the vehicular and biomass burning sources appear to be strongly correlated to both OP (r>0.8). The nitrate-rich factor presents a lower correlation, as well as the sea/road salt factors ( for both OPs), whereas the secondary biogenic, primary biogenic and sulfate-rich factors are slightly anti-correlated with both OPs (). Crustal dust correlation is not significant with respect to the AA test but presents low correlation to the DTT test (r=0.15 and r=0.35, respectively).
3.3 Setting up a multiple linear regression
As the OP is a value of reactivity, it cannot be directly introduced in a mass-balance model. Hence, in order to estimate the contributions of the PM sources to the OP, we must use an inversion method. Despite the possible non-linearity of OP values with increasing masses of PM, as discussed below, we assume in this work that the OP is linearly linked to the mass. Thus, we hereafter assume that OP and the explanatory variables, namely the mass of the PM sources mPM, are linearly related as follows:
where OPobs is the (n×1) observed OP matrix in , mPM the () matrix with the PM mass attributed to each source expressed in µg m−3 and a constant unity term with no unit for the intercept, and ε the (n×1) uncertainty matrix in ; n is the number of samples and p the number of sources. The estimator β (matrix ) represents the intrinsic OP of the sources (i.e., the OP per mass unit of PM attributed to a given source) and the intercept, expressed respectively in for the intrinsic OP and in for the intercept.
The optimal approximation of a solution for the linear system expressed by Eq. (1) is typically found by least squares. A variety of methods exist differing on the function to be minimized and on the regularization or sparsity penalty imposed to perform variable selection on β, from ordinary least squares to ridge regression and LASSO (least absolute shrinkage and selection operator). Here we have chosen a weighted least squares (WLS) approach as it has an integrated way to handle the OP uncertainties. We have also chosen not to add a penalty function as we do not have prior knowledge on the intrinsic OP values. However, regular WLS do not rule out negative solutions, which should be implemented in our case, as it is not demonstrated that intrinsic OP negative values exist in the real world. Therefore, a stepwise regression is conducted. The underlying algorithm is as follows.
-
Solve the WLS problem and estimate the intrinsic OP.
-
If an intrinsic OP is negative, then set it to zero and go back to step 1.
-
Repeat until all intrinsic OPs are positive or zero.
No source is discarded based on its p-value, but sources should be discarded due to negative intrinsic OP. We did not choose a direct non-negative least square approach as it would be a constraint in the model that we believe would be too strong. In addition, we can use the absence of negative coefficients as a test for the coherence of our dataset. Such an approach may allow us to investigate which sources present a negative OP and why. This loop converges in a finite number of iterations, either to a situation with zero sources – which would be discarded as absurd, pointing to a breakdown of the underlying assumptions, or to an acceptable solution with a lower number of sources. In our particular case, since OP measurements never display negative values or negative source contributions from the PMF, the method is strictly guaranteed to converge to an acceptable solution. Further, we expressly do not set the intercept to zero in Eq. (1), choosing instead to use this as a check on our method. If the system is well constrained (i.e., no missing sources) the intercept should be close to zero within the model uncertainties, without any explicit constraint. The reciprocal situation could point to missing explanatory variables.
The uncertainties of the intrinsic OP are extracted from the variance of β, which in turn is derived from the Hessian matrix of the WLS regression in the standard way. However, the uncertainties on the modeled OP are not analytically computed. Indeed, some coefficients present covariation due to the activity of the sources in the same period of the year, so analytical variance cannot be used to estimate uncertainties. Therefore, in order to estimate the uncertainties of the modeled OP, we bootstrap the solution β 1000 times with a Monte-Carlo algorithm. The bootstrap simply randomly selects an intrinsic OP for each source according to their respective normal distribution.
The algorithm was implemented in Python 3 making use of the statsmodels WLS module (Seabold and Perktold, 2010).
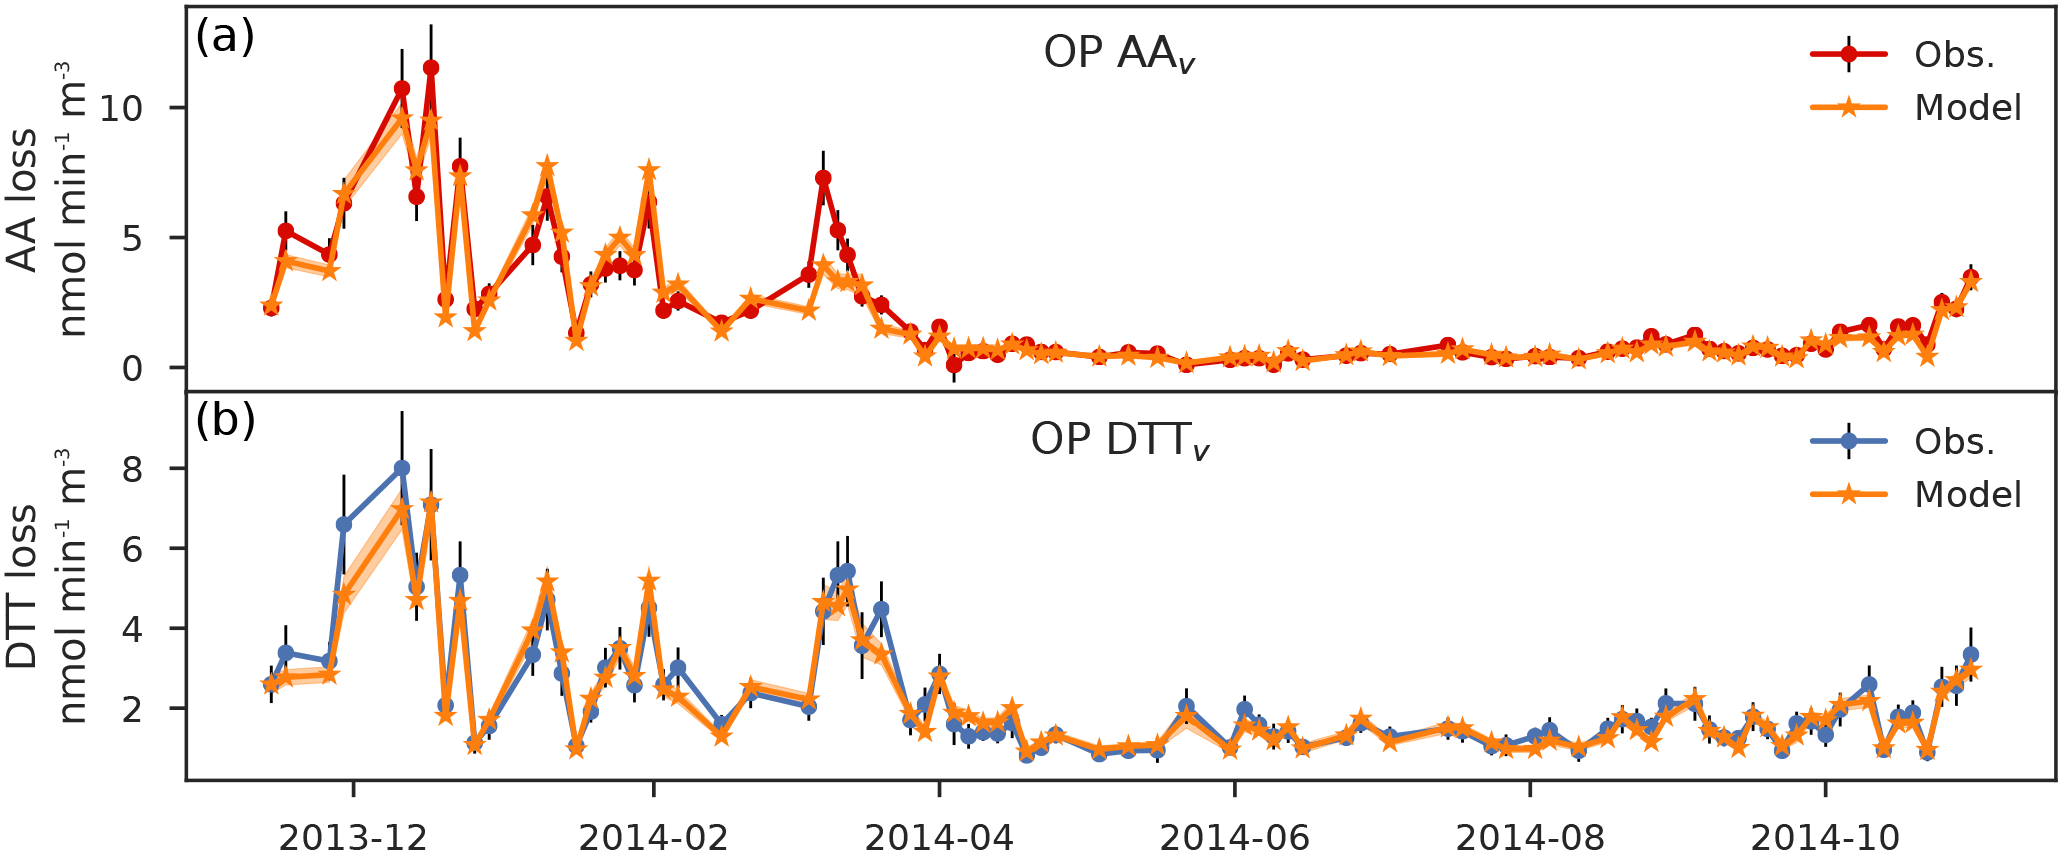
Figure 4Comparison of the modeled OP (orange) and the observed OP for both the AA (a) and DTT (b) test (85 samples) from November 2013 to November 2014. The black error bars are the standard deviation of the observed values and the shaded orange area the uncertainties of the modeled OP. Units are in OP normalized by volume and expressed in .
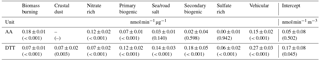
Table 2Regression coefficients (i.e., intrinsic OP) expressed in at Chamonix for the AA and DTT assays. The values are the mean ± standard deviation based on N=1000 bootstrap of the best solution. The p-value is in the parenthesis. The crustal dust source was excluded during the inversion process for the AA test.
The method proposed here is an improvement of the one of Bates et al. (2015) and our methods differ in several points. First of all, our backward elimination criteria is based on the negativity of a source and not in its p-value. Indeed, a source might present a statistically significant negative value. But according to us, a source with negative intrinsic OP does not have a geo-chemical sense as the air is known to be a strong oxidant milieu. Secondly, as Bates et al. (2015) did not measure the uncertainty of their OP samples, they used an ordinary least square (OLS) regression. On the opposite, we have an estimation of our measurements uncertainty thanks to triplicate. We then use a weighted least square (WLS) regression instead. Finally, we propose a way to estimate uncertainties of our estimated OP with a Monte-Carlo method, which is not provided in the previous study. Moreover, the method proposed here does not only include the multiple linear regression (MLR) but also the use of the PMF model instead of the CMB one. Indeed, the MLR is highly sensitive to the explanatory variable and we decide to use the local sources' profile (PMF) instead of the chemical mass balance method with ensemble-averaged source impact profiles.
3.4 Application to the Chamonix site and discussion
Figure 4 shows the comparison between observed and modeled OPs for the measurements at the Chamonix site for both OP AA and OP DTT assays. Table 2 presents the intrinsic OP AA and OP DTT in for each source with their respective uncertainties and p-values.
3.4.1 Accuracy of the model
The method developed in this study appears to be sufficiently accurate to explain the two OP annual series at Chamonix. First, the seasonal trend of the OP is very well reproduced, despite some under-estimation of some of the highest values in winter. Second, the intercept of the equation regression for OP AAv is not significant (p>0.05). It is not so clear for the DTT test, but the p-value remains high (p=0.04). We can consider the intercepts of the equation regression as nearly negligible (see Table 2). The PM sources presented in this study are then sufficient to explain the observed OP AAv and OP DTTv time series. We can also note that none of the sources was excluded for the DTT assay during the inversion procedure due to negative contributions. It emphasizes the fact that the sources explain the observed OP well. However, one source was discarded for the AA assay: the crustal dust. Its p-value was less than 0.01 for an intrinsic OP of . We supposed that the crustal dust source in this study is a mixing of several sources, including Saharan dust and road suspension dust. We could then end up with a mixing of highly different redox-active compounds towards the AA test that could explain the error for this source. Further work is needed to understand this behavior.
3.4.2 Uncertainties and residual
The uncertainties of the modeled OP are quite low and mostly in the range of the measurement uncertainties (Fig. 4). Indeed, the distribution of the residual is close to the normal law (Fig. 5). However, we note an asymmetry toward underestimation and residual seem to increase almost linearly with the endogenous variable (no random repartition around 0 for the highest OP). The OP is underestimated by the model for these days featuring concentrations. It may suggest either non-linearity with high loading (as suggested above), or a particular event that is not apportioned by the sources provided in this study.
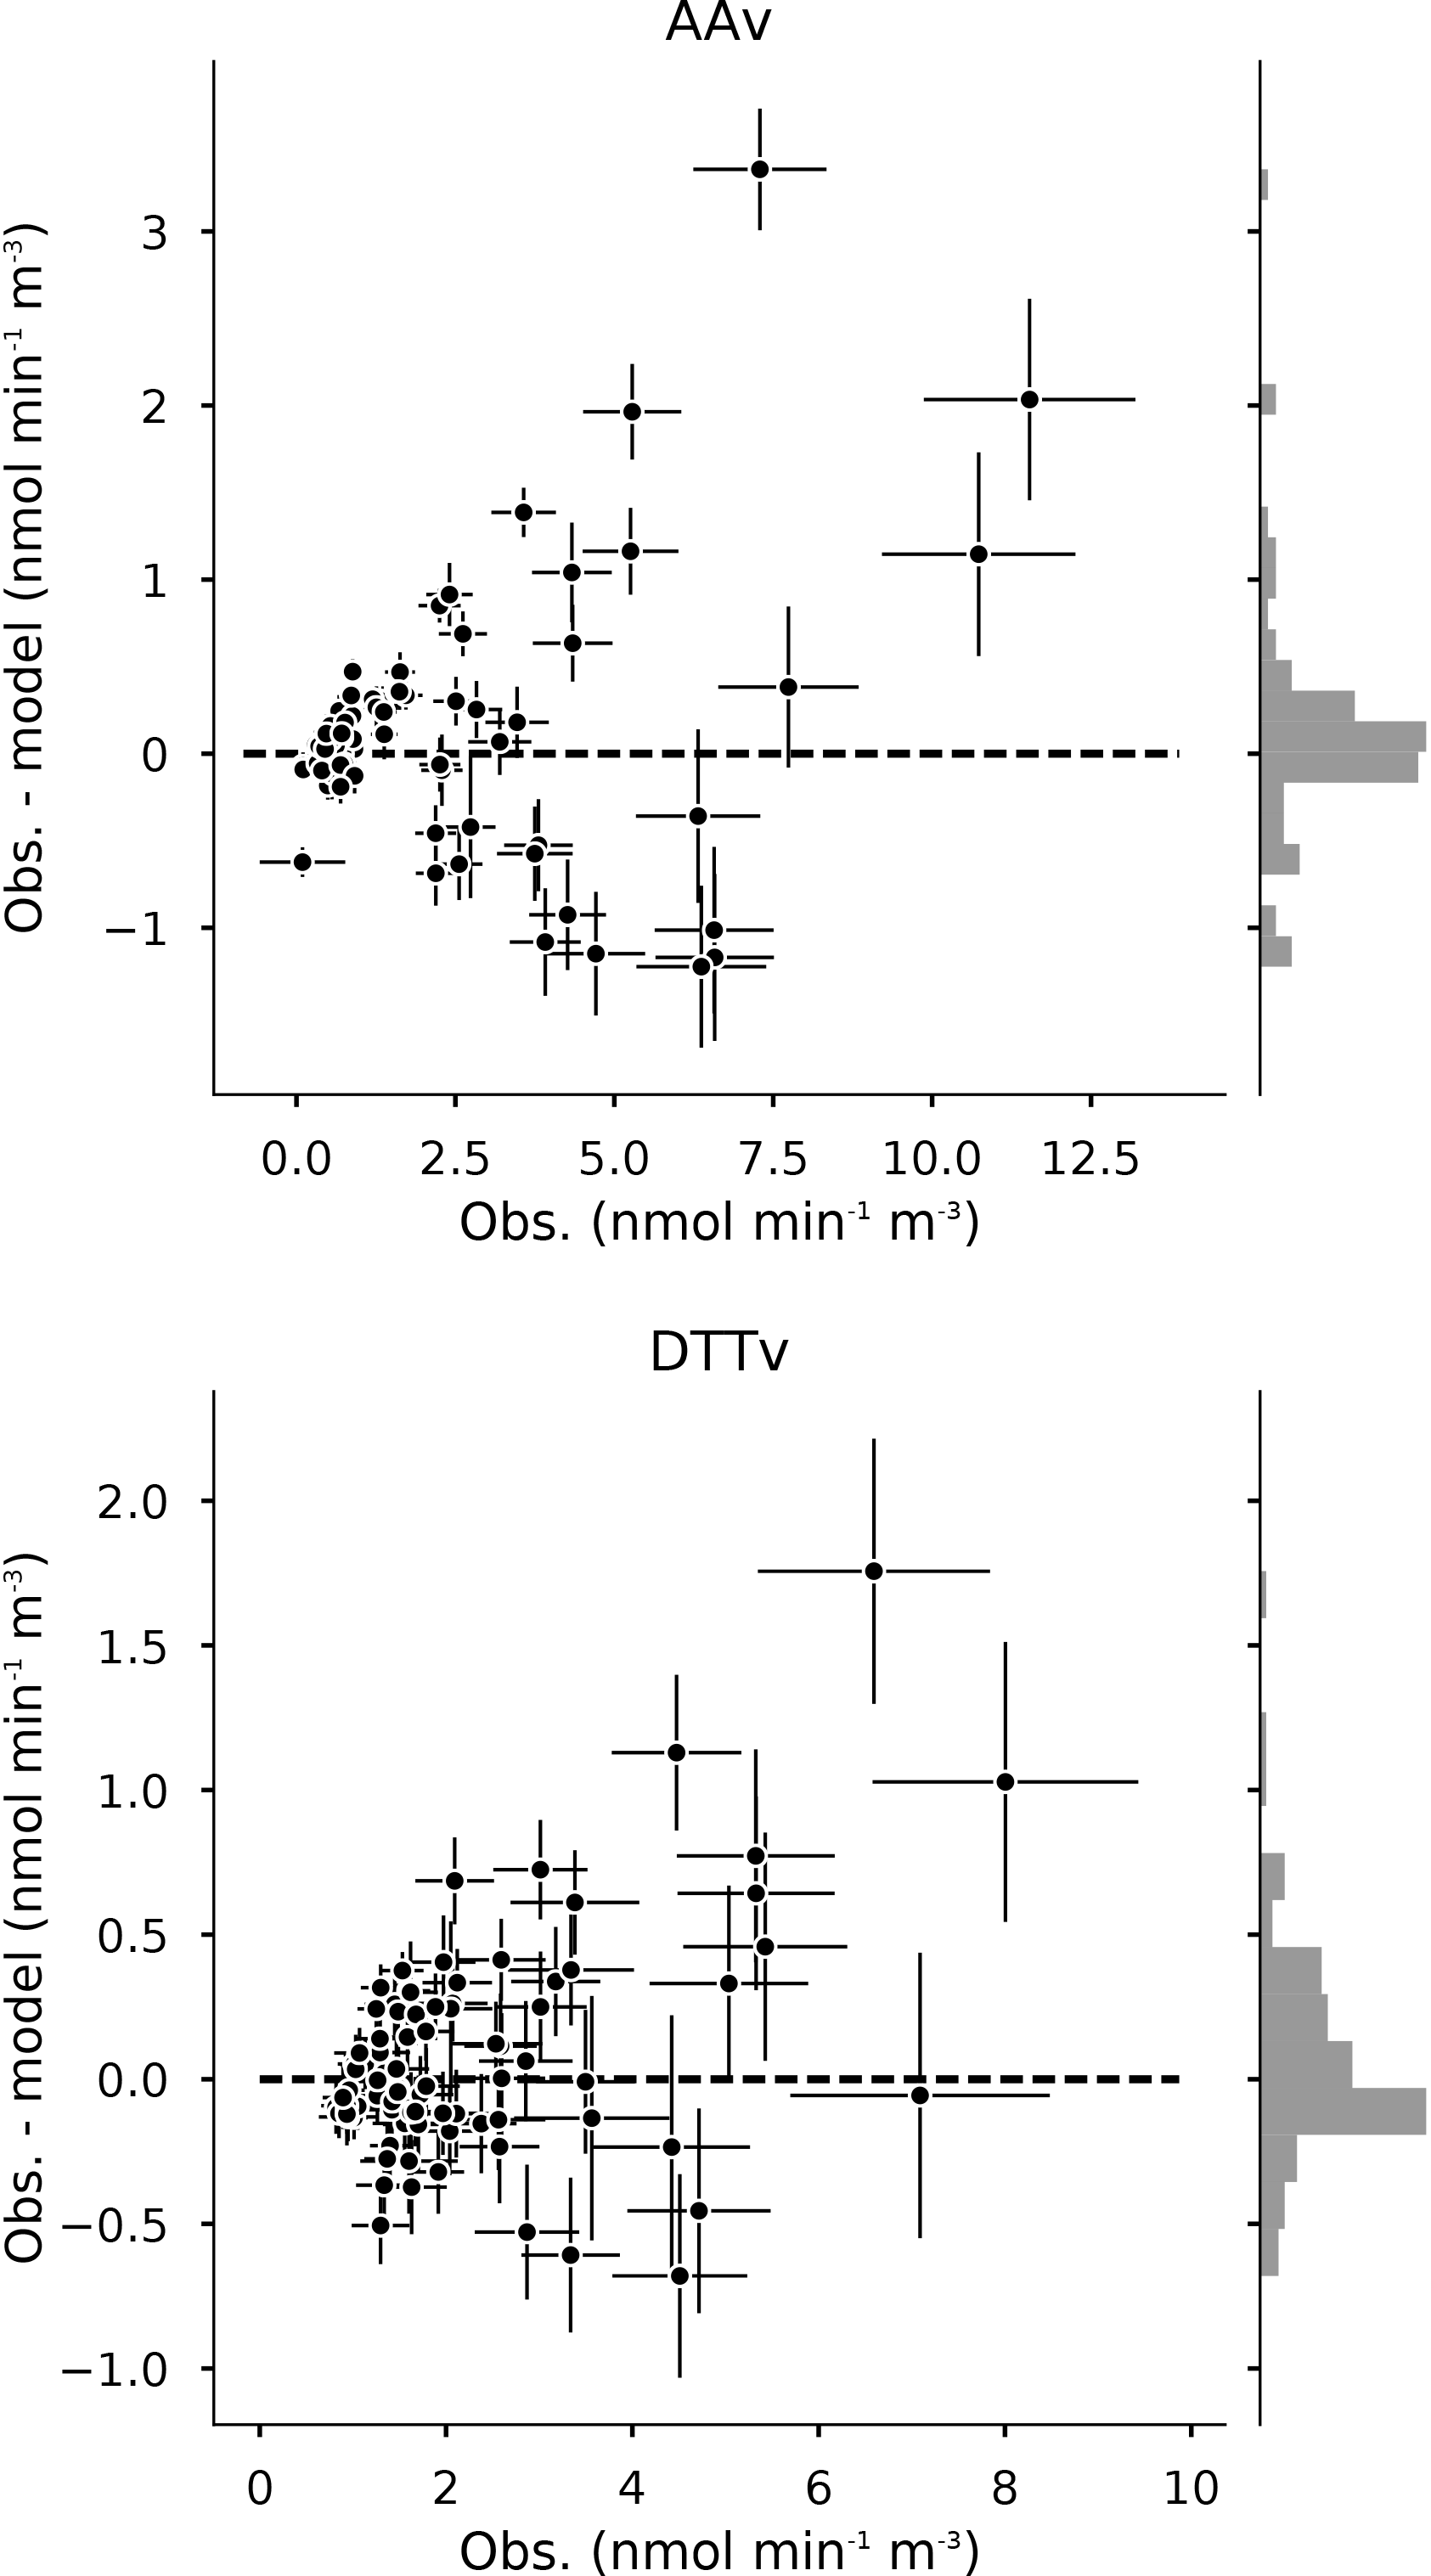
Figure 5Residual distribution for the regression of the AA and DTT assays (85 samples). The error bars represent the standard deviation of the observation and the model. The histogram on the right is the distribution of the residuals. Units are in OP normalized by volume and expressed in . Note the different scales for the AAv and the DTTv.
3.4.3 Intrinsic OP
Values of the intrinsic OP of different sources for both the AA and DTT assays are ranging from zero to 0.18 ± 0.01 for the AA test and from 0.06 ± 0.02 to 0.27 ± 0.03 for the DTT test (Table 2). The various sources do not have the same reactivity toward the AA and DTT. We also note that the two tests present different intrinsic OP for the same source, and the relative importance of the sources differs from one test to the other. For instance, the vehicular source displays a lower intrinsic OP (0.15 ) than the biomass burning (0.18 ) for the AA test but a higher intrinsic OP for the DTT test (0.27 for the vehicular and 0.07 for the biomass burning). This deconvolution method may be able to account for the chemical specificity of the two OP assays. In addition, the DTT test seems to be more multi-sources influenced than the AA test.
Nevertheless, we clearly see the importance of the vehicular source, which is associated to a strong intrinsic OP in both the AA and DTT assays. Previous studies (Bates et al., 2015; Fang et al., 2016; Verma et al., 2014) also highlighted the importance of this source to explain the OP AA and DTT. We may explain such high intrinsic OP by the presence of metals in this source – notably copper (Charrier et al., 2015).
In the AA assay, the biomass burning also presents a high redox-activity per µg of PM. This result disagrees with Fang et al. (2016) as they found no activity for this source in the OP AA test. Such difference for the biomass burning source may be explained by the two extraction protocols (in water or in a SLF solution) or by the proximity of the biomass source in Chamonix compared to the longer distance transport in Atlanta, that would change the chemistry of the source profile. However, the biomass burning in the OP DTT test has an intrinsic OP of 0.07 ± 0.01 , which is coherent with the previous study of Fang et al. (2016). The presence of oxygenated compounds such as quinones, which are redox-active in the organic matter could explain this high intrinsic OP.
The nitrate-rich source also appears to contribute in the redox-activity in both assays. Although the nitrate itself is not redox-active, it can be present with species that are oxidants. More work is needed in order to understand the evolution of intrinsic OP for the nitrate rich factor, including measurements on series characterized by specific spring events related to agricultural activities, and series close to traffic sites for NOx emissions.
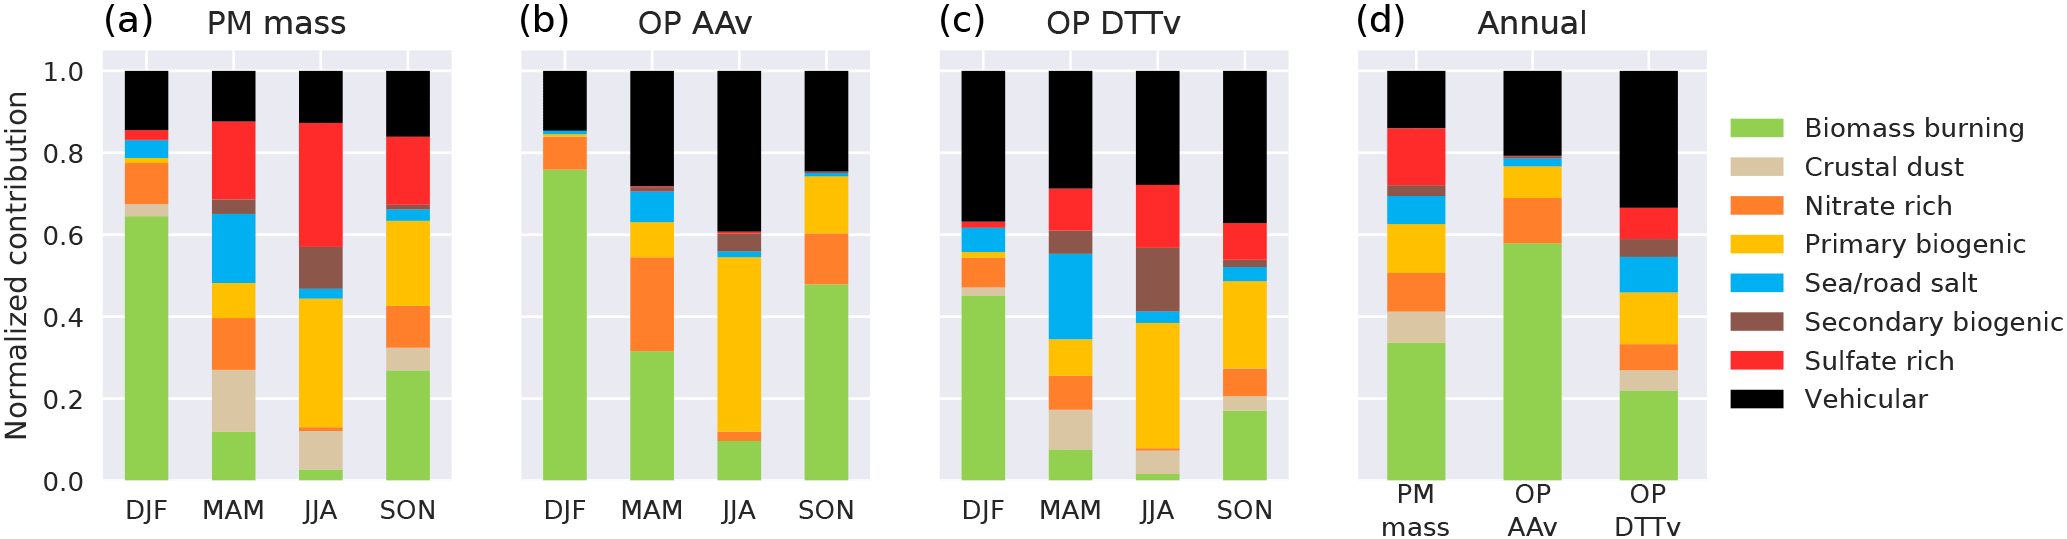
Figure 6Normalized seasonal contribution of the sources to (a) the PM10 total mass, (b) the OP AAv and (c) the OP DTTv. DJF is December–January–February, MAM is March–April–May, JJA is June–July–August and SON is September–October–November. Panel (d) shows the annual normalized contributions of each source to the PM, OP AAv and OP DTTv.
The primary biogenic source, mainly identified by the presence of polyols, presents a significant intrinsic OP. This result was unexpected. Indeed, Liu et al. (2010) shows that mannitol is a strong anti-oxidant. Our result suggests that some chemical species, present in the primary biogenic source but not measured in this study, may contribute to the OP of the PM from this source. Recently, it was shown that fungal spores exhibit a significant intrinsic OP (Samake et al., 2017), and this may be an hypothesis to be further tested. However, the PMF profile of the primary biogenic source may also be a mixing of different sources in our study (there is BCff in it for instance). Such mixing may also explain the high intrinsic OP of this source.
Nevertheless, all these results contrast with those from simple univariate correlations between OP and sources. Indeed, the secondary biogenic source that is slightly anti-correlated to both OPs is in fact the second most redox-active source when considering intrinsic OP DTT. On the contrary, the sulfate-rich factor is slightly anti-correlated to the OP AAv but presents an intrinsic OP AA close to 0. The vehicular factor, which highly correlates with OPs is also the dominant source in terms of intrinsic OPs for both assays. Such results emphasize the real interest in replacing the simple univariate correlation by a more comprehensive statistical analysis when considering the contribution of the sources (or species) to the OPs.
3.4.4 Contribution to the OP
The aim of this study was to establish a deconvolution model for the OP. The results obtained with it will be discussed in depth in another study, including other sites. However, here are some preliminary results for the Chamonix station concerning the sources contribution.
Due to the different intrinsic OP of the sources, the source contributions to the OP (intrinsic OP times by the source contribution in µg m−3) is different from their contribution to the PM mass. Figure 6 illustrates the normalized contribution of the sources to the mass of the aerosols and the OP measures with AA and DTT. It shows that the vehicular source barely contributes 17 % of the total PM mass during March–April–May (MAM) and June–July–August (JJA) but more than 30 % to the OP DTTv in the same period, and even reaching around 50 % of the OP AAv in JJA. Conversely, some sources largely contributing to the PM10 mass such as the sulfate-rich source (30 % of the total PM mass in JJA) do not contribute to the OP (2 % to the OP AAv in the same period). Finally, some sources like the biomass burning contribute to a large extend in both PM mass and OP (on an annual basis: 35 % of the PM mass, 55 % of the OP AAv and 22 % of the OP DTTv). We also note that on an annual basis, the contribution of the vehicular source is much larger for both OP assays than for the mass. All these outcomes are key parameters for policy initiatives.
To sum up, with this methodology we observe a redistribution of the relative importance of the sources ranked as ROS contributors. This study, and more generally the OP, gives us a new vision of the atmospheric aerosols and associated ROS burden. We also point out a clear distinction between the different OP tests. Such differences raise new questions on OP assays choices and standardization and require further investigation, especially coupled OP–toxicology–epidemiology studies.
First of all, when comparing with previous studies we should note that our PM extraction of samples was done in a SLF and not in water. This induces a difference in OP measurement which is not predictable for the complexes occurring between PM and SLF compounds as when PM enters in contact with the epithelial lung fluid (Calas et al., 2017) and then direct comparison may not be fully accurate.
The method used in this study gives very robust results and is promising for practical application. However, since it has some limitations, we hereafter list some possible improvements. First, as previously discussed, the model is strongly constrained by the explanatory variable, which are the PM sources contributions obtained with a PMF analysis. The PMF model has uncertainties of two different natures, inherent to the model: (1) mathematical uncertainties on the sources contributions and (2) frequent mixing profiles, due to colinearity induced, e.g., by meteorology. In our study, we might encounter such mixing for the biogenic sources. An improvement would be to bootstrap the PMF results and use these uncertainties in the OP inversion in order to see its sensitivity.
Even if it has been shown that mainly the PM2.5 part deposits in lung alveoli (Fang et al., 2017), PM10 are still a public health concern and under regulation in EU and France. PM10 has the advantage of encompassing all parts of PM potentially reaching the lower respiratory tract. However, in doing so, a source of uncertainty probably arises from the mixing, in our measurements systems, of PM populations with different chemical characteristics (i.e., acidity), that can influence the OP (i.e., changing solubility of trace metal, for example).This potential artifact, already existing for PM2.5, may be reinforced with PM10.
Another debatable choice is setting the intrinsic OP to zero for the source with a negative intrinsic OP during the stepwise regression process. Some chemical species may act as anti-oxidants which lead to “negative” intrinsic OP for the associated PM source. Namely, the polyols from the primary biogenic source, that include species like mannitol, are known to present strong anti-oxidant capabilities (Liu et al., 2010) and bacteria can halve the OP of copper-rich PM (Samake et al., 2017). Further studies should focus on this topic in order to better understand this potential effect.
Other choices of targets for optimization, and of penalty functions to promote the positivity of the coefficients, are possible. However, we think that our proposals manage to strike a balance between a satisfactory handling of the uncertainties of the problem and ease of application using existing statistical frameworks.
Based on one-year PM10 sampling at an urban site located in Chamonix (France), associated with chemical speciation and Oxidative Potential (OP) measurements with the DTT and OP AA assays, we successfully established a method to attribute the contribution of the PM sources to the observed OP. The main conclusions of this study are summarized as follows.
-
The different sources present different OP AA and OP DTT per microgram of PM with intrinsic OP differences between sources up to a factor of 20.
-
The biomass burning and vehicular sources seem to be the leading sources of the OP AAv and OP DTTv in Chamonix. On an annual basis, they represent together 78 % of the OP AAv and 54 % of the OP DTTv apportionment.
-
The two OP assays present different views on the PM sources based on their specific chemical selectivity, as illustrated by the salt source that does not contribute to the OP AAv but to the OP DTTv.
-
The relative mass contributions of the sources to the PM10 differ from their relative OP AAv and OP DTTv contributions. For instance, the vehicular source has a larger contribution to the total OP AA and OP DTT than to the total PM10 mass, whereas the sulfate rich source appears to be a minor source of OP AAv but an important source of PM mass. If OP is a proper metric of health impact of PM on population, the PM mass is not fully appropriate for PM regulations targeting public health.
Finally, even if OP metric is correlated to health outcomes, this study cannot directly attribute toxicity to one source or another. Is sporadic exposure to PM with high OP values or chronic exposure to PM with low OP values sufficient to provoke health damage? As the DTT and AA tests point to different sources as the main ROS-generating source, is one of them more linked to toxicological effects? To answer these questions, more crossover studies involving OP measurements, epidemiology and toxicology are needed.
The chemical, OP and PMF datasets are available on request.
The supplement related to this article is available online at: https://doi.org/10.5194/acp-18-9617-2018-supplement.
JLJ and GU designed the experiment. AC did the OP measurement while JLB and JLJ conducted the chemical speciation. IJ and GM provided the aethalometer measurements. FC and DS ran the PMF analysis. SW, with the help of AC, developed the OP apportionment model and performed the simulations. SW prepared the manuscript with contributions from all co-authors.
The authors declare that they have no conflict of interest.
This work was funded in part by Primequal (DECOMBIO program in the Arve valley, grant ADEME 1362C0028) and by ANSES (ExPOSURE program, grant 2016-CRD-31). The funding of the PhD for Samuël Weber is provided by the Ecole Normale Supérieure. The Région Auvergne Rhône-Alpes funded the PhD grant for Florie Chevrier. The Université Grenoble Alpes funded the PhD grant of Aude Calas with a Président Award. The funding of the post-doctoral position for Dalia Salameh comes from the SOURCES program (ADEME Grant 1462C0044). This study was also supported by direct funding by IGE and LCME (technician salary), the LEFE CHAT Potentiel oxydant program and the LABEX OSUG@2020 (ANR-10-LABX-56) both for funding analytical instruments. ATMO AuRA conducted all the logistical aspects of the sample collection in the field.
The authors would like to thanks Lisa Fluchaire, Jean-Charles Francony, Coralie
Conniès, Vincent Lucaire, and Fanny Masson for their dedicated work for the
samples analyses, together with many people from Atmo AuRA for collection of
samples in the field. Many thanks also to Jesus Carrete Montaña for
improving the ideas in this work.
Edited by: Athanasios Nenes
Reviewed by: two anonymous referees
Abrams, J. Y., Weber, R. J., Klein, M., Samat, S. E., Chang, H. H., Strickland, M. J., Verma, V., Fang, T., Bates, J. T., Mulholland, J. A., Russell, A. G., and Tolbert, P. E.: Associations between Ambient Fine Particulate Oxidative Potential and Cardiorespiratory Emergency Department Visits, Environ. Health Persp., 125, https://doi.org/10.1289/EHP1545, 2017. a
ANSES ExPOSURE: Etude multi-sites des variations du Potentiel Oxydant des PM atmosphériques en France, en liaison avec leur chimie et leurs sources, Tech. rep., ANSES, http://www.ige-grenoble.fr/recherche/equipes/chimie-atmospherique-chianti/projets/article/exposure?lang=en, 2017. a
Aymoz, G., Jaffrezo, J.-L., Jacob, V., Colomb, A., and George, Ch.: Evolution of organic and inorganic components of aerosol during a Saharan dust episode observed in the French Alps, Atmos. Chem. Phys., 4, 2499–2512, https://doi.org/10.5194/acp-4-2499-2004, 2004. a, b
Ayres, J. G., Borm, P., Cassee, F. R., Castranova, V., Donaldson, K., Ghio, A., Harrison, R. M., Hider, R., Kelly, F., Kooter, I. M., Marano, F., Maynard, R. L., Mudway, I., Nel, A., Sioutas, C., Smith, S., Baeza-Squiban, A., Cho, A., Duggan, S., and Froines, J.: Evaluating the Toxicity of Airborne Particulate Matter and Nanoparticles by Measuring Oxidative Stress Potential – A Workshop Report and Consensus Statement, Inhalation Toxicology, 20, 75–99, https://doi.org/10.1080/08958370701665517, 2008. a, b
Bates, J. T., Weber, R. J., Abrams, J., Verma, V., Fang, T., Klein, M., Strickland, M. J., Sarnat, S. E., Chang, H. H., Mulholland, J. A., Tolbert, P. E., and Russell, A. G.: Reactive oxygen species generation linked to sources of atmospheric particulate matter and cardiorespiratory effects, Environ. Sci. Technol., 49, 13605–13612, https://doi.org/10.1021/acs.est.5b02967, 2015. a, b, c, d
Belis, C., Karagulian, F., Larsen, B., and Hopke, P.: Critical review and meta-analysis of ambient particulate matter source apportionment using receptor models in Europe, Atmos. Environ., 69, 94–108, https://doi.org/10.1016/j.atmosenv.2012.11.009, 2013. a
Belis, C. A., Favez, O., Harrison, R. M., Larsen, B. R., Amato, F., El Haddad, I., Hopke, P. K., Nava, S., Paatero, P., Prévôt, A., Quass, U., Vecchi, R., and Viana, M.: European Commission, Joint Research Centre, and Institute for Environment and Sustainability: European guide on air pollution source apportionment with receptor models, Publications Office, Luxembourg, https://doi.org/10.2788/9307, oCLC: 875979269, 2014. a
Calas, A., Uzu, G., Martins, J. M. F., Voisin, D., Spadini, L., Lacroix, T., and Jaffrezo, J.-L.: The importance of simulated lung fluid (SLF) extractions for a more relevant evaluation of the oxidative potential of particulate matter, Sci. Rep.-UK, 7, 11617, https://doi.org/10.1038/s41598-017-11979-3, 2017. a, b, c, d
Calas, A., Uzu, G., Martins, J. M. F., Houdier, S., Thomas, F., Molton, F., Lacroix, T., Charron, A., Jacob, V., Besombes, J.-L., Chevrier, F., Brulfert, G., Dunster, C., Oliete, A., Kelly, F. J., and Jaffrezo, J.-L.: Comparison between five acellular oxidative potential measurement assays performed on a yearly series of PM10 samples from the city of Chamonix (France), with detailed chemistry, in preparation for ACPD, 2018. a, b, c
Cavalli, F., Alastuey, A., Areskoug, H., Ceburnis, D., Čech, J., Genberg, J., Harrison, R., Jaffrezo, J., Kiss, G., Laj, P., Mihalopoulos, N., Perez, N., Quincey, P., Schwarz, J., Sellegri, K., Spindler, G., Swietlicki, E., Theodosi, C., Yttri, K., Aas, W., and Putaud, J.: A European aerosol phenomenology -4: Harmonized concentrations of carbonaceous aerosol at 10 regional background sites across Europe, Atmos. Environ., 144, 133–145, https://doi.org/10.1016/j.atmosenv.2016.07.050, 2016. a, b
Charrier, J. G. and Anastasio, C.: On dithiothreitol (DTT) as a measure of oxidative potential for ambient particles: evidence for the importance of soluble transition metals, Atmos. Chem. Phys., 12, 9321–9333, https://doi.org/10.5194/acp-12-9321-2012, 2012. a
Charrier, J. G., Richards-Henderson, N. K., Bein, K. J., McFall, A. S., Wexler, A. S., and Anastasio, C.: Oxidant production from source-oriented particulate matter – Part 1: Oxidative potential using the dithiothreitol (DTT) assay, Atmos. Chem. Phys., 15, 2327–2340, https://doi.org/10.5194/acp-15-2327-2015, 2015. a, b
Chevrier, F.: Chauffage au bois et qualité de l'air en Vallée de l'Arve : définition d'un système de surveillance et impact d'une politique de rénovation du parc des appareils anciens, Ph.D. thesis, Université Grenoble Alpes, Grenoble, https://tel.archives-ouvertes.fr/tel-01527559 (last access: 28 June 2018), 2016. a, b, c, d, e, f
Chevrier, F., Ježek, I., Brulfert, G., Močnik, G., Marchand, N., Jaffrezo, J.-L., and Besombes, J.-L.: DECOMBIO-Contribution de la combustion de la biomasse aux PM10 en vallée de l'Arve: mise en place et qualification d'un dispositif de suivi, 2268–3798, http://lodel.irevues.inist.fr/pollution-atmospherique/index.php?id=5952, 2016. a
Cohen, A. J., Brauer, M., Burnett, R., Anderson, H. R., Frostad, J., Estep, K., Balakrishnan, K., Brunekreef, B., Dandona, L., and Dandona, R.: Estimates and 25-year trends of the global burden of disease attributable to ambient air pollution: an analysis of data from the Global Burden of Diseases Study 2015, The Lancet, 389, 1907–1918, 2017. a
Crobeddu, B., Aragao-Santiago, L., Bui, L.-C., Boland, S., and Baeza Squiban, A.: Oxidative potential of particulate matter 2.5 as predictive indicator of cellular stress, Environ. Pollut., 230, 125–133, https://doi.org/10.1016/j.envpol.2017.06.051, 2017. a
Drinovec, L., Mocnik, G., Zotter, P., Prévôt, A. S. H., Ruckstuhl, C., Coz, E., Rupakheti, M., Sciare, J., Müller, T., Wiedensohler, A., and Hansen, A. D. A.: The “dual-spot” Aethalometer: an improved measurement of aerosol black carbon with real-time loading compensation, Atmos. Meas. Tech., 8, 1965–1979, https://doi.org/10.5194/amt-8-1965-2015, 2015. a
Fang, T., Guo, H., Verma, V., Peltier, R. E., and Weber, R. J.: PM2.5 water-soluble elements in the southeastern United States: automated analytical method development, spatiotemporal distributions, source apportionment, and implications for heath studies, Atmos. Chem. Phys., 15, 11667–11682, https://doi.org/10.5194/acp-15-11667-2015, 2015. a
Fang, T., Verma, V., Bates, J. T., Abrams, J., Klein, M., Strickland, M. J., Sarnat, S. E., Chang, H. H., Mulholland, J. A., Tolbert, P. E., Russell, A. G., and Weber, R. J.: Oxidative potential of ambient water-soluble PM2.5 in the southeastern United States: contrasts in sources and health associations between ascorbic acid (AA) and dithiothreitol (DTT) assays, Atmos. Chem. Phys., 16, 3865–3879, https://doi.org/10.5194/acp-16-3865-2016, 2016. a, b, c, d, e
Fang, T., Guo, H., Zeng, L., Verma, V., Nenes, A., and Weber, R. J.: Highly Acidic Ambient Particles, Soluble Metals, and Oxidative Potential: A Link between Sulfate and Aerosol Toxicity, Environ. Sci. Technol., 51, 2611–2620, https://doi.org/10.1021/acs.est.6b06151, 2017. a
Gehling, W. and Dellinger, B.: Environmentally Persistent Free Radicals and Their Lifetimes in PM2.5, Environ. Sci. Technol., 47, 8172–8178, https://doi.org/10.1021/es401767m, 2013. a
Gianini, M., Piot, C., Herich, H., Besombes, J.-L., Jaffrezo, J.-L., and Hueglin, C.: Source apportionment of PM10, organic carbon and elemental carbon at Swiss sites: An intercomparison of different approaches, Sci. Total Environ., 454–455, 99–108, https://doi.org/10.1016/j.scitotenv.2013.02.043, 2013. a, b, c
Golly, B.: Étude des sources et de la dynamique atmosphérique de polluants organiques particulaires en vallées alpines: apport de nouveaux traceurs organiques aux modèles récepteurs, Ph.D. thesis, Grenoble, http://www.theses.fr/2014GRENA019, 2014. a, b
Golly, B., Brulfert, G., Berlioux, G., Jaffrezo, J.-L., and Besombes, J.-L.: Large chemical characterisation of PM10 emitted from graphite material production: Application in source apportionment, Sci. Total Environ., 538, 634–643, https://doi.org/10.1016/j.scitotenv.2015.07.115, 2015. a
Jaffrezo, J.-L., Aymoz, G., and Cozic, J.: Size distribution of EC and OC in the aerosol of Alpine valleys during summer and winter, Atmos. Chem. Phys., 5, 2915–2925, https://doi.org/10.5194/acp-5-2915-2005, 2005. a
Janssen, N. A. H., Strak, M., Yang, A., Hellack, B., Kelly, F. J., Kuhlbusch, T. A. J., Harrison, R. M., Brunekreef, B., Cassee, F. R., Steenhof, M., and Hoek, G.: Associations between three specific a-cellular measures of the oxidative potential of particulate matter and markers of acute airway and nasal inflammation in healthy volunteers, Occup. Environ. Med., 72, 49–56, https://doi.org/10.1136/oemed-2014-102303, 2015. a
Kelly, F. J. and Fussell, J. C.: Size, source and chemical composition as determinants of toxicity attributable to ambient particulate matter, Atmos. Environ., 60, 504–526, https://doi.org/10.1016/j.atmosenv.2012.06.039, 2012. a
Kelly, F. J. and Mudway, I. S.: Protein oxidation at the air-lung interface, Amino Acids, 25, 375–396, https://doi.org/10.1007/s00726-003-0024-x, 2003. a
Liu, J.-H., Chen, M.-M., Huang, J.-W., Wann, H., Ho, L.-K., Pan, W. H., Chen, Y.-C., Liu, C.-M., Yeh, M.-Y., Tsai, S.-K., Young, M. S., Ho, L.-T., Kuo, C.-D., Chuang, H.-Y., Chao, F.-P., and Chao, H.-M.: Therapeutic Effects and Mechanisms of Action of Mannitol During H2O2-Induced Oxidative Stress in Human Retinal Pigment Epithelium Cells, J. Ocul. Pharmacol. Th., 26, 249–257, https://doi.org/10.1089/jop.2009.0127, 2010. a, b
Ntziachristos, L., Froines, J. R., Cho, A. K., and Sioutas, C.: Relationship between redox activity and chemical speciation of size-fractionated particulate matter, Part. Fibre Toxicol., 4, 5, https://doi.org/10.1186/1743-8977-4-5, 2007. a
Petit, J.-E., Favez, O., Sciare, J., Crenn, V., Sarda-Estève, R., Bonnaire, N., Močnik, G., Dupont, J.-C., Haeffelin, M., and Leoz-Garziandia, E.: Two years of near real-time chemical composition of submicron aerosols in the region of Paris using an Aerosol Chemical Speciation Monitor (ACSM) and a multi-wavelength Aethalometer, Atmos. Chem. Phys., 15, 2985–3005, https://doi.org/10.5194/acp-15-2985-2015, 2015. a
Pope III, C. A.: Air pollution and health-good news and bad, New Engl. J. Med., 351, 1132–1133, 2004. a
Pope III, C. A. and Dockery, D. W.: Epidemiology of Particle Effects, in: Air Polution and Health, 673–705, Academic Press, https://doi.org/10.1016/B978-012352335-8/50106-X, 1999. a
Salameh, D.: Impacts atmosphériques des activités portuaires et industrielles sur les particules fines (PM2.5) à Marseille, Ph.D. thesis, Aix-Marseille, 2015. a
Samake, A., Uzu, G., Martins, J. M. F., Calas, A., Vince, E., Parat, S., and Jaffrezo, J. L.: The unexpected role of bioaerosols in the Oxidative Potential of PM, Sci. Rep.-UK, 7, 10978, https://doi.org/10.1038/s41598-017-11178-0, 2017. a, b
Sandradewi, J., Prévôt, A. S. H., Szidat, S., Perron, N., Alfarra, M. R., Lanz, V. A., Weingartner, E., and Baltensperger, U.: Using Aerosol Light Absorption Measurements for the Quantitative Determination of Wood Burning and Traffic Emission Contributions to Particulate Matter, Environ. Sci. Technol., 42, 3316–3323, https://doi.org/10.1021/es702253m, 2008. a
Sauvain, J., Sanchez-Sandoval Hohl, M., and Riediker, M.: Differentiated Chemical Reactivity of Nanoparticles toward DTT, in: C105, NANOMATERIALS: LITTLE PARTICLES, BIG IMPACT, p. A5258, Am. Thoracic. Soc., http://www.atsjournals.org/doi/pdf/10.1164/ajrccm-conference.2009.179.1_MeetingAbstracts.A5258, 2009. a
Sauvain, J.-J., Rossi, M. J., and Riediker, M.: Comparison of three acellular tests for assessing the oxidation potential of nanomaterials, Aerosol Sci. Tech., 47, 218–227, https://doi.org/10.1080/02786826.2012.742951, 2013. a, b
Seabold, S. and Perktold, J.: Statsmodels: Econometric and statistical modeling with python, in: Proceedings of the 9th Python in Science Conference, vol. 57, p. 61, https://www.researchgate.net/profile/Josef_Perktold/publication/264891066_Statsmodels_Econometric_and_Statistical_Modeling_with_Python/links/5667ca9308ae34c89a0261a8/Statsmodels-Econometric-and-Statistical-Modeling-with-Python.pdf, 2010. a
Shirmohammadi, F., Hasheminassab, S., Saffari, A., Schauer, J. J., Delfino, R. J., and Sioutas, C.: Fine and ultrafine particulate organic carbon in the Los Angeles basin: Trends in sources and composition, Sci. Total Environ., 541, 1083–1096, https://doi.org/10.1016/j.scitotenv.2015.09.133, 2016. a
Srivastava, D., Tomaz, S., Favez, O., Lanzafame, G. M., Golly, B., Besombes, J.-L., Alleman, L. Y., Jaffrezo, J.-L., Jacob, V., Perraudin, E., Villenave, E., and Albinet, A.: Speciation of organic fraction does matter for source apportionment. Part 1: A one-year campaign in Grenoble (France), Sci. Total Environ., 624, 1598–1611, https://doi.org/10.1016/j.scitotenv.2017.12.135, 2018. a, b
US EPA: Positive Matrix Factorization Model for environmental data analyses, https://www.epa.gov/air-research/positive-matrix-factorization-model-environmental-data-analyses (last access: 28 June 2018), 2017. a, b
Verma, V., Fang, T., Guo, H., King, L., Bates, J. T., Peltier, R. E., Edgerton, E., Russell, A. G., and Weber, R. J.: Reactive oxygen species associated with water-soluble PM2.5 in the southeastern United States: spatiotemporal trends and source apportionment, Atmos. Chem. Phys., 14, 12915–12930, https://doi.org/10.5194/acp-14-12915-2014, 2014. a, b
Verma, V., Fang, T., Xu, L., Peltier, R. E., Russell, A. G., Ng, N. L., and Weber, R. J.: Organic Aerosols Associated with the Generation of Reactive Oxygen Species (ROS) by Water-Soluble PM 2.5, Environ. Sci. Technol., 49, 4646–4656, https://doi.org/10.1021/es505577w, 2015. a
Waked, A., Favez, O., Alleman, L. Y., Piot, C., Petit, J.-E., Delaunay, T., Verlinden, E., Golly, B., Besombes, J.-L., Jaffrezo, J.-L., and Leoz-Garziandia, E.: Source apportionment of PM10 in a north-western Europe regional urban background site (Lens, France) using positive matrix factorization and including primary biogenic emissions, Atmos. Chem. Phys., 14, 3325–3346, https://doi.org/10.5194/acp-14-3325-2014, 2014. a, b, c, d, e
World Health Organization: Ambient air pollution: A global assessment of exposure and burden of disease, Tech. rep., World Health Organization, http://www.who.int/iris/handle/10665/250141 (last access: 29 June 2018), 2016. a
Yang, A., Jedynska, A., Hellack, B., Kooter, I., Hoek, G., Brunekreef, B., Kuhlbusch, T. A., Cassee, F. R., and Janssen, N. A.: Measurement of the oxidative potential of PM2.5 and its constituents: The effect of extraction solvent and filter type, Atmos. Environ., 83, 35–42, https://doi.org/10.1016/j.atmosenv.2013.10.049, 2014. a
Zanatta, M., Gysel, M., Bukowiecki, N., Müller, T., Weingartner, E., Areskoug, H., Fiebig, M., Yttri, K., Mihalopoulos, N., Kouvarakis, G., Beddows, D., Harrison, R., Cavalli, F., Putaud, J., Spindler, G., Wiedensohler, A., Alastuey, A., Pandolfi, M., Sellegri, K., Swietlicki, E., Jaffrezo, J., Baltensperger, U., and Laj, P.: A European aerosol phenomenology-5: Climatology of black carbon optical properties at 9 regional background sites across Europe, Atmos. Environ., 145, 346–364, https://doi.org/10.1016/j.atmosenv.2016.09.035, 2016. a