the Creative Commons Attribution 4.0 License.
the Creative Commons Attribution 4.0 License.
 | 21 Jun 2018
Direct radiative effects during intense Mediterranean desert dust outbreaks
Vincenzo Obiso
Carlos Pérez García-Pando
Oriol Jorba
Nikos Hatzianastassiou
Lluis Vendrell
Sara Basart
Stavros Solomos
Santiago Gassó
José Maria Baldasano
The direct radiative effect (DRE) during 20 intense and widespread dust outbreaks, which affected the broader Mediterranean basin over the period March 2000–February 2013, has been calculated with the NMMB-MONARCH model at regional (Sahara and European continent) and short-term temporal (84 h) scales. According to model simulations, the maximum dust aerosol optical depths (AODs) range from ∼ 2.5 to ∼ 5.5 among the identified cases. At midday, dust outbreaks locally induce a NET (shortwave plus longwave) strong atmospheric warming (DREATM values up to 285 W m−2; Niger–Chad; dust AODs up to ∼ 5.5) and a strong surface cooling (DRENETSURF values down to −337 W m−2), whereas they strongly reduce the downward radiation at the ground level (DRESURF values down to −589 W m−2 over the Eastern Mediterranean, for extremely high dust AODs, 4.5–5). During night-time, reverse effects of smaller magnitude are found. At the top of the atmosphere (TOA), positive (planetary warming) DREs up to 85 W m−2 are found over highly reflective surfaces (Niger–Chad; dust AODs up to ∼ 5.5) while negative (planetary cooling) DREs down to −184 W m−2 (Eastern Mediterranean; dust AODs 4.5–5) are computed over dark surfaces at noon. Dust outbreaks significantly affect the mean regional radiation budget, with NET DREs ranging from −8.5 to 0.5 W m−2, from −31.6 to 2.1 W m−2, from −22.2 to 2.2 W m−2 and from −1.7 to 20.4 W m−2 for TOA, SURF, NETSURF and ATM, respectively. Although the shortwave DREs are larger than the longwave ones, the latter are comparable or even larger at TOA, particularly over the Sahara at midday. As a response to the strong surface day-time cooling, dust outbreaks cause a reduction in the regional sensible and latent heat fluxes by up to 45 and 4 W m−2, respectively, averaged over land areas of the simulation domain. Dust outbreaks reduce the temperature at 2 m by up to 4 K during day-time, whereas a reverse tendency of similar magnitude is found during night-time. Depending on the vertical distribution of dust loads and time, mineral particles heat (cool) the atmosphere by up to 0.9 K (0.8 K) during day-time (night-time) within atmospheric dust layers. Beneath and above the dust clouds, mineral particles cool (warm) the atmosphere by up to 1.3 K (1.2 K) at noon (night-time). On a regional mean basis, negative feedbacks on the total emitted dust (reduced by 19.5 %) and dust AOD (reduced by 6.9 %) are found when dust interacts with the radiation. Through the consideration of dust radiative effects in numerical simulations, the model positive and negative biases for the downward surface SW or LW radiation, respectively, with respect to Baseline Surface Radiation Network (BSRN) measurements, are reduced. In addition, they also reduce the model near-surface (at 2 m) nocturnal cold biases by up to 0.5 K (regional averages), as well as the model warm biases at 950 and 700 hPa, where the dust concentration is maximized, by up to 0.4 K. However, improvements are relatively small and do not happen in all episodes because other model first-order errors may dominate over the expected improvements, and the misrepresentation of the dust plumes' spatiotemporal features and optical properties may even produce a double penalty effect. The enhancement of dust forecasts via data assimilation techniques may significantly improve the results.
- Article
(8633 KB) - Full-text XML
-
Supplement
(13213 KB) - BibTeX
- EndNote


Dust aerosols through their interaction with the incoming solar (shortwave, SW) and the outgoing terrestrial (longwave, LW) radiation, perturb the radiation budget of the Earth–atmosphere system and redistribute the energy therein. The induced perturbation of the radiation fields by dust particles, the so-called dust radiative effect, takes place through three processes of increasing complexity affecting the energy budgets at the surface, in the atmosphere and at the top of the atmosphere (TOA). The first one, known as direct radiative effect (DRE) and referred as REari (aerosol–radiation interactions) in the latest report of the Intergovernmental Panel on Climate Change (IPCC, Boucher et al., 2013), is caused by the absorption and scattering of the SW radiation (Sokolik et al., 2001) and the absorption and re-emission of the LW radiation by mineral particles (Heinold et al., 2008). Due to the perturbation of the radiation fields by dust aerosols, the energy budget both at the surface and in the atmosphere is modified and the signal of these impacts is evident in atmospheric stability or instability conditions associated with cloud development and precipitation. These rapid adjustments, which have been referred to earlier as semi-direct effects (Hansen et al., 1997), are induced by the dust REari on surface energy budget and atmospheric profile (Boucher et al., 2013) contributing to the effective radiative forcing (ERFari). Moreover, dust aerosols, due to their ability to serve as cloud condensation nuclei (CCN) and ice nuclei (IN), modify the physical (Twomey, 1974; Albrecht, 1989) and optical properties of clouds (Pincus and Baker, 1994), which consist of the major regulators of the Earth–atmosphere system's radiation budget (Lohmann and Feicher, 2005). This chain of complex processes, involving aerosol–cloud interactions (ACI) and the subsequent modifications of the radiation fields, constitute the indirect impact of mineral particles on radiation, which is characterized by the largest uncertainties, even larger than those of the dust direct and semi-direct effects. In the latest IPCC report (IPCC, 2013), the effects formerly known as indirect effects have been renamed to effective radiative forcing (ERFaci) including the modification of radiation by clouds as well as the subsequent changes (rapid adjustments) of clouds' physical, microphysical or optical properties (Boucher et al., 2013).
Several studies have been conducted aiming to estimate the dust direct, semi-direct (e.g. Pérez et al., 2006; Helmert et al., 2007; Zhao et al., 2010; Nabat et al., 2015a) and indirect effects (e.g. Sassen et al., 2003; Seigel et al., 2013). Specifically, numerous studies have been carried out either by means of numerical modelling (e.g. Solmon et al., 2012; Woodage and Woodward, 2014) or through the synergy of observations and radiative transfer codes (Di Sarra et al., 2011; Valenzuela et al., 2012) or solely based on aerosol observations (e.g. Yang et al., 2009; Zhang et al., 2016), and their findings either referred to extended time periods (e.g. Spyrou et al., 2013), limited time periods (e.g. Nabat et al., 2015b) or specific desert dust outbreaks (e.g. Pérez et al., 2006; Santese et al., 2010; Stanelle et al., 2010). The investigation of dust radiative effects is a scientific issue of great concern since it is documented that mineral particles, through their interaction with the radiation, can affect atmospheric processes from short (weather) to long (climate) temporal scales. To this end, many research efforts were dedicated to the investigation of dust impacts on the convective activity (Mallet et al., 2009), sea surface temperature (Foltz and McPhaden, 2008), hydrological cycle (Miller et al., 2004b), hurricanes (Bretl et al., 2015), boundary layer dynamics (Heinold et al., 2008) and monsoons (Solmon et al., 2008; Vinoj et al., 2014).
The direct impact of dust aerosols is expressed by the sign and the magnitude of the DRE values, which are defined as the anomalies (perturbation) of the radiation fields attributed to dust–radiation direct interaction, considering as a reference (control) an atmospheric state where mineral particles are not a radiatively active substance. Based on this, negative and positive DREs indicate a cooling (loss of energy) and a warming effect (gain of energy), respectively. Nevertheless, the signs of the DREs vary between the SW and LW spectrum (Osborne et al., 2011) as well as within the Earth–atmosphere system. More specifically, due to the attenuation (through scattering and absorption) of the SW radiation, dust aerosols warm the atmosphere and cool the surface (Huang et al., 2014), while reverse tendencies are revealed at longer wavelengths attributed to the absorption and re-emission of LW radiation by the mineral particles (Sicard et al., 2014a). Between the two spectrum ranges, the SW DREs are larger compared to the LW ones, in absolute terms, thus explaining their predominance when the corresponding calculations are made for the NET (SW + LW) radiation (e.g. Pérez et al., 2006; Zhu et al., 2007; Woodage and Woodward, 2014). The perturbations of the radiation budget at the surface and in the atmosphere determine the DRE at TOA (e.g. Kumar et al., 2014), which indicates the increase (planetary cooling) or the decrease (planetary warming) in the outgoing radiation from the Earth–atmosphere system and is relevant to dust climatic effects (Christopher and Jones, 2007).
The scientific importance of investigating the dust direct impacts on radiation has been noted in previous studies, in which it was shown that the consideration of the dust–radiation interactions may improve the forecasting ability of weather models (Pérez et al., 2006) and can reduce the observed biases of the LW radiation at TOA between models and satellite retrievals (Haywood et al., 2005). The dust direct impacts are highly variable both in space (e.g. Zhao et al., 2010) and time (e.g. Osipov et al., 2015), which can be attributed to several parameters related either to dust aerosols' physical and optical properties or to external factors (e.g. surface type), which determine both the sign and the magnitude of the DREs (Liao and Seinfeld, 1998). One of the most important factors is the composition of mineral particles determining the spectral variation of the refractive index (Müller et al., 2009; Petzold et al., 2009; Perlwitz et al., 2015a, b; Pérez García-Pando et al., 2016) and subsequently their absorption efficiency (Mallet et al., 2009), which are both critical in radiation transfer studies and are also dependent on the mixing state (either external or internal) of dust aerosols (Scarnato et al., 2015). Under clear skies, apart from mineral particles' optical properties, the shape (Wang et al., 2013a), the emitted dust size distribution (Mahowald et al., 2014), the surface albedo (Tegen et al., 2010) and the vertical distribution of dust aerosols (Mishra et al., 2015) have been recognized as determinant factors for the DRE calculation. On the contrary, when clouds are present, the position of dust layers with regards to clouds defines the sign and the magnitude of DREs at TOA (Yorks et al., 2009; Meyer et al., 2013; Choobari et al., 2014; Zhang et al., 2014).
The dust radiative effects become important under specific conditions of very high concentrations: so-called events, episodes or outbreaks. Such episodes occur frequently over the broader Mediterranean basin (Gkikas et al., 2013), due to its vicinity to the world's major dust sources situated across the northern African (Sahara) and Middle Eastern deserts (Ginoux et al., 2012). Dust particles are mobilized over these areas by strong winds (Schepanski et al., 2009) being uplifted to the free troposphere due to strong convection in the boundary layer (Cuesta et al., 2009) and are transported towards the Mediterranean due to the prevailing synoptic circulation (Gkikas et al., 2015). Under these conditions, dust particles over the Mediterranean are recorded at very high concentrations, as has been confirmed either by satellite (e.g. Moulin et al., 1998; Guerrero-Rascado et al., 2009; Rémy et al., 2015) and ground retrievals (e.g. Kubilay et al., 2003; Toledano et al., 2007) or by surface PM10 measurements (e.g. Rodríguez et al., 2001; Querol et al., 2009; Pey et al., 2013).
Among the different aerosol types that co-exist in the Mediterranean (Lelieveld et al., 2002; Basart et al., 2009), dust is the one causing the greatest perturbation of the SW and LW radiation, especially during desert dust outbreaks (e.g. Di Sarra et al., 2008; Di Biagio et al., 2010). Thus, a number of studies focused on Mediterranean dust outbreaks' impacts on the SW (Meloni et al., 2004; Gómez-Amoet al., 2011; Antón et al., 2012; Di Sarra et al., 2013; Obregón et al., 2015), LW (Antón et al., 2014; Sicard et al., 2014a) and NET (Di Sarra et al., 2011; Romano et al., 2016) radiation. However, the obtained results were representative at a local scale and, considering the high spatial variability of desert dust outbreaks, the optimum solution of assessing in a comprehensive way their impacts on weather and climate is provided by atmospheric-dust models. To this end, the induced DREs by the Mediterranean desert dust outbreaks have been analysed through short-term numerical simulations (Pérez et al., 2006; Santese et al., 2010; Remy et al., 2015) while similar studies have been conducted either at a seasonal (Nabat et al., 2015a) and annual scale (Nabat et al., 2012) or for extended time periods (Spyrou et al., 2013; Nabat et al., 2015b), pointing out the key role of desert dust aerosols in the Mediterranean climate.
The overarching goals of the present study are (i) the assessment of the short-term direct radiative effects on the Earth–atmosphere system's radiation budget, induced during intense Mediterranean desert dust outbreaks, based on regional model simulations; (ii) the assessment of the associated impacts on temperature and sensible or latent heat fluxes; (iii) the investigation of possible feedbacks on dust aerosol optical depth (AOD) and dust emission; and (iv) the assessment of the model's predictive skills, in terms of reproducing temperature and radiation fields, when dust–radiation interactions are taken into account in numerical simulations. To this end, 20 intense and widespread desert dust outbreaks that affected the broader area of the Mediterranean basin, over the period March 2000–February 2013, have been identified based on an objective and dynamic satellite algorithm, which utilizes daily multi-sensor satellite retrievals (Sect. 2). It must be highlighted that through the consideration of a large dataset of desert dust outbreaks is ensured the robustness of our findings, thus providing the opportunity to have a clear view of dust outbreaks' impacts on radiation as well as of the associated impacts on meteorological variables (e.g. temperature). For each dust outbreak, through short-term (84 h) numerical simulations of the regional NMMB-MONARCH model (Sect. 3), the DREs are calculated at TOA, surface and in the atmosphere, at both grid point (geographical distributions) and regional-scale level (Sect. 5.2), for the SW, LW and NET (SW + LW) radiation. Also examined are the impacts of the Mediterranean desert dust outbreaks on the sensible or latent heat fluxes (Sect. 5.3) and on the surface temperature (Sect. 5.4) as well as the potential feedbacks on dust AOD and dust emissions (Sect. 5.5). The last part of the study (Sect. 5.6 and 5.7) investigates the potential improvement of the model's forecasting ability in terms of reproducing the temperature and radiation fields when dust–radiation interactions are included in numerical simulations. A summary is made and conclusions are drawn in Sect. 6.

Figure 1Geographical limits of the (i) NMMB simulation domain (NSD, outer domain), (ii) Mediterranean satellite domain (MSD, red rectangle) and (iii) Sahara desert domain (SDD, green rectangle). The magenta star symbols depict the locations of the BSRN stations and the yellow triangle denotes the location of the AERONET SEDE_BOKER station.
In the present study, 20 intense and widespread desert dust outbreaks that affected the broader area of the Mediterranean basin, over the period March 2000–February 2013, are analysed. The studied desert dust outbreaks have been identified using an objective and dynamic satellite algorithm introduced in Gkikas et al. (2013; flowchart in their Fig. 2) and further improved in Gkikas et al. (2016). The algorithm utilizes daily 1∘ × 1∘ latitude–longitude resolution satellite retrievals, derived from MODerate resolution Imaging Spectroradiometer (MODIS; Remer et al., 2005), Total Ozone Mapping Spectrometer (TOMS; Torres et al., 1998) and Ozone Monitoring Instrument (OMI; Torres et al., 2007) observations. The MODIS-Terra (Collection 051) aerosol optical depth at 550 nm (AOD550 nm), Ångström exponent (α), fine fraction (FF) and effective radius (reff, available only over sea) products are used in the algorithm along with EP-TOMS and the OMI-Aura Aerosol Index (AI). Using these products, the algorithm takes into account information regarding aerosols' load (AOD), size (FF, a and reff) and absorbing or scattering ability (AI), which is necessary for the identification of dust.
Only a brief discussion of the algorithm operation is given here, whereas a detailed description is provided in Gkikas et al. (2013). The satellite algorithm is applied to each individual 1∘ × 1∘ grid cell of the Mediterranean satellite domain (29–47∘ N and 11∘ W–39∘ E, MSD, red rectangle in Fig. 1), separately over land and sea surfaces, during the period March 2000–February 2013. For each grid cell, from the series (2000–2013) of daily AOD550 nm values, the mean (Mean) and the associated standard deviation (SD) of AOD550 nm are calculated. Based on these two primary statistics, two threshold (or cut-off) levels being equal to Mean + 2 × SD and Mean + 4 × SD, are defined. By comparing each daily AOD value to the two thresholds, the algorithm determines whether an aerosol episode (or event) occurs over an 1∘ × 1∘ grid cell (or pixel) in that day or not, and labels it as strong or extreme, depending on which AOD threshold is exceeded (lower or higher). Thereby, the term “aerosol episode” refers to pixel-level episodic (extremely high loading) aerosol conditions and it is used with this meaning henceforth. Subsequently, in order to characterize the identified pixel-level episodes as desert dust (DD) episodes, appropriate thresholds for α, FF, reff and AI are used, based on existing knowledge about relevant physical properties (size and absorbing or scattering ability) of dust. According to the algorithm, a strong or extreme pixel-level DD episode occurs if α≤ 0.7, FF ≤ 0.4, reff > 0.6 µm and AI > 1 (conditions should be met simultaneously).
Based on the satellite algorithm's outputs, for each day of the study period the total number of grid cells over which a strong or an extreme DD episode has taken place is calculated. Subsequently, from the overall series of 4748 days over the study period, only those in which at least 30 grid cells with a DD episode (either strong or extreme) have been recorded are kept. This criterion was first adopted by Gkikas et al. (2015), who analysed the atmospheric circulation evolution patterns favouring the occurrence of dust outbreaks over the broader Mediterranean basin, in order to keep and study the most extensive ones (in terms of the number of pixel-level DD episodes). In a next step, the days satisfying the defined criterion (i.e. days where at least 30 pixel-level DD episodes have occurred) are ranked based on their regional MODIS-Terra AODs averaged over the “dust episodic” pixels within the geographical limits of the MSD. If two or more consecutive days satisfy the defined criteria, then the day with the maximum number of DD episodes is selected. The final dataset consists of 20 intense Mediterranean desert dust outbreaks listed in a chronological order in Table 1.
Table 1List of the Mediterranean desert dust outbreaks which have been identified within the geographical limits of the MSD based on the satellite algorithm. In addition, the number of strong, extreme and total (strong plus extreme) DD episodes (number of satellite grid cells at 1∘ × 1∘ spatial resolution where a DD episode has been identified), the regional intensity (in terms of AOD550 nm) calculated from the total DD episodes as well as the dust-affected parts of the Mediterranean domain are provided.
The majority of the selected desert dust outbreaks (55 % or 11 out of 20) took place in spring (March–April–May) when massive dust loads originating in the Sahara Desert are transported towards the central and eastern parts of the Mediterranean (Gkikas et al., 2013; Pey et al., 2013). Four widespread desert dust outbreaks mainly affected the western sector of the MSD in summer (July, August), while five dust outbreaks were recorded across the central and eastern parts of the basin in winter (January, February). Among the selected cases, the number of pixel-level total (strong plus extreme) DD episodes in the MSD varies from 30 (28 July 2005, western-central Mediterranean) to 85 (31 July 2001, western Mediterranean). In almost all cases, the number of extreme DD episodes is higher than those for the strong ones spanning from 20 (28 July 2005) to 51 (8 May 2002) and from 3 (24 February 2006) to 56 (31 July 2001). Likewise, the intensity (in terms of AOD at 550 nm) of total DD episodes ranges from 0.74 (31 July 2001) to 2.96 (2 March 2005), being in general higher in winter while moderate-to-high intensities are recorded in spring. Based on the information in Table 1, the selected study cases correspond to widespread and intense dust outbreaks that occurred in various parts of the Mediterranean, and therefore they are representative and appropriate for further study of their radiative effects.
In the present section, the main features of the meteorological driver (Sect. 3.1.1) and the dust module (Sect. 3.1.2) used in the regional NMMB-MONARCH (Multiscale Online Nonhydrostatic AtmospheRe CHemistry) model, previously known as NMMB/BSC-Dust, are described. The version (v1.0) of the NMMB-MONARCH model used here contributes to different model inter-comparisons like the International Cooperative for Aerosol Prediction (ICAP) initiative and the Sand and Dust Storm Warning Advisory and Assessment System (SDS-WAS), a project developed under the umbrella of the World Meteorological Organization (WMO) with a focus on improving the capabilities of sand and dust storm forecasts. For brevity reasons, only the main characteristics of the model are discussed here since a thorough description is provided in Pérez et al. (2011, and references therein) as well as in recent publications presenting its developments and applications in gas-phase chemistry (Badia et al., 2017), volcanic ash dispersion (Marti et al., 2017) and data assimilation (Di Tomaso et al., 2017) studies. The spectral variation of the GOCART dust optical properties, utilized as inputs to the radiation transfer scheme, is presented in Sect. 3.2, whereas the model set-up used in our experiments is given in Sect. 3.3.
3.1 The NMMB-MONARCH model
3.1.1 The NMMB atmospheric model
The Non-hydrostatic Multiscale Model (NMMB; Janjic, 2004; Janjic and Black, 2007; Janjic et al., 2011) is a unified atmospheric model developed at the National Centers for Environmental Prediction (NCEP) (Janjic et al., 2001; Janjic, 2003). A powerful element of the model constitutes its non-hydrostatic dynamical core, activated depending on the resolution, providing the capability to be used for applications spanning at a wide range of temporal (from short- to long-term) and spatial (from regional to global) scales. An additional dynamic feature of the NMMB is the consideration of various parameterization schemes which can be incorporated into the numerical simulations. In our experiments, the parameterization schemes of Betts–Miller–Janjic (Betts, 1986; Betts and Miller, 1986; Janjic, 1994, 2000), Ferrier (Ferrier et al., 2002), Mellor–Yamada–Janjic (Janjic et al., 2001) and Monin–Obukhov (Monin and Obukhov, 1954) have been utilized for the convection, cloud microphysics, turbulence and surface layer, respectively, as well as the NOAH land model (Ek et al., 2003). Moreover, only the greenhouse gases are taken into account and not the emitted short lived atmospheric gases. The model's dynamic equations, in the horizontal plane, are solved on the Arakawa B grid (Arakawa and Lamb, 1977) while in vertical the general hybrid pressure–sigma coordinate (Simmons and Burridge, 1981) is utilized. For regional simulations, a rotated longitude–latitude coordinated system is used (the Equator is running through the middle of the integration domain), thereby enabling more uniform grid distances.
3.1.2 The dust component
The main components of the desert dust life cycle, regarding mineral particles' production in the source areas, transport and removal from atmosphere, are considered in the dust component of the MONARCH model, which is embedded into the NMMB model. The size intervals as well as the effective radii for each one of the eight dust bins, representing clay-originated sub-micron (bins 1–4) and silt-originated coarse (bins 5–8) particles, that are considered in the dust module were adopted from Pérez et al. (2006). The mass of each bin is calculated at each time step, grid point and layer, while the median mass diameter and the geometric standard deviation of the sub-bin distribution are fixed to 2.524 and 2.0 µm, respectively. In the existing version of the NMMB-MONARCH model, dust aerosols are externally mixed and hydrophobic. All the required parameters regulating dust emission and mobilization, namely the (i) surface wind speed, (ii) turbulence, (iii) land use type, (iv) vegetation cover, (v) erodibility, (vi) surface roughness, (vii) soil texture and (viii) soil moisture, are considered in the dust emission scheme (Pérez et al., 2011). The vertical dust flux for each dust size bin is proportional to the horizontal sand flux while several parameters are tuned to match observations that are mainly available far away from the sources. Coarse dust aerosols are removed efficiently from the atmosphere through sedimentation, which is solved implicitly in each model layer. For the description of dust aerosols' wet removal, a mechanism which is more effective for fine mineral particles, parameterizations representing in- and below-cloud scavenging are included in the NMMB-MONARCH in which the grid-scale cloud microphysical scheme of Ferrier and the convective adjustment scheme of Betts–Miller–Janjic are utilized (Pérez et al., 2011). The ability of the NMMB-MONARCH model to accurately reproduce the dust aerosol fields has been confirmed through evaluation studies, which relied on global and regional annual simulations (Pérez et al., 2011), as well as through utilizing measurements from experimental campaigns as reference data (Haustein et al., 2012). Moreover, the reliability of the model in terms of reproducing the Saharan dust patterns over Cape Verde as well as to simulate dust vertical profiles has been confirmed through the analyses made by Gama et al. (2015) and Binietoglou et al. (2015), respectively. In addition, the predictive skills of the NMMB-MONARCH model, in comparison with other regional models, have been assessed for a specific dust outbreak (Huneeus et al., 2016) that affected the western parts of the Mediterranean and Europe. Finally, in the framework of the SDS-WAS (https://sds-was.aemet.es/forecast-products/forecast-evaluation, last access: 14 June 2018), the evaluation of the simulated dust fields (over the Sahara, Middle East and Mediterranean) produced by 12 models, versus ground-based (AERONET) and spaceborne (MODIS) retrievals, reveals that the NMMB-MONARCH is ranked at the highest positions.
3.2 Radiative transfer model and dust optical properties
For the description of dust aerosols interaction with both the SW and LW radiation, the RRTMG (Rapid Radiative Transfer Model for Global Circulation Models, Iacono et al., 2008) radiative transfer model is coupled with the dust module. RRTMG consists a modified version of the RRTM which is a broadband radiative transfer model that includes the molecular absorption of the SW (by water vapour, carbon dioxide, ozone, methane and oxygen) and LW (by water vapour, carbon dioxide, ozone, methane, nitrous oxide, oxygen, nitrogen and halocarbons) radiation. Even though the basic physics and absorption coefficients utilized in RRTM (Mlawer et al., 1997) remain unchanged in RRTMG, several updates regarding computational efficiency and representation of sub-grid-scale cloud variability have been implemented (Iacono et al., 2008). Through these adjustments, the efficiency of the RRTMG has been improved in global circulation model (GCM) applications with a minimal loss of accuracy (Iacono et al., 2008). In the RRTMG, the total number of quadrature points (g points) used to calculate radiances has been reduced from 224 to 112 and from 256 to 140 for the shortwave and longwave spectrum, respectively. In addition, for the short wavelengths, the discrete ordinates algorithm DISORT (Stammes et al., 1998) has been replaced by a two-stream radiation transfer solver (Oreopoulos and Baker, 1999). All the updates applied in the RRTMG radiation transfer code are listed in the Atmospheric and Environmental Research (AER) radiative transfer web site (http://rtweb.aer.com/, last access: 14 June 2018). Based on evaluation studies, the comparison of the RRTMG clear-sky SW and LW fluxes versus RRTM_SW and LBLRTM, respectively, has revealed that its accuracy at short wavelengths is within 3 W m−2 whereas at long wavelengths it is 1.5 W m−2. As inputs to the radiation transfer scheme, the aerosol optical depth (measure of the aerosol load), the single scattering albedo (SSA, expresses the fraction of scattering to total extinction) and the asymmetry parameter (ASYM, measures the degree of symmetry of the phase function between the forward and backward hemispheres) are required. In the present version (v1.0) of the model, the calculation of dust optical properties is made based on the formulas presented in Pérez et al. (2006), by using the mass concentration simulated by the NMMB-MONARCH model, the single-particle optical properties derived by the GOCART model (Chin et al., 2002) and the refractive indices from the Global Aerosol Data Set (GADS) (Koepke et al., 1997), which have been modified using Sinyuk et al. (2003), as described in Pérez et al. (2011). The spectral variation of the single-particle dust optical properties for each bin, namely the mass extinction coefficient, the single scattering albedo and the asymmetry parameter, are shown in Fig. 2a–c, respectively. Their calculation for each dust size bin and at each spectral band is made based on the Mie code (Mishchenko et al., 2002), assuming homogeneous and spherical dust particles. For the other types of tropospheric aerosols (sulfate, organic carbon, black carbon and sea salt), the GOCART monthly climatological AOD, SSA and ASYM values for the year 2000 are utilized.
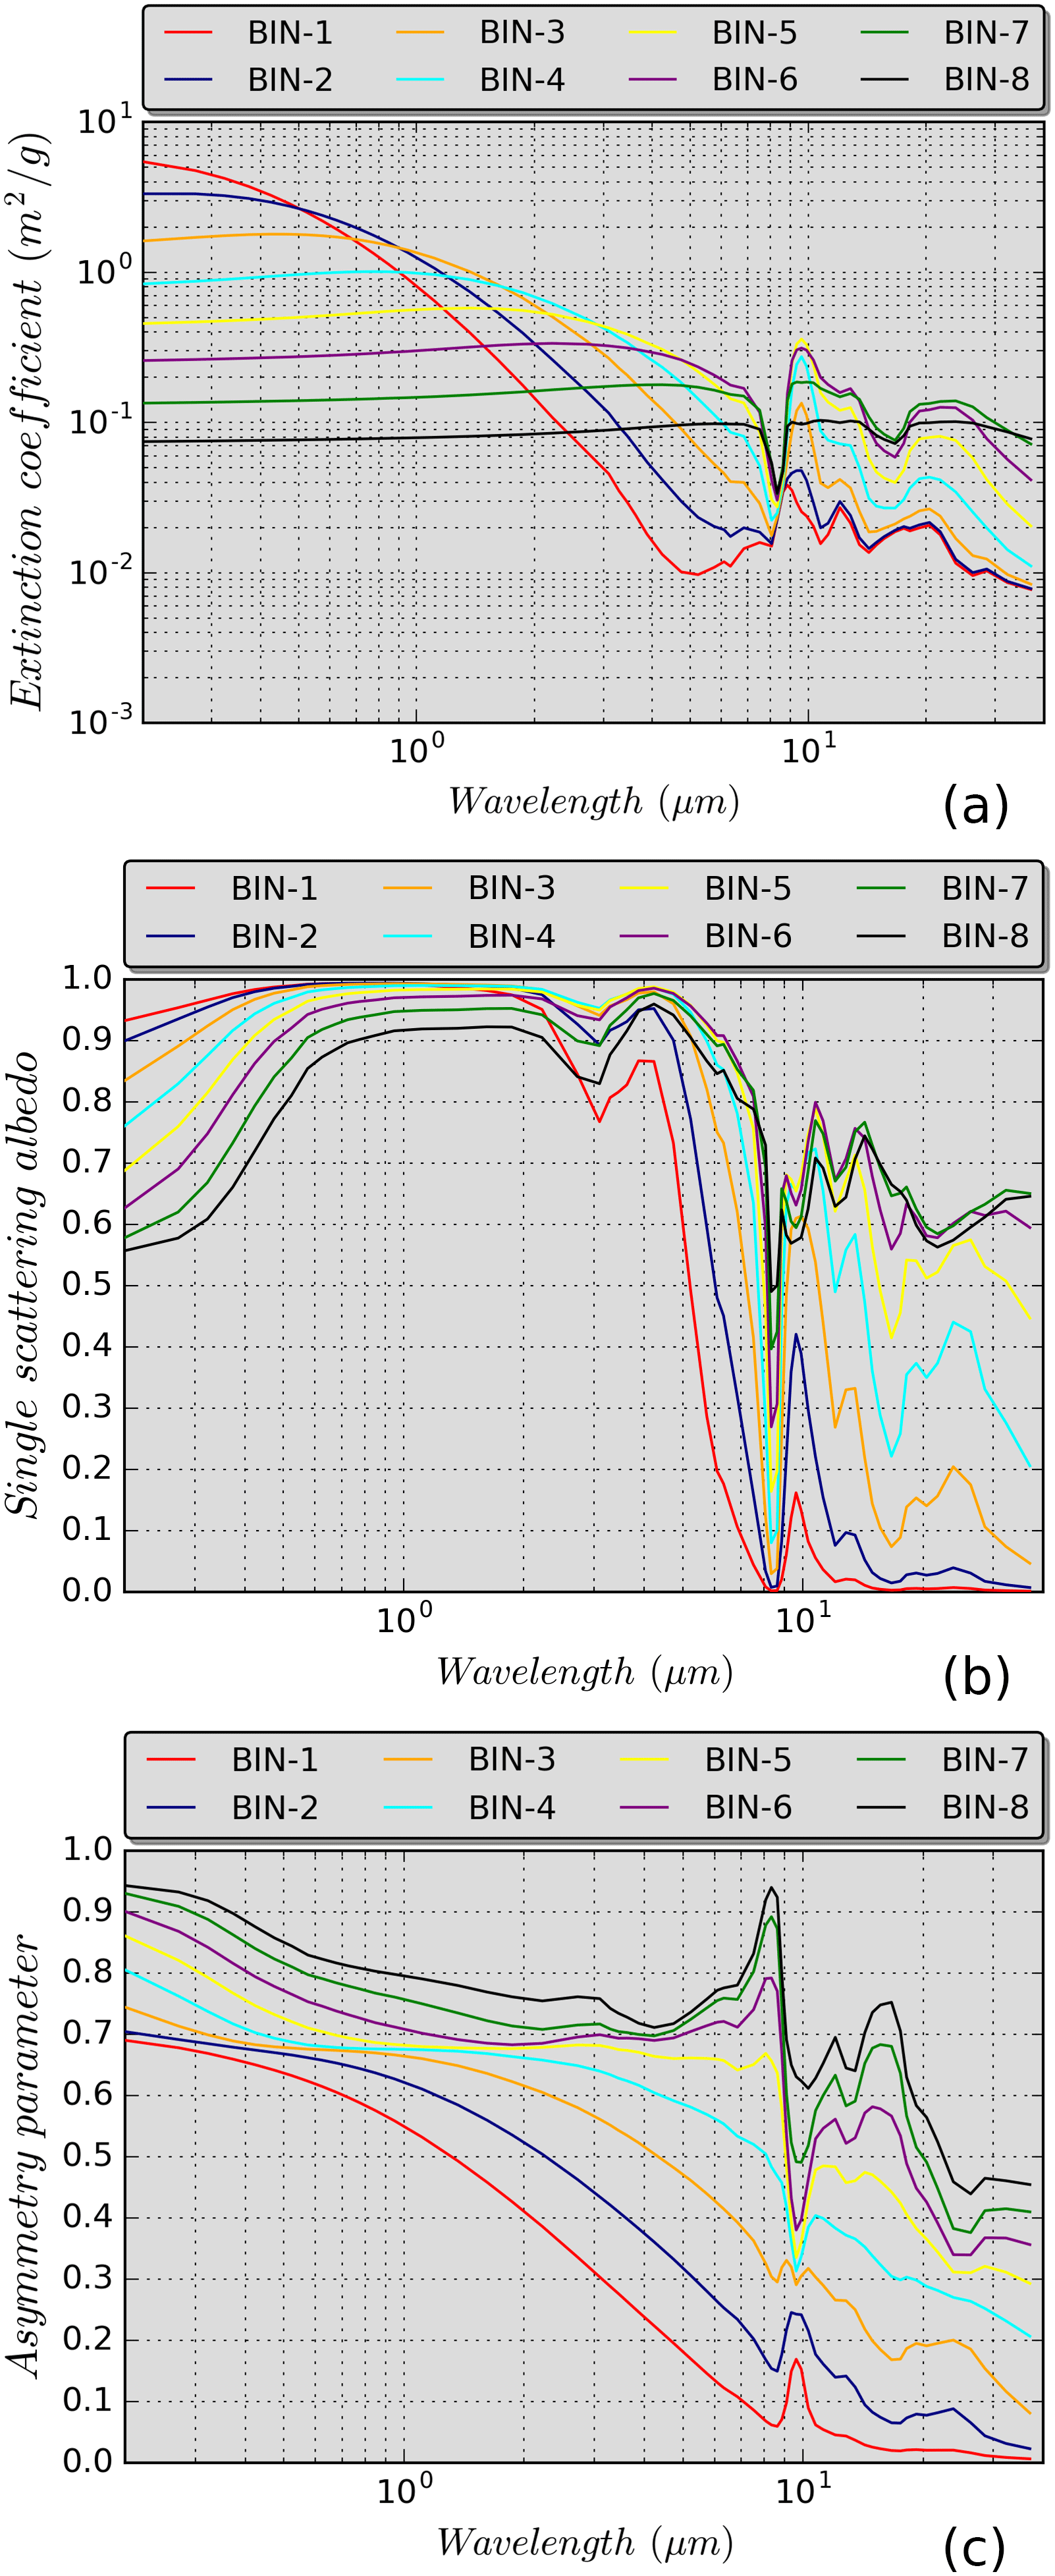
Figure 2Spectral variation of the GOCART: (a) extinction coefficient (in m2 g−1), (b) single scattering albedo and (c) asymmetry parameter, for each one of the eight dust bins which are considered in the dust module.
3.3 Model set-up configuration
In our experiments, the simulation domain (NMMB-MONARCH Simulation Domain, NSD, outer domain in Fig. 1) covers the Sahara (dust sources areas), the Mediterranean (mid-range dust transport areas) and most of the European continent (long-range dust transport areas). The horizontal resolution is equal to 0.25∘ × 0.25∘ and 40 sigma-hybrid pressure levels up to 50 hPa are used in vertical. The atmospheric model's fundamental time step is set to 25 s. The simulations have been made for each one of the 20 identified Mediterranean desert dust outbreaks (see Sect. 2) considering a spin-up and a forecast period, using 1∘ × 1∘ NCEP final analyses (FNL) as initial and 6 h boundary conditions. More specifically, for each case, a hindcast period of 84 h starts at 00:00 UTC (see the second column in Table 1) when the desert dust outbreak has been identified according to the defined criteria (explained in Sect. 2). In order to ensure a more “realistic” initial state of the atmosphere, a 10-day spin-up before the initialization of the forecast period is simulated, where the model's meteorology is re-initialized every 24 h. During the forecast periods, for the computation of the aerosol radiative effects, two configurations of the model were run. In the first one (RADON), all aerosol types interact with radiation while in the second one the corresponding interactions are deactivated (RADOFF). It must be clarified that in the RADON experiment, the perturbation of the radiation fields is mainly caused by dust aerosols, which are dynamically calculated, while the contribution of the other aerosol species depends on climatological optical properties derived from GOCART. However, since the selected cases refer to desert dust outbreaks, the term “dust–radiation interactions” instead of “aerosol–radiation interactions” is used throughout the paper.
The direct radiative effects, expressed in watts per square metre (W m−2), are computed at the TOA, in the atmosphere (ATM), and at the surface, for the downwelling (SURF) and the absorbed (NETSURF) radiation, for the shortwave, longwave and NET (SW + LW) radiation. The calculations are made according to the following formulas.
At TOA (Eq. 1), DREs are calculated through the subtraction of the RADON (dust–radiation interaction is activated) from the RADOFF (dust–radiation interaction is deactivated) outputs of the upward (↑) radiative fluxes (F) and express the loss (cooling effect or planetary cooling) or the gain (warming effect or planetary warming) of energy within the atmosphere when DREs are negative and positive, respectively. At the surface, DREs are computed for both the downwelling (↓) (SURF, Eq. 2) and the net (downward minus upward) radiation (NETSURF, Eq. 3). Both DREs indicate a dust-induced surface cooling or warming when they get negative or positive values, respectively. Finally, on energy within the Earth–atmosphere system, the DREATM is calculated by subtracting the DRENETSURF from the DRETOA values (Eq. 4) and quantifies the impact (warming or cooling) of dust outbreaks on the atmospheric radiation budget. The DREs are based on the subtraction of two independent model runs. Therefore, our results represent the radiative anomalies induced by dust aerosols including both the direct effect and the rapid response of atmospheric constituents such as humidity and clouds (semi-direct effects).
5.1 Comparison of model and satellite AODs
Before dealing with the DREs, the ability of the model to satisfactorily reproduce the dust AOD fields is assessed using MODIS-Terra AOD550 nm retrievals as reference data. The results of the intercomparison between the daily satellite AODs (left column in Fig. 3) and the modelled (right column in Fig. 3) AODs at 12:00 UTC (instantaneous fields) are presented here for three of the 20 identified desert dust outbreaks (see Sect. 2), which took place on 2 March 2005 (upper row in Fig. 3), 19 May 2008 (middle row in Fig. 3) and 2 August 2012 (bottom row in Fig. 3) and affected the eastern, central and western parts of the Mediterranean basin, respectively. The corresponding maps for the remaining 17 cases are illustrated in Fig. S1 in the Supplement. Note that the evaluation of the model outputs vs. the satellite measurements is restricted within the geographical limits of the MSD (red rectangle in Fig. 1), since the satellite algorithm used for identification of the desert dust outbreaks is applied only to this region (see Sect. 2). Moreover, in order to eliminate the spatial inconsistencies between the two products, we have regridded the model outputs from their raw spatial resolution (0.25∘ × 0.25∘) to 1∘ × 1∘, matching them with the satellite retrievals.
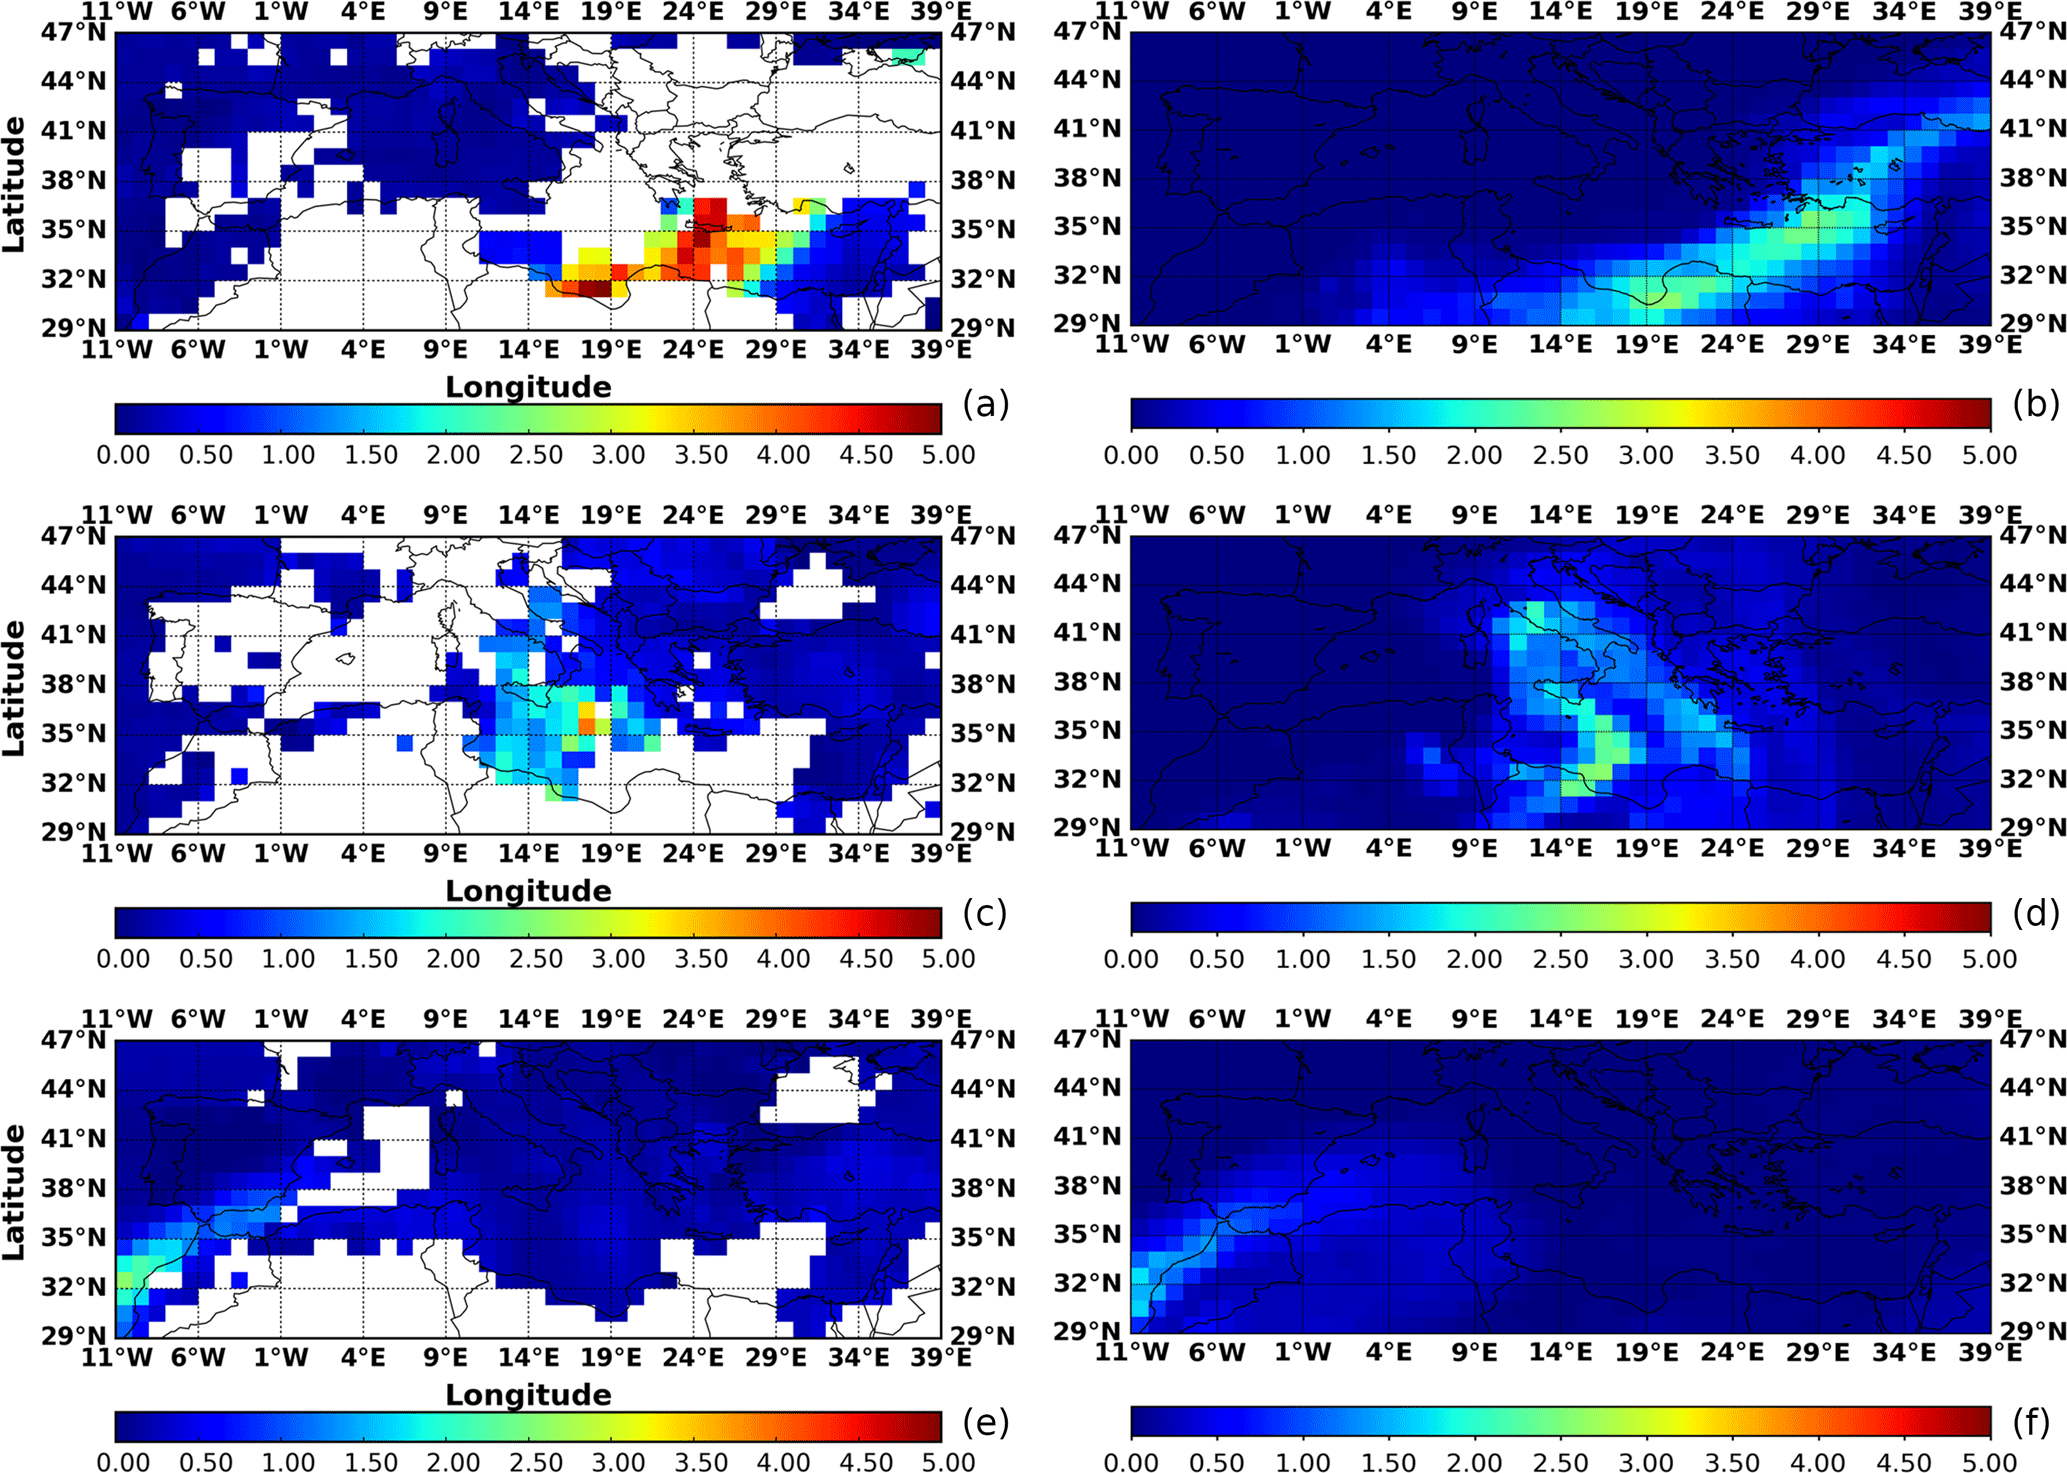
Figure 3Geographical distributions of the aerosol optical depth (AOD) at 550 nm: (a, c, e) retrieved by the MODIS-Terra sensor and (b, d, f) simulated by the NMMB-MONARCH model at 12:00 UTC for the Mediterranean desert dust outbreaks that took place on (a, b) 2 March 2005, (c, d) 19 May 2008 and (e, f) 2 August 2012.
According to the MODIS-Terra observations on 2 March 2005, a dust plume extends from the Gulf of Sidra to the southern parts of Greece, with AODs up to 5 (Fig. 3a). As shown in Fig. 3b, the model on this day simulates high dust AOD550 nm values (1–3.25) along a dust plume, extending from Algeria to the Black Sea, which affects the eastern parts of the Mediterranean Sea. Through the intercomparison of satellite and model AODs, it is revealed that the desert dust outbreak is slightly shifted eastwards while the maximum dust AODs are lower than those retrieved by the satellite sensor. The second desert dust outbreak occurred on 19 May 2008 and affected the central sector of the MSD. According to MODIS (Fig. 3c), the intensity of dust loads is maximized (up to 4) in the central parts of the Mediterranean Sea (southeast of Sicily). This is also reproduced by the model, although somewhat higher AODs are found over the central and southern parts of Italy (Fig. 3d). In spite of this, however, there is a clearly good model performance in reproducing the dust event that hit the central Mediterranean. An even better agreement between the model and satellite AODs, in terms of spatial variability and intensity of dust loads, is found for the desert dust outbreak of 2 August 2012, that affected the westernmost parts of the Mediterranean, with highest AODs (up to 2–2.5) from the Alboran Sea down to the coastal areas of Morocco (Fig. 3e, f).
Apart from a qualitative comparison between MODIS and NMMB-MONARCH, the performance of the model has also been assessed quantitatively. More specifically, for each desert dust outbreak the spatial correlation coefficient (R) values as well as the absolute biases (defined as NMMB-MODIS) have been calculated considering only the grid cells where a DD episode (either strong or extreme) has been identified by the satellite algorithm. Figure S2 presents the computed regional R (Fig. S2ii) and bias (Fig. S2iii) scores while the stacked bars (Fig. S2i) illustrate the number of strong, extreme and total DD episodes (available also in Table 1). Among the studied cases, a strong variation of R values is revealed (Fig. S2ii), reflecting the diversity of the model's capability in terms of capturing the spatial patterns of the desert dust outbreaks. These drawbacks result mainly from displacements of the simulated dust patterns with respect to the observed ones. The best performance is found on 22 February 2004 (R= 0.82) in contrast to 23 January 2009 where the correlation coefficient is zero. In 7 out of 20 cases, the R values are higher than 0.5 while in 7 cases the R values vary between 0.2 and 0.4, indicating a weak-to-moderate performance of the model. In the remaining 6 dust events, the spatial agreement between MODIS and NMMB is characterized as poor (R < 0.2). As it concerns the bias, in absolute terms, in all the events negative values are recorded ranging from −2.3 (24 February 2006) to −0.17 (19 May 2008). This finding shows that the model consistently underestimates the intensity of the desert dust outbreaks which have been analysed in the present study.
According to the evaluation analysis, the model's ability in terms of satisfactorily reproducing the dust fields varies strongly case-by-case while the simulated intensity of the desert dust outbreaks is lower with respect to the satellite retrievals. Therefore, both facts can raise questions regarding the accuracy of the computed DREs in some cases since the perturbations of the radiation fields are determined to a large extent by AOD (e.g. Hatzianastassiou et al., 2004; Pérez et al., 2006; Papadimas et al., 2012). Nevertheless, several factors affect or determine the level of agreement between observed and simulated AODs, providing a reasonable explanation for the discrepancies found between MODIS and NMMB-MONARCH. The most important is the temporal inconsistency between the two products. More specifically, the satellite retrievals correspond to daily averages whereas the model products are representative for a specific forecast time (instantaneous fields). Considering the high variability of aerosols' loads, particularly under episodic conditions, this temporal discrepancy imposes a limitation when a quantitative comparison between MODIS and NMMB is attempted. This can explain the observed differences found either on the intensity or on the spatial patterns of the desert dust events. Also, it must be considered that artifacts of the satellite retrievals (e.g. clouds contamination, representativeness or homogeneity within the 1∘ × 1∘ grid cell) may lead to higher AODs, as has been shown in relevant evaluation studies (e.g. Gkikas et al., 2016). Moreover, due to the inability of the MODIS Dark Target (DT) algorithm to retrieve aerosol optical properties over desert areas as well as under cloudy conditions, in a significant part of the study region there are no available satellite observations (white areas in Fig. 3a, c and e), thus restricting their comparison with the model outputs which provide full spatial coverage.
5.2 Direct radiative effects (DREs)
5.2.1 Geographical distributions
For each desert dust outbreak, the TOA, ATM, SURF and NETSURF DREs have been computed for the SW, LW and NET radiation, according to the formulas presented in Sect. 4. Just as an example, Fig. 4 illustrates the geographical patterns of the instantaneous NET (SW + LW) DRETOA (second column), DREATM (third column), DRESURF (fourth column) and DRENETSURF (fifth column) values, at 12 h (first row), 24 h (second row), 36 h (third row) and 48 h (fourth row) after the initialization of the model forecast on 2 August 2012 at 00:00 UTC, along with the simulated patterns of dust AOD at 550 nm on the same day and at the same time (first column). For brevity reasons only the results for the all-wave (NET) are given, while the SW and LW DREs and their contribution to NET DREs are discussed in the regional analysis (next sub-section). The corresponding patterns for each desert dust outbreak are given in Figs. S3–S21 in the Supplement. Moreover, for each desert dust outbreak, the minimum and maximum clear-sky NET DREs at grid point level, during the simulation period, are presented in Table S1.
Based on the model outputs, at 12 h, an arc shaped dust plume affected the western parts of the Sahara, the Canary Islands, the maritime areas off the Moroccan coasts, the southern parts of the Iberian Peninsula and the western Mediterranean Sea (Fig. 4). During the forecast period, the spatial features of the desert dust outbreak do not reveal a remarkable variability, with maximum AODs (up to 3) across Mali, Mauritania, the western Sahara and in the Canary Islands. At a first glance, it is evident that the DRE patterns are driven by those of the desert dust outbreaks whereas small-scale isolated features of extremely high or low DREs mainly result from slight “shifts” of clouds between the two independent model runs. Moreover, it is apparent that both the sign and the magnitude of DREs vary among TOA, surface and atmosphere as well as with time (day or night). During the day-time (12 and 36 h) the DREs are driven by their SW components which significantly exceed the LW ones. Through absorption and scattering of solar radiation by mineral particles, the downwelling radiation at the ground level (SURF) is reduced by up to 308 W m−2, indicating a strong surface cooling (bluish colours) in areas where the dust AOD is maximized, like Mauritania or southern Algeria. During night-time (24 and 48 h), the sign of the DRESURF values is reversed and their magnitude decreases compared to that at 12 and 36 h. This is because during the night the DRESURF values are identical to the LW DRE ones, which are positive, implying extra downwelling LW radiation at the surface, by up to 58 W m−2, emitted by the overlying dust. This effect, leading to night surface warming, is more visible over specific parts of the Sahara that host high dust loads, e.g. in its western parts. The geographical patterns of DRENETSURF are very similar to those of DRESURF, as expected, since they only differ by the net upward radiation at the surface, which in turn is determined by the surface albedo (for the SW radiation) and temperature (for the LW radiation). Based on our results, the negative (surface cooling) and positive (surface warming) DRENETSURF values can reach down to −290 W m−2 (eastern Atlantic Ocean) and up to 42 W m−2 (western Sahara) during day-time and night-time, respectively. Among our studied cases (see Table S1) the instantaneous NET DRESURF and DRENETSURF values at noon can be as large as −589 and −337 W m−2, respectively, in agreement with relevant results reported in previous studies dealing with the radiative impacts of dust intrusions in the Mediterranean (Pérez et al, 2006; Remy et al., 2015), in west Africa (Heinold et al., 2008; Mallet et al., 2009) and in Asia (Wang et al., 2009; Singh and Beegum et al., 2013).
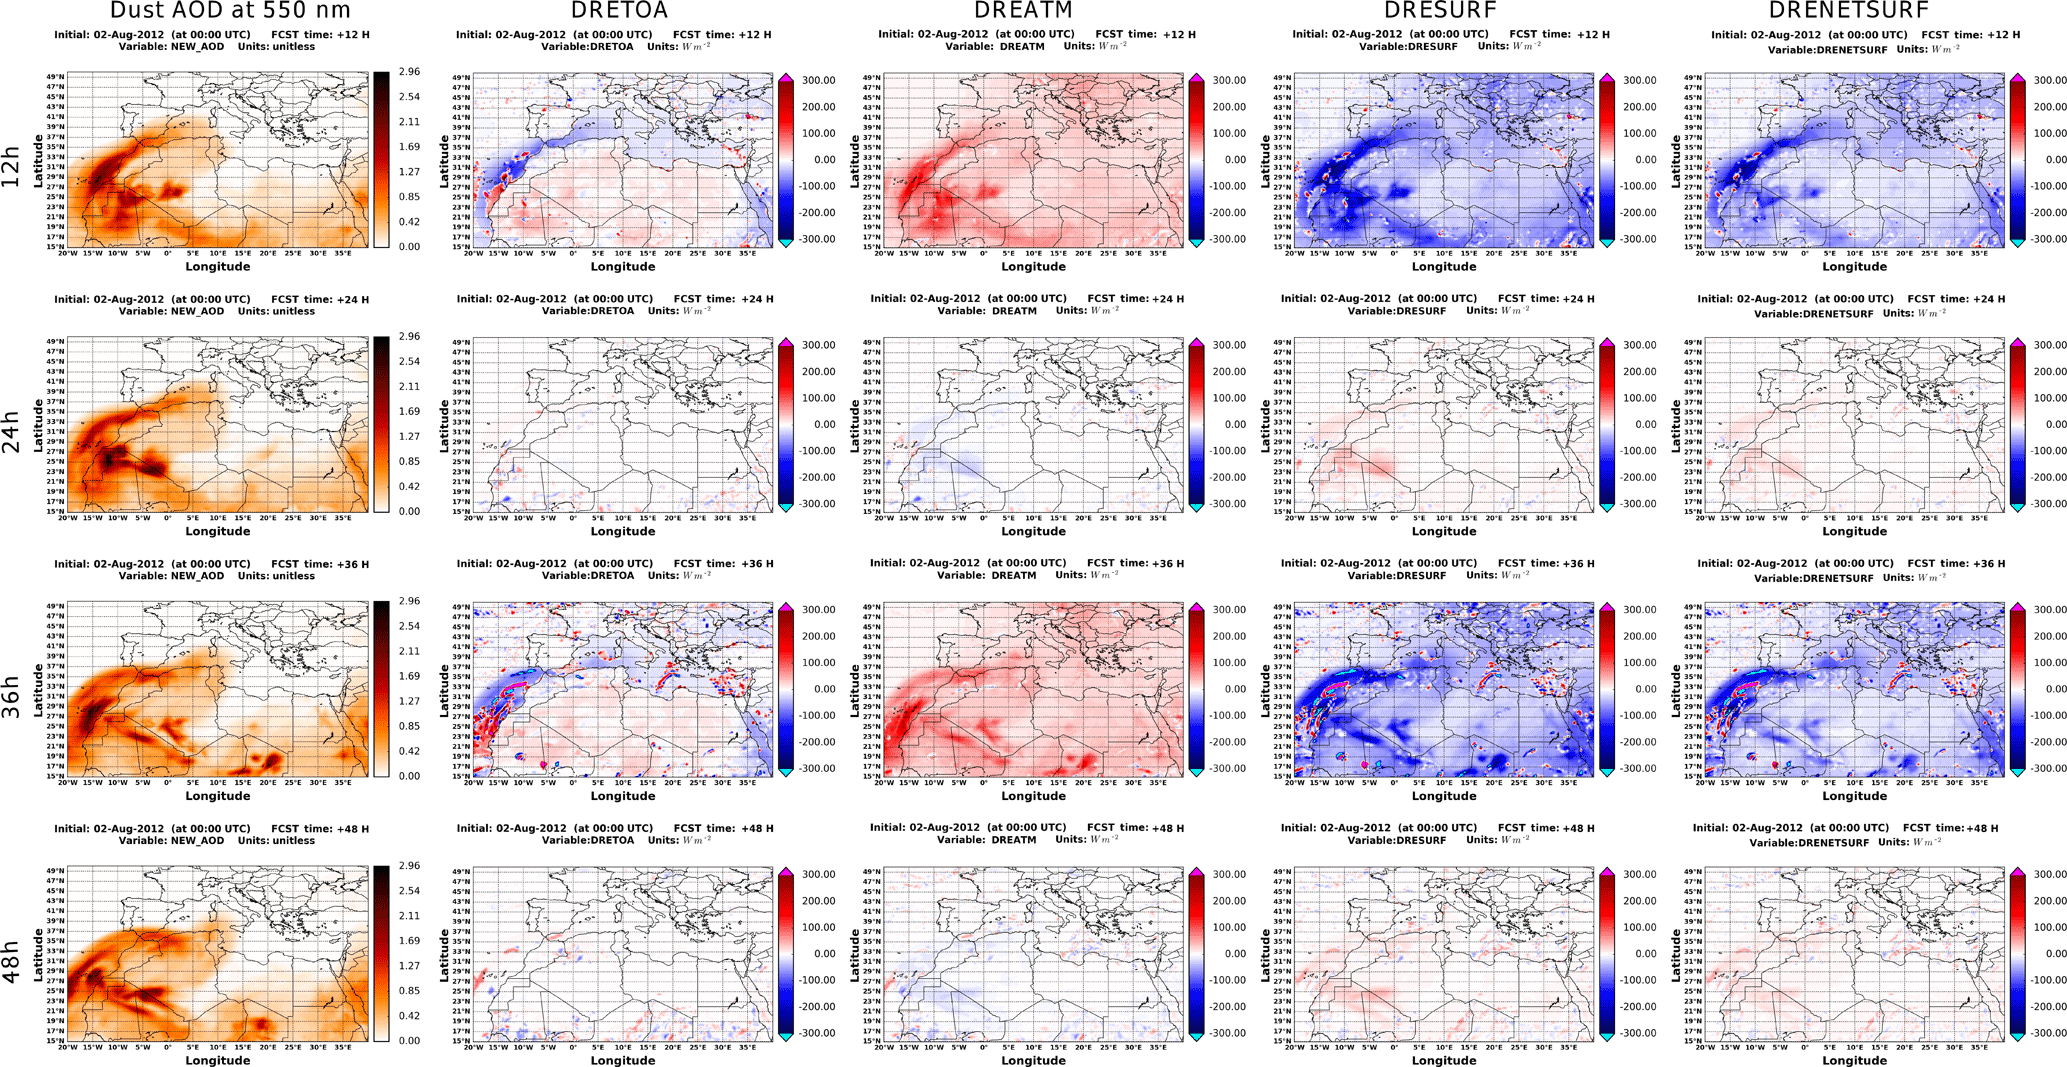
Figure 4Spatial patterns of the simulated dust AOD550 nm and the instantaneous DRETOA, DREATM, DRESURF and DRENETSURF values, expressed in watts per square metre (W m−2), at 12, 24, 36 and 48 h after the initialization of NMMB-MONARCH model at 00:00 UTC on 2 August 2012.
The occurrence of desert dust outbreaks results in a strong perturbation of the atmospheric radiation budget, attributed to the interaction of dust aerosols with the SW and LW radiation. More specifically, during day-time (i.e. 12 and 36 h), mineral particles absorb radiation at short wavelengths, thus warming the atmosphere as indicated by the positive instantaneous NET DREATM values in Fig. 4 (third column), reaching up to 189 W m−2 over the dust-affected areas. Our calculated noon atmospheric DREs (Table S1) are comparable to those reported by Heinold et al. (2008; 2011) and significantly lower compared to those in Pérez et al. (2006), who found DREATM values higher than 500 W m−2 in land areas with dust AOD > 3 during a desert outbreak that affected the Mediterranean on 12 April 2002. We note that Pérez et al. (2006) used complex refractive indices taken from the GADS that have been shown to be excessively absorbing, which may partly explain their high DREATM values. During night-time, negative DREATM values (down to −45 W m−2 in Algeria and Mali) are computed in the dust-affected areas, indicating an atmospheric cooling because of the emission of LW radiation by mineral particles (Wang et al., 2013b).
The sign and magnitude of DRETOA (Eq. 4) are regulated by DRENETSURF and DREATM. At noon and above cloud-free areas, there is a distinct change of DRETOA sign over oceanic and desert areas affected by dust loads (note for example the red colours over the dusty western Sahara Desert regions, e.g. Mauritania, against blue colours off the African coasts). This change of the DRETOA sign is due to the difference in surface albedo of the two types of surface (water and desert), in combination with dust high AODs and low-to-moderate single scattering albedo enhancing solar absorption by dust above highly multiple reflecting surfaces. Such a reverse of DRETOA sign has been also reported in previous studies (e.g. Santese et al., 2010; Nabat et al., 2012; Papadimas et al., 2012). Over highly reflective surfaces (i.e. deserts), the atmospheric warming is enhanced since dust aerosols absorb not only the incoming solar radiation but also the radiation reflected by the surface. At the same time, the amount of the absorbed radiation at the ground level is reduced by the attenuation of the SW radiation and by the increase in the back-reflected radiation at the surface. The combination of these processes results in a predominance of the atmospheric warming over surface cooling and subsequently to positive DRETOA values (planetary warming), which can be as large as 85 W m−2 according to our simulations (Table S1 in the Supplement). On the contrary, when dust aerosols are suspended over dark surfaces (i.e. maritime areas), the condition is reversed and negative DRETOA values down to −184 W m−2 (Table S1) are calculated, thus revealing a strong planetary cooling. Nevertheless, the positive DRETOA values exceeding 300 W m−2, which are recorded in maritime areas off the western African coasts, are associated with the existence of absorbing dust aerosols superimposed over low- and mid-level clouds. During night, the atmospheric cooling offsets the surface warming, both induced by the desert dust outbreaks, and for this reason the DRETOA values are almost negligible (do not exceed 10 W m−2 in absolute terms over cloud-free areas), indicating an almost null dust direct radiative effect. Our model computed dust-induced planetary warming above western Africa is comparable to similar results reported in previous studies focusing on the same or similar desert areas (e.g. Pérez et al., 2006; Mallet et al., 2009; Wang et al., 2010; Nabat et al., 2012; Kalenderski and Stenchikov, 2016).
5.2.2 Regional mean results
In order to show more clearly temporal patterns, DREs were also averaged over the NSD (outer NMMB simulation domain in Fig. 1), SDD (Sahara Desert domain, green rectangle in Fig. 1) and MSD (Mediterranean satellite domain, red rectangle in Fig. 1) domains, for each desert dust outbreak, separately for the NET, SW and LW radiation. Then, in a further step, DRE values have been averaged over the 20 dust outbreaks every 3 h during the forecast period (84 h). Thus, the time series of regional mean and associated standard deviation (shaded areas) all-sky TOA (black curve), SURF (purple curve), NETSURF (blue curve) and ATM (red curve) DREs are depicted in Fig. 5.
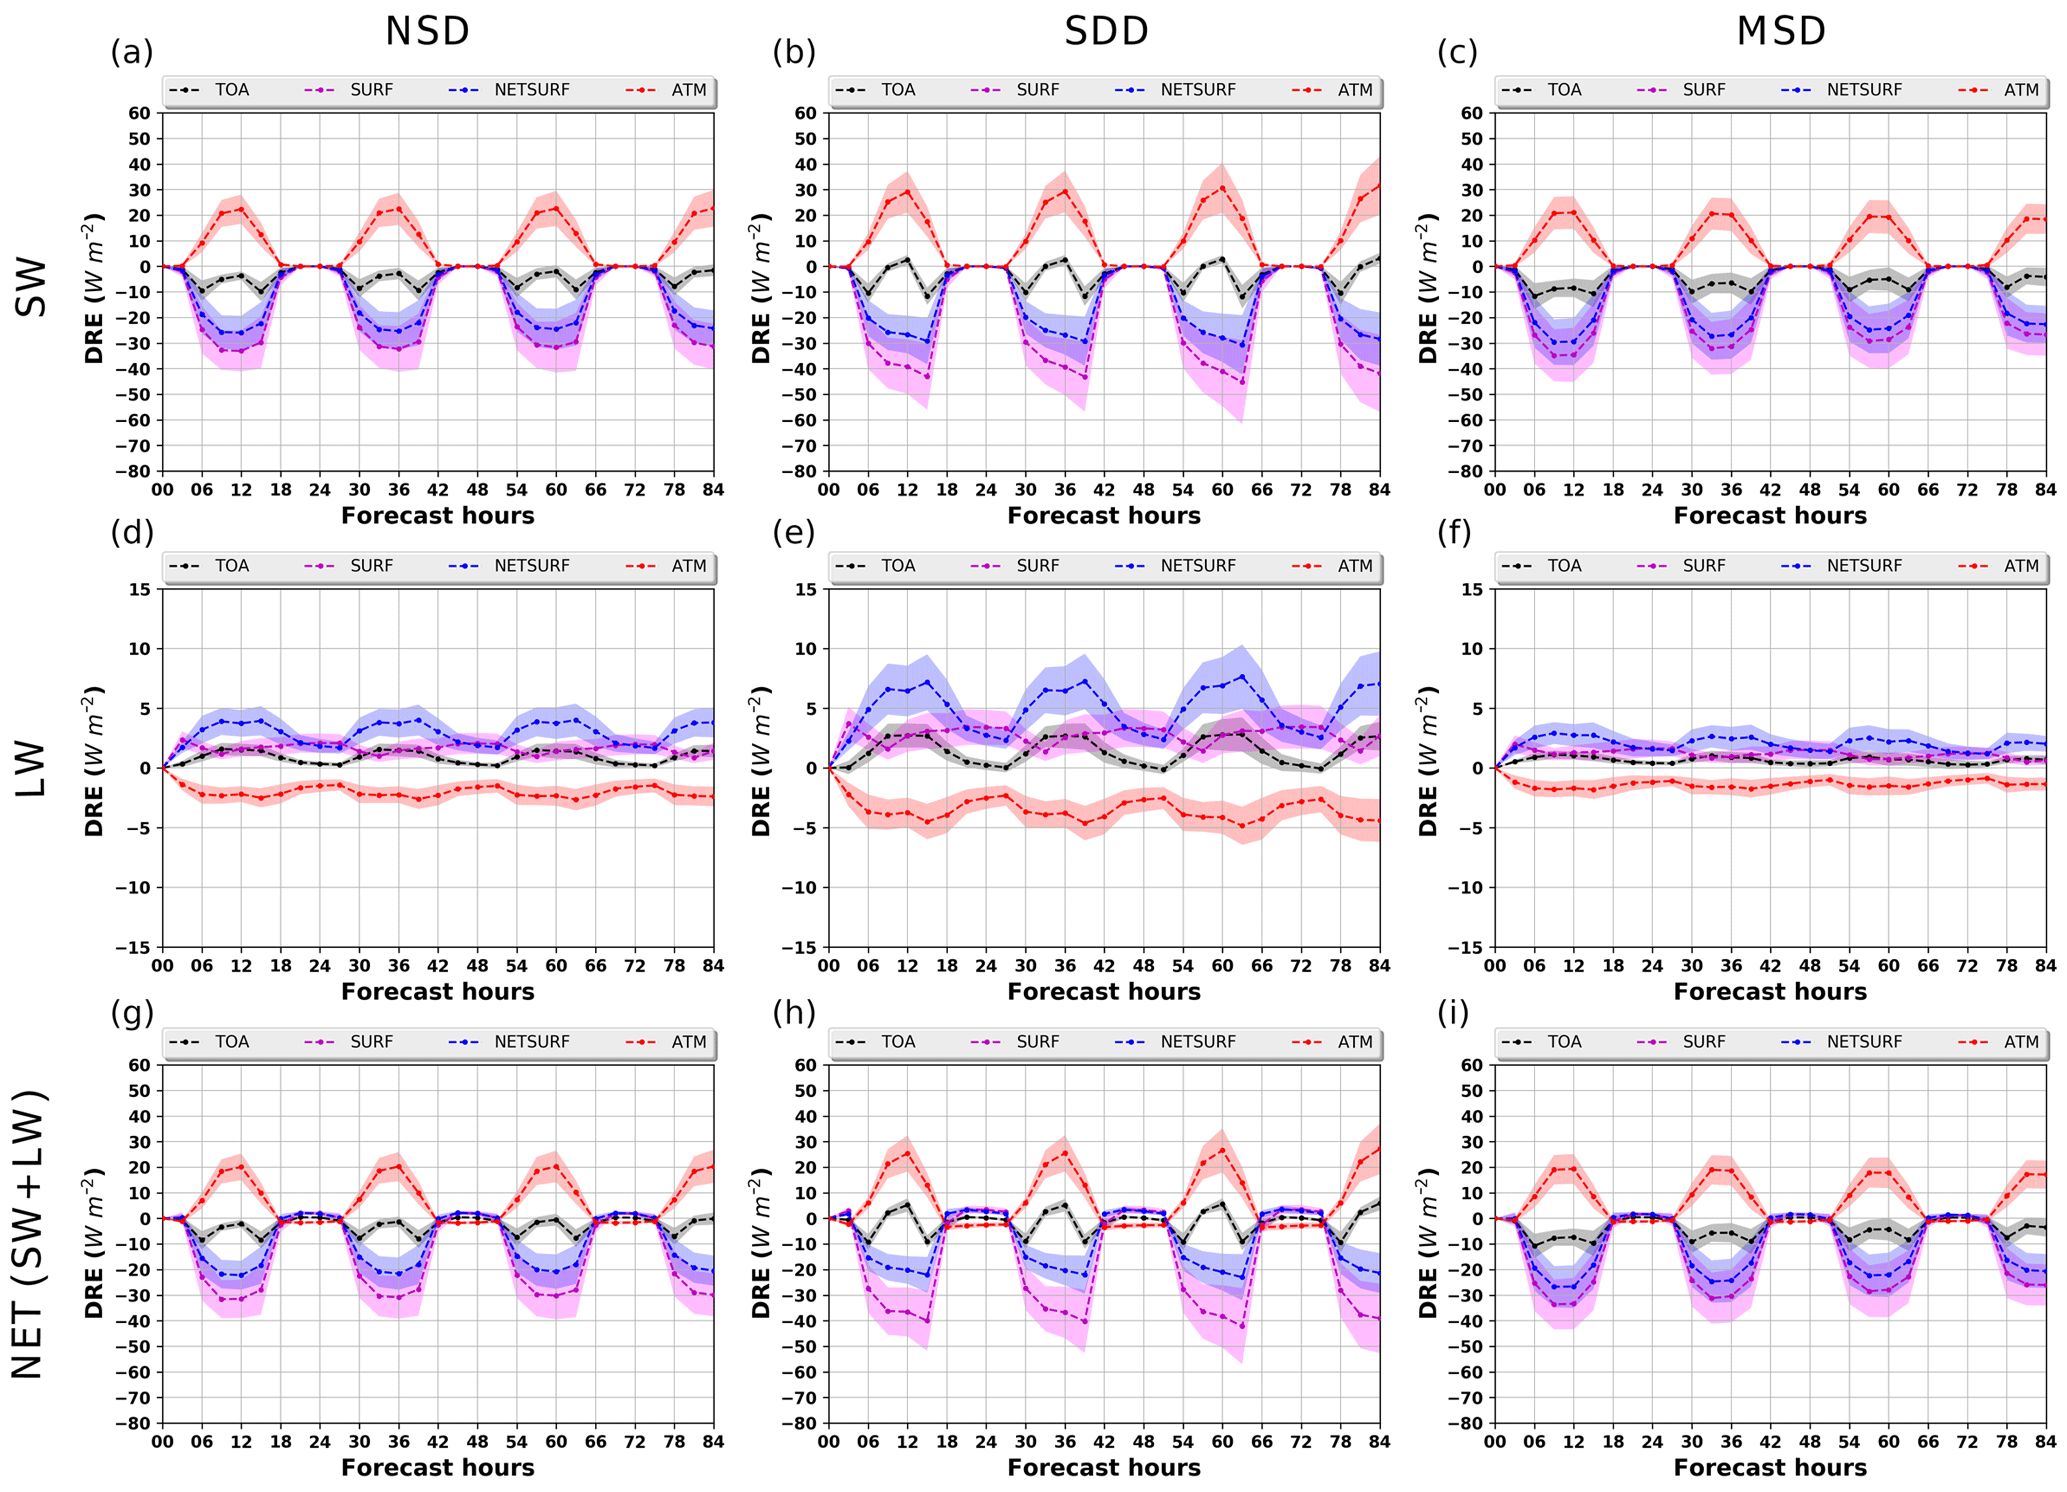
Figure 5Regional all-sky SW (a–c), LW (d–f) and NET (SW + LW) (g–i) DREs at TOA (black), SURF (purple), NETSURF (blue) and ATM (red) averaged over the NSD (a, d, g), SDD (b, e, h) and MSD (c, f, i) domains. The calculated DREs correspond to the mean values calculated from the 20 simulated Mediterranean desert dust outbreaks, and the shaded areas represent the associated standard deviation.
The SW DREs (upper row in Fig. 5) are positive in the atmosphere (ATM, warming effect) and negative at the surface (SURF and NETSURF, cooling effect) throughout the entire forecast period, revealing a distinct diurnal cycle with marked maximum values around noon over all three domains. A careful look, however, reveals some differences between the sub-regions. Thus, in NSD (first column) and SDD (second column) the maximum DREATM values increase slightly with time from 22.3 to 22.7 W m−2 and from 29.1 to 31.6 W m−2, respectively, while in contrast they decrease in MSD (third column) from 21 to 18.5 W m−2. Respectively, the negative DRESURF values (surface cooling) reach down to −33.1 W m−2 in the NSD and 45.3 W m−2 in the SDD, while in the Mediterranean area reach down to −34.8 W m−2. In addition, the magnitude of DRESURF and DRENETSURF values in NSD and MSD slightly decrease while an increasing trend (in absolute terms) is recorded in the SDD. The opposite tendencies found for both sub-regions (i.e. SDD and MSD) for the atmospheric and surface DREs are attributed to the increase and decrease in dust AOD over the Sahara (Fig. S22ii) and the Mediterranean (Fig. S22i), respectively. As it concerns the SW DRENETSURF values, their temporal variation is identical to the corresponding ones for DRESURF; however, the former ones are lower by up to 14.6 W m−2, in absolute terms. The most noticeable difference between the two sub-domains (i.e. SDD and MSD) is encountered for the DRETOA at noon. Over bright desert surfaces, dust outbreaks warm the Earth–atmosphere system as indicated by the positive DRETOA values (up to 3.2 W m−2) while over the darker (mostly covered by sea) surfaces of the Mediterranean, the mineral particles induce a planetary cooling, with DRETOA values ranging from −12 to −4 W m−2. In both sub-domains, the strongest planetary cooling is found at early morning and afternoon hours with negative SW DRETOA values down to −11.9 and −11.6 W m−2 over the Sahara and Mediterranean, respectively. On the contrary, DRETOA values decrease towards noon, due to increasing solar absorption and decreasing scattering by dust under smaller solar zenith angles. Finally, the regional SW DREs have also been analysed separately over land and sea surfaces for the three sub-domains (results not shown here) revealing that the computed DREs are mainly driven by the corresponding perturbations simulated over continental regions.
Table 2Mean and standard deviation of all-sky DRETOA, DRESURF, DRENETSURF and DREATM values, over the simulation period (84 h), calculated in the NSD, SDD and MSD domains for the SW, LW and NET radiation. Bold and italic fonts indicate negative (cooling effect) and positive (warming effect) DREs, respectively.
The regional all-sky DREs have been also computed for the LW spectrum (middle row in Fig. 5), revealing reverse effects of lower magnitude (in absolute terms) with respect to the corresponding ones found at short wavelengths. Due to the emission of LW radiation by the mineral particles, desert dust outbreaks induce an atmospheric cooling (negative LW DREATM values) and increase the amount of the downward LW radiation at the surface (positive LW DRESURF values). Both DREATM and DRESURF levels do not reveal remarkable temporal variation ranging from −4.8 to −2.2 W m−2 and from 1.4 to 3.7 W m−2, respectively, over the Sahara where the maximum values are found. On the contrary, the time series of the LW DREs for TOA and NETSURF shows evidence of the existence of a diurnal cycle with maximum and minimum values around noon and during night-time, respectively. Moreover, both DRETOA and DRENETSURF values are higher than zero, throughout the simulation period, indicating a warming LW radiative effect. More specifically, the regional LW DRETOA ranges from 0.2 to 1.6 W m−2 and DRENETSURF varies between 1.7 and 4 W m−2 for the whole simulation domain (NSD). The corresponding maximum DREs for the SDD and MSD are higher by up to 3.6 W m−2 and lower by up to 1.1 W m−2, respectively. Dust aerosols act like greenhouse gases (Miller and Tegen, 1998), trapping the outgoing terrestrial radiation while at the same time emitting radiation at longer wavelengths back to the ground and thus explaining the positive LW DREs for TOA (planetary warming) and NETSURF (surface warming). In addition, the aforementioned LW DREs (TOA and NETSURF) covary with time, revealing that the sign and the magnitude of the LW DRETOA are determined by the perturbation of the surface radiation budget (LW DRENETSURF) since the LW DREATM values are almost constant throughout the simulation period. This is in contrast to the corresponding finding for the SW radiation where the dust outbreaks' impact on the Earth–atmosphere system's radiation budget is regulated by the perturbation of the radiation fields in the atmosphere (ATM) and at the surface (NETSURF). Finally, between SDD and MSD remarkably stronger LW DREs are found for the former domain due to the higher dust loads over the Sahara as well as due to the larger size of mineral particles close to the source areas.
As has been shown from the above analysis, the dust DREs between short and long wavelengths are reversed (except at TOA over the Sahara around midday), and in order to assess the impact of desert dust outbreaks in the whole spectrum the regional all-sky NET (SW + LW) DREs have been also analysed (bottom row in Fig. 5). During sunlight hours, the NET DREs result from the compensation of the SW and LW effects while during night-time the NET and the LW DREs are equal, attributed to the absence of SW radiation. Based on our results, in the NSD, the DRETOA, DRESURF, DRENETSURF and DREATM range from −8.5 to 0.5 W m−2, from −31.6 to 2.1 W m−2, from −22.2 to 2.2 W m−2 and from −1.7 to 20.4 W m−2, respectively. In the SDD, the corresponding NET DREs vary from −9.3 to 5.9 W m−2, from −42.2 to 3.5 W m−2, from −23 to 3.6 W m−2 and from −3.5 to 27.2 W m−2, respectively. Over the Mediterranean, the DREs for TOA range from −10.7 to 0.5 W m−2, for SURF from −33.6 to 1.7 W m−2, for NETSURF from −26.7 to 1.7 W m−2 and for ATM from −1.3 to 19.3 W m−2.
At noon, the SW planetary cooling dominates over the LW planetary warming, thus resulting in negative DRETOA values over the simulation (NSD) and the Mediterranean (MSD) domains. On the contrary, in the SDD, both SW and LW DRETOA are positive due to the higher surface albedo and the trapping of the surface upward LW radiation by mineral particles, respectively, leading to a net warming of the Earth–atmosphere system. In the atmosphere, for the three domains, the negative LW DREs offset the positive SW ones by about 8–26 %, resulting in an overall warming effect (positive NET DREATM) around midday. Moreover, at noon, the increase in the absorbed LW radiation at the ground level offsets the decrease in the absorbed SW radiation by about 14–18 % resulting in a NET surface cooling (negative NET DRENETSURF) over the simulation domain. The corresponding levels for the SDD and MSD vary from 24 to 26 % and from 9 to 13 %, respectively.
Beyond the hourly and day-to-day variability of dust DREs, the results were averaged over the total 84 h simulation period and the results are given, for the three domains, in Table 2, separately for the SW, LW and NET radiation. At TOA, desert dust outbreaks cause a net planetary cooling with all-sky NET DRETOA values equal to −2.6 ± 3.2, −1.3 ± 5 and −3.8 ± 3.8 W m−2 for the NSD, SDD and MSD, respectively. Note that due to the very strong temporal variability of DREs at TOA, the computed standard deviations are higher than the averages in the NSD and SDD in contrast to MSD where they are equal. The negative averaged NET DRETOA in SDD is attributed to the planetary cooling found at early morning and afternoon hours. Wang et al. (2011) showed that when solar altitude is low (i.e. high solar zenith angle) DRE at TOA is getting negative even over high-albedo deserts. Similar results reported also by Banks et al. (2014), who studied the day-time cycle of dust DREs during the Fennec campaign held in the central Sahara in June 2011. Our results for the DRETOA in the MSD are within the ranges reported in previous studies (e.g. Valenzuela et al., 2012; Sicard et al., 2014a, b) dealing with dust intrusions in the Mediterranean. In the atmosphere, mineral particles cause an overall atmospheric warming with NET DREATM levels varying from 6.9 ± 8.3 (MSD) to 7.8 ± 11.7 W m−2 (SDD). On average, dust outbreaks reduce the downwelling NET radiation at the ground level (DRESURF) by up to −14.7 ± 14.6 W m−2 (NSD), −18.0 ± 19.3 W m−2 (SDD) and −14.2 ± 14 W m−2 (MSD) while the corresponding DRENETSURF levels are equal to −9.6 ± 10.2 W m−2, −9.1 ± 11.2 W m−2 and −10.8 ± 11.2 W m−2, respectively. Our results for the SW and LW radiation in the SDD are in a good agreement with the annual averages for the year 2008 presented by Nabat et al. (2012) over northern Africa.
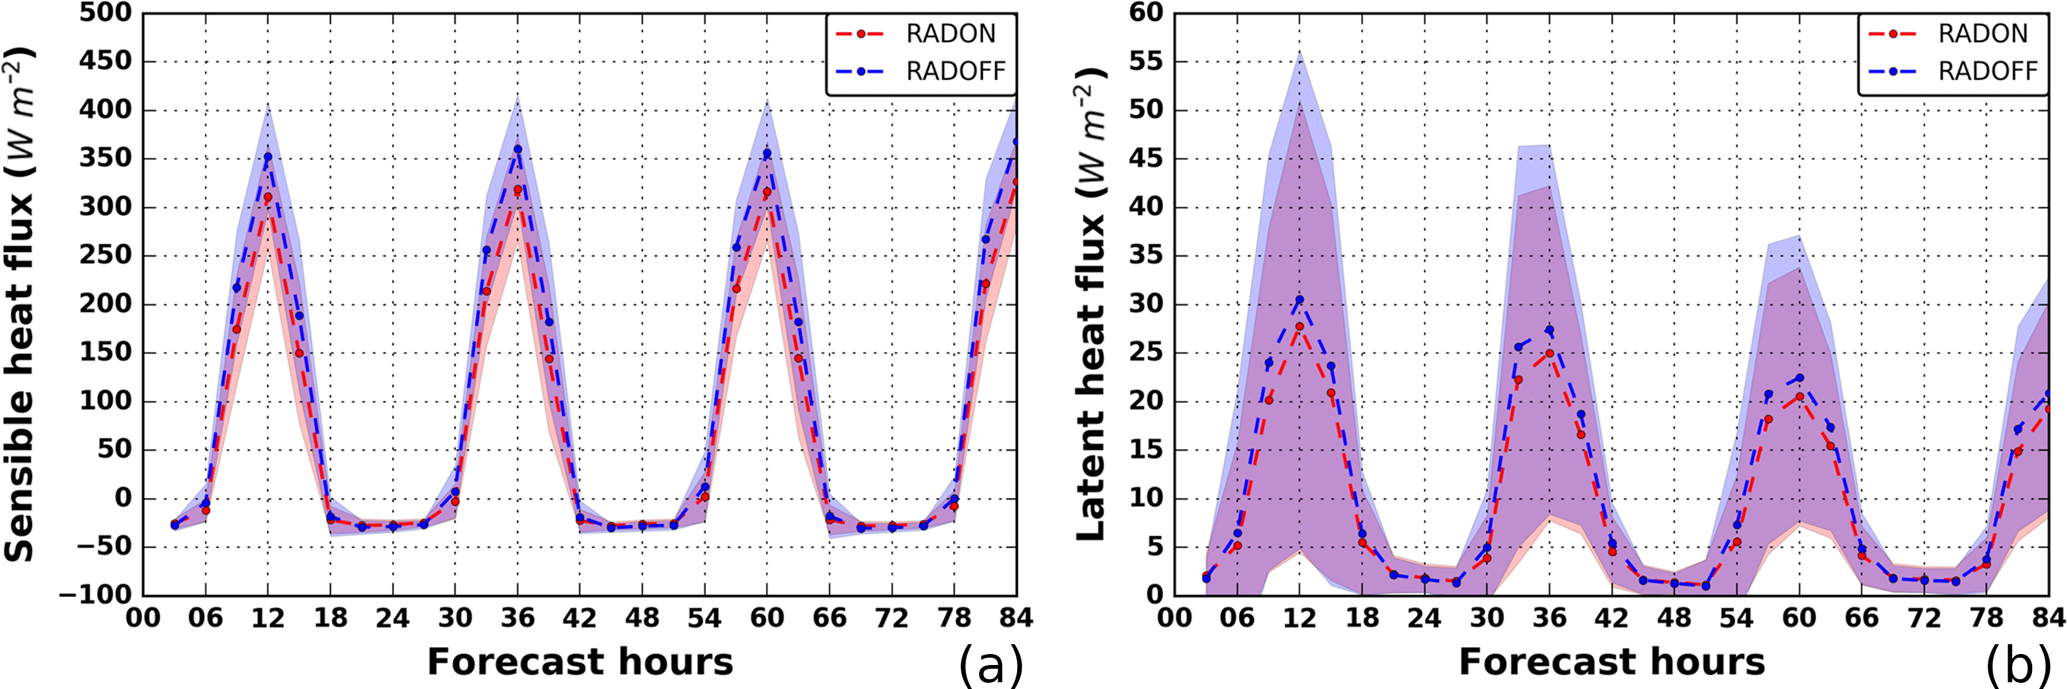
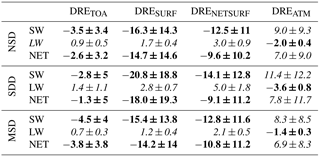
Figure 6Regional averaged values, over land areas of the simulation domain affected by dust loads, of the (a) sensible and (b) latent heat fluxes, expressed in watts per square metre (W m−2), based on the RADON (red) and the RADOFF (blue) configuration of the NMMB-MONARCH model. The dashed lines correspond to the mean values calculated by the 20 simulated Mediterranean desert dust outbreaks and the shaded areas represent the associated standard deviation.
5.3 Impact on sensible and latent heat fluxes
As has been shown in previous sections, dust outbreaks exert a strong perturbation of the surface radiation budget by reducing and increasing the absorbed NET radiation at the ground level during day-time and night-time, respectively. As a response to these disturbances, the surface heat fluxes, both sensible (SH) and latent (LE), associated with the transfer of energy (heat) and moisture between surface and atmosphere, also change in order to balance the gain or the loss of energy at the ground level (Miller and Tegen, 1998). Subsequently, variations of SH and LE have an impact on the components of the hydrological cycle (Miller et al., 2004b) as well as on the turbulent kinetic energy and momentum transfer which in turn affect near-surface winds and dust emission (Pérez et al., 2006). Moreover, Marcella and Eltahir (2014) and Kumar et al. (2014) have shown that due to the presence of dust aerosols in the atmosphere, the day-time surface sensible heat fluxes are reduced, leading to a reduction in the planetary boundary layer (PBL) height.
Here, we are investigating the impact of desert dust outbreaks on SH and LE over the simulation domain (NSD). It must be clarified that our analysis is restricted only above land areas since we are looking at short-range effects and the atmospheric driver is not coupled with an ocean model. The time series of the regional SH and LE values, over the forecast period, based on the RADON (red curve) and RADOFF (blue curve) configurations of the model are presented in Fig. 6a (for SH) and Fig. 6b (for LE). Each curve corresponds to the mean levels calculated from the 20 desert dust outbreaks while the shaded areas represent the associated standard deviations. According to our results, SH is characterized by a diurnal variation with maximum values (∼ 350 W m−2) at noon and minimum ones (∼ −30 W m−2) during night-time (Fig. 6a). Nevertheless, during sunlight hours, the surface sensible heat fluxes simulated in the RADON experiment are lower by up to 45 W m−2 in comparison to the RADOFF outputs. At night, an opposite tendency is recorded and the RADON SH fluxes are higher by up to 2 W m−2 than the corresponding fluxes based on the RADOFF configuration of the model. The reverse effects on SH levels, over the western parts of the Sahara, between day-time and night-time as well as the diurnal variability of their magnitude have been pointed out by Zhao et al. (2011). Based on the paired t test, the differences between RADOFF and RADON SH values are statistically significant at 95 % confidence level throughout the forecast period. At local scale (geographical distributions), among the studied cases, in areas where the desert dust outbreaks' intensity is maximized, the SH fluxes are reduced by up to 150 W m−2 during day-time and increased by up to 50 W m−2 during night-time. Our findings are consistent with those presented by Mallet et al. (2009) and Rémy et al. (2015), who analysed the impact of dust storms on sensible heat fluxes over western Africa and Mediterranean, respectively, and substantially higher than the instantaneous perturbations of SH calculated by Kumar et al. (2014), who studied a dust outbreak that occurred in northern India (17–22 April 2010).

Figure 7Spatial patterns of temperature differences at 2 m, between the RADON and RADOFF configuration of the NMMB-MONARCH model, for the (a) 12, (b) 24, (c) 36 and (d) 48 h forecast of the 00:00 UTC cycle on 2 August 2012.
Figure 8Altitude–latitude cross sections (up to 8 km a.m.s.l.) simulated by the NMMB-MONARCH model of the (a, b) dust concentration (in kg m−3) and (c, d) RADON-RADOFF temperature anomalies (in K) on (a, c) 4 April 2003 at 12:00 UTC along the meridional 30∘ E and (b, d) 7 March 2009 00:00 UTC along the meridional 10∘ E.

Figure 9(a) Regional dust AOD at 550 nm averaged over the simulation domain (NSD) and (b) regional dust emission (in kg m−2) aggregated over the simulation domain (NSD). Blue and red curves correspond to the mean values, calculated from the 20 desert dust outbreaks, for the RADOFF and RADON simulations, respectively, and the shaded areas represent the associated standard deviation.
The diurnal variation of the latent heat fluxes (Fig. 6b) is identical to that of sensible heat fluxes; however, LE levels are remarkably lower than the regional averages of SH. This is attributed to the lower soil water content and limited evaporation in arid regions (Ling et al., 2014). Based on our simulations, LE values at noon gradually decrease both for the RADOFF (blue) and RADON (red) experiments over the forecast period, attributed to the too-moist initialization of the model (note that the model is initialized with FNL analysis produced by a different model; GFS). Nevertheless, the latter LE values are lower than the former ones by up to 4 W m−2, indicating that desert dust outbreaks reduce the latent heat fluxes leaving from the ground. The reliability of this finding is further supported by the fact that the RADOFF–RADON differences are statistically significant at 95 % confidence level. During night-time, the RADON LE values are slightly higher (less than 0.5 W m−2) with respect to the corresponding ones simulated in the RADOFF configuration. The instantaneous reduction and increase in LE (results not shown here) can be as large as −100 and 20–30 W m−2, respectively. Finally, in contrast to SH, the spatial features of LE anomalies are not identical to those of DRENETSURF since other parameters (e.g. soil moisture) also regulate the latent heat fluxes (Marcella and Eltahir, 2014).
5.4 Impact on temperature fields
Through the perturbation of the radiation it is expected that desert dust outbreaks will also affect the temperature fields. In order to quantify these impacts, the temperature differences between the RADON and RADOFF simulations, both at 2 m and in vertical, are analysed. Figure 7 displays the RADON-RADOFF anomaly maps of temperature at 2 m at 12 (a), 24 (b), 36 (c) and 48 h (d) after the initialization of the forecast period on 2 August 2012 at 00:00 UTC. At noon, the highest negative biases (down to −4 K) are observed over land areas where the intensity of dust loads is high (see the first and third row in the first column in Fig. 4) due to the strong reduction of the NET radiation reaching the ground by the mineral particles. Similar findings, under dust episode conditions, have been also reported by previous studies conducted for the Mediterranean (Pérez et al., 2006), across the Sahara (Helmert et al., 2007; Heinold et al., 2008; Stanelle et al., 2010) and in East Asia (Kumar et al., 2014; Ling et al., 2014). Over dust-affected maritime areas, due to the higher heat capacity of the sea, the temperature differences between the RADON and RADOFF experiments are almost negligible at these timescales. During night-time, dust aerosols emit radiation at thermal wavelengths, thus increasing the near-surface temperature when the dust–radiation interactions are included in the numerical simulations (RADON experiment). For this reason, the RADON-RADOFF temperature differences at 2 m become positive (up to 4 K) at 24 and 48 forecast hours over land areas where the “core” of the dust plume is observed. The reduction and the increase in the near-surface temperature during day-time and night-time, respectively, either solely or as a combined result, indicate that the temperature diurnal range is reduced due to desert dust outbreaks.
The vertical distribution of dust layers determines their impacts on radiation with altitude which in turn modify the temperature profiles (Meloni et al., 2015) and subsequently affect convection (Ji et al., 2015), cloud development (Yin and Chen, 2007), precipitation (Yin et al., 2002) and wind profiles (Choobari et al., 2012). In order to investigate the impacts of desert dust outbreaks on temperature fields in the atmosphere, we have reproduced the altitude–latitude cross sections (up to 8 km above mean sea level, a.m.s.l.) of RADON-RADOFF temperature differences on 4 April 2003 at 12:00 UTC along the meridional 30∘ E (Fig. 8c) and on 7 March 2009 at 00:00 UTC along the meridional 10∘ E (Fig. 8d). In addition, the corresponding cross sections of dust concentration (in kg m−3) are shown in Fig. 8a and b, respectively. At midday, an elevated dust layer extends from 1.5 to 6 km a.m.s.l., between 23 and 33∘ N, with dust concentrations up to 0.8 × 10⁻⁶ kg m−3 while a low elevated dust layer extends from the surface up to 1.5 km a.m.s.l., between 27 and 31∘ N, with concentrations up to 10−6 kg m−3 (Fig. 8a). Along the cross section, the simulated columnar dust AOD at 550 nm reaches up to 1.21. Based on the cross section of temperature differences (Fig. 8c), dust aerosols via the absorption of solar radiation warm the atmospheric layers by up to 0.8–0.9 K between altitudes where the high-elevated dust layer is located. On the contrary, below the dust cloud, mineral particles cool the lowest tropospheric levels (by up to 1.3 K) by attenuating the incoming solar radiation. Note that between the parallels 31 and 35∘ N, where dust loads are recorded at low altitudes (below 2 km), higher temperatures by up to 0.3 K are simulated in the RADON experiment with respect to RADOFF, thus revealing an atmospheric warming near the surface. Also, it must be considered that in this area mineral particles are suspended over sea, where the impacts on sensible heat fluxes are negligible, therefore making evident the dust warming effect at low atmospheric levels in contrast to land areas (parallels between 27 and 31∘ N), where the near-surface temperature is reduced because of the reduction of the sensible heat fluxes, as has also been shown by Pérez et al. (2006, Fig. 10). Therefore, the vertical distribution of dust loads plays a significant role regarding their impact on near-surface temperature which in turn may affect winds and subsequently dust emission (Stanele et al., 2010; Huang et al., 2014). Above the high-elevated dust layer, negative RADON-RADOFF temperature differences (down to −0.3 K) are found, indicating an atmospheric cooling attributed to the dust albedo effect (Spyrou et al., 2013).
In the second example, on 7 March 2009 at 00:00 UTC, a dust layer extends from the southern parts of the NSD domain to the northern parts of Tunisia, between the surface and 4 km a.m.s.l. (Fig. 8b). Along the dust plume, with AODs reaching up to 1.40, moderate concentrations (up to 0.5 × 10⁻⁶ kg m−3) are simulated between 15 and 20∘ N, being low (less than 0.2 × 10⁻⁶ kg m−3) between 20 and 25∘ N while the maximum ones (higher than 2 × 10⁻⁶ kg m−3) are recorded between 25 and 35∘ N. Due to the emission of LW radiation by mineral particles, dust aerosols cool the atmospheric layers (Otto et al., 2007) in which they reside, by up to 0.8 K, and increase the temperature, by up to 0.4 K, just above the dust layer. Between the bottom of the dust layer and surface, positive RADON-RADOFF temperature differences (i.e. warming) up to 1.2 K are calculated, as indicated by the red colours following the model topography (grey shaded). Nevertheless, this near-surface warming is “interrupted”, being null or even reverse (i.e. cooling), in areas where the dust layer abuts the ground.
5.5 Feedbacks on dust emission and dust aerosol optical depth
In the present section, focus is put on the investigation of the potential feedbacks on dust AOD (at 550 nm) and dust emissions attributed to dust radiative effects. To this end, the time series of the regional averages and the associated standard deviations throughout the forecast period (84 h), calculated from the 20 desert dust outbreaks for both parameters and based on the RADON (red) and RADOFF (blue) experiments, are analysed and the obtained results are shown in Fig. 9. Over the simulation period, the RADOFF dust AOD550 nm gradually increases from 0.31 to 0.34 in contrast to the corresponding outputs from RADON that are gradually decreasing down to 0.29 (Fig. 9a). The positive RADOFF–RADON differences of dust AOD, indicating a negative feedback when the dust–radiation interactions are considered in the numerical simulations, are becoming evident 12 h (0.005 or 2 %) after the initialization of the forecast period and amplify with time (up to 0.036 or 12 %), being also statistically significant (paired t test, confidence level at 95 %) at each forecast step. The observed negative feedbacks on dust AOD have been also pointed out in relevant studies (Pérez et al., 2006; Wang et al., 2010) carried out for specific desert dust outbreaks. Through the comparison of the mean dust AOD levels, calculated over the 84 h simulation period, based on RADON (0.288) and RADOFF (0.308) simulations, it is revealed a statistically significant reduction by 0.02 (6.9 %) attributed to the dust radiative effects. Among the 20 desert dust outbreaks, these reductions vary from 1 % (22 February 2004) to 12.5 % (27 January 2005) and are statistically significant at 95 % confidence level in all cases.
A similar analysis has been also made for the dust emissions (in kg m−2) aggregated over the whole simulation domain (NSD, outer domain in Fig. 1) and the overall results are given in Fig. 9b. Dust emissions are maximized around midday (Cowie et al., 2014) and are very weak during night-time. Based on the RADOFF simulation, the highest amounts of emitted dust are increased from 2 to 2.5 kg m−2 throughout the hindcast period. This increasing tendency is also encountered in the RADON experiment but the emitted dust amount is lower. The positive RADOFF–RADON anomalies during day-time range from 0.1 to 0.4 kg m−2 and are statistically significant at 95 % confidence level based on the paired t test. Therefore, desert dust outbreaks exert a negative feedback on dust emission, thus explaining the reduction of dust AOD. The lower amounts of emitted dust, modelled based on the RADON configuration, result from a chain of processes triggered by the surface cooling which decreases the turbulent flux of sensible heat into the atmosphere, weakening the turbulent mixing within the PBL and the downward transport of momentum to the surface and subsequently reduces surface wind speed and dust emission (Miller et al., 2004a; Pérez et al., 2006).
During the simulation period, the total emitted amount of desert dust (parentheses in the legend of Fig. 9b) is equal to 18.279 and 21.849 kg m−2 based on the RADON and RADOFF, respectively. Therefore, desert dust outbreaks cause a negative feedback on dust emissions, reducing them by 3.57 kg m−2 (−19.5 %). This reduction is consistent in all the studied cases of our analysis, varying from 0.6 kg m−2 (∼ 10 %, 24 February 2006) to 6.6 kg m−2 (∼ 34 %, 2 August 2012). Negative feedbacks on dust AOD and dust emissions have been also pointed out in previous studies based on short- (e.g. Ahn et al., 2007; Rémy et al., 2015) and long-term (e.g. Perlwitz et al., 2001; Zhang et al., 2009) simulations. Woodage and Woodward (2014) relied on climatic simulations of the HiGEM model and found a positive feedback on global dust emissions which is in contradiction with findings reported in the majority of the existing studies. The authors claimed that this discrepancy could be explained by the absence of mineral particles with a radius larger than 10 µm in the emitted dust size distribution, thus leading to an underestimation of the LW effects. It must be clarified that according to our results negative feedbacks on dust emission are found at a regional scale. Stanelle et al. (2010) showed that the vertical distribution of dust aerosols determines their impacts on atmospheric stability and wind patterns and subsequently the associated feedbacks on dust emissions which can even be positive at a local scale. This highlights the importance of studying the potential feedbacks on mineral particles' loads as well as on their emissions spatially by analysing all the contributor factors.
5.6 Assessment of the radiation at the ground level
The performance of the NMMB-MONARCH model in terms of reproducing the downward SW and LW radiation is assessed using as reference data ground measurements derived from the Baseline Surface Radiation Network (BSRN, Ohmura et al., 1998). Through this analysis an attempt was made to quantify objectively the potential improvements of the model's predictive skills attributed to the inclusion of the dust radiative effects in the numerical simulations. Globally, 59 BSRN stations are installed at different climatic zones providing radiation measurements (http://bsrn.awi.de/, last access: 14 June 2018) of high accuracy at very high temporal resolution (1 min) (Roesch et al., 2011). For the evaluation analysis, we have used the global (direct and diffuse) shortwave and longwave downwelling radiation at the ground level measured at 6 stations (magenta star symbols in Fig. 1) located in Spain (Izana, Cener), France (Palaiseau, Carpentras), Algeria (Tamanrasset) and Israel (Sede Boker).

Figure 10Time series of the downwelling: (a, b) SW and (c, d) LW radiation measured at SEDE_BOKER (red line) and simulated based on the RADON (black line) and RADOFF (blue line) configuration of the NMMB-MONARCH model during the periods: (a, c, e) 22 February 2004 at 00:00 UTC–25 February 2004 at 12:00 UTC and (b, d, f) 21 April 2007 at 00:00 UTC–24 April 2007 at 12:00 UTC. The mean ground and modelled values along with the computed correlation coefficients (R) between RADON-BSRN and RADOFF-BSRN, both calculated over the simulation periods, are also provided. (e, f) Time series of the simulated dust AOD at 550 nm for the RADON (black line) and RADOFF (blue line) configuration of the NMMB-MONARCH model. The AERONET total AOD at 500 nm (red x symbols) and AERONET alpha (green x symbols) values are provided.
Figure 10 presents the time series of the measured (red curve) SW (a, b) and LW (c, d) radiation at SEDE_BOKER and the corresponding model outputs based on the RADON (black curve) and the RADOFF (blue curve) experiments, for the periods 22 February 2004 at 00:00 UTC–25 February 2004 at 12:00 UTC (a, c, e) and 21 April 2007 00:00 UTC–24 April 2007 12:00 UTC (b, d, f). Figure 10c–d show the temporal evolution of the model dust AOD550 nm and the Level 2 AERONET total AOD500 nm (red x symbols) retrieved via the O'Neill algorithm (O'Neill et al., 2003). Moreover, the AERONET Ångström exponent (alpha) retrievals (denoted with green x symbols) are used as an indicator of coarse or fine particles' predominance in the atmosphere. For the comparison between model and observations, the nearest grid point to the stations' coordinates is utilized. In SEDE_BOKER, the model's grid point elevation is 465 m, being slightly lower than the AERONET (480 m) and BSRN (500 m) stations, and therefore these small altitude differences do not substantially affect the intercomparison results. Likewise, the SW and LW radiation are measured from 0.295 to 2.8 µm and from 4 to 50 µm, respectively, while the spectral intervals in the model's radiation transfer scheme span from 0.2 to 12.2 µm and from 3.3 to 1000 µm in the shortwave and longwave spectrum, respectively. These differences might contribute to the level of agreement between model and observations; however, they are not discussed in our evaluation analysis.
In both examples presented here, but also for the rest of our dataset, the model captures better the temporal variation of the downwelling SW in contrast to the LW radiation at the ground level with correlation coefficients (R) higher than 0.96 and between 0.63 and 0.85, respectively. However, the model-BSRN biases vary strongly in temporal terms because of the inability of the model to adequately reproduce the amount of the suspended mineral particles. For the first desert dust outbreak (left column in Fig. 10), during the first forecast day, the maximum measured SW radiation is higher by about 150 W m−2 than the simulated RADON outputs and slightly lower than the corresponding RADOFF levels. The former is explained by the facts that the model reproduces the dust peak earlier than actually recorded according to AERONET observations (see Fig. 10e) and it develops low-level clouds (cloud fractions between 0.5 and 0.6) while the latter one is attributed to the absence of radiative effects. For the rest of the simulation period, the model overestimates and underestimates the shortwave and longwave radiation, respectively, due to its deficiency to reproduce (underestimation) the amount of dust aerosols. More specifically, based on AERONET retrievals, AOD and alpha levels vary from 0.2 to 0.4 and from 0.2 to 0.7, respectively, indicating the existence of dust loads of moderate intensity. On the contrary, the simulated dust AOD at 550 is less than 0.1 in both model configurations characterized by a “flat” behaviour in temporal terms. Over the simulation period (22 February 2004 at 00:00 UTC–25 February 2004 at 12:00 UTC), the mean SW (LW) radiation based on BSRN, RADON and RADOFF is equal to 221.6 (290.0), 255.4 (266.4) and 272.7 (264.7 W m−2), respectively. Thanks to the consideration of the dust radiative effects, the positive model-BSRN biases in the shortwave spectrum are reduced from 51.1 (RADOFF-BSRN) to 33.9 W m−2 (RADON-BSRN) while the negative model-BSRN biases in the longwave spectrum are reduced from −25.3 (RADOFF-BSRN) to −23.6 W m−2 (RADON-BSRN).
In the second case which is analysed (right column in Fig. 10), two peaks are simulated with dust AOD550 nm values up to 0.9 (midday on 23 April 2007) and 0.5 (afternoon on 21 April 2007). For the major one, the model clearly overestimates aerosol optical depth with respect to AERONET retrievals in which AOD (red x symbols) varies between 0.2 and 0.3 and alpha (green x symbols) ranges from 0.3 to 0.5 while the second one cannot be confirmed due to the lack of ground observations. Note that between 09:00 and 15:00 UTC on 23 April 2007, the model underestimates the SW radiation by up to 200 W m−2 while it overestimates the LW radiation by up to 150 W m−2 (maximum overestimations throughout the simulation period) due to the misrepresentation of the dust AODs. Even higher model overestimations of the SW radiation are observed at 12:00 UTC on 22 April 2007, attributed mainly to the inability of the model to satisfactorily reproduce clouds, since the negative model–AERONET differences of AOD cannot explain these large discrepancies in radiation. Clouds play an important role in such comparisons, particularly when their features are not well reproduced by the model, leading to large overestimations or underestimations, by up to 600 W m−2 in absolute terms among the studied cases of the present analysis, as has been pointed out in previous studies (e.g. Spyrou et al., 2013). Finally, the model (RADON) overestimation of the SW radiation reaching the ground, by up to 200 W m−2 at 09:00 UTC on 21 April 2007, is probably associated with underestimation of the simulated dust AOD since fair weather conditions are forecasted and confirmed by the true colour MODIS-Terra images (http://modis-atmos.gsfc.nasa.gov/IMAGES/, last access: 14 June 2018). For the SW radiation, the positive NMMB-BSRN biases during the simulation period (21 April 2007 at 00:00 UTC–24 April 2007 at 12:00 UTC) are reduced from 69.0 to 40.9 W m−2 when dust–radiation interactions are activated (RADON) while lower positive biases for the LW radiation are calculated (0.7 W m−2) when dust–radiation interactions are deactivated (RADOFF). To summarize, in the majority of the studied desert dust outbreaks here, positive and negative model–observation biases are found for the downwelling SW (Table S2) and LW (Table S3) radiation, respectively, which are reduced when the dust–radiation interactions are activated. On the contrary, similar improvements are not evident on the correlation coefficients since there are no remarkable differences found between RADON-BSRN and RADOFF-BSRN R values (results not shown).
5.7 Assessment of the temperature fields versus analysis datasets
The forecasting performance of the NMMB-MONARCH model has been also assessed for the temperature fields, utilizing as reference final analyses (FNL) derived from the National Centers for Environmental Prediction database (http://rda.ucar.edu/, last access: 14 June 2018). The evaluation of both model configurations (RADON and RADOFF) against FNL temperature at 2 m and at 17 pressure levels in the atmosphere is made at a regional scale for the NSD. For the former intercomparison, only land grid points are taken into account, while for the latter one both continental and maritime areas are considered. The evaluation of the model is made by considering grid points where the dust AOD is higher than or equal to than 0.1, 0.5 and 1.0 for each domain. In order to overcome spatial inconsistencies between model and analyses, the model outputs have been regridded from their raw spatial resolution (0.25∘ × 0.25∘) to 1∘ × 1∘ to match FNL. We note that analyses datasets are only “best” estimates of the observed states of the atmosphere and the surface produced by combining a model (in this case GFS) and available observations through data assimilation techniques. Analysis datasets are more poorly constrained by observations over certain regions, including the arid and dusty ones, and more dependent on the model's behaviour. This is even more relevant for surface variables such as 2 m temperature, which may heavily depend on the underlying model's soil scheme.
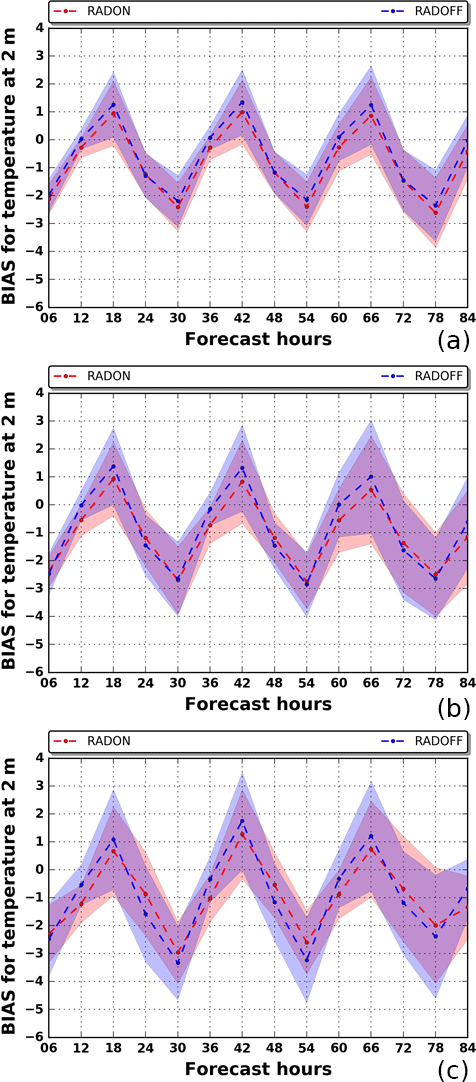
Figure 11Regional biases of temperature at 2 m between NMMB-MONARCH and FNL, at 1∘ × 1∘ spatial resolution, calculated over land grid points of the simulation domain (NSD) in which dust AOD at 550 nm is higher than or equal to (a) 0.1, (b) 0.5 and (c) 1.0.
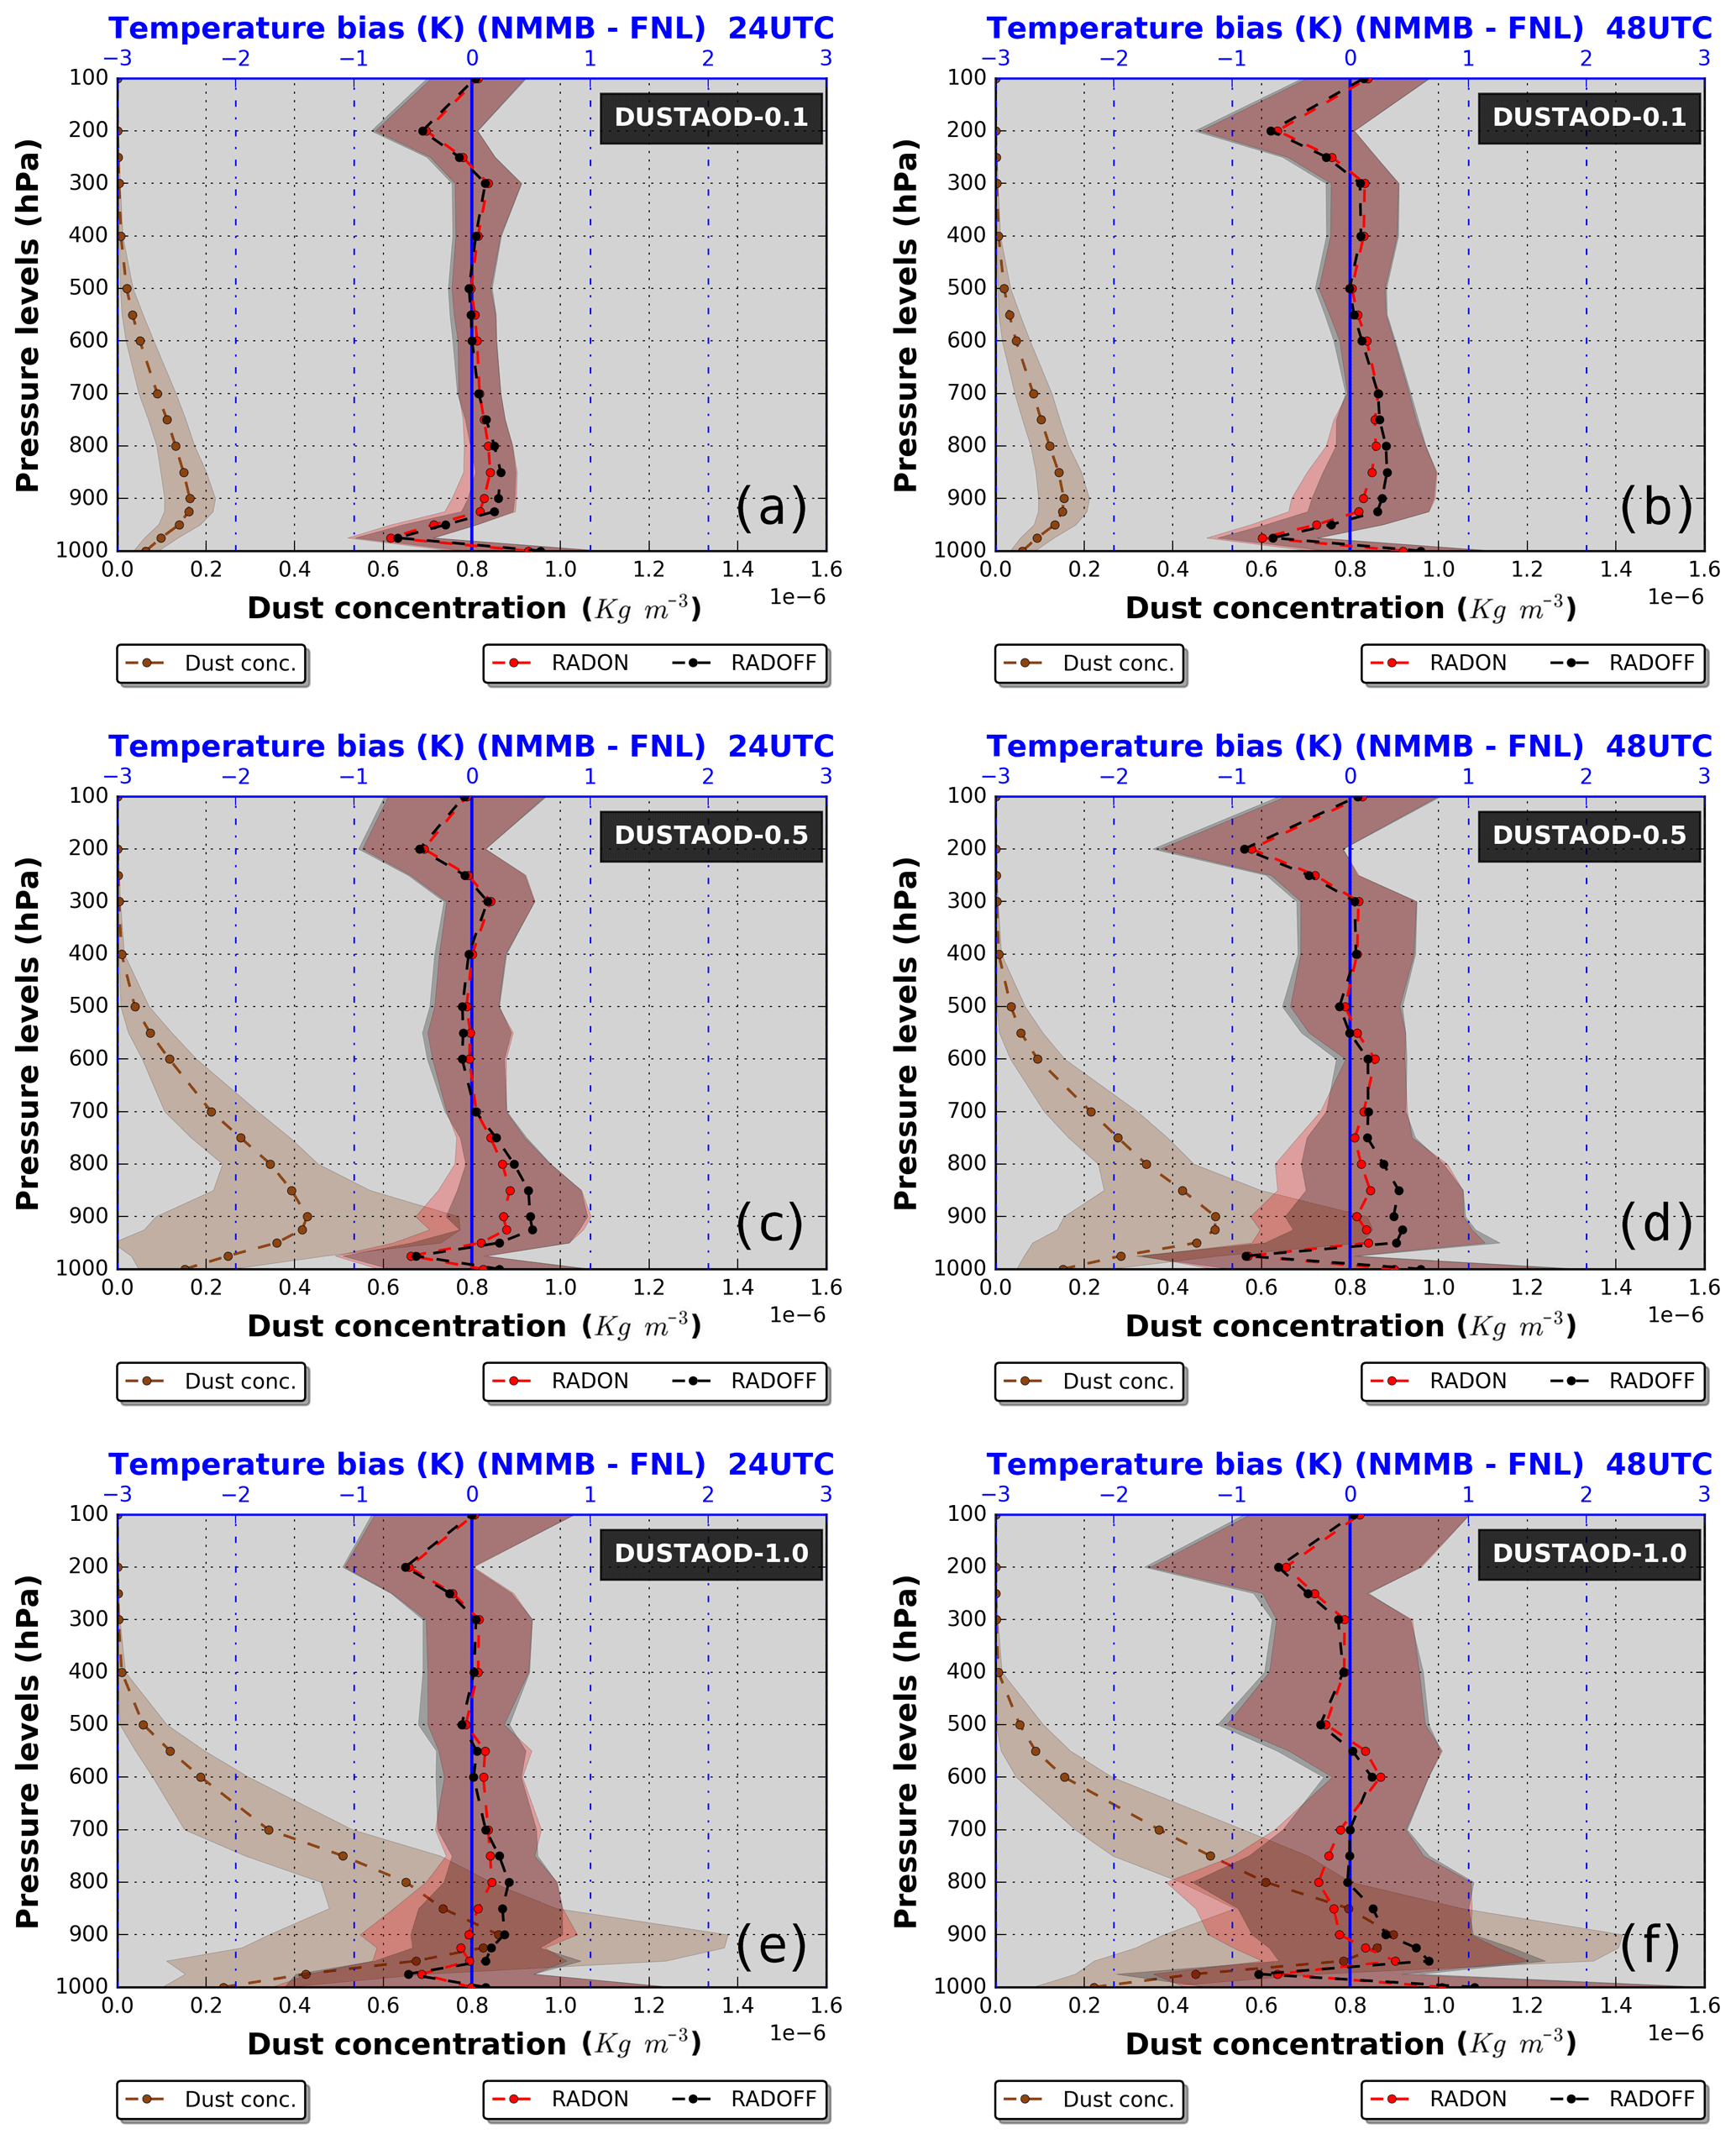
Figure 12Vertical profiles of the regional temperature RADON-FNL (red curve) and RADOFF-FNL (black curve) biases calculated over grid points (1∘ × 1∘ spatial resolution) where the dust AOD at 550 nm is higher than or equal to (a, b) 0.1, (c, d) 0.5 and (e, f) 1.0. In addition, the vertical profiles of the simulated dust concentration (in × 10−6 kg m−3) are provided (brown curve). Each profile corresponds to the mean value calculated from the 20 desert dust outbreaks which are considered while the shaded areas correspond to the associated standard deviations. The obtained results are valid (a, c, e) 24 and (c, d, f) 48 h after the initialization of the forecast period.
Figure 11 presents the regional biases (model-FNL) of temperature at 2 m for the RADON (red curve) and RADOFF (blue curve) experiments, averaged from the 20 desert dust outbreaks every 6 h of the hindcast period, considering only land grid points where the dust AOD is higher than or equal to (a) 0.1, (b) 0.5 and (c) 1.0. In order to avoid misleading interpretations, attributed to possible error compensations as a result of an erroneously representation of the dust patterns or optical properties (see Sect. 5.1), the corresponding root mean square error (RMSE) values have been calculated as well (Fig. S23). The combination of these two skill scores (bias and RMSE) can provide information regarding the model departures (i.e. cold or warm biases) and how “sensitive” the level of agreement between NMMB-FNL due to large errors is (outliers). Regardless of the dust AOD threshold, cold biases are found during night-time and early morning hours, warm biases are calculated in the afternoon and the minimum biases in absolute terms appear at noon. According to our results, under low desert dust conditions (Fig. 11a), the agreement between model and FNL is better when the dust radiative effects are neglected (RADOFF) during day-time, while slightly lower RADON-FNL biases compared to RADOFF-FNL ones are found during night-time. These trivial nocturnal “corrections” are not evident in the RMSE time series and therefore are not so trustworthy. At noon, the RADOFF-FNL biases are almost zero (less than 0.l K), whereas negative RADON-FNL biases (down to −0.27 K) are computed due to the surface cooling induced by the mineral particles. For moderate dust AODs (Fig. 11b), during night-time, the model-FNL temperature biases are lower, being in agreement also with the associated RMSE values (Fig. S23ii), for the RADON configuration (less than 1 K) in contrast to the RADOFF simulation (less than 1.4 K), and these improvements are statistically significant at 95 % confidence level. Nevertheless, at midday, the RADOFF-FNL biases are similar to those found for the lowest dust AOD threshold (Fig. 11a), while the model cold biases, varying from −1.15 K (84 h) to −0.55 K (12 h), are amplified when the dust–radiation interactions are activated (RADON). The “corrections” of the near-surface temperature forecasts during night-time become more evident and statistically significant, when only land areas affected by intense dust loads (dust AOD ≥ 1.0) are considered in the NMMB-FNL comparison. Under these high dust AODs, the increase in air temperature at 2 m due to the dust LW DREs reduces the existing cold biases and the RADON RMSE levels (Fig. S23iii). Therefore, the improvements in model's ability to predict temperature at 2 m when accounting for dust–radiation interactions are more evident when the intensity of dust loads increases.
The potential impacts of the dust radiative effects' inclusion on the model's forecasting ability have been also investigated for the temperature fields in vertical. For this purpose, from the 20 desert dust outbreaks, the temperature model-FNL biases at 17 pressure levels (from 1000 to 100 hPa) have been calculated for the RADOFF (black curve) and RADON (red curve) and the obtained results are illustrated in Fig. 12. The corresponding vertical profiles for the RMSE are given in Fig. S24. The assessment results are presented only 24 (a) and 48 (b) hours after the initialization of the forecast period since no remarkable differences between the two model configurations at noon (i.e. 12:00 and 12:00 UTC the next day) are found.
Based on our findings, model warm biases are found between 950 and 700 hPa where most of the dust is confined (brown curve). For the lowest dust AOD threshold, these positive model-FNL biases reach up to 0.245 and 0.313 K at 24 and 48 forecast hours, respectively, when mineral particles are not treated as radiatively active substance (RADOFF). On the contrary, when dust–radiation interactions are activated (RADON) the corresponding biases are reduced down to 0.155 and 0.239 K, respectively, indicating a better model performance, which is further supported by the fact that these improvements are statistically significant (95 % confidence level). In addition, slightly lower RMSEs are also calculated for the RADON configuration between 925 and 700 hPa (Fig. S24i). Similar but more evident results are found when the dust AOD threshold increases from 0.1 to 0.5 (middle row in Figs. 12 and S24ii). More specifically, at 24 forecast hours, the RADON-FNL temperature differences do not exceed 0.321 K in contrast to the corresponding biases between RADOFF and FNL which can be as high as 0.512 K. At 48 forecast hours, between altitudes where the dust concentrations are maximized, the red curve (RADON-FNL) is close to the blue thick line which represents the ideal score (i.e. zero biases), while the RADOFF warm biases can reach up to 0.443 K. As has been shown in Sect. 5.4 (see Fig. 8d), due to the emission of longwave radiation by the mineral particles there is a temperature reduction within the atmospheric layers in which they are confined and a slight warming above the dust layer. The former effect explains the statistically significant reduction of the model warm biases between 950 and 700 hPa, whereas the latter one could explain the slight statistically significant reduction of the model cold biases recorded between 600 and 500 hPa (see Fig. 12c). According to the RMSE vertical profiles, between the two altitude ranges (950–700 and 600–500 hPa), the better performance of the RADON configuration is evident only at pressure levels where the main amount of dust is simulated (Fig. S24iia and iib). For the highest dust AOD threshold, at 24 forecast hours (Fig. 12e), the agreement of temperature profiles between RADON and FNL is better compared to RADOFF-FNL whereas at 48 forecast hours depends on altitude (Fig. 12f). To summarize, thanks to the consideration of the dust radiative effects the predictive skills of the NMMB-MONARCH model in terms of reproducing temperature fields within the atmosphere are improved as has also been pointed in previous relevant studies (Pérez et al., 2006; Wang et al., 2010; Wang and Niu, 2013). However, the improvements are relatively small. The consideration of dust–radiation interactions does not always lead to a better model performance since other model first-order errors may dominate over the expected improvements. Also, the representation of dust plumes' spatiotemporal features and optical properties, particularly the AOD and SSA, may produce double penalty effects. In this sense, the enhancement of dust forecasts via data assimilation techniques may significantly improve the results.
In the present study, the direct radiative effects during 20 intense and widespread Mediterranean desert dust outbreaks, that took place during the period March 2000–February 2013, have been analysed based on short-term (84 h) regional simulations of the NMMB-MONARCH model. The identification of desert dust outbreaks has been accomplished via an objective and dynamic algorithm utilizing as inputs daily 1∘ × 1∘ satellite retrievals providing information about aerosols' load, size and nature. DREs have been calculated at the top of the atmosphere, in the atmosphere, and at the surface, for the downwelling and the absorbed radiation, for the shortwave, longwave and NET radiation. At a further step, the impacts on sensible and latent heat fluxes as well as on temperature at 2 m and in the atmosphere have been investigated. Moreover, the potential feedbacks on dust emission and dust AOD have been assessed at regional scale, representative of the simulation domain used in our experiments. In the last part of our study, focus was put on the potential improvements to model's predictive skills, attributed to the inclusion of dust radiative effects in the numerical simulations, in terms of reproducing the downward SW and LW radiation at the ground level as well as the temperature fields. The main findings obtained from the present analysis are summarized below.
6.1 Direct radiative effects
-
DREs in the atmosphere and at the surface are driven by the dust outbreaks' spatial features, whereas at TOA the surface albedo plays a crucial role, particularly under clear sky conditions.
-
At noon, dust outbreaks induce a strong surface cooling with instantaneous NET DRESURF and DRENETSURF values down to −589 and −337 W m−2, respectively.
-
Through the absorption of the incoming solar radiation by the mineral particles, dust outbreaks cause a strong atmospheric warming effect (by up to 319 W m−2) around midday.
-
At TOA, during day-time, positive DREs up to 85 W m−2 (planetary warming) are found over highly reflective areas while negative DREs down to −184 W m−2 (planetary cooling) are computed over dark surfaces.
-
During night-time, reverse effects of lower magnitude are found in the atmosphere and at the surface, with maximum instantaneous NET DRESURF, DRENETSURF and DREATM values equal to 83, 50 and −61 W m−2 whereas at TOA due to the offset of the atmospheric cooling by the surface warming, the DRETOA values are almost negligible (less than 10 W m−2).
-
The regional NET all-sky DREs for the NSD range from −8.5 to 0.5 W m−2, from −31.6 to 2.1 W m−2, from −22.2 to 2.2 W m−2 and from −1.7 to 20.4 W m−2for TOA, SURF, NETSURF and ATM, respectively.
-
The contribution of the LW DREs to the NET ones is comparable or even larger, particularly over the Sahara at midday.
6.2 Sensible and latent heat fluxes
-
As a response to the surface radiation budget perturbations, desert dust outbreaks reduce the sensible heat fluxes (regional averages taking into account only land grid points) by up to 45 W m−2 during day-time while reverse tendencies of lower magnitudes are found during night-time (2 W m−2).
-
Locally, the aforementioned values can reach down to −150 W m−2 and up to 50 W m−2.
-
At noon, dust outbreaks also reduce the surface latent heat fluxes by up to 4 and 100 W m−2 at a regional and grid point level, respectively. At night, the regional and the instantaneous LE levels are increased by up to 0.5 and 30 W m−2, respectively.
6.3 Impact on temperature fields
-
Due to the attenuation of the incoming solar radiation and the emission of radiation at thermal wavelengths, both induced by dust aerosols, temperature at 2 m reduces and increases during day and night, respectively, by up to 4 K in absolute terms in land areas where the dust loads are intense (AODs higher than 2).
-
At noon, dust outbreaks warm the atmosphere by up to 0.9 K between altitudes where elevated dust layers are located and cool the lowest tropospheric levels by up to 1.3 K, due to the reduced surface sensible heat fluxes.
-
Due to the emission of LW radiation and the trapping of the outgoing terrestrial radiation by dust aerosols, the nocturnal temperature decreases by up to 0.8 K in atmospheric altitudes where mineral particles are confined, whereas between the bottom of the dust layer and the surface, the air temperature increases by up to 1.2 K.
6.4 Feedbacks on dust AOD and dust emission
-
The total emitted amount of dust is reduced by 19.5 % (statistically significant at 95 % confidence level) over the forecast period when dust DREs are included in the numerical simulations, thus revealing a negative feedback on dust emissions.
-
Among the cases studied, the corresponding percentages range from −34 (2 August 2012) to −10 % (24 February 2006) and are statistically significant (95 % confidence level) in all cases.
-
As a consequence of the lower amount of mineral particles emitted in the atmosphere, negative feedbacks are also found on the mean regional dust AOD550 nm, which is decreased by 0.02 (6.9 %) with respect to the control experiment (RADOFF).
-
Statistically significant reductions of the regional dust AOD550 nm, varying from 1 % (22 February 2004) to 12.5 % (27 January 2005), are found in all the studied cases when dust–radiation interactions are activated (RADON).
6.5 Assessment of model's predictive skills
-
Through the evaluation of the model's forecast outputs of the SW and LW downwelling radiation at the ground level against surface measurements derived by the BSRN network, a reduction of the modelled positive (for SW) and negative (for LW) biases, attributed to the consideration of dust radiative effects, is revealed. However, the model's accuracy is critically affected by its ability to represent satisfactorily aerosols' and clouds' spatiotemporal features, thus highlighting their key role when such comparisons are attempted.
-
Under high dust load conditions (AODs higher than or equal to 0.5), the nocturnal model-FNL negative regional biases of temperature at 2 m are reduced by up to 0.5 K (95 % statistically significant) in the RADON experiment. On the contrary, these temperature “corrections” are not evident during day-time, thus revealing that other model errors (particularly those introduced by the soil model) can dominate over the expected improvements attributed to the consideration of dust–radiation interactions in the numerical simulations.
-
The model regional warm biases found at 24 and 48 h after the initialization of the forecast period, between pressure levels (950 and 700 hPa) where the dust concentration is maximized, are reduced by up to 0.4 K (95 % statistically significant) in the RADON experiment.
-
In general, the bias and RSME reductions achieved are relatively small. We recall that the model simulations show underestimation and spatiotemporal mismatches compared to MODIS. A future study may consider the potential benefit of AOD data assimilation in the model to better reproduce the magnitude and spatial features of the events and therefore to further improve the weather forecast itself.
The MODIS-Terra data were obtained from NASA's Level 1 and Atmosphere Archive and Distribution System (LAADS) website (ftp://ladsweb.nascom.nasa.gov/, last access: 14 June 2018). The Earth Probe (TOMS) and OMI aerosol climatology is available from the Mirador ftp server (http://mirador.gsfc.nasa.gov/, last access: 14 June 2018). Simulations were performed with the Marenostrum Supercomputer at the Barcelona Supercomputing Center (BSC). Radiation measurements from the Baseline Surface Radiation Network (BSRN) stations are accessible via the BSRN website (http://bsrn.awi.de/, last access: 14 June 2018). The aerosol data from the SEDE_BOKER station (PI: Arnon Karnieli) are available in the AERONET website (https://aeronet.gsfc.nasa.gov/, last access: 14 June 2018). Final analyses (FNL) have been derived from the National Centers for Environmental Prediction database (http://rda.ucar.edu/, last access: 14 June 2018).
The supplement related to this article is available online at: https://doi.org/10.5194/acp-18-8757-2018-supplement.
The authors declare that they have no conflict of interest.
The MDRAF project has received funding from the European Union's Seventh
Framework Programme for research, technological development and demonstration
under grant agreement no. 622662. Oriol Jorba and Sara Basart acknowledge the
grant CGL2013-46736 and the AXA Research Fund. Carlos Pérez
García-Pando acknowledges long-term support from the AXA Research Fund,
as well as the support received through the Ramón y Cajal programme
(grant RYC-2015-18690) and grant CGL2017-88911-R of the Spanish Ministry of
Economy and Competitiveness. The authors acknowledge support from the EU COST
Action CA16202 “International Network to Encourage the Use of Monitoring and
Forecasting Dust Products (InDust)”. Simulations were performed with the
Marenostrum Supercomputer at the Barcelona Supercomputing Center (BSC). We
would like to thank the principal investigators maintaining the BSRN sites
used in the present work. The authors would like thank the Arnon Karnieli for
his effort in establishing and maintaining SEDE_BOKER AERONET
site.
Edited by: Stelios Kazadzis
Reviewed by: three anonymous referees
Ahn, H. J., Park, S. U., and Chang, L. S.: Effect of direct radiative forcing of Asian dust on the meteorological fields in East Asia during an Asian dust event period, J. Appl. Meteorol., 46, 1655–1681, https://doi.org/10.1175/JAM2551.1, 2007.
Albrecht, B. A.: Aerosols, cloud microphysics, and fractional cloudiness, Science, 245, 1227–1230, 1989.
Antón, M., Valenzuela, A., Cazorla, A., Gil, J. E., Fernández-Gálvez, J., Lyamani, H., Foyo-Moreno, I., Olmo, F. J., and Alados-Arboledas, L.: Global and diffuse shortwave irradiance during a strong desert dust episode at Granada (Spain), Atmos. Res., 118, 232–239, https://doi.org/10.1016/j.atmosres.2012.07.007, 2012.
Antón, M., Valenzuela, A., Mateos, D., Alados, I., Foyo-Moreno, I., Olmo, F. J., Alados-Arboledas, L.: Longwave aerosol radiative effects during an extreme desert dust event in Southeastern Spain, Atmos. Res., 148, 18–23, https://doi.org/10.1016/j.atmosres.2014.05.022,2014.
Arakawa, A. and Lamb, V. R.: Computational design of the basic dynamical processes of the UCLA general circulation model, Meth. Comput. Phys., 17, 173–265, 1977.
Badia, A., Jorba, O., Voulgarakis, A., Dabdub, D., Pérez García-Pando, C., Hilboll, A., Gonçalves, M., and Janjic, Z.: Description and evaluation of the Multiscale Online Nonhydrostatic AtmospheRe CHemistry model (NMMB-MONARCH) version 1.0: gas-phase chemistry at global scale, Geosci. Model Dev., 10, 609–638, https://doi.org/10.5194/gmd-10-609-2017, 2017.
Banks, J. R., Brindley, H. E., Hobby, M., and Marsham, J. H.: The daytime cycle in dust aerosol direct radiative effects observed in the central Sahara during the Fennec campaign in June 2011, J. Geophys. Res.-Atmos., 119, 13861–13876, https://doi.org/10.1002/2014JD022077, 2014.
Basart, S., Pérez, C., Cuevas, E., Baldasano, J. M., and Gobbi, G. P.: Aerosol characterization in Northern Africa, Northeastern Atlantic, Mediterranean Basin and Middle East from direct-sun AERONET observations, Atmos. Chem. Phys., 9, 8265–8282, https://doi.org/10.5194/acp-9-8265-2009, 2009.
Bergstrom, R. W., Pilewskie, P., Russell, P. B., Redemann, J., Bond, T. C., Quinn, P. K., and Sierau, B.: Spectral absorption properties of atmospheric aerosols, Atmos. Chem. Phys., 7, 5937–5943, https://doi.org/10.5194/acp-7-5937-2007, 2007.
Betts, A. K.: A new convective adjustment scheme, Part 1: Observational and theoretical basis, Q. J. Roy. Meteor. Soc., 112, 677–691, https://doi.org/10.1002/qj.49711247307, 1986.
Betts, A. K. and Miller, M. J.: A new convective adjustment scheme, Part 2: Single column tests using GATE wave, BOMEX, ATEX and arctic air-mass data sets, Q. J. Roy. Meteor. Soc., 112, 693–709, https://doi.org/10.1002/qj.49711247308, 1986.
Binietoglou, I., Basart, S., Alados-Arboledas, L., Amiridis, V., Argyrouli, A., Baars, H., Baldasano, J. M., Balis, D., Belegante, L., Bravo-Aranda, J. A., Burlizzi, P., Carrasco, V., Chaikovsky, A., Comerón, A., D'Amico, G., Filioglou, M., Granados-Muñoz, M. J., Guerrero-Rascado, J. L., Ilic, L., Kokkalis, P., Maurizi, A., Mona, L., Monti, F., Muñoz-Porcar, C., Nicolae, D., Papayannis, A., Pappalardo, G., Pejanovic, G., Pereira, S. N., Perrone, M. R., Pietruczuk, A., Posyniak, M., Rocadenbosch, F., Rodríguez-Gómez, A., Sicard, M., Siomos, N., Szkop, A., Terradellas, E., Tsekeri, A., Vukovic, A., Wandinger, U., and Wagner, J.: A methodology for investigating dust model performance using synergistic EARLINET/AERONET dust concentration retrievals, Atmos. Meas. Tech., 8, 3577–3600, https://doi.org/10.5194/amt-8-3577-2015, 2015.
Boucher, O., Randall, D., Artaxo, P., Bretherton, C., Feingold, G., Forster, P., Kerminen, V.-M., Kondo, Y., Liao, H., Lohmann, U., Rasch, P., Satheesh, S. K., Sherwood, S., Stevens, B., and Zhang, X. Y.: Clouds and Aerosols, in: Climate Change 2013: The Physical Science Basis, Contribution of Working Group I to the Fifth Assessment Report of the Intergovernmental Panel on Climate Change, edited by: Stocker, T. F., Qin, D., Plattner, G.-K., Tignor, M., Allen, S. K., Boschung, J., Nauels, A., Xia, Y., Bex, V. and Midgley, P. M., Cambridge University Press, Cambridge, UK and New York, NY, USA, 571–658, https://doi.org/10.1017/CBO9781107415324.016, 2013.
Chin, M., Ginoux, P., Kinne, S., Torres, O., Holben, B. N., Duncan, B. N., Martin, R. V., Logan, J. A., Higurashi, A., and Nakajima, T.: Tropospheric aerosol optical thickness from the GOCART model and comparisons with satellite and Sun photometer measurements, J. Atmos. Sci., 59, 461–483, https://doi.org/10.1175/1520-0469(2002)059<0461:TAOTFT>2.0.CO;2, 2002.
Choobari, O. A., Zawar-Reza, P., and Sturman, A.: Feedback between wind blown dust and planetary boundary-layer characteristics: sensitivity to boundary and surface layer parameterizations, Atmos. Environ., 61, 294–304, https://doi.org/10.1016/j.atmosenv.2012.07.038, 2012.
Choobari, O. A., Zawar-Reza, P., and Sturman, A.: The global distribution of mineral dust and its impacts on the climate system: A review, Atmos. Res., 138, 152–165, https://doi.org/10.1016/j.atmosres.2013.11.007, 2014.
Christopher, S. A. and Jones, T. A.: Satellite-based assessment of cloud-free net radiative effect of dust aerosols over the Atlantic Ocean, Geophys. Res. Lett., 34, L02810, https://doi.org/10.1029/2006GL027783, 2007.
Cowie, S. M., Knippertz, P., and Marsham, J. H.: A climatology of dust emission events from northern Africa using long-term surface observations, Atmos. Chem. Phys., 14, 8579–8597, https://doi.org/10.5194/acp-14-8579-2014, 2014.
Cuesta, J., Marsham, J. H., Parker, D. J., and Flamant, C.: Dynamical mechanisms controlling the vertical redistribution of dust and the thermodynamic structure of the West Saharan atmospheric boundary layer during summer, Atmos. Sci. Lett., 10, 34–42, https://doi.org/10.1002/Asl.207, 2009.
Di Biagio, C., di Sarra, A., and Meloni, D.: Large atmospheric shortwave radiative forcing by Mediterranean aerosol derived from simultaneous ground-based and spaceborne observations, and dependence on the aerosol type and single scattering albedo, J. Geophys. Res., 115, D10209, https://doi.org/10.1029/2009JD012697, 2010.
Di Sarra, A., Pace, G., Meloni, D., De Silvestri, L., Piacentino,S., and Monteleone, F.: Surface shortwave radiative forcing of different aerosol types in the central Mediterranean, Geophys. Res. Lett., 35, L02714, https://doi.org/10.1029/2007GL032395, 2008.
Di Sarra, A., di Biagio, C., Meloni, D., Monteleone, F., Pace, G., Pugnaghi, S., and Sferlazzo, D.: Shortwave and longwave radiative effects of the intense Saharan dust event of 25–26 March 2010 at Lampedusa (Mediterranean Sea), J. Geophys. Res., 116, D23209, https://doi.org/10.1029/2011JD016238, 2011.
Di Sarra, A., Fuà, D., and Meloni, D.: Estimate of surface direct radiative forcing of desert dust from atmospheric modulation of the aerosol optical depth, Atmos. Chem. Phys., 13, 5647–5654, https://doi.org/10.5194/acp-13-5647-2013, 2013.
Di Tomaso, E., Schutgens, N. A. J., Jorba, O., and Pérez García-Pando, C.: Assimilation of MODIS Dark Target and Deep Blue observations in the dust aerosol component of NMMB-MONARCH version 1.0, Geosci. Model Dev., 10, 1107–1129, https://doi.org/10.5194/gmd-10-1107-2017, 2017.
Ek, M. B., Mitchell, K. E., Lin, Y., Rogers, E., Grunmann, P., Koren, V., Gayno, G., and Tarpley, J. D.: Implementation of Noah land surface model advances in the National Centers for Environmental Prediction operational mesoscale Eta model, J. Geophys.Res., 108, 8851, https://doi.org/10.1029/2002JD003296, 2003.
Ferrier, B. S., Jin, Y., Lin, Y., Black, T., Rogers, E., and DiMego, G.: Implementation of a new grid-scale cloud and precipitation scheme in the NCEP Eta Model, in: Proc. 15th Conf. on Numerical Weather Prediction, 12–16 August 2002, San Antonio, TX, USA, Amer. Meteor. Soc., 280–283, 2002.
Foltz, G. R. and McPhaden, M. J.: Impact of Saharan dust on tropical North Atlantic SST, J. Climate, 21, 5048–5060, 2008.
Gama, C., Tchepel, O., Baldasano, J. M., Basart, S., Ferreira, J., Pio, C., Cardoso, J., and Borrego, C.: Seasonal patterns of Saharan dust over Cape Verde – a combined approach using observations and modelling, Tellus B, 67, 24410, https://doi.org/10.3402/tellusb.v67.24410, 2015.
Ginoux, P., Prospero, J. M., Gill, T. E., Hsu, N. C., and Zhao, M.: Global-scale attribution of anthropogenic and natural dust sources and their emission rates based on MODIS Deep Blue aerosol products, Rev. Geophys., 50, RG3005, https://doi.org/10.1029/2012rg000388, 2012.
Gkikas, A., Hatzianastassiou, N., Mihalopoulos, N., Katsoulis, V., Kazadzis, S., Pey, J., Querol, X., and Torres, O.: The regime of intense desert dust episodes in the Mediterranean based on contemporary satellite observations and ground measurements, Atmos. Chem. Phys., 13, 12135–12154, https://doi.org/10.5194/acp-13-12135-2013, 2013.
Gkikas, A., Houssos, E. E., Lolis, C. J., Bartzokas, A., Mihalopoulos, N. and Hatzianastassiou, N.: Atmospheric circulation evolution related to desert-dust episodes over the Mediterranean. Q. J. Roy. Meteorol. Soc., 141, 1634–1645, https://doi.org/10.1002/qj.2466, 2015.
Gkikas, A., Basart, S., Hatzianastassiou, N., Marinou, E., Amiridis, V., Kazadzis, S., Pey, J., Querol, X., Jorba, O., Gassó, S., and Baldasano, J. M.: Mediterranean intense desert dust outbreaks and their vertical structure based on remote sensing data, Atmos. Chem. Phys., 16, 8609–8642, https://doi.org/10.5194/acp-16-8609-2016, 2016.
Gómez-Amo, J. L., Pinti, V., Di Iorio, T., di Sarra, A., Meloni, D., Becagli, S., Bellantone, V., Cacciani, M., Fuà, D., and Perrone, M. R.: The June 2007 Saharan dust event in the central Mediterranean: Observations and radiative effects in marine, urban, and sub-urban environments, Atmos. Environ., 45, 5385–5493, 2011.
Guerrero-Rascado, J. L., Olmo, F. J., Avilés-Rodríguez, I., Navas-Guzmán, F., Pérez-Ramírez, D., Lyamani, H., and Alados Arboledas, L.: Extreme Saharan dust event over the southern Iberian Peninsula in september 2007: active and passive remote sensing from surface and satellite, Atmos. Chem. Phys., 9, 8453–8469, https://doi.org/10.5194/acp-9-8453-2009, 2009.
Hansen, J., Sato, M., and Ruedy, R.: Radiative forcing and climate response, J. Geophys. Res., 102, 6831–6864, 1997.
Hatzianastassiou, N., Katsoulis, B., and Vardavas, I.: Sensitivity analysis of aerosol direct radiative forcings in the ultraviolet – visible wavelengths and consequences for the heat budget, Tellus, 56B, 368–381, 2004.
Haustein, K., Pérez, C., Baldasano, J. M., Jorba, O., Basart, S., Miller, R. L., Janjic, Z., Black, T., Nickovic, S., Todd, M. C., Washington, R., Müller, D., Tesche, M., Weinzierl, B., Esselborn, M., and Schladitz, A.: Atmospheric dust modeling from meso to global scales with the online NMMB/BSC-Dust model – Part 2: Experimental campaigns in Northern Africa, Atmos. Chem. Phys., 12, 2933–2958, https://doi.org/10.5194/acp-12-2933-2012, 2012.
Haywood, J., Allan, R., Culverwell, I., Slingo, T., Milton, S., Edwards, J., and Clerbaux, N.: Can desert dust explain the outgoing longwave radiation anomaly over the Sahara during July 2003?, J.Geophys. Res., 110, D05105, https://doi.org/10.1029/2004JD005232, 2005.
Heinold, B., Tegen, I., Schepanski, K., and Hellmuth, O.: Dust Radiative feedback on Saharan boundary layer dynamics and dust mobilization, Geophys. Res. Lett., 35, L20817, https://doi.org/10.1029/2008GL035319, 2008.
Helmert, J., Heinold, B., Tegen, I., Hellmuth, O., and Wendisch, M.: On the direct and semi direct effect of Saharan dust over Europe: a modeling study, J. Geophys. Res., 112, D11204, https://doi.org/10.1029/2006JD007444, 2007.
Huang, J., Wang, T., Wang, W., Li, Z., and Yan, H.: Climate effects of dust aerosols over East Asian arid and semi-arid regions, J. Geophys. Res., 119, 11398–11416, https://doi.org/10.1002/2014JD021796,2014.
Huneeus, N., Basart, S., Fiedler, S., Morcrette, J.-J., Benedetti, A., Mulcahy, J., Terradellas, E., Pérez García-Pando, C., Pejanovic, G., Nickovic, S., Arsenovic, P., Schulz, M., Cuevas, E., Baldasano, J. M., Pey, J., Remy, S., and Cvetkovic, B.: Forecasting the northern African dust outbreak towards Europe in April 2011: a model intercomparison, Atmos. Chem. Phys., 16, 4967–4986, https://doi.org/10.5194/acp-16-4967-2016, 2016.
Iacono, M. J., Delamere, J. S., Mlawer, E. J., Shephard, M.W., Clough, S. A., and Collins, W. D.: Radiative forcing by long-lived greenhouse gases: Calculations with the AER Radiative transfer models, J. Geophys. Res., 113, D13103, https://doi.org/10.1029/2008JD009944, 2008.
IPCC: Summary for Policymakers, in: Climate Change 2013: The Physical Science Basis. Contribution of Working Group I to the Fifth Assessment Report of the Intergovernmental Panel on Climate Change, edited by: Stocker, T. F., Qin, D., Plattner, G.-K., Tignor, M., Allen, S. K., Boschung, J., Nauels, A., Xia, Y., Bex, V., and Midgley, P. M., Cambridge University Press, Cambridge, UK and New York, NY, USA, 2013.
Janjic, Z.: Further development of the unified multiscale Eulerian model for a broad range of spatial and temporal scales within the new National Environmental Modeling System, EGU General Assembly 2009, 19–24 April 2009, Vienna, Austria, abstract #EGU2009-1587, 11, p. 1587, 2009.
Janjic, Z., Janjic, T., and Vasic, R.: A class of conservative fourth order advection schemes and impact of enhanced formal accuracy on extended-range forecasts, Mon. Weather Rev., 13, 1556–1568, 2011.
Janjic, Z. I.: A non hydrostatic model based on a new approach, Meteorol. Atmos. Phys., 82, 271–285, https://doi.org/10.1007/s00703-001-0587-6, 2003.
Janjic, Z. I.: A unified model approach from meso to global scales, Geophys. Res. Abstr., 7, SRef-ID: 1607-7962/gra/EGU05-A-05582, 2005.
Janjic, Z. I. and Black, T.: A unified model approach from meso to global scales, Geophys. Res. Abstr., 9, SRef-ID: 1607-7962/gra/EGU2007-A-05025, 2007.
Janjic, Z. I.: The step-mountain eta coordinate model: further developments of the convection, viscous sublayer, and turbulence closure schemes, Mon. Weather Rev., 122, 927–945, https://doi.org/10.1175/1520-0493(1994)122<0927:TSMECM>2.0.CO;2, 1994.
Janjic, Z. I.: Comments on “Development and evaluation of a convection scheme for use in climate models”, J. Atmos. Sci., 57, 3686–3686, https://doi.org/10.1175/1520-0469(2000)057<3686:CODAEO>2.0.CO;2, 2000.
Janjic, Z. I., Gerrity, J. P., and Nickovic, S.: An alternative approach to non hydrostatic modeling, Mon. Weather Rev., 129, 1164–1178, https://doi.org/10.1175/1520-0493(2001)129<1164:AAATNM>2.0.CO;2, 2001.
Ji, Z., Wang, G., Pal, J. S., and Yu, M.: Potential climate effect of mineral aerosols over West Africa, Part I: model validation and contemporary climate evaluation, Clim. Dynam., 46, 1–17, https://doi.org/10.1007/s00382-015-2641-y, 2015.
Kalenderski, S. and Stenchikov, G.: High-resolution regional modeling of summertime transport and impact of African dust over the Red Sea and Arabian Peninsula, J. Geophys. Res., 121, 6435–6458, https://doi.org/10.1002/2015JD024480, 2016.
Koepke, P., Hess, M., Schult, I., and Shettle, E. P.: Global aerosol data set, Tech. rep., Max-Planck Institut für Meteorologie, Hamburg, Germany, 1997.
Kubilay, N., Cokacar, T., and Oguz, T.: Optical properties of mineral dust outbreaks over the northeastern Mediterranean, J. Geophys. Res., 108, 4666, https://doi.org/10.1029/2003JD003798, 2003.
Kumar, R., Barth, M. C., Pfister, G. G., Naja, M., and Brasseur, G. P.: WRF-Chem simulations of a typical pre-monsoon dust storm in northern India: influences on aerosol optical properties and radiation budget, Atmos. Chem. Phys., 14, 2431–2446, https://doi.org/10.5194/acp-14-2431-2014, 2014.
Lelieveld, J., Lelieveld, J., Berresheim, H., Borrmann, S., Crutzen, P. J., Dentener, F. J., Fischer, H., Feichter, J., Flatau, P. J., and Heland, J.: Global Air Pollution Crossroads over the Mediterranean, Science, 794, 794–799, https://doi.org/10.1126/science.1075457, 2002.
Liao, H. and Seinfeld, J.: Radiative forcing by mineral dust aerosols: sensitivity to key variables, J. Geophys. Res., 103, 31637–31645, 1998.
Ling, X., Guo, W., and Fu, C.: Composite analysis of impacts of dust aerosols on surface atmospheric variables and energy budgets in a semiarid region of China, J. Geophys. Res.-Atmos., 119, 3107–3123, https://doi.org/10.1002/2013jd020274, 2014.
Lohmann, U. and Feichter, J.: Global indirect aerosol effects: a review, Atmos. Chem. Phys., 5, 715–737, https://doi.org/10.5194/acp-5-715-2005, 2005.
Mahowald, N. M., Albani, S., Kok, J. F., Engelstaedter, S., Scanza, R., Ward, D. S., and Flanner, M. G.: The size distribution of desert dust aerosols and its impact on the Earth system, Aeol. Res., 15, 53–71, https://doi.org/10.1016/j.aeolia.2013.09.002, 2014.
Mallet, M., Tulet, P., Serça, D., Solmon, F., Dubovik, O., Pelon, J., Pont, V., and Thouron, O.: Impact of dust aerosols on the radiative budget, surface heat fluxes, heating rate profiles and convective activity over West Africa during March 2006, Atmos. Chem. Phys., 9, 7143–7160, https://doi.org/10.5194/acp-9-7143-2009, 2009.
Marcella, M. P. and Eltahir, E. A. B.: The role of mineral aerosols in shaping the regional climate of West Africa, J. Geophys. Res.-Atmos., 119, 1–14, https://doi.org/10.1002/2012JD019394, 2014.
Marti, A., Folch, A., Jorba, O., and Janjic, Z.: Volcanic ash modeling with the online NMMB-MONARCH-ASH v1.0 model: model description, case simulation, and evaluation, Atmos. Chem. Phys., 17, 4005–4030, https://doi.org/10.5194/acp-17-4005-2017, 2017.
McPeters, R. D., Bhartia, P. K., Krueger, A. J., Herman, J. R., Wellemeyer, C. G., Seftor, C. J., Jaross, G., Torres, O., Moy, L., Labow, G., Byerly, W., Taylor, S. L., Swissler, T., and Cebula, R. P.: Earth Probe Total Ozone Mapping Spectrometer (TOMS) Data Products User's Guide, NASA/TP-1998-206895, 1998.
Meloni, D., di Sarra, A., Di Iorio, T., and Fiocco, G.: Direct radiative forcing of Saharan dust in the Mediterranean from measurements at Lampedusa island and MISR space-borne observations, J. Geophys. Res., 109, D08206, https://doi.org/10.1029/2003JD003960, 2004.
Meloni, D., Junkermann, W., di Sarra, A., Cacciani, M., De Silvestri, L., Di Iorio, T., Estellés, V., Gómez-Amo, J. L., Pace, G., and Sferlazzo, D. M.: Altitude-resolved shortwave and longwave radiative effects of desert dust in the Mediterranean during the GAMARF campaign: Indications of a net daily cooling in the dust layer, J. Geophys. Res., 120, 3386–3407, https://doi.org/10.1002/2014JD022312, 2015.
Meyer, K., Platnick, S., Oreopoulos, L., and Lee, D.: Estimating the direct radiative effect of absorbing aerosols overlying marine boundary layer clouds in the southeast Atlantic using MODIS and CALIOP, J. Geophys. Res.-Atmos., 118, 4801–4815, https://doi.org/10.1002/jgrd.50449, 2013.
Miller, R. L. and Tegen, I.: Climate response to soil dust aerosols, J. Climate, 11, 3247–3267, 1998.
Miller, R. L., Perlwitz, J., and Tegen, I.: Feedback upon dust emission by dust radiative forcing through the planetary boundary layer, J. Geophys. Res., 109, D24209, https://doi.org/10.1029/2004JD004912, 2004a.
Miller, R. L., Tegen, I., and Perlwitz, J.: Surface radiative forcing by soil dust aerosols and the hydrologic cycle, J. Geophys. Res., 109, D04203, https://doi.org/10.1029/2003JD004085, 2004b.
Mishchenko, M. I., Travis, L. D., and Lacis, A. A.: Scattering, Absorption, and Emission of Light by Small Particles, Cambridge University Press, New York, 2002.
Mishra, A. K., Koren, I., and Rudich, Y.: Effect of aerosol vertical distribution on aerosol-radiation interaction: a theoretical prospect, Heliyon, 1, e00036, https://doi.org/10.1016/j.heliyon.2015.e00036, 2015.
Mlawer, E. J., Taubman, S. J., Brown, P. D., Iacono, M. J., and Clough, S. A.: Radiative transfer for inhomogeneous atmospheres: RRTM, a validated correlated-k model for the longwave, J. Geophys. Res., 102, 16663–16682, https://doi.org/10.1029/97JD00237, 1997.
Monin, A. S. and Obukhov, A. M.: Osnovnye zakonomernosti turbulentnogo peremesivanija v prizemnom sloe atmosfery, Trudy geofiz. inst. AN SSSR, 24, 163–187, 1954.
Moulin, C., Lambert, C. E., Dayan, U., Masson, V., Ramonet, M., Bousquet, P., Legrand, M., Balkanski, Y. J., Guelle, W., Marticorena, B., Bergametti, G., and Dulac, F.: Satellite climatology of African dust transport in the Mediterranean atmosphere, J. Geophys. Res., 103, 13137, https://doi.org/10.1029/98JD00171, 1998.
Müller, T., Schladitz, A., Massling, A., Kaaden, N., Kandler, K., and Wiedensohler, A.: Spectral absorption coefficients and imaginary parts of refractive indices of Saharan dust during SAMUM-1, Tellus B, 61, 79–95, 2009.
Nabat, P., Solmon, F., Mallet, M., Kok, J. F., and Somot, S.: Dust emission size distribution impact on aerosol budget and radiative forcing over the Mediterranean region: a regional climate model approach, Atmos. Chem. Phys., 12, 10545–10567, https://doi.org/10.5194/acp-12-10545-2012, 2012.
Nabat, P., Somot, S., Mallet, M., Sevault, F., Chiacchio, M., and Wild, M.: Direct and semi-direct aerosol radiative effect on the Mediterranean climate variability using a Regional Climate System Model, Clim. Dynam., 44, 1127–1155, https://doi.org/10.1007/s00382-014-2205-6, 2015a.
Nabat, P., Somot, S., Mallet, M., Michou, M., Sevault, F., Driouech, F., Meloni, D., di Sarra, A., Di Biagio, C., Formenti, P., Sicard, M., Léon, J.-F., and Bouin, M.-N.: Dust aerosol radiative effects during summer 2012 simulated with a coupled regional aerosol–atmosphere–ocean model over the Mediterranean, Atmos. Chem. Phys., 15, 3303–3326, https://doi.org/10.5194/acp-15-3303-2015, 2015b.
Obregón, M. A., Pereira, S., Salgueiro, V., Costa, M. J., Silva, A. M., Serrano, A., and Bortoli, D.: Aerosol radiative effects during two desert dust events in August 2012 over the Southwestern Iberian Peninsula, Atmos. Res., 153, 404–415, https://doi.org/10.1016/j.atmosres.2014.10.007, 2015.
Ohmura, A., Gilgen, H., Hegner, H., Müller, G., Wild, M., Dutton, E. G., Forgan, B., Fröhlich, C., Philipona, R., Heimo, A., and König-Langlo, G.: Baseline Surface Radiation Network (BSRN/WCRP): New precision radiometry for climate research, B. Am. Meteorol. Soc., 79, 2115–2136, 1998.
O'Neill, N. T., Eck, T. F., Smirnov, A., Holben, B. N., and Thulasiraman, S.: Spectral discrimination of coarse and fine mode optical depth, J. Geophys. Res., 108, 4559, https://doi.org/10.1029/2002JD002975,2003.
Oreopoulos, L. and Barker, H. W.: Accounting for subgrid-scale cloud variability in a multi-layer 1-D solar radiative transfer algorithm, Q. J. Roy Meteor. Soc., 125, 301–330, 1999.
Osborne, S., Baran, A., Johnson, B., Haywood, J., Hesse, E., and Newman, S.: Short-wave and long-wave radiative properties of Saharan dust aerosol, Q. J. Roy. Meteor. Soc., 137, 1149–1167,2011.
Osipov, S., Stenchikov, G., Brindley, H., and Banks, J.: Diurnal cycle of the dust instantaneous direct radiative forcing over the Arabian Peninsula, Atmos. Chem. Phys., 15, 9537–9553, https://doi.org/10.5194/acp-15-9537-2015, 2015.
Otto, S., de Reus, M., Trautmann, T., Thomas, A., Wendisch, M., and Borrmann, S.: Atmospheric radiative effects of an in situ measured Saharan dust plume and the role of large particles, Atmos. Chem. Phys., 7, 4887–4903, https://doi.org/10.5194/acp-7-4887-2007, 2007.
Papadimas, C. D., Hatzianastassiou, N., Matsoukas, C., Kanakidou, M., Mihalopoulos, N., and Vardavas, I.: The direct effect of aerosols on solar radiation over the broader Mediterranean basin, Atmos. Chem. Phys., 12, 7165-7185, https://doi.org/10.5194/acp-12-7165-2012, 2012.
Pérez, C., Nickovic, S., Pejanovic, G., Baldasano, J. M., and Özsoy, E.: Interactive dust-radiation modeling: A step to improve weather forecasts, J. Geophys. Res., 111, 1–17, 2006.
Pérez, C., Haustein, K., Janjic, Z., Jorba, O., Huneeus, N., Baldasano, J. M., Black, T., Basart, S., Nickovic, S., Miller, R. L., Perlwitz, J. P., Schulz, M., and Thomson, M.: Atmospheric dust modeling from meso to global scales with the online NMMB/BSC-Dust model – Part 1: Model description, annual simulations and evaluation, Atmos. Chem. Phys., 11, 13001–13027, https://doi.org/10.5194/acp-11-13001-2011, 2011.
Pérez García-Pando, C., Miller, R. L., Perlwitz, J. P., Rodríguez, S., and Prospero, J. M.: Predicting the mineral composition of dust aerosols: Insights from elemental composition measured at the Izaña Observatory, Geophys. Res. Lett., 43, 10520–10529, https://doi.org/10.1002/2016GL069873, 2016.
Perlwitz, J., Tegen, I., and Miller, R.: Interactive soil dust aerosol model in the GISS GCM 1, Sensitivity of the soil dust cycle to radiative properties of soil dust aerosols, J. Geophys. Res., 106, 18167–18192, 2001.
Perlwitz, J. P., Pérez García-Pando, C., and Miller, R. L.: Predicting the mineral composition of dust aerosols – Part 1: Representing key processes, Atmos. Chem. Phys., 15, 11593–11627, https://doi.org/10.5194/acp-15-11593-2015, 2015a.
Perlwitz, J. P., Pérez García-Pando, C., and Miller, R. L.: Predicting the mineral composition of dust aerosols – Part 2: Model evaluation and identification of key processes with observations, Atmos. Chem. Phys., 15, 11629–11652, https://doi.org/10.5194/acp-15-11629-2015, 2015b.
Petzold, A., Rasp, K., Weinzierl, B., Esselborn, M., Hamburger, T., Dörnbrack, A., Kandler, K., Schütz, L., Knippertz, P., Fiebig, M., and Virkkula, A.: Saharan dust refractive index and optical properties from aircraft-based observations during SAMUM 2006, Tellus B, 61 118–130, 2009.
Pey, J., Querol, X., Alastuey, A., Forastiere, F., and Stafoggia, M.: African dust outbreaks over the Mediterranean Basin during 2001–2011: PM10 concentrations, phenomenology and trends, and its relation with synoptic and mesoscale meteorology, Atmos. Chem. Phys., 13, 1395–1410, https://doi.org/10.5194/acp-13-1395-2013, 2013.
Pincus, R. and Baker, M.: Precipitation, solar absorption and albedo susceptibility in marine boundary layer clouds, Nature, 372, 250–252, 1994.
Querol, X., Pey, J., Pandolfi, M., Alastuey, A., Cusack, M., Pérez, N., Moreno, T., Viana, N., Mihalopoulos, N., Kallos, G., and Kleanthous, S.: African dust contributions to mean ambient PM10 mass-levels across the Mediterranean basin, Atmos. Environ., 43, 4266–4277, https://doi.org/10.1016/j.atmosenv.2009.06.013, 2009.
Remer, L. A., Kaufman, Y. J., Tanré, D., Mattoo, S., Chu, D. A., Martins, J. V., Li, R. R., Ichoku, C., Levy, R. C., Kleidman, R. G., Eck, T. F., Vermote, E., and Holben, B. N.: The MODIS aerosol algorithm, products and validation, J. Atmos. Sci., 62, 947–973,https://doi.org/10.1175/JAS3385.1, 2005.
Rémy, S., Benedetti, A., Bozzo, A., Haiden, T., Jones, L., Razinger, M., Flemming, J., Engelen, R. J., Peuch, V. H., and Thepaut, J. N.: Feedbacks of dust and boundary layer meteorology during a dust storm in the eastern Mediterranean, Atmos. Chem. Phys., 15, 1290–12933, https://doi.org/10.5194/acp-15-12909-2015, 2015.
Rodríguez, S., Querol, X., Alastuey, A., Kallos, G., and Kakaliagou, O.: Saharan dust contributions to PM10 and TSP levels in Southern and Eastern Spain, Atmos. Environ., 35, 2433–2447, https://doi.org/10.1016/S1352-2310(00)00496-9, 2001.
Roesch, A., Wild, M., Ohmura, A., Dutton, E. G., Long, C. N., and Zhang, T.: Assessment of BSRN radiation records for the computation of monthly means, Atmos. Meas. Tech., 4, 339–354, https://doi.org/10.5194/amt-4-339-2011, 2011.
Romano, S., Burlizzi, P., and Perrone, M. R.: Experimental determination of short- and long-wave dust radiative effects in the Central Mediterranean and comparison with model results, Atmos. Res., 171, 5–20, https://doi.org/10.1016/j.atmosres.2015.11.019, 2016.
Santese, M., Perrone, M. R., Zakey, A. S., De Tomasi, F., and Giorgi, F.: Modeling of Saharan dust outbreaks over the Mediterranean by RegCM3: case studies, Atmos. Chem. Phys., 10, 133–156, https://doi.org/10.5194/acp-10-133-2010, 2010.
Sassen, K., DeMott, P. J., Prospero, J. M., and Poellot, M. R.: Saharan dust storms and indirect aerosol effects on clouds: CRYSTAL-FACE results, Geophys. Res. Lett., 30, 1633, https://doi.org/10.1029/2003GL017371, 2003.
Scarnato, B. V., China, S., Nielsen, K., and Mazzoleni, C.: Perturbations of the optical properties of mineral dust particles by mixing with black carbon: a numerical simulation study, Atmos. Chem. Phys., 15, 6913–6928, https://doi.org/10.5194/acp-15-6913-2015, 2015.
Schepanski, K., Tegen, I., Todd, M. C., Heinold, B., Bönisch, G., Laurent, B., and Macke, A.: Meteorological processes forcing Saharan dust emission inferred from MSG-SEVIRI observations of subdaily dust source activation and numerical models, J. Geophys. Res., 114, D10201, https://doi.org/10.1029/2008jd010325, 2009.
Seigel, R. B., van den Heever, S. C., and Saleeby, S. M.: Mineral dust indirect effects and cloud radiative feedbacks of a simulated idealized nocturnal squall line, Atmos. Chem. Phys., 13, 4467–4485, https://doi.org/10.5194/acp-13-4467-2013, 2013.
Sicard, M., Bertolín, S., Mallet, M., Dubuisson, P., and Comerón, A.: Estimation of mineral dust long-wave radiative forcing: sensitivity study to particle properties and application to real cases in the region of Barcelona, Atmos. Chem. Phys., 14, 9213–9231, https://doi.org/10.5194/acp-14-9213-2014, 2014a.
Sicard, M., Bertolín, S., Muñoz, C., Rodríguez, A., Rocadenbosch, F., and Comerón, A.: Separation of aerosol fine- and coarse-mode radiative properties: Effect on the mineral dust longwave, direct radiative forcing, Geophys. Res. Lett., 41, 6978–6985, https://doi.org/10.1002/2014GL060946, 2014b.
Simmons, A. J. and Burridge, D. M.: An energy and angular momentum conserving vertical finite-difference scheme and hybrid vertical coordinates, Mon. Weather Rev., 109, 758–766, https://doi.org/10.1175/1520-0493(1981)109<0758:AEAAMC>2.0.CO;2, 1981.
Singh, S. and Beegum, S. N.: Direct radiative effects of an unseasonal dust storm at a western Indo Gangetic Plain station Delhi in ultraviolet, shortwave, and longwave regions, Geophys. Res. Lett., 40, 2444–2449, https://doi.org/10.1002/grl.50496, 2013.
Sinyuk, A., Torres, O., and Dubovik, O.: Combined use of satellite and surface observations to infer the imaginary part of refractive index of Saharan dust, Geophys. Res. Lett., 30, 1081, https://doi.org/10.1029/2002GL016189, 2003.
Sokolik, I. N., Winker, D. M., Bergametti, G., Gilette, D. A., Carmichel, G., Kaufmann, Y. J., Gomes, L., Schmetz, L., and Penner, J. E.: Introduction to special section: outstanding problems in quantifying the radiative impacts of mineral dust, J. Geophys. Res., 106, 18015–18027, 2001.
Solmon, F., Mallet, M., Elguindi, N., Giorgi, F., Zakey, A., and Konare, A.: Dust aerosol impact on regional precipitation over Western Africa, mechanisms and sensitivity to absorption properties, Geophys. Res. Lett., 35, l24705, https://doi.org/10.1029/2008GL035900, 2008.
Solmon, F., Elguindi, N., and Mallet, M.: Radiative and climatic effects of dust over West Africa, as simulated by a regional climate model, Clim. Res., 2, 97–113, 2012.
Spyrou, C., Kallos, G., Mitsakou, C., Athanasiadis, P., Kalogeri, C., and Iacono, M. J.: Modeling the radiative effects of desert dust on weather and regional climate, Atmos. Chem. Phys., 13, 5489–5504, https://doi.org/10.5194/acp-13-5489-2013, 2013.
Stanelle, T., Vogel, B., Vogel, H., Bäumer, D., and Kottmeier, C.: Feedback between dust particles and atmospheric processes over West Africa during dust episodes in March 2006 and June 2007, Atmos. Chem. Phys., 10, 10771–10788, https://doi.org/10.5194/acp-10-10771-2010, 2010.
Tegen, I., Bierwirth, E., Heinold, B., Helmert, J., and Wendisch, M.: Effect of measured surface albedo on modeled Saharan dust solar radiative forcing, J. Geophys. Res., 115, D24312, https://doi.org/10.1029/2009JD013764, 2010.
Toledano, C., Cachorro, V. E., de Frutos, A. M., Sorribas, M., Prats, N., and de la Morena, B. A.: Inventory of African desert dust events over the southwestern Iberian Peninsula in 2000–2005 with an AERONET Cimel Sun photometer, J. Geophys. Res., 112, D21201, https://doi.org/10.1029/2006JD008307, 2007.
Torres, O., Bhartia P. K., Herman J. R., Ahmad Z., and Gleason, J.: Derivation of aerosol properties from satellite measurements of backscattered ultraviolet radiation: Theoretical bases, J. Geophys. Res., 103, 17009–17110, 1998.
Torres, O., Tanskanen, A., Veihelman, B., Ahn, C., Braak, R., Bhartia, P. K., Veefkind, P., and Levelt, P.: Aerosols and Surface UV Products from OMI Observations: an overview, J. Geophys. Res., 112, D24S47, https://doi.org/10.1029/2007JD008809, 2007.
Twomey, S.: Pollution and the planetary albedo, Atmos. Environ., 8, 1251–1256, 1974.
Valenzuela, A., Olmo, F. J., Lyamani, H., Antón, M., Quirantes, A., and Alados-Arboledas, L.: Aerosol radiative forcing during African desert dust events (2005–2010) over Southeastern Spain, Atmos. Chem. Phys., 12, 10331–10351, https://doi.org/10.5194/acp-12-10331-2012, 2012.
Vinoj, V., Rasch, P. J., Wang, H., Yoon, J.-H., Ma, P.-L., Landu, K., and Singh, B.: Short-term modulation of Indian summer monsoon rainfall by West Asian dust, Nat. Geosci., 7, 308–313, https://doi.org/10.1038/NGEO2107, 2014.
Wang, H. and Niu, T.: Sensitivity studies of aerosol data assimilation and direct radiative feedbacks in modeling dust aerosols, Atmos. Environ., 64, 208–218, https://doi.org/10.1016/j.atmosenv.2012.09.066, 2013.
Wang, H., Zhang, X. Y., Gong, S. L., Chen, Y., Shi, G. Y., and Li, W.: Radiative feedback of dust aerosols on the East Asian dust storms, J. Geophys. Res., 115, D23214, https://doi.org/10.21029/22009JD013430, 2010.
Wang, H., Zhao, T. L., Zhang, X. Y., and Gong, S. L.: Dust direct radiative effects on the earth-atmosphere system over east Asia: Early spring cooling and late spring warming, Chinese Sci. Bull, 56, 1020–1030, https://doi.org/10.1007/s11434-011-4405-3, 2011.
Wang, H., Shi, G. Y., Zhu, J., Chen, B., Che, H., and Zhao, T. L.: Case study of longwave contribution to dust radiative effects over East Asia, Chin. Sci. Bull., 30, 3673–3681, https://doi.org/10.1007/s11434-013-5752-z, 2013.
Wang, Z. L., Zhang, H., Jing, X. W., and Wei, X. D.: Effect of non-spherical dust aerosol on its direct radiative forcing, Atmos. Res., 120, 112–126, https://doi.org/10.1016/j.atmosres.2012.08.006, 2013.
Woodage, M. J. and Woodward, S.: U.K. HiGEM: Impacts of desert dust radiative forcing in a High-Resolution Atmospheric GCM, J. Climate, 27, 5907–5928, 2014.
Yang, E.-S., Gupta, P., and Sundar, A. C.: Net radiative effect of dust aerosols from satellite measurements over Sahara, Geophys. Res. Lett., 36, L18812, https://doi.org/10.1029/2009GL039801, 2009.
Yin, Y. and Chen, L.: The effects of heating by transported dust layers on cloud and precipitation: a numerical study, Atmos. Chem. Phys., 7, 3497–3505, https://doi.org/10.5194/acp-7-3497-2007, 2007.
Yin, Y., Wurzler, S., Levin, Z., and Reisin, T. G.: Interactions of mineral dust particles and clouds: effects on precipitation and cloud optical properties, J. Geophys. Res., 107, 4724, https://doi.org/10.1029/2001JD001544, 2002.
Yorks, J. E., McGill, M., Rodier, S., Vaughan, M., Hu, Y., and Hlavka, D.: Radiative effects of African dust and smoke observed from Clouds and the Earth's Radiant Energy System (CERES) and Cloud-Aerosol Lidar with Orthogonal Polarization (CALIOP) data, J. Geophys. Res., 114, D00H04, https://doi.org/10.1029/2009JD012000, 2009.
Zhang, D. F., Zakey, A. S., Gao, X. J., Giorgi, F., and Solmon, F.: Simulation of dust aerosol and its regional feedbacks over East Asia using a regional climate model, Atmos. Chem. Phys., 9, 1095–1110, https://doi.org/10.5194/acp-9-1095-2009, 2009.
Zhang, Z., Meyer, K., Platnick, S., Oreopoulos, L., Lee, D., and Yu, H.: A novel method for estimating shortwave direct radiative effect of above-cloud aerosols using CALIOP and MODIS data, Atmos. Meas. Tech., 7, 1777–1789, https://doi.org/10.5194/amt-7-1777-2014, 2014.
Zhang, Z., Meyer, K., Yu, H., Platnick, S., Colarco, P., Liu, Z., and Oreopoulos, L.: Shortwave direct radiative effects of above-cloud aerosols over global oceans derived from 8 years of CALIOP and MODIS observations, Atmos. Chem. Phys., 16, 2877–2900, https://doi.org/10.5194/acp-16-2877-2016, 2016.
Zhao, C., Liu, X., Leung, L. R., Johnson, B., McFarlane, S. A., Gustafson Jr., W. I., Fast, J. D., and Easter, R.: The spatial distribution of mineral dust and its shortwave radiative forcing over North Africa: modeling sensitivities to dust emissions and aerosol size treatments, Atmos. Chem. Phys., 10, 8821–8838, https://doi.org/10.5194/acp-10-8821-2010, 2010.
Zhao, C., Liu, X., Ruby Leung, L., and Hagos, S.: Radiative impact of mineral dust on monsoon precipitation variability over West Africa, Atmos. Chem. Phys., 11, 1879–1893, https://doi.org/10.5194/acp-11-1879-2011, 2011.
Zhu, A., Ramanathan, V., Li, F., and Kim, D.: Dust plumes over the Pacific, Indian, and Atlantic oceans: Climatology and radiative impact, J. Geophys. Res., 112, D16208, https://doi.org/10.1029/2007JD008427, 2007.