the Creative Commons Attribution 4.0 License.
the Creative Commons Attribution 4.0 License.
 | 14 Jun 2018
East Asian dust storm in May 2017: observations, modelling, and its influence on the Asia-Pacific region
Xiao-Xiao Zhang
Brenton Sharratt
Lian-You Liu
Zi-Fa Wang
Xiao-Le Pan
Jia-Qiang Lei
Shi-Xin Wu
Shuang-Yan Huang
Yu-Hong Guo
Jie Li
Xiao Tang
Ting Yang
Yu Tian
Xue-Shun Chen
Jian-Qi Hao
Hai-Tao Zheng
Yan-Yan Yang
Yan-Li Lyu
A severe dust storm event originated from the Gobi Desert in Central and East Asia during 2–7 May 2017. Based on Moderate Resolution Imaging Spectroradiometer (MODIS) satellite products, hourly environmental monitoring measurements from Chinese cities and East Asian meteorological observation stations, and numerical simulations, we analysed the spatial and temporal characteristics of this dust event as well as its associated impact on the Asia-Pacific region. The maximum observed hourly PM10 (particulate matter with an aerodynamic diameter ≤ 10 µm) concentration was above 1000 µg m−3 in Beijing, Tianjin, Shijiazhuang, Baoding, and Langfang and above 2000 µg m−3 in Erdos, Hohhot, Baotou, and Alxa in northern China. This dust event affected over 8.35 million km2, or 87 % of the Chinese mainland, and significantly deteriorated air quality in 316 cities of the 367 cities examined across China. The maximum surface wind speed during the dust storm was 23–24 m s−1 in the Mongolian Gobi Desert and 20–22 m s−1 in central Inner Mongolia, indicating the potential source regions of this dust event. Lidar-derived vertical dust profiles in Beijing, Seoul, and Tokyo indicated dust aerosols were uplifted to an altitude of 1.5–3.5 km, whereas simulations by the Weather Research and Forecasting with Chemistry (WRF-Chem) model indicated 20.4 and 5.3 Tg of aeolian dust being deposited respectively across continental Asia and the North Pacific Ocean. According to forward trajectory analysis by the FLEXible PARTicle dispersion (FLEXPART) model, the East Asian dust plume moved across the North Pacific within a week. Dust concentrations decreased from the East Asian continent across the Pacific Ocean from a magnitude of 103 to 10−5 µg m−3, while dust deposition intensity ranged from 104 to 10−1 mg m−2. This dust event was unusual due to its impact on continental China, the Korean Peninsula, Japan, and the North Pacific Ocean. Asian dust storms such as those observed in early May 2017 may lead to wider climate forcing on a global scale.
- Article
(9967 KB) - Full-text XML
-
Supplement
(3670 KB) - BibTeX
- EndNote


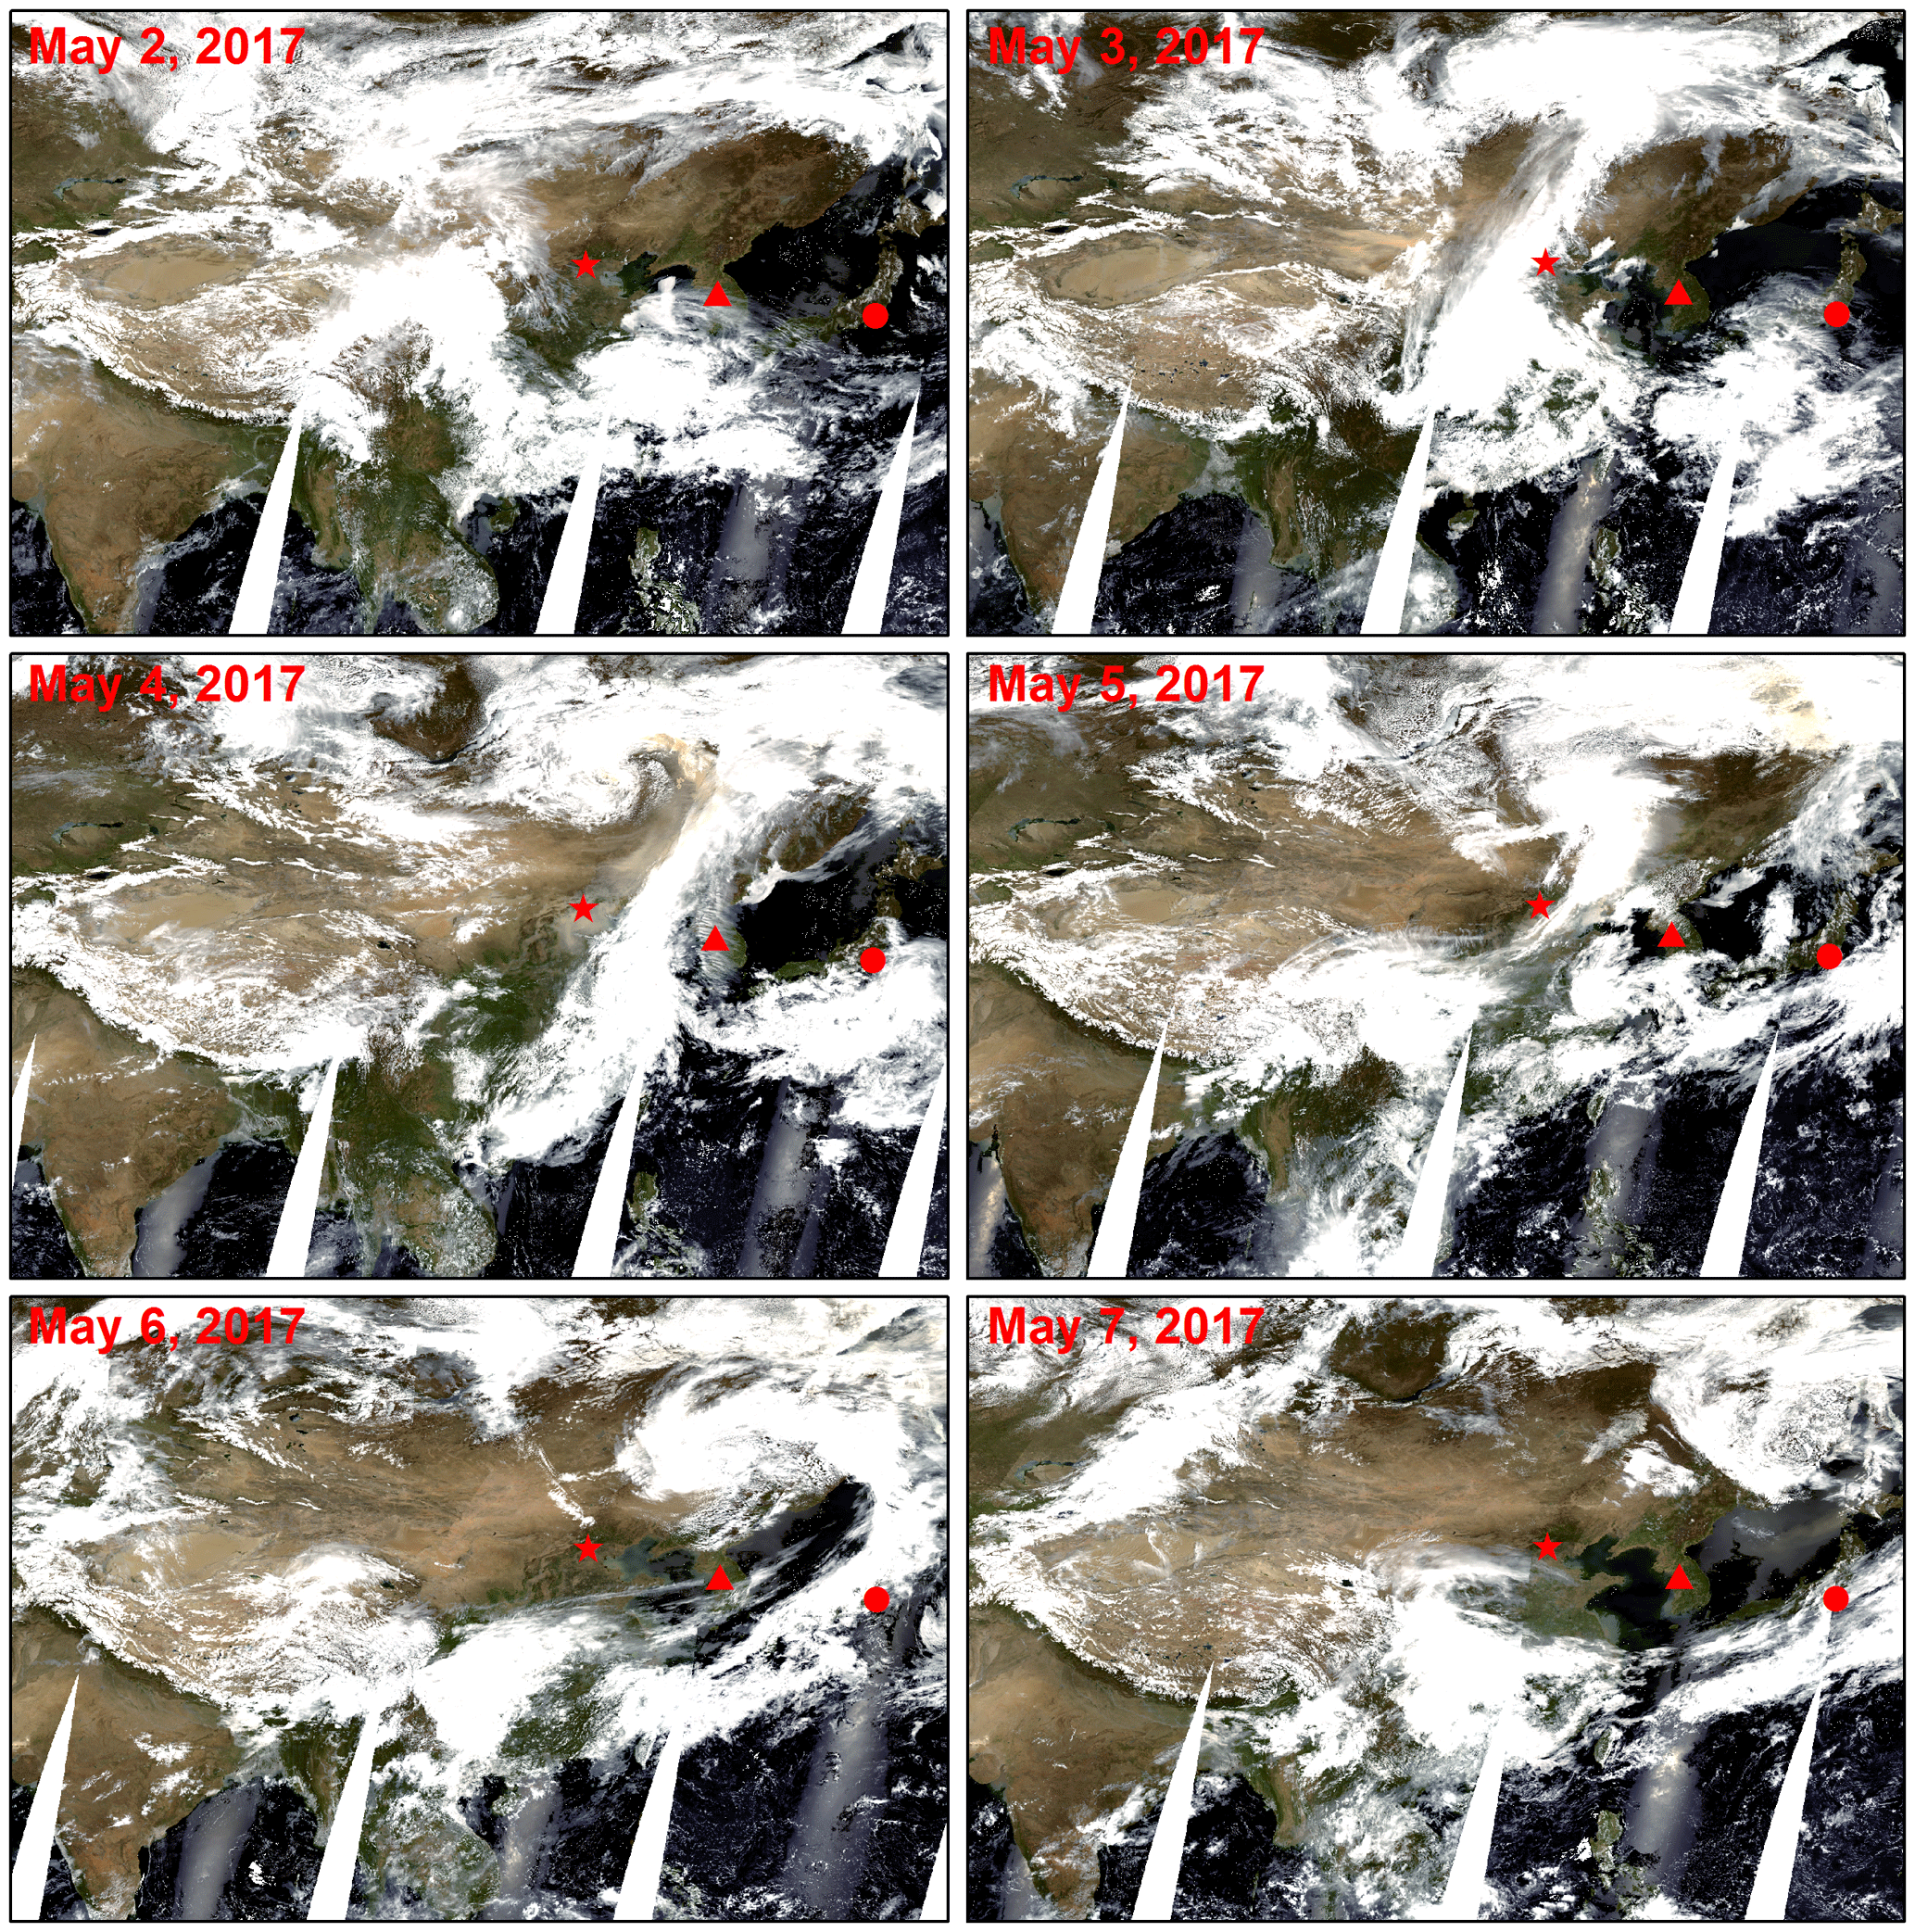
Figure 1MODIS Terra images showing dust outbreak across East Asia from 2 to 7 May 2017. Red stars, rectangles, and circles indicate Beijing, Seoul, and Tokyo, respectively.
A major dust storm arose and swept over East Asia on 2–7 May 2017. This dust storm originated from the deserts of Central and East Asia, namely the Mongolian Gobi Desert, the Taklimakan Desert, the Hexi Corridor, and the Alxa Desert (Figs. 1 and 2). Visibility was reduced to < 100 m as a result of dense dust near Guaizihu (41.37∘ N, 102.37∘ E) on the north edge of the Badain Jaran Desert and Turpan (42.83∘ N, 89.25∘ E) on the north edge of the Taklimakan Desert. Maximum surface wind speed reached 24 m s−1 in the Mongolian Gobi Desert (43.1∘ N, 109.2∘ E) and air quality was consequently very poor during this dust storm. This storm was unusual in that East Asian dust storms typically develop along more south-eastward trajectories (Satake et al., 2004; Nee et al., 2007; Huang et al., 2008). Dust storms develop as a result of the passage of synoptic cold fronts (Hsu et al., 2006). Over the past 5 decades, the frequency of Asian dust events has decreased due to ecological restoration efforts and climate change (Shao et al., 2011a; Lyu et al., 2017a). Strong dust storms have not occurred in the past 7 years. Although East Asian dust storms mostly occur during springtime (Zhang et al., 1997; Shao and Dong, 2006; Chen, 2010; Li et al., 2012), it is essential to determine dust sources, emission, transport, and deposition to enhance our understanding of the negative impact of atmospheric dust on global warming (Tegen et al., 1996; Stanhill, 2005; Park et al., 2011; IPCC, 2013; Carslaw et al., 2013; Huang et al., 2014).
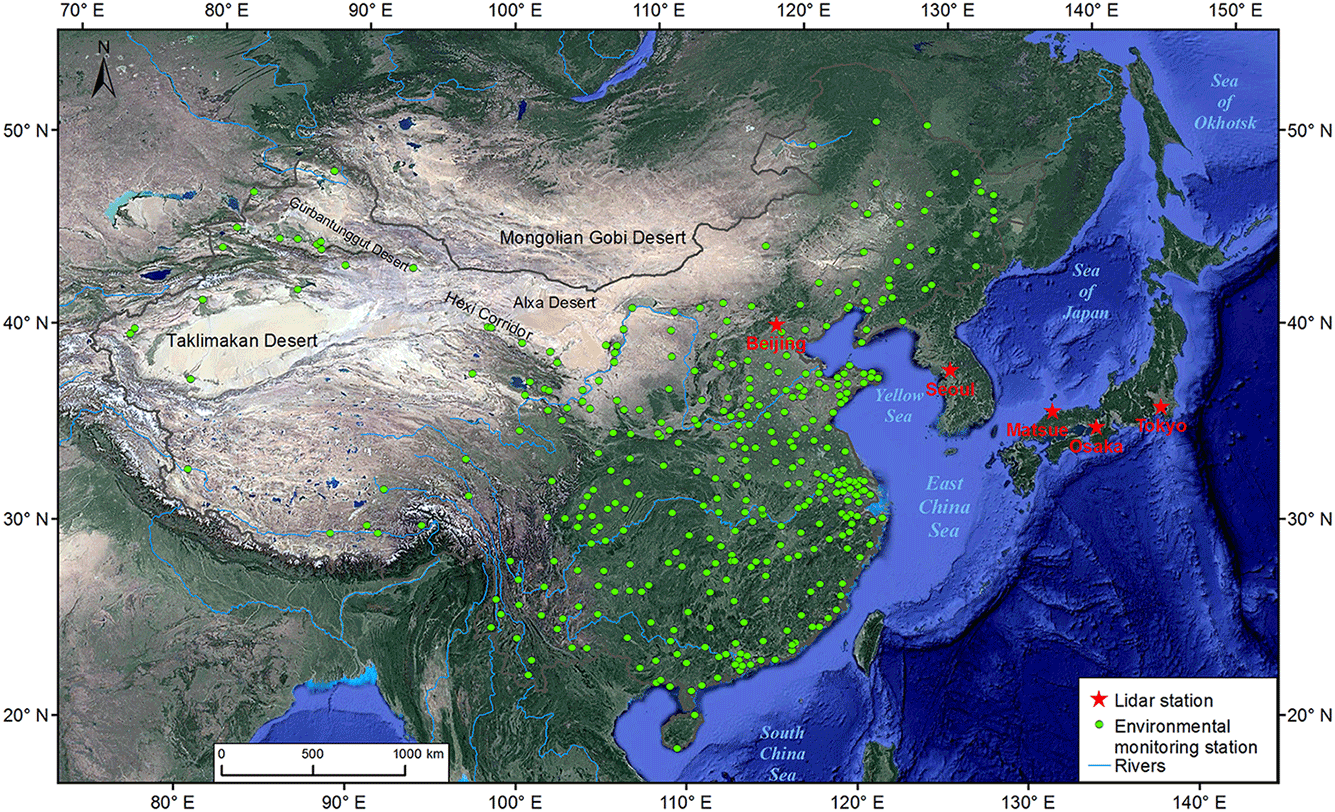
Figure 2Location of environmental monitoring stations in the Chinese mainland and lidar monitoring stations in East Asia.
Dust aerosols can be transported long distances, even on a global scale from Africa to the Americas or from Asia to North America (Merrill et al., 1994; Uno et al., 2009; Shao et al., 2011a). Atmospheric dust has been observed across continents and oceans, giving rise to its importance in both terrestrial and marine ecosystems (Huebert et al., 2003; Mahowald et al., 2009; IPCC, 2013; Kok et al., 2017). Mineral aerosols can influence air quality by reducing visibility and bolstering concentrations of inhalable particulate matter (Sharratt and Lauer, 2006; Huneeus et al., 2011; Goudie, 2014). In dust source regions, atmospheric dust concentrations can approach 1–10 mg m−3, while dust particles can be uplifted to altitudes of 2–10 km under strong wind shear stress (McTainsh and Strong, 2007; Cottle et al., 2013a; Shao et al., 2013; Goudie, 2014). Fine particulates reaching high altitudes may be transported by tropospheric winds (Shao, 2000; Eguchi et al., 2009). Trans-Pacific transport of mineral dust from East Asia to North America has been frequently detected during springtime (Merrill et al., 1989; Mahowald et al., 1999; Uno et al., 2001; Zhao et al., 2003; Gong et al., 2006; McKendry et al., 2008; Cottle et al., 2013a). Long-range transport of dust aerosol has been substantiated by ice core samples taken at the North Pole (Jaffe et al., 1999; Mahowald et al., 2017). In addition, oceanic chlorophyll observations have suggested a strong linkage between mineral dust and oceanic primary production after atmospheric dust deposition events (Young et al., 1991; Mahowald et al., 2009). Duce et al. (1991) and Tagliabue et al. (2017) also suggest a possible association between dust storms and enrichment of iron (Fe) and phosphorus (P) in oceans. Mineral dust aerosols are the primary source of Fe in the atmosphere (Mahowald et al., 2017). According to physically based model estimation, more than 60 Tg Fe and 1 Tg P are deposited into world oceans as a result of the fallout of atmospheric dust (Luo et al., 2005; Mahowald et al., 2017). However, uncertainties exist in assessing the global dust cycle due to a lack of understanding in parameterizing dust emission, transport, and deposition (Wang et al., 2000; Ginoux et al., 2001; Gong et al., 2003; Mahowald et al., 2003; Shao and Dong, 2006; Zhao et al., 2010; Huneeus et al., 2011; Kok, 2011). Therefore, the estimation of the impact of dust on the biogeochemical cycle is still uncertain and unclear (Takemura et al., 2002; Mahowald et al., 2005, 2009; Field et al., 2010; Huneeus et al., 2011; Shao et al., 2013).
Asian dust has long been an environmental concern to China, which notably has affected the formation of the Loess Plateau and historic Chinese civilization (Tsoar and Pye, 1987; An et al., 1991; Zhang et al., 1996; An, 2000; Husar et al., 2001; Chen et al., 2014; Goudie, 2014; Huang et al., 2014). To quantify and assess the impact of dust cycles on the environment, remote sensing (i.e. satellite) and modelling techniques based on physical processes must be used along with environmental monitoring data and surface observations (Shao et al., 2011a). Few studies, however, have combined the use of these techniques and monitoring data to document the fate of dust in the atmosphere and especially the range of transport of dust from its source in East Asia. Trans-Pacific transport not only has the potential to impact the North Pacific marine environment, but also air quality of communities within and downwind of the source region. The purpose of this study was therefore to determine dust emission, transport, and deposition during the May 2017 Asian dust storm using environmental observations and remote sensing data along with simulation techniques.
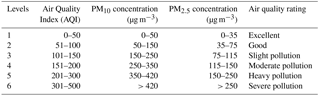
Table 1Ambient particulate matter concentration related to air pollution levels in China.
2.1 Data sources
2.1.1 Air quality data
Air quality data were collected from China and the United States during the May 2017 dust storm event. In China, hourly PM10 and PM2.5 concentration data were collected from 367 environmental monitoring stations (Fig. 2) maintained by the Ministry of Environmental Protection (MEP, 2011). Ambient PM10 and PM2.5 concentrations (µg m−3) were measured with beta radiation attenuation monitors, designed to continuously collect particulate matter and widely used in air quality monitoring. The technique relies upon the absorption of beta radiation by solid particles extracted from air flow in determining PM10 and PM2.5 concentration (US EPA, 2009). The particulate matter monitors were installed 1.5 m above the ground. Air quality index (AQI) data were obtained from nationwide air quality monitoring statistics published by the MEP (http://datacenter.mep.gov.cn, last access: 11 June 2018). These AQI data were used to illustrate the influence of airborne dust versus other air pollutants on ambient air quality. In this study, we assessed AQI based upon only particulate matter concentrations. The AQI is dependent on the concentration of a single air pollutant (US EPA, 2006; Wang et al., 2013) and calculated according to
where AQIi is the index for pollutant i (i.e. PM10, PM2.5), AQIu and AQIL are the upper and lower limits of the index for a specific category of air quality (i.e. excellent, good, slight pollution, moderate pollution, heavy pollution, and severe pollution), Ci is the observed concentration of pollutant, and Cu and CL are the upper and lower concentration limits of the pollutant for a specific category of air quality. Information regarding the determination of the AQI can be accessed from the MEP (MEP, 2012a, b). Based on the AQI, air quality was classified as excellent, with AQI ≤ 50; good, with AQI 50–100; slight pollution, with AQI 100–150; moderate pollution with AQI 150–200; heavy pollution, with AQI 200–300; and severe pollution, with AQI 300–500. Air quality indices associated with particulate matter concentrations are listed in Table 1.
In the United States, hourly ambient PM10 concentration data were collected at 12 locations maintained by the Environmental Protection Agency (EPA). Data were obtained from https://aqs.epa.gov/aqsweb/airdata/download_files.html (last access: 11 June 2018) for the time period 2–15 May in an attempt to identify elevated concentrations arising from the long-range transport of dust from Asia.
2.1.2 Satellite data
Moderate Resolution Imaging Spectroradiometer (MODIS) Terra satellite data were collected from the U.S. National Aeronautics and Space Administration (https://terra.nasa.gov, last access: 11 June 2018). The Terra satellite images the entire Earth's surface every 1 to 2 days in 36 discrete spectral bands. MODIS Level 3 Deep Blue products of aerosols optical depth (AOD) were collected for analysing the spatio-temporal distribution of dust aerosols across large spatial scales (Hyer et al., 2011); products collected included comprehensive properties of aerosol optical depth, the Ångström exponent, and total column optical extinction of aerosol at a wavelength of 550 nm. Extinction at a wavelength of 550 nm has been used to quantitatively track the evolution of global dust and fine-mode anthropogenic aerosols (Hsu et al., 2006).
The CALIPSO (Cloud-Aerosol Lidar and Infrared Pathfinder Satellite Observations) satellite was launched on 28 April 2006 to study the roles of clouds and aerosols on climate and weather. The satellite carries three instruments: the Cloud-Aerosol Lidar with Orthogonal Polarization (CALIOP), the Imaging Infrared Radiometer (IIR), and the Wide Field Camera (WFC). Passive and active remote sensing instruments on the satellite continuously monitor aerosols and clouds at a temporal and spatial resolution of 0.74 s and 333 m, respectively. We used CALIPSO AOD data at 532 nm of the Vertical Feature Mask (VFM) level 2 version 4.10 to analyse mineral dust transport across the North Pacific Ocean. The use of CALIPSO products (https://eosweb.larc.nasa.gov/project/calipso/cal_lid_l2_vfm-standard-v4-10, last access: 11 June 2018) allows aerosols to be classified as clean marine, dust, polluted continental, clean continental, polluted dust, and smoke.
2.1.3 Meteorological data
Meteorological data, including synoptic conditions, surface wind speed, and visibility, for more than 2000 meteorological observation stations in East Asia were collected from the China Meteorological Administration. Observations were taken every 3 h. Dust conditions at each station were defined by visibility and subjective synoptic reports according to World Meteorological Organization (WMO) protocol. Both “present weather” and “past weather” conditions were recorded by the meteorological observer with descriptions in specified format and codes. Codes were used to designate the intensity and duration of dust periods (http://www.wmo.int/pages/prog/www/WMOCodes.html, last access: 11 June2018; Shao and Dong, 2006).
2.1.4 Lidar data
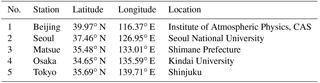
Lidar data, which were used to examine the vertical distribution of dust in the atmosphere, were collected from the Asian dust observation network, AD-Net (http://www-lidar.nies.go.jp/AD-Net, last access: 11 June 2018), for meteorological stations in Beijing, Seoul, Matsue, Osaka, and Tokyo (Fig. 2 and Table 2). The ground-based lidars were developed by the Japanese National Institute for Environmental Studies (NIES) and operated as part of the Japanese NIES lidar network and AD-Net (Murayama et al., 2001; Shimizu et al., 2004). Dust particles tend to be highly non-spherical and show a high degree of depolarization (Cottle et al., 2013a); therefore we used non-spherical data observed by the lidar network. Depolarization at dual-wavelength channels of 1064 and 532 nm was used to identify aerosol types from the lidar measurements (Sugimoto et al., 2003; Shimizu et al., 2004). The laser beam was vertically oriented toward the sky and collimated with a beam expander. The beam had an output power of 20 mJ pulse−1 at 1064 nm (30 mJ pulse−1 at 532 nm) and a pulse repetition rate of 10 Hz (Shimizu et al., 2016). The scattered light was received by a 20 cm Schmidt Cassegrain type telescope, which separated the light at 532 and 1064 nm (Sugimoto et al., 2008). The measured lidar signal was collected every 15 min with a vertical resolution of 30 m. Detailed information on the calibration method and its accuracy can be found in Shimizu et al. (2004).
2.2 WRF-Chem model
The Weather Research and Forecasting with Chemistry (WRF-Chem) model (version 3.7.1 available at http://ruc.noaa.gov/wrf/WG11, last access: 11 June 2018) was used to simulate dust aerosol emission, transport, and deposition across the Asia-Pacific region. The model was run using National Center for Atmospheric Research/National Centers of Environmental Prediction (NCAR/NCEP) reanalysis meteorological input data (http://rda.ucar.edu/datasets/ds083.2, last access: 11 June 2018) at a horizontal resolution of 1∘ × 1∘ and vertical resolution of 26 levels. The WRF-Chem model included the following components: the Noah land surface scheme, the Yonsei University planetary boundary layer scheme, the MM5 similarity surface layer scheme, the WRF single-moment 5-class microphysics scheme, and the Grell 3-D cumulus scheme. Simulations were carried out from 25 April to 10 May 2017, the first week of simulation (25 April–1 May) being a spin-up period to reduce the impact of initial conditions. Emission of dust particles from the surface is a key component in the surface exchange process (Wesely and Hicks, 2000) and dust emission flux is closely related to the mass of dust deposition (Whicker et al., 2014). Dust emissions are simulated by various modules in the WRF-Chem model, including the Georgia Tech/Goddard Global Ozone Chemistry Aerosol Radiation and Transport (GOCART) model (Chin et al., 2000; Ginoux et al., 2001), the Model for Simulating Aerosol Interactions and Chemistry (MOSAIC), the modified GOCART model, the Shao (2001) scheme, the Shao (2004) scheme, and the Shao et al. (2011b) scheme. The size-resolved dust emission scheme of Shao et al. (2011b) was developed based upon implicit physical mechanisms following the schemes of Shao (2001, 2004). The Shao et al. (2011b) scheme has been rigorously examined and validated with field measurements, and found to perform well in simulating dust emission fluxes (Shao et al., 2011b). Therefore, in this study, we selected the dust emission scheme of Shao et al. (2011b) in the WRF-Chem model as this scheme has been widely used and tested in the East Asia Gobi Desert region (Kang et al., 2011; Wu and Lin, 2014). The Shao et al. (2011b) dust emission scheme classified particles into four bin sizes: 0–2.5, 2.5–5, 5–10, and 10–20 µm. Dust deposition in the WRF-Chem model was simulated using Wesely's aerodynamic resistance model (Wesely, 1989), which accounts for the diffusion of particulates through the air.

Figure 3Observations of PM10 concentrations across the Chinese mainland during 2–7 May 2017. PM10 concentrations are reported as average hourly based on 24 observations during the day. Land use types are identified across the Chinese mainland according to Wang et al. (2005).
2.3 Trajectory model
We used the FLEXPART model (FLEXible PARTicle model, version 9.0.2, available at http://www.flexpart.eu, last access: 11 June 2018) to simulate long-range and mesoscale dispersion of air parcels over the Asia-Pacific region. This model simulates forward in time to trace particles from source areas or backward in time to backtrack particles from given receptors (Brioude et al., 2013). In this study, we simulated 216 h forward trajectories at 00:00, 12:00, and 24:00 UTC each day during the period 2–10 May 2017. The trajectories were simulated starting at the receptor point of potential dust emission sources (discussed in Sect. 3.2) from 2000 to 3000 m a.s.l. (above sea level); this range of altitudes was chosen because trans-Pacific dust clouds have been observed at these altitudes (Cottle et al., 2013a, b). Input data for the FLEXPART model were derived from the NCEP Global Data Assimilation System mesoscale meteorological global model. These data included 6 h products such as temperature, precipitation, wind speed, relative humidity, and geopotential height for 23 levels.

Figure 4Hourly air quality index as observed for major stations in China during 2–7 May 2017. The PM10 pollutant contributing to the hourly AQI is identified for each station.
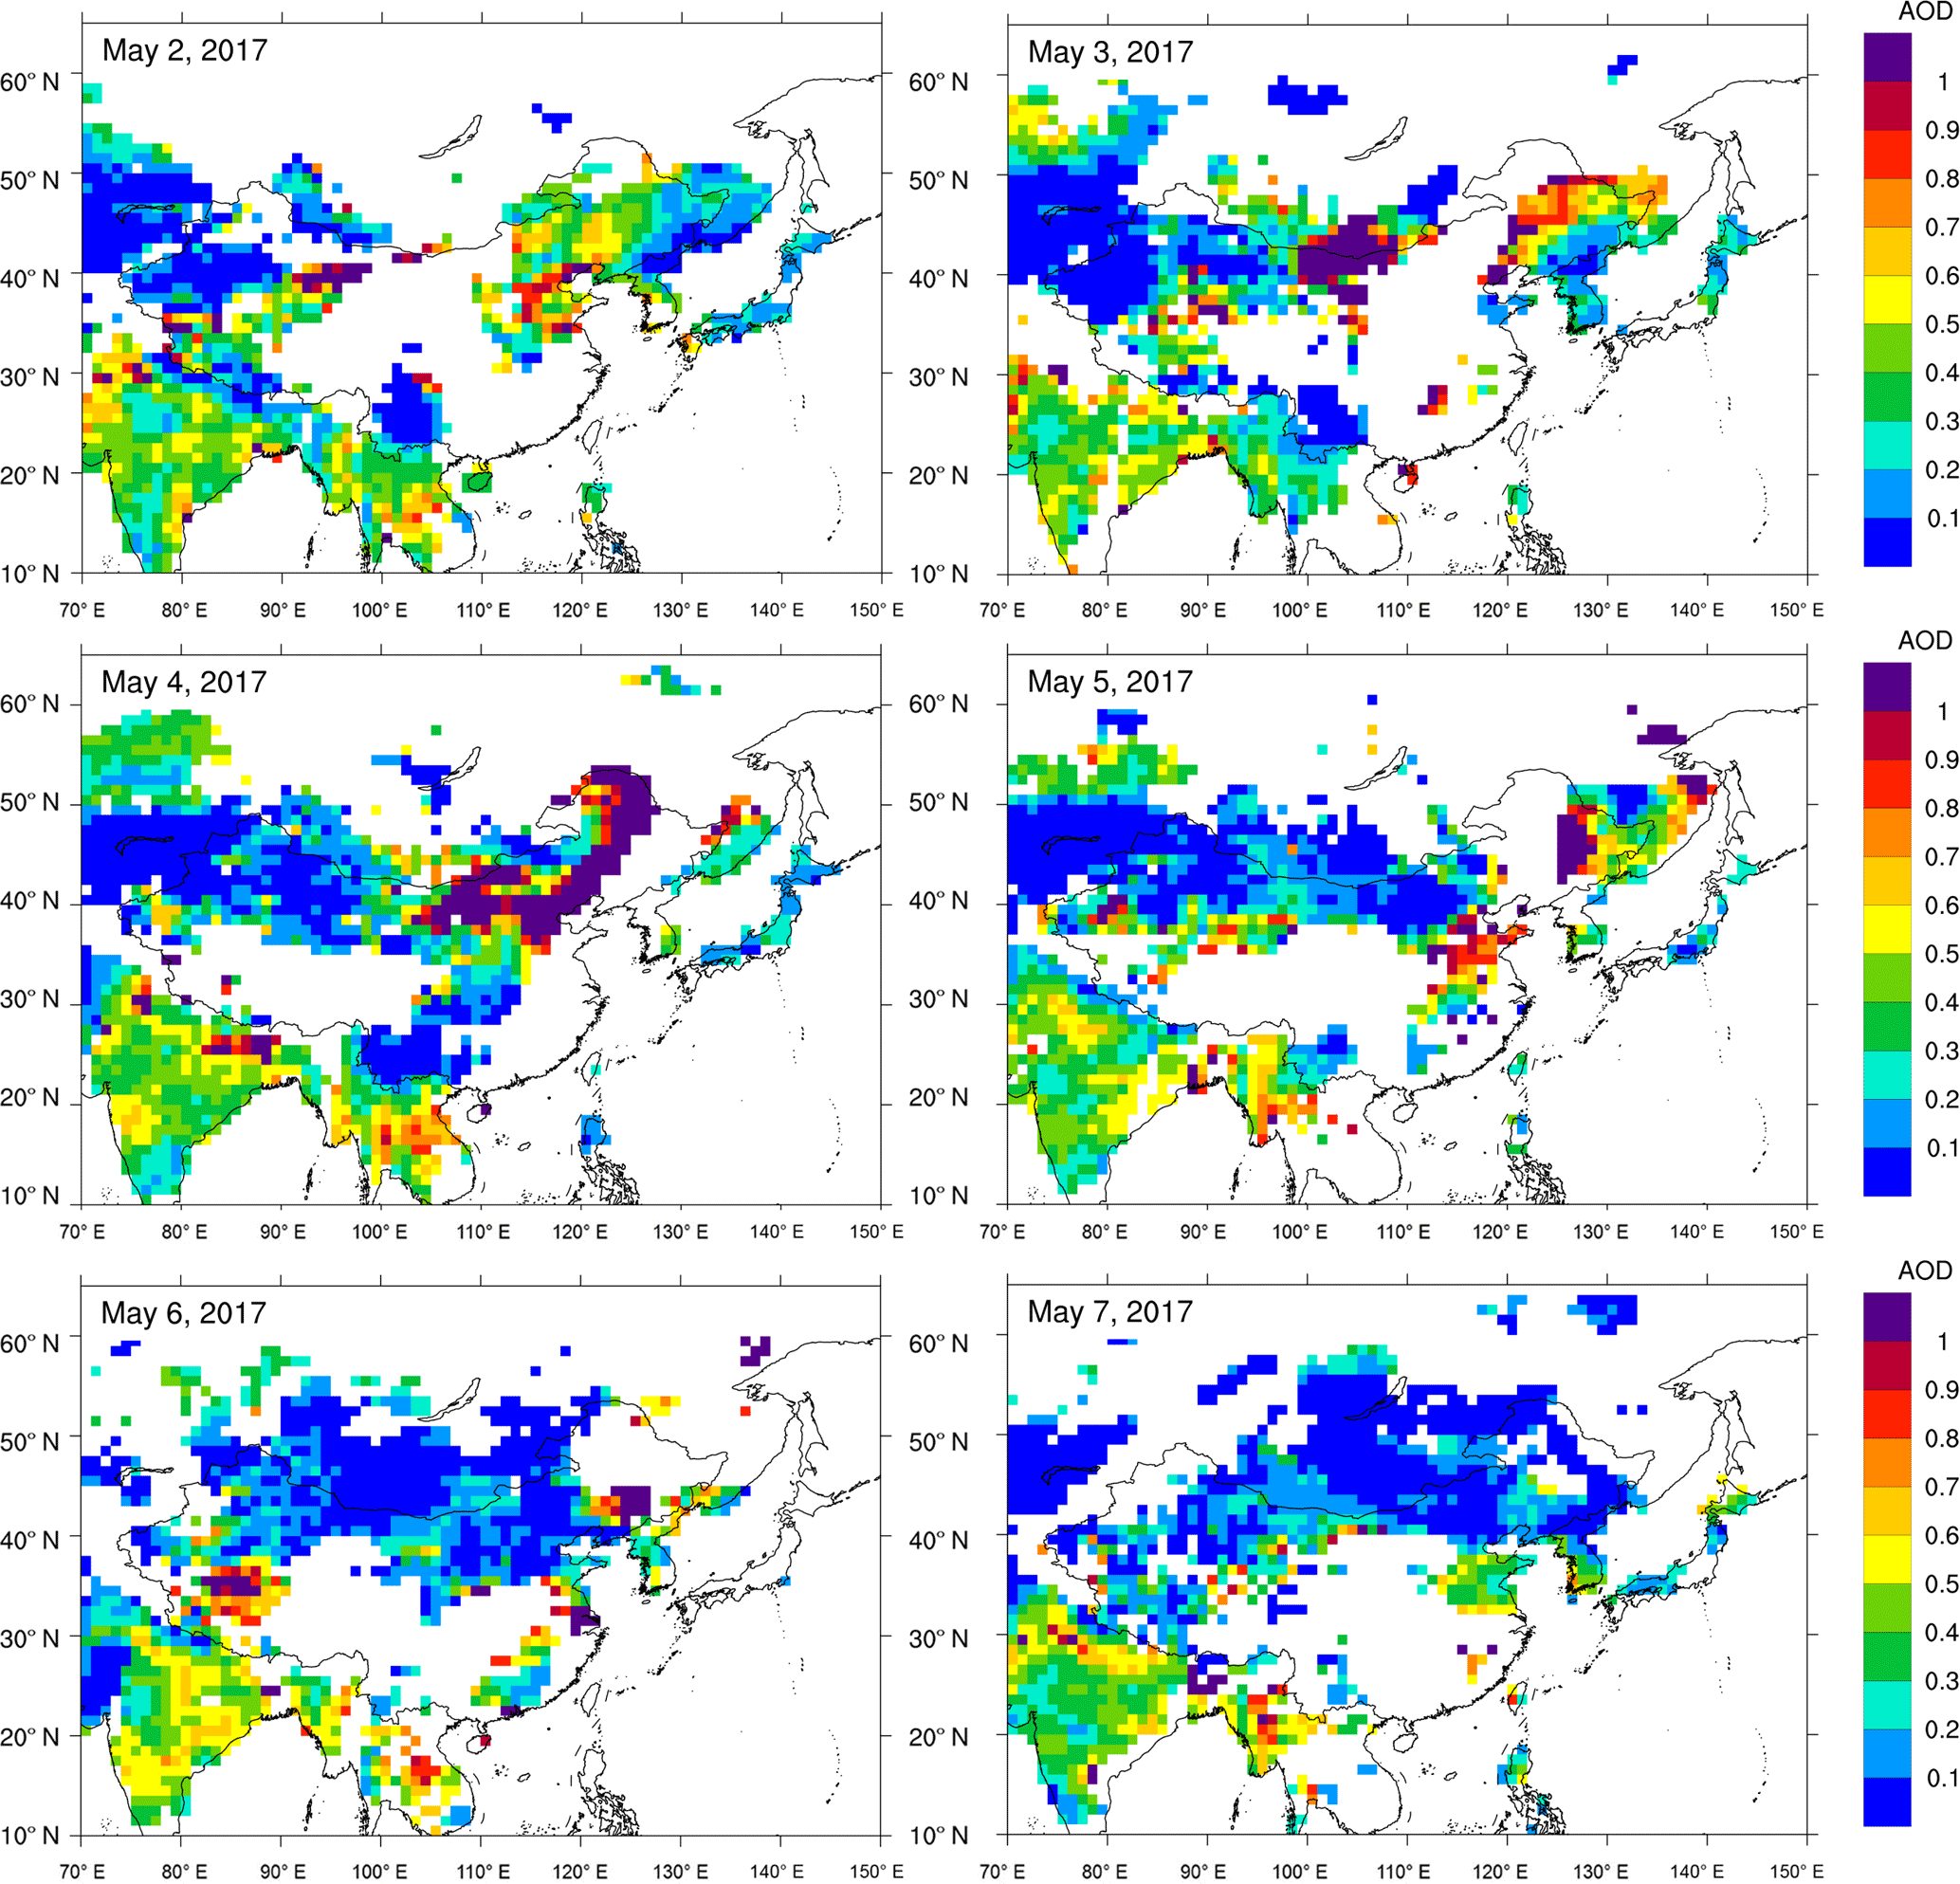
Figure 5Distribution of mean AOD at 550 nm derived from the MODIS Terra Deep Blue product in East Asia during 2–7 May 2017.
3.1 Pervasive air pollution
Figure 1 shows an overview of the severe dust storm that developed over East Asia on 2–7 May 2017 using data from the MODIS Terra sensor. The dust storm originated in the Mongolian Gobi Desert, the Hexi Corridor, and the Taklimakan Desert on 2 May 2017. Dense dust clouds formed initially over southern Mongolia and western Inner Mongolia on 2–3 May 2017, then moved quickly across northern and northeastern China and migrated pervasively into the southeast China coast, the Korean Peninsula, and Japan. On 4 May, yellow dust clouds masked the North China Plain and northeastern China as these regions were not visible from space. The strongest dust plumes were observed over southern Mongolia and western Inner Mongolia on 3 May 2017. Dust signals were accordingly captured in the Yellow Sea and the East China Sea on 4–6 May, and in the north of the Sea of Japan and Sea of Okhotsk on 6–7 May. Figure 3 depicts the movement of dust clouds across continental China according to the spatio-temporal variation in average hourly PM10 concentration at 367 Chinese environmental monitoring stations during this dust event. The maximum observed hourly PM10 concentration was above 1000 µg m−3 in Beijing, Tianjin, Shijiazhuang, Baoding, Langfang, Xi'an, and Lanzhou, and above 2000 µg m−3 in Erdos, Hohhot, Baotou, Alxa, Shizuishan, Yan'an, Changchun, and Jilin. The highest hourly PM10 dust concentration (4277 µg m−3) was observed over Inner Mongolia at Erdos (39.59∘ N, 109.77∘ E) at 02:00 on 5 May, which was 30 times higher than the concentration observed on 2 May. Figure 3 also indicates that air quality was beginning to deteriorate in northwestern China on 2 May as PM10 concentrations were 759 µg m−3 at Aksu and 380 µg m−3 at Hotan in the Taklimakan Desert. Air quality simultaneously deteriorated along the Hexi Corridor as PM10 concentrations were 1297 µg m−3 in Jiuquan, 957 µg m−3 in Zhangye, 869 µg m−3 in Jiayuguan, and 796 µg m−3 in Jinchang. It should be noted that major cities in the Northeast China Plain such as Beijing, Langfang, Shijiazhuang and Zhengzhou had level 2 or 3 air quality on 2 May due to anthropogenic pollution caused by static stability weather conditions. On 3 May, air pollution became evident in northern China, especially central Inner Mongolia and northeastern China. PM10 concentration rose to 2500 µg m−3 in Hohhot, 1540 µg m−3 in Baotou, 898 µg m−3 in Erdos, 1526 µg m−3 in Shizuishan, 2403 µg m−3 in Wuhai, 3706 µg m−3 in Banyan Nur, 2592 µg m−3 in Ulanqab, and 1681 µg m−3 in Alax. In addition, PM10 concentrations in northeastern China rose to 1634 µg m−3 in Mudanjiang, 1056 µg m−3 in Songyuan, and 1249 µg m−3 in Suihua. On 4 May, the dust storm severely influenced the North China Plain as PM10 concentrations rose to 1000–2000 µg m−3. Beginning at 04:00 (CST) on 4 May, air quality deteriorated in Beijing, Tianjing, and Shijiazhuang in the North China Plain as well as in Changchun, Jilin, and Tongliao in the Northeast China Plain. Ambient PM10 concentration in Beijing increased from 62 µg m−3 at 03:00 to 491 µg m−3 at 04:00 and then to 1000 µg m−3 at 07:00. On 4 May, the maximum ambient PM10 concentration at Tianjin, Shijiazhuang, and Zhangjiakou was respectively 1508, 1475, and 2849 µg m−3. Aeolian dust migrated south-eastward to the Central Plain in the lower reaches of the Yellow River. Dense dust clouds continued to move east to southeast China, where high PM10 concentrations were observed on the Shandong Peninsula on 5 May 2017. On this date, the ambient PM10 concentration in Qingdao rose from 39 µg m−3 at 13:00 to 831 µg m−3 at 17:00. The adverse effects of the dust storm subsided on 5 May in northwestern China as PM10 concentrations in Aksu, Hotan, Jiayuguan, Zhangye, and Jiuquan decreased respectively to 147, 224, 64, 106, and 71 µg m−3. The Changjiang River Delta region in east-central China was affected by dust on 6–7 May 2017. Compared with the excellent air quality (PM10 concentrations ranged from 37 to 41 µg m−3) on 4–5 May, PM10 concentrations in Shanghai and Nanjing increased to 194–282 µg m−3 on 6 May. Dust clouds crossed the Changjiang River Delta region and extended to Jiangxi Province in southern China. The PM10 concentration in Jiujiang (Jiangxi Province) rose from 56 to 225 µg m−3 within 24 h and peaked at 275 µg m−3 at 02:00 on 7 May. The spatio-temporal variation in PM2.5 concentration at the 367 stations is provided in Fig. S1 in the Supplement. PM2.5 concentrations paralleled PM10 concentrations across the region with PM2.5 ∕ PM10 ratios of 0.3 to 0.5 (Fig. S2).
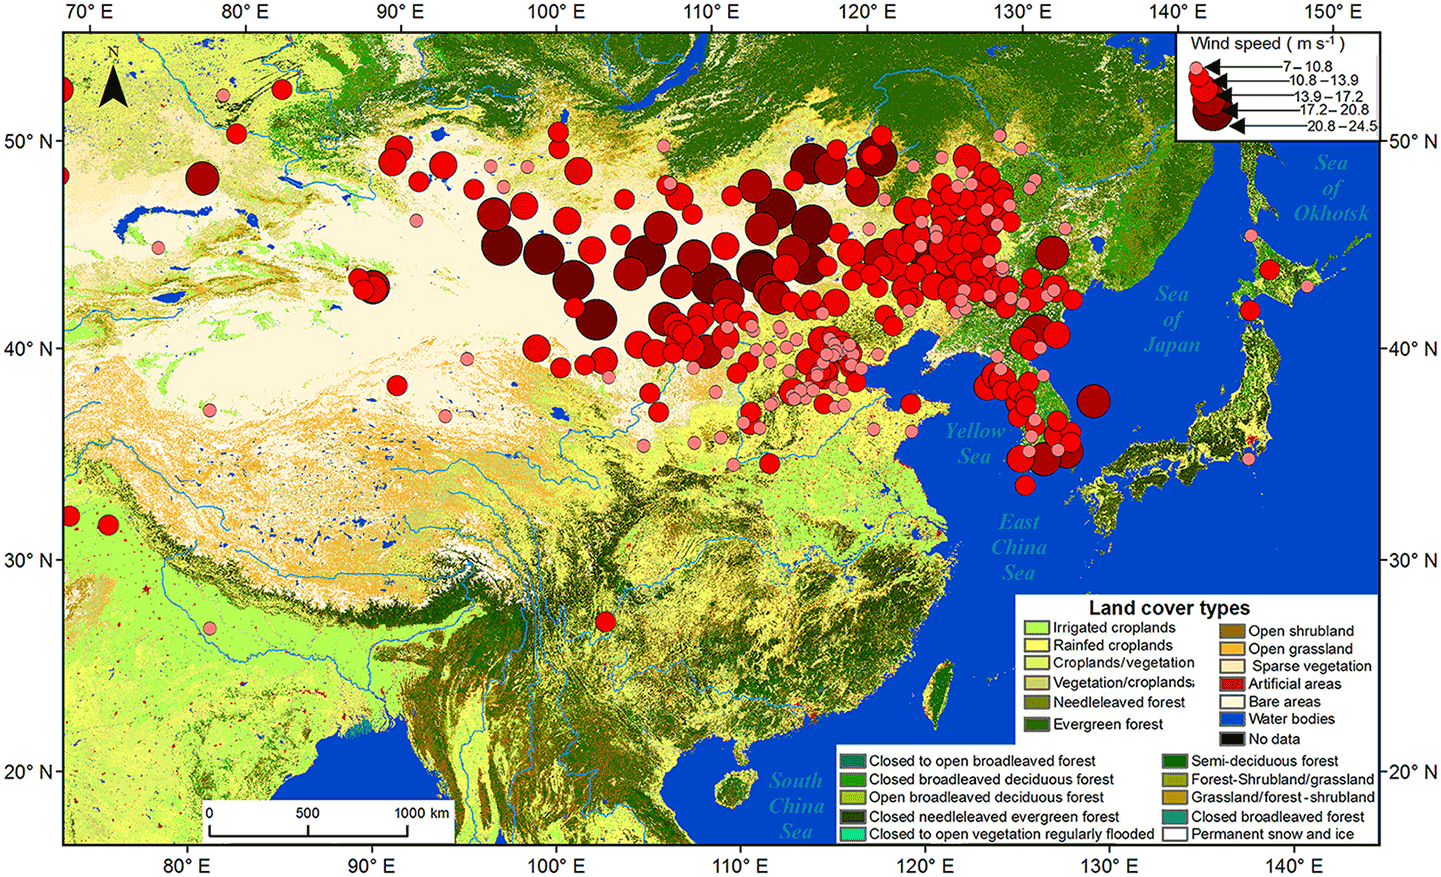
Figure 6Maximum wind speed across East Asia during 2–7 May 2017. Land cover types in East Asia are derived from global land cover products published by the European Space Agency (ESA).
Airborne dust is one of the chief pollutants influencing air quality in China (Zhang et al., 2010). Thus, the relative contribution of mineral dust to the AQI was analysed to identify the impact of airborne dust on air quality in major cities of China. We examined the relative contribution of dust to AQI at Alxa, Erdos, and Hohhot in the arid region of northern China, Beijing, Tianjing, and Shijiazhuang in the North China Plain, Xi'an, Zhengzhou, and Qingdao in central China, and Wuhan, Nanjing, and Shanghai in southeastern China (Fig. 4). The data suggest that atmospheric dust pollution decreased from north to south and from west to east (inland to coast). Degraded air quality would have affected more than 700 million Chinese people living in the path of the dust storm.
MODIS AOD, with a quality assurance confidence (level 2 single pixel measurements) of 3 over land and > 0 over ocean and a maximum retrievable signal of 1.0 (Masuoka et al., 2010), was used to describe the dust load in East Asia. Mahowald et al. (2017) indicated that during dust events, AOD can be used as a reliable tool to represent dust loading in the atmosphere. High AOD values were observed in Mongolia, Inner Mongolia, Hexi Corridor, the eastern Taklimakan Desert, and the Northwest China Plain (Fig. 5). The MODIS AOD data indicated that atmospheric mineral dust reached east Taiwan to the south and crossed the East China Sea toward the North Pacific region. Our comparison of MODIS AOD with WRF-Chem model simulations corroborated the spatio-temporal variation in the dust cloud throughout the Asian region. The pattern of evolution of the severe East Asian dust storm during 2–7 March 2017 was reasonably well reproduced by the WRF-Chem model and showed the ability to capture the major characteristics of the dust storm event.
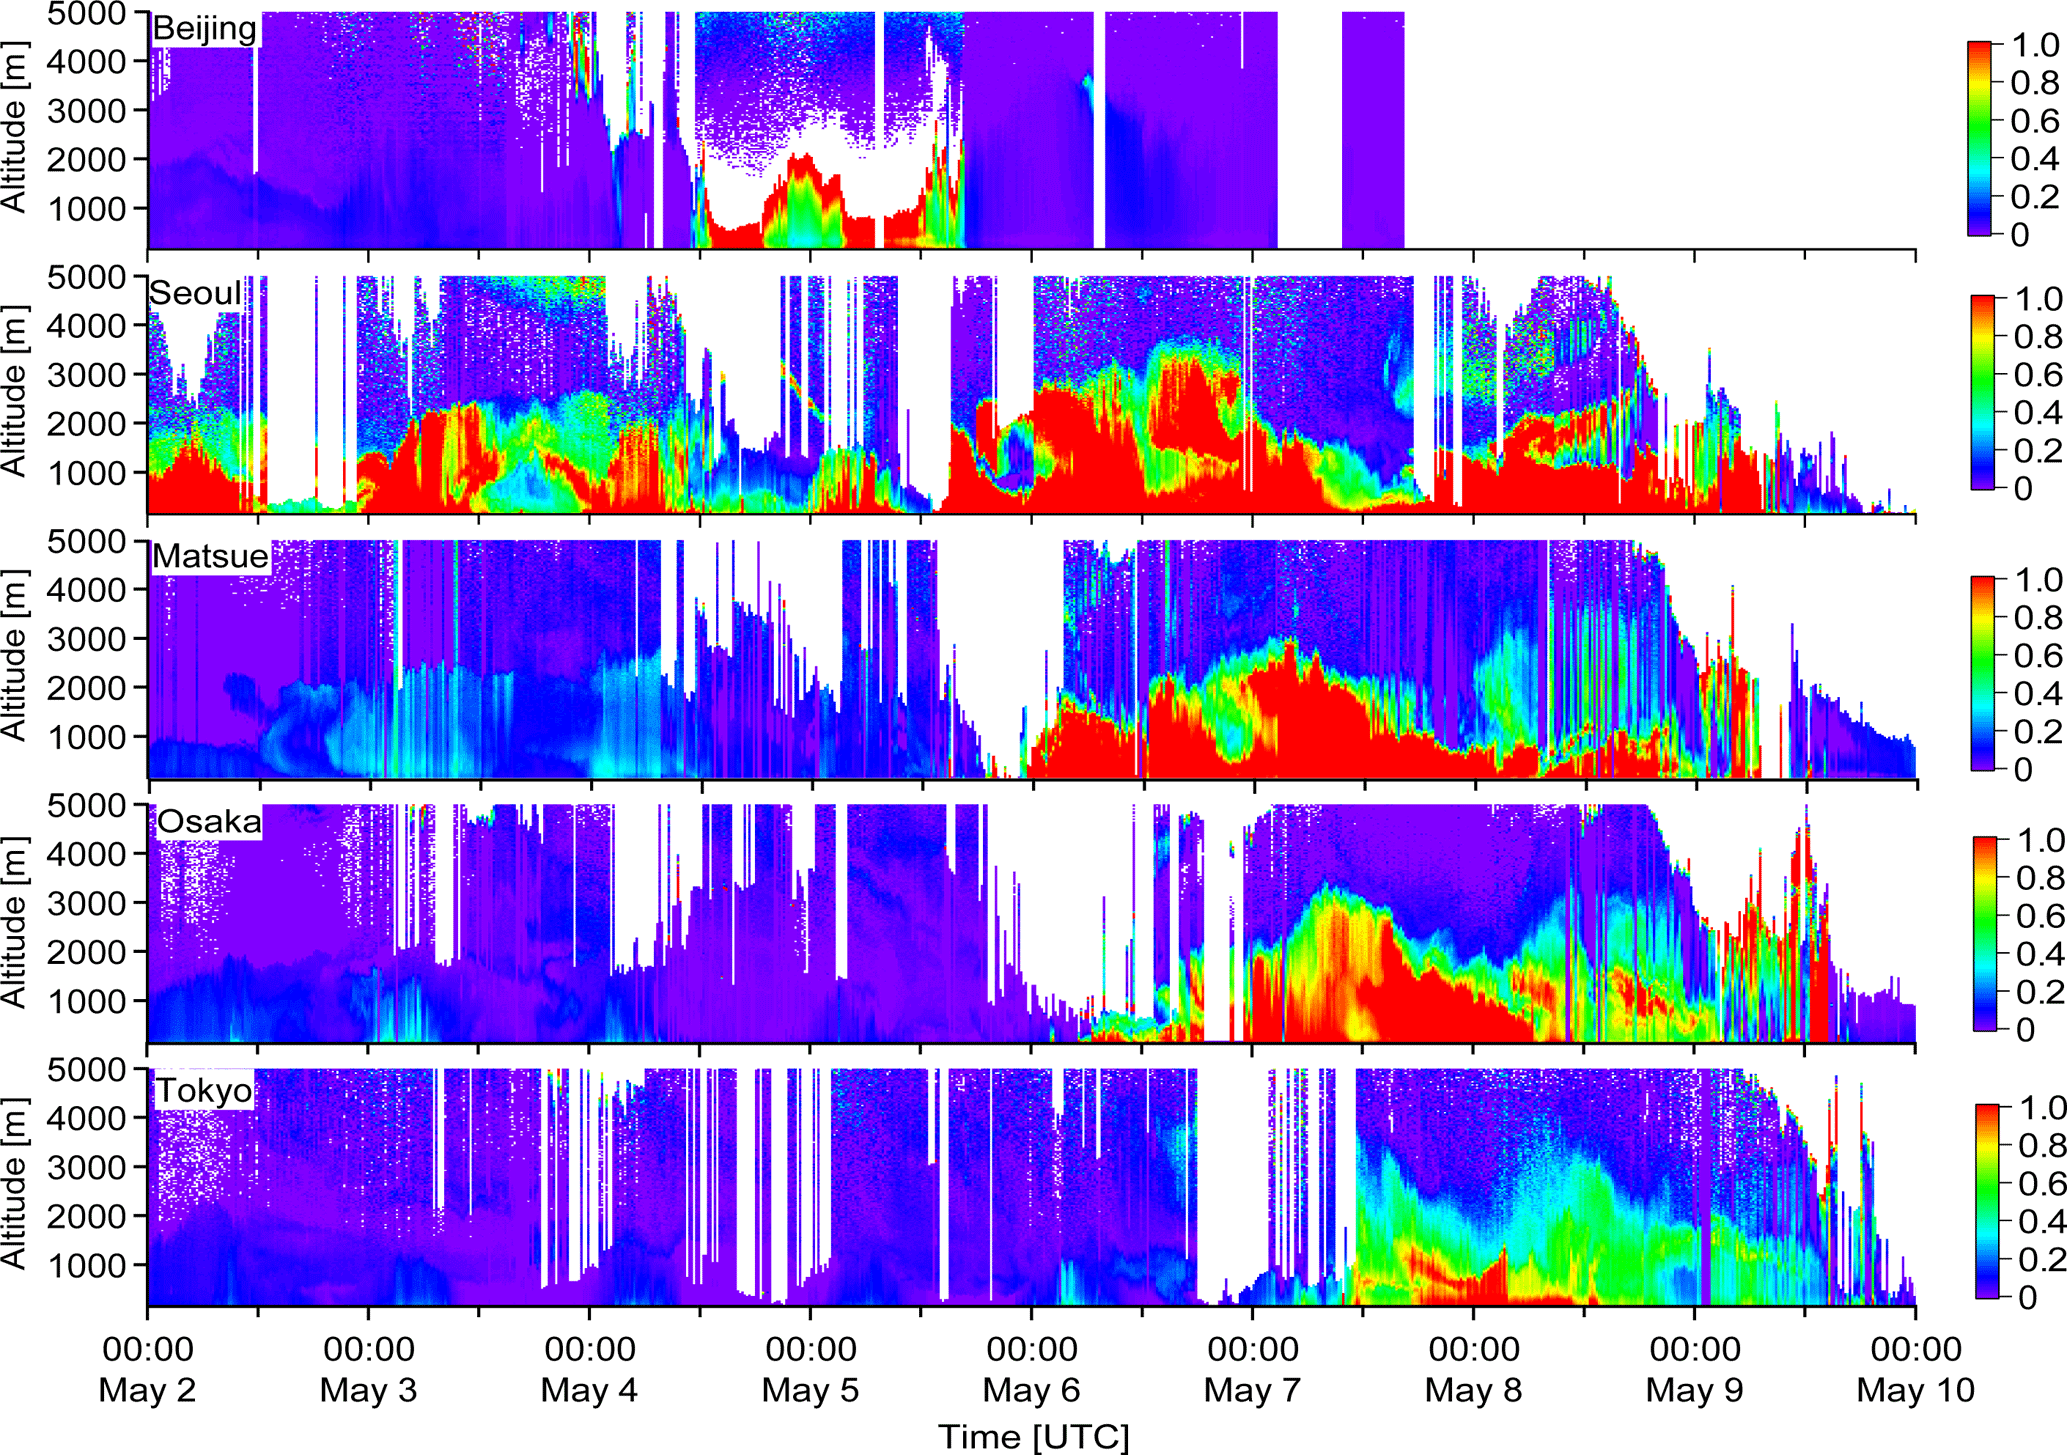
Figure 7Lidar profile of dust vertical distribution in Beijing, Seoul, Matsue, Osaka, and Tokyo during 2–10 May 2017. Colours indicate depolarization ratio observed in ground lidar.
3.2 Distribution of maximum wind speed
Dust storms are typically caused by anticyclone conditions that result in high winds across northwestern China (Shao, 2000). The magnitude of wind speed is one of the main factors influencing dust emission, transport and deposition processes (Pye, 1987; Liu et al., 2005). Dry soil particles were uplifted from the surface by aerodynamic forces under strong winds, generating dust emission. The uplift of particles or initiation of wind erosion generally occurs at wind speeds above 7 m s−1 (Saxton et al., 2000; Sharratt et al., 2010; Liu et al., 2015). Figure 6 presents the spatial distribution of maximum wind speed above 7 m s−1 under the observed synoptic conditions in East Asia at the meteorological stations during 2–7 May 2017. The data show winds were sufficient to cause wind erosion in Mongolia, northern China, and the Korean Peninsula. Maximum surface wind speeds above 17.2 m s−1 (categorized meteorologically as a strong wind) were observed in the Gobi Desert of southern and southeastern Mongolia (e.g. Zamiin Ude, Barum-Urt, and Tsgot-Ovo) and central Inner Mongolia (e.g. Erenhot, Suniteyouqi, Xilinhot, and Hails). Synoptic records indicated that visibility was reduced to < 100 m at Guaizihu (41.37∘ N, 102.37∘ E) in the Badain Jaran Desert and at Turpan (42.83∘ N, 89.25∘ E) on the north edge of the Taklimakan Desert. The maximum surface wind speed during the dust storm was 23–24 m s−1 in the Mongolian Gobi Desert and 20–22 m s−1 in central Inner Mongolia, indicating that these are likely potential source regions during the dust event. Under strong northwest and west winds, aeolian sand and dust were blown south-eastwards to Asia-Pacific regions. Atmospheric dust was, therefore, observed over the Korean Peninsula and Japan (e.g. Asahikawa, Hakodate, Oshima, Kushiro, and Wakkanai) during 6–7 May 2017.
3.3 Vertical and horizontal dust dispersion
The observed temporal and vertical dust layering structures and dust mass concentration provide information for the validation of dust transport simulation studies. These dust characteristics were identified by lidars and suggest the transport and dispersion of dust originating in northwestern China were influenced by strong atmospheric circulation forcing. Figure 7 illustrates lidar observations of vertical dust profiles in Beijing, Seoul, Matsue, Osaka, and Tokyo from 2 to 10 May 2017. Airborne dust appeared to be uplifted to altitudes of 1.5–3.5 km. Dust was clearly visible in lidar observations beginning on 2 May in Beijing and Seoul and ending in the Korean Peninsula and Japan on 9 May. The detection of dust in Beijing and Seoul on 2 May indicates the rapidity of transport of dust from northwestern China. The layering structures from lidars were identified as dust using the depolarization ratio. Unfortunately, lidar observations in Beijing were not possible on 6 May due to routine maintenance. In the lidar measurement for this study, the well-mixed boundary layers in East Asia, prior to the obvious intermingling of subsiding layers from above, show depolarization ratios 150–250 % higher than boundary layers in North America (Cottle et al., 2013a). This indicates that dust clouds moved across the North China Plain at altitudes < 1500 m. Our lidar observations of dust being uplifted to altitudes of 3.5 km above the Korea Peninsula and Japan agree closely with those of Murayama et al. (2001) who observed dust being uplifted to altitudes of 3 km over Japan and 4–5 km over the Korean Peninsula as a result of a wind erosion event in northwestern China and Mongolia in 1998.
Dust arising from the surface during wind erosion events may be transported along different pathways in the atmosphere due to variations in atmospheric circulation and vertical mixing within the atmosphere across events (Satake et al., 2004). To provide insight into dust flow trajectories and the impact of dust from the potential sources (discussed in Sect. 3.2) on regions downwind of the source, Fig. 8 depicts the 9-day forward trajectories of dust particles from 2 May 2017 (00:00 UTC) by the FLEXPART model. This numerical experiment identified the location of dust emissions according to the ground observations by WMO. Simulations indicated dust particles were released from source regions with an intensity of 1000 mg m−2 at 2000 to 3000 m a.s.l. Strong atmospheric circulation resulted in the transport of this emitted dust to the North American continent within a week. The FLEXPART model indicated a high probability that dust particles emitted during the 2 May dust storm event crossed the North Pacific Ocean and reached the coasts of the northwestern United States and western Canada.
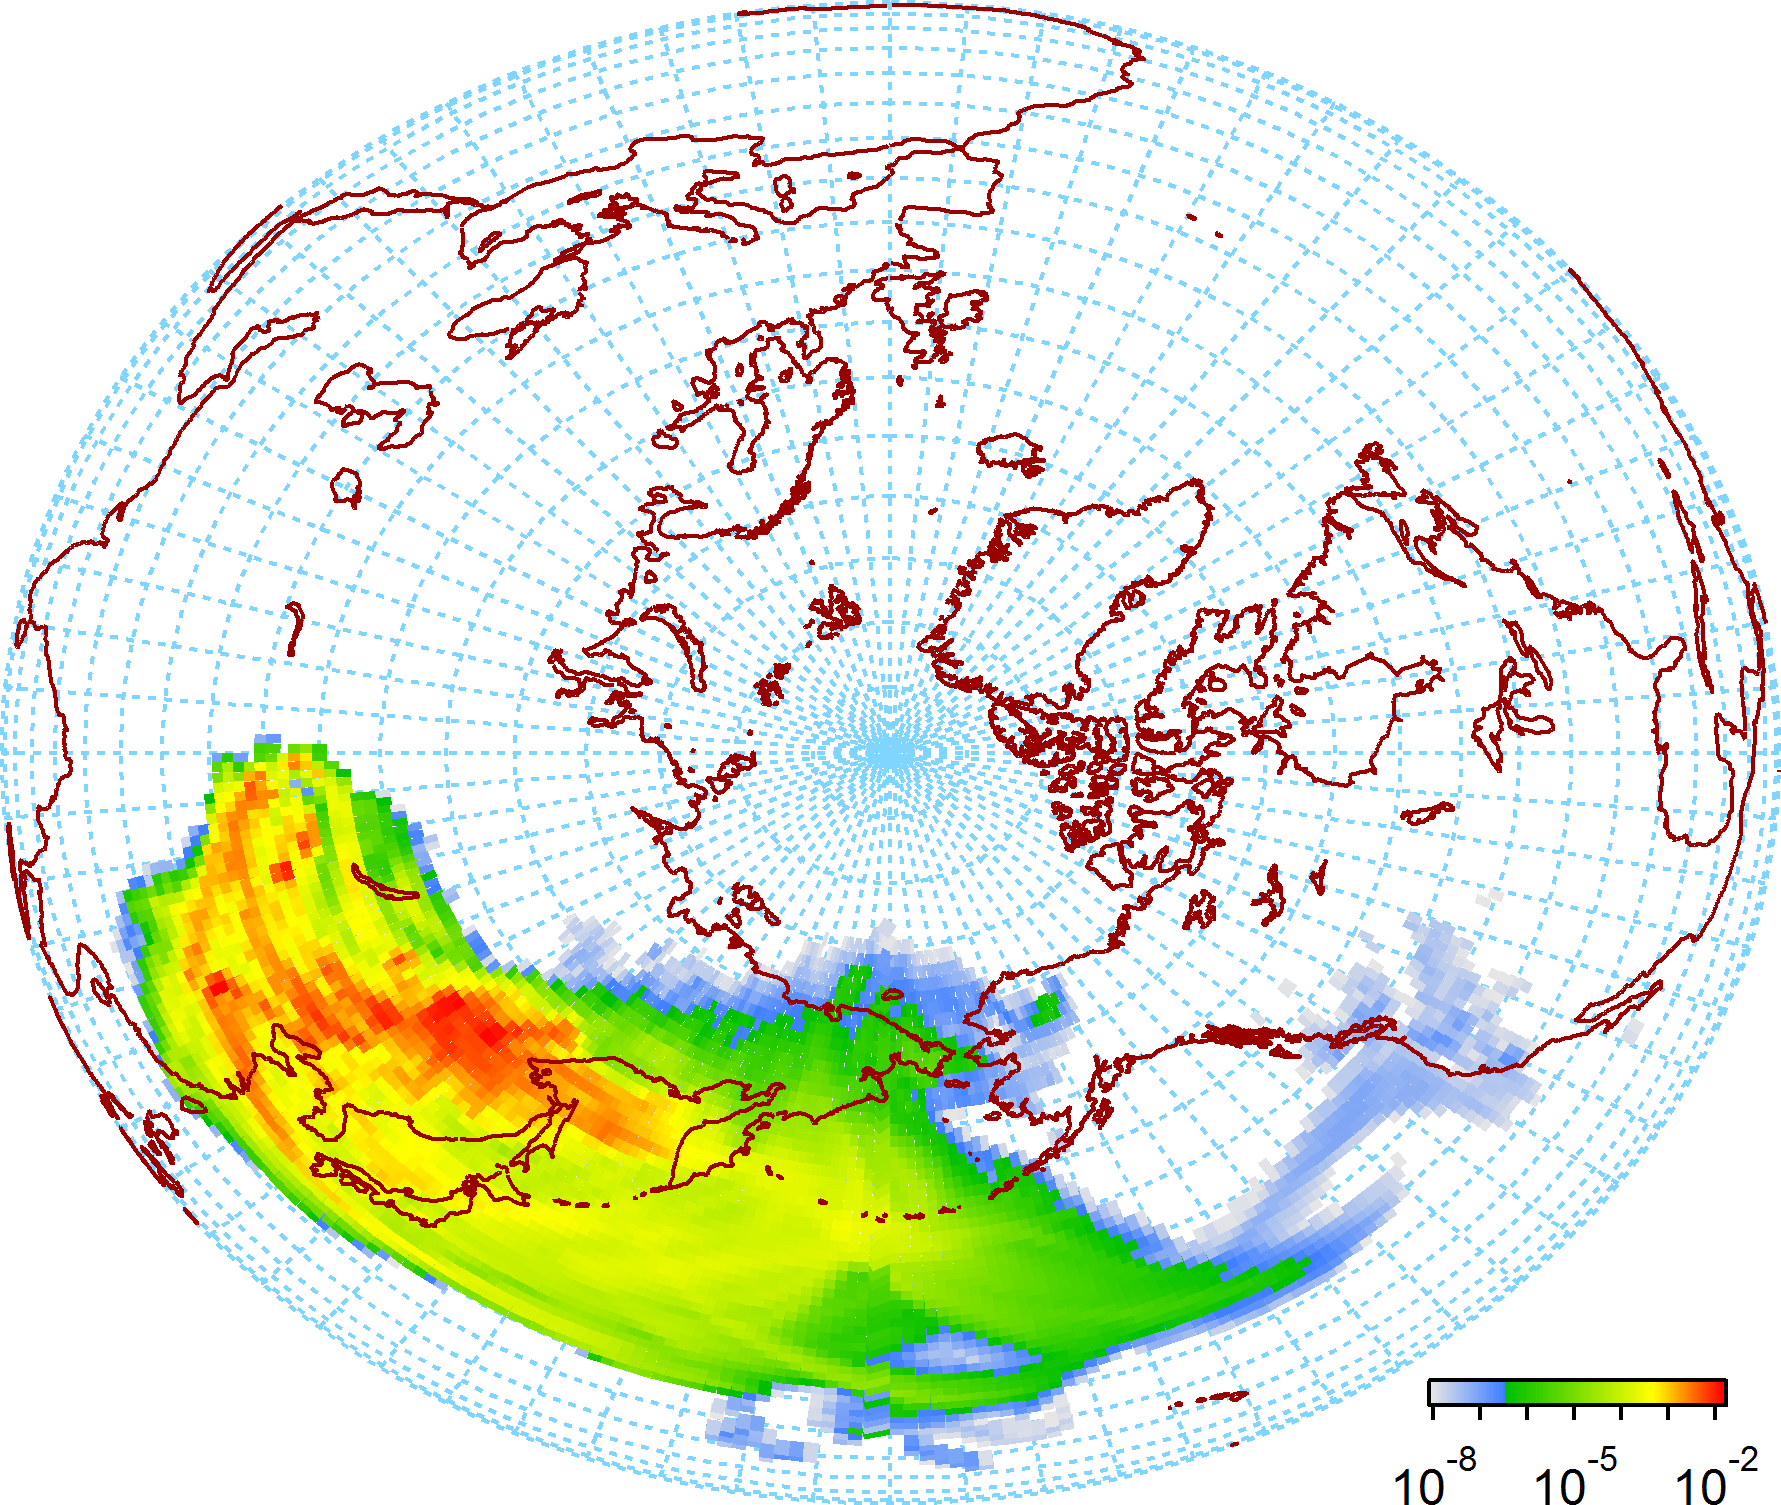
Figure 8Forward trajectory analysis of dust transport (units: µg m−3) in the free atmosphere using the FLEXPART model in 216 h from 2 to 10 May 2017.
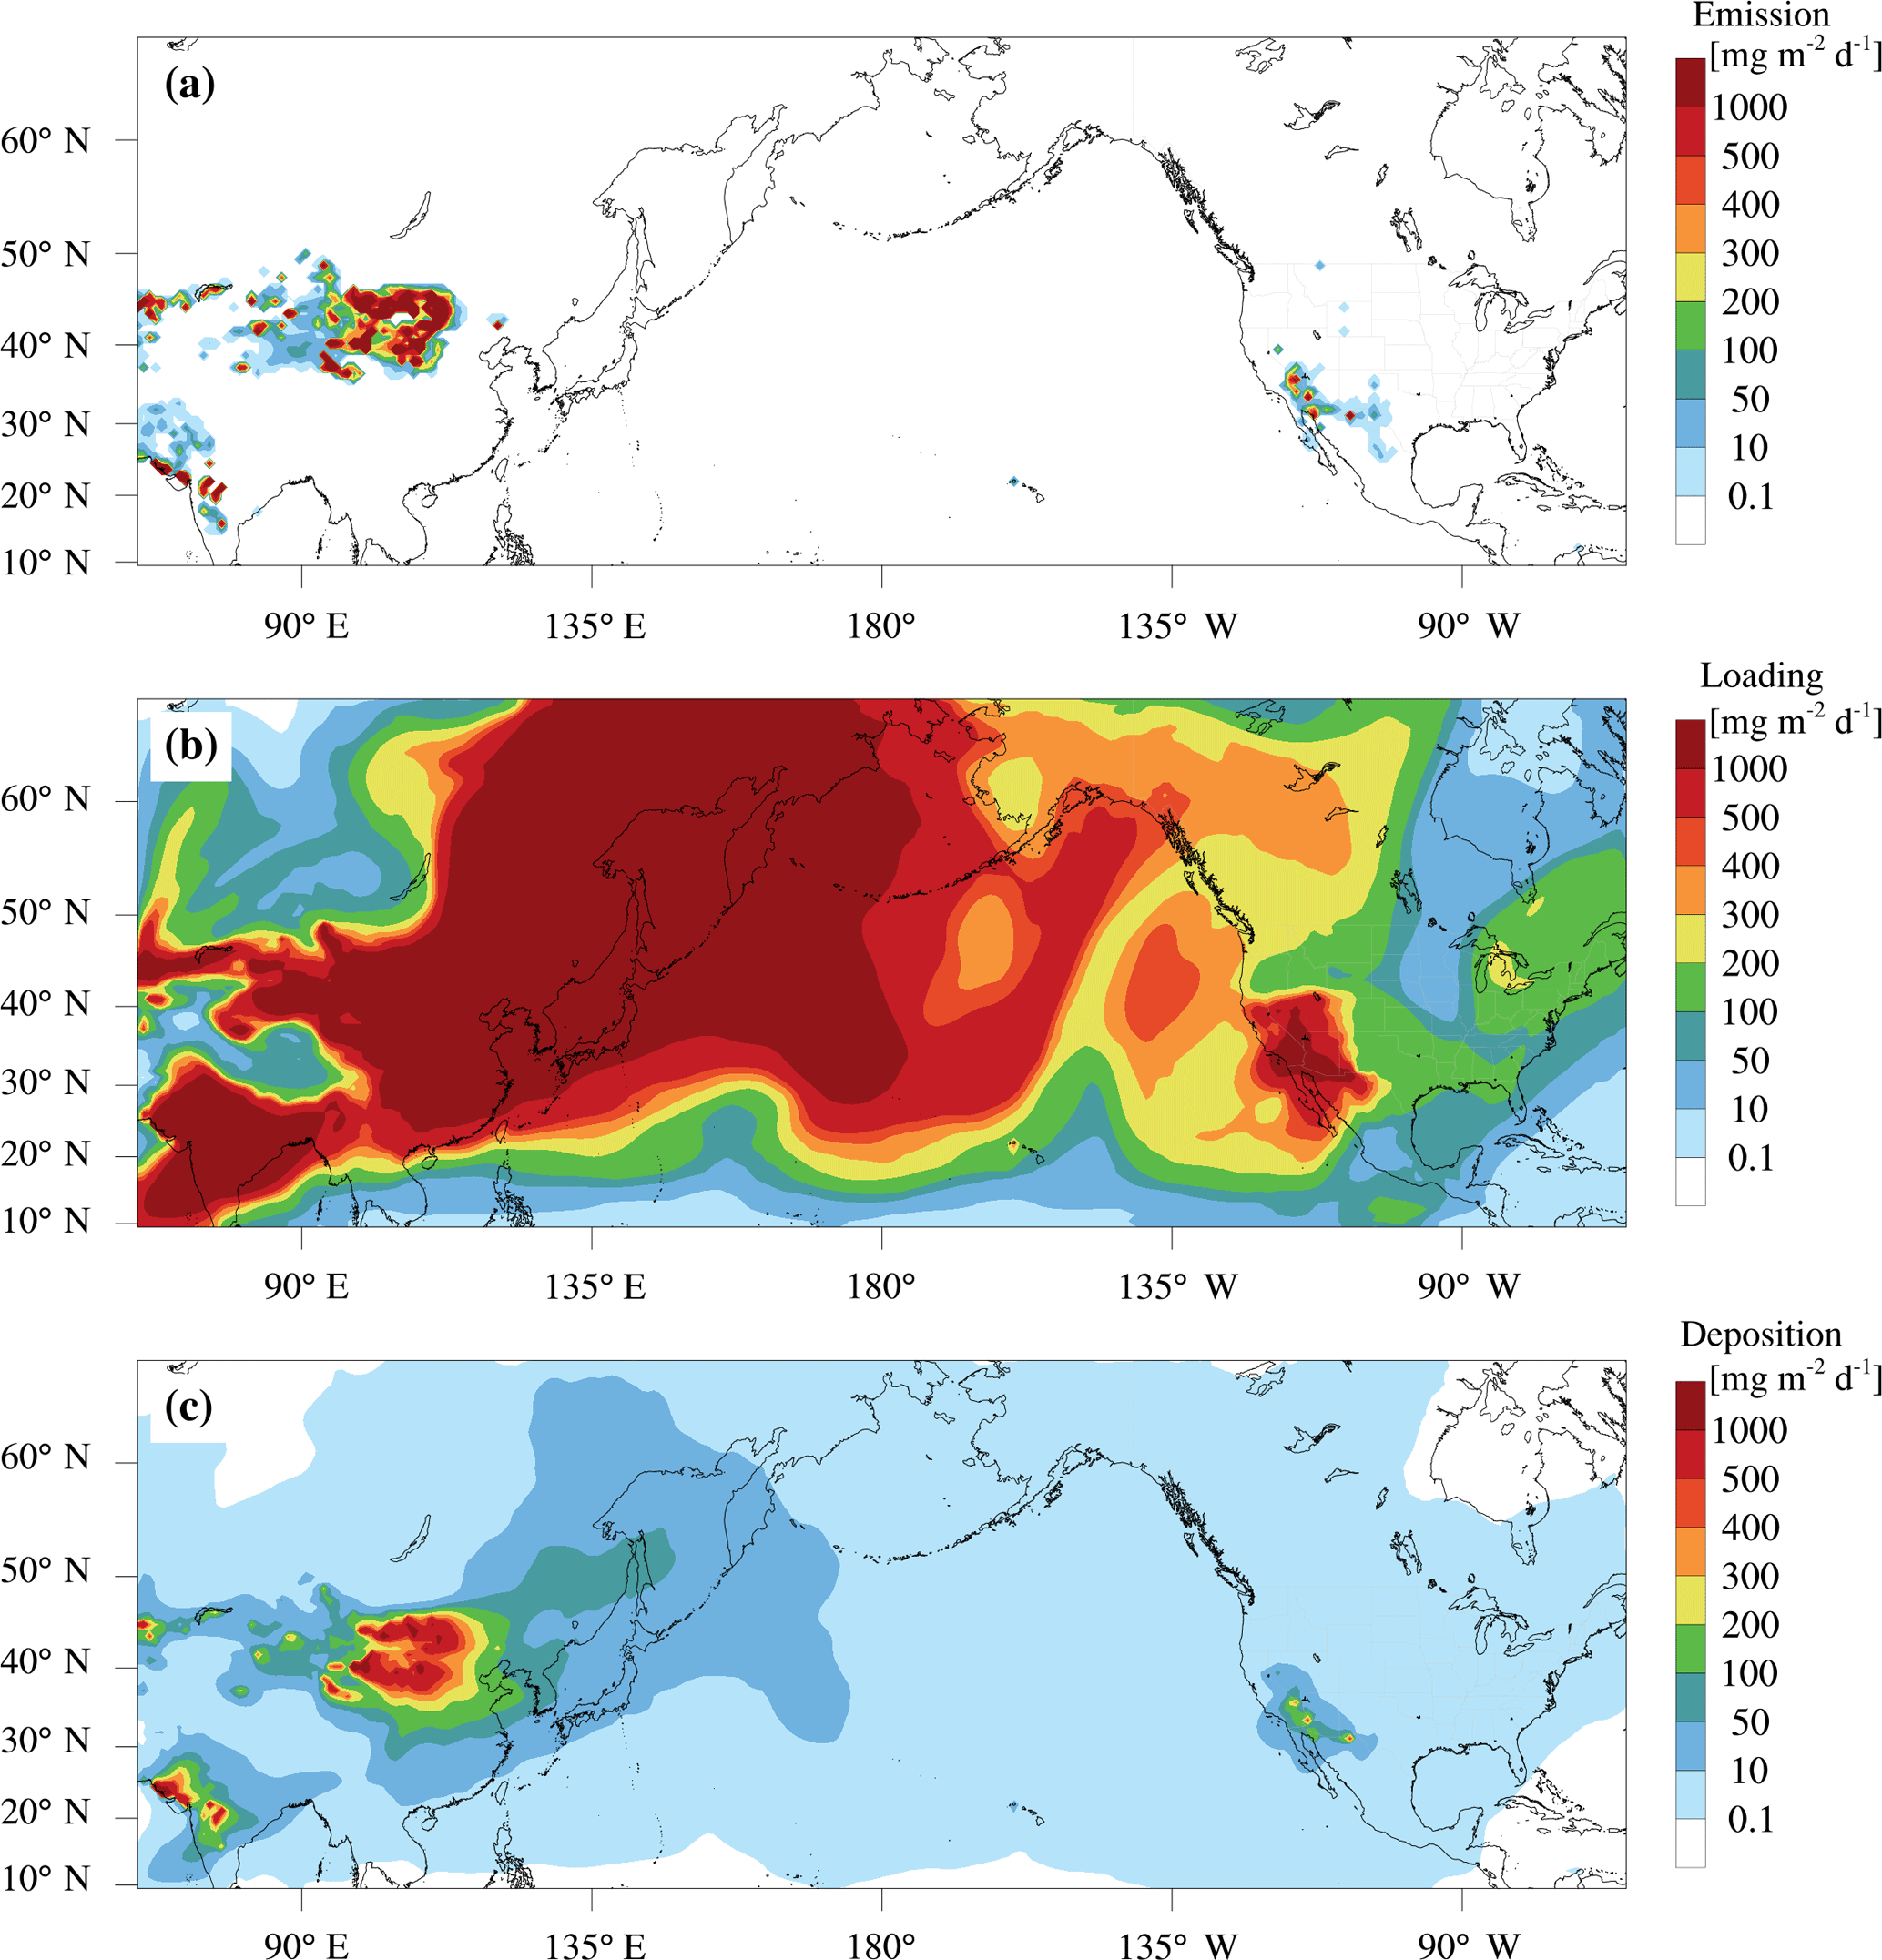
Figure 9Estimation of daily dust emission (a), dust loading (b), and dust deposition (c) over the Asia-Pacific region during 2–10 May 2017.
3.4 Atmospheric dust deposition
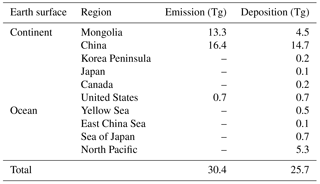
The long-range transport of dust is influenced by dry and wet depositional processes (Shao and Dong, 2006; Tanaka and Chiba, 2006; Zheng et al., 2016). Atmospheric mineral dust and subsequent deposition in the ocean is an important source of iron in high-nutrient, low-chlorophyll (HNLC) oceanic regions (Mahowald et al., 2009). The intensity of dust deposition on land or ocean can exceed 100 g m−2 yr−1 (Ginoux et al., 2001; Liu et al., 2004; Zhang et al., 2010). However, the dust deposition rate over Chinese deserts has been reported to be 70 times larger than over the North Pacific Ocean (Shao, 2000). Atmospheric dust concentrations may change rapidly during the early stages of dust transport (Uematsu et al., 1983). Few observations exist of East Asian dust deposition over the Pacific Ocean. Uematsu et al. (1983) estimated that 1.6 Tg of dust aerosols is deposited over the North Pacific Ocean during East Asian dust storm events. The annual average deposition of mineral dust over the North Pacific could be as high as 480 Tg (Uematsu et al., 2003). Figure 9 displays the simulated daily emission, loading, and deposition of dust over East Asia and North Pacific regions. As simulated by the WRF-Chem model, approximately 29.7 Tg of dust was emitted from dust sources in Mongolia and China (Fig. 9a and Table 3). Subsequently, 25.7 Tg of dust was deposited over the Asia-Pacific region, with 20.4 Tg of dust deposited over land and 5.3 Tg of dust deposited over the North Pacific Ocean (Fig. 9c and Table 3). Simulated results further indicate that 4 Tg of dust were suspended in the atmosphere. The amount of dust deposited over China, Mongolia, the Korean Peninsula, and Japan was 14.7, 4.5, 0.2, and 0.1 Tg, while the dust deposition intensity in the Yellow Sea, East China Sea, and the Sea of Japan was 1.3, 0.2, and 0.6 g m−2, respectively. The estimated dust deposition over East Asia (20.8 Tg) during 2–7 May 2017 was of the same magnitude as deposition during the 2002 and 2010 Asian dust storms (Shao et al., 2002; Han et al., 2004; Li et al., 2011). In addition, the ratio of dust deposition intensity over the Yellow Sea to East China Sea (6.5) was close to that reported by Tan et al. (2017). Deposition intensity is highly correlated with atmospheric dust concentration (Shao et al., 2013; Zhang et al., 2017); thus we assume that areas with high deposition also had high atmospheric concentration. We estimated that 0.9 Tg of dust was deposited over North America. Iron deposition over the North Pacific Ocean was estimated by ourselves to be 0.19 Tg, assuming the dust contained 3.5 % iron (Luo et al., 2005; Mahowald et al., 2017).
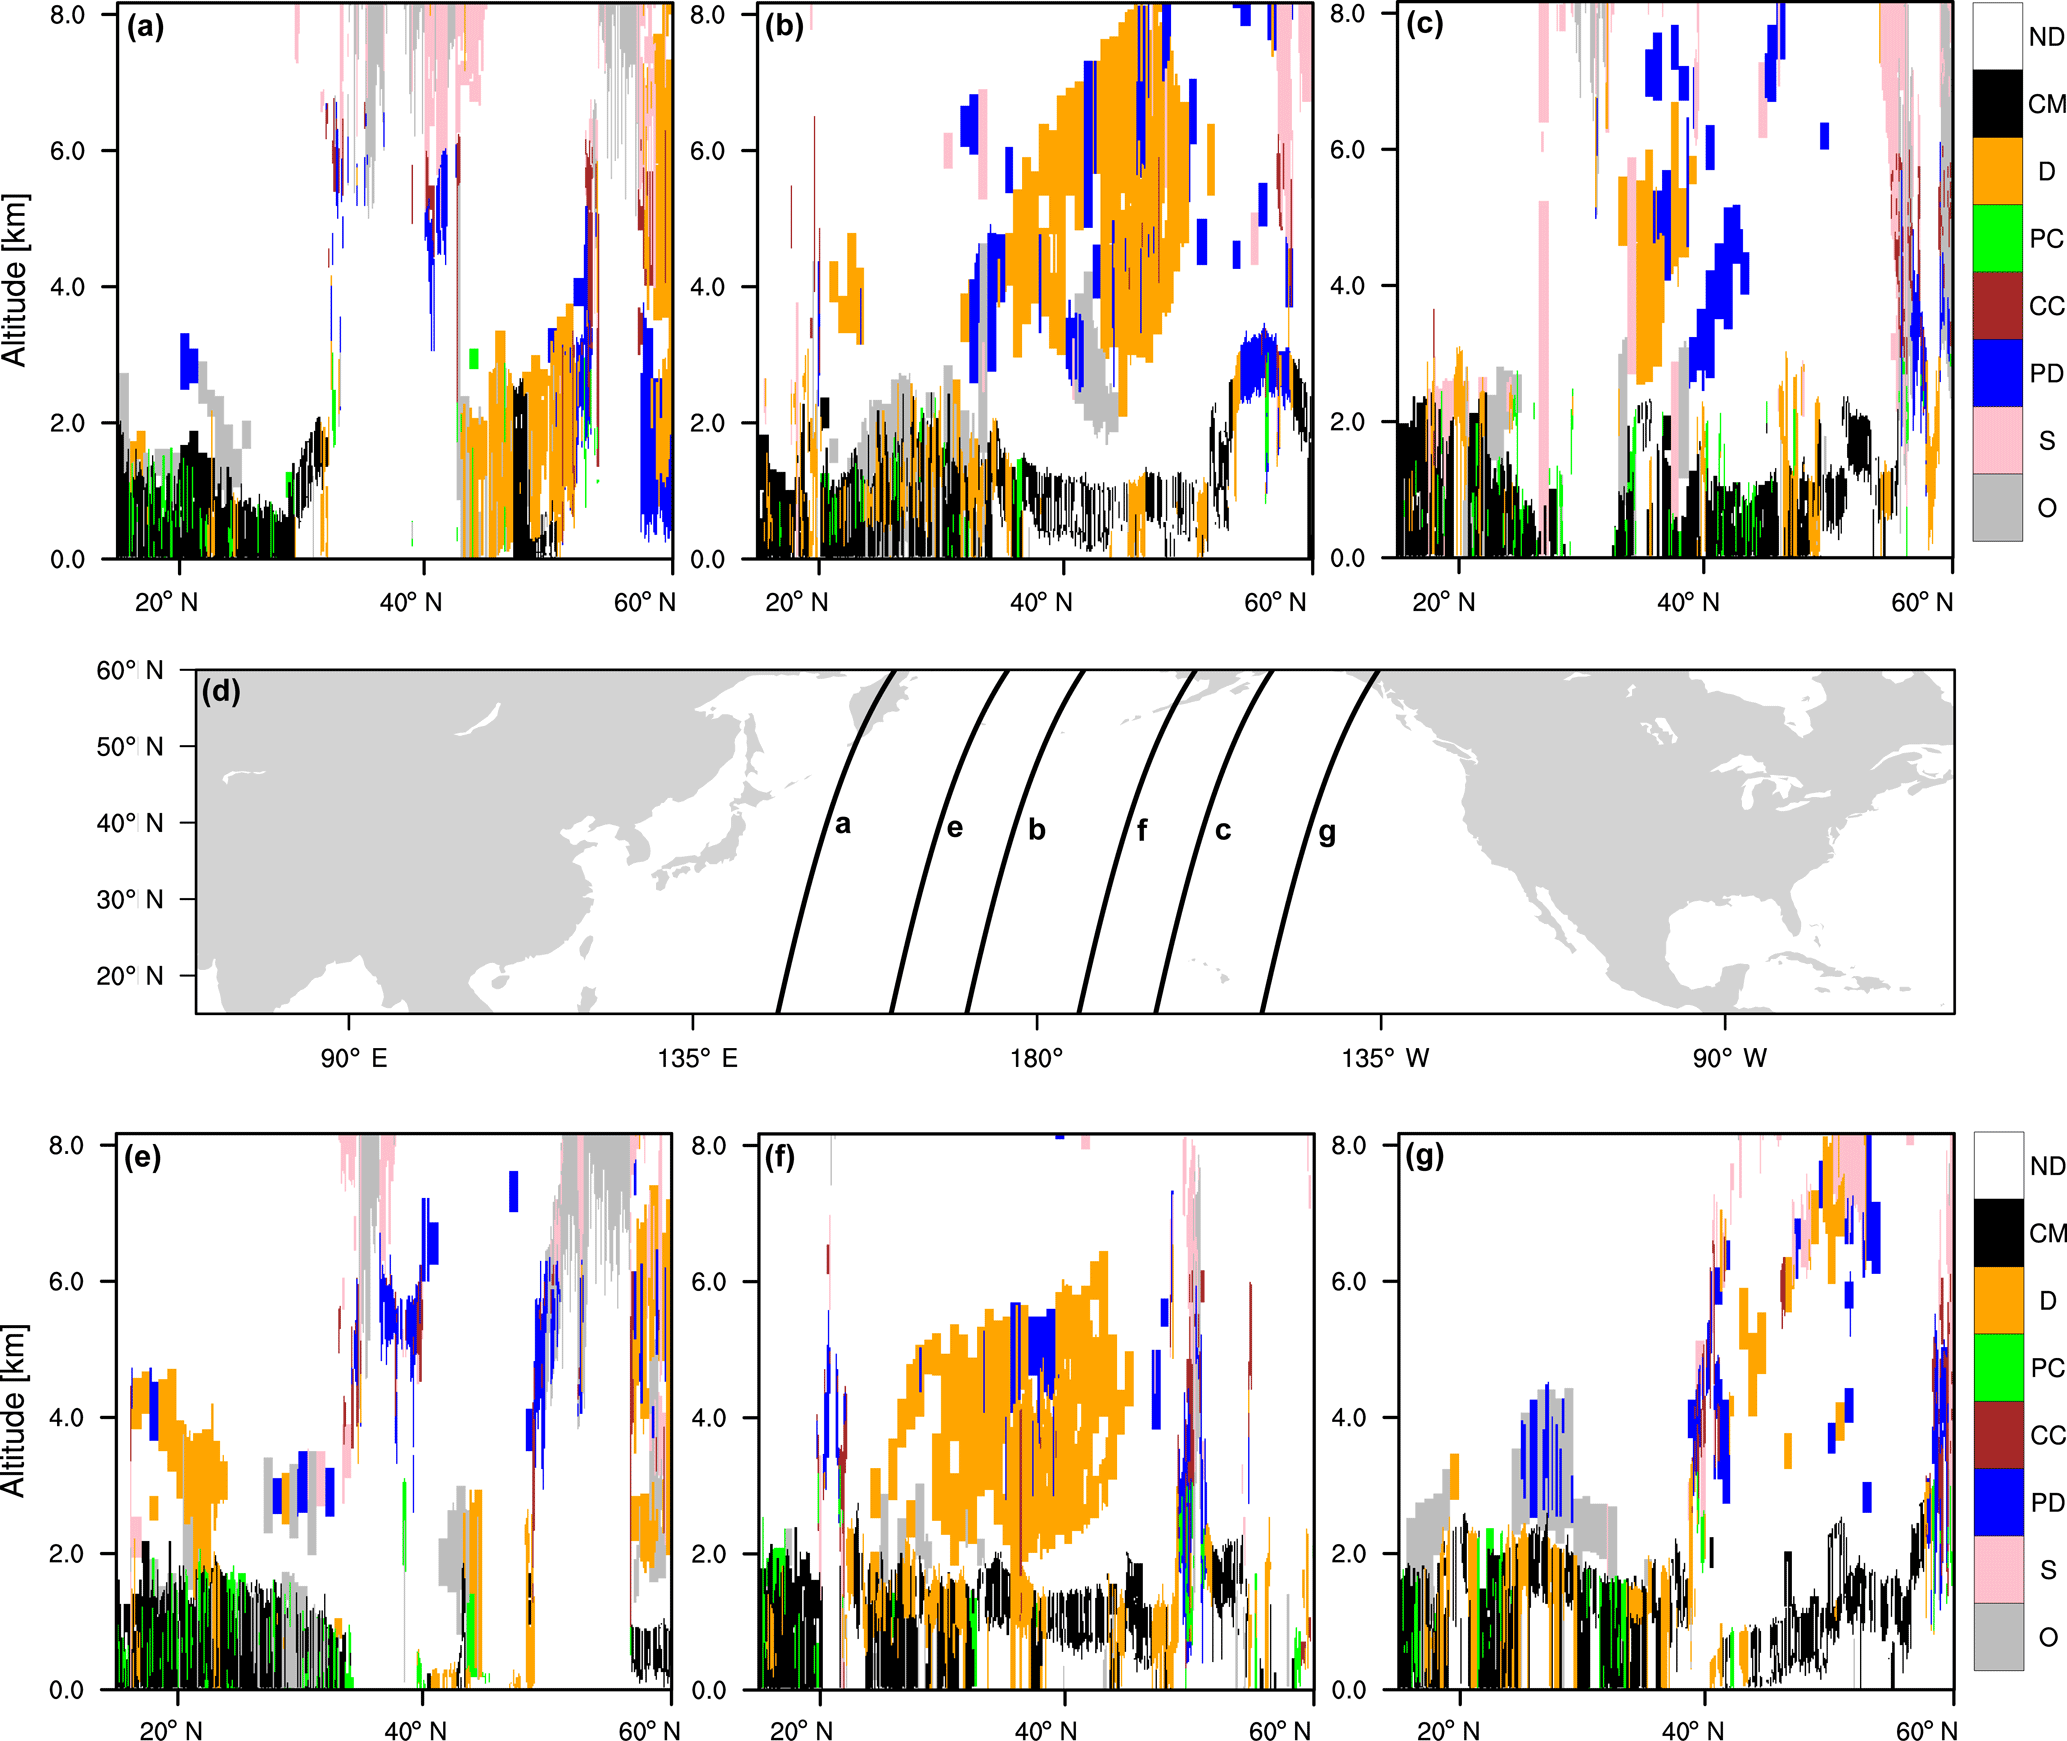
Figure 10Vertical profiles of atmospheric features derived from CALIPSO satellite VFM data on 7 May (a, b, c) and 8 May (e, f, g) 2017. (ND: not determined, CM: clean marine, D: dust, PC: polluted continental, CC: clean continental, PD: polluted dust, S: smoke, O: other). Satellite trajectories of the vertical profiles were presented in (d).
Table 3Estimates of atmospheric dust emission and deposition over the Asian-Pacific region during 2–10 May 2017.
Transport of dust emitted from East Asian desert sources is highly dependent on atmospheric circulation (Zhang et al., 1997). The Eurasian atmospheric circulation greatly influences weather of East Asia and is primarily driven by the strength of the Asian monsoon and the Siberian High (Park et al., 2011; Shao et al., 2013). Strong winds associated with these atmospheric circulations cause large amounts of mineral dust to be emitted into the atmosphere and then redeposited after long-range transport through wet scavenging and dry settling. According the WRF-Chem model, dust emitted from East Asian Gobi Desert sources on 2 May took 3, 3.5, and 7 days to reach the Korean Peninsula, Japan, and the western coast of the United States and Canada, respectively.
The Gobi and sand deserts in East Asia are important sources of global atmospheric mineral dust (Ginoux et al., 2001; Shao et al., 2013; Chen et al., 2017a). Atmospheric deposition of mixed Asian dust pollutants can result in the deposition of many compounds (e.g. sulfate, nitrate, ammonium, base cations, and heavy metals) in remote areas (Carrico et al., 2003; Li et al., 2012). Figure 10 displays the vertical profile variations over the North Pacific Ocean on 7–8 May 2017. The profiles show atmospheric mineral dust at latitudes of 35–50∘ N on 7 May and 30–45∘ N on 8 May in the North Pacific Ocean. Dust deposition in the planetary boundary layer was also detected in the western North Pacific Ocean, which is near the source of East Asian dust (Fig. 10a). The westerly winds aloft can carry dust raised from the surface rapidly out over the Pacific Ocean in spring, which is then transported eastward. The long-range transport of atmospheric constituents from East Asia not only delivers mineral dust aerosols but also carries mixed anthropogenic pollutants and nutrients to remote continents and oceans (Li et al., 2012; Lyu et al., 2017b). As indicated by Fig. 10b, c, and f, anthropogenic pollution was detected in dust at altitudes of 3–8 km. This observation is consistent with previous studies on trans-Pacific dust transport as reported by Huebert et al. (2003), Uno et al. (2009), and Mahowald et al. (2009).
Based upon WRF-Chem simulations, dust was emitted from localized sources in North America during 2–10 May 2017. Tanaka and Chiba (2006) and Wu et al. (2018) also suggest that dust is emitted from localized sources in North America. There was 0.7 Tg of dust emitted across Arizona, Nevada, and the Sonoran Desert during 2–10 May 2017 according to WRF-Chem simulations. Approximately 0.7 Tg of dust was deposited across the United States. To visualize the influence of the North American dust sources on atmospheric dust loading, Fig. S3 displays the hourly PM10 concentration for locations in California, Arizona, Nevada, and Washington during 2–15 May 2017. These results indicate dust emitted from the Mexican Desert and drylands in Arizona and Nevada significantly influenced the atmospheric environment in the southwestern United States.
3.5 Influence on Asia-Pacific region
The long-range transport of mineral dust aerosols occurs with high temporal and spatial variability (Mahowald et al., 2017). In addition, dust deposition rates are highly variable as deposition during singular dust storms can account for over 3 % of the annual dust deposition flux (Liu et al., 2004; Zhang et al., 2010). For marine ecosystems, long-range transport and subsequent deposition of mineral dust can result in an influx of nutrients and thereby stimulate growth of aquatic organisms. For example, aeolian dust contains Fe, which is essential to the growth of aquatic organisms such as phytoplankton (Zhuang et al., 1992; Luo et al., 2005; Mahowald et al., 2009, 2017; Tagliabue et al., 2017). Zhuang et al. (1992) proposed that Fe contained in dust may couple with anthropogenic S in the atmosphere and ocean, thereby enhancing solubility and subsequent availability to aquatic organisms. Thus, an influx of nutrients to the ocean during the May 2017 dust event would significantly influence aquatic primary productivity.
Cottle et al. (2013a) and Hu et al. (2016) reported that the long-range transport of Asian dust can impact the Pacific region. Indeed, high-altitude dust clouds from the May 2017 event were observed crossing toward North America as evidenced by CALIPSO retrieval signals in Fig. 10. Dust was observed at heights of approximately 2–8 km over North America on 9–10 May (Fig. S4b and e), a week after initiation of the East Asian dust storm. The source of high-altitude dust over North America may not be entirely from Asia, but could also be attributed to dust emissions from the southwestern US and northern Mexico. Indeed, the WRF-Chem model predicted that 0.7 Tg of dust was emitted from these regions of North America during 2–10 May 2017 (Fig. 9a and Table 3). While we are unable to conclusively determine the source of high-altitude dust over North America, we believe the likely source was Asian dust due to the zonal transport of high-altitude dust from Asia as well as seemingly little dust remaining in the atmosphere after deposition was accounted for (dust emissions and deposition were equal as indicated in Table 3) over the southwestern United States and northern Mexico. Strong signals of dust aerosols were also observed at mid-latitudes in the east North Pacific (Fig. S4a and e).
Asian dust can be transported further north to the Arctic at altitudes of 3–7 km as a result of either a blocking high pressure system in the northwest Pacific Ocean or a trough–ridge configuration between East Asia and the North Pacific Ocean (Di Pierro et al., 2011). Mineral dust was observed throughout the vertical profile over high latitudes near the North Pole on 9 May as indicated by CALIPSO satellite data (Fig. S4a). The zonal transported dust may mix with ice nuclei at high latitudes through microphysical nucleation processes and result in cloud formation (Liu et al., 2012; Yu et al., 2012; Sand et al., 2017). Our simulations showed by the time the dust had been transported across the Pacific Ocean that > 4 Tg of fine dust aerosols remained in suspension in the atmosphere (Fig. 9b and c). This suspended dust likely influenced the atmospheric chemical composition as well as optical properties. These anomalies of fast-rising atmospheric aerosol concentration could directly or indirectly influence the climate of temperature-sensitive regions like the Arctic (Di Pierro et al., 2011; Carslaw et al., 2013; Sand et al., 2017).
During intercontinental transport, particulate matter more likely remained at low altitudes due to less uplift by thermal eddies and precipitation. The long-range transport of dust aerosols in the troposphere has been detected from satellite and lidar observations. Our results suggest a 3-fold increase in dust deposition over the Pacific Ocean during dust events, emphasizing the importance of dust emission sources from East Asian lands to current ambient particulate matter levels in the environment. In general, long-range-transported Asian dust originated from the Gobi Desert or other sources can significantly elevate ambient particulate matter concentration and affect air quality in major cities of China, Mongolia, the Korean Peninsula, Japan, and far beyond (Uno et al., 2006; Huang et al., 2008, 2017; Mahowald et al., 2009, 2017; Chen et al., 2017b).
The atmospheric environment of East Asia is severely affected by dust emitted from arid and semiarid regions. This study was undertaken to quantify ambient PM10 concentration and dust deposition in East Asia as well as its impact on the Asia-Pacific region. Based upon wind field patterns, the Alxa Desert in western Inner Mongolia and the Gobi Desert of Mongolia were found to be the main dust sources during the May 2017 dust storm event. This event resulted in an estimated dust emission of 29.7 Tg. Two-thirds of the emitted dust was deposited over East Asia, while one-sixth of the emitted dust was deposited into the North Pacific Ocean. This dust event dominated the atmospheric environment in East Asia. Data collected at environmental monitoring stations suggested aeolian dust was a major pollutant in East Asia affecting regional air quality and a significant contributor to the global dust budget. This dust storm impacted a wide area of China and other Asian nations and reached North America within 1 week. The spatial distribution and temporal variability in ambient PM10 concentration showed significant decreases along the transport trajectory and persistence on a regional scale. Dust from other sources such as the Sahara, Middle East, and Central Asia may also affect the Asia-Pacific region; therefore additional observations would be necessary to clarify the contributions from other potential dust source regions to dust transport and deposition in East Asia and the North Pacific Ocean. A combination of satellite and surface observations and numerical simulations presented in this study would reduce the uncertainties in quantitative estimations of Asian dust impact.
The data used in this study are available upon request by contacting the first author (zhangxx@ms.xjb.ac.cn).
The supplement related to this article is available online at: https://doi.org/10.5194/acp-18-8353-2018-supplement.
The authors declare that they have no conflict of interest.
The authors would like to thank anonymous reviewers for their useful comments
that contributed to improving the manuscript. We thank the NASA Goddard Space
Flight Center for providing the MODIS satellite data. We gratefully thank
AD-Net (http://www-lidar.nies.go.jp/AD-Net, last access: 11 June 2018)
for providing the lidar data in this study. The CALIPSO data were obtained
from the NASA Langley Atmospheric Science Data Center (ASDC). This work was
supported by the National Natural Science Foundation of China (no. 41730639),
the Chinese Academy of Sciences (no. 131965KYSB20170038), the Ministry of
Science and Technology, China (no. 2017FY101004, no. 2016YFE0109500), the
National Natural Science Foundation of China (no. 41301655), and the Open
Funds (no. LAPC-KF-2017-01) of the State Key Laboratory of Atmospheric
Boundary Layer Physics and Atmospheric Chemistry, China.
Edited by: Jianping Huang
Reviewed by: two
anonymous referees
An, Z. S.: The history and variability of the East Asian paleomonsoon climate, Quaternary Sci. Rev., 19, 171–187, https://doi.org/10.1016/S0277-3791(99)00060-8, 2000.
An, Z. S., Kukla, G., Porter, S. C., and Xiao, J. L.: Late quaternary dust flow on the Chinese Loess Plateau, CATENA, 18, 125–132, https://doi.org/10.1016/0341-8162(91)90012-M, 1991.
Brioude, J., Arnold, D., Stohl, A., Cassiani, M., Morton, D., Seibert, P., Angevine, W., Evan, S., Dingwell, A., Fast, J. D., Easter, R. C., Pisso, I., Burkhart, J., and Wotawa, G.: The Lagrangian particle dispersion model FLEXPART-WRF version 3.1, Geosci. Model Dev., 6, 1889–1904, https://doi.org/10.5194/gmd-6-1889-2013, 2013.
Carrico, C. M., Kus, P., Rood, M. J., Quinn, P. K., and Bates, T. S.: Mixtures of pollution, dust, sea salt, and volcanic aerosol during ACE-Asia: Radiative properties as a function of relative humidity, J. Geophys. Res., 108, 8650, https://doi.org/10.1029/2003JD003405, 2003.
Carslaw, K. S., Lee, L. A., Reddington, C. L., Pringle, K. J., Rap, A., Forster, P. M., Mann, G. W., Spracklen, D. V., Woodhouse, M. T., Regayre, L. A., and Pierce, J. R.: Large contribution of natural aerosols to uncertainty in indirect forcing, Nature, 503, 67–71, https://doi.org/10.1038/nature12674, 2013.
Chen, S., Zhao, C., Qian, Y., Leung, L. R., Huang, J., Huang, Z., Bi, J., Zhang, W., Shi, J., Yang, L., Li, D., and Li, J.: Regional modeling of dust mass balance and radiative forcing over East Asia using WRF-Chem, Aeolian Res., 15, 15–30, https://doi.org/10.1016/j.aeolia.2014.02.001, 2014.
Chen, S., Huang, J., Kang, L., Wang, H., Ma, X., He, Y., Yuan, T., Yang, B., Huang, Z., and Zhang, G.: Emission, transport, and radiative effects of mineral dust from the Taklimakan and Gobi deserts: comparison of measurements and model results, Atmos. Chem. Phys., 17, 2401–2421, https://doi.org/10.5194/acp-17-2401-2017, 2017a.
Chen, S., Huang, J., Li, J., Jia, R., Jiang, N., Kang, L., Ma, X., and Xie, T.: Comparison of dust emissions, transport, and deposition between the Taklimakan Desert and Gobi Desert from 2007 to 2011, Science China Earth Sciences, 60, 1338–1355, https://doi.org/10.1007/s11430-016-9051-0, 2017b.
Chen, X.: Physical geography of arid land in China, Science Press, Beijing, 124–155, 2010.
Chin, M., Rood, R. B., Lin, S.-J., Müller, J. F., and Thomspon, A. M.: Atmospheric sulfur cycle in the global model GOCART: Model description and global properties, J. Geophys. Res., 105, 24671–24687, https://doi.org/10.1029/2000JD900384, 2000.
Cottle, P., Strawbridge, K., McKendry, I., O'Neill, N., and Saha, A.: A pervasive and persistent Asian dust event over North America during spring 2010: lidar and sunphotometer observations, Atmos. Chem. Phys., 13, 4515–4527, https://doi.org/10.5194/acp-13-4515-2013, 2013a.
Cottle, P., Mueller, D., Shin, D. H., Zhang, X. X., Feng, G. L., McKendry, I., and Strawbridge, K.: Studying Taklamakan Aerosol properties with Lidar (STAPL), Proc. of SPIE, 8894:88940X, https://doi.org/10.1117/12.2029158, 2013b.
Di Pierro, M., Jaeglé, L., and Anderson, T. L.: Satellite observations of aerosol transport from East Asia to the Arctic: three case studies, Atmos. Chem. Phys., 11, 2225–2243, https://doi.org/10.5194/acp-11-2225-2011, 2011.
Duce, R. A., Liss, P. S., Merrill, J. T., Atlas, E. L, Buat-Menard, P., Hicks, B. B., Miller, J. M., Prospero, J. M., Arimoto, R., Church, T. M., Ellis, W., Galloway, J. N., and Hansen, L.: The atmospheric input of trace species to the world ocean, Global Biogeochem. Cy., 5, 193–259, https://doi.org/10.1029/91GB01778, 1991.
Eguchi, K., Uno, I., Yumimoto, K., Takemura, T., Shimizu, A., Sugimoto, N., and Liu, Z.: Trans-pacific dust transport: integrated analysis of NASA/CALIPSO and a global aerosol transport model, Atmos. Chem. Phys., 9, 3137–3145, https://doi.org/10.5194/acp-9-3137-2009, 2009.
Field, J. P., Belnap, J., Breshears, D. D., Neff, J. C., Okin, G. S., Whicker, J. J., Painter, T. H., Ravi, S., Reheis, M. C., and Reynolds, R. L.: The ecology of dust, Front. Ecol. Environ., 8, 423–430, https://doi.org/10.1890/090050, 2010.
Ginoux, P., Chin, M., Tegen, I., Prospero, J. M., Holben, B., Dubovik, O., and Lin, S.: Sources and distributions of dust aerosols simulated with the GOCART model, J. Geophys. Res., 106, 20255–20273, https://doi.org/10.1029/2000JD000053, 2001.
Gong, S. L., Zhang, X. Y., Zhao, T. L., McKendry, I. G., Jaffe, D. A., and Lu, N. M.: Characterization of soil dust aerosol in China and its transport and distribution during 2001 ACE-Asia: 2. Model simulation and validation, J. Geophys. Res., 108, 4262, https://doi.org/10.1029/2002JD002633, 2003.
Gong, S. L, Zhang, X. Y., Zhao, T. L., Zhang, X. B., Barrie, L. A., Mckendry, I. G., and Zhao, C. S.: A Simulated climatology of Asian dust aerosol and its trans-Pacific transport. Part II: Interannual variability and climate connections, J. Climate, 19, 104–122, https://doi.org/10.1175/JCLI3606.1, 2006.
Goudie, A. S.: Desert dust and human health disorders, Environmental International, 63, 101–113, https://doi.org/10.1016/j.envint.2013.10.011, 2014.
Han, Z., Ueda, H., Matsuda, K., Zhang, R., Arao, K., Kanai, Y., and Hasome, H.: Model study on particle size segregation and deposition during Asian dust events in March 2002, J. Geophys. Res., 109, D19205, https://doi.org/10.1029/2004JD004920, 2004.
Hsu, N. C., Tsay, S.-C., King, M. D., and Herman, J. R.: Deep blue retrievals of Asian aerosol properties during ACE-Asia, IEEE T. Geosci. Remote Sens., 44, 3180–3195, https://doi.org/10.1109/TGRS.2006.879540, 2006.
Hu, Z., Zhao, C., Huang, J., Leung, L. R., Qian, Y., Yu, H., Huang, L., and Kalashnikova, O. V.: Trans-Pacific transport and evolution of aerosols: evaluation of quasi-global WRF-Chem simulation with multiple observations, Geosci. Model Dev., 9, 1725–1746, https://doi.org/10.5194/gmd-9-1725-2016, 2016.
Huang, J., Minnis, B., Chen, Z., Huang, Z., Liu, Q., Zhao, Y., and Ayers, J. K.: Long-range transport and vertical structure of Asian dust from CALIPSO and surface measurements during PACDEX, J. Geophys. Res.-Atmos., 113, D23212, https://doi.org/10.1029/2008JD010620, 2008.
Huang, J., Wang, T., Wang, W., Li, Z., and Yan, H.: Climate effects of dust aerosols over East Asian arid and semiarid regions, J. Geophys. Res.-Atmos., 119, 11398–11416, https://doi.org/10.1002/2014JD021796, 2014.
Huang, J., Li, Y., Fu, C., Chen, F., Fu, Q., Dai, A., Shinoda, M., Ma, Z., Guo, W., Li, Z., Zhang, L., Liu, Y., Yu, H., He, Y., Xie, Y., Guan, X., Li, M., Lin, L., Wang, S., Yan, H., and Wang, G.: Dryland climate change: Recent progress and challenges, Rev. Geophys., 55, 719–778, https://doi.org/10.1002/2016RG000550, 2017.
Huebert, B. J., Bates, T., Russell, P. B., Shi, G., Kim, Y. J., Kawamura, K., Carmichael, G., and Nakajima, T.: An overview of ACE-Asia: Strategies for quantifying the relationships between Asian aerosols and their climatic impacts, J. Geophys. Res., 108, 8633, https://doi.org/10.1029/2003JD003550, 2003.
Huneeus, N., Schulz, M., Balkanski, Y., Griesfeller, J., Prospero, J., Kinne, S., Bauer, S., Boucher, O., Chin, M., Dentener, F., Diehl, T., Easter, R., Fillmore, D., Ghan, S., Ginoux, P., Grini, A., Horowitz, L., Koch, D., Krol, M. C., Landing, W., Liu, X., Mahowald, N., Miller, R., Morcrette, J.-J., Myhre, G., Penner, J., Perlwitz, J., Stier, P., Takemura, T., and Zender, C. S.: Global dust model intercomparison in AeroCom phase I, Atmos. Chem. Phys., 11, 7781–7816, https://doi.org/10.5194/acp-11-7781-2011, 2011.
Husar, R. B., Tratt, D. M., Schichtel, B. A., Falke, S. R., Li, F., Jaffe, D., Gasso, S., Gill, T., Laulainen, N. S., Lu, F., Reheis, M. C., Chun, Y., Westphal, D., Holben, B. N., Gueymard, C., McKendry, I., Kuring, N., Feldman, G. C., McClain, C., Frouin, R. J., Merrill, J., DuBois, D., Vignola, F., Murayama, T., Nickovic, S., Wilson, W. E., Sassen, K., Sugimoto, N., and Malm, W. C.: The Asian dust events of April 1998, J. Geophys. Res., 106, 18317–18330, https://doi.org/10.1029/2000JD900788, 2001.
Hyer, E. J., Reid, J. S., and Zhang, J.: An over-land aerosol optical depth data set for data assimilation by filtering, correction, and aggregation of MODIS Collection 5 optical depth retrievals, Atmos. Meas. Tech., 4, 379–408, https://doi.org/10.5194/amt-4-379-2011, 2011.
IPCC (Intergovernmental Panel on Climate Change): Climate change-the physical science basis, Cambridge University Press, New York, 252–271, 2013.
Jaffe, D. A., Anderson, T. L., Covert, D. S., Kotchenruther, R. A., Trost, B., Danielson, J., Simpson, W., Berntsen, T., Karlsdottir, S., Blake, D., Harris, J., Carmichael, G., and Uno, I.: Transport of Asian air pollution to North America, Geophys. Res. Lett., 26, 711–714, https://doi.org/10.1029/1999GL900100, 1999.
Kang, J.-Y., Yoon, S.-C., Shao, Y., and Kim S.-W.: Comparison of vertical dust flux by implementing three dust emission schemes in WRF/Chem, J. Geophys. Res., 116, D09202, https://doi.org/10.1029/2010JD014649, 2011.
Kok, J. F.: A scaling theory for the size distribution of emitted dust aerosols suggests climate models underestimate the size of the global dust cycle, P. Natl. Acad. Sci. USA, 108, 1016–1021, https://doi.org/10.1073/pnas.1014798108, 2011.
Kok, J. F., Ridley, D. A, Zhou, Q., Miller, R. L., Zhao, C., Heald, C. L., Ward, D. S., Albani, S., and Haustein, K.: Smaller desert dust cooling effect estimated from analysis of dust size and abundance, Nat. Geosci., 10, 274–278, https://doi.org/10.1038/ngeo2912, 2017.
Li, J., Han, Z., and Zhang, R.: Model study of atmospheric particulates during dust storm period in March 2010 over East Asia, Atmos. Environ., 45, 3954–3964, https://doi.org/10.1016/j.atmosenv.2011.04.068, 2011.
Li, J., Wang, Z., Zhuang, G., Luo, G., Sun, Y., and Wang, Q.: Mixing of Asian mineral dust with anthropogenic pollutants over East Asia: a model case study of a super-duststorm in March 2010, Atmos. Chem. Phys., 12, 7591–7607, https://doi.org/10.5194/acp-12-7591-2012, 2012.
Liu, L. Y., Shi, P. J., Gao, S. Y., Zou, X. Y., Erdon, H., Yan, P., Li, X. Y., Ta, W. Q., Wang, J. H., and Zhang, C. L.: Dustfall in China's western loess plateau as influenced by dust storm and haze events, Atmos. Environ., 38, 1699–1703, https://doi.org/10.1016/j.atmosenv.2004.01.003, 2004.
Liu, L. Y., Skidmore, E., Hasi, E., Wagner, L, and Tatarko, J.: Dune sand transport as influenced by wind directions, speed and frequencies in the Ordos Plateau, China, Geomorphology, 67, 283–297, https://doi.org/10.1016/j.geomorph.2004.10.005, 2005.
Liu, L. Y., Yang, Y. Y., Shi, P. J., Zhang, G. M., and Qu, Z. Q.: The role of maximum wind speed in sand-transporting events, Geomorphology, 238, 177–186, https://doi.org/10.1016/j.geomorph.2015.03.007, 2015.
Liu, X., Shi, X., Zhang, K., Jensen, E. J., Gettelman, A., Barahona, D., Nenes, A., and Lawson, P.: Sensitivity studies of dust ice nuclei effect on cirrus clouds with the Community Atmosphere Model CAM5, Atmos. Chem. Phys., 12, 12061–12079, https://doi.org/10.5194/acp-12-12061-2012, 2012.
Luo, C., Mahowald, N. M., Meskihidze, N., Chen, Y., Siefert, R. L., Baker, A. R., and Johansen, A. M.: Estimation of iron solubility from observations and a global aerosol model, J. Geophys. Res., 110, D23307, https://doi.org/10.1029/2005JD006059, 2005.
Lyu, Y. L., Qu, Z. Q., Liu, L. Y., Guo, L. L., Yang, Y. Y., Hu, X., Xiong, Y. Y., Zhang, G. M., Zhao, M. D., Liang, B., Dai, J. D., Jia, Q. P., Zheng, H., Han, X. J., Zhao, S. D., and Liu, Q.: Characterization of dustfall in rural and urban sites during three dust storms in northern China, 2010, Aeolian Res., 28, 29–37, https://doi.org/10.1016/j.aeolia.2017.06.004, 2017a.
Lyu, Y. L., Liu, L. Y., Guo, L. L., Yang, Y. Y., Qu, Z. Q., Hu, X., and Zhang, G. M.: Deposited atmospheric dust as influenced by anthropogenic emissions in northern China, Environ. Monit. Assess., 189, 390, https://doi.org/10.1007/s10661-017-6093-1, 2017b.
Mahowald, N. M., Kohfeld, K. E., Hansson, M., Balkanski, Y., Harrison, S. P., Prentice, I. C., Michael, S., and Rodhe, H.: Dust sources and deposition during the last glacial maximum and current climate: a comparison of model results with paleodata from ice cores and marine sediments, J. Geophys. Res., 104, 15895–15916, https://doi.org/10.1029/1999JD900084, 1999.
Mahowald, N. M., Luo, C., Corral, J. D., and Zender C.: Interannual variability in atmospheric mineral aerosols from a 22-year model simulation and observational data, J. Geophys. Res., 108, 4352, https://doi.org/10.1029/2002JD002821, 2003.
Mahowald, N. M., Baker, A. R., Bergametti, G., Brooks, N., Duce, R. A., Jickells, T. D., Kubilay, N., Prospero, J. M., and Tegen, I.: Atmospheric global dust cycle and iron inputs to the ocean, Global Biogeochem. Cy., 19, GB4025, https://doi.org/10.1029/2004GB002402, 2005.
Mahowald, N. M., Engelstaedter, S., Luo, C., Sealy, A., Artaxo, P., Benitez-Nelson, C., Bonnet, S., Chen, Y., Chuang, P. Y., Cohen, D. D., Dulac, F., Herut, B., Johansen, A. M., Kubilay, N., Losno, R., Maenhaut, W., Paytan, A., Prospero, J. M., Shank, L. M., and Siefert, R. L.: Atmospheric iron deposition: global distribution, variability, and human perturbations, Annu. Rev. Mar. Sci., 1, 245–278, https://doi.org/10.1146/annurev.marine.010908.163727, 2009.
Mahowald, N. M., Scanza, R., Brahney, J., Goodale, C. L., Hess, P. G., Moore, J. K., and Neff, J.: Aerosol deposition impacts on land and ocean carbon cycles, Current Climate Change Reports, 3, 16–31, https://doi.org/10.1007/s40641-017-0056-z, 2017.
Masuoka, E., Roy, D., Wolfe, R., Morisette, J., Sinno, S., Teague, M., Saleous, N., Devadiga, S., Justice, C., and Nickeson, J.: MODIS Land Data Products: Generation, Quality Assurance and Validation, in: Land Remote Sensing and Global Environmental Change, edited by: Ramachandran, B., Justice, C., and Abrams, M., Remote Sensing and Digital Image Processing, Vol. 11, Springer, New York (NY), 509–531, https://doi.org/10.1007/978-1-4419-6749-7_22, 2010.
McKendry, I. G., Macdonald, A. M., Leaitch, W. R., van Donkelaar, A., Zhang, Q., Duck, T., and Martin, R. V.: Trans-Pacific dust events observed at Whistler, British Columbia during INTEX-B, Atmos. Chem. Phys., 8, 6297–6307, https://doi.org/10.5194/acp-8-6297-2008, 2008.
McTainsh, G. and Strong, C.: The role of aeolian dust in ecosystems, Geomorphology, 89, 39–54, https://doi.org/10.1016/j.geomorph.2006.07.028, 2007.
MEP (Ministry of Environmental Protection, China): Determination of atmospheric particles PM10 and PM2.5 in ambient air by gravimetric method (HJ 618-2011), Standards Press of China, Beijing, 2011.
MEP (Ministry of Environmental Protection, China): Ambient air quality standards (GB 3095-2012), Standards Press of China, Beijing, 2012a.
MEP (Ministry of Environmental Protection, China): Technical Regulation on Ambient Air Quality Index (HJ 633-2012), Standards Press of China, Beijing, 2012b.
Merrill, J. T., Uematsu, M., and Bleck, R.: Meteorological analysis of long range transport of mineral aerosols over the North Pacific, J. Geophys. Res., 94, 8584–8598, https://doi.org/10.1029/JD094iD06p08584, 1989.
Merrill, J. T., Arnold, E., Leinen, M., and Weaver, C.: Mineralogy of aeolian dust reaching the North Pacific Ocean. 2: Relationship of mineral assemblages to atmospheric transport patterns, J. Geophys. Res., 99, 21025–21032, https://doi.org/10.1029/94JD01734, 1994.
Murayama, T., Sugimoto, N., Uno, I., Kinoshita, K., Aoki, K., Hagiwara, N., Liu, Z. Y., Matsui, I., Sakai, T., Shibata, T., Arao, K., Sohn, B.-J., Won, J.-G., Yoon, S.-C., Li, T., Zhou, J., Hu, H. L., Abo, M., Iokibe, K., Koga, R., and Iwasaka, Y.: Ground-based network observation of Asian dust events of April 1998 in east Asia, J. Geophys. Res., 106, 18345–18359, https://doi.org/10.1029/2000JD900554, 2001.
Nee, J. B., Chiang, C.-W., Hu, H.-L., Hu, S.-X., and Yu, J.-Y.: Lidar measurements of Asian dust storms and dust cloud interactions, J. Geophys. Res., 112, D15202, https://doi.org/10.1029/2007JD008476, 2007.
Park, T. W., Ho, C. H., Jeong, S. J., Choi, Y. S., Park, S. K., and Song, C. K.: Different characteristics of cold day and cold surge frequency over East Asia in a global warming situation, J. Geophys. Res., 116, D12118, https://doi.org/10.1029/2010JD015369, 2011.
Pye, K.: Aeolian dust and dust deposits, Academic Press, London, 5–63, 1987.
Sand, M., Samset, B. H., Balkanski, Y., Bauer, S., Bellouin, N., Berntsen, T. K., Bian, H., Chin, M., Diehl, T., Easter, R., Ghan, S. J., Iversen, T., Kirkevåg, A., Lamarque, J.-F., Lin, G., Liu, X., Luo, G., Myhre, G., Noije, T. V., Penner, J. E., Schulz, M., Seland, Ø., Skeie, R. B., Stier, P., Takemura, T., Tsigaridis, K., Yu, F., Zhang, K., and Zhang, H.: Aerosols at the poles: an AeroCom Phase II multi-model evaluation, Atmos. Chem. Phys., 17, 12197–12218, https://doi.org/10.5194/acp-17-12197-2017, 2017.
Satake, S., Uno, I., Takemura, T., Carmichael, G., Tang, Y., Streets, D., Sugimoto, N., Shimizu, A., Uematsu, M., Han, J.-S., and Ohta, S.: Characteristics of Asian aerosol transport simulated with a regional-scale chemical transport model during the ACE-Asia observation, J. Geophys. Res., 109, D19S22, https://doi.org/10.1029/2003JD003997, 2004.
Saxton, K., Chandler, D., Stetler, L., Lamb, B., Claiborn, C., and Lee, B.-H.: Wind erosion and fugitive dust fluxes on agricultural lands in the Pacific Northwest, T. ASAE, 43, 623–630, https://doi.org/10.13031/2013.2743, 2000.
Shao, Y.: Physics and modeling of wind erosion, Dordrecht, Kluwer Academic Publishers, 225–278, 2000.
Shao, Y.: A model for mineral dust emission, J. Geophys. Res., 106, 20239–20254, https://doi.org/10.1029/2001JD900171, 2001.
Shao, Y.: Simplification of a dust emission scheme and comparison with data, J. Geophys. Res., 109, D10202, https://doi.org/10.1029/2003JD004372, 2004.
Shao, Y. and Dong, C.: A review on East Asian dust storm climate, modelling and monitoring, Global Planet. Change, 52, 1–22, https://doi.org/10.1016/j.gloplacha.2006.02.011, 2006.
Shao, Y., Jung, E., and Leslie, L. M.: Numerical prediction of northeast Asian dust storms using an integrated wind erosion modeling system, J. Geophys. Res., 107, 4814, https://doi.org/10.1029/2001JD001493, 2002.
Shao, Y., Wyrwoll, K., Chappell, A., Huang, J., Lin, Z., McTainsh, G., Mikami, M., Tanaka, T., Wang, X., and Yoon, S.: Dust cycle: an emerging core theme in Earth system science, Aeolian Res., 2, 181–204, https://doi.org/10.1016/j.aeolia.2011.02.001, 2011a.
Shao, Y., Ishizuka, M., Mikami, M., and Leys, J. F.: Parameterization of size-resolved dust emission and validation with measurements, J. Geophys. Res., 116, D08203, https://doi.org/10.1029/2010JD014527, 2011b.
Shao, Y., Klose, M., and Wyrwoll, K.: Recent global dust trend and connections to climate forcing, J. Geophys. Res., 118, 11107–11118, https://doi.org/10.1002/jgrd.50836, 2013.
Sharratt, B. and Lauer, D.: Particulate matter concentration and air quality affected by windblown dust in the Columbia Plateau, J. Environ. Qual., 35, 2011–2016, https://doi.org/10.2134/jeq2006.0212, 2006.
Sharratt, B., Wendling, L., and Feng, G.: Windblown dust affected by tillage intensity during summer fallow, Aeolian Res., 2, 129–134, https://doi.org/10.1016/j.aeolia.2010.03.003, 2010.
Shimizu, A., Sugimoto, N., Matsui, I., Arao, K., Uno, I., Murayama, T., Kagawa, N., Aoki, K., Uchiyama, A., and Yamazaki, A.: Continuous observations of Asian dust and other aerosols by polarization lidar in China and Japan during ACE-Asia, J. Geophys. Res., 109, D19S17, https://doi.org/10.1029/2002JD003253, 2004.
Shimizu, A., Nishizawa, T., Jin, Y., Kim, S.-W., Wang, Z. F., Batdorj, D., and Sugimoto, N.: Evolution of a lidar network for tropospheric aerosol detection in East Asia, Opt. Eng., 56, 031219, https://doi.org/10.1117/1.OE.56.3.031219, 2016.
Stanhill, G.: Global dimming: a new aspect of climate change, Weather, 60, 11–14, https://doi.org/10.1256/wea.210.03, 2005.
Sugimoto, N., Uno, I., Nishikawa, M., Shimizu, A., Matsui, I., Dong, X. H., Chen, Y., and Quan, H.: Record Heavy Asian Dust in Beijing in 2002: Observations and Model Analysis of Recent Events, Geophys. Res. Lett., 30, 1640, https://doi.org/10.1029/2002GL016349, 2003.
Sugimoto, N., Matsui, I., Shimizu, A., Nishizawa, T., Hara, Y., Xie, C. B., Uno, I., Yumimoto, K., Wang, Z. F., and Yoon, S.-C.: Lidar Network Observations of Troposheric Aerosols, Lidar Remote Sensing for Environmental Monitoring IX, Proc. of SPIE, 7153, https://doi.org/10.1117/12.806540, 2008.
Tagliabue, A., Bowie, A. R., Boyd, P. W., Buck, K. N., Johnson, K. S., and Saito, M. A.: The integral role of iron in ocean biogeochemistry, Nature, 543, 51–59, https://doi.org/10.1038/nature21058, 2017.
Takemura, T., Uno, I., Nakajima, T., Higurashi, A., and Sano, I.: Modeling study of long-range transport of Asian dust and anthropogenic aerosols from East Asia, Geophys. Res. Lett., 29, 2158, https://doi.org/10.1029/2002GL016251, 2002.
Tan, S.-C., Li, J., Che, H., Chen, B., and Wang, H.: Transport of East Asian dust storms to the marginal seas of China and the southern North Pacific in spring 2010, Atmos. Environ., 148, 316–328, https://doi.org/10.1016/j.atmosenv.2016.10.054, 2017.
Tanaka, T. Y. and Chiba, M.: A numerical study of the contributions of dust source regions to the global dust budget, Global Planet. Change, 52, 88–104, https://doi.org/10.1016/j.gloplacha.2006.02.002, 2006.
Tegen, I., Lacis, A. A., and Fung, I.: The influence on climate forcing of mineral aerosols from disturbed soils, Nature, 380, 419–422, https://doi.org/10.1038/380419a0, 1996.
Tsoar, H. and Pye, K.: Dust transport and the question of desert loess formation, Sedimentology, 34, 139–153, https://doi.org/10.1111/j.1365-3091.1987.tb00566.x, 1987.
Uematsu, M., Duce, R. A., Prospero, J. M., Chen, L. Q., Merrill J. T., and Mcdonald, R. L.: Transport of mineral aerosol from Asia over the North Pacific Ocean, J. Geophys. Res., 88, 5343–5352, https://doi.org/10.1029/JC088iC09p05343, 1983.
Uematsu, M., Wang, Z. F., and Uno, I.: Atmospheric input of mineral dust to the western North Pacific region based on direct measurements and a regional chemical transport model, J. Geophys. Res., 30, 1342, https://doi.org/10.1029/2002GL016645, 2003.
Uno, I., Amano, H., Emori, S., Kinoshita, K., Matsui, I., and Sugimoto, N.: Trans-Pacific yellow sand transport observed in April 1998: A numerical simulation, J. Geophys. Res., 106, 18331–18344, https://doi.org/10.1029/2000JD900748, 2001.
Uno, I., Wang, Z., Chiba, M., Chun, Y. S., Gong, S. L., Hara, Y., Jung, E., Lee, S.-S., Liu, M., Mikami, M., Music, S., Nickovic, S., Satake, S., Shao, Y., Song, Z., Sugimoto, N., Tanaka, T., and Westphal, D.: Dust model intercomparison (DMIP) study over Asia: Overview, J. Geophys. Res., 111, 2503–2511, https://doi.org/10.1029/2005JD006575, 2006.
Uno, I., Eguchi, K., and Yumimoto, K.: Asian dust transported one full circuit around the globe, Nat. Geosci., 2, 557–560, https://doi.org/10.1038/ngeo583, 2009.
US EPA: Guideline for reporting of daily air quality – the Air Quality Index (AQI), U.S. Environmental Protection Agency, Office of Air Quality Planning and Standards, Research Triangle Park, North Carolina, 2006.
US EPA: Compendium of methods for the determination of inorganic compounds in ambient air (chapter 10-1), U.S. Environmental Protection Agency, Center for Environmental Research Information, Office of Research and Development, Cincinnati, Ohio, 2009.
Wang, L., Zhang, P., Tan, S., Zhao, X., Cheng, D., Wei, W., Su, J., and Pan, X.: Assessment of urban air quality in China using air pollution indices (APIs), J. Air Waste Manage., 63, 170–178, https://doi.org/10.1080/10962247.2012.739583, 2013.
Wang, Y. M., Wang, J. H., Qi, Y., and Yan, C. Z.: China 1 : 100 000 Desert (Sand land) Map, Cold and Arid Regions Science Data Center at Lanzhou, https://doi.org/10.3972/westdc.006.2013.db, 2005.
Wang, Z. F., Ueda, H., and Huang, M. Y.: A deflation module for use in modeling long-range transport of yellow sand over East Asia, J. Geophy. Res., 105, 26947–26960, https://doi.org/10.1029/2000JD900370, 2000.
Wesely, M. L.: Parameterization of surface resistances to gaseous dry deposition in regional-scale numerical models, Atmos. Environ., 23, 1293–1304, https://doi.org/10.1016/0004-6981(89)90153-4, 1989.
Wesely, M. L. and Hicks, B. B.: A review of the current status of knowledge on dry deposition, Atmos. Environ., 34, 2261–2282, https://doi.org/10.1016/S1352-2310(99)00467-7, 2000.
Whicker, J. J., Breshears, D. D., and Field, J. P.: Progress on relationships between horizontal and vertical dust flux: Mathematical, empirical and risk-based perspectives, Aeolian Res., 14, 105–111, https://doi.org/10.1016/j.aeolia.2013.12.001, 2014.
Wu, C. and Lin, Z.: Impact of Two Different Dust Emission Schemes on the Simulation of a Severe Dust Storm in East Asia Using the WRF/Chem Model, Clim. Environ. Res., 19, 419–436, https://doi.org/10.3878/j.issn.1006-9585.2013.13041, 2014.
Wu, C., Liu, X., Lin, Z., Rahimi-Esfarjani, S. R., and Lu, Z.: Impacts of absorbing aerosol deposition on snowpack and hydrologic cycle in the Rocky Mountain region based on variable-resolution CESM (VR-CESM) simulations, Atmos. Chem. Phys., 18, 511–533, https://doi.org/10.5194/acp-18-511-2018, 2018.
Young, R. W., Carder, K. L., Betzer, P. R., Costello, D. K., Duce, R. A., DiTullio, G. R., Tindale, N. W., Laws, E. A., Uemastsu, M., Merrill, J. T., and Feely, R. A.: Atmospheric iron inputs and primary productivity: Phytoplankton responses in the North Pacific, Global Biogeochem. Cy., 5, 119–134, https://doi.org/10.1029/91GB00927, 1991.
Yu, F., Luo, G., Liu, X., Easter, R. C., Ma, X., and Ghan, S. J.: Indirect radiative forcing by ion-mediated nucleation of aerosol, Atmos. Chem. Phys., 12, 11451–11463, https://doi.org/10.5194/acp-12-11451-2012, 2012.
Zhang, X. X., Shi, P. J., Liu, L. Y., Tang, Y., Cao, H. W., Zhang, X. N., Hu, X., Guo, L. L., Lue, Y. L., Qu, Z. Q., Jia, Z. J., and Yang, Y. Y.: Ambient TSP concentration and dustfall in major cities of China: spatial distribution and temporal variability, Atmos. Environ., 44, 1641–1648, https://doi.org/10.1016/j.atmosenv.2010.01.035, 2010.
Zhang, X.-X., Sharratt, B., Chen, X., Wang, Z.-F., Liu, L.-Y., Guo, Y.-H., Li, J., Chen, H.-S., and Yang, W.-Y.: Dust deposition and ambient PM10 concentration in northwest China: spatial and temporal variability, Atmos. Chem. Phys., 17, 1699–1711, https://doi.org/10.5194/acp-17-1699-2017, 2017.
Zhang, X. Y., Shen, Z. B., Zhang, G. Y., Chen, T., and Liu, H.: Remote mineral aerosols in westerlies and their contributions to the Chinese loess, Science China Earth Sciences, 39, 134–143, https://doi.org/10.1360/yd1996-39-2-134, 1996.
Zhang, X. Y., Arimoto, R., and An, Z. S.: Dust emission from Chinese desert sources linked to variations in atmospheric circulation, J. Geophys. Res., 102, 28041–28047, https://doi.org/10.1029/97JD02300, 1997.
Zhao, C., Liu, X., Leung, L. R., Johnson, B., McFarlane, S. A., Gustafson Jr., W. I., Fast, J. D., and Easter, R.: The spatial distribution of mineral dust and its shortwave radiative forcing over North Africa: modeling sensitivities to dust emissions and aerosol size treatments, Atmos. Chem. Phys., 10, 8821–8838, https://doi.org/10.5194/acp-10-8821-2010, 2010.
Zhao, T., Gong, S., Zhang, X. Y., and McKendry, I.: Modeled size-segregated wet and dry deposition budgets of soil dust aerosol during ACE-Asia, 2001: Implications for trans-Pacific transport, J. Geophys. Res., 108, 8665, https://doi.org/10.1029/2002JD003363, 2003.
Zheng, Y., Zhao, T., Che, H., Liu, Y., Han, Y., Liu, C., Xiong, J., Liu, J., and Zhou, Y.: A 20-year simulated climatology of global dust aerosol deposition, Sci. Total Environ., 557–558, 861–868, https://doi.org/10.1016/j.scitotenv.2016.03.086, 2016.
Zhuang, G. S., Yi, Z., and Duce, R.: Link between iron and sulphur cycles suggested by detection of iron(II) in remote marine aerosols, Nature, 355, 537–539, https://doi.org/10.1038/355537a0, 1992.