the Creative Commons Attribution 4.0 License.
the Creative Commons Attribution 4.0 License.
 | 05 Jun 2018
A European aerosol phenomenology – 6: scattering properties of atmospheric aerosol particles from 28 ACTRIS sites
Marco Pandolfi
Lucas Alados-Arboledas
Andrés Alastuey
Marcos Andrade
Christo Angelov
Begoña Artiñano
John Backman
Urs Baltensperger
Paolo Bonasoni
Nicolas Bukowiecki
Martine Collaud Coen
Sébastien Conil
Esther Coz
Vincent Crenn
Vadimas Dudoitis
Marina Ealo
Kostas Eleftheriadis
Olivier Favez
Prodromos Fetfatzis
Markus Fiebig
Harald Flentje
Patrick Ginot
Martin Gysel
Bas Henzing
Andras Hoffer
Adela Holubova Smejkalova
Ivo Kalapov
Nikos Kalivitis
Giorgos Kouvarakis
Adam Kristensson
Markku Kulmala
Heikki Lihavainen
Chris Lunder
Krista Luoma
Hassan Lyamani
Angela Marinoni
Nikos Mihalopoulos
Marcel Moerman
José Nicolas
Colin O'Dowd
Tuukka Petäjä
Jean-Eudes Petit
Jean Marc Pichon
Nina Prokopciuk
Jean-Philippe Putaud
Sergio Rodríguez
Jean Sciare
Karine Sellegri
Erik Swietlicki
Gloria Titos
Thomas Tuch
Peter Tunved
Vidmantas Ulevicius
Aditya Vaishya
Milan Vana
Aki Virkkula
Stergios Vratolis
Ernest Weingartner
Alfred Wiedensohler
Paolo Laj
This paper presents the light-scattering properties of atmospheric aerosol particles measured over the past decade at 28 ACTRIS observatories, which are located mainly in Europe. The data include particle light scattering (σsp) and hemispheric backscattering (σbsp) coefficients, scattering Ångström exponent (SAE), backscatter fraction (BF) and asymmetry parameter (g). An increasing gradient of σsp is observed when moving from remote environments (arctic/mountain) to regional and to urban environments. At a regional level in Europe, σsp also increases when moving from Nordic and Baltic countries and from western Europe to central/eastern Europe, whereas no clear spatial gradient is observed for other station environments. The SAE does not show a clear gradient as a function of the placement of the station. However, a west-to-east-increasing gradient is observed for both regional and mountain placements, suggesting a lower fraction of fine-mode particle in western/south-western Europe compared to central and eastern Europe, where the fine-mode particles dominate the scattering. The g does not show any clear gradient by station placement or geographical location reflecting the complex relationship of this parameter with the physical properties of the aerosol particles. Both the station placement and the geographical location are important factors affecting the intra-annual variability. At mountain sites, higher σsp and SAE values are measured in the summer due to the enhanced boundary layer influence and/or new particle-formation episodes. Conversely, the lower horizontal and vertical dispersion during winter leads to higher σsp values at all low-altitude sites in central and eastern Europe compared to summer. These sites also show SAE maxima in the summer (with corresponding g minima). At all sites, both SAE and g show a strong variation with aerosol particle loading. The lowest values of g are always observed together with low σsp values, indicating a larger contribution from particles in the smaller accumulation mode. During periods of high σsp values, the variation of g is less pronounced, whereas the SAE increases or decreases, suggesting changes mostly in the coarse aerosol particle mode rather than in the fine mode. Statistically significant decreasing trends of σsp are observed at 5 out of the 13 stations included in the trend analyses. The total reductions of σsp are consistent with those reported for PM2.5 and PM10 mass concentrations over similar periods across Europe.
- Article
(1289 KB) - Full-text XML
-
Supplement
(792 KB) - BibTeX
- EndNote


Atmospheric aerosol particles are recognized as an important atmospheric constituent that has demonstrated effects on climate and health. The radiative forcing of aerosol particles, estimated as −0.9 [−1.9 to −0.1] W m−2 (IPCC, 2014), has two competing components: a cooling effect from most particle types and a partially offsetting warming contribution from black carbon (BC) particle light absorption of solar radiation. The aerosol cooling is the dominant effect; thus aerosol particles counteract a substantial portion of the warming effect from well-mixed greenhouse gases (GHGs). This process is driven by the scattering properties of most aerosol particle types (e.g. secondary sulfate and nitrate particles, mineral and organic matter), which reduce the amount of solar radiation reaching the Earth's surface, instead reflecting it back into space and thus modifying the Earth's radiative balance.
However, the high temporal and spatial variability in atmospheric aerosol particles due to the wide variety of aerosol sources and sinks, together with their short and variable lifetimes (hours to weeks in the planetary boundary layer) and spatial non-uniformity, constitute the largest uncertainties in the estimation of the total radiative forcing. Reducing these uncertainties is mandatory in view of the warming the planet has experienced over the past 50 years. In fact, there is evidence suggesting that the observed (and projected) decrease in emissions of anthropogenic aerosol particles in response to air quality policies will eventually exert a positive aerosol effective radiative forcing at the top of the atmosphere (Rotstayn et al., 2013). Thus, current emission controls could both enhance climate warming while improving air quality (e.g. Stohl et al., 2015).
The measurements of aerosol particle optical properties, such as light scattering and absorption, together with measurements of their physical and chemical properties, are fundamental for understanding the current trade-off between the impacts of aerosols on environmental health and the Earth's climate. In recent decades, several international projects have provided important information on atmospheric particle properties worldwide. Near-surface in situ observations of aerosol particle properties are being made worldwide under the GAW/WMO (Global Atmosphere Watch; http://www.wmo.int/pages/prog/arep/gaw/gaw_home_en.html, last access: August 2017) programme and are complemented with policy-oriented programmes such as IMPROVE (Interagency Monitoring of Protected Visual Environments; http://vista.cira.colostate.edu/Improve/, last access: August 2017) in the United States and EMEP (European Monitoring and Evaluation Programme; http://www.emep.int/, last access: August 2017) in Europe. Additional information specifically targeting advanced aerosol particle properties has been obtained in Europe using information from the European research infrastructure ACTRIS (Aerosols, Clouds, and Trace gases Research InfraStructure; http://www.actris.eu, last access: August 2017) and from short-term RTD (Research and Technological Development) projects such as EUCAARI (European Integrated Project on Aerosol Cloud Climate and Air Quality Interactions; http://www.cas.manchester.ac.uk/resprojects/eucaari/, last access: August 2017).
The implementation of the GAW programme in Europe is performed under ACTRIS in regard to the advanced observation of aerosol particle properties. ACTRIS provides harmonized measurements of different (physical, chemical and optical) aerosol properties in a systematic way at major observation sites across Europe. More than 60 measuring sites worldwide are currently providing ground-based in situ aerosol particle light-scattering measurements (EBAS database; http://ebas.nilu.no/, last access: August 2017) and this number has increased substantially in the last decade. However, EBAS also includes data from the IMPROVE network nephelometers, which latter are operated at ambient conditions with no size cut, and as a result these IMPROVE data are not directly comparable to the ACTRIS data set discussed in this investigation.
The objective of this work is to integrate the total aerosol light-scattering coefficient (σsp) and hemispheric backscattering coefficient (σbsp) measurements taken over several years at the ground-based in situ ACTRIS stations. A total of 28 stations (26 European + 2 non-European) are included in order to document the variability in near-surface aerosol particle light scattering across the ACTRIS network. Moreover, at some of the ACTRIS stations more than 10 years of σsp data are available, allowing us to perform trend analyses. The study of the trend of σsp is important given that a decreasing or increasing trend of σsp over time would be indicative of the effectiveness of the air quality control measures. In fact, many studies have shown that the concentrations of particulate matter (PM) and other air pollutants such as sulfur dioxide (SO2) and carbon monoxide (CO) have clearly decreased over the last 20 years in many European countries (Barmpadimos et al., 2012; Cusack et al., 2012; EEA, 2013; Querol et al., 2014; Guerreiro et al., 2014; Pandolfi et al., 2016; Tørseth et al., 2012, among others).
Previous studies presenting multi-site ground-based in situ aerosol particle optical measurements were, for example, taken by Delene and Ogren (2002), Sherman et al. (2015), Collaud Coen et al. (2013) and Andrews et al. (2011). Delene and Ogren (2002) and Sherman et al. (2015) reported on the variability in aerosol particle optical properties at four North American surface monitoring sites. Collaud Coen et al. (2013) presented long-term (> 8–9 years) aerosol particle light-scattering and absorption measurements taken at 24 regional/remote observatories located mostly in the United States (although 5 are located in Europe). Andrews et al. (2011) reported aerosol particle optical measurements taken at 12 mountaintop observatories (4 of which are located in Europe, 5 in the United States and Canada and 3 in Asia).
Our work is focused mainly on European observatories and aims to present a representative phenomenology of aerosol particle light-scattering coefficients measurements at ACTRIS stations. Thanks to the establishment of European monitoring networks and/or research projects, five papers relating to aerosol phenomenology have been published in Europe: Van Dingenen et al. (2004) and Putaud et al. (2004) respectively studied the physical and chemical characteristics of PM at the kerbside, urban, rural and background sites in Europe; Putaud et al. (2010) studied the physical and chemical characteristics of PM measured at 60 sites across Europe; Cavalli et al. (2016) studied the harmonized concentrations of carbonaceous aerosols at 10 regional background sites in Europe; and Zanatta et al. (2016) presented a climatology of BC optical properties at nine European regional background sites. The importance of these studies and of the present work rests on the premise that a reliable assessment of the physical, chemical and optical properties of aerosol particles at a European scale is of crucial importance for an accurate estimation of the radiative forcing of atmospheric aerosols. This work is the first European phenomenology study dedicated to the light-scattering properties of aerosol particles measured in situ at near-surface ground-based observatories. Moreover, the trend analyses presented can be used to evaluate how the European mitigation strategies adopted to improve air quality have impacted aerosol particle optical properties.
Table 1List of ACTRIS observatories providing aerosol particle-scattering measurements.
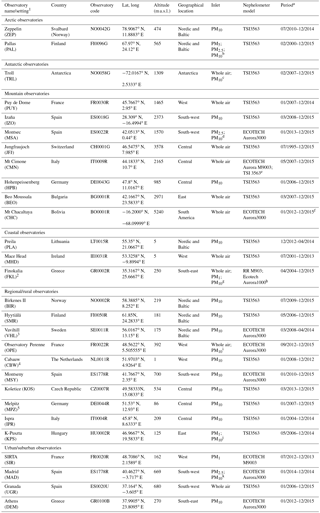
1 Observatory codes from EBAS; 2 GAW code: FIK; 3 GAW code: VAV; 4 GAW code: CES; 5 GAW code: MEL; a start-end of measurements; total aerosol particle scattering was used as reference for measurement period; b PM5 (2000–08/2005), PM2.5 (08/2005–2007) and PM10 (2008–2015); c whole air (2007–2009) and PM10 (2010–2015); d PM2.5 (2013–03/2014) and PM10 (04/2014–2015); e ECOTECH Aurora M9003 during 2007–2013 and TSI 3563 (2014–2015); f only measurements taken during the year 2012 were used in this investigation; g whole air (2004–2008), PM10 (2009–2011), PM1 (2011–2012), PM10 (2013–2015); h RR M903 during 2004–2011, Ecotech AURORA1000 during 2012–2015; i whole air (2012–08/2013) and PM10 (09/2014–2015); j PM1 (2006–04/2008) and PM10 (05/2008–2014); k PM10 from 03/2014.
2.1 Atmospheric observatories
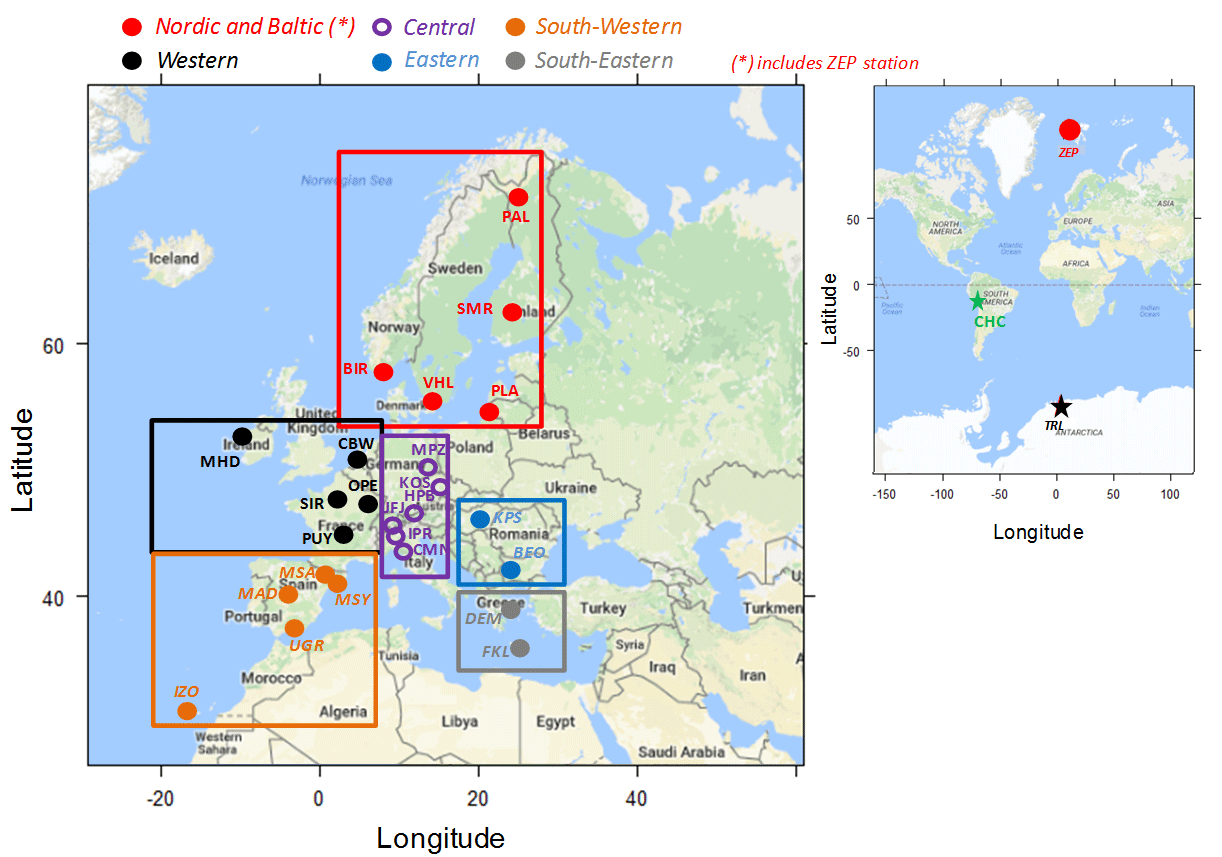
Figure 1 shows the location of the observatories which are grouped according to their geographical locations, a grouping employed in other European phenomenology studies (e.g. Putaud et al., 2010). Observatory information (country, code, coordinates, altitude, geographical location, among others) and measurement periods are summarized in Table 1. The observatories are also divided into five different categories depending on their placement within each geographical sector. The Arctic includes stations located in the Arctic/sub-Arctic region; mountains include those observatories located at more than 985 (the lowest altitude among the mountain observatories included here); coastal regions include observatories located close to the coast (< 1–4 km); regional/rural areas include those observatories that are representative of large regional areas; and urban/suburban areas include observatories located in the background of an urban or suburban area. Two non-European stations are also included: one Antarctic site and one mountain site in Bolivia. Given that this work mainly focuses on European ACTRIS observatories, the results from these two non-European stations are reported in the Supporting Information.
The altitudes of the mountain stations considered here range between 985 m at HPB and 5240 m at CHC (see Table 1). Some of the mountain stations included in this investigation have already been included in the work of Andrews et al. (2011), namely IZO, JFJ, CMN and BEO. Moreover, the FKL, HPB, JFJ, MHD and PAL stations have been included in the study by Collaud Coen et al. (2013). Both studies presented in situ aerosol particle optical measurements taken at these stations. The main results of these previous investigations are summarized in the Results section.
2.2 Scattering measurements
2.2.1 Instruments
The measurements of σsp and σbsp included in this study were obtained from TSI and Ecotech integrating nephelometers (Table 1). These optical instruments measure the amount of light scattered by particles in the visible spectrum and provide σsp and σbsp coefficients of the sampled aerosols. The most common nephelometers in the ACTRIS programme are the TSI3563 and the Ecotech AURORA3000 nephelometers, both of which provide σsp and σbsp. The model TSI3563 measures σsp and σbsp at 450, 550 and 700 nm, whereas the Ecotech AURORA3000 measures at 450, 525 and 635 nm. Other models used are the M9003 from Ecotech (SIR and CMN) and the RR (Radiance Research) nephelometer model M903 (FKL) measuring σsp at 520 and 532 nm respectively. Due to the non-homogeneity of the angular distribution of the light intensity of model M9003 (see Müller et al., 2009), the light source was changed at SIR in 2013 with the AURORA3000 light source and at CMN in 2009 with an opal glass light source. After the change of the light sources, both nephelometers were examined at the World Calibration Center for Aerosol Physics in Leipzig and performed very well (personal communication from Jean Sciare (SIR; 27 July 2017) and Angela Marinoni (CMN; 21 July 2017)). The detailed description of the main characteristics and the working principle of the integrating nephelometers can be found in Müller et al. (2011) for the Ecotech AURORA3000 and in Anderson and Ogren (1998) for the model TSI 3563.
Recommended quality assurance procedures during an on-site operation, as described in GAW (WMO-GAW report, 2016), help to ensure the quality and comparability of the data. The nephelometers included in this investigation are regularly calibrated using span gas and are zero adjusted using particle-free air. Additionally, most of the integrating nephelometers employed in ACTRIS have undergone a schedule of performance checks at the World Calibration Center for Aerosol Physics of ACTRIS/GAW.
2.2.2 Data treatment
Data used in this investigation include hourly averaged level 2 aerosol particle-scattering data downloaded from the ACTRIS/EBAS Data Centre web portals (http://actris.nilu.no; http://ebas.nilu.no; last downloads August 2017). The σsp and σbsp data reported to EBAS and used in this work are referenced to standard T (273.15 ∘C) and P (1013 hPa) conditions. Data consistency is critical when comparing many years' worth of data from different stations. In this work, the level 2 scattering data were further reviewed in order to ensure a high quality of presented data. There are, however, station-to-station differences (e.g. sizecut, RH control, wavelength and data processing), which are addressed below.
Truncation correction
Data from the integrating nephelometers used here are corrected for non-ideal illumination of the light source (deviation from a Lambertian distribution of light) and for truncation of the sensing volumes in the near-forward (around 0–10∘) and near-backward (around 170–180∘) directions (Müller et al., 2009 and Anderson and Ogren, 1998). Correction schemes have been provided by Müller et al. (2009, 2011) for the RR M903 and Ecotech models M9003 and AURORA3000, and by Anderson and Ogren (1998) for the TSI3563. These schemes consist of a simple linear correction based on the scattering Ångström exponent (SAE) determined from the raw nephelometer data to take account of the size-distribution-dependent truncation error. It has been demonstrated that these simple correction schemes are accurate for a wide range of atmospheric aerosols and that the uncertainties in the corrections are not expected to be larger than 2 % for an aerosol particle population with a single-scattering albedos (SSA) greater than 0.8 (Bond et al., 2009).
The majority of the σsp data in the EBAS database are corrected for non-ideal illumination and for truncation by the data providers. Exceptions are the scattering data submitted for KOS, MHD, PLA, CMN, FKL and SIR. Scattering data from KOS, MHD and PLA were corrected in this work using the correction scheme provided by Anderson and Ogren (1998) (see Table S1 in the Supplement). The σsp data collected at CMN, FKL and SIR are not corrected because the nephelometers deployed at these three stations provide scattering only at one wavelength, thus preventing the estimation of the SAE. Given that the nephelometer correction factors vary as a function of SAE, the assumption of a constant correction factor for the 1-λ scattering data could introduce undesired noise. Moreover, at SIR and CMN, the σsp is measured with the single-wavelength Ecotech nephelometer model M9003 (until 2013 at CMN). The correction curve from Müller et al. (2009; Fig. 4) provides a correction factor of around 0.97–1.0 for the M9003 for a SAE of around 1.5–2. Using the TSI3563 scattering measurements taken at CMN during 2014–2015, we estimated a mean SAE of around 2 for CMN (see Table S5 in the Supplement). Thus, given the rather small effect of the correction factor estimated for the Ecotech M9003, scattering data from CMN and SIR were not corrected in this work. At FKL the nephelometer models RR M903 (until 2011) and Ecotech 1000 (from 2012) were used (see Table 1). To the best of our knowledge, no correction scheme has been provided for the Ecotech 1000. Moreover, at FKL, the inlet was changed many times (see Table 1) and the correction factors provided in the literature are a strong function of the size cut-off used. For these reasons, scattering data collected at FKL are not corrected in this investigation.
Relative humidity
The integrating nephelometer measurements within ACTRIS and WMO-GAW should be taken at a low relative humidity (RH < 40 %) in order to avoid enhanced scattering due to water uptake of aerosol particles and in order to make the measurements comparable. For the Ecotech integrating nephelometers, the RH threshold can be set by using a processor-controlled automatic heater inside the instrument. At some mountain sites, where whole air is sampled (see Table 1), the natural temperature difference between the outside and inside air dries cloud droplets to the aerosol phase when a cloud is present at the station. RH is also controlled by dehumidifying the inlet pipe, as reported in GAW report 226, to ensure a sampling RH of less than 40 %. This recommendation is intended to ensure that the data are comparable across the network, as measurements would otherwise would be a strong function of the highly variable sample RH. Currently, at the majority of ACTRIS observatories, the aerosol particle light-scattering measurements are taken at a RH below 40 %. However, given that at some stations the 40 % RH threshold is sometimes exceeded, in this work we selected a RH threshold of 50 % in order to improve the data coverage.
Estimating the aerosol particle light-scattering enhancement due to an increase in RH from 40 to 50 % is difficult using the data available here because the σsp measurements at a RH > 40 % are not evenly distributed over the measurement periods, with the majority of the stations registering a RH higher than 40 % during the summer. Moreover, the chemical composition of atmospheric aerosol particles is an important factor determining the magnitude of the scattering enhancement due to water uptake, which can then change from one site to another (e.g. Fierz-Schmidhauser et al., 2010a, b; Zieger et al., 2014, 2017). However, the scattering enhancement due to a change in RH between 40 and 50 % should be small and will not exceed few percent, even for more hygroscopic particles (e.g. Fierz-Schmidhauser et al., 2010a, b). Table S2 in the Supplement reports the percentage of hourly σsp values collected in the range 40 % < RH < 50 %, whereas the frequency distributions of the measured RH are shown in Fig. S1 in the Supplement.
Available wavelengths
In this work we present and discuss the σsp, backscatter fraction (BF) and asymmetry parameter (g) measurements obtained using the green wavelength of the integrating nephelometers. The available wavelengths ranged from 520 nm (2 stations; CMN and VHL) to 550 nm (18 stations). Other wavelengths used are 525 nm (6 stations) and 532 nm (used at FKL until 2010; see Table 2). An exception is SIR, where only σsp values at 450 nm are available. The measurements of σsp reported here are not adjusted to 550 nm, which is generally the most common wavelength (e.g. Andrews et al., 2011) because of the different data availability of σsp and SAE at the measuring stations. As discussed in the following sections, the SAE is calculated for σsp data higher than 0.8 Mm−1, thus leading to different data coverage for σsp and SAE and preventing the adjustment of all measured σsp to 550 nm. Moreover, the SAE is not available at FKL and SIR (or at CMN until 2014), thus preventing any wavelength adjustment at these stations. Using the mean SAE calculated at stations where σsp is measured at wavelengths in addition to 550 nm (see Tables S4 and S5 in the Supplement), we estimate differences in the σsp values of less than 6 % after adjusting to 550 nm. At FKL and SIR, where the SAE is not available, and assuming a reasonable SAE range between 1.5 and 1.0, the difference due to the adjustment to 550 nm is 4.9–3.0 % at FKL and 26–18 % at SIR. The higher difference at SIR is due to the fact that measurements at this station are taken at 450 nm. Finally, at CMN, the effect of the adjustment of σsp to 550 nm (from 520 nm) using a mean SAE of 2 (calculated using the 3-λ nephelometer data from 2014; see Table S5) is below 10 %.
Inlet size cut changes
It should be noted that any comparison of the σsp and SAE values among the different stations and the presented trend analyses could be slightly biased by the different particle size cuts upstream of the integrating nephelometers used in this work (see Table 1). Currently, all ACTRIS integrating nephelometers measure whole air or PM10, with the exception of SIR, where the PM1 inlet is used. Whole air is currently measured at mountain observatories (BEO, CMN, JFJ, PUY, CHC), one coastal observatory (MHD) and one urban observatory (UGR) (see Table 1).
At some stations, the inlet was changed from whole air to PM10 at some point, namely at OPE, FKL and TRL. Given the lower scattering efficiency of aerosol particles larger than 10 µm, no important differences in the aerosol particle optical parameters should be expected between aerosol particles sampled with a whole air and a PM10 cut-off. At the other stations the inlet was changed during the measurement period from a cut-off lower than 10 µm (1 µm at KPS; 2.5 µm or 5 µm at PAL, MSA and MAD) to PM10. For PAL (where a median SAE of around 1.8 was measured; see Sect. 3.2 and Table S5), Lihavainen et al. (2015a) assumed that the inlet changes (from PM5 to PM2.5 in 2005 and from PM2.5 to PM10; see Table 1) had only minor effects on scattering because the number concentration of coarse particles is very low at PAL. Similarly, the KPS observatory registers among the highest SAE values observed in the network (median value of around 2; see Sect. 3.2 and Table S5), suggesting an aerosol particle size distribution dominated by fine particles. Moreover, at KPS, the inlet was changed in April 2008, less than 1.5 years after the measurements commenced, and thus likely also has a minor effect on the trend analyses and climatology performed at this site over the period 2006–2014. Two stations (MSA and MAD) changed the inlet from a PM2.5 diameter cut-off to PM10. For these two southern European stations the inlet change may have had an effect on the SAE, especially during Saharan dust outbreaks, which are, however, sporadic events. Finally, the FKL observatory was removed from the trend analysis because the inlet was changed from whole air to PM10 in 2009, from PM10 to PM1 in 2011 and again from PM1 to PM10 in 2013 (see Table 1). These events likely had a major effect on the measured particle optical properties.
A sensitivity study (not shown) was carried out to assess the effect of the inlet changes on the SAE values measured at the aforementioned stations. We looked at the climatology of SAE for different inlet sizes and for different time periods (with and without inlet size changes) and we did not observe any obvious change in the climatology as a function of size cut due to interannual variability. Thus, despite the differences in the particle diameter cut-off, the comparison between the different stations seems feasible.
2.2.3 Calculation of aerosol particle intensive optical properties
Starting from the spectral σsp measurements taken at the ACTRIS observatories, three intensive aerosol particle optical parameters can be estimated, namely the scattering Ångström exponent (SAE), the backscattering fraction (BF) and the asymmetry parameter (g). These intensive properties do not depend on the PM mass concentration and are directly related to aerosol particle properties such as size, shape, size distribution and chemical composition. The SAE can be considered a proxy for the aerosol particle size range with a higher (lower) SAE associated with predominance of fine (coarse) aerosol particles (e.g. Seinfeld and Pandis, 1998; Esteve et al., 2012; Valenzuela et al., 2015 among others). The BF and g parameters are calculated quantities that influence the variability in the radiative forcing efficiency and that represent the angular light scattering of aerosol particles. For computational efficiency, the angular light scattering is often represented by a single value (BF, σsp∕σbsp or g) (Andrews et al., 2006).
The SAE characterizes the wavelength dependency of σsp and it can be calculated as follows:
Here, the SAE is derived from a multispectral log linear fit based on the three nephelometer wavelengths. The SAE depends on the particle size distribution and takes values greater than 2 when the light scattering is dominated by fine particles (radii ≤ 0.5 µm as in Schuster et al., 2006), while it is lower than one when the light scattering is dominated by coarse particles (Seinfeld and Pandis, 1998; Schuster et al., 2006).
The asymmetry parameter (g) (Andrews et al., 2006; Delene and Ogren, 2002) describes the probability that the radiation is scattered in a given direction and it is defined as the cosine-weighted average of the phase function. Thus, g yields information regarding the amount of radiation that a particle scatters in the forward direction compared to the backward direction. Theoretically, the values of g can range from −1 for only back scattering to +1 for complete forward scattering, with a value of 0.7 commonly used in radiative transfer models. The g parameter can be estimated from the backscatter fraction (BF), which is the ratio of σbsp and σsp (Andrews et al., 2006):
2.2.4 Data coverage
Table S3 in the Supplement reports the percentage (%) of data coverage at the 28 ACTRIS stations included in this study. Removed data include data flagged as non-valid by the data providers (instrument failure, calibration periods, unspecified contamination or local influence, etc.) or obtained at a RH of greater than 50 %. The data coverage for the extensively measured aerosol particle optical properties (σsp and σbsp) is generally high, ranging from around 60 to 95 %. Exceptions are the σsp measurements at CMN in the blue (450 nm) and red (700 nm) wavelengths, which have much less data coverage compared to the green wavelength because the three-wavelength nephelometer was implemented at CMN in 2014. Consequently, also the SAE and g have low data coverage at CMN. Moreover, lower data coverage (< 40 %) was registered at PLA and VHL.
The data coverage for the intensive aerosol particle optical properties (SAE and g) is generally lower compared to the data coverage of σsp and σbsp. This is because the intensive optical properties are calculated from hourly σsp and σbsp data higher than 0.8 Mm−1 to avoid noise in the calculations. As a consequence, the data coverage of the intensive properties is lower at stations measuring low σsp and σbsp values (e.g. mountain and remote sites). For example, at JFJ, the SAE and g data coverages are around 54 and 22 % respectively. At TRL, these values are even lower, at 21 and 1 %. However, as reported in Table S3, at the majority of the stations the data coverage of SAE and g is higher than 60 %.
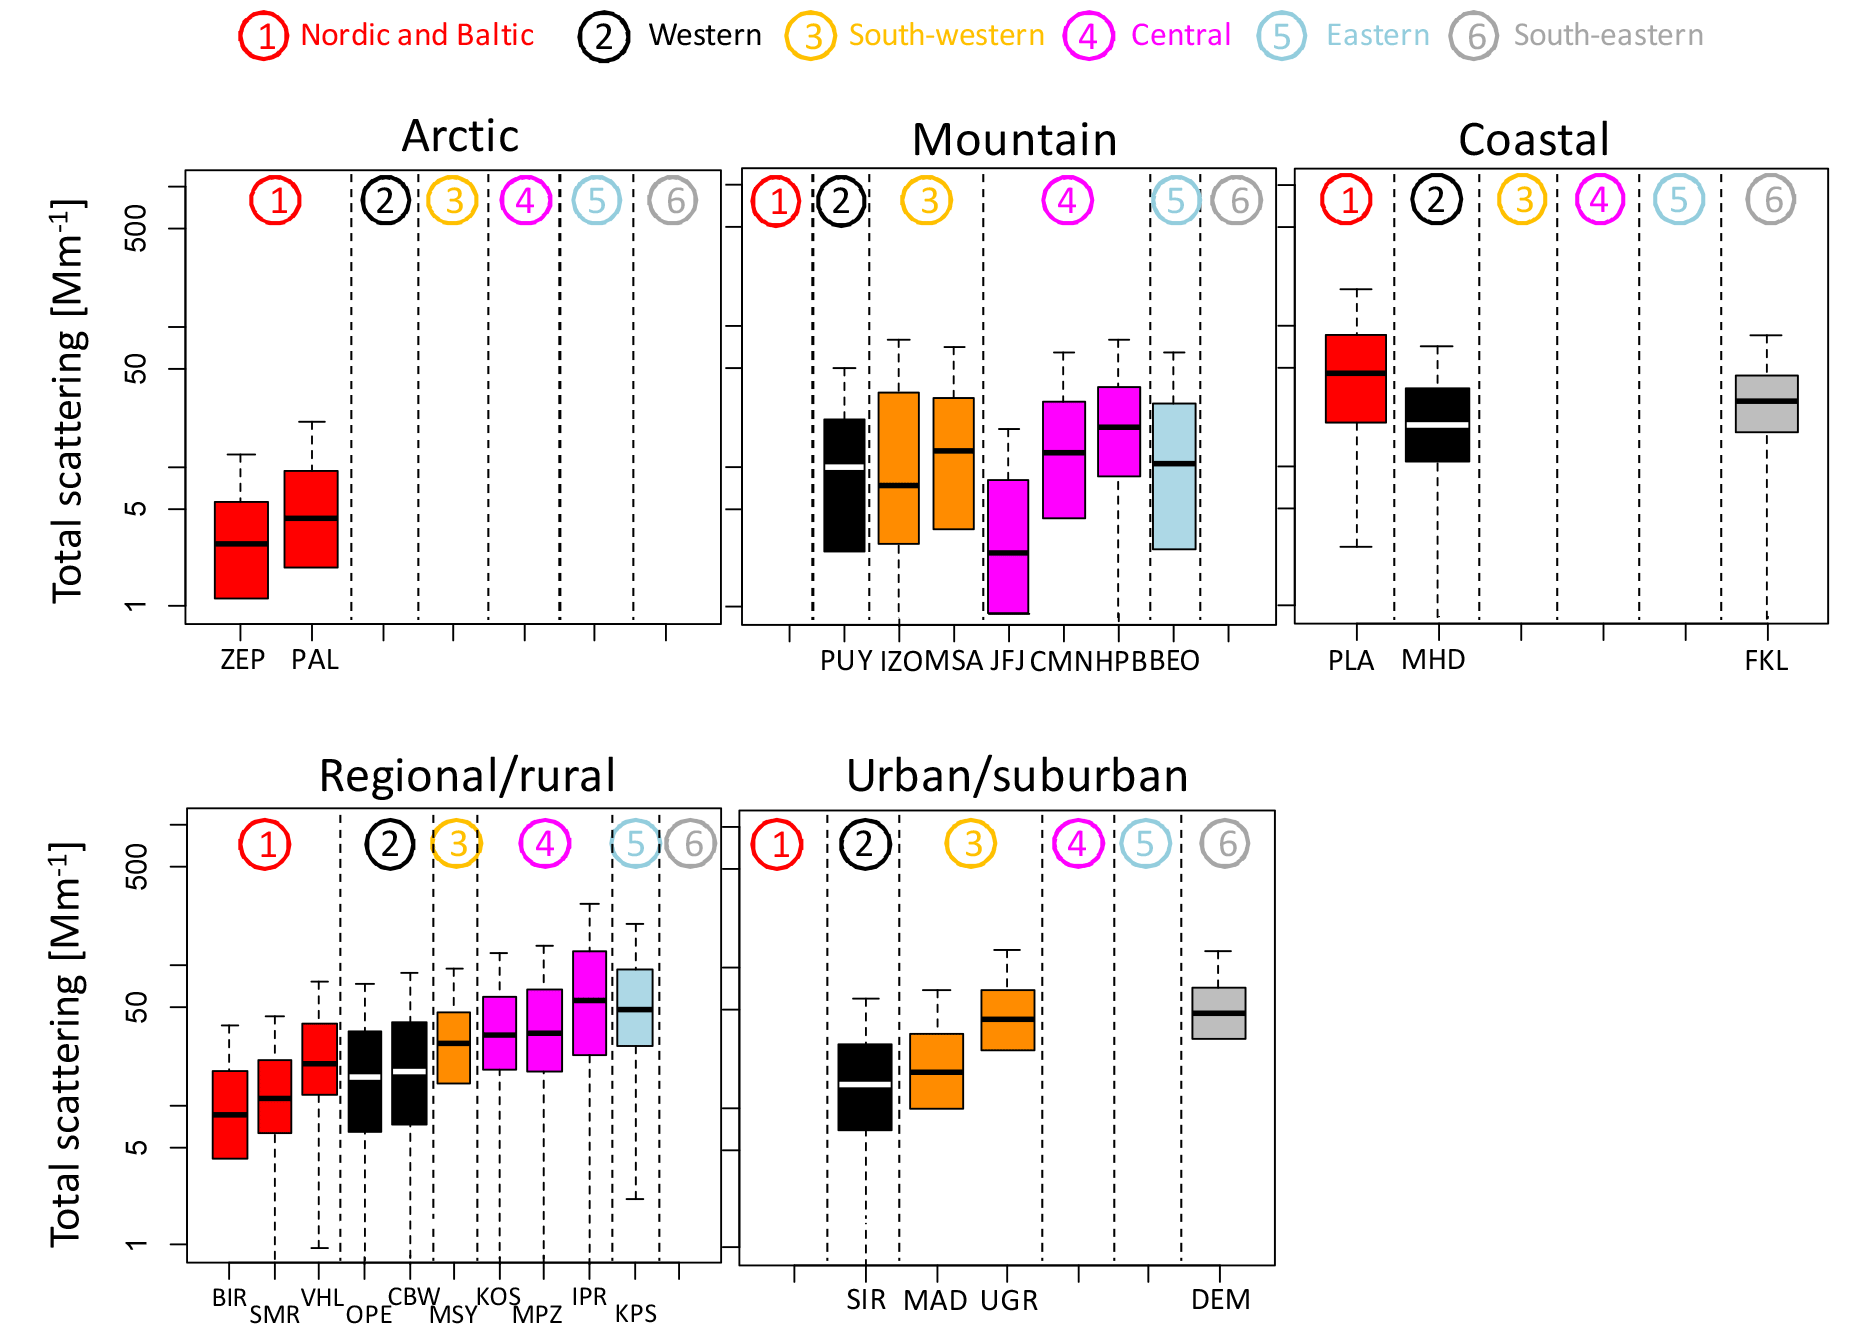
Figure 2Total aerosol scattering coefficients in the green divided by station setting. Different colours highlight different geographical locations. At SIR, aerosol scattering was available only at 450 nm. Medians (horizontal lines in the boxes), percentiles 25 and 75 (lower and upper limits of the boxes) and percentiles 5 and 95 (lower and upper limits of the vertical dashed lines) are reported. Hourly data were used for the statistics.
3.1 Variability of σsp
Figure 2 shows the box-and-whisker plots of σsp measured at the stations included in this investigation. In Fig. 2, the observatories are grouped based on their placement and ordered according to their geographical location. Table S4 and Fig. S2 in the Supplement respectively report the statistics of σsp (mean, SD, minimum and maximum values and 5th, 25th, 50th, 75th and 95th percentiles) and frequency and cumulative frequency distributions.
In each geographical sector, an increasing gradient of σsp is generally observed when moving from mountain to regional and to urban sites. Thus, the σsp values measured at mountain sites are lower than the measurements made at other locations (coastal to urban), even if exceptions are observed in some sectors.
A large range of σsp coefficients is observed across the network, ranging from median values lower than 10 Mm−1 to values higher than 40 Mm−1. Overall, the lowest σsp is on average measured at remote stations because of either (a) their altitude (for example, JFJ is located in central Europe at more than 3500 and CHC in Bolivia is at around 5300 ; see Fig. S3 in the Supplement) or (b) because of their large distance from pollution sources, for example the Arctic ZEP and PAL stations, TRL station (see Fig. S3) and some regional sites in the Nordic and Baltic sector such as BIR and SMR. Higher σsp values (medians > 40 Mm−1) are on average registered at more polluted sites, such as some urban sites in southern Europe (UGR and DEM), some regional sites in eastern and central Europe (KPS and IPR respectively) and one coastal site in the Nordic and Baltic sector (PLA).
The observed variation is consistent with the differences in particulate matter (PM) mass concentrations, PM chemical composition, particle number concentration and absorption coefficients observed across Europe, as described, for example, by Putaud et al. (2010), Asmi et al. (2011) and Zanatta et al. (2016).
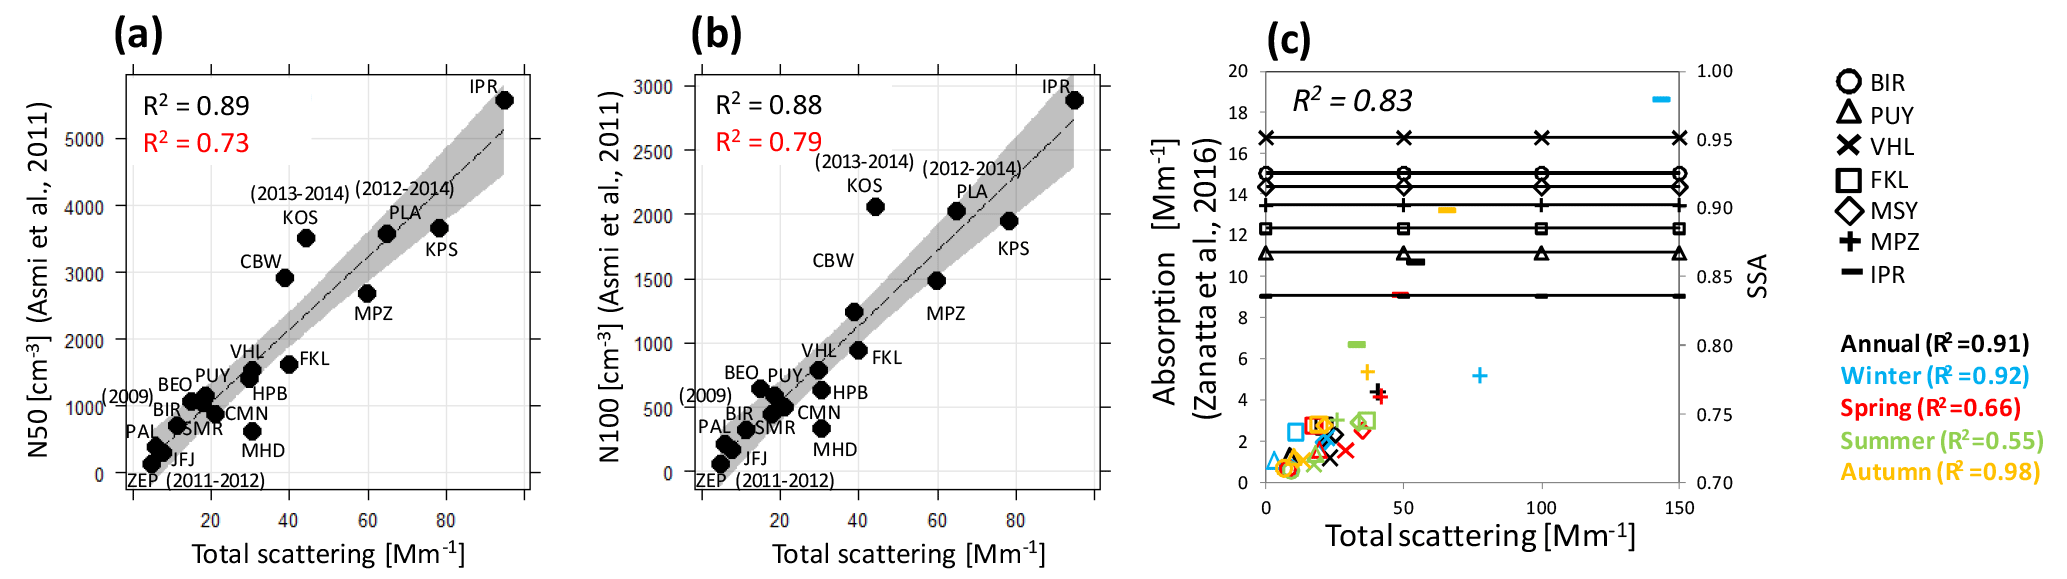
Figure 3Relationship between (a) N50 (mean particle number concentration between 50 and 500 nm), (b) N100 (mean particle number concentration between 100 and 500 nm), (c) absorption coefficient and mean aerosol particle total scattering coefficient. (a, b) Data averaged over the period 2008–2009. For ZEP, BIR, KOS and PLA aerosol particle-scattering measurements were not available during 2008–2009 and different periods were used. R2 values, highlighted in red, were obtained using the median values. (c) Data averaged as in Zanatta et al. (2016). Panel (c) also reports the geometric mean of SSA.
Figure 3a and b show the relationship between the mean particle number concentration measured at different stations from 2008 to 2009 (and reported in Asmi et al., 2011) and the mean σsp measured over the same period (where available). As reported in Fig. 3, positive correlations are observed between N50 (Fig. 3a: mean/median particle number between 50 and 500 nm) and N100 (Fig. 3b: mean/median particle number between 100 and 500 nm) and mean σsp. Figure 3c shows the relationship (for some stations) between absorption coefficients reported in Zanatta et al. (2016) and the total scattering. The positive correlations reported in Fig. 3c (especially high for the winter and autumn periods) suggest an increase in both scattering and absorption coefficients with increasing aerosol loading. Figure 3c also reports the mean single-scattering albedo (SSA). On average lower SSA is observed at IPR, whereas higher SSA is observed at the Nordic and Baltic VHL and BIR observatories.
Finally, at all stations included in this work, the skewness of the σsp distributions (see Table S4) is higher than one and ranges between 1.4 at PLA and 10.6 at TRL (skewness calculated from hourly averaged data). The skewness can be used to evaluate the asymmetry of a distribution. Positive skewness is usually observed for parameters which are defined to be positive and it indicates that the tail on the right side of the distribution is longer or fatter than that on the left side. Thus, for a right-skewed distribution, the mass of the distribution is concentrated on the left, and there is a higher probability of measuring a high value compared to a left-skewed distribution. For example, Querol et al. (2009) used the skewness to assess the importance of Saharan dust outbreaks on PM10 levels measured at different sites across the Mediterranean basin. They found a positive correlation between the calculated skewness and the net dust contribution to the measured PM10 concentration (i.e. the strength of dust pollution episodes; see Fig. 6 in Querol et al., 2009). Figure S2 in the Supporting Material shows the frequency and cumulative frequency distributions for σsp for each station, evidencing the presence of these right-skewed tails.
3.1.1 σsp at Arctic/Antarctic observatories
The Arctic (ZEP and PAL; see Fig. 2) and Antarctic (TRL; see Fig. S3) monitoring stations are located in undisturbed environments with minimal influence from the local settlement because they are located above the inversion layer. The mean σsp values measured at ZEP and TRL are by far the lowest across the network, whereas higher σsp values are measured at PAL. PAL is located in a remote continental area characterized by the absence of large local and regional pollution sources (e.g. Aaltonen et al., 2006). However, Lihavainen et al. (2015a) reported that high values of the absorption coefficient and low values of the single-scattering albedo at PAL are related to continental air masses from lower latitudes. Despite this, the mean σsp at PAL is among the lowest in the ACTRIS network and is comparable to the mean σsp observed at the JFJ and CHC mountaintop observatories (see Table S4).
3.1.2 σsp at mountain observatories
Differences can be observed among stations with similar environments but different geographical locations. For mountain observatories, a clear gradient is not observed when moving from western to south-eastern Europe, because the altitude of the station is an important parameter contributing to the σsp measured at these observatories. Among the mountain stations a higher mean σsp is on average measured at HPB and IZO (see Table S4). The HPB station is likely to be more influenced by the PBL than other mountain stations due to its lower altitude (Nyeki et al., 2012; Collaud Coen et al., 2017), whereas IZO is largely influenced by Saharan dust outbreaks transporting dust toward the station (e.g. Rodriguez et al., 2011), thus increasing σsp. In fact, at IZO, the median value of σsp is among the lowest measured at these mountain sites (around 7 Mm−1; see Table S4), indicating that the sporadic but extremely intense pollution episodes due to Saharan mineral dust outbreaks strongly affect the mean σsp at this station.
Despite their placement at higher altitudes, both CMN and BEO (more than 2 ) register similar σsp values compared to PUY and MSA (around 1.5. ), likely because of the effect of important regional pollution sources (i.e. the Po Valley for CMN) on these central and eastern European observatories under favourable meteorological conditions (i.e. Marenco et al., 2006). Conversely, the region around the MSA observatory is sparsely populated and the station is isolated from large urban and industrial agglomerations (i.e. Pandolfi et al., 2014a; Ripoll et al., 2014; Ealo et al., 2016). The PUY observatory is surrounded by a protected area with fields and forests, and previous works have shown that the influence of the Clermont-Ferrand city on the PUY measurements remains too small to be detected (i.e. Asmi et al., 2011).
The lowest median σsp values at mountain sites are on average measured at JFJ, probably due to the higher altitude of this station compared to other mountain stations included in this work and/or its distance from important pollution sources. Moreover, Collaud Coen et al. (2017) reported a low PBL influence at this site due to the location of the station in a dominant position within the whole mountainous massif. CHC (see Fig. S3) registers higher median σsp values compared to JFJ despite its location at around 5300 , likely due to the influence of the emissions from the city of La Paz (3600 ), located around 30 km from the CHC site, and the local topography, which facilitates the uplift of air masses toward the CHC observatory (Collaud Coen et al., 2017).
3.1.3 σsp at coastal observatories
The PLA coastal station registered σsp values, which are higher compared to both other Nordic and Baltic stations and other coastal sites (e.g. MHD and FKL) and which are among the highest in Europe. Kecorius et al. (2016) have shown that ship emissions in the Baltic Sea contribute strongly to pollution levels at PLA and that up to 50 % of particles arriving at PLA are generated by processes and emissions, including shipping, taking place in areas upwind of the station. Moreover, Asmi et al. (2011) presented a number of similarities in particle number concentrations measured at PLA to those measured at some central European sites, such as IPR, which are due to the influence of multiple source areas (see Fig. 3). It should be noted, however, that the period with available σsp measurements is very short at PLA (see Table 1 and Fig. 7) and the data coverage is also low (see Table S3). Consequently, more measurements at this site are needed in order to confirm the σsp values reported there. The other two coastal stations (MHD and FKL) register median σsp values in the upper range of σsp measured across the network, mostly due to the contribution of marine aerosols in winter and mineral dust in summer at MHD and FKL respectively (see Sect. 3.5).
3.1.4 σsp at regional/rural observatories
Regional sites exhibit a large variability of σsp coefficients across Europe, with the lowest values measured at BIR and SMR (Nordic and Baltic) and the highest at IPR (central Europe) and KPS (eastern Europe). Thus, a gradient is observed in σsp when moving from western to eastern Europe. At both IPR and KPS, the frequent wintertime episodes, linked to stable air due to strong thermal inversions, affect the level of pollution at these sites (e.g. Putaud et al., 2014; Molnár et al., 2016). It is known that the IPR station, despite lying several tens of kilometres away from large pollution sources, is located in an area (the Po Valley) which is one of the most polluted regions in Europe (e.g. van Donkelaar et al., 2010). The VHL observatory registers on average a higher σsp compared to PAL and compared to the BIR and SMR regional sites, likely because VHL is located closer to the European continent and it is consequently more affected by polluted continental air masses. Moreover, the emissions from the densely populated areas of Helsingborg, Malmö and the city of Copenhagen, located 25 km to the west, 50 km to the south and 45 km to the south-east respectively, could also explain the relatively high σsp measured at VHL (Kecorius et al., 2016). The σsp values at a regional level in western Europe (OPE and CBW) are on average higher compared to those measured in the Nordic and Baltic regions and lower compared to those measured at a regional level in southern Europe (MSY). The relatively higher σsp values measured at MSY are due to both the contaminated air transported by the sea breeze from the close metropolitan area of Barcelona to the mountains and the frequent Saharan dust outbreaks (i.e. Pandolfi et al., 2011, 2014b).
3.1.5 σsp at urban/suburban observatories
Among the urban background sites, lower σsp values are measured at MAD and SIR compared to DEM and UGR. The low σsp at MAD during the period presented here (only 2014 data are available for MAD) could be related to the reduced formation of secondary nitrate aerosols due to the limited availability of ammonia in this urban environment (Revuelta et al., 2014). However, it should be noted that winter episodes with high secondary nitrate concentrations are not uncommon in Madrid and we are presenting here only 1 year of measurements for this station. On the other hand, secondary inorganic aerosol concentrations recorded at the SIR suburban observatory can be considered representative of a large geographical zone, given the rather flat orography of the Parisian basin. At UGR, the accumulation, mainly in winter, of fine particles from traffic, domestic heating and the burning of biomass, explains the relatively higher σsp (e.g. Lyamani et al., 2012; Titos et al., 2017). Traffic emissions, the high level of formation of secondary sulfate and organic aerosols in the summer and the transport of dust from Africa are the main contributory factors to the high σsp at DEM, where high PM2.5 and PM10 values are usually measured and compared to other important Mediterranean cities (e.g. Diapouli et al., 2017; Eleftheriadis et al., 2014; Karanasiou et al., 2014; Querol et al., 2009).
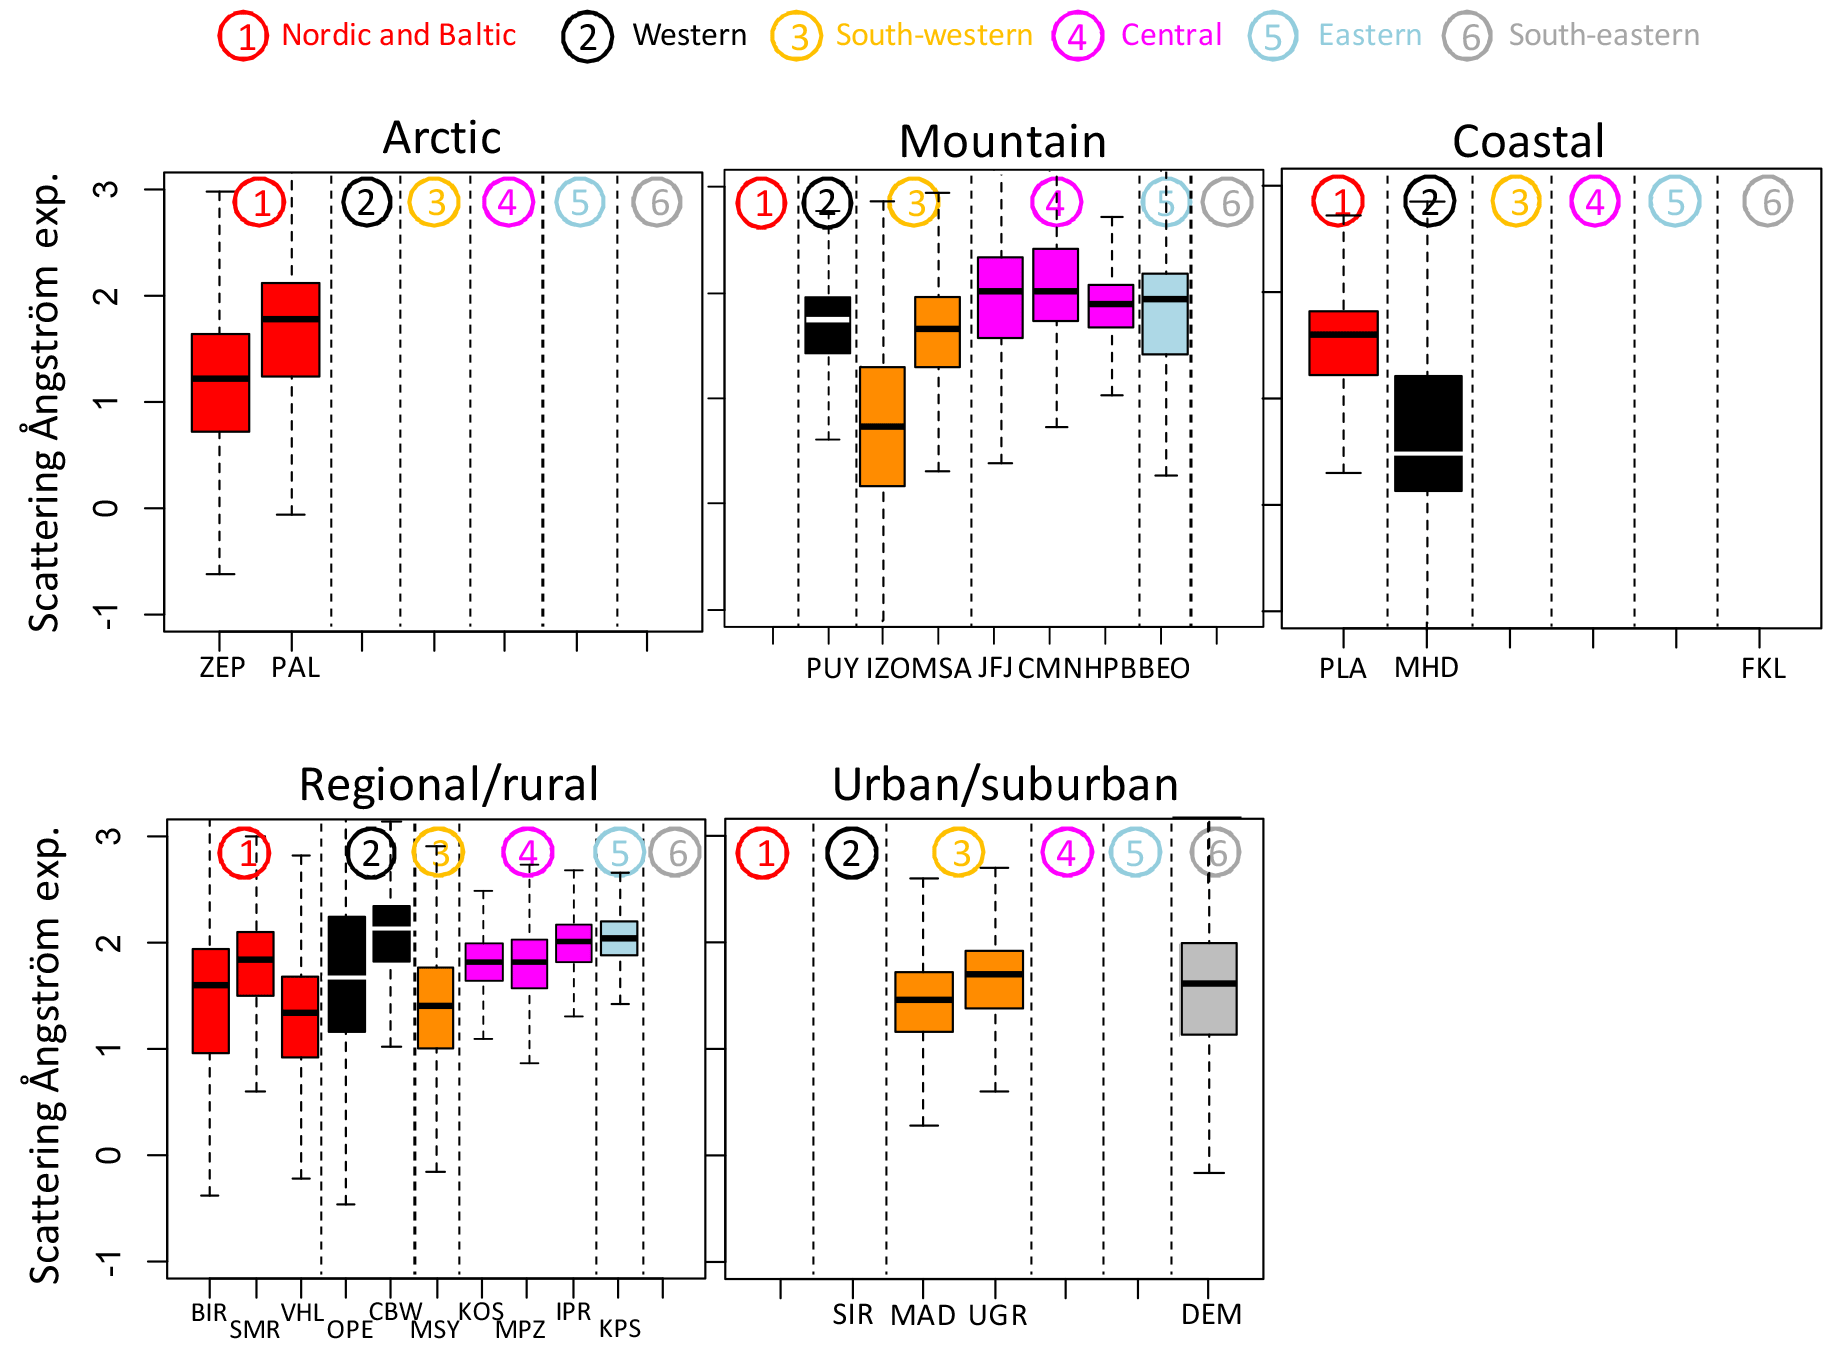
Figure 4Scattering Ångström exponent divided by station setting. Different colours highlight different geographical locations. Medians (horizontal lines in the boxes), percentiles 25 and 75 (lower and upper limits of the boxes) and percentiles 5 and 95 (lower and upper limits of the vertical dashed lines) are reported. Hourly data were used for the statistics.
3.2 Variability of SAE
Figure 4 shows the box-and-whisker plots of the SAE calculated at the different stations. Table S5 and Fig. S4 in the Supplement report the statistics of the SAE and frequency and cumulative frequency distributions respectively.
3.2.1 Variability of SAE by geographical sector
The SAE shows a large variability across the geographical sectors considered in this study (Fig. 4). On average, independently of the station setting, the highest SAE is observed at the central and eastern European observatories (see Table S5) with station-averaged values of 1.88 ± 0.49 and 1.88 ± 0.53. The high SAE values in central and eastern Europe clearly indicate the predominance of fine particles. In fact, high PM2.5 ∕ PM10 ratios, indicative of the presence of small particles, are typical for rural lowland sites in central Europe (e.g. Spindler et al., 2010; EMEP, 2008). Figure S4 shows that the frequency plots of SAE data have very similar unimodal delta-like distributions and the variability of the SAE within the 5th to the 95th percentile range is much lower than that of the other European regions, suggesting a greater homogeneity in some microphysical properties of atmospheric particles such as size. Exceptions are the CMN, JFJ and BEO mountain sites, where left-tailed SAE distributions are observed, likely due to the reduced effect of fine particles from the PBL in winter and an increase in the relative importance of coarse mineral dust, sea-salt particles and aged aerosols compared to lower-altitude stations in the same geographical sector.
On average, the SAE is lower for all other geographical sectors. Station-averaged mean SAE of around 1.60 ± 0.61, 1.25 ± 0.86 and 1.36 ± 0.67 are observed in the Nordic and Baltic, western and south-western sectors respectively. Exceptions are, however, observed, for example, at CBW (western Europe) the median SAE reaches values of around 2.1. Indeed, both polluted air masses from the industrialized zones of the Benelux countries and clean air masses from the sea contribute to the presence of aerosol particles at this site (Crumeyrolle et al., 2010). Moreover, CBW is surrounded by several large cities at distances of approximately 20–40 km from the station, which may have contributed to the high SAE values measured in this geographical location. Asmi et al. (2011) have also shown that background particle number concentrations at CBW are much higher than, for example, at BIR.
Median SAE values close to one or lower, indicative of the fact that the σsp is dominated by large particles, are observed at remote sites in western Europe (MHD), south-western Europe (IZO) and the Nordic and Baltic (ZEP) and Antarctic (TRL) regions. A low SAE at MHD has already been reported by Vaishya et al. (2011, 2012) and justified by the frequent presence, mainly in winter, of coarse-mode sea-salt particles, since mineral dust particles can be ruled out. In fact, air masses originating from dust sources are infrequent at these sites. Similarly, the low SAE observed at ZEP and TRL can be associated with the presence of coarse sea-salt particles (e.g. Zieger et al., 2010 for ZEP). Conversely, the SAE obtained at IZO is mainly due to the frequent presence of mineral dust particles from African deserts (e.g. Rodríguez et al., 2011). Very similar bimodal frequency distributions are observed at MHD and IZO, showing a pronounced left peak indicative of the high probability of encountering coarse particles at these sites. BIR and PLA also show an enhanced left peak in the SAE frequency distributions, likely due to the presence of coarse marine aerosols at these sites.
3.2.2 Variability of SAE by station type
Unlike σsp, the SAE does not show any clear gradient when moving from mountainous to regional/urban sites in each geographical sector. For example, at mountain sites the median SAE ranges between around 0.7 at IZO (south-western Europe) and values higher than two at JFJ and CMN (central Europe). As reported by Zieger et al. (2012) a SAE value of around 2 usually prevails at JFJ and can be regarded as the typical background under non-dusty conditions. Thus, the SAE values at JFJ and CMN can be considered representative of central Europe's free troposphere, especially in winter when the PBL emissions at these sites are reduced. This high variability of SAE at mountain sites was also reported by Andrews et al. (2011), with values from 11 mountaintop stations worldwide, ranging from less than one to more than two. Moreover, Bourcier et al. (2012) have shown that coarse particles are transported more efficiently at high altitude by the higher wind speed, thus probably also contributing to the observed variability of SAE at mountain sites.
Also, at coastal sites (PLA and MHD), the SAE shows large variability, with higher SAE measured at PLA compared to MHD, confirming a higher effect of anthropogenic emissions at PLA compared to MHD.
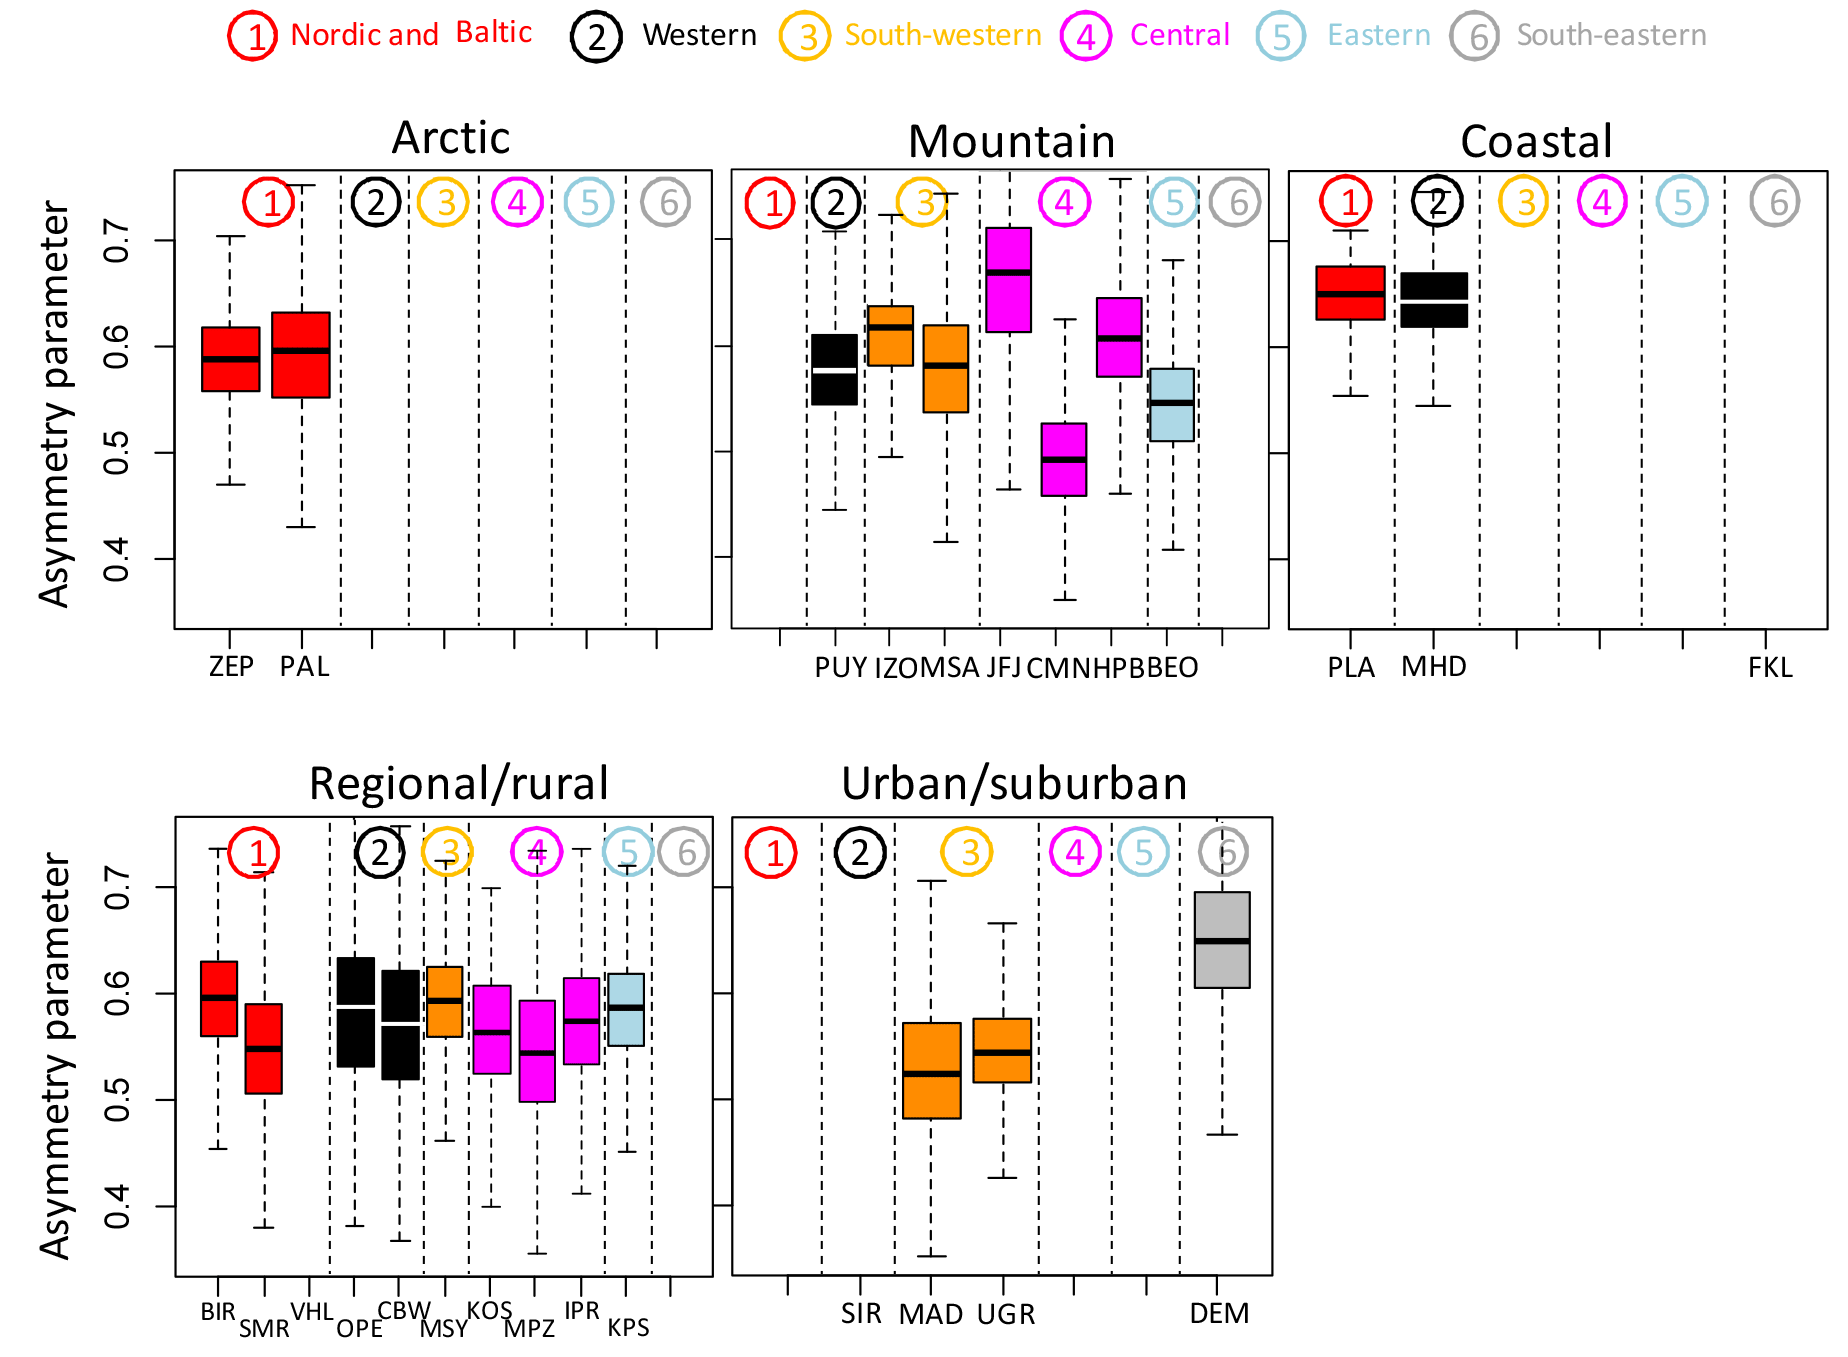
Figure 5Asymmetry parameter in the green divided by station setting. Different colours highlight different geographical locations. Medians (horizontal lines in the boxes), percentiles 25 and 75 (lower and upper limits of the boxes) and percentiles 5 and 95 (lower and upper limits of the vertical dashed lines) are reported. Hourly data were used for the statistics.
An increasing gradient of SAE is observed when moving from regional/rural observatories in the north-west of Europe to regional/rural observatories in the east of Europe. Among these stations, the lowest SAE is observed at VHL (Nordic and Baltic) and MSY (south-western Europe), whereas, as already observed, central and eastern regional areas are characterized by high SAE values. This gradient is also driven by the importance of sea-salt or dust particle contributions affecting the north-western and south-western European countries more than countries in central and eastern Europe.
Among the urban sites, MAD registers the lowest median SAE (1.47) compared to UGR (1.69) and DEM (1.60). The lower SAE at MAD could be explained, as already noted, by the reduced formation of secondary inorganic aerosols during the available measurement period. Moreover, resuspended dust from vehicles could also explain the lower SAE observed at the MAD observatory.
3.3 Variability of g
The asymmetry parameter is widely used in radiative transfer models because it provides information regarding how much radiation is scattered back compared to the amount of radiation scattered in the forward direction. Figure 5 shows the box-and-whisker plots of g calculated at the different stations. Table S6 and Fig. S5 in the Supplement report the statistics of g and the frequency and cumulative frequency distributions respectively. Given that g is calculated from BF using Eq. (2) (Sect. 2.2.7), in Fig. S6 we report in the Supplement the box-and-whisker plots of BF, whereas Table S7 in the Supplement reports the statistics of BF. Figure 5 and Fig. S6 in the Supplement are symmetrical, with a lower BF corresponding to a higher g.
3.3.1 Variability of g by geographical sector
Unlike the SAE, the g parameter does not show any clear gradient when moving from the west to the east of Europe. Slightly higher g values are observed in western Europe (station-averaged mean g of 0.61 ± 0.08) compared to central and eastern Europe (mean g = 0.59 ± 0.07 and 0.57 ± 0.06 respectively). These differences in the g values, even if small, are consistent with the opposite gradient observed for SAE, the latter being smaller in western Europe. However, the station-averaged g in central and eastern Europe is similar to the mean g observed in the Nordic and Baltic regions (mean g = 0.58 ± 0.08) and in south-western Europe (mean g = 0.57 ± 0.06). Thus, contrary to the SAE, a clear relationship between aerosol size and g is not observed. The possible reasons for this are reported below.
3.3.2 Variability of g by station type
At some mountain sites higher median g values are observed relative to the g values obtained at regional or urban locations. This is the case, for example, for IZO compared to MSY, UGR and MAD in the south-western European sector and for HPB and JFJ compared to IPR, MPZ and KOS in central Europe. However, exceptions are observed. For example, at CMN, where the median g value (only 2 years of data are available) is the lowest in the central European sector and among the lowest observed in this study. On average, g values range between 0.49 and 0.64 at mountain sites, with a mean value of 0.58 ± 0.05. This value is consistent with the mean value of 0.61 ± 0.05 reported by Andrews et al. (2011) at the mountain sites included in their work.
Figure S7 in the Supplement reports the mean SAE (ordered from low to high values for each station setting) and g at each station used in this work together with the SAE–g scatter plot. Figure S7 shows that no clear relationship between g and SAE is observed. For example, the TRL and MHD observatories register among the highest g values observed in the network, which is consistent with the very low SAE measured at these stations because of the frequent presence of coarse-mode sea-salt particles (see Fig. 4). However, high g values, similar to TRL and MHD, are also observed at stations such as PLA, BIR, JFJ and DEM, which are dominated on average by fine aerosol particles (with SAE values similar to or higher than 1.5). Similarly, similar g values are observed at IZA and PUY or HPB despite the differences in SAE values at these observatories.
Differences in the shape of the particle number size distribution, particle shape and chemical composition (e.g. refractive index, RI) are likely factors contributing to the poor relationship observed between g and SAE. The Mie theory of polydisperse spherical particles predicts that the BF is lower and g is correspondingly higher for coarse-mode aerosol particles (for which the SAE will be low) compared to fine-mode particles. However, some studies deploying integrating nephelometers have found that the BF can be higher for coarse-mode aerosol particles (such as mineral dust) than for fine-mode aerosol particles (Carrico et al., 2003; Doherty et al., 2005). Doherty et al. (2005) suggested that an under-correction for the σsp truncation of the forward-scattered radiation (which is relatively larger for coarse particles) could bias the calculated BF toward high values. Moreover, the shape of the particle number size distribution is another factor affecting the BF and SAE. Thus, differences in the relative fractions of the fine and coarse modes could also drive the BF–SAE relationship. In fact, the SAE is most sensitive to the presence of coarse-mode aerosol particles compared to the BF, which is most sensitive to small accumulation-mode particles (Delene and Ogren, 2002; Collaud Coen et al., 2007). Thus, depending on the shape of the particle number size distribution, the BF and SAE values might or might not correlate.
The refractive index (RI), which is strongly related to the chemical composition of the particles, is another important variable that can affect g (e.g. Marshall et al., 1995). In the work of Hansen and Travis (1974; Fig. 12) the authors showed that, for a given particle diameter, the g parameter non-linearly decreased with increasing real RI. Thus, coarse-mode particles with a given RI could have an asymmetry parameter similar to or lower than that of fine particles with lower RI. Recently, Obiso et al. (2017) confirmed the findings of Hansen and Travis (1974), also showing that for fine particles a perturbation in the RI of 20 % has a larger effect on g than a similar relative perturbation of particle shape. Obiso et al. (2017) also showed that a variation in the RI for coarse particles can have a small effect on the mass scattering efficiency of a particle and its spectral dependence, and consequently also on SAE.

Figure 6Seasonal cycles of σsp (Mm−1) measured in the green nephelometer wavelength.
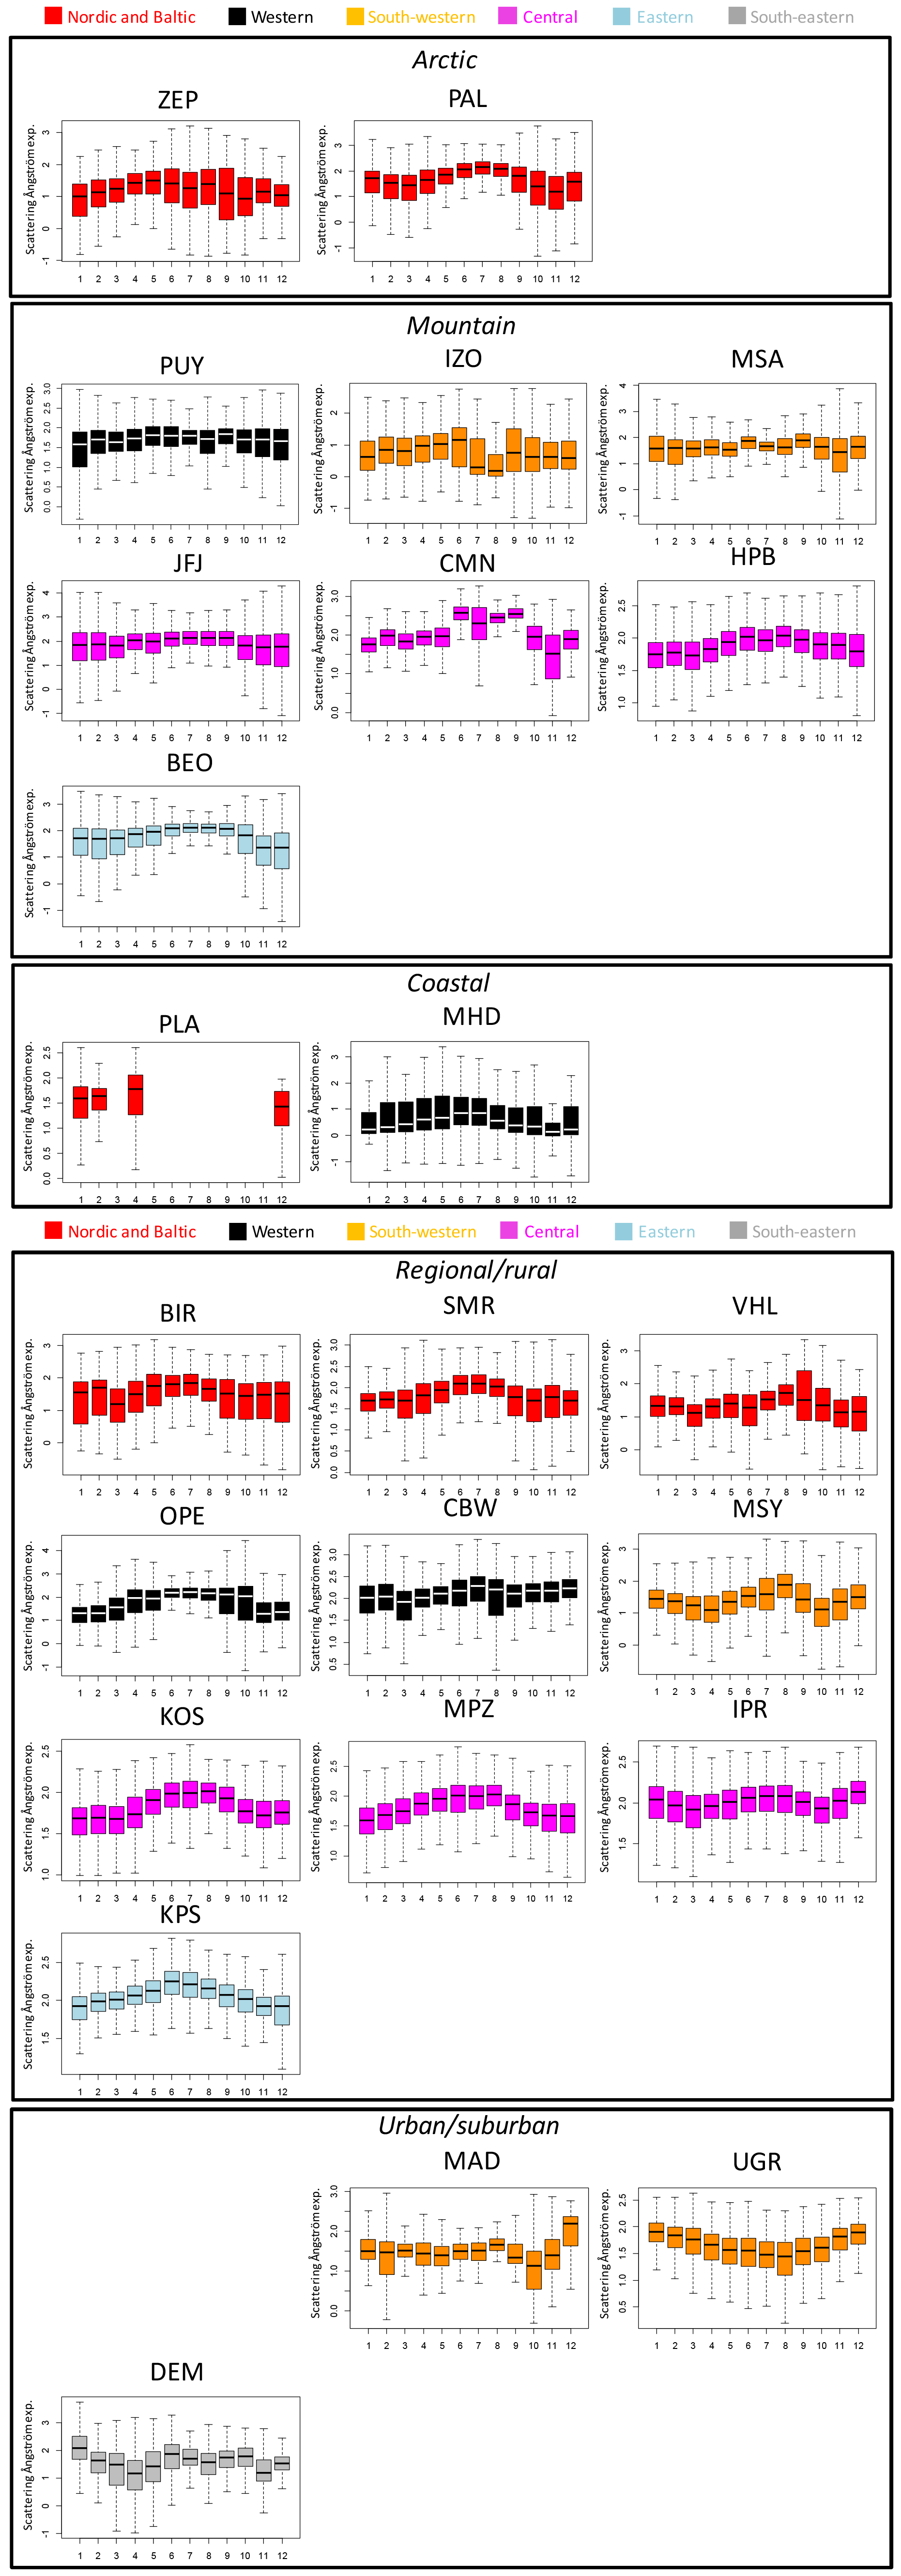
Figure 7Seasonal cycles of SAE (calculated using the three nephelometer wavelengths).
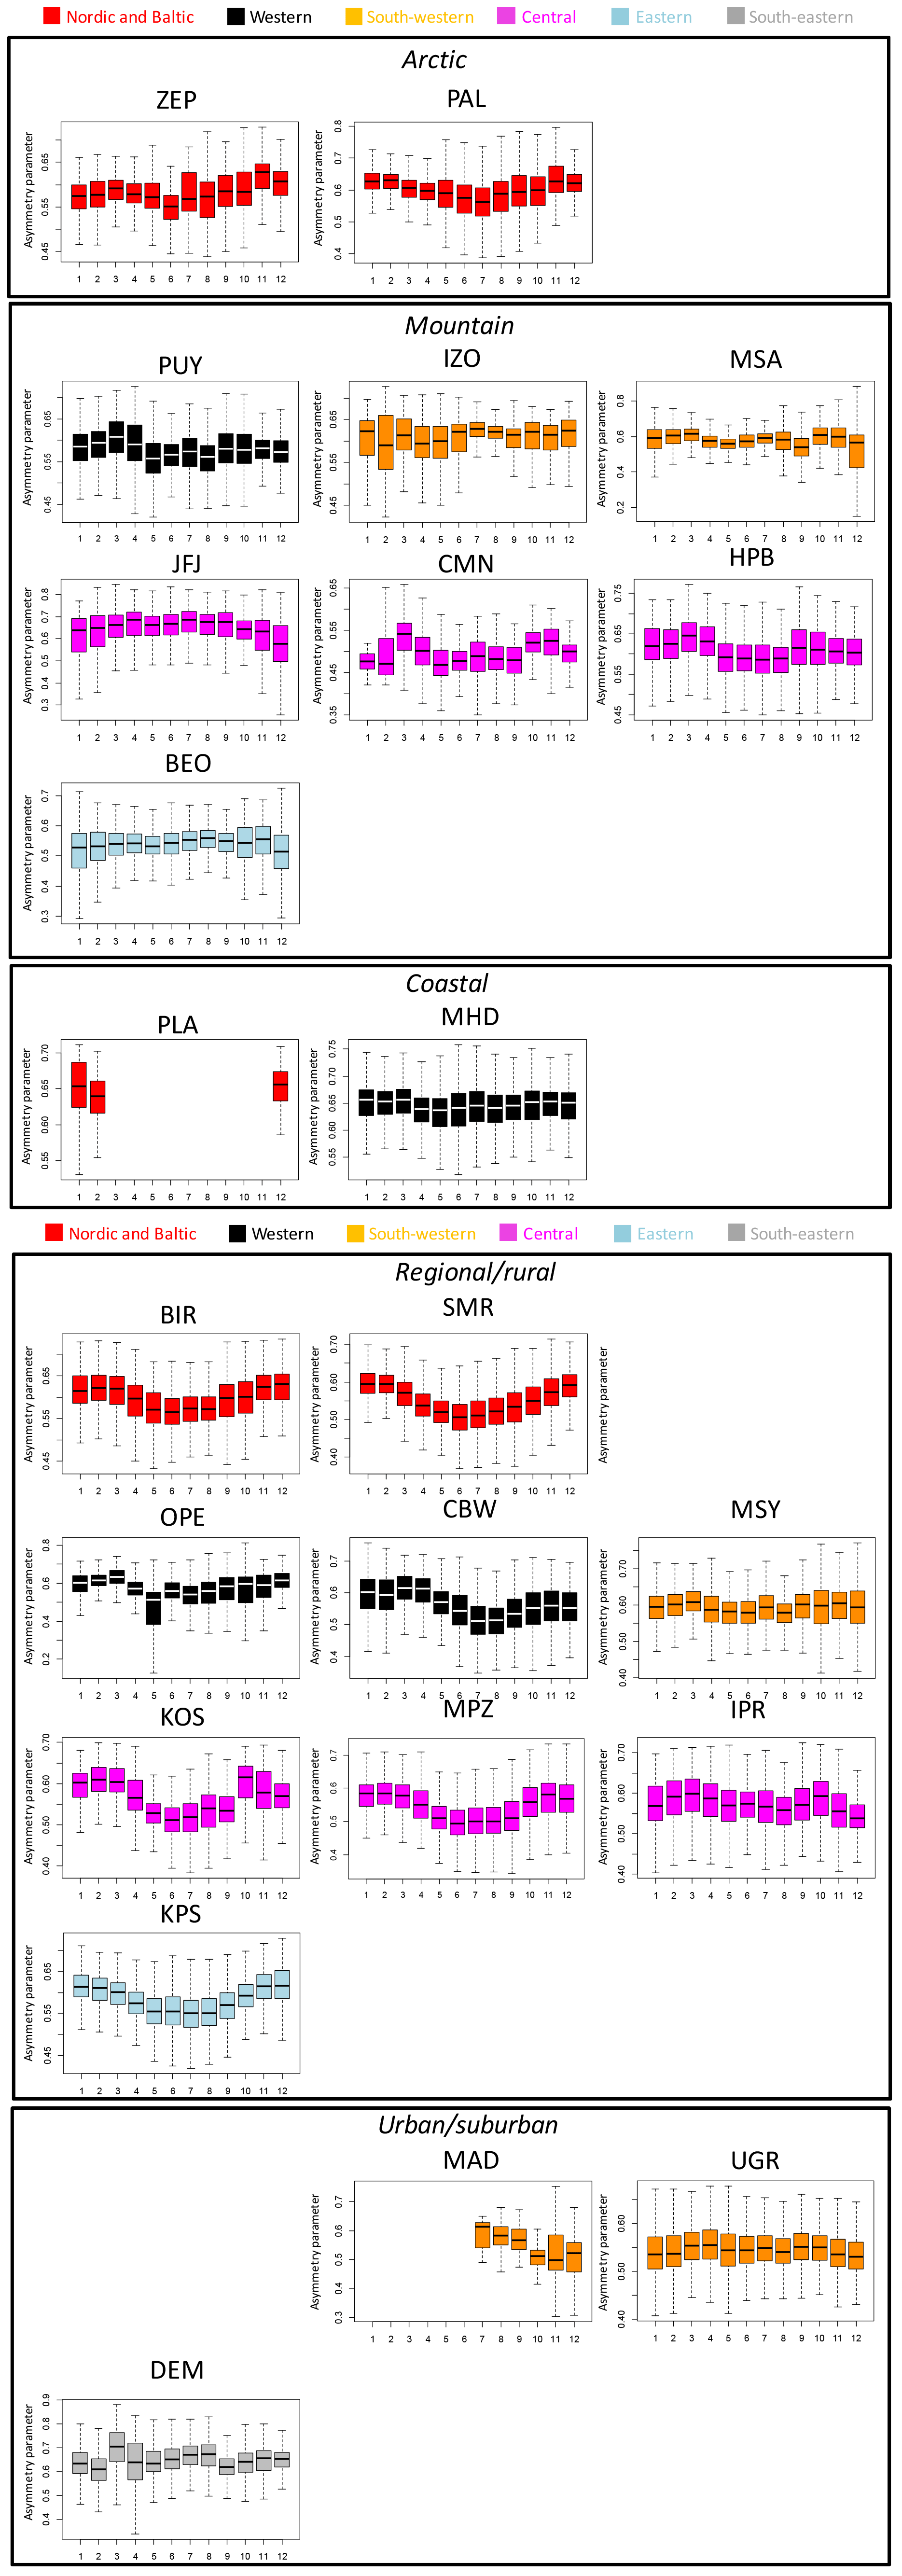
Figure 8Seasonal cycles of g (calculated for the green wavelength).
3.4 Seasonal variability
Figures 6–8 present the annual cycles of σsp, SAE and g, at each site. The annual cycles for the non-European CHC and TRL stations are reported in Fig. S8 in the Supplement. Overall, strong seasonal cycles of σsp and intensive aerosol particle optical parameters are observed at the majority of the stations, although exceptions are observed. The analysis of the annual cycles is presented below separately for different station settings.
3.4.1 Seasonal variability at Arctic observatories
ZEP and PAL observatories present quite different annual cycles of σsp. At ZEP, the highest σsp is observed in late winter and in spring, whereas the lowest σsp is observed in the summer. The σsp values increase in late winter and spring due to the Arctic Haze phenomenon, i.e. layers with enhanced concentrations of aerosols and precursor gases in the Arctic troposphere caused by anthropogenic sources and long-range transport (i.e. Engvall et al., 2008; Ström et al., 2003). Ström et al. (2003) have shown that, during winter and spring, the aerosol particle accumulation-mode dominates. Conversely, in summer, this mode is significantly smaller and Aitken-mode-sized aerosols dominate the size distribution. The change in the aerosol size distribution between winter–spring and summer is likely the cause of the observed variations of σsp and g at ZEP, the latter being slightly larger in late winter and spring compared to the summer. At PAL observatory, on average a higher σsp is observed in spring–summer compared to autumn–winter. As reported by Lihavainen et al. (2015a), low values of σsp in autumn and early winter can be related to frequent precipitation events, whereas the high values of σsp in summer are probably related to biogenic organic aerosols from natural sources. At PAL, the monthly variation of SAE and g is rather pronounced: SAE (g) increases (decreases) in summer compared to winter, indicating the predominance of relatively smaller particles during the warmest months. Lihavainen et al. (2015a) observed that the seasonal variations in intensive aerosol optical properties at PAL are related to both the transport of different air masses at this remote site depending on the season and the enhanced formation of BSOA (biogenic secondary organic aerosols) in the summer. Lihavainen et al. (2015a) also reported a lower single-scattering albedo in winter compared to summer at PAL due to a significant contribution from light-absorbing carbon, mostly from residential wood combustion. Thus, they have shown that aerosol particles observed in the summer at PAL have the potential to cool the atmosphere more efficiently than those observed during winter.
3.4.2 Seasonal variability at mountain observatories
At the mountain stations (PUY, HPB, JFJ, CMN, BEO, MSA and IZO), the σsp peaks in spring–summer, whereas lower σsp values are measured in autumn–winter. Similar findings were, for example, already reported by Nyeki et al. (1998) for JFJ and summarized by Andrews et al. (2011) for many mountaintop stations worldwide and by Pandolfi et al. (2014a) for the MSA station. Different factors contribute to the σsp increase in spring–summer at the mountaintop observatories, such as the increase in the boundary layer height and the stronger upslope winds during the warmest months. Moreover, specific events, such as Saharan mineral dust outbreaks, may contribute to the increased σsp observed at mountain stations in spring–summer, especially in southern Europe (e.g. Pey et al., 2013; Pandolfi et al., 2014a; Rodríguez et al., 2011). At IZO, σsp peaks strongly in July–August because of the very high influence of African mineral dust at this station during these months (e.g. Alastuey et al., 2005; Diaz et al., 2006; Rodríguez et al., 2015). At the mountaintop CHC observatory (see Fig. S8), σsp progressively increases during the dry season, from May to October, reaching lower values during the rainy season (from December to April). Moreover, during the dry season, the new particle formation events, taking place at CHC with one of the highest frequencies reported in the literature so far (Rose et al., 2015), can introduce very small particles that grow to nucleation and the Aitken mode.
At the mountain stations, both SAE and σsp are on average higher in summer compared to the winter period, thus suggesting a higher anthropogenic influence at these sites during the warmest months. The summer SAE increase is more evident at some mountain stations, e.g. HPB, CMN and BEO, compared to other mountain stations such as JFJ and MSA. The less pronounced SAE seasonal variation at JFJ was related to the rather constant composition of the JFJ aerosol by Bukowiecki et al. (2016). At MSA in south-western Europe, the observed less pronounced seasonal cycle of SAE could be due to the contribution of Saharan dust in spring–summer, which contrasts with the PBL transport of fine particles observed at other mountain sites during the warm season. At IZO, the SAE reaches its lowest values during July–August in conjunction with the peak frequency of dust events (Rodríguez et al., 2015).
Overall, the g parameter shows the opposite seasonal cycle to the SAE at almost all mountain stations, with the exception of JFJ and BEO, where g slightly increases with SAE in the summer. At almost all mountain stations, the seasonal variations of SAE and g are less pronounced compared to the seasonal variation of σsp, indicating a larger seasonal variation in the extensive aerosol optical properties than in the intensive properties. At CHC, the SAE decreases as the σsp increases when moving from the wet to the dry season, indicating an increasing effect of coarse particles on the σsp during the dry season. At PUY, σsp peaks from March to September and this increase is accompanied by a small increase in SAE. Venzac et al. (2009) and Boulon et al. (2011) have shown that PUY is more often influenced by the free troposphere or residual layers in winter and spring compared to the summer season.
3.4.3 Seasonal variability at coastal observatories
A very different seasonal variation of σsp is observed at the two coastal observatories, MHD and FKL (at PLA, the lack of spring–summer measurements prevents the analysis of the annual cycles). The σsp at MHD (western Europe) peaks in winter, whereas a higher σsp is observed in summer at FKL (south-eastern Europe). At FKL, where no intensive optical aerosol properties are available, the higher σsp in summer can be associated with mineral dust storm events, such as those reported by Vrekoussis et al. (2005). However, mineral dust storms in the Mediterranean are not the only reason for the observed increased σsp in the summer at FKL. In fact, as reported by Kalivitis et al. (2011), concentrations of ammonium sulfate and particulate organic matter, which increase in summer in the Mediterranean Basin, can also be assumed to be important contributors to σsp during the warm season. At MHD, the higher σsp in winter is related to the higher contribution of wind-speed-generated sea-salt particles in the marine boundary layer during wintertime (Vaishya et al., 2011). At MHD, the SAE (g) is higher (lower) in summer compared to winter. O'Connor et al. (2008) and Vaishya et al. (2011, 2012) showed that the background marine aerosol level measured at MHD contains a strong and significant seasonal cycle with sea salt dominating in winter and biogenic organic aerosols dominating at the submicron scale in summer. This is consistent with the observed seasonal cycles of SAE and g reported here for MHD.
3.4.4 Seasonal variability at regional/rural observatories
Regional observatories in central and eastern Europe show marked seasonal cycles of both extensive and intensive aerosol particle optical properties. In these regions, less horizontal and vertical pollutant dispersion in winter, due to a higher frequency of stagnant conditions and temperature inversions, play an important role in the accumulation of aerosols. As a consequence, the σsp is much higher in winter compared to summer. SAE and g also show marked seasonal cycles in these regions, with the SAE (g) being higher (lower) in summer compared to winter. Ma et al. (2014) have shown that, at MPZ, an increased SAE in summer is mainly explained by the variation in the particle number size distribution. Thus, high concentrations in spring and summer of small particles during new particle formation and subsequent growth periods cause the observed increase in SAE (and correspondingly a decrease in g) during the warmest months.
At regional sites in the Nordic and Baltic regions, the monthly variation of σsp is on average less pronounced compared to the central or eastern European stations, especially at BIR and SMR (Virkkula et al., 2011). This is likely due to the placement of these stations in remote areas with a different meteorology (e.g. less pronounced PBL variations), where on average much lower σsp values are measured compared to other European sites. Moreover, this could also indicate the importance of anthropogenic sources such as domestic heating in central and eastern Europe in winter. However, both SAE and g show marked seasonal cycles at these Nordic and Baltic observatories, similar to those reported for central and eastern European observatories with higher (lower) SAE (g) in summer compared to winter.
Differences are observed in the annual cycle of σsp at a regional level in south-western Europe (represented by the MSY observatory), where higher σsp values are registered in summer. At the MSY regional site (located at around 720 ), the higher efficiency of the sea breeze in transporting pollutants from the urbanized/industrialized coastline toward regional elevated inland areas during the warmer season mainly explains the summer increase in aerosol particle mass concentration and scattering coefficient observed at this site (e.g. Pandolfi et al., 2011). Moreover, the enhanced formation of secondary sulfate and organic matter in the summer, together with frequent Saharan mineral dust outbreaks, strongly contribute to the observed seasonal cycle for σsp and the intensive properties at the MSY site. The σsp peak observed at MSY in March is due to the winter pollution episodes typical of the western Mediterranean Basin (WMB) (e.g. Pandolfi et al., 2014b and references therein). During these episodes, the accumulation of pollutants close to the emission sources is favoured by anticyclonic conditions coupled with strong atmospheric inversions. During such conditions, pollutants accumulate in the PBL and can subsequently reach the MSY station when the PBL height increases.
3.4.5 Seasonal variability at urban/suburban observatories
Among the urban sites, marked variations of σsp and the intensive properties are observed at UGR and DEM. At the urban UGR site, the mean aerosol type is very different in winter compared to summer. As evidenced by the seasonal cycles of SAE and g, aerosol particles are generally finer during the winter at UGR compared to the summer season, as already observed, for example, by Lyamani et al. (2010, 2012) and Titos et al. (2012). This is likely due to the accumulation of fine particles, mainly from traffic, domestic heating and biomass burning, favoured by stagnant conditions and atmospheric inversions during winter. In summer, the higher frequency of Saharan mineral dust outbreaks at this site increases the mean size of the particles during the warmest months. At the DEM urban observatories, the high σsp values measured in spring are linked to Saharan dust outbreaks, as also supported by the seasonal cycles of SAE and g, which show the lowest and highest values in spring.
3.5 SAE and g vs. σsp relationships
Figure 9 shows the relationships between σsp and SAE and between σsp and g at each station. Mean SAE and g are calculated for each σsp bin and the bin size at each station is calculated following the Freedman–Diaconis rule:
where IQR(x) is the interquartile range of the data and n is the number of observations in the sample x. These graphs help in understanding which aerosol type on average dominates the particle light scattering, depending on the degree of scattering measured. It should be noted that, in Fig. 9, the number of samples available at each station are not evenly distributed among the considered bins. Figure S9 in the Supplement shows, for some stations, the SAE–σsp pairs coloured by the number of samples in each bin to highlight how the samples are distributed among the bins.
3.5.1 g–σsp relationships
The asymmetry parameter g shows the lowest values for very low σsp, suggesting the predominance of small fine-mode particles. Andrews et al. (2011) reported similar g–σsp relationships at different mountain sites and suggested that the removal of large particles by cloud scavenging or by deposition during transport could explain the observed low g values in a clean atmosphere. They also suggested that the formation of new particles followed by condensation/coagulation could generate small but optically active particles. Here, we show that this behaviour was observed from BF or g as a function of σsp at all sites, not only at mountain sites.
The parameter g then increases with increasing σsp, indicating a shift in the particle number size distribution toward the larger end of the accumulation mode. Delene and Ogren (2002), Andrews et al. (2011), Pandolfi et al. (2014a) and Sherman et al. (2015) showed that the BF tends to decrease with increasing aerosol loading, consistent with the observed increase in g. For comparison with previous works, Fig. S10 in the Supplement shows the BF–σsp relationships for all observatories, evidencing the aforementioned BF decrease with increasing σsp.
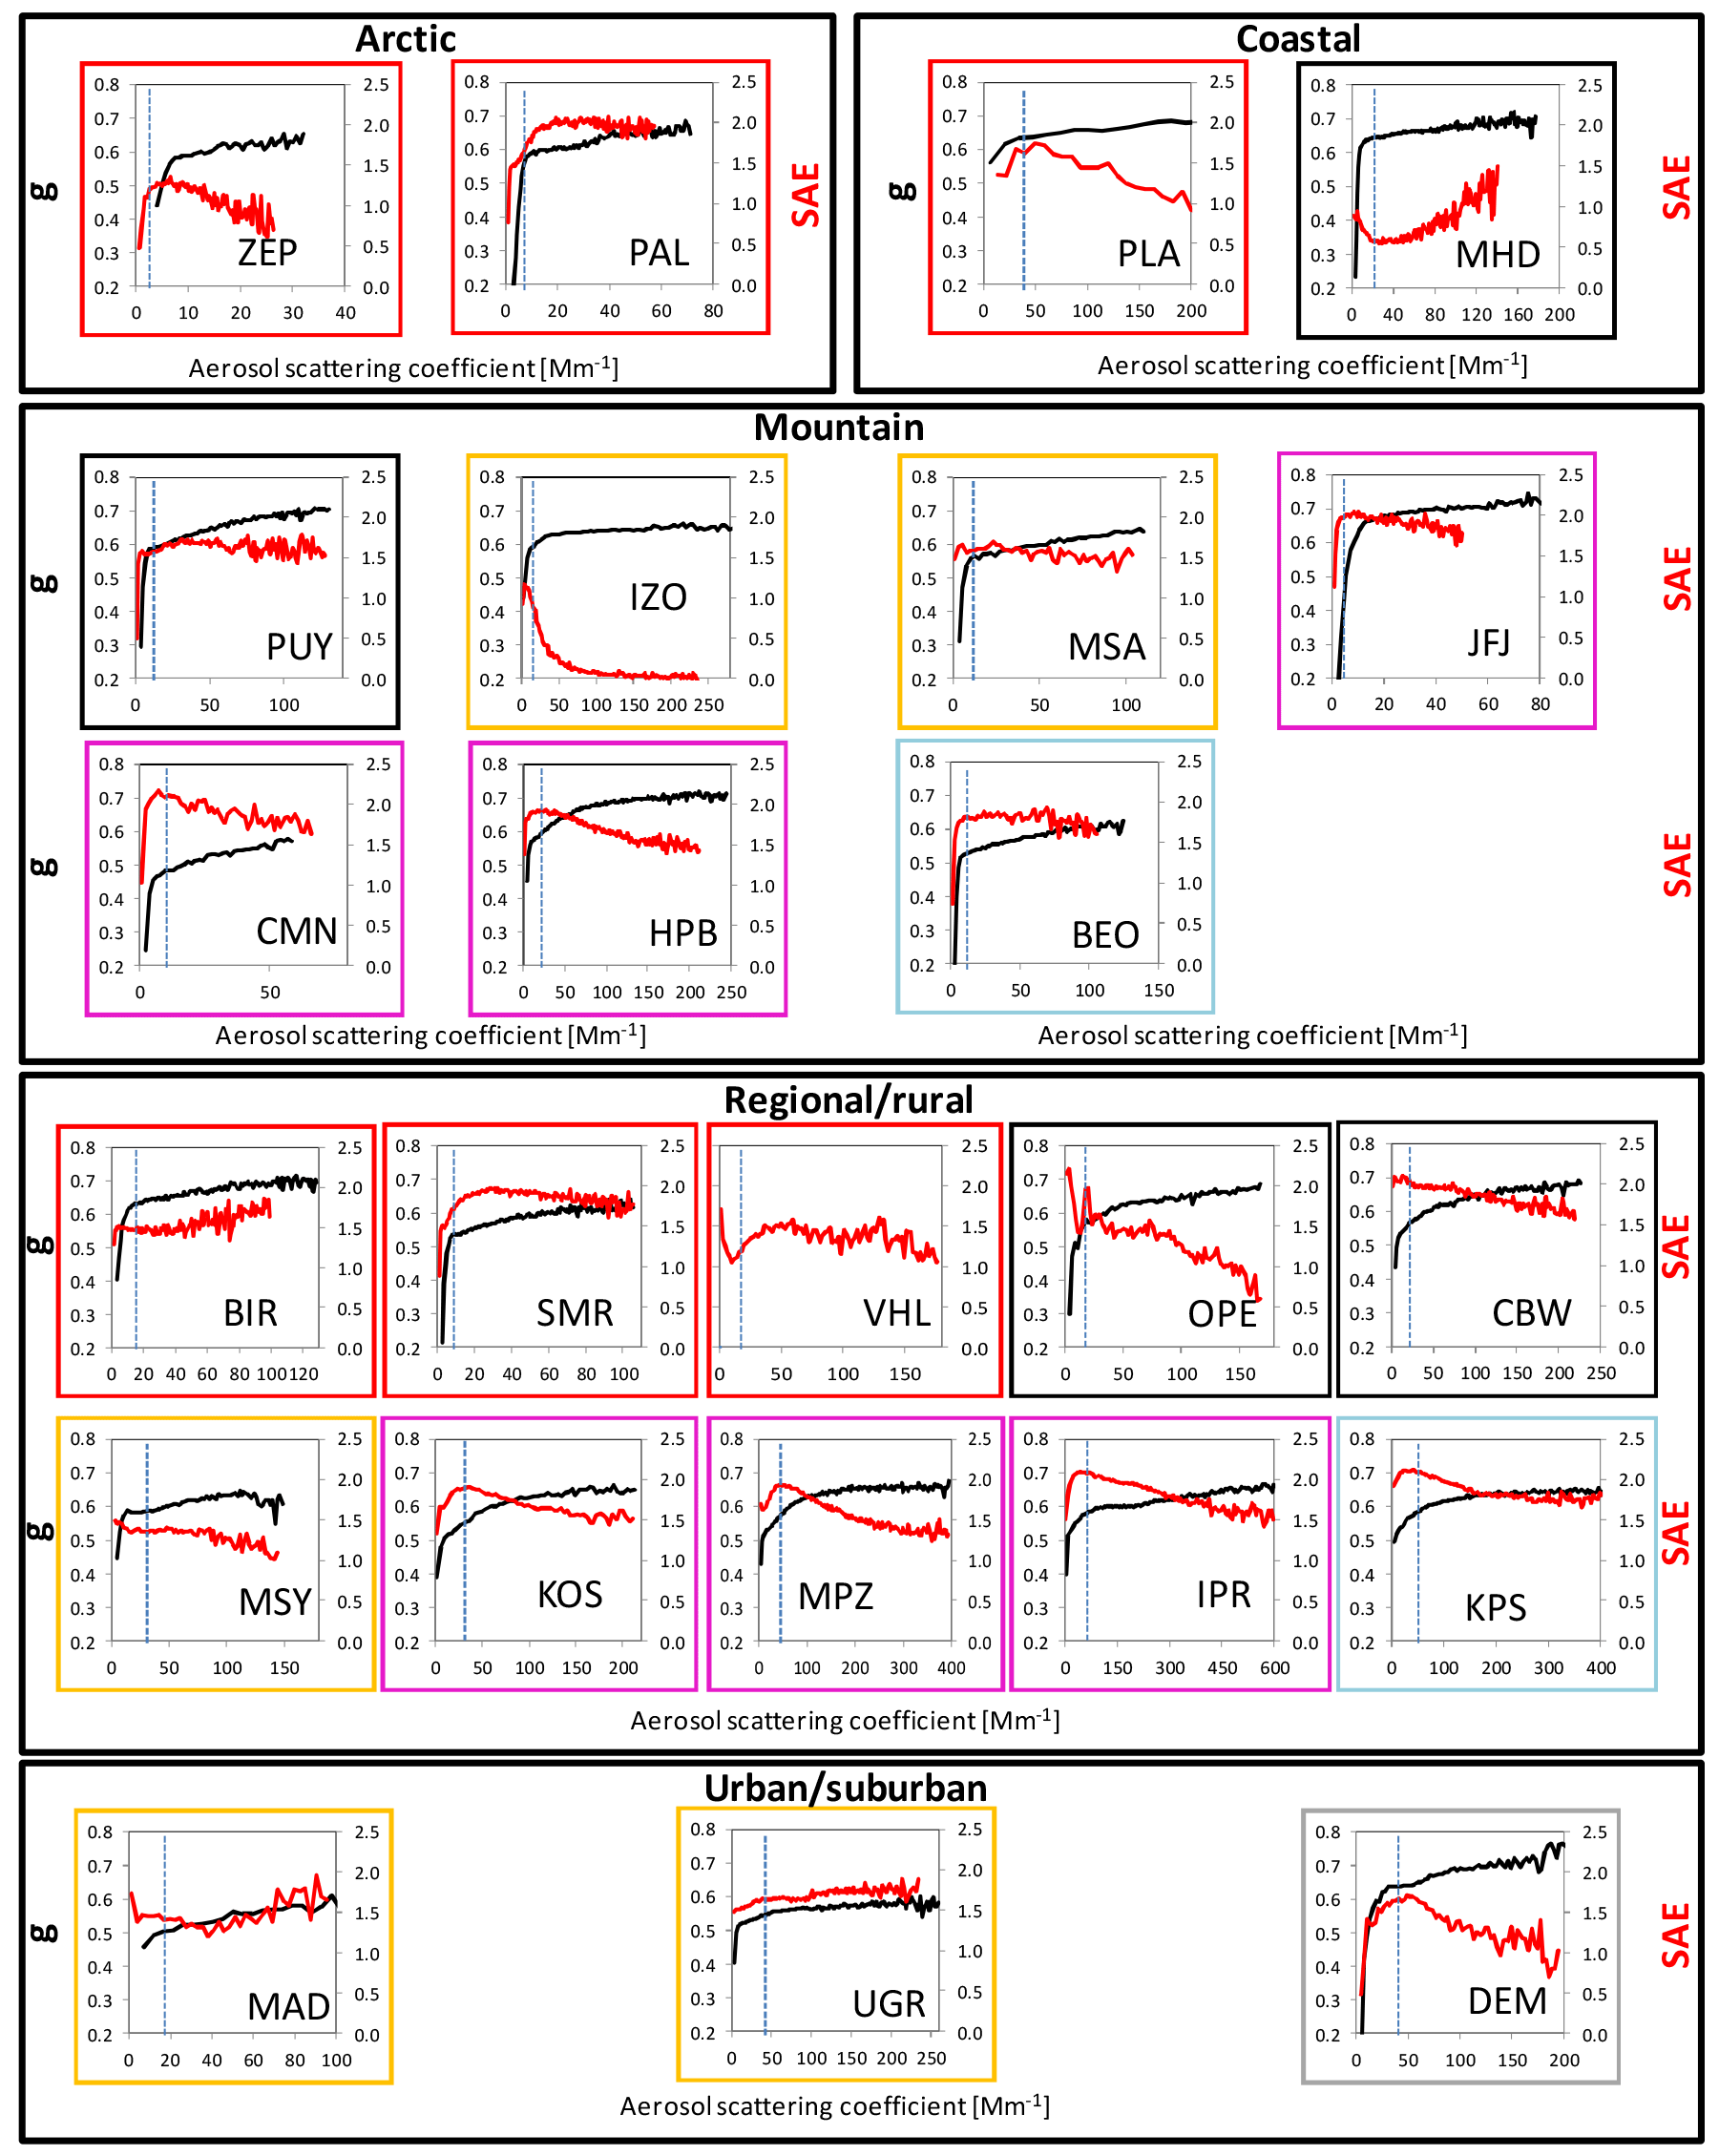
Figure 9Scatter plots between σsp (x axis) and SAE (right y axis; red lines) and g (left y axis; black lines). Dashed lines represent median σsp values at each station. Different colours highlight different geographical locations as in Figs. 2, 4 and 5.
The shift in the particle number size distribution toward the large end of the fine mode with increasing σsp is probably the main cause of the observed increase in g (and the decrease in BF; see Fig. S10). A possible explanation for this shift is a progressive ageing of atmospheric aerosol particles. Then, at the majority of stations, the variation of g is less pronounced during periods of high particle mass concentration, suggesting changes mostly in the coarse aerosol particle mode rather than in the fine mode.
3.5.2 SAE–σsp relationships
As reported in Fig. 9, at some stations the SAE progressively increases with σsp in the σsp range, in which the g parameter also increases. The increase in both g and SAE with σsp, observed for example at the Nordic and Baltic regions, and central and eastern European observatories, could be related to the different effects that different particle sizes have on the SAE and g. A progressive increase in SAE with σsp would suggest an increase in the relative importance of fine aerosol particles. The origin of these fine particles is probably different depending on the location of the measuring site. For the remote PAL site, for example, Lihavainen et al. (2015b) observed an increase in both σsp and SAE with increasing temperature due to the increasing rate of formation of BSOA with increasing ambient temperature, thus likely driving the σsp–SAE relationships reported in Fig. 9 for PAL. The BSOA from gas-to-particle formation over regions substantially lacking in anthropogenic aerosol sources, such as the European boreal region (Tunved et al., 2006), probably contribute strongly to the σsp–SAE relationships observed at other Nordic and Baltic sites, such as SMR. At polluted sites, such as those located in central and eastern Europe, the anthropogenic aerosol emissions and active secondary aerosol production in the region (e.g. Ma et al., 2014) are probably driving the σsp–SAE relationships reported in Fig. 9.
For higher σsp, the σsp–SAE relationships change and a progressive shift toward relatively larger particles is on average observed with increasing σsp. However, at the majority of north-western, central and eastern European stations, the SAE maintains values around, or higher than, 1.5 at high particle loads, indicating that the high σsp is dominated by fine particles. An exception is MHD, where the SAE increases with increasing σsp, maintaining values on average lower than 1.4 at high particle loads (see Fig. 9). As already observed, the low SAE at MHD is mainly due to the predominance of coarse sea-salt particles at this site (Vaishya et al., 2011). Conversely, at some sites in southern Europe (e.g. MSA, MSY, IZO, DEM) the SAE reaches values of around one or lower for high particle loads, indicating that, at these stations, the high σsp is dominated by mineral dust coarse particles mainly from African deserts. Exceptions are two urban sites in south-western Europe (UGR and MAD) where fine particles, probably generated for the most part by traffic (and also from biomass burning at UGR), on average dominate the highest measured σsp values.
Similar σsp–SAE relationships to those reported in Fig. 9 were observed by Andrews et al. (2011) at mountain sites and by Delene and Ogren (2002) at marine sites. Among the lowest SAE are observed at IZO, the station closest to the African continent. Interestingly, at IZO, the SAE shows the highest gradient for σsp coefficients in the range of 0 to 50 Mm−1, whereas the gradient is much lower for σsp values higher than 50 Mm−1, with the SAE being almost constant for σsp higher than 100 Mm−1. The IZO station is often in the free troposphere and high loadings at this station are only registered during Saharan dust events, thus it is virtually only the mineral dust that is measured at IZO. Normally, the long-range transport mineral dust particles do not represent a significant fraction of the particle population above 10 µm because of their short lifetimes, which likely explains the constant SAE observed at the IZO site under high aerosol loading.
3.6 Trends
Trends of σsp, SAE and BF are studied for those stations with more than 8 years' worth of data (13 observatories). Among the ACTRIS stations, PAL, SMR, MHD, HPB, IPR, JFJ and UGR have more than 10 years of data, whereas at PUY, MPZ, CMN, BEO, KPS and IZO, 8 or 9 years of data are available. These stations are included in order to improve the spatial coverage, as is the case in Collaud Coen et al. (2013). The Theil–Sen statistical estimator (Theil, 1950; Sen, 1968) is used here to determine the regression parameters of the data trends, including slope, uncertainty in the slope and p value. The Theil–Sen method provides similar results to the Mann–Kendall test and it is implemented in the OpenAir package available for R software (Carslaw, 2012; Carslaw and Ropkins, 2012). The applied method yields accurate confidence intervals, even with non-normal data, and it is less sensitive to outliers and missing values (Hollander and Wolfe, 1999). Monthly means are used for trend analysis and the data are corrected for seasonal effects.
The data coverage for σsp is higher than 70 % at all stations included in the trend analyses, with the exception of IZO, where the σsp data coverage is 55 %. For SAE, the data coverage is higher than 65 % at all sites with the exception of PAL (54 %), PUY (59 %) and IZO (52 %). For BF, the data coverage is higher than 65 % with the exception of PAL (26 %), PUY (43 %), BEO (47 %) and IZO (27 %). At the remote (PAL) or mountain stations (PUY, BEO and IZO), the percentage for the intensive aerosol particle optical properties is lower because there is a higher probability of measuring σsp lower than the threshold (0.8 Mm−1) selected for the calculation of SAE and BF.
Table 2Trends of aerosol particle-scattering coefficient (σsp), scattering Ångström exponent (SAE) and backscatter fraction (BF). Three trends for SAE are reported: SAE calculated as a linear fit using three wavelengths (b-g-r), the blue and green wavelengths (b-g) and the green and red wavelengths (g-r). Trend results are reported for the whole period available at each station until 2015 (bold) and for the periods reported in Collaud Coen et al. (2013) and Asmi et al. (2013). Trends are considered statistically significant for a p value of < 0.05. Statistically significant increasing or decreasing trends are highlighted with capital bold I and D letters. Non-statistically significant increasing or decreasing trends are highlighted with lower case italic i and d letters. The dashes in the table cells highlight stations included in this work but not included in the works of Collaud Coen et al. (2013) or Asmi et al. (2013). The symbol $ denotes parameters removed in this work and in the work of Collaud Coen et al. (2013) because of measurement gaps, low data coverage or break points for one or more wavelengths. The symbol # denotes data only available for 2014–2015.
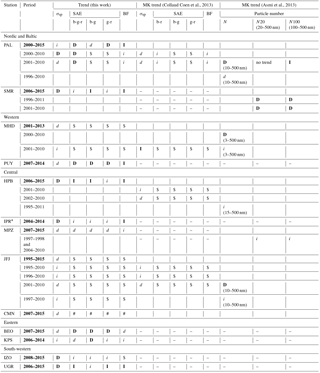
* A statistically significant decreasing trend of σsp at IPR was also reported by Putaud et al. (2014) for the period 2002–2010.
Table 2 reports the trends observed for σsp, SAE and BF at the 13 observatories included in this analysis. The magnitude and statistical significance of the trends for these parameters are reported in Table S8 in the Supplement. In Table 2, comparisons with the previous trend analysis results presented by Collaud Coen et al. (2013) for aerosol particle optical properties and by Asmi et al. (2013) for particle number concentrations are also reported.
3.6.1 Trends of σsp
Overall, a statistically significant decreasing trend for σsp is observed at around 50 % of the stations considered here (Table 2). Significantly, decreasing trends for σsp are observed at the two Nordic and Baltic observatories (PAL for the period 2000–2010 and SMR), at two (HPB and IPR) out of the five observatories in central Europe and at the two observatories in south-western Europe (IZO and UGR). The trends are not statistically significant in western (MHD and PUY) and eastern (BEO and KPS) Europe. The highest magnitude for the σsp trend [] (see Table S8 in the Supplement) is observed at the polluted IPR observatory. Conversely, the lowest magnitude is observed at the remote PAL observatory.
For the periods considered in this work, the total reductions (TRs) for σsp range between approximately 30 % (SMR) and 60 % (IZO). The high TRs observed at IZO might be affected by the intensity and frequency of Saharan dust outbreaks at this site. However, estimating the effects of these events at IZO is beyond the scope of this study. Overall, the observed decreasing trends of σsp are consistent with a uniform decrease in the aerosol optical depth observed in Europe (AERONET data in Li et al., 2014).
The observed statistically significant and decreasing trends of σsp are consistent with the demonstrated reduction of PM concentration in the atmosphere in Europe in recent decades thanks to the implementation of European, national, regional and local mitigation strategies. These decreasing trends are also consistent with the trends in the aerosol chemistry derived from observations in urban environments in Europe (e.g. EEA, 2013; Barmpadimos et al., 2011; Titos et al., 2014; Pandolfi et al., 2016), regional and remote environments in the western Mediterranean (Cusack et al., 2012; Pandolfi et al., 2016) and in general with trends derived for the aerosol chemistry across Europe (Tørseth et al., 2012). Recently, Collaud Coen et al. (2013) showed that trends in σsp are observed at most of the US continental sites and that these trends are generally consistent with the strong SO2 and PM reductions observed in the United States (Asmi et al., 2013; EPA, 2011). Conversely, in Europe, the strong decreasing trend observed for SO2 (e.g. Tørseth et al., 2012; Henschel et al., 2013) and, with a lower spatial homogeneity and statistical significance, for PM2.5 (e.g. EEA, 2016) is not observed for aerosol optical properties. As reported in Collaud Coen et al. (2013) the reasons that no significant trends are observed at some of the European sites might be related to the spatial inhomogeneities and under-representation of continental Europe PBL sites (e.g. Laj et al., 2009) and/or the timing of the SO2 and PM trends for the United States and Europe. In Europe, the emission reductions were greater for the period 1980–2000 compared to the period 2000–2010 (e.g. Colette et al., 2016; Tørseth et al., 2012; Manktelow et al., 2007), thus the measurements of optical particle properties in Europe may not go back far enough to reflect the time period with the largest emission reductions. Tørseth et al. (2012) reported average reductions for ambient sulfate and nitrate mass concentrations in Europe of −12 and −1 % during 2000–2009 compared to −24 and −7 % during 1990–2000. These authors also reported statistically significant decreases in the PM10 and PM2.5 mass concentrations at around 50 % of European sites, with total reductions of −18 and −27 %, for PM10 (24 sites) and PM2.5 (13 sites) during 2000–2009. A direct comparison between the stations included in this work and those included in the study of Tørseth et al. (2012) is not possible because of the different timings of the reported σsp and PM mass concentration measurements. At those stations where a significant decreasing trend for σsp is observed and considering a period of 10 years (even if not coincident for all stations), the total reduction for σsp in Europe is around −35 % (see Table S8), consistent with the trend reported by Tørseth et al. (2012) for PM in Europe.
Quite good agreement, although again likely biased by the different timings, is also observed when comparing the PM mass concentration and σsp trends by geographical sector. A significant total reduction of around −40 to −30 % was reported for PM10 and PM2.5 in the Nordic and Baltic sector by Tørseth et al. (2012; see Fig. 7 in Tørseth et al., 2012), in close agreement with the statistically significant total decrease in σsp of around −34 % reported for PAL during 2000–2010 (see Table S8). In the western sector (MHD), the decreasing trend for PM2.5 during 2000–2009 was insignificant (−10 to 0 %) as reported here for σsp during the period 2001–2010. In the central sector, statistically significant decreases for the PM2.5 and PM10 mass concentrations ranging between −20 and −40 % were observed during a 10-year period (2000–2009) and the total reduction for σsp ranged between −38 % (HPB) and around −48 % (IPR). In the south-western European sector the total reduction for σsp is around −32 % (at UGR) and −60 % (at IZO), whereas Tørseth et al. (2012) reported decreases of around −20 to −40 % for the PM10 mass concentration in the same geographical sector.
To further confirm the observed close agreement between the PM trends reported in the literature and the trends of σsp detailed in this work, Table S9 in the Supplement reports the comparison between σsp and PM10 and/or PM2.5 mass concentration trends calculated at those stations where simultaneous σsp and PM mass concentration measurements are available. As reported in Table S9, both the observed total reductions and the statistical significance levels of the trends are very similar for σsp and PM10.
3.6.2 Trends of SAE and BF
The trends for SAE are estimated for three different quantities, namely the SAE is calculated using the three wavelengths (b-g-r), using the blue and the green wavelengths (b-g) and using the green and red wavelengths (g-r). For the periods considered in this work (in bold in Table 2), the SAE calculated using the three wavelengths (b-g-r) shows statistically significant trends at five sites. At PAL (Nordic and Baltic), PUY (western Europe) and BEO (eastern Europe) decreasing trends are observed, whereas increasing trends are observed at HPB (central Europe) and UGR (south-western Europe). Uniform negative trends of the columnar Ångström exponent from AERONET data were reported by Li et al. (2014) across Europe and these trends were ascribed to reduced fine-mode anthropogenic emissions. The positive SAE trend observed at HPB and UGR would suggest a shift in the accumulation-mode particles toward smaller sizes and/or a change in the coarse aerosol mode. For example, the SAE increase at UGR might be explained by a progressive relative importance of fine particle emissions driven by a progressive reduction of coarse particles, for example from construction/demolition works due to the economic crisis which affected Spain from 2008 (e.g. Lyamani et al., 2011; Querol et al., 2014; Pandolfi et al., 2016). In fact, Titos et al. (2014) reported a statistically significant decreasing trend for the PM10 fraction during the period 2006 to 2010, whereas no trend was observed for the PM1 fraction. Moreover, at UGR, a statistically significant increasing trend is also observed for the SAE calculated using the green and red wavelengths (g-r), which are likely more sensitive to the coarser particle mode, whereas the trend was non-statistically significant for the SAE at b-g wavelengths.
The possible change in the coarse aerosol mode at UGR is likely also the cause of the observed statistically significant increasing trend of BF (see Table 2), given that a positive trend of BF would be consistent with a shift in the accumulation-mode particles toward smaller sizes. Similarly, statistically significant increasing trends for both SAE and BF are also observed at SMR (SAE b-g) and HPB. Statistically significant increasing trends of BF are also observed at the other Nordic and Baltic stations (PAL) and at PUY (western Europe), where the SAE shows statistically significant decreasing trends, and at IPR (central Europe), where the trend of SAE is insignificant. Thus, overall, the trends of BF are positive at all stations where BF measurements are available. The opposite sign of the trends for SAE and BF at PAL and PUY could be due to the different effects that the different particle sizes have on SAE and g or a progressive change in the mean diameter of the fine-mode aerosols. Further research involving, for example, size distribution data and a Mie calculation could help in understanding the differences observed in some cases between SAE and BF (or g).
Recently, Korras-Carraca et al. (2015) showed that the column-integrated g from MODIS Terra showed widely statistically significant positive trends (2002–2010) with stronger increases observed in the eastern and southern Black Sea, as well as over the Baltic and Barents seas. Moreover, both MODIS Terra and MODIS Aqua produce positive trends of g in the eastern Mediterranean Sea and the eastern coast of the Iberian Peninsula. Positive trends for g correspond to negative trends for BF. The difference observed in our work could be due to the different variability often observed between near-surface measurements and column-integrated measurements which can confound the relationship between surface and column optical properties (e.g. Bergin et al., 2000; Lyamani et al., 2010), although it has been shown that a mid-altitude station might be globally representative of the whole atmospheric column (Chauvigne et al., 2016).
3.6.3 Comparison with previous trend analyses
Table 2 shows the comparison, over the same time periods, between the trend analyses performed in this work and the analyses presented by Collaud Coen et al. (2013) for aerosol particle optical properties and by Asmi et al. (2013) for particle number concentrations (NLDL−500, N20−500 and N100−500). An agreement with the results from Collaud Coen et al. (2013) is observed for JFJ, where consistent insignificant trends are detected for the three periods reported in Collaud Coen et al. (2013). For MHD, we observed a non-significant increasing trend for σsp during 2001–2010, whereas Collaud Coen et al. (2013) reported a statistically significant increasing trend for the same period. At PAL, a non-statistically significant trend for σsp is observed both in the current work and in Collaud Coen et al. (2013) for the period 2001–2010, whereas we observe a statistically significant decreasing trend for the period 2000–2010. Moreover, at PAL, we observe a statistically significant decreasing trend for SAE during the two common periods which were insignificant in Collaud Coen et al. (2013). It should be noted that Collaud Coen et al. (2013) reported an insignificant SAE trend at PAL using the Mann–Kendall test, whereas they reported statistically significant decreasing trends using the GLS/ARB (generalized least square trends with either autoregressive or block bootstrap confidence intervals) and LMS (least-mean square) methods, consistent with our work. These differences are thus likely due to the relatively short period used in these trend analyses and the different sensitivity of the methods used to missing values or the presence of outliers, especially at PAL, where σsp is very low (see Fig. 2). For example, in this work, the SAE calculated for PAL during the year 2007 was removed from the trend analysis due to the presence of too many extremely high SAE values, likely explaining the difference observed in SAE compared to the work of Collaud Coen et al. (2013). Moreover, here we use deseasonalized monthly means for trend analyses, whereas Collaud Coen et al. (2013) used deseasonalized medians with a different time granularity (3 days), likely affecting the comparison, especially over relatively short periods.
A comparison of trends analysis results between σsp and the particle number concentration is not straightforward as the σsp measurements are more sensitive to the particle number concentration in the upper end of the fine mode than to smaller particles. For example, Asmi et al. (2013) reported that, globally, no strong similarities were observed between σsp and particle number concentration (N) trends and that the N trends are controlled by particles in the larger range of the Aitken mode and the smaller range of the accumulation mode, i.e. ca. 50–150 nm diameter. In this work, as reported in Table 2, the statistically significant decreasing trend reported for N during the period 2001–2010 is not observed for σsp. However, differences are also observed at PAL between N20 and N100, mainly due to the fact that the DMPS measurements at PAL had long gaps during periods with unusually low concentrations, thus effectively removing low concentrations from the trend analysis (Asmi et al., 2013).
Table 3Daytime (08:00 to 16:00 GMT) and night-time (21:00 to 05:00 GMT) σsp trends by season calculated for the periods considered in this work. Sp is spring, Su is summer, Au is autumn and Wi is winter. Trends are considered statistically significant at a p value of < 0.05. Statistically significant increasing or decreasing trends are highlighted with capital bold I and D letters. Non-statistically significant increasing or decreasing trends are highlighted with lower case italic i and d letters.
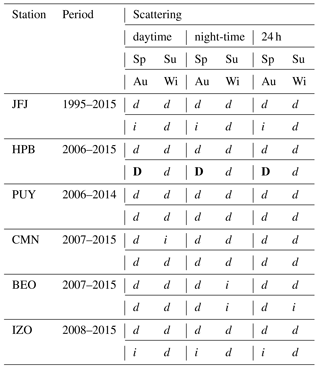
3.6.4 Daytime and night-time trend analyses at mountain sites
Finally, the analysis of the trends during daytime (08:00 to 16:00 GMT) and night-time (21:00 to 05:00 GMT) by season at the mountain stations are also analysed (Table 3). This analysis could provide information about changes in σsp during periods when the mountain stations are likely affected by the PBL (e.g. daytime and/or summer) or by the residual layer (e.g. night-time in summer) or when the mountain stations are representative of the free troposphere (e.g. night-time in winter). Consistent with what is reported in Table 2 for σsp, the trends are insignificant at JFJ, PUY, CMN and BEO irrespective of the time of the day or season. The decreasing trends observed at HPB, also reported in Table 2, are statistically significant only during autumn, irrespective of the time of day. Conversely, the trend observed for σsp at IZO reported in Table 2, is not observed on splitting the analysis by time of day and/or season.
This investigation presented the near-surface in situ σsp (aerosol particle light scattering), SAE (scattering Ångström exponent), BF (backscatter fraction) and g (asymmetry parameter) measurements obtained over the past decade at 28 atmospheric observatories which are part of the ACTRIS Research Infrastructure, with most belonging to the GAW network. Results show a large variability in both extensive and intensive aerosol particle optical properties across the network, which is consistent with the previously reported variability observed for other aerosol particle properties such as particle mass concentration, particle number concentration and chemical composition. The main findings can be summarized as follows.
An increasing gradient of σsp is observed when moving from remote environments (Arctic/mountain) to regional and to urban environments. At a regional level in Europe, σsp also increases when moving from Nordic and Baltic countries and from western Europe to central/eastern Europe, whereas no clear spatial gradient is observed for other station environments. For example, the lack of a clear spatial gradient of σsp measured at mountain observatories is likely due to the different altitudes of the observatories in the different geographical sectors considered in this study. Among the European mountain observatories a relationship was observed between the station altitude and the median σsp, the latter being the highest at the station located at the lower altitude and vice versa.
Overall, the highest σsp values are measured at low-altitude observatories in central and eastern Europe and at some urban observatories in southern Europe, whereas the lowest σsp values are observed at mountain stations and at Arctic and Antarctic observatories. Low σsp levels, comparable to those measured at mountain sites, are also observed at the majority of the regional Nordic and Baltic observatories. The σsp values in western Europe are on average higher compared to those measured in the Nordic and Baltic regions and lower compared to those measured at a regional level in southern Europe. Some exceptions to these general features are, however, observed.
The SAE does not show any clear gradient as a function of the placement of the station. However, a west-to-east-increasing gradient is observed for both regional and mountain placements, suggesting a lower fraction of fine-mode particle in western/south-western Europe compared to central and eastern Europe, where the fine-mode particles dominate the scattering.
In fact, in central and eastern Europe, independently of the station placement, the SAE is among the highest observed across the network, indicating a large predominance of fine particles. In these regions, the SAE is even higher in summer compared to winter, suggesting a shift toward the small end of the aerosol particle size distribution that is likely linked to new particle formation events during the warmest months. On average, SAE is lower in the Nordic, Baltic, western geographical sectors (likely due to the contribution from coarse-mode sea-salt particles) and southern sectors (likely because of the presence of mineral dust particles from African deserts) compared to central and eastern Europe.
The g does not show any clear gradient by station placement or geographical location, reflecting the complex relationship of this parameter with the aerosol particles properties such as size distribution, particle shape or refractive index.
Slightly higher g values are observed in western Europe compared to central and eastern Europe. These differences in the g values, even if small, are consistent with the opposite gradient observed for SAE, the latter being smaller in western Europe. However, the station-averaged g in central and eastern Europe is similar to the mean g observed in the Nordic and Baltic regions and in south-western Europe. Thus, contrary to the SAE, a clear relationship between aerosol size and g is not observed.
Seasonal cycles for σsp, SAE and g are observed in all geographical sectors and explained by different factors. The seasonal cycles are especially marked at a regional level in central and eastern Europe where wintertime episodes linked to stable air and thermal inversions favour the accumulation of pollutants. In these European regions the SAE (g) is higher (lower) in summer compared to winter due to variations in particle number size distribution due to the enhanced formation of small and optically active particles during new particles formation and subsequent growth. Clear annual cycles are also observed at mountain sites where σsp is higher in summer because of the enhanced influence of the boundary layer. In some cases, the SAE (g) is also high (low) in summer at mountain sites, indicating a higher PBL anthropogenic influence during the warmer months and/or new particles formation episodes. In the Nordic and Baltic regions, the seasonal variation of σsp is less pronounced compared to central and eastern Europe, likely due to the different meteorology and less pronounced PBL variations. Despite the relatively small σsp seasonal cycles in the Nordic and Baltic regions, SAE (g) increases (decreases) in these regions in summer compared to the winter period, likely due to a season-dependent transport of air masses at these remote sites and the enhanced formation of secondary organic aerosols previously observed at these sites during the warmest months. At coastal sites in north-western Europe, the presence of sea-salt particles in winter also contributes to the observed pronounced seasonal cycles of SAE and g. In southern Europe the seasonal cycles are strongly driven by the enhanced formation of secondary sulfate and organic matter in the summer, together with frequent Saharan mineral dust outbreaks.
The analyses of the systematic variabilities of SAE and g as a function aerosol loading (σsp) reveal some common patterns. At all stations, g shows the lowest values at very low σsp, likely because of the formation of new particles in a clean atmosphere followed by condensation/coagulation consequently with the generation of small but optically active particles. The g value then sharply increases with increasing σsp, indicating the shift in the particle number size distribution toward the larger end of the accumulation mode. Then, during periods of high σsp values, the variation of g is less pronounced at the majority of the stations, contrary to the SAE, which increases or decreases, suggesting changes mostly in the coarse aerosol particle mode rather than in the fine mode. At the majority of north-western, central and eastern European stations, the SAE maintains high values at high σsp values, indicating that the high σsp is dominated by fine particles. Conversely, at some sites in southern Europe the SAE reaches values of around one or lower for high particle loads, indicating that, at these stations, the high σsp is dominated by mineral dust coarse particles mainly from African deserts. Exceptions are two urban sites in south-western Europe where fine particles, probably generated for the most part by traffic (and also from biomass burning) on average dominate the highest measured σsp values.
The analyses of the trends reported in this investigation provide evidence that both extensive and intensive aerosol optical properties have significantly changed at some of the locations included here over the last 10 and 15 years. The σsp decreasing trends reported here are statistically significant at 5 out of 13 stations included in the analyses. These five stations are located in the Nordic and Baltic regions, and the central and south-western sectors. Conversely, σsp trends which are decreasing are not statistically significant in western and eastern Europe. Statistically significant decreasing trends of SAE are observed at 3 out of 10 observatories included in the analysis: one site in the Nordic and Baltic sector and two mountain sites in the western and eastern sectors. These negative trends could be ascribed to reduced fine-mode anthropogenic emissions, as already observed in the literature for columnar SAE in Europe. Conversely, at two stations (one mountain site in central Europe and one urban site in south-western Europe), the SAE shows a statistically significant increasing trend, suggesting a shift in the accumulation-mode particles toward smaller sizes and/or a change in the coarse aerosol mode. At the remaining five observatories, the reported SAE trends are not statistically significant. The backscatter fraction shows a statistically significant increasing trend at five out of the nine sites where BF measurements are available. At three stations (the mountain site in central Europe, the urban site in south-western Europe and one of the two sites in the Nordic and Baltic sector), both BF and SAE increase, suggesting consistent evidence of a shift in the accumulation-mode particles toward a smaller size. Conversely, at the other site in the Nordic and Baltic sector and at one mountain site in the western sector the BF increases, whereas the SAE decreases.
A general agreement is observed between the trend analyses performed in this work and the analyses presented in a previous work confirming the general decreasing trends observed for σsp in Europe. However, some differences are also observed and are likely due to the relatively short periods used in these trend analyses and the different sensitivity of the methods used for missing values or the presence of outliers (Mann–Kendall or Theil–Sen vs. GLS/ARB or MLS; means vs. medians; different time granularity).
In conclusion, this investigation provides a clear and useful picture of the spatial and temporal variability in the surface in situ aerosol particle optical properties in Europe. The results presented here give a comprehensive view of the particle optical properties and provide a reliable analysis of aerosol optical parameters for model constraints. In addition, the analyses presented here suggest findings that may need additional investigation. For example, the fact that at some of the stations the trend of σsp changes in terms of both statistical significance and sign depending on the period used suggests that trend analyses are necessary in the future when longer-duration records will be available. Moreover, the fact that at some sites BF and SAE show different signs in their trends suggests that further analysis is needed to better understand how other aerosol parameters, such as particle size distribution and mean diameter, affect the relationships between BF and SAE.
The data sets used for this publication are accessible online on the WDCA (World Data Centre for Aerosols) web page: http://ebas.nilu.no (last access: August 2017).
The supplement related to this article is available online at: https://doi.org/10.5194/acp-18-7877-2018-supplement.
The authors declare that they have no conflict of interest.
This project has received funding from the European Union's Horizon 2020
research and innovation programme under grant agreement no. 654109, ACTRIS
(project no. 262254), ACTRIS-PPP (project no. 739530). We thank the
International Foundation High Altitude Research Stations JFJ (Jungfraujoch)
and Gornergrat (HFSJG), which made it possible to carry out the experiments
at the High Altitude Research JFJ Station and the support of MeteoSwiss
within the Swiss programme of the Global Atmosphere Watch (GAW) of the WMO.
The MAD (Madrid) station is co-financed by the PROACLIM (CGL2014-52877-R)
project. The SMR (Hyytiälä) station acknowledges BACCHUS (project
no. 603445), CRAICC (project no. 26060) and the Academy of Finland (project
no. 3073314). The UGR (Granada) station is co-financed by the Spanish
Ministry of Economy and Competitiveness through project CGL2016-81092-R.
Measurements at MSY (Montseny) and MSA (Montsec) stations were supported by
the MINECO (Spanish Ministry of Economy, Industry and Competitiveness) and
FEDER funds under the PRISMA project (CGL2012-39623-C02/00) and under the
HOUSE project (CGL2016-78594-R), by the MAGRAMA (Spanish Ministry of
Agriculture, Food and Environment) and by the Generalitat de Catalunya (AGAUR
2014 SGR33, AGAUR 2017 SGR41 and the DGQA). Measurements at IZO (Izaña)
were supported by the AEROATLAN project (CGL2015-17 66229-P), co-funded by
the Ministry of Economy and Competitiveness of Spain and the European
Regional Development Fund. Station KOS (Košetice) is supported by the
Ministry of Education, Youth and Sports of the Czech Republic within the
project to support the national research infrastructure ACTRIS –
participation of the Czech Republic (ACTRIS-CZ – LM2015037). Measurements at
PUY (Puy de Dôme) were partly supported by CNRS-INSU, University
Clermont-Auvergne, OPGC and the french CLAP programme. The PAL (Pallas)
station acknowledges KONE Foundation, Academy of Finland (project no. 269095
and no. 296302). CHC (Mt Chacaltaya) station received support from Institut
de Recherche pour le Développement (IRD) under both Jeune Equipe
programme attributed to LFA and support to ACTRIS-FR programme. CHC received
grants from Labex OSUG@2020 (Investissements d'avenir – ANR10 LABX56). Marco
Pandolfi is funded by a Ramón y Cajal Fellowship (RYC-2013-14036) awarded
by the Spanish Ministry of Economy and Competitiveness. The authors would
like to express their gratitude to David Carslaw and Karl Ropkins for
providing the OpenAir software used in this paper (Carslaw and Ropkins, 2012;
Carslaw, 2012). We also thank the co-editor Andreas Petzold and two anonymous
reviewers for their constructive comments.
Edited by: Andreas Petzold
Reviewed by: two anonymous referees
Aaltonen, V., Lihavainen, H., Kerminen, V.-M., Komppula, M., Hatakka, J., Eneroth, K., Kulmala, M., and Viisanen, Y.: Measurements of optical properties of atmospheric aerosols in Northern Finland, Atmos. Chem. Phys., 6, 1155–1164, https://doi.org/10.5194/acp-6-1155-2006, 2006.
Alastuey, A., Querol, X., Castillo, S., Escudero, M., Avila, A., Cuevas, E., Torres, C., Romero, P.-M., Exposito, F., García, O., Diaz, J. P., Van Dingenen, R., and Putaud, J. P.: Characterisation of TSP and PM2.5 at Izaña and Sta. Cruz de Tenerife (Canary Islands, Spain) during a Saharan dust episode (July 2002), Atmos. Environ., 39, 4715–4728, https://doi.org/10.1016/j.atmosenv.2005.04.018, 2005.
Anderson, T. L. and Ogren, J. A.: Determining aerosol radia radiative properties using the TSI 3563 Integrating Nephelometer, Aerosol Sci. Tech., 29, 57–69, 1998.
Andrews, E., Sheridan, P. J., Fiebig, M., McComiskey, A., Ogren, J. A., Arnott, P., Covert, D., Elleman, R., Gasparini, R., Collins, D., Jonsson, H., Schmid, B., and Wang, J.: Comparison of methods for deriving aerosol asymmetry parameter, J. Geophys. Res.-Atmos., 111, D05S04, https://doi.org/10.1029/2004JD005734, 2006.
Andrews, E., Ogren, J. A., Bonasoni, P., Marinoni, A., Cuevas, E., Rodríguez, S., Sun, J. Y., Jaffe, D. A., Fischer, E. V., Baltensperger, U., Weingartner, E., Collaud Coen, M., Sharma, S., Macdonald, A. M., Leaitch, W. R., Lin, N.-H., Laj, P., Arsov, T., Kalapov, I., Jefferson, A., and Sheridan, P.: Climatology of aerosol radiative properties in the free troposphere, Atmos. Res., 102, 365–393, https://doi.org/10.1016/j.atmosres.2011.08.017, 2011.
Asmi, A., Wiedensohler, A., Laj, P., Fjaeraa, A.-M., Sellegri, K., Birmili, W., Weingartner, E., Baltensperger, U., Zdimal, V., Zikova, N., Putaud, J.-P., Marinoni, A., Tunved, P., Hansson, H.-C., Fiebig, M., Kivekäs, N., Lihavainen, H., Asmi, E., Ulevicius, V., Aalto, P. P., Swietlicki, E., Kristensson, A., Mihalopoulos, N., Kalivitis, N., Kalapov, I., Kiss, G., de Leeuw, G., Henzing, B., Harrison, R. M., Beddows, D., O'Dowd, C., Jennings, S. G., Flentje, H., Weinhold, K., Meinhardt, F., Ries, L., and Kulmala, M.: Number size distributions and seasonality of submicron particles in Europe 2008–2009, Atmos. Chem. Phys., 11, 5505–5538, https://doi.org/10.5194/acp-11-5505-2011, 2011.
Asmi, A., Collaud Coen, M., Ogren, J. A., Andrews, E., Sheridan, P., Jefferson, A., Weingartner, E., Baltensperger, U., Bukowiecki, N., Lihavainen, H., Kivekäs, N., Asmi, E., Aalto, P. P., Kulmala, M., Wiedensohler, A., Birmili, W., Hamed, A., O'Dowd, C., G Jennings, S., Weller, R., Flentje, H., Fjaeraa, A. M., Fiebig, M., Myhre, C. L., Hallar, A. G., Swietlicki, E., Kristensson, A., and Laj, P.: Aerosol decadal trends – Part 2: In-situ aerosol particle number concentrations at GAW and ACTRIS stations, Atmos. Chem. Phys., 13, 895–916, https://doi.org/10.5194/acp-13-895-2013, 2013.
Barmpadimos, I., Hueglin, C., Keller, J., Henne, S., and Prévôt, A. S. H.: Influence of meteorology on PM10 trends and variability in Switzerland from 1991 to 2008, Atmos. Chem. Phys., 11, 1813–1835, https://doi.org/10.5194/acp-11-1813-2011, 2011.
Barmpadimos, I., Keller, J., Oderbolz, D., Hueglin, C., and Prévôt, A. S. H.: One decade of parallel fine (PM2.5) and coarse (PM10–PM2.5) particulate matter measurements in Europe: trends and variability, Atmos. Chem. Phys., 12, 3189–3203, https://doi.org/10.5194/acp-12-3189-2012, 2012.
Bergin, M. H., Schwartz, S. E., Halthore, R. N., Ogren, J. A., and Hlavka, D. L.: Comparison of aerosol optical depth inferred from surface measurements with that determined by Sun photometry for cloud-free conditions at a continental US site, J. Geophys. Res., 105, 6807–6816, 2000.
Bond, T. C., Covert, D. S., and Muller, T.: Truncation and angular-scattering corrections for absorbing aerosol in the TSI 3563 Nephelometer, Aerosol Sci. Tech., 43, 866–871, 2009.
Boulon, J., Sellegri, K., Hervo, M., and Laj, P.: Observations of nucleation of new particles in a volcanic plume, P. Natl. Acad. Sci. USA, 108, 12223–12226, https://doi.org/10.1073/pnas.1104923108, 2011.
Bourcier, L., Sellegri, K., Chausse, P., Pichon, J. M., and Laj, P.: Seasonal variation of water-soluble inorganic component in size-segregated aerosol at the puy de Dôme station (1465 ), France, J. Atmos. Chem., 69, 47–66, https://doi.org/10.1007/s10874-012-9229-2, 2012.
Bukowiecki, N., Weingartner, E., Gysel, M., Collaud Coen, M., Zieger, P., Herrmann, E., Steinbacher, M., Gäggeler, H. W., and Baltensperger, U.: A review of more than 20 years of aerosol observation at the high altitude research station Jungfraujoch, Switzerland (3580 ), Aerosol Air Qual. Res., 16, 764–788, https://doi.org/10.4209/aaqr.2015.05.0305, 2016.
Carrico, C. M., Kus, P., Rood, M. J., Quinn, P. K., and Bates, T. S.: Mixtures of pollution, dust, sea salt, and volcanic aerosol during ACE-Asia: radiative properties as a function of relative humidity, J. Geophys. Res., 108, 8650, https://doi.org/10.1029/2003JD003405, 2003.
Carslaw, D. C.: The Openair Manual – Open-Source Tools for Analysing Air Pollution Data, Manual for version 0.7-0, King's College, London, 2012.
Carslaw, D. C. and Ropkins, K.: openair – an R package for air quality data analysis, Environ. Modell. Softw., 27–28, 52–61, 2012.
Cavalli, F., Alastuey, A., Areskoug, H., Ceburnis, D., Cech, J., Genberg, J., Harrison, R. M., Jaffrezo, J. L., Kiss, G., Laj, P., Mihalopoulos, N., Perez, N., Quincey, P., Schwarz, J., Sellegri, K., Spindler, G., Swietlicki, E., Theodosi, C., Yttri, K. E., Aas, W., and Putaud, J. P.: A European aerosol phenomenology –4: harmonized concentrations of carbonaceous aerosol at 10 regional background sites across Europe, Atmos. Environ., 144, 133–145, 2016.
Chauvigné, A., Sellegri, K., Hervo, M., Montoux, N., Freville, P., and Goloub, P.: Comparison of the aerosol optical properties and size distribution retrieved by sun photometer with in situ measurements at midlatitude, Atmos. Meas. Tech., 9, 4569–4585, https://doi.org/10.5194/amt-9-4569-2016, 2016.
Colette, A., Aas, W., Banin, L., Braban, C., Ferm, M., González Ortiz, A., Ilyin, I., Mar, K., Pandolfi, M., Putaud, J.-P., Shatalov, V., Solberg, S., Spindler, G., Tarasova, O., Vana, M., Adani, M., Almodovar, P., Berton, E., Bessagnet, B., Bohlin-Nizzetto, P., Boruvkova, J., Breivik, K., Briganti, G., Cappelletti, A., Cuvelier, K., Derwent, R., D'Isidoro, M., Fagerli, H., Funk, C., Garcia Vivanco, M., González Ortiz, A., Haeuber, R., Hueglin, C., Jenkins, S., Kerr, J., de Leeuw, F., Lynch, J., Manders, A., Mircea, M., Pay, M., Pritula, D., Putaud, J.-P., Querol, X., Raffort, V., Reiss, I., Roustan, Y., Sauvage, S., Scavo, K., Simpson, D., Smith, R., Tang, Y., Theobald, M., Tørseth, K., Tsyro, S., van Pul, A., Vidic, S., Wallasch, M., and Wind, P.: Air pollution trends in the EMEP region between 1990 and 2012, Tech. Rep., Joint Report of the EMEP Task Force on Measurements and Modelling (TFMM), Chemical Co-ordinating Centre (CCC), Meteorological Synthesizing Centre- East (MSC-E), Meteorological Synthesizing Centre-West (MSC-W) EMEP/CCC Report 1/2016, Norwegian Institute for Air Research, Kjeller, Norway, available at: http://www.unece.org/fileadmin/DAM/env/documents/2016/AIR/Publications/Air_pollution_trends_in_the_EMEP_region.pdf (last access: December 2016), 2016.
Collaud Coen, M., Weingartner, E., Nyeki, S., Cozic, J., Henning, S., Verheggen, B., Gehrig, R., and Baltensperger, U.: Long-term trend analysis of aerosol variables at the highalpine site Jungfraujoch, J. Geophys. Res., 112, D13213, https://doi.org/10.1029/2006JD007995, 2007.
Collaud Coen, M., Weingartner, E., Apituley, A., Ceburnis, D., Fierz-Schmidhauser, R., Flentje, H., Henzing, J. S., Jennings, S. G., Moerman, M., Petzold, A., Schmid, O., and Baltensperger, U.: Minimizing light absorption measurement artifacts of the Aethalometer: evaluation of five correction algorithms, Atmos. Meas. Tech., 3, 457–474, https://doi.org/10.5194/amt-3-457-2010, 2010.
Collaud Coen, M., Andrews, E., Asmi, A., Baltensperger, U., Bukowiecki, N., Day, D., Fiebig, M., Fjaeraa, A. M., Flentje, H., Hyvärinen, A., Jefferson, A., Jennings, S. G., Kouvarakis, G., Lihavainen, H., Lund Myhre, C., Malm, W. C., Mihapopoulos, N., Molenar, J. V., O'Dowd, C., Ogren, J. A., Schichtel, B. A., Sheridan, P., Virkkula, A., Weingartner, E., Weller, R., and Laj, P.: Aerosol decadal trends – Part 1: In-situ optical measurements at GAW and IMPROVE stations, Atmos. Chem. Phys., 13, 869–894, https://doi.org/10.5194/acp-13-869-2013, 2013.
Collaud Coen, M., Andrews, E., Aliaga, D., Andrade, M., Angelov, H., Bukowiecki, N., Ealo, M., Fialho, P., Flentje, H., Hallar, A. G., Hooda, R., Kalapov, I., Krejci, R., Lin, N.-H., Marinoni, A., Ming, J., Nguyen, N. A., Pandolfi, M., Pont, V., Ries, L., Rodríguez, S., Schauer, G., Sellegri, K., Sharma, S., Sun, J., Tunved, P., Velasquez, P., and Ruffieux, D.: The topography contribution to the influence of the atmospheric boundary layer at high altitude stations, Atmos. Chem. Phys. Discuss., https://doi.org/10.5194/acp-2017-692, in review, 2017.
Crumeyrolle, S., Manninen, H. E., Sellegri, K., Roberts, G., Gomes, L., Kulmala, M., Weigel, R., Laj, P., and Schwarzenboeck, A.: New particle formation events measured on board the ATR-42 aircraft during the EUCAARI campaign, Atmos. Chem. Phys., 10, 6721–6735, https://doi.org/10.5194/acp-10-6721-2010, 2010.
Cusack, M., Alastuey, A., Pérez, N., Pey, J., and Querol, X.: Trends of particulate matter (PM2.5) and chemical composition at a regional background site in the Western Mediterranean over the last nine years (2002–2010), Atmos. Chem. Phys., 12, 8341–8357, https://doi.org/10.5194/acp-12-8341-2012, 2012.
Delene, D. J. and Ogren, J. A.: Variability of aerosol optical properties at four North American surface monitoring sites, J. Atmos. Sci., 59, 1135–1149, 2002.
Diapouli, E., Manousakas, M. I., Vratolis, S., Vasilatou, V., Pateraki, S., Bairachtari, K. A., Querol, X., Amato, F., Alastuey, A., Karanasiou, A. A., Lucarelli, F., Nava, S., Calzolai, G., Gianelle, V. L., Colombi, C., Alves, C., Custódio, D., Pio, C., Spyrou, C., Kallos, G. B., and Eleftheriadis, K.: AIRUSE-LIFE +: estimation of natural source contributions to urban ambient air PM10 and PM2.5 concentrations in southern Europe – implications to compliance with limit values, Atmos. Chem. Phys., 17, 3673–3685, https://doi.org/10.5194/acp-17-3673-2017, 2017.
Diaz, A. M., Diaz, J. P., Exposito, F. J., Hernandez-Leal, P. A., Savoie, D., and Querol, X.: Air masses and aerosols chemical components in the free troposphere at the subtropical northeast Atlantic region, J. Atmos. Chem., 53, 63–90, 2006.
Doherty, S. J., Quinn, P. K., Jefferson, A., Carrico, C. M., Anderson, T. L., and Hegg, D.: A comparison and summary of aerosol optical properties as observed in situ from aircraft, ship, and land during ACE-Asia, J. Geophys. Res., 110, D04201, https://doi.org/10.1029/2004JD004964, 2005.
Ealo, M., Alastuey, A., Ripoll, A., Pérez, N., Minguillón, M. C., Querol, X., and Pandolfi, M.: Detection of Saharan dust and biomass burning events using near-real-time intensive aerosol optical properties in the north-western Mediterranean, Atmos. Chem. Phys., 16, 12567–12586, https://doi.org/10.5194/acp-16-12567-2016, 2016.
EEA: European Environmental Agency Air quality in Europe – 2013 report, EEA report 9/2013, Copenhagen, 1725–9177, available at: http://www.eea.europa.eu/publications/air-quality-in-europe-2013 (last access: December 2017), 2013.
EEA: European Environmental Agency Air quality in Europe – 2016 report, EEA Report No 28/2016, Copenhagen, available at: https://www.eea.europa.eu/publications/air-quality-in-europe-2016 (last access: December 2017), 2016.
Eleftheriadis, K., Ochsenkuhn, K. M., Lymperopoulou, T., Karanasiou, A., Razos, P., and Ochsenkuhn-Petropoulou, M.: Influence of local and regional sources on the observed spatial and temporal variability of size resolved atmospheric aerosol mass concentrations and water-soluble species in the Athens metropolitan area, Atmos. Environ., 97, 252–261, https://doi.org/10.1016/j.atmosenv.2014.08.013, 2014.
EMEP: Transboundary Particulate Matter in Europe Status Report 2008, NILU Reference: O-98134, edited by: Yttri, K.-E., Aas, W., Tørseth, K., Stebel, K., Nyíri, Á., Tsyro, S., Merckova, K., Wankmüller, R., Winiwarter, W., Bauer, H., Caseiro, A., Puxbaum, H., Holzer-Popp, T., and Schroedter-Homscheidt, M., available at: http://tarantula.nilu.no/projects/ccc/reports/emep4-2008.pdf) (last access: December 2017), 2008.
Engvall, A.-C., Krejci, R., Ström, J., Treffeisen, R., Scheele, R., Hermansen, O., and Paatero, J.: Changes in aerosol properties during spring-summer period in the Arctic troposphere, Atmos. Chem. Phys., 8, 445–462, https://doi.org/10.5194/acp-8-445-2008, 2008.
EPA: Emissions of Primary Particulate Matter and Secondary Particulate Matter Precursors, Assessment published December 2011, available at: http://www.epa.gov/ttn/chief/trends/ (last access: December 2017), CSI 003, 2011.
Esteve, A. R., Estellés, V., Utrillas, M. P., and Martínez-Lozano, J. A.: In-situ integrating nephelometer measurements of the scattering properties of atmospheric aerosols at an urban coastal site in western Mediterranean, Atmos. Environ., 47, 43–50, 2012.
Fierz-Schmidhauser, R., Zieger, P., Vaishya, A., Monahan, C., Bialek, J., O'Dowd, C. D., Jennings, S. G., Baltensperger, U., and Weingartner, E.: Light scattering enhancement factors in the marine boundary layer (Mace Head, Ireland), J. Geophys. Res., 115, D20204, https://doi.org/10.1029/2009JD013755, 2010a.
Fierz-Schmidhauser, R., Zieger, P., Gysel, M., Kammermann, L., DeCarlo, P. F., Baltensperger, U., and Weingartner, E.: Measured and predicted aerosol light scattering enhancement factors at the high alpine site Jungfraujoch, Atmos. Chem. Phys., 10, 2319–2333, https://doi.org/10.5194/acp-10-2319-2010, 2010b.
Guerreiro, C., Leeuw, F. de, Foltescu, V., Horálek, J., and European Environment Agency: Air Quality in Europe 2014 Report, Publications Office, Luxembourg, available at: http://bookshop.europa.eu/uri?target=EUB:NOTICE:THAL14005:EN:HTML (last access: 2 June 2016), 2014.
Hansen, J. E. and Travis, L. D.: Light scattering in the planetary atmosphere, Space Sci. Rev., 16, 527–610, 1974.
Henschel, S., Querol, X., Atkinson, R., Pandolfi, M., Zeca, A., Le Tertre, A., Analitis, A., Katsouyanni, K., Chanel, O., Pascal, M., Bouland, C., Haluza, D., Medina, S., and Goodman, P. G.: Ambient air SO2 patterns in 6 European cities, Atmos. Environ., 79, 236–247, 2013.
Hollander, M. and Wolfe, D. A.: Nonparametric statistical methods, 2nd Edn., Wiley, New York, 787, 1999.
IPCC: Climate Change 2014: Synthesis Report. Contribution of Working Groups I, II and III to the Fifth Assessment Report of the Intergovernmental Panel on Climate Change, edited by: Core Writing Team, Pachauri, R. K., and Meyer, L. A., IPCC, Geneva, Switzerland, 151 pp., 2014.
Kalivitis, N., Bougiatioti, A., Kouvarakis, G., and Mihalopoulos, N.: Long term measurements of atmospheric aerosol optical properties in the Eastern Mediterranean, Atmos. Res., 102, 351–357, 2011.
Karanasiou, A., Querol, X., Alastuey, A., Perez, N., Pey, J., Perrino, C., Berti, G., Gandini, M., Poluzzi, V., Ferrari, S., and de la Rosa, J.: Particulate matter and gaseous pollutants in the Mediterranean Basin: results from the MED-PARTICLES project, Sci. Total Environ., 488–489, 297–315, 2014.
Kecorius, S., Kivekäs, N., Kristensson, A., Tuch, T., Covert, D. S., Birmili, W., Lihavainen, H., Hyvärinen, A. P., Martinsson, J., Sporre, M. K., Swietlicki, E., Wiedensohler, A., and Ulevicius, V.: Significant increase of aerosol number concentrations in air masses crossing a densely trafficked sea area, Oceanologia, 58, 1–12, 2016.
Korras-Carraca, M. B., Hatzianastassiou, N., Matsoukas, C., Gkikas, A., and Papadimas, C. D.: The regime of aerosol asymmetry parameter over Europe, the Mediterranean and the Middle East based on MODIS satellite data: evaluation against surface AERONET measurements, Atmos. Chem. Phys., 15, 13113–13132, https://doi.org/10.5194/acp-15-13113-2015, 2015.
Laj, P., Klausen, J., Bilde, M., Plaß-Duelmer, C., Pappalardo, G., Clerbaux, C., Baltensperger, U., Hjorth, J., Simpson, D., Reimann, S., Coheur, P.-F., Richter, A., De Mazie, M., Rudich, Y., McFiggans, G., Torseth, K., Wiedensohler, A., Morin, S., Schulz, M., Allan, J. D., Attie, J.-L., Barnes, I., Birmili, W., Cammas, J. P., Dommen, J., Dorn, H.-P., Fowler, D., Fuzzi, S., Glasius, M., Granier, C., Hermann, M., Isaksen, I. S. A., Kinne, S., Koren, I., Madonna, F., Maione, M., Massling, A., Moehler, O., Mona, L., Monks, P. S., Müller, D., Müller, T., Orphal, J., Peuch, V.-H., Stratmann, F., Tanre, D., Tyn dall, F., Abo Riziqmm, A., Van Roozendael, M., Villani, P., Wehner, B., Wex, H., and Zardini, A. A.: Measuring atmospheric composition change, Atmos. Environ., 43, 5351–5414, https://doi.org/10.1016/j.atmosenv.2009.08.020, 2009.
Li, J., Carlson, B. E., Dubovik, O., and Lacis, A. A.: Recent trends in aerosol optical properties derived from AERONET measurements, Atmos. Chem. Phys., 14, 12271–12289, https://doi.org/10.5194/acp-14-12271-2014, 2014.
Lihavainen, H., Hyvärinen, A., Asmi, E., Hatakka, J., and Viisanen, Y.: Long-term variability of aerosol optical properties in northern Finland, Boreal Environ. Res., 20, 526–541, 2015a.
Lihavainen, H., Asmi, E., Aaltonen, V., Makkonen, U., and Kerminen, V.-M.: Direct radiative feedback due to biogenic secondary organic aerosol estimated from boreal forest site observations, Environ. Res. Lett., 10, 104005, https://doi.org/10.1088/1748-9326/10/10/104005, 2015b.
Lyamani, H., Olmo, F. J., and Alados-Arboledas, L.: Physical and optical properties of aerosols over an urban location in Spain: seasonal and diurnal variability, Atmos. Chem. Phys., 10, 239–254, https://doi.org/10.5194/acp-10-239-2010, 2010.
Lyamani, H., Olmo, F. J., Foyo, I., and Alados-Arboledas, L.: Black carbon aerosols over an urban area in south-eastern Spain: changes detected after the 2008 economic crisis, Atmos. Environ., 45, 6423–6432, 2011.
Lyamani, H., Fernández-Gálvez, J., Pérez-Ramírez, D., Valenzuela, A., Antón, M., Alados, I., Titos, G., Olmo, F. J., and Alados-Arboledas, L.: Aerosol properties over two urban sites in south Spain during an extended stagnation episode in winter season, Atmos. Environ., 62, 424–432, 2012.
Ma, N., Birmili, W., Müller, T., Tuch, T., Cheng, Y. F., Xu, W. Y., Zhao, C. S., and Wiedensohler, A.: Tropospheric aerosol scattering and absorption over central Europe: a closure study for the dry particle state, Atmos. Chem. Phys., 14, 6241–6259, https://doi.org/10.5194/acp-14-6241-2014, 2014.
Manktelow, P. T., Mann, G. W., Carslaw, K. S., Spracklen, D. V., and Chipperfield, M. P.: Regional and global trends in sulphate aerosol since the 1980's, Geophys. Res. Lett., 34, L14803, https://doi.org/10.1029/2006GL028668, 2007.
Marenco, F., Bonasoni, P., Calzolari, F., Ceriani, M., Chiari, M., Cristofanelli, P., D'Alessandro, A., Fermo, P., Lucarelli, F., Mazzei, F., Nava, S., Piazzalunga, A., Prati, P., Valli, G., and Vecchi, R.: Characterization of atmospheric aerosols at Monte Cimone, Italy, during summer 2004: source apportionment and transport mechanisms, J. Geophys. Res., 111, D24202, https://doi.org/10.1029/2006JD007145, 2006.
Marshall, S. F., Covert, D. S., and Charlson, R. J.: Relationship between asymmetry parameter and hemispheric backscatter ratio: implications for climate forcing by aerosols, Appl. Optics, 34, 6306–6311, 1995.
Molnár, A., Bécsi, Z., Imre, K., Gácser, V., and Zita Ferenczi, Z.: Characterization of background aerosol properties during a wintertime smog episode, Aerosol Air Qual. Res., 16, 1793–1804, 2016.
Müller, T., Nowak, A., Weidensohler, A., Sheridan, P., Laborde, M., Covert, D. S., Marinoni, A., Imre, K., Henzing, B., Roger, J.-C., Martins dos Santos, S., Wilhelm, R.,Wang, Y.-Q., and de Leeuw, G.: Angular illumination and truncation of three different integrating nephelometers: implications for empirical size-based corrections, Aerosol Sci. Tech., 43, 581–586, 2009.
Müller, T., Laborde, M., Kassell, G., and Wiedensohler, A.: Design and performance of a three-wavelength LED-based total scatter and backscatter integrating nephelometer, Atmos. Meas. Tech., 4, 1291–1303, https://doi.org/10.5194/amt-4-1291-2011, 2011.
Nyeki, S., Baltensperger, U., Colbeck, I., Jost, D. T., Weingartner, E., and Gäggeler, H. W.: The Jungfraujoch high-alpine research station (3454 m) as a background continental site for the measurement of aerosol parameters, J. Geophys. Res., 103, 6097–6107, 1998.
Nyeki, S., Halios, C. H., Baum, W., Eleftheriadis, K., Flentje, H., Gröbner, J., Vuilleumier, L., and Wehrli, C.: Ground-based aerosol optical depth trends at three high-altitude sites in Switzerland and southern Germany from 1995 to 2010, J. Geophys. Res., 117, D18202, https://doi.org/10.1029/2012JD017493, 2012.
Obiso, V., Pandolfi, M., Ealo, M., and Jorba, O.: Impact of aerosol microphysical properties on mass scattering cross section, J. Aerosol. Sci., 112, 68–82, https://doi.org/10.1016/j.jaerosci.2017.03.001, 2017.
O'Connor, T. C., Jennings, S. G., and O'Dowd, C. D.: Highlights of fifty years of atmospheric aerosol research at Mace Head, Atmos. Res., 90, 338–355, 2008.
Pandolfi, M., Cusack, M., Alastuey, A., and Querol, X.: Variability of aerosol optical properties in the Western Mediterranean Basin, Atmos. Chem. Phys., 11, 8189–8203, https://doi.org/10.5194/acp-11-8189-2011, 2011.
Pandolfi, M., Ripoll, A., Querol, X., and Alastuey, A.: Climatology of aerosol optical properties and black carbon mass absorption cross section at a remote high-altitude site in the western Mediterranean Basin, Atmos. Chem. Phys., 14, 6443–6460, https://doi.org/10.5194/acp-14-6443-2014, 2014a.
Pandolfi, M., Querol, X., Alastuey, A., Jimenez, J. L., Jorba, O., Day, D., Ortega, A., Cubison, M. J., Comerón, A., Sicard, M., Mohr, C., Prévôt, A. S. H., Minguillón, M. C., Pey, J., Baldasano, J. M., Burkhart, J. F., Seco, R., Peñuelas, J., van Drooge, B. L., Artiñano, B., Di Marco, C., Nemitz, E., Schallhart, S., Metzger, A., Hansel, A., Lorente, J., Ng, S., Jayne, J., and Szidat, S.: Effects of sources and meteorology on particulate matter in the Western Mediterranean Basin: an overview of the DAURE campaign, J. Geophys. Res.-Atmos., 119, 4978–5010, https://doi.org/10.1002/2013JD021079, 2014b.
Pandolfi, M., Alastuey, A., Pérez, N., Reche, C., Castro, I., Shatalov, V., and Querol, X.: Trends analysis of PM source contributions and chemical tracers in NE Spain during 2004–2014: a multi-exponential approach, Atmos. Chem. Phys., 16, 11787–11805, https://doi.org/10.5194/acp-16-11787-2016, 2016.
Pey, J., Querol, X., Alastuey, A., Forastiere, F., and Stafoggia, M.: African dust outbreaks over the Mediterranean Basin during 2001–2011: PM10 concentrations, phenomenology and trends, and its relation with synoptic and mesoscale meteorology, Atmos. Chem. Phys., 13, 1395–1410, https://doi.org/10.5194/acp-13-1395-2013, 2013.
Putaud, J. P., Raes, F., Van Dingenen, R., Brüggemann, E., Facchini, M. C., Decesari, S., Fuzzi, S., Gehrig, R., Hüglin, C., Laj, P., Lorbeer, G., Maenhaut, W., Mihalopoulos, N., Müller, K., Querol, X., Rodriguez, S., Schneider, J., Spindler, G., Ten Brink, H., Tørseth, K., and Wiedensohler, A.: European aerosol phenomenology – 2: chemical characteristics of particulate matter at kerbside, urban, rural and background sites in Europe, Atmos. Environ., 38, 2579–2595, 2004.
Putaud, J. P., Van Dingenen, R., Alastuey, A., Bauer, H., Birmili, W., Cyrys, J., Flentje, H., Fuzzi, S., Gehrig, R., Hansson, H. C., Harrison, R. M., Hermann, H., Hitzenberger, R., Hüglin, C., Jones, A. M., Kasper-Giebl, A., Kiss, G., Kousa, A., Kuhlbusch, T. A. J., Lóschau, G., Maenhaut, W., Molnar, A., Moreno, T., Pekkanen, J., Perrino, C., Pitz, M., Puxbaum, H., Querol, X., Rodriguez, S., Salma, I., Schwarz, J., Smolik, J., Schneider, J., Spindler, G., ten Brink, H., Tursic, J., Viana, M., Wiedensohler, A., and Raes, F.: A European aerosol phenomenology – 3: physical and chemical characteristics of particulate matter from 60 rural, urban, and kerbside sites across Europe, Atmos. Environ., 44, 1308–1320, 2010.
Putaud, J. P., Cavalli, F., Martins dos Santos, S., and Dell'Acqua, A.: Long-term trends in aerosol optical characteristics in the Po Valley, Italy, Atmos. Chem. Phys., 14, 9129–9136, https://doi.org/10.5194/acp-14-9129-2014, 2014.
Querol, X., Pey, J., Pandolfi, M., Alastuey, A., Cusack, M., Perez, N., Moreno, T., Viana, M., Mihalopoulos, N., Kallos, G., and Kleanthous, S.: African dust contributions to mean ambient PM10 mass-levels across the Mediterranean Basin, Atmos. Environ., 43, 4266–4277, https://doi.org/10.1016/j.atmosenv.2009.06.013, 2009.
Querol, X.,, Alastuey, A., Pandolfi, M., Reche, C., Pérez, N., Minguillón, M. C., Moreno, T., Viana, M., Escudero, M., Orio, A., Pallarés, M., and Reina, F.: 2001–2012 trends on air quality in Spain, Sci. Total Environ., 490, 957–969, https://doi.org/10.1016/j.scitotenv.2014.05.074, 2014.
Revuelta, M. A., Artiñano, B., Gómez-Moreno, F. J., Viana, M., Reche, C., Querol, X., Fernández, A. J., Mosquera, J. L., Núñez, L., Pujadas, M., Herranz, A., López, B., Molero, F., Bezares, J. C., Coz, E., Palacios, M., Sastre, M., Férnandez, J. M., Salvador, P., and Aceña, B.: Ammonia levels in different kinds of sampling sites in the central Iberian Peninsula, in: Proceedings of the 2nd Iberian Meeting on Aerosol Science an Technology, RICTA, Tarragona, Spain, 2014.
Ripoll, A., Pey, J., Minguillón, M. C., Pérez, N., Pandolfi, M., Querol, X., and Alastuey, A.: Three years of aerosol mass, black carbon and particle number concentrations at Montsec (southern Pyrenees, 1570 ), Atmos. Chem. Phys., 14, 4279–4295, https://doi.org/10.5194/acp-14-4279-2014, 2014.
Rodríguez, S., Alastuey, A., Alonso-Pérez, S., Querol, X., Cuevas, E., Abreu-Afonso, J., Viana, M., Pérez, N., Pandolfi, M., and de la Rosa, J.: Transport of desert dust mixed with North African industrial pollutants in the subtropical Saharan Air Layer, Atmos. Chem. Phys., 11, 6663–6685, https://doi.org/10.5194/acp-11-6663-2011, 2011.
Rodríguez, S., Cuevas, E., Prospero, J. M., Alastuey, A., Querol, X., López-Solano, J., García, M. I., and Alonso-Pérez, S.: Modulation of Saharan dust export by the North African dipole, Atmos. Chem. Phys., 15, 7471–7486, https://doi.org/10.5194/acp-15-7471-2015, 2015.
Rose, C., Sellegri, K., Velarde, F., Moreno, I., Weinhold, K., Wiedensholer, A., and Laj, P.: Frequent nucleation events at the high altitude station of Chacaltaya (5240 ), Bolivia, Atmos. Environ., 102, 18–29, https://doi.org/10.1016/j.atmosenv.2014.11.015, 2015.
Rotstayn, L. D., Collier, M. A., Chrastansky, A., Jeffrey, S. J., and Luo, J.-J.: Projected effects of declining aerosols in RCP4.5: unmasking global warming?, Atmos. Chem. Phys., 13, 10883–10905, https://doi.org/10.5194/acp-13-10883-2013, 2013.
Schuster, G. L., Dubovik, O., and Holben, B. N.: Angstrom exponent and bimodal aerosol size distributions, J. Geophys. Res., 111, D07207, https://doi.org/10.1029/2005JD006328, 2006.
Seinfeld, J. H. and Pandis, S. N.: Atmospheric Chemistry and Physics, John Wiley and Sons, New York, 1998.
Sen, P. K.: Estimates of regression coefficient based on Kendall's tau, J. Am. Stat. Assoc., 63, 1379–1389, 1968.
Sherman, J. P., Sheridan, P. J., Ogren, J. A., Andrews, E., Hageman, D., Schmeisser, L., Jefferson, A., and Sharma, S.: A multi-year study of lower tropospheric aerosol variability and systematic relationships from four North American regions, Atmos. Chem. Phys., 15, 12487–12517, https://doi.org/10.5194/acp-15-12487-2015, 2015.
Spindler, G., Brüggemann, E., Gnauk, T., Grüner, A., Müller, K., and Herrmann, H.: A four-year size-segregated characterization study of particles PM10, PM2.5 and PM1 depending on air mass origin at Melpitz, Atmos. Environ., 44, 164–173, 2010.
Stohl, A., Aamaas, B., Amann, M., Baker, L. H., Bellouin, N., Berntsen, T. K., Boucher, O., Cherian, R., Collins, W., Daskalakis, N., Dusinska, M., Eckhardt, S., Fuglestvedt, J. S., Harju, M., Heyes, C., Hodnebrog, Ø., Hao, J., Im, U., Kanakidou, M., Klimont, Z., Kupiainen, K., Law, K. S., Lund, M. T., Maas, R., MacIntosh, C. R., Myhre, G., Myriokefalitakis, S., Olivié, D., Quaas, J., Quennehen, B., Raut, J.-C., Rumbold, S. T., Samset, B. H., Schulz, M., Seland, Ø., Shine, K. P., Skeie, R. B., Wang, S., Yttri, K. E., and Zhu, T.: Evaluating the climate and air quality impacts of short-lived pollutants, Atmos. Chem. Phys., 15, 10529–10566, https://doi.org/10.5194/acp-15-10529-2015, 2015.
Ström, J., Umegård, J., Torseth, K., Tunved, P., Hansson, H. C., Holmen, K., Wismann, V., Herber, A., and Konig-Langlo, G.: One year of particle size distribution and aerosol chemical composition measurements at the Zeppelin Station, Svalbard, March 2000–March 2001, Phys. Chem. Earth, 28, 1181–1190, 2003.
Theil, H.: A rank invariant method of linear and polynomial regression analysis, I, II, III, P. K. Ned. Akad. A Math., 386–392, 521–525, 1397–1412, 1950.
Titos, G., Foyo-Moreno, I., Lyamani, H., Querol, X., Alastuey, A., and Alados-Arboledas, L.: Optical properties and chemical composition of aerosol particles at an urban location: an estimation of the aerosol mass scattering and absorption efficiencies, J. Geophys. Res.-Atmos., 117, D04206, https://doi.org/10.1029/2011JD016671, 2012.
Titos, G., Lyamani, H., Pandolfi, M., Alastuey, A., and Alados-Arboledas, L.: Identification of fine (PM1) and coarse (PM10−1) sources of particulate matter in an urban environment, Atmos. Environ., 89, 593–602, 2014.
Titos, G., del Águila, A., Cazorla, A., Lyamani, H., Casquero-Vera, J. A., Colombi, C., Cuccia, E., Gianelle, V., Močnik, G., Alastuey, A., Olmo, F. J., and Alados-Arboledas, L.: Spatial and temporal variability of carbonaceous aerosols: assessing the impact of biomass burning in the urban environment, Sci. Total Environ., 578, 613–625, 2017.
Tørseth, K., Aas, W., Breivik, K., Fjæraa, A. M., Fiebig, M., Hjellbrekke, A. G., Lund Myhre, C., Solberg, S., and Yttri, K. E.: Introduction to the European Monitoring and Evaluation Programme (EMEP) and observed atmospheric composition change during 1972–2009, Atmos. Chem. Phys., 12, 5447–5481, https://doi.org/10.5194/acp-12-5447-2012, 2012.
Tunved, P., Hansson, H.-C., Kerminen, V.-M., Ström, J., Dal Maso, M., Lihavainen, H., Viisanen, Y., Aalto, P. P., Komppula, M., and Kulmala, M.: High natural aerosol loading over boreal forests, Science, 312, 261–263, https://doi.org/10.1126/science.1123052, 2006.
Vaishya, A., Jennings, S. G., and O'Dowd, C.; Seasonal variation of the aerosol light scattering coefficient in marine air of the Northeast Atlantic, Adv. Meteorol., 2011, 170490, https://doi.org/10.1155/2011/170490, 2011.
Vaishya, A., Jennings, S. G., and O'Dowd, C.: Wind driven influences on aerosol light scattering in north-east Atlantic air, Geophys. Res. Lett., 39, L05805, https://doi.org/10.1029/2011GL050556, 2012.
Valenzuela, A., Olmo, F. J., Lyamani, H., Antón, M., Titos, G., Cazorla, A., and Alados-Arboledas, L.: Aerosol scattering and absorption Angström exponents as indicators of dust and dust-free days over Granada (Spain), Atmos. Res., 154, 1–13, 2015.
Van Dingenen, R., Putaud, J. P., Raes, F., Baltensperger, U., Charron, A., Facchini, M. C., Decesari, S., Fuzzi, S., Gehrig, R., Hansson, H. C., Harrison, R. M., Hüglin, C., Jones, A. M., Laj, P., Lorbeer, G., Maenhaut, W., Palgren, F., Querol, X., Rodriguez, S., Schneider, J., Ten Brink, H., Tunved, P., Tørseth, K., Wehner, B., Weingartner, E., Wiedensohler, A., and Wåhlin, P.: A European aerosol phenomenology_1: physical characteristics of particulate matter at kerbside, urban, rural and background sites in Europe, Atmos. Environ., 38, 2561–2577, 2004.
van Donkelaar, A., Randall, M., Brauer, M., Kahn, R., Levy, R., Verduzco, C., and Villeneuve, P. J.: Global estimates of exposure to fine particulate matter concentrations from satellite-based aerosol optical depth, Environ. Health Persp., 118, 847–855, https://doi.org/10.1289/ehp.0901623, 2010.
Venzac, H., Sellegri, K., Villani, P., Picard, D., and Laj, P.: Seasonal variation of aerosol size distributions in the free troposphere and residual layer at the puy de Dôme station, France, Atmos. Chem. Phys., 9, 1465–1478, https://doi.org/10.5194/acp-9-1465-2009, 2009.
Virkkula, A., Backman, J., Aalto, P. P., Hulkkonen, M., Riuttanen, L., Nieminen, T., dal Maso, M., Sogacheva, L., de Leeuw, G., and Kulmala, M.: Seasonal cycle, size dependencies, and source analyses of aerosol optical properties at the SMEAR II measurement station in Hyytiälä, Finland, Atmos. Chem. Phys., 11, 4445–4468, https://doi.org/10.5194/acp-11-4445-2011, 2011.
Vrekoussis, M., Liakakou, E., Koc-ak, M., Kubilay, N., Oikonomou,1, K., Sciare, J., and Mihalopoulos, N.: Seasonal variability of optical properties of aerosols in the Eastern Mediterranean, Atmos. Environ., 39, 7083–7094, 2005.
WMO: WMO/GAW report 227: Aerosol Measurement Procedures, Guidelines and Recommendations, 2nd Edn., 103 pp., August 2016 (WMO-No. 1177), Geneva, Switzerland, 2016.
Zanatta, M., Gysel, M., Bukowiecki, N., Müller, T., Weingartner, E., Areskoug, H., Fiebig, M., Yttri, K. E., Mihalopoulos, N., Kouvarakis, G., Beddows, D., Harrison, R. M., Cavalli, F., Putaud, J. P., Spindler, G., Wiedensohler, A., Alastuey, A., Pandolfi, M., Sellegri, K., Swietlicki, E., Jaffrezo, J. L., Baltensperger, U., and Laj, P.: A European aerosol phenomenology–5: climatology of black carbon optical properties at 9 regional background sites across Europe, Atmos. Environ., 145, 346–364, 2016.
Zieger, P., Fierz-Schmidhauser, R., Gysel, M., Ström, J., Henne, S., Yttri, K. E., Baltensperger, U., and Weingartner, E.: Effects of relative humidity on aerosol light scattering in the Arctic, Atmos. Chem. Phys., 10, 3875–3890, https://doi.org/10.5194/acp-10-3875-2010, 2010.
Zieger, P., Kienast-Sjögren, E., Starace, M., von Bismarck, J., Bukowiecki, N., Baltensperger, U., Wienhold, F. G., Peter, T., Ruhtz, T., Collaud Coen, M., Vuilleumier, L., Maier, O., Emili, E., Popp, C., and Weingartner, E.: Spatial variation of aerosol optical properties around the high-alpine site Jungfraujoch (3580 ), Atmos. Chem. Phys., 12, 7231–7249, https://doi.org/10.5194/acp-12-7231-2012, 2012.
Zieger, P., Fierz-Schmidhauser, R., Poulain, L., Müller, T., Birmili, W., Spindler, G., Wiedensohler, A., Baltensperger, U., and Weingartner, E.: Influence of water uptake on the aerosol particle light scattering coefficients of the Central European aerosol, Tellus B, 66, 22716, https://doi.org/10.3402/tellusb.v66.22716, 2014.
Zieger, P., Väisänen, O., Corbin, J. C., Partridge, D. G., Bastelberger, S., Mousavi-Fard, M., Rosati, B., Gysel, M., Krieger, U. K., Leck, C., Nenes, A., Riipinen, I., Virtanen, A., and Salter, M. E.: Revising the hygroscopicity of inorganic sea salt particles, Nat. Commun., 8, 15883, https://doi.org/10.1038/ncomms15883, 2017.