the Creative Commons Attribution 4.0 License.
the Creative Commons Attribution 4.0 License.
 | 28 May 2018
Quantification of methane sources in the Athabasca Oil Sands Region of Alberta by aircraft mass balance
Sabour Baray
Andrea Darlington
Mark Gordon
Katherine L. Hayden
Amy Leithead
Shao-Meng Li
Peter S. K. Liu
Richard L. Mittermeier
Samar G. Moussa
Jason O'Brien
Ralph Staebler
Mengistu Wolde
Doug Worthy
Aircraft-based measurements of methane (CH4) and other air pollutants in the Athabasca Oil Sands Region (AOSR) were made during a summer intensive field campaign between 13 August and 7 September 2013 in support of the Joint Canada–Alberta Implementation Plan for Oil Sands Monitoring. Chemical signatures were used to identify CH4 sources from tailings ponds (BTEX VOCs), open pit surface mines (NOy and rBC) and elevated plumes from bitumen upgrading facilities (SO2 and NOy). Emission rates of CH4 were determined for the five primary surface mining facilities in the region using two mass-balance methods. Emission rates from source categories within each facility were estimated when plumes from the sources were spatially separable. Tailings ponds accounted for 45 % of total CH4 emissions measured from the major surface mining facilities in the region, while emissions from operations in the open pit mines accounted for ∼ 50 %. The average open pit surface mining emission rates ranged from 1.2 to 2.8 t of CH4 h−1 for different facilities in the AOSR. Amongst the 19 tailings ponds, Mildred Lake Settling Basin, the oldest pond in the region, was found to be responsible for the majority of tailings ponds emissions of CH4 (> 70 %). The sum of measured emission rates of CH4 from the five major facilities, 19.2 ± 1.1 t CH4 h−1, was similar to a single mass-balance determination of CH4 from all major sources in the AOSR determined from a single flight downwind of the facilities, 23.7 ± 3.7 t CH4 h−1. The measured hourly CH4 emission rate from all facilities in the AOSR is 48 ± 8 % higher than that extracted for 2013 from the Canadian Greenhouse Gas Reporting Program, a legislated facility-reported emissions inventory, converted to hourly units. The measured emissions correspond to an emissions rate of 0.17 ± 0.01 Tg CH4 yr−1 if the emissions are assumed as temporally constant, which is an uncertain assumption. The emission rates reported here are relevant for the summer season. In the future, effort should be devoted to measurements in different seasons to further our understanding of the seasonal parameters impacting fugitive emissions of CH4 and to allow for better estimates of annual emissions and year-to-year variability.
- Article
(4169 KB) - Full-text XML
-
Supplement
(659 KB) - BibTeX
- EndNote


Methane (CH4) is a significant greenhouse gas (GHG), second in rank to carbon dioxide (CO2) in terms of its direct radiative forcing (Montzka et al., 2011; IPCC, 2013). Controlling emissions of CH4 is an attractive climate control strategy because of its shorter atmospheric lifetime (τ∼9 years) and larger global warming potential (GWP) compared to CO2 (IPCC, 2013). Emissions of CH4 include biogenic (animal husbandry, landfills, wetlands, agriculture), pyrogenic (biomass burning) and thermogenic sources (fossil fuel reservoirs). The most important sink of CH4 is reaction with the hydroxyl radical (OH) in the troposphere (Vaghjiani and Ravishankara, 1991), which produces formaldehyde (HCHO) that is subsequently photolyzed or oxidized to yield CO and eventually CO2. In addition to climate implications, CH4 also has air quality implications through its role in NOx-catalyzed ozone formation in the troposphere, especially in areas with large sources of CH4. Of recent interest are wintertime rapid ozone formation events (OFEs) seen in regions of intense oil and gas extraction (Pinto, 2009; Schnell et al., 2009) that are associated with snow coverage (Edwards et al., 2013), shallow boundary layers (Schnell et al., 2016), high levels of ozone precursors and enhanced photolysis of HCHO and other carbonyls under radical-limited conditions (Edwards et al., 2014).
The growth of the atmospheric burden of CH4 increased in the post-industrial revolution, slowed in the 1980s and 1990s (Worthy et al., 2009) and paused between 1990 and 2007, but has increased again starting in 2007, with an atmospheric growth rate of ∼ 0.4 % yr−1 from 2007–2014 in the Northern Hemisphere (Hausmann et al., 2016). Satellite observations have suggested a 30 % increase in CH4 emissions in the USA during 2002–2014 (Turner et al., 2016). The 2009–2014 trend in CH4 mixing ratios and tropospheric columns of ethane was attributed to oil and gas production in the USA (Helmig et al., 2016) and recent increases in tropospheric columns of ethane and methane have suggested the global oil and gas sector to be partially responsible (Hausmann et al., 2016). Contrasting this, a recent study suggests that North American CH4 emissions have been flat from 2000–2012 (Bruhwiler et al., 2017) and there is still ambiguity in the source versus sink role for the recent increase in atmospheric CH4 (Turner et al., 2017). The above uncertainties underline a need for better quantification of anthropogenic emissions of CH4 to the atmosphere and motivate the current study.
Emission inventories can quantify the contributions of specific sources to the atmosphere. However, bottom-up inventories benefit from top-down measurements and validation (Fujita et al., 1992) due to the difficulty in identifying all possible points of emission and quantifying all emissions in a large complex source (e.g., a city or a facility). Top-down measurements of various types have long been used in the validation of emission inventories and emission models including comparison of surface-based pollutant profiles and ratios (Fujita et al., 1992, 1995; Jiang et al., 1997), source-receptor methods (Scheff and Wadden, 1993; Fujita et al., 1995; McLaren et al., 1996), aircraft-based flux measurements (Mays et al., 2009), measurement–modeling hybrid methods (Allen et al., 2004; Shephard et al., 2015) and satellite measurements (McLinden et al., 2012, 2014; Turner et al., 2016; Kort et al., 2014; Jacob et al., 2016). Multiple studies have suggested the underestimation of CH4 emissions from natural gas infrastructure (Brandt et al., 2014; Hendrick et al., 2016). Several recent aircraft studies using mass-balance approaches have quantified CH4 emissions in oil and gas regions and compared these to inventory emission rates and/or leakage rates (Karion et al., 2013, 2015; Peischl et al., 2013, 2015, 2016; Lavoie et al., 2015). Other studies have used top-down satellite measurements to quantify the emission of CH4 in oil and gas regions (Schneising et al., 2014; Kort et al., 2014). As such, top-down measurements of methane emissions and comparison with bottom-up inventories can make a significant contribution to our understanding of the sources of CH4.
In this study we quantify total emission rates of CH4 from facilities in the Athabasca Oil Sands Region (AOSR) of Alberta in the summer of 2013. Alberta has large deposits of oil sands, an unconventional viscous mixture of bitumen, sand, silt, clay, water and trapped gases (Stringham, 2012). Canada has proven reserves of 1.69×10¹¹ barrels of oil (2.7×10¹³ L), the third largest in the world, 97 % of which are located in the oil sands (Orbach, 2012). Approximately 82 % of the oil sands are located in the AOSR north of Fort McMurray with 20 % located in near-surface deposits (depth < 100 m) that can be mined using open pit techniques and the remainder located in deeper deposits requiring underground in situ extraction. In both cases the oil must be separated from sand, requiring the use of hot water or steam froth treatment, and organic solvent diluents (naphtha or paraffin) are used to help separate water and solids and/or to decrease the bitumen viscosity. For surface mining processes, once the bitumen is separated, process water containing unrecovered organic diluents is recycled but some is discharged in large tailings ponds open to the atmosphere for further remediation. Oil extraction in the AOSR is unique in that unlike other oil and gas regions, CH4 is not the primary economic commodity being extracted, but is an unintended by-product. In particular, a significant fraction of the CH4 is not associated with fossil fuel reserves, but is emitted from the tailings ponds (Small et al., 2015). The factors giving rise to the release of CH4 from these ponds are complex but include the organic and inorganic chemical composition of the ponds, the diversity and types of microbial communities, especially methanogens, and the age of the ponds. It is reported that it took 20 and 15 years for the largest ponds at Syncrude and Suncor, respectively, to show evidence of methane bubbling from the surface (Small et al., 2015). Additional fugitive CH4 is associated with the gaseous component of the oil sand along with other gases (Strausz and Elizabeth, 2003; Johnson et al., 2016) that are released during overburden removal, open pit mining and/or subsequent processing.
In the summer of 2013, an intensive ambient air measurement campaign took place in the AOSR with both ground and airborne components in support of the Joint Oil Sands Monitoring (JOSM) Plan (JOSM, 2012). The airborne measurements were conducted to address four objectives: (i) to measure and quantify air emissions from the oil sands mining facilities, (ii) to study the downwind physical and chemical transformation of pollutants emitted, (iii) to provide spatio-temporal measurements of pollutants suitable for intercomparison with simultaneous satellite nadir overpasses in the region, and (iv) to support air quality model prediction capabilities. In this paper, we report CH4 emissions from industrial facilities in the AOSR based on the airborne campaign. We applied the top-down emission rate retrieval algorithm (TERRA) mass-balance approach (Gordon et al., 2015) to determine total CH4 emissions rates from each of the major industrial facilities and a second mass-balance approach using downwind flight tracks to spatially separate CH4 emissions from different sources in each facility. Emissions rates of CH4 are determined for the five major facilities in the region: Syncrude Mildred Lake (SML), Suncor Energy OSG (SUN), Canadian Natural Resources Limited Horizon (CNRL), Shell Albian Muskeg River and Jackpine (SAJ) and Syncrude Aurora (SAU). These results are the first source-attributed emissions estimates for the facilities in the AOSR obtained by identifying and characterizing plume origins according to the signatures of chemical tracer species.
2.1 Instrumentation
An array of instruments for the measurement of trace gases, aerosols, meteorological and aircraft state parameters were installed aboard the National Research Council of Canada Convair 580 research aircraft. Measurements of CH4, CO2, CO and H2O were made using a cavity ring-down spectrometer (Picarro G2401-m) at an interpolated rate of approximately 0.5 Hz with a flow rate of ∼ 435 sccm min−1. The precision of the CH4 measurement was 2 ppb, and the uncertainty of the measurement at background (∼ 1.9 ppm) was 3.3 ppb (at 2 s). The instrument was calibrated six times before, during and after the project using two standard reference gases traceable to NOAA GMD standards. Methane mixing ratios are reported throughout as dry mole fractions in the paper. Necessary parameters for emissions estimation included temperature (T) measured a using Rosemount probe, dew-point temperature (Td) measured with an Edgetech hygrometer and pressure (P) measured with a Digiquartz sensor. The three-component wind speed (Ux, Uy, Uz) was derived from a Rosemount 858 probe, GPS and Honeywell HG1700 inertial measurement unit. The uncertainties of horizontal and vertical winds on the aircraft are 0.6 and 0.4 m s−1, respectively (Williams and Marcotte, 2000). Geospatial information (latitude, longitude, ellipsoid height altitude) was measured by GPS.
Nitrogen oxides (NO, NO2 and NOy) were measured with a modified trace level chemiluminescent analyzer (Thermo Scientific model 42i-TL). A molybdenum converter (325 ∘C) was used to convert NOy species to NO and an NO2-specific converter (Droplet Measurement Technologies) was used to convert NO2 to NO. Detection limits for NO, NO2 and NOy were determined to be 0.08 ppb (1 s), 0.20 ppb (2 s) and 0.09 ppb (1 s), respectively. Sulfur dioxide (SO2) was measured with a pulsed UV fluorescence analyzer (Thermo Scientific model 43i-TLE) with a detection limit of 0.7 ppb (1 s). Ambient air was drawn in through filtered 6.35 mm (1/4′′) diameter PFA tubing taken from a rear-facing inlet located on the roof toward the rear of the aircraft. Measurements of NO, NO2, NOy and SO2 were made downstream of a constant pressure inlet system maintained at 770 mmHg with a total flow rate of 5 L min−1. In-flight zero and background determinations were made several times throughout each flight and the analyzers were calibrated multiple times during the study against National Institute and Standards Technology (NIST) certified reference gases.
Refractory black carbon mass (rBC) was measured with a Droplet Measurement Technologies (DMT) single-particle soot photometer (SP2). Ambient air was subsampled from the main aerosol flow that was brought into the main cabin with a forward-facing shrouded diffuser isokinetic aerosol inlet (Cheng et al., 2018). Benzene, toluene, ethylbenzene and xylenes (BTEX) were measured by a proton transfer reaction time-of-flight mass spectrometer (PTRMS) from the main gas inlet. Further technical details are provided elsewhere (Li et al., 2017). The delay time of each instrument was determined experimentally and through calculations based on sample flow rates and inlet volumes. Total delays are contributed to by the response time of the instruments (1–3 s) and the volume of sampling tubing. Data were adjusted to account for the total delay times of 2–6 s to spatially and temporally synchronize the different measurements (Picarro delay time 6 s). The average speed of the aircraft was 90 m s−1 during the research flights, thus providing a spatial resolution of 90–270 m based upon the internal response time of each measurement.
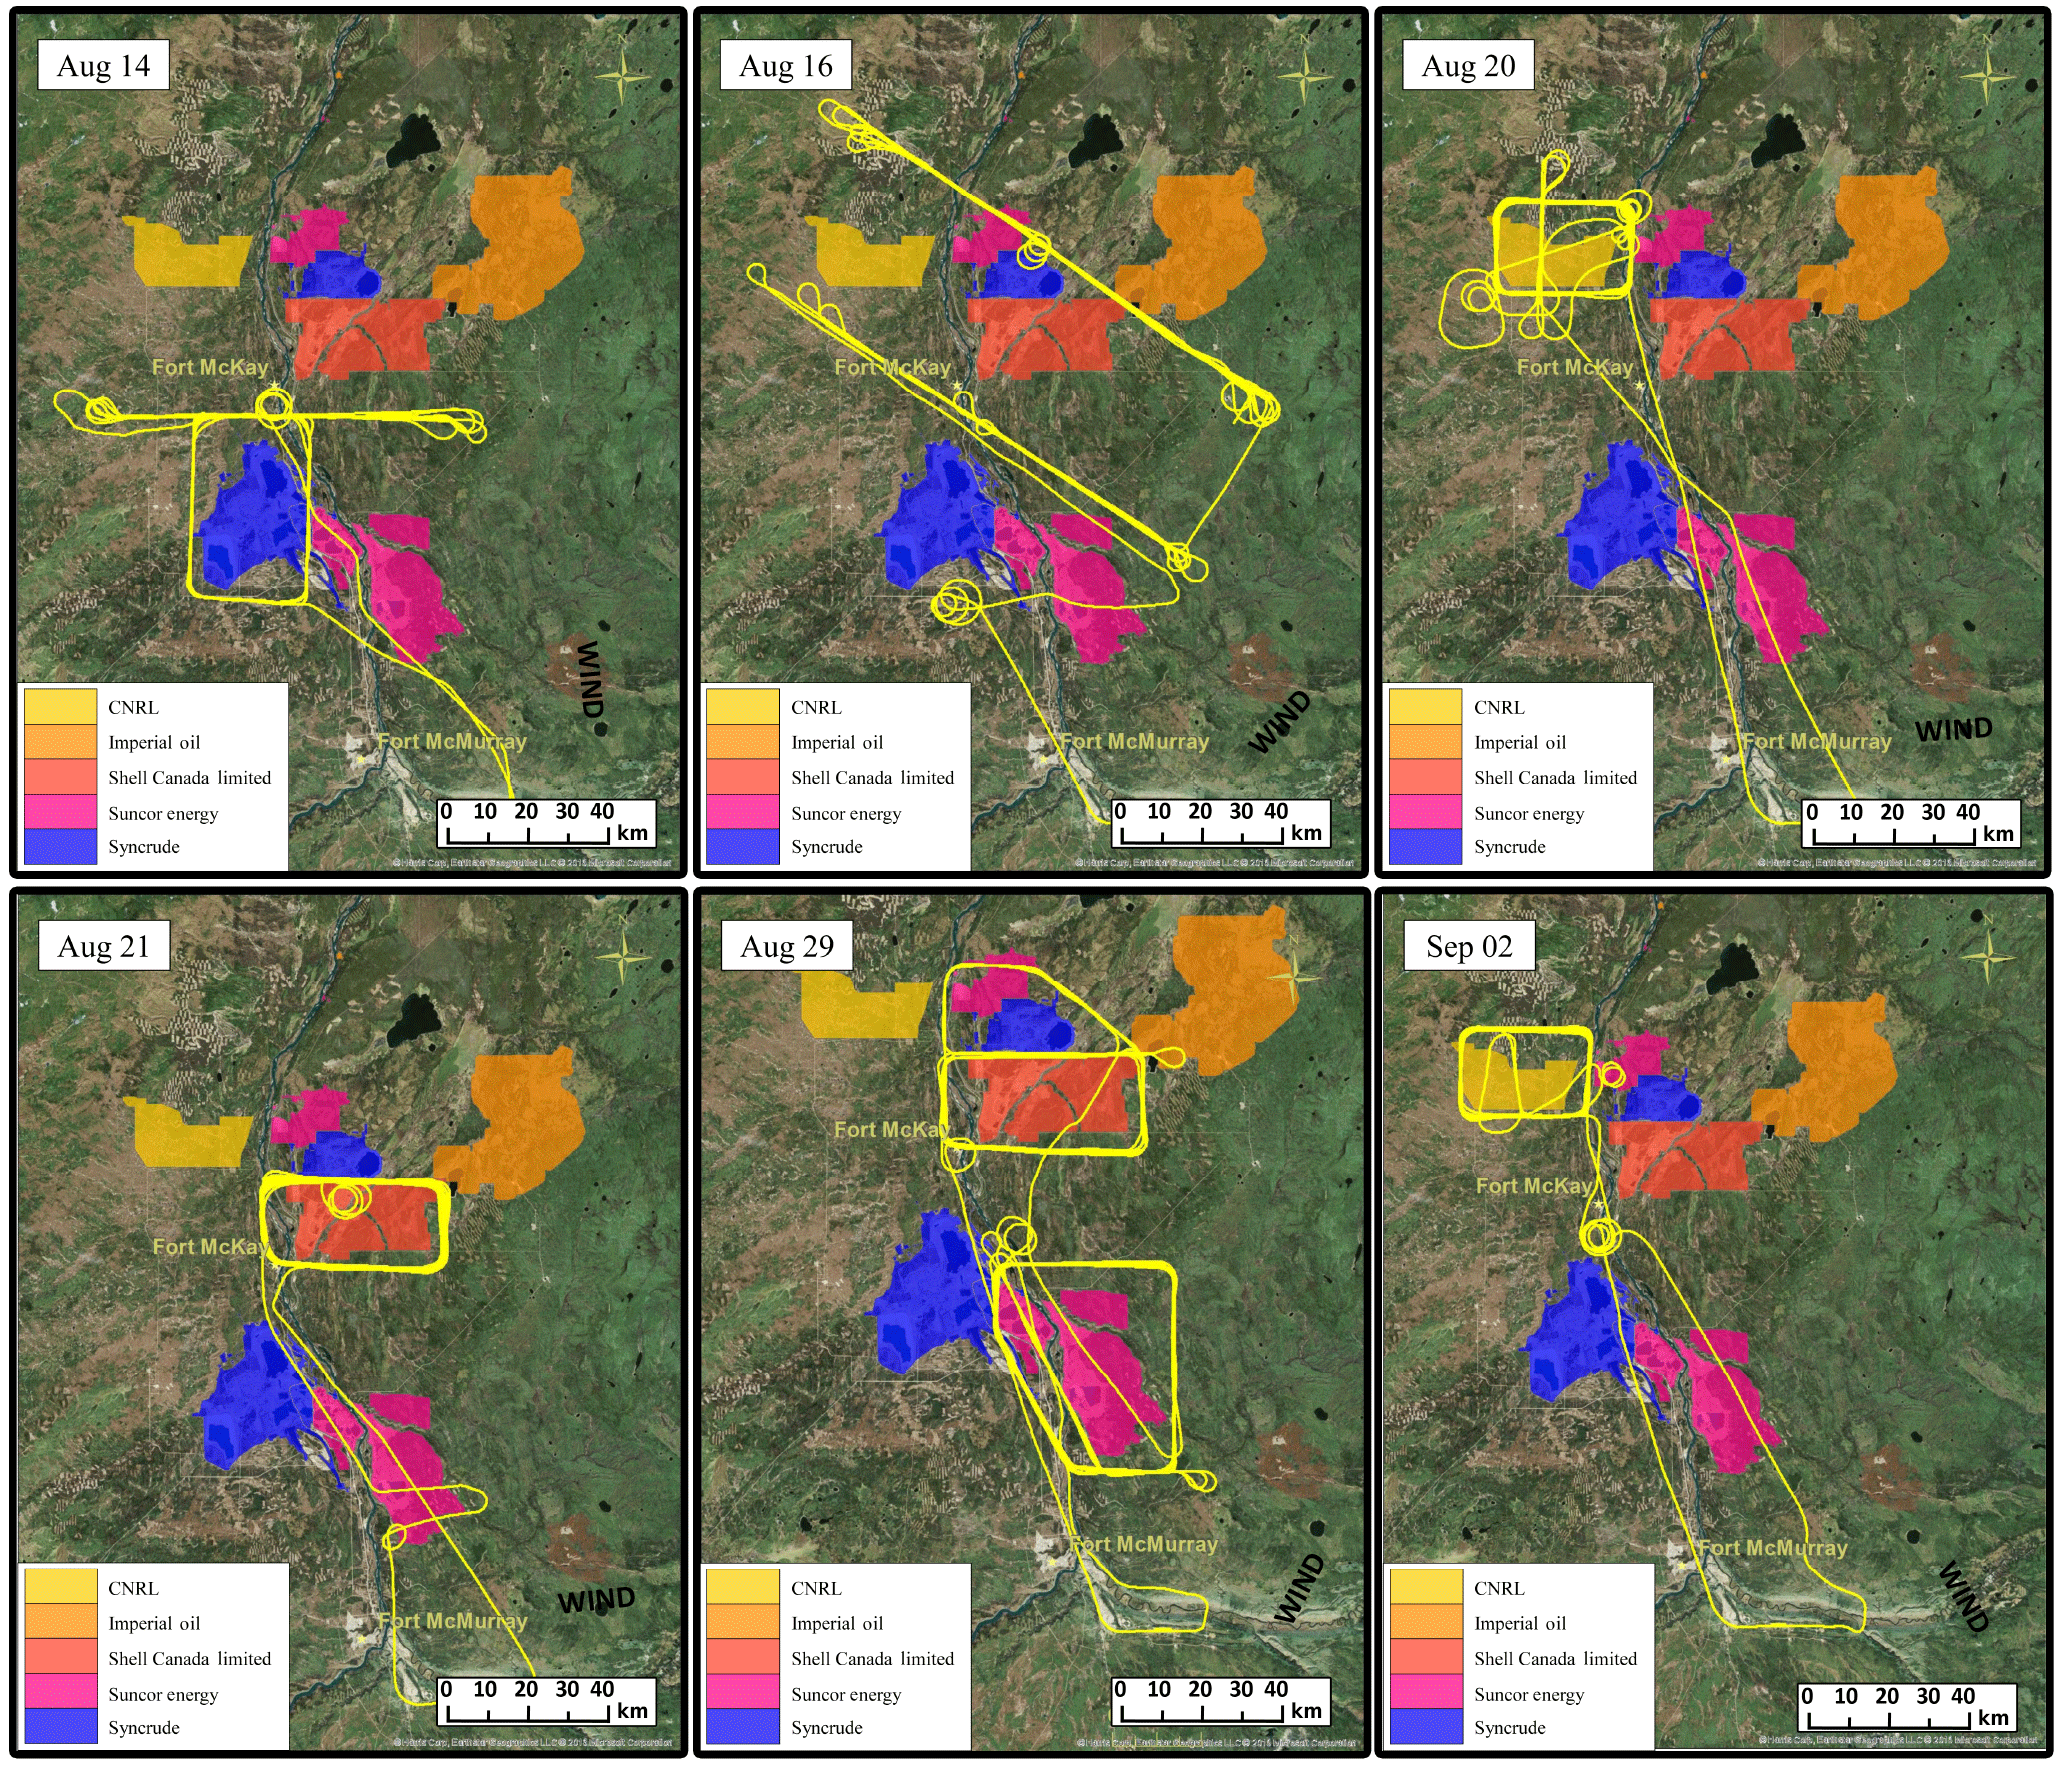
Figure 1Flight tracks from flights capturing emissions from SML (14 and 16 August), SUN (16 and 29 August), CNRL (20 August, 2 September), SAJ (21 August, 6 September not shown) and SAU (29 August, 6 September not shown). SML and SAU are shown in blue, SUN in pink, CNRL in yellow and SAJ in dark orange.
2.2 Aircraft flights
In total, there were 22 flights with 84 hours of measurements in the AOSR between 13 August and 7 September 2013. The flights were designed for three purposes: measurement of pollutant emissions from facilities (Gordon et al., 2015; Li et al., 2017), measurement of pollutant transformation downwind of the AOSR (Liggio et al., 2016) and comparison with satellite overpasses (Shephard et al., 2015). A total of 13 flights were dedicated to quantifying facility emissions with a minimum of two flights for each of the SML, SUN, CNRL, SAJ and SAU facilities. CH4 above background was not detected during the 2013 flights targeting the Imperial Kearl Lake (IKL) facility, which was not in full production mode at the time (but has since expanded significantly), or from the Suncor Firebag in situ operation. We did detect CH4 above background suspected to originate from the Suncor MacKay River operation (west of SML). We were not able to quantify this source separately; however, emissions from this source are included in one measurement of the total emissions from all mining facilities in the AOSR using a wide downwind screen (see Sect. 3.4 and Fig. 7). Several other flights are not included in the analysis due to unfavorable meteorological conditions, including wind shear problems or insufficient numbers of transects. In total, seven flights were found to be suitable for identifying and quantifying emissions of CH4 from the facilities. Figure 1 displays several of the flight tracks over and downwind of the target facilities north of the Fort McMurray airport.
The flight patterns designed for the quantification of emissions rates were of two types: (i) screen flights, wherein the aircraft flew transects perpendicular to the plume downwind of one or more facilities, and (ii) box flights, wherein the aircraft flew transects at multiple heights around a single target facility in a box-type pattern (Gordon et al., 2015; Li et al., 2017). The transects were performed at heights from 150 to 1370 m above ground level (a.g.l.), complemented by vertical profiles designed to determine the height of the planetary boundary layer (PBL) and to compare with ground-based measurements.
2.3 Mass-balance approaches for determining CH4 emissions
Following the TERRA methodology (Gordon et al., 2015), the time-resolved measurements were interpolated using covariance kriging to produce a 40 m (horizontal, s) by 20 m (vertical, z) contiguous screen of CH4 mixing ratios. Within TERRA, the CH4 mixing ratios are extrapolated from the lowest transect (∼ 150 m a.g.l.) to the surface using a constant, linear or half-Gaussian extrapolation depending on the type of source and the boundary layer conditions at the time. Uncertainty estimates (see section in the Supplement) are included according to the various types of surface extrapolation applied. Interpolated matrices were constructed for measurements of air pressure (Pair) and temperature (Tair) in order to determine the air mass balance within the box and to convert mixing ratios to mass densities. Spatially equivalent interpolations of wind velocity perpendicular to aircraft motion (U⊤) were created from the vector components of wind speed and direction measurements.
Emissions rates were determined according to the two different mass-balance approaches for screen and/or box flight patterns. Horizontal tracks at multiple altitudes flown perpendicular to the general wind direction produce a virtual screen downwind of the target that is intercepted by emission plumes from the facilities. Fluxes of CH4 moving through each 40×20 m (s×z) pixel can be determined from the interpolated matrices and integrated for a dimensional s by z target area according to Eq. (1):
where ([CH4]−[CH4]B) is the enhanced mixing ratio of CH4 above background, U⊤ is the horizontal wind velocity perpendicular to the screen (e.g., U×sin θ, θ = angle between wind vector and airplane vector), s1 and sn are the horizontal integration limits along the screen transect, and zb and zt are the bottom and top vertical integration limits. Background mixing ratios of CH4 were determined from the outside edges of the screens away from plume sources. Because [CH4]B varies with height, a vertically variant background profile was subtracted from each vertical measurement column, an approach used in other mass-balance determinations (Cambaliza et al., 2014; Karion et al., 2013). Example vertical profiles of [CH4]B(z) for each day are included in Fig. S1 in the Supplement. The simple mass-balance approach represented by Eq. (1) can be applied to individual downwind screens from other flight paths (i.e., box flights) to determine CH4 emissions from specific sources within a facility.
The second mass-balance method used in this paper is to apply the full box-model TERRA (Gordon et al., 2015) to compute total emissions from all sources within a box, which is made up of multiple (4–6) screens forming a polygon encompassing a facility. This more rigorous mass-balance approach used for calculating total emissions from a facility is represented by Eq. (2):
where EBox, the total emissions rate from all sources within a box, is the sum of the horizontal advective and turbulent fluxes (ECH and ECHT), vertical advective and turbulent fluxes (ECV and ECVT), and the change in CH4 mass within the box volume (ECM). Because the box includes screens that are downwind, upwind and lateral to sources, incoming (background) and outgoing (background + source) fluxes are determined as a part of the horizontal flux terms (ECH and ECHT). Vertical fluxes through the box top, normally ignored in the conventional mass-balance approaches (Eq. 1), are estimated according to the conservation of air mass within the box volume and the mixing ratio at the top edge of the box. ECM is estimated according to the time derivative of the ideal gas law based on measured changes in pressure and temperature over the flight time (see Gordon et al., 2015, for a full discussion).
The advantage of the box approach (Eq. 2) over the screen approach is a more precise estimate of total emissions by accounting for incoming and outgoing fluxes and meteorological effects within a volume. However, this flight pattern takes more time to completely surround a target facility. The advantage of the screen approach (Eq. 1) is the computation of CH4 fluxes per pixel, which can thus be used to spatially integrate individual emission plumes of arbitrary shapes when the sources can be spatially resolved. Studies applying aircraft mass-balance methods have used single-height transect (Karion et al., 2013; Peischl et al., 2016), single screens (Cambaliza et al., 2014; Walter et al., 2012), spiral (Wratt et al., 2001; Gatti et al., 2014) and full box flight paths (Gordon et al., 2015) for the purpose of determining emissions rates and characterizing meteorological conditions. The aircraft flights presented contained various segments of tracks that allowed applications of all the above methods. In this work we apply a systematic approach deriving information from each of these techniques for a comprehensive top-down characterization of CH4 sources and emissions in the region. Single-height transects are used to determine source chemical signatures by identifying CH4 enhancements and their associations with other trace gas species. Vertical profiles are used to determine the PBL height throughout flights. Single screens are used to determine CH4 emissions rates (Eq. 1) for facilities and their individual sources when plumes are spatially resolved. Box flights are used to determine total CH4 emissions from facilities at a lower uncertainty (Eq. 2) and source-specific emissions are determined where possible (Eq. 1).
The summertime emission rates measured in this study are reported in units of tonnes of CH4 per hour, an appropriate unit given the duration of the flights (i.e., a few hours). We do not attempt to derive annual emissions as the assumptions needed to do so are highly uncertain without measurements in other seasons for a volatile species such as CH4. However, we do make a first-order comparison to emission inventories and other studies that report emissions on an annual basis by downscaling the annual emissions to hourly emission rates using an assumption of a constant temporal factor throughout the entire year. This is appropriate for emission inventories that are based upon the measurement of emissions or emission factors in summer that then upscale their emission rates of CH4 to annual emissions using a constant temporal factor assumption (e.g., GOA, 2014). However, the assumption of a constant temporal factor is far from being validated and further measurements in different months are needed to understand the potential for seasonal variability of fugitive emissions of CH4.
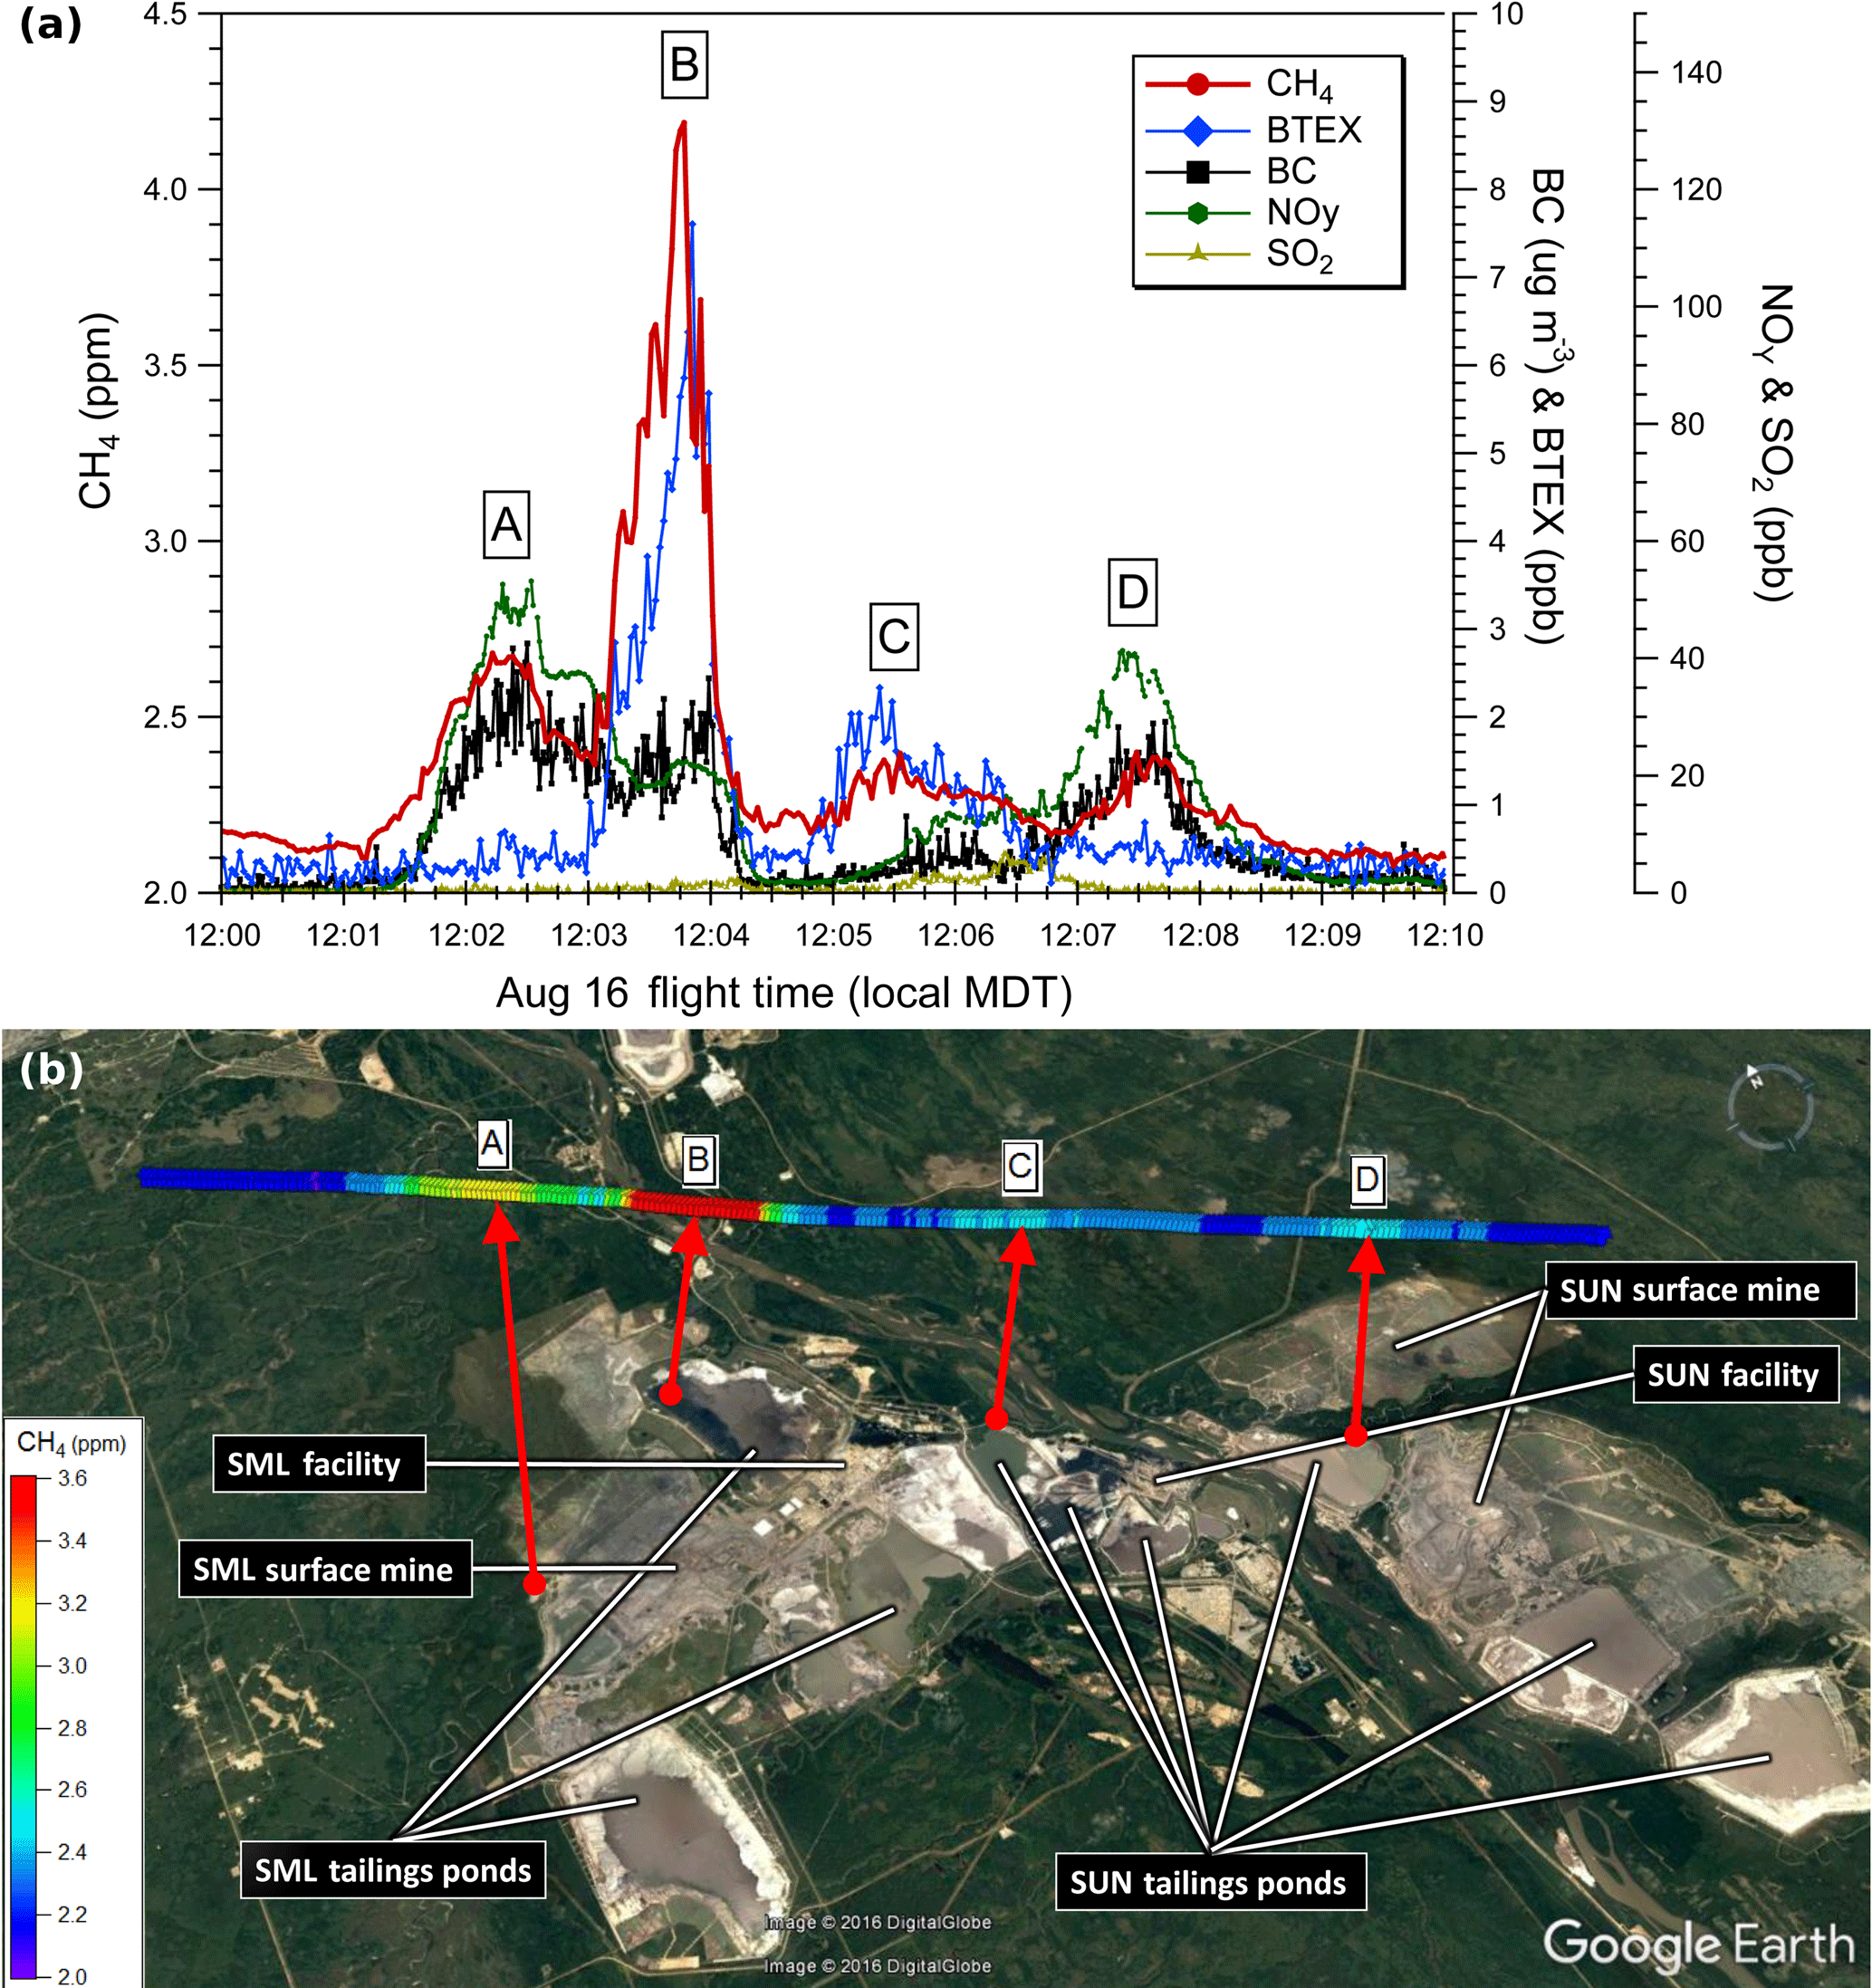
Figure 2(a) Aircraft measurements of CH4 (red), BTEX (blue) and rBC (black) from a single transect at 150 m a.g.l. downwind of SML and SUN on 16 August. Four plumes are labeled: A (SML mine), B (SML tailings), C (SUN tailings) and D (SUN mine). (b) CH4 mixing ratios along the 150 m a.g.l. transect for the above time series. Each data point is color coded for the CH4 mixing ratio and instantaneous wind vector measured on the aircraft at that location. Red arrows indicate air parcel back trajectories based on the linear back extrapolation of the aircraft-measured wind vectors at plume centers, with end points at 100 min (A) and 20 min (B–D).
Previous work shows that the box approach has a demonstrated uncertainty of 25–27 % for total emissions of CH4 from a facility in the AOSR (Gordon et al., 2015). Uncertainty due to the extrapolation of CH4 mixing ratios from the lowest height measurements to the surface was estimated to be 15 and 26 % in that study. In contrast, screen approaches used in other studies have estimated uncertainty in the range of 30–50 % (Cambaliza et al., 2014) with the main sources of error attributed to the reliability of plume characterization and the stability of meteorological conditions. In this study, uncertainties in both the box and screen estimates are reduced through (i) a high number of transects over a wide vertical range to accurately characterize vertical structure in the PBL, (ii) reliable measurements of background CH4 (or incoming fluxes for boxes), (iii) measurements of the PBL height to account for meteorological variance and (iv) measurements within time periods of minimal PBL change. In addition, the enhancement of CH4 in the plumes downwind of the facilities and the high precision of the Picarro instrument minimize uncertainties in plume characterization and background CH4. The overall uncertainty for computed CH4 emission rates for an individual determination was estimated to be less than 30 % (see the Supplement for a complete evaluation and discussion of uncertainties).
3.1 Identification of sources of CH4
Two example flights from three different facilities (SML, SUN and CNRL) are presented to demonstrate that CH4 emissions in the AOSR are mainly from three source types: open pit mining, tailings ponds and facility activities. Emissions from the remaining two facilities (SAJ and SAU) were shown to be primarily open pit mining. Source categories were identified by measurements of CH4, NOy, BTEX and rBC. Figure 2 shows measurements from one low-level transect of a screen flight on 16 August 2013 (nine transects in total). This transect was flown at a height of approximately 150 m a.g.l. downwind of the SML and SUN facilities, showing a clear separation of emission sources from the two facilities. Four distinct plumes are visible, labeled A–D, with linear air parcel back trajectories indicated by red arrows. Back trajectories were determined using the wind speeds and wind directions measured on the aircraft at flight level from the positions of maximum CH4, back extrapolated as a general indicator of plume origin. This methodology creates a western bias in our plume origins. A more careful analysis of surface winds at several meteorological stations in the local vicinity at the time of the aircraft transect shows that surface wind directions were from ∼ 140–180∘ (SE) compared to the flight level winds, ∼ 220∘ (SW). The low-level surface winds are likely channeled by the river valley, which runs in a SE to NW direction. Thus, the trajectories of air masses originating at the surface and mixing upwards have a clockwise rotation, a very local effect, placing the actual plume sources further east than the linear tracks show in Fig. 2. Plume A shows a maximum mixing ratio of 2.68 ppm CH4, which is an enhancement of ∼ 0.58 ppm above a background of ∼ 2.1 ppm on this day in this region. This enhanced CH4 is associated with values of 2.3 µg m3 rBC and 47 ppb NOy. The simple linear wind back trajectory places the origin of the air mass near the western edge of open pit surface mining activity ∼ 100 min earlier, although as mentioned the actual source is likely slightly east of that location due to the clockwise rotation of the plumes. The combination of rBC and NOy is indicative of exhaust from heavy hauler diesel trucks that operate in open pit mines. However, significant CH4 emissions are not expected from the truck exhaust, as emissions factors of CH4 from off-road gasoline and diesel combustion indicate that the CH4 ∕ CO2 emission ratio would be 1 to 2 orders of magnitude lower (Environment Canada, 2015) than the ΔCH4 ∕ ΔCO2 observed in this plume (0.58 ppm CH4 ∕ 16.1 ppm CO2). The disturbance of the oil sands at the mine faces by the trucks is a well-known source of CH4 with minor emissions of CO2 and other VOCs (Strausz and Elizabeth, 2003) as well as intermediate volatility organic compounds (Tokarek et al., 2018). Thus, Plume A is interpreted to be a combination of heavy truck exhaust, indicated by the presence of rBC and NOy, that spatially overlaps the mine face source of CH4. Plume D shows a similar chemical profile with a maximum CH4 of 2.40 ppm, ∼ 0.30 ppm above background, associated with elevated levels of NOy (40 ppb) and rBC (1.5 µg m−3). The back trajectory for Plume D is in agreement with an origin at one of two locations of open pit mining activity at SUN. The two plumes show a similar ΔNOy ∕ ΔrBC ratio within the range of 15–30 ppb per µg m−3. We consistently measure this profile of NOy and rBC enhancements from active mines across all five facilities.
Plume B (Fig. 2) shows the highest CH4 mixing ratio at 4.19 ppm, which is an enhancement of ∼ 2.09 ppm above background. The back trajectory from the position of the maximum CH4 places the air mass over the western edge of Mildred Lake Settling Basin (MLSB) tailings pond ∼ 20 min earlier. The CH4 enhancement occurs simultaneously with a decrease in NOy and rBC and an enhancement of total BTEX from ∼ 0 ppb to a maximum of 7.6 ppb. Tailings ponds are known to contain significant quantities of BTEX compounds due to waste streams of mature fine tailings containing naphtha diluent flowing into the pond (Small et al., 2015). This is similar to the chemical profile observed in Plume C, with a back trajectory placing the air mass over one of several possible SUN facility tailings ponds shown in Fig. 2 (Ponds 6, 5 and 2–3 in Small et al., 2015). This indicates the presence of CH4 emissions from multiple tailings ponds. The anaerobic digestion of organic matter in the tailings pond is the primary mechanism for the production of this biogenic CH4 (Siddique et al., 2012). For Plume C the measured mixing ratio enhancements are 0.25 ppm CH4 and 2.3 ppb of BTEX. The lower CH4 enhancement compared to Plume B suggests that less CH4 is emitted from this pond, in agreement with Small et al. (2015). The peak-to-peak CH4 ∕ BTEX ratios from Plume B and Plume C are ∼ 300 and ∼ 100 ppb ppb−1, respectively. The difference in measured inter-facility CH4 ∕ BTEX ratios could arise from a number of factors including different pond ages, history, depth, methanogenic behavior or the use of different diluents in each facility. The in-plume correlations of CH4 with the associated tracers (NOy, rBC and BTEX) for each of the Plumes identified in Fig. 2 are shown in Fig. S2 in the Supplement.
Our observations are qualitatively consistent with pond-specific industry-reported CH4 emission factors, which present SML and SUN Ponds 2–3 (Small et al., 2015) as the highest CH4-emitting tailings ponds in the region. We consistently measured relative enhancements from plumes downwind of SML and SUN according to the pattern of Plumes B and C in Fig. 2, demonstrating the feasibility of using BTEX compounds as tracers for the CH4 being emitted from tailings ponds. We expect that BTEX would be greatly reduced from the tailings ponds of those facilities using paraffinic froth treatment (e.g., SAJ) instead of naphtha. In such cases, light hydrocarbons could in principle be used as tracers for the tailings ponds emissions of CH4. However, we did not detect methane plumes above the detection limit that were distinct from the open pit mining plumes of CH4 associated with rBC and NOx for any facilities other than SML and SUN.
Elevated plumes from facility stacks are the primary sources of SO2 in the AOSR due to the bitumen upgrading process. Hence, a significant enhancement of SO2 can be used as a tracer for plant or stack CH4 sources. However, this is not measured at the height shown in Fig. 2, which shows a maximum SO2 of only 5 ppb for this transect between Plumes C and D at 150 m a.g.l. For the same flight (Fig. 2), maximum SO2 was 131 ppb for a transect ∼ 350 m above the ground, with an associated narrow peak of CH4 with a maximum mixing ratio of 2.11 ppm. While higher-altitude SO2 plumes were frequently measured downwind of various facilities over the course of the aircraft campaign, in most cases no significant CH4 enhancements were observed in these plumes. A similar case is discussed in Sect. 3.2 in which we show the full range of vertical measurements and a lack of enhanced CH4 in the SO2 plume. Ground-level CH4 from tailings ponds and open pit mine faces therefore dominates the CH4 emissions in the region, with minor contributions from industrial plants.
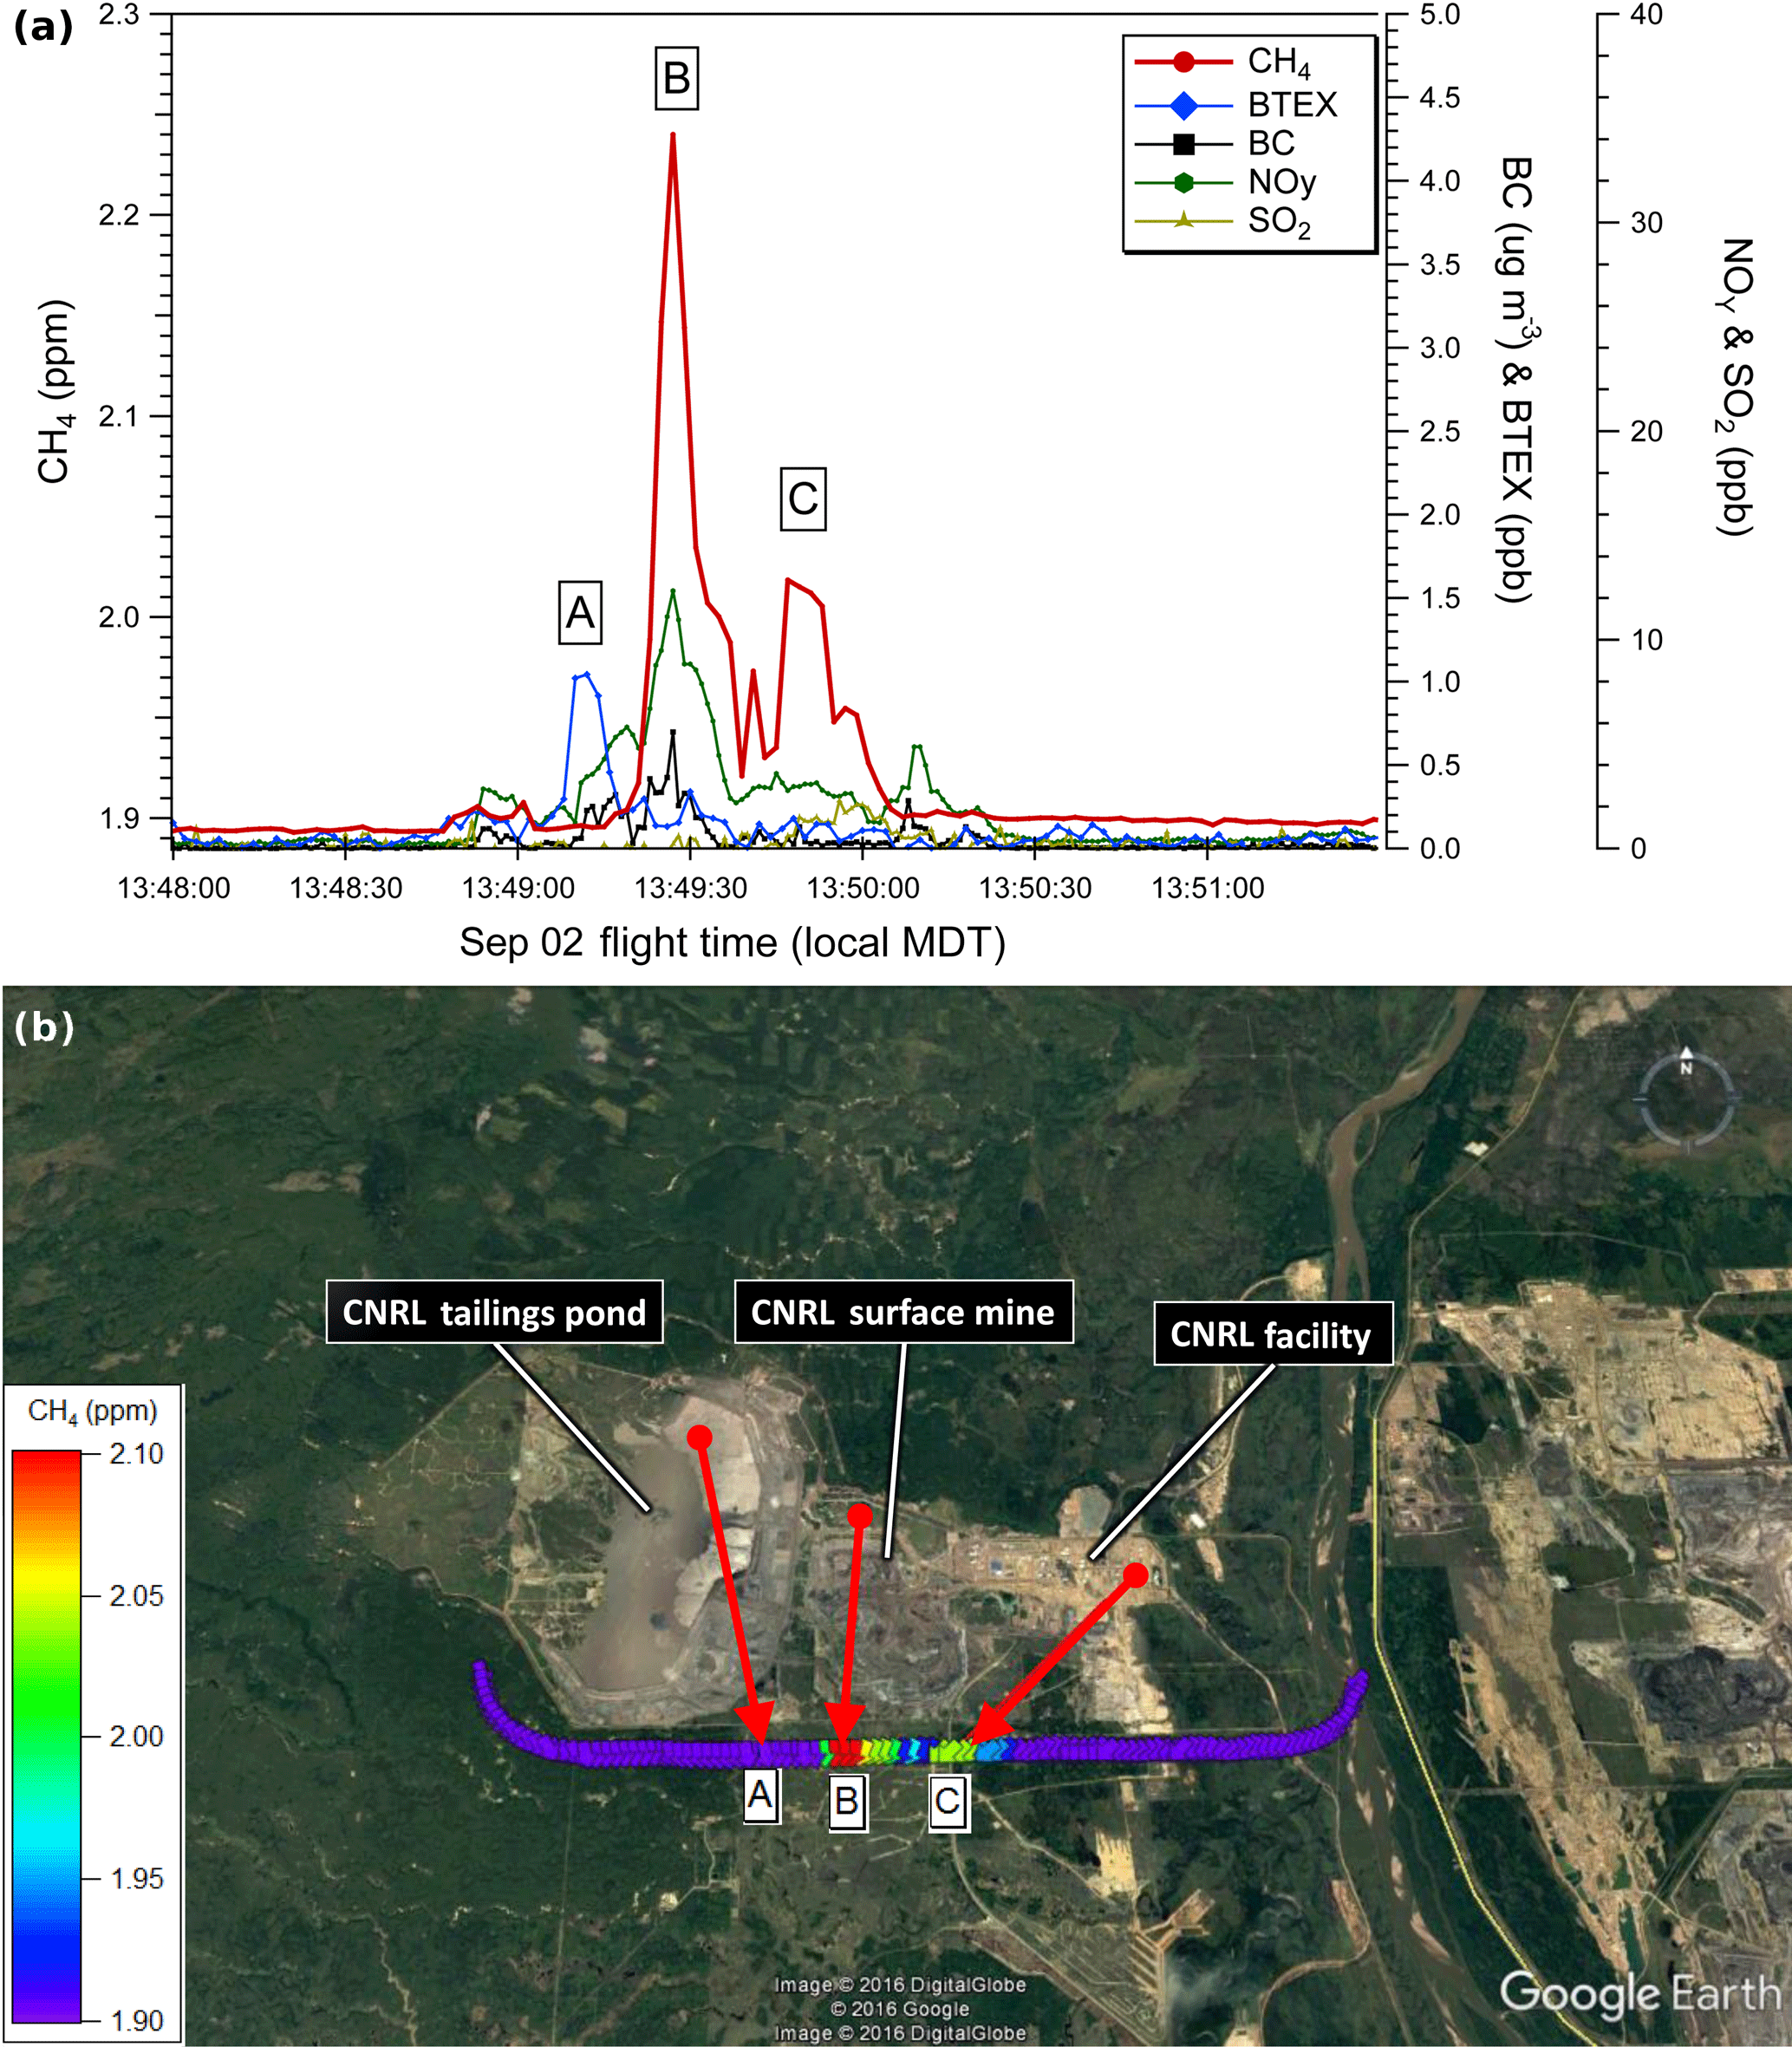
Figure 3(a) Aircraft measurements of CH4 (red), BTEX (blue) and rBC (black) from a single transect ∼ 150 m a.g.l. downwind of CNRL. Plume A (CNRL tailings pond), Plume B (CNRL mine) and Plume C CNRL facility. (b) CH4 mixing ratios along the 150 m a.g.l. transect for the above time series. Each data point is color coded for the CH4 mixing ratio and instantaneous wind vector measured on the aircraft at that location. Red arrows show back trajectories based on the linear extrapolation of measured wind speed and direction.
We next compare the profiles from SML and SUN to a third facility, CNRL Horizon. Figure 3 shows a similar transect at ∼ 150 m a.g.l. from the 2 September flight in the vicinity of CNRL. The bottom panel of Fig. 3 shows that there was considerable wind divergence at this time (see back trajectory arrows for A, B and C). This wind divergence was also present in the next pass of the aircraft on the south side of CNRL at a height of 300 m (not shown). While this divergence aids in the visualization of source separation, it invokes uncertainty in the mass-balance determinations. The emission rates on 2 September were determined using 10 transects from a flight much earlier in time than that shown in Fig. 3, when the winds were more consistent in direction (NNW).
While Plume A shows a small enhancement of ∼ 1 ppb BTEX downwind of the tailings pond, in contrast to SML and SUN no significant CH4 was associated with it. This is consistent with the pond-specific emission factors presented in Small et al. (2015) that do not list the CNRL tailings pond as a significant source of CH4. The primary Plume B included a CH4 mixing ratio up to 2.24 ppm (an enhancement of ∼ 0.34 ppm above background) associated with 12 ppb NOy and 0.7 µg m3 rBC downwind of the CNRL mine. Consistent with the previously described open pit profile and the back trajectory, we identify Plume B as an open pit mining source of CH4. A secondary Plume C was measured with a maximum CH4 of 2.02 ppm (an enhancement of ∼ 0.12 ppm) east of the open pit mine. The lack of associated species does not relate the origin of Plume C to a tailings pond or an open pit mine source of CH4. The plume is downwind of the main CNRL plant and closer in horizontal proximity to SO2 plumes measured during higher-altitude transects. This suggests a CH4 source near the main plant that could originate from venting or flaring activity, electricity cogeneration using natural gas or natural gas leakage. Thus, the primary source of CH4 from the CNRL facility is open pit surface mining activity with a secondary undetermined source from the main plant.
Table 1Enhancements of ΔC2H6 from canister measurements overlapping the CH4 plumes across three flights (14 August, 16 August and 2 September). Mean enhanced ΔCH4 is shown over the course of ∼ 20 s canister sampling times with ethane-to-methane ratios (EMRs) computed.
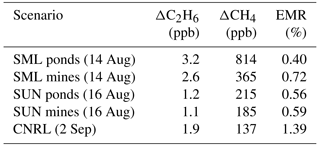
Source profiles of CH4 are further compared to measurements of ethane (C2H6). Source-attribution studies for CH4 commonly use higher ethane-to-methane ratios (EMRs) as a signature for oil and gas emissions on both a regional (Peischl et al., 2016) and global (Hausmann et al., 2016) scale, while low EMR ratios can be indicative of microbial sources of methane that do not emit ethane (agriculture, landfills, wetlands, etc.; Smith et al., 2015). C2H6, along with other VOCs, was measured from 20 s grab samples collected in 3 L Summa canisters. The VOCs were analyzed offline using GC-MS and GC-FID methods described elsewhere (Li et al., 2017). Table 1 shows C2H6 measurements from three different flights (14 August, 16 August and 2 September) when canister sampling overlapped the plume descriptions listed previously. In all cases shown, enhancements of C2H6 above background (0.8–1.5 ppb) were in the range of only 1–2 ppb, normally the highest enhancements for each flight (within 1 ppb of 95th percentile). The small emissions rates of ethane (EMRs < 1.4 %) across flights contrast with the high EMRs (i.e., 40–50 %) seen for conventional oil and gas fields in other regions of North America (Peischl et al., 2016; Smith et al., 2015) and are lower than all the possible EMR source scenarios tested in Hausmann et al. (2016). The problems associated with determining EMR ratios from a combination of continuous CH4 measurements and the discrete canister sampling of ethane from aircraft have been highlighted recently, and it was shown that actual EMR ratios determined in this way can be off by up to a factor of 2 (Smith et al., 2015). Thus, the limited EMR data shown in Table 1 are not intended to be a comprehensive measure of EMR in the AOSR but simply to support the conclusion that the major sources of methane from the facilities in the AOSR are microbial in nature without a significant co-emission of ethane. The low EMRs are consistent with previous measurements in the region (Simpson et al., 2010) and are an indication of the unique character of unconventional bitumen sources. As such, global estimates of the relative contributions of oil and gas emissions to decadal increases in atmospheric CH4 that are based on C2H6 and CH4 measurements in the free troposphere (Hausmann et al., 2016) would not capture AOSR emissions due to the low C2H6 emissions in this region.
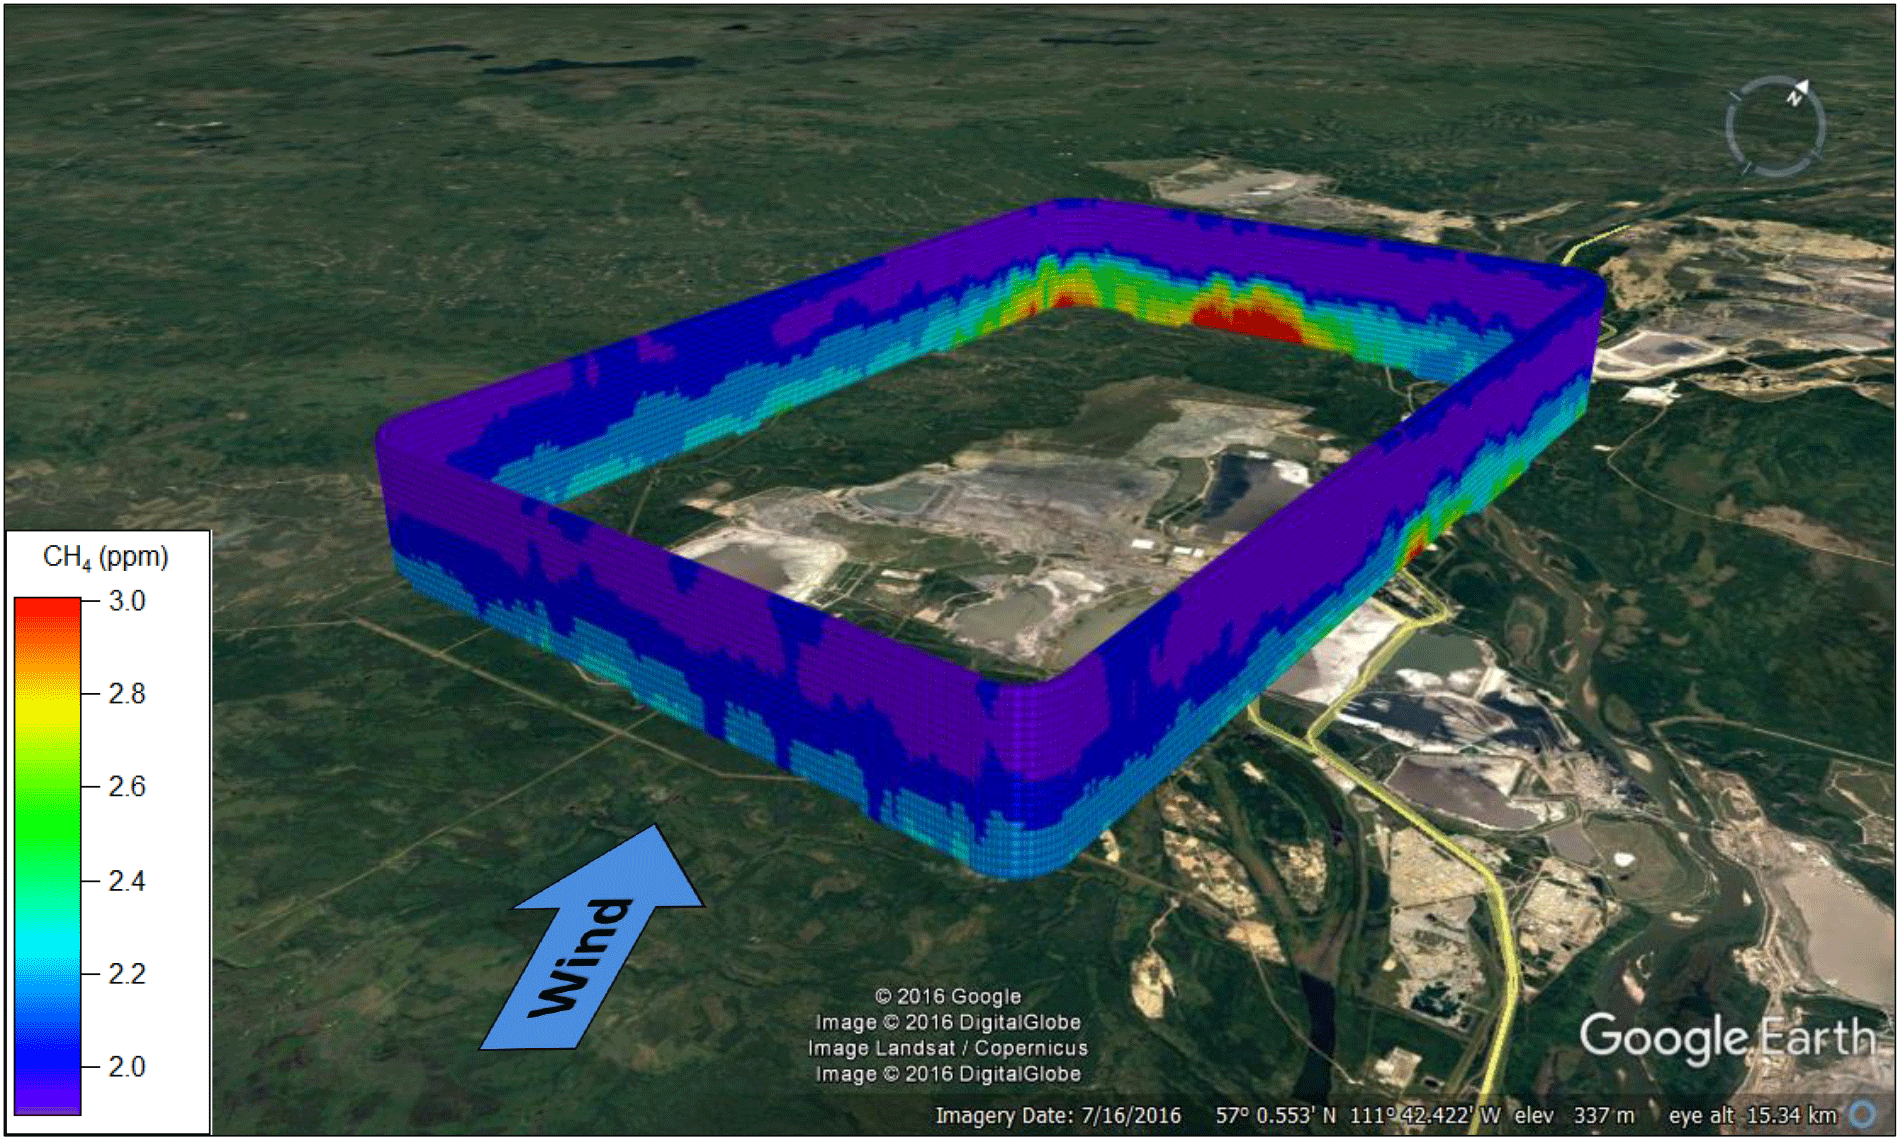
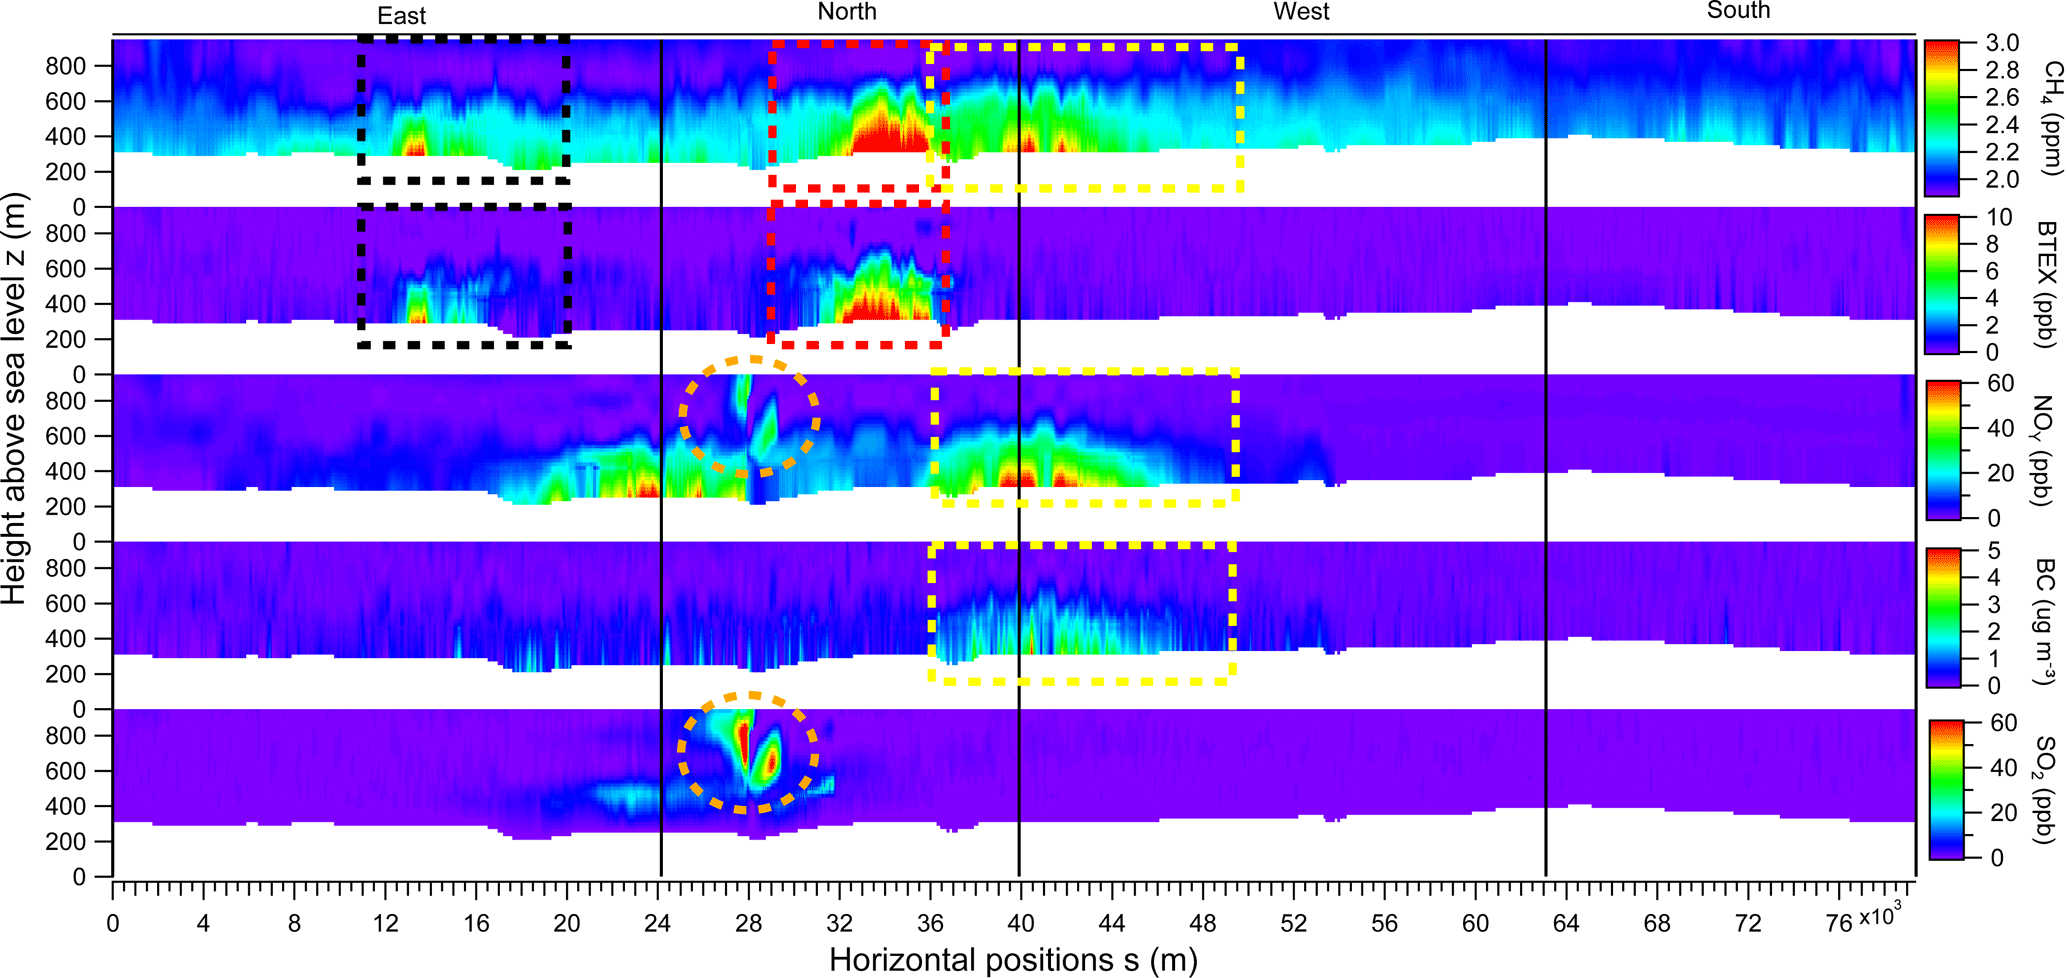
Figure 5Curtain plots showing interpolated CH4, BTEX, NOy, rBC and SO2 mixing ratios for the 14 August box flight around SML. The red-dashed box indicates the primary plume on the north screen, the yellow-dashed box indicates the secondary plume on the west screen and the black-dashed box indicates the tertiary incoming plume on the east screen. The orange dashed-circle shows the upgrader plume on the north screen.
3.2 Quantification of CH4 emission rates from sources
The source chemical profiles in Sect. 3.1 can be used in combination with the screen mass-balance method (Eq. 1) to isolate and quantify categories of AOSR emissions. As an example, we show the 14 August flight surrounding the SML facility, which consisted of a box and screen path flown in rapid succession. Figure 4 shows an image of the interpolated aircraft measurements from the box path creating a contiguous mesh superimposed on a map of the region. Winds were from the south at 186 ± 48∘ over the course of the day. Three distinct ground-based plumes of CH4 are visible: a primary plume (Plume N) on the northern screen (∼ 6500 m wide) exiting the box, a secondary plume (Plume NW) at the northwest corner (∼ 7000 m wide) exiting the box and a smaller plume (Plume E) on the eastern screen (∼ 3000 m in width) entering the box from outside the SML facility boundary. The lowest aircraft transect was at a height of ∼ 150 m a.g.l., with maximum CH4 mixing ratios of 3.00, 2.60 and 2.63 ppm, respectively, for the three plumes. Mixing ratios of CH4 below 150 m a.g.l. are based on a linear extrapolation of interpolated pixels to the surface corresponding to maximum surface mixing ratios of 3.48, 3.17 and 3.06 ppm for the primary (N), secondary (NW) and tertiary (E) plumes, respectively. Extrapolation to the surface is the primary source of uncertainty for surface sources in this method; however, the uncertainty can vary between flights depending on the meteorological conditions (Gordon et al., 2015). As a part of our uncertainty analysis in the Supplement, we have included an uncertainty associated with the differences in emission rates that arise from the use of linear, constant and half-Gaussian extrapolations in the calculations.
Unwrapped curtain plots of CH4, BTEX, NOy, rBC and SO2 from the 14 August box flight (Fig. 4) are shown individually in Fig. 5, projecting the 3-D virtual box onto a 2-D grid. The same three plumes from Fig. 4 are highlighted by dotted boxes in red (N screen), yellow (NW corner) and black (E screen). The red and yellow boxes show sources originating from within the SML facility and the black boxes show a source originating outside of the SML boundaries and entering the box from the east. The largest SML CH4 plume is associated with > 10 ppb BTEX and the absence of rBC and SO2, with some NOy (∼ 20 ppb). This is consistent with the chemical signature associated with tailings pond emissions discussed previously. The NW plume is associated with > 60 ppb of NOy and up to 5 µg m−3 of rBC, with minimal BTEX and SO2, consistent with the expected chemical signature from open pit surface mining. The smaller plume on the E screen is associated with elevated BTEX and CH4 and is likely a plume from one of the SUN tailings ponds as the winds indicate the plume is entering the box. The elevated plume in Fig. 5 (orange circles) with ∼ 100 ppb of SO2 and ∼ 30 ppb of NOy is traced to the SML upgrader activities, but with no enhancement of CH4 above background on this day. A second NOy plume is visible at the northeastern corner of the box, not associated with any of the identified CH4 source types. This NOy plume likely originates from traffic on the main highway that passes between the SML and SUN facilities and/or trucks and other vehicles operating in and around the main SML facility.
Boundaries of the plumes from separate sources are estimated using the tracer species listed in Fig. 5 by evaluating where the chemical signatures reached background levels. However, the SML tailings pond and open pit mine plumes were not completely resolved from one another, overlapping within a range of ∼ 800 m. The uncertainties in the emission rates due to plume overlap were estimated by contracting and expanding the horizontal integration boundaries (s) by 800 m on each side (a total of ± 1600 m) as part of the sensitivity analysis. A vertically varying background profile ([CH4]B(z)) is determined using data from the upwind southern screen, as mentioned previously. Using a spatially identical screen of perpendicular wind U⊤(z), the fluxes are determined through each pixel and the total source emission is calculated by integrating the pixels within the plume boundaries (Eq. 1). CH4 emissions rates are computed to be 6.4 ± 1.2 tonnes per hour (t h−1) for the SML main tailings pond and 2.7 ± 0.6 t h−1 for the SML open pit mine source. It is possible that the CH4 plume from the SML tailings pond includes CH4 emissions from the main SML plant facility (flaring, venting, natural gas leakage, etc.) that cannot be spatially separated from one another due to their proximity; however, we anticipate that the magnitude of these emissions are minor and captured within the error intervals listed.
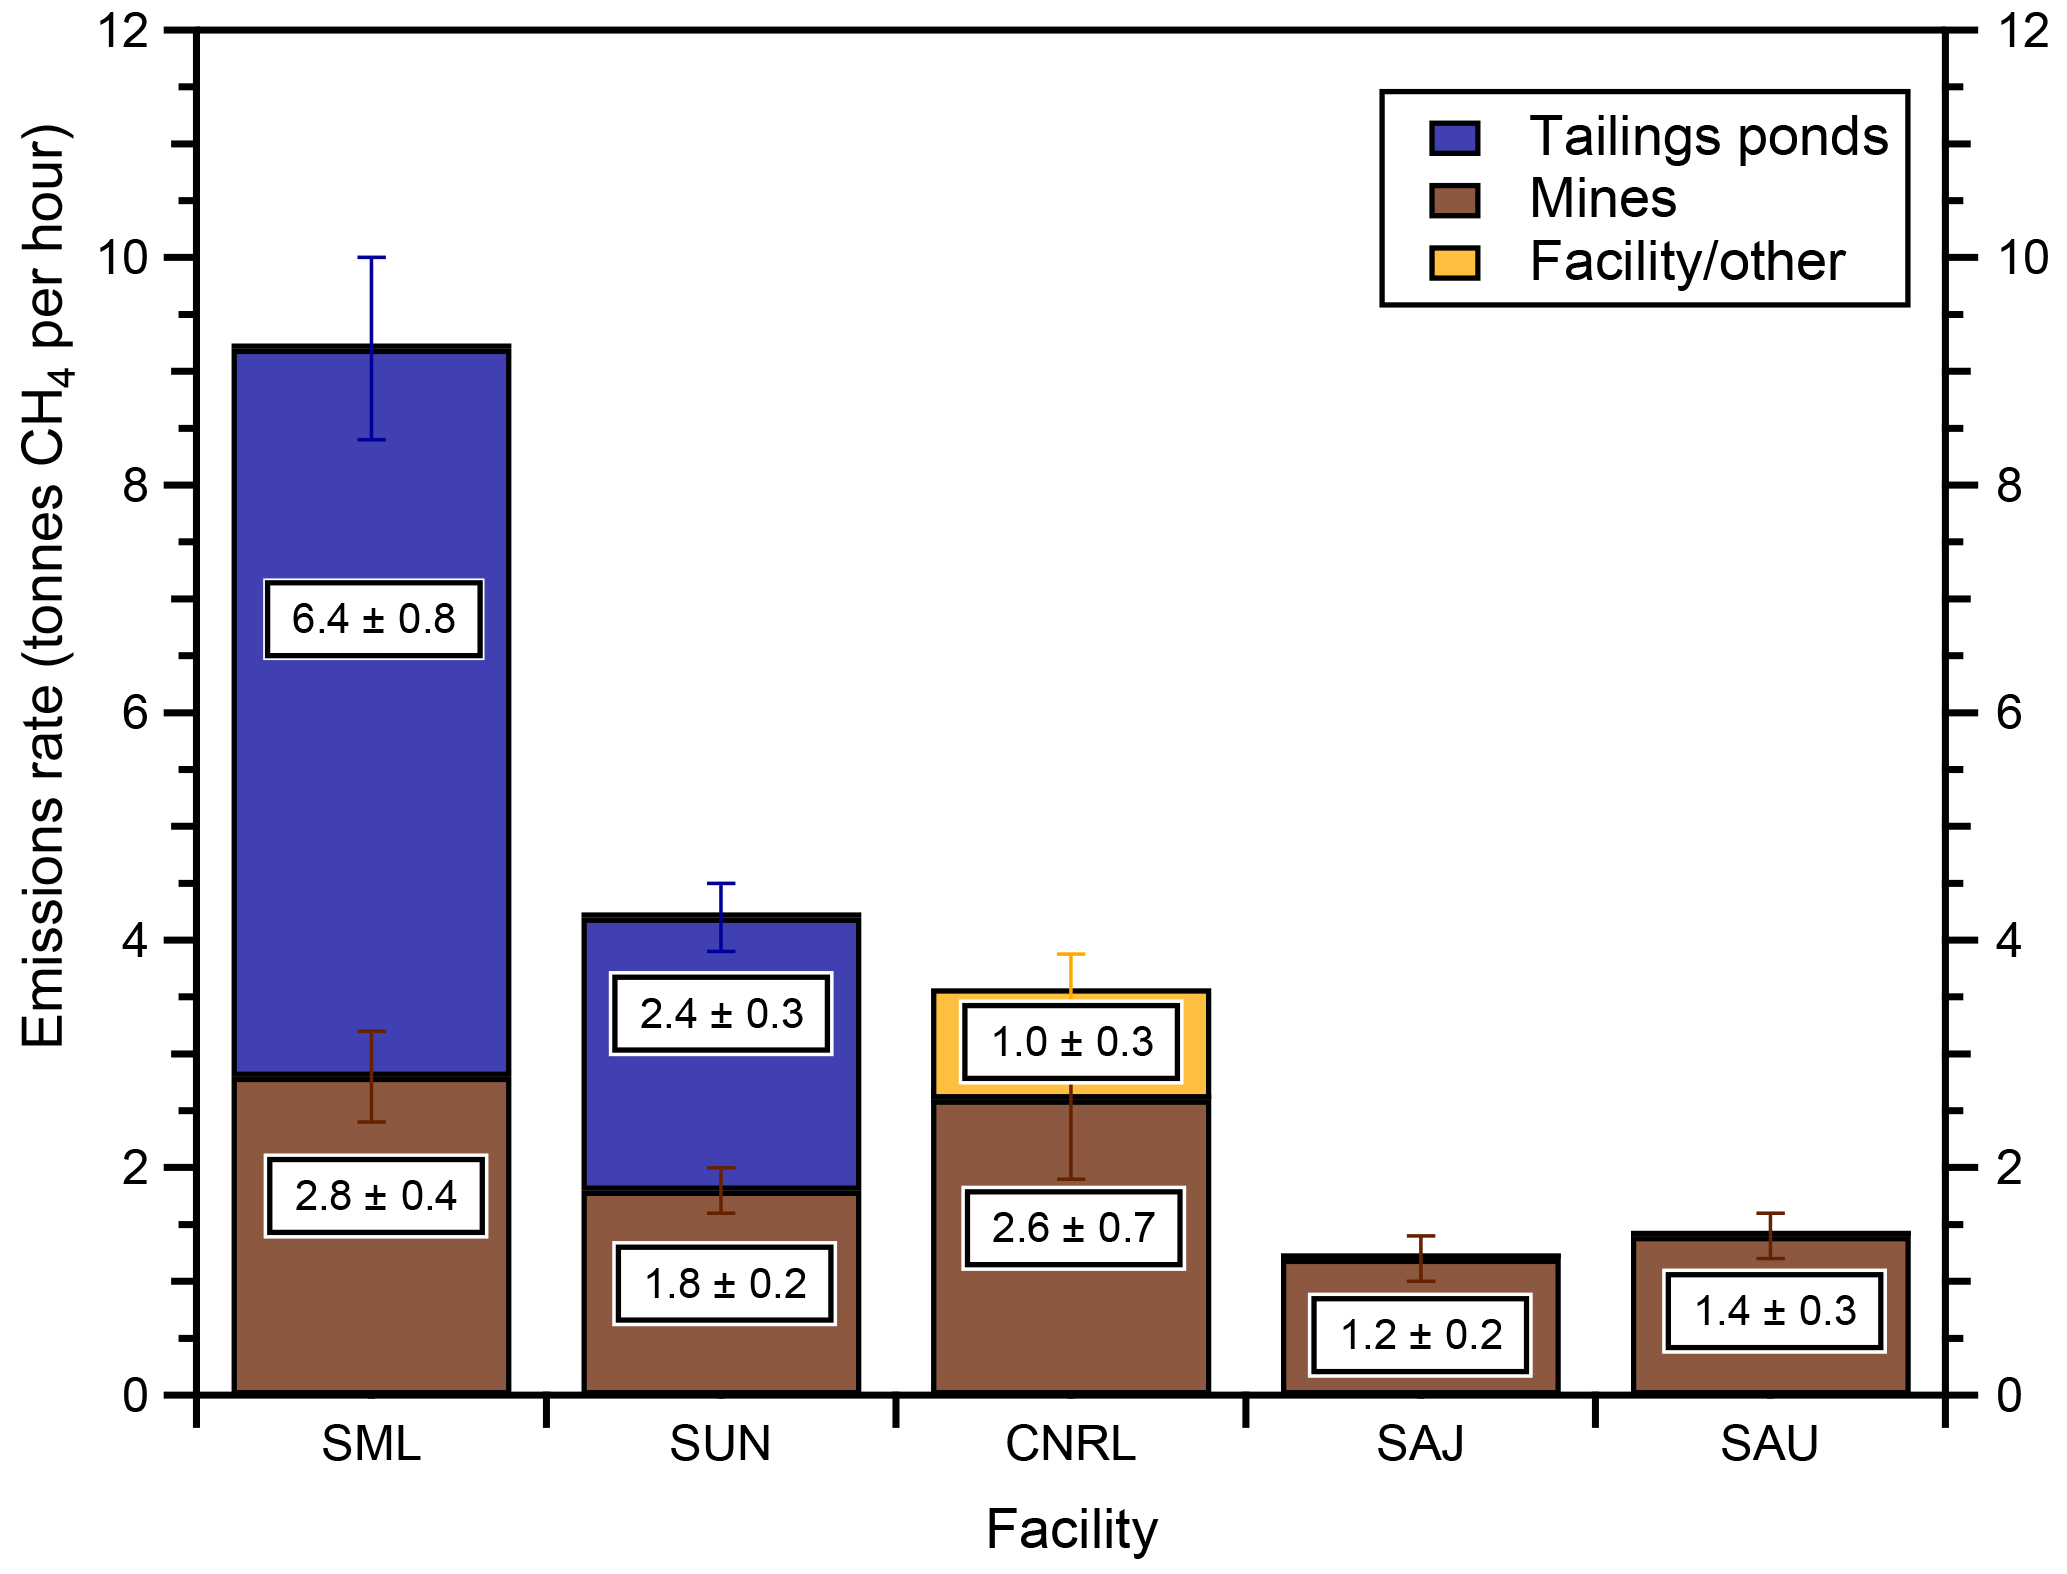
Figure 6Source-apportioned emissions rates of CH4 determined by the screen mass-balance method (Eq. 1) for the SML, SUN, CNRL, SAJ and SAU facilities. Emissions rates are the average of three mass-balance flights for SML over 2 days, two flights each for SUN, SAJ and SAU on separate days and one flight for CNRL.
This screen-based mass-balance approach for determining specific source emission rates (Eq. 1) is applied to flights with appropriate conditions for plume separation. Mean emissions rates of CH4 from specific sources within the facilities SML, SUN, CNRL, SAU and SAJ are shown in Fig. 6. SML emissions rates are the average of three mass-balance flights over 2 days (two on 14 August and one on 16 August). Two flights on separate days were used for each of the SUN (16 and 29 August), SAJ (21 August and 6 September) and SAU (29 August, 6 September) facilities. One CNRL flight (2 September) had northerly wind conditions showing plume separation on a southern screen. No significant daily variability is observed as the emissions rates for the same source agree within error. Duplicate and triplicate estimates for the same source are combined using an error-weighted uncertainty (the Supplement). SML and SUN had significant open pit mining emissions of CH4 of 2.8 ± 0.4 and 1.8 ± 0.2 t h−1, respectively, and were the only facilities with tailings ponds emissions above the detection limit, 6.4 ± 0.8 and 2.4 ± 0.3 t h−1. CNRL had open pit mining emissions (2.6 ± 0.7 t h−1) and significant emissions originating from the main plant facility (1.0 ± 0.3 t h−1). Plumes of CH4 from SAJ and SAU were only attributed to open pit emissions of 1.2 ± 0.2 and 1.4 ± 0.2 t h−1, respectively.
The plume-targeting screen mass-balance method described here is unable to resolve emissions of CH4 from multiple sources not characterized by the chemical profiles described in Sect. 3.1 if they cannot also be spatially separated. Because spatial s and z constraints are manually chosen by plume boundaries from chemical profiles, minor emissions may contribute to an overestimation of the emissions from an individual source when highly coincidental in space such that the sources are not separable. For example, the emissions from the main plant were identifiable in the case of CNRL due to the separation and orientation of the plant, the open pit and the tailings ponds with respect to the winds. This was not the case for the other major facilities in the AOSR where many of the sources were highly coincidental in space. It is possible and even likely that other major facilities in this study also have CH4 emissions from their main plants (venting, cogeneration, natural gas leakage, etc.) that are identified as tailings pond emissions or open pit emissions due to close proximity and our inability to deconvolute the sources spatially or chemically. However, we expect that the total emission rates of CH4 from each facility are still accurate.
Emissions rates from each flight and individual sources (where possible) using the screen mass-balance method are tabulated in the Supplement (Tables S1–S5). We did not measure a detectable tailings pond source of CH4 from CNRL, SAJ and SAU. Associated enhancements of rBC and NOy with CH4 suggest that the CH4 source from SAJ and SAU is also predominantly open pit mining. The results using the screen mass-balance approach (Eq. 1) are further verified in Sect. 3.3 using emissions rates for each facility determined from the box approach (Eq. 2).
Comparison to fugitive emissions literature
Average open pit surface mining emissions from the five facilities are within a range of 1.2–2.8 t h−1 (Fig. 6 and Tables S1–S5). This shows some consistency in the nature of CH4 release from open pit mining activity in the region, with differences that may possibly be attributed to the size of the surface disturbance taking place and the intensity of the mining activity. Methane emissions from open pit mines were recently estimated using a bottom-up emissions factor approach by analyzing the gaseous composition in the overburden and oil sand component of drill core samples (Johnson et al., 2016). Emissions factors of CH4 were then scaled up according to the total mass of material mined or the total bitumen produced. For 2013, Johnson et al. estimate total fugitive mining emissions in the region to be 21.4–46.0 kt of CH4 using total mined material and 33.1–85.0 kt of CH4 using total mined bitumen. Our top-down approach estimates total fugitive emissions from open pit mining to be 9.7 ± 0.9 t h−1, corresponding to 84.9 ± 7.9 kt yr−1 CH4 if constant temporal emissions are assumed. Agreement with the upper estimates in Johnson et al. (2016), despite the uncertainty associated with extrapolation to annual emissions, suggests that their bottom-up emissions factors from gases in core samples may reliably predict real-world emissions provided there is accurate characterization of CH4 in the core samples over the entire disturbed area. This is reasonable considering that it would be expected that degassing of an extremely volatile gas such as CH4 from the oil sands material would be quantitative in a short period of time after the ore is exposed or crushed.
From our 2013 measurements, only two facilities, SML and SUN, had significant emissions of CH4 from tailings ponds. Tailings ponds emissions accounted for ∼ 70 and ∼ 58 % of total CH4 from SML and SUN, respectively. This accounted for ∼ 45 % of total emissions in the AOSR. Recently, bottom-up area-weighted emissions factors of CH4 from 19 major tailings ponds in the AOSR were provided for the year 2012 (Small et al., 2015). The top three emitting ponds reported were Mildred Lake Settling Basin (MLSB) and the West In-Pit (WIP) pond within SML and Ponds 2–3 (P23) within SUN. These tailings ponds account for > 96 % of tailings pond CH4 in the region according to that study. This is qualitatively consistent with our measurements of CH4 mainly from SML and SUN. Our method requires CH4 plumes to be clearly enhanced above background, so trace amounts of CH4 from ponds in the other three facilities were not detected. This could be related to differences in the chemical composition of the process streams being released into these ponds, or it could simply be due to these ponds being younger in age, with insufficient time for the anaerobic methanogenic communities to be established (Small et al., 2015). We are unable to differentiate emissions from ponds within the same facility due to overlapping chemical profiles from ponds within close proximity. However, using the ratios of relative pond emissions rates within the same facility presented in Small et al. (2015), (i.e., MLSB contributes 92 % to SML emissions, Ponds 2–3 contribute 85 % to SUN), we can infer individual pond emissions from our measurements assuming that the relative contributions are accurate. The resulting emissions rates are 5.8 ± 0.8 t h−1 for MLSB and 2.0 ± 0.3 for Ponds 2–3. This ranks the MLSB tailings pond as the highest area source of CH4 in the AOSR, followed by the open pit mines in SML and CNRL, with Ponds 2–3 in SUN as the fourth highest. Total CH4 from tailings ponds in Small et al. (2015) is estimated to be 30.3 kt of CH4 per year, with 29.7 kt of CH4 from the SML and SUN facilities (∼ 98 %). Our total CH4 emission rate determined for tailings ponds is 8.8 ± 0.9 t h−1, which corresponds to 77.1 ± 7.9 kt yr−1 if a constant temporal factor is assumed. This is 2.3–2.9 times larger than the emissions inferred from the data in Small et al. (2015), despite the uncertainty of extrapolation to an annual emissions rate. Our measurements suggest that more work is needed to reconcile top-down and bottom-up CH4 emissions.
3.3 Emission rates of CH4 from AOSR facilities
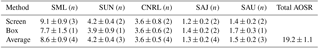
The total emissions rates of CH4 from each facility determined using the box mass-balance method (TERRA) are tabulated in the Supplement (Tables S1–S5) along with the determinations using the screen approach. Where multiple screen estimates or multiple box estimates were available, uncertainty-weighted (1/σ2) averages were determined for each method for each facility and are summarized in Table 2. While the box method is in some cases based on the same downwind measurements as the screen approach, the two methods have several key differences (described in Sect. 2.3) and are treated as independent estimates. In particular, the box method does not resolve specifically targeted, individual plumes and instead determines the net outgoing flux from the closed volume surrounding the facility. Thus, consistency between the two estimates is evidence that the primary sources of CH4 from facilities in the AOSR are tailings ponds, open pit mines and facility emissions captured by the source characterization in Sect. 3.1 and 3.2. In general, the total emissions from each facility using the screen and box methods are in agreement within uncertainty, which adds confidence to the measured emission rates reported here. In the final row of Table 2, we calculate a weighted average emission rate for each facility using all screen and box measurements. The CH4 emission rates from the facilities are 8.6 ± 0.9, 4.2 ± 0.4, 3.6 ± 0.5, 1.3 ± 0.2 and 1.5 ± 0.2 t CH4 h−1 from the SML, SUN, CNRL, SAJ and SAU facilities, respectively.
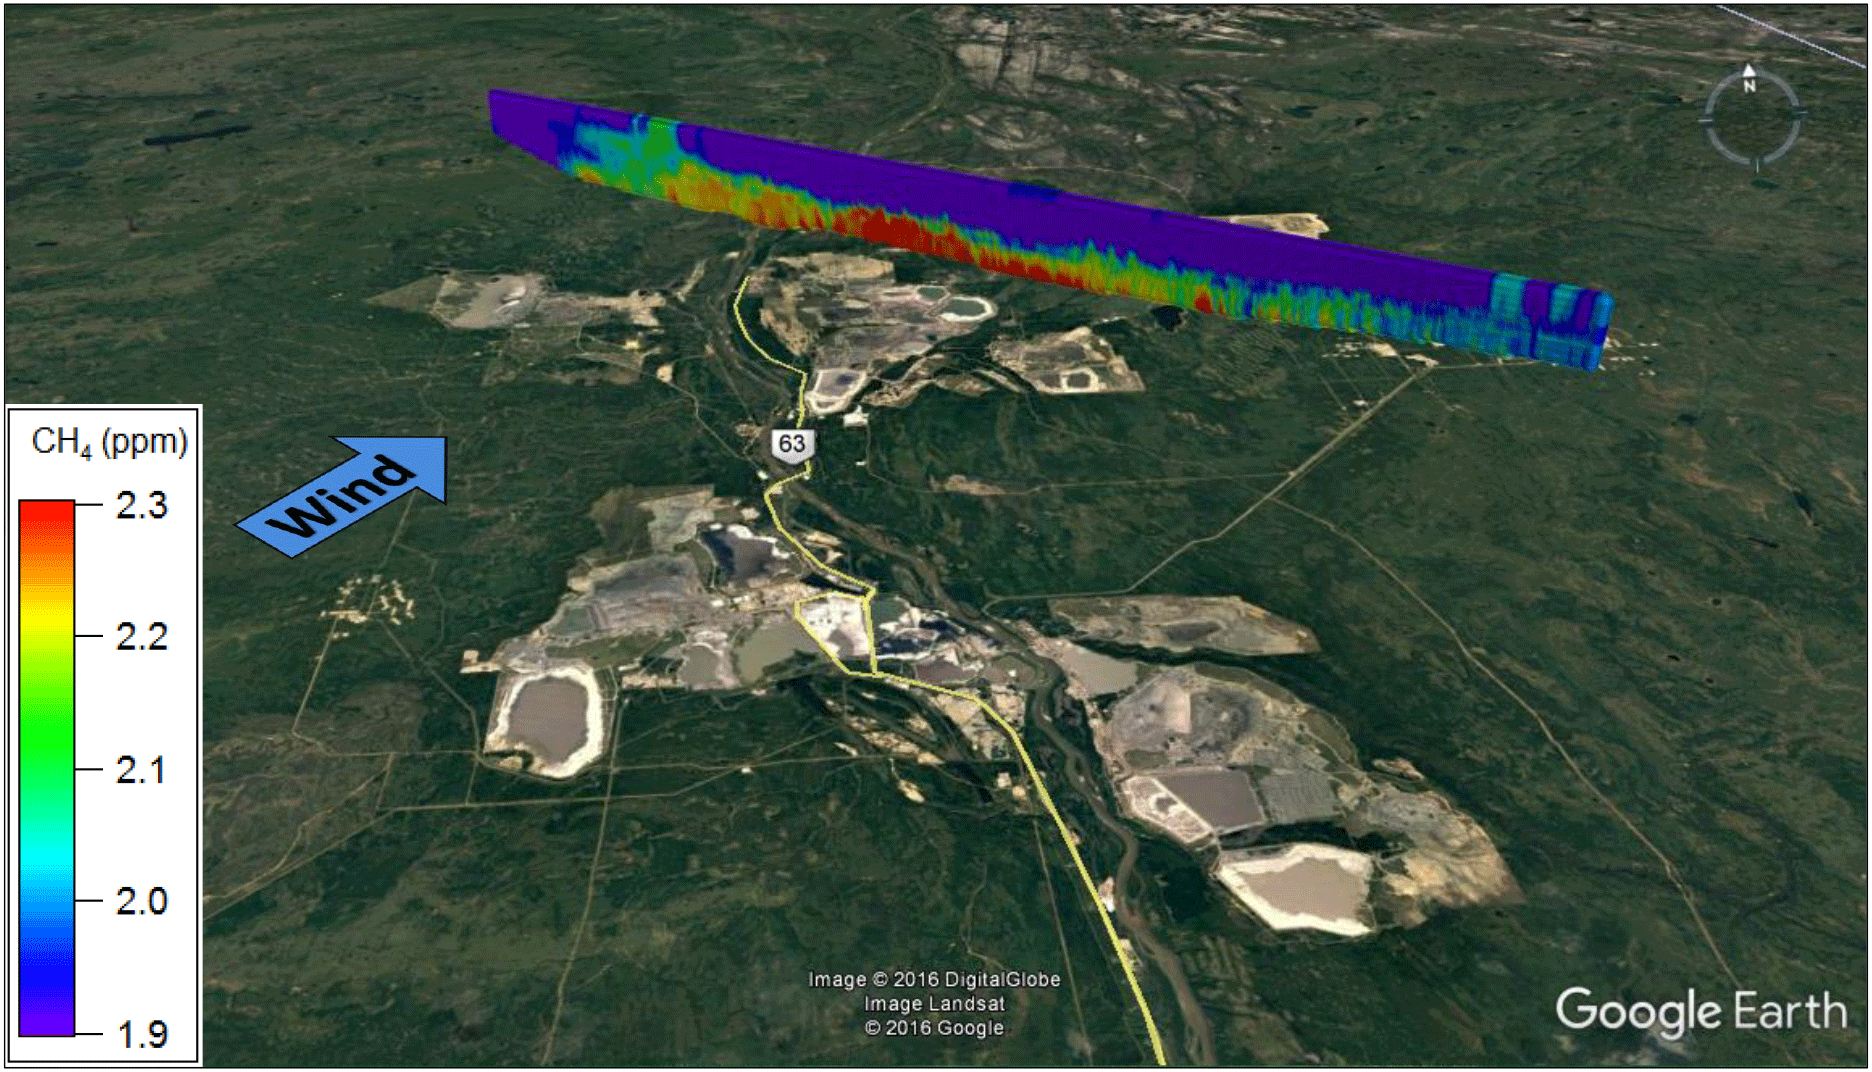
Figure 7Map image showing interpolated CH4 mixing ratios for the 16 August total oil sands screen.
Table 2Comparison of emissions rates (in t CH4 h−1) determined from the screen approach (n estimates per facility), the box approach (n estimates per facility) and the uncertainty-weighted average for each method and facility. The five-facility AOSR total is shown in the final column and row.
3.4 Total emissions of CH4 from the AOSR
The total CH4 emissions from the five mining facilities in the AOSR, obtained by summing the best estimates (i.e., uncertainty-weighted average of multiple measurements; bottom row, Table 2) of the individual facility emission rates, is given in the final row and column of Table 2. The five-facility total emission rate of CH4 is 19.2 ± 1.1 t CH4 h−1. A final independent estimate of total AOSR emissions was obtained from a flight on 16 August utilizing an independent transect screen ∼ 75 km wide (16 August Screen B) downwind of all major mining facilities in the AOSR (excluding Imperial Kearl Lake and Suncor Firebag operations, but also inclusive of any emissions from the Suncor MacKay River in situ facility). The details of this flight are given in the Supplement Table S6. The interpolated screen from the 16 August flight (total OS) is shown in Fig. 7. The screen was constructed from 10 aircraft horizontal transects from 250–900 m a.g.l. Enhancements of CH4 were measured over a wide horizontal subrange of ∼ 60 km of the entire ∼ 75 km screen. Winds were perpendicular to the plane from the southwest (225∘), showing a large flux of CH4 through the screen from upwind sources. The highest measured mixing ratios of CH4 were 2.67 ppm at the ∼ 250 m a.g.l. transect. Background CH4 in the region was ∼ 2.00 ppm taken as a vertical profile from the wings of the screen. Using the screen method (Eq. 1), the emissions rate was determined to be 23.0 ± 3.7 t CH4 h−1, which represents the emissions from all major facilities within the AOSR domain. This AOSR total is only slightly larger than the previous five-facility total emission rate of 19.2 ± 1.1 t h−1, but not statistically so, demonstrating the reproducibility of our measured estimates. It is entirely possible that there are other minor sources of CH4 included in this larger number from smaller industrial operators in the region, trucks and vehicles on the main highway, and wetland emissions. In fact, the Canadian GHGRP inventory (see Sect. 3.5) indicates that there is an additional 0.13 t CH4 h−1 emitted upwind and 0.17 t CH4 h−1 emitted downwind of the aircraft screen (Fig. 7) from minor industrial facilities within the AOSR (both numbers downscaled from the facility-reported annual emissions). The amount of CH4 emitted from vehicles on the highway, however, is expected to be smaller. The fact that the two numbers are not statistically different supports the determination that the majority of the CH4 in the AOSR is emitted from the five major industrial facilities in the region. The two values are combined here using an error-weighted uncertainty, resulting in a final AOSR facility emissions estimate of 19.6 ± 1.1 t CH4 h−1 measured during a summertime period.
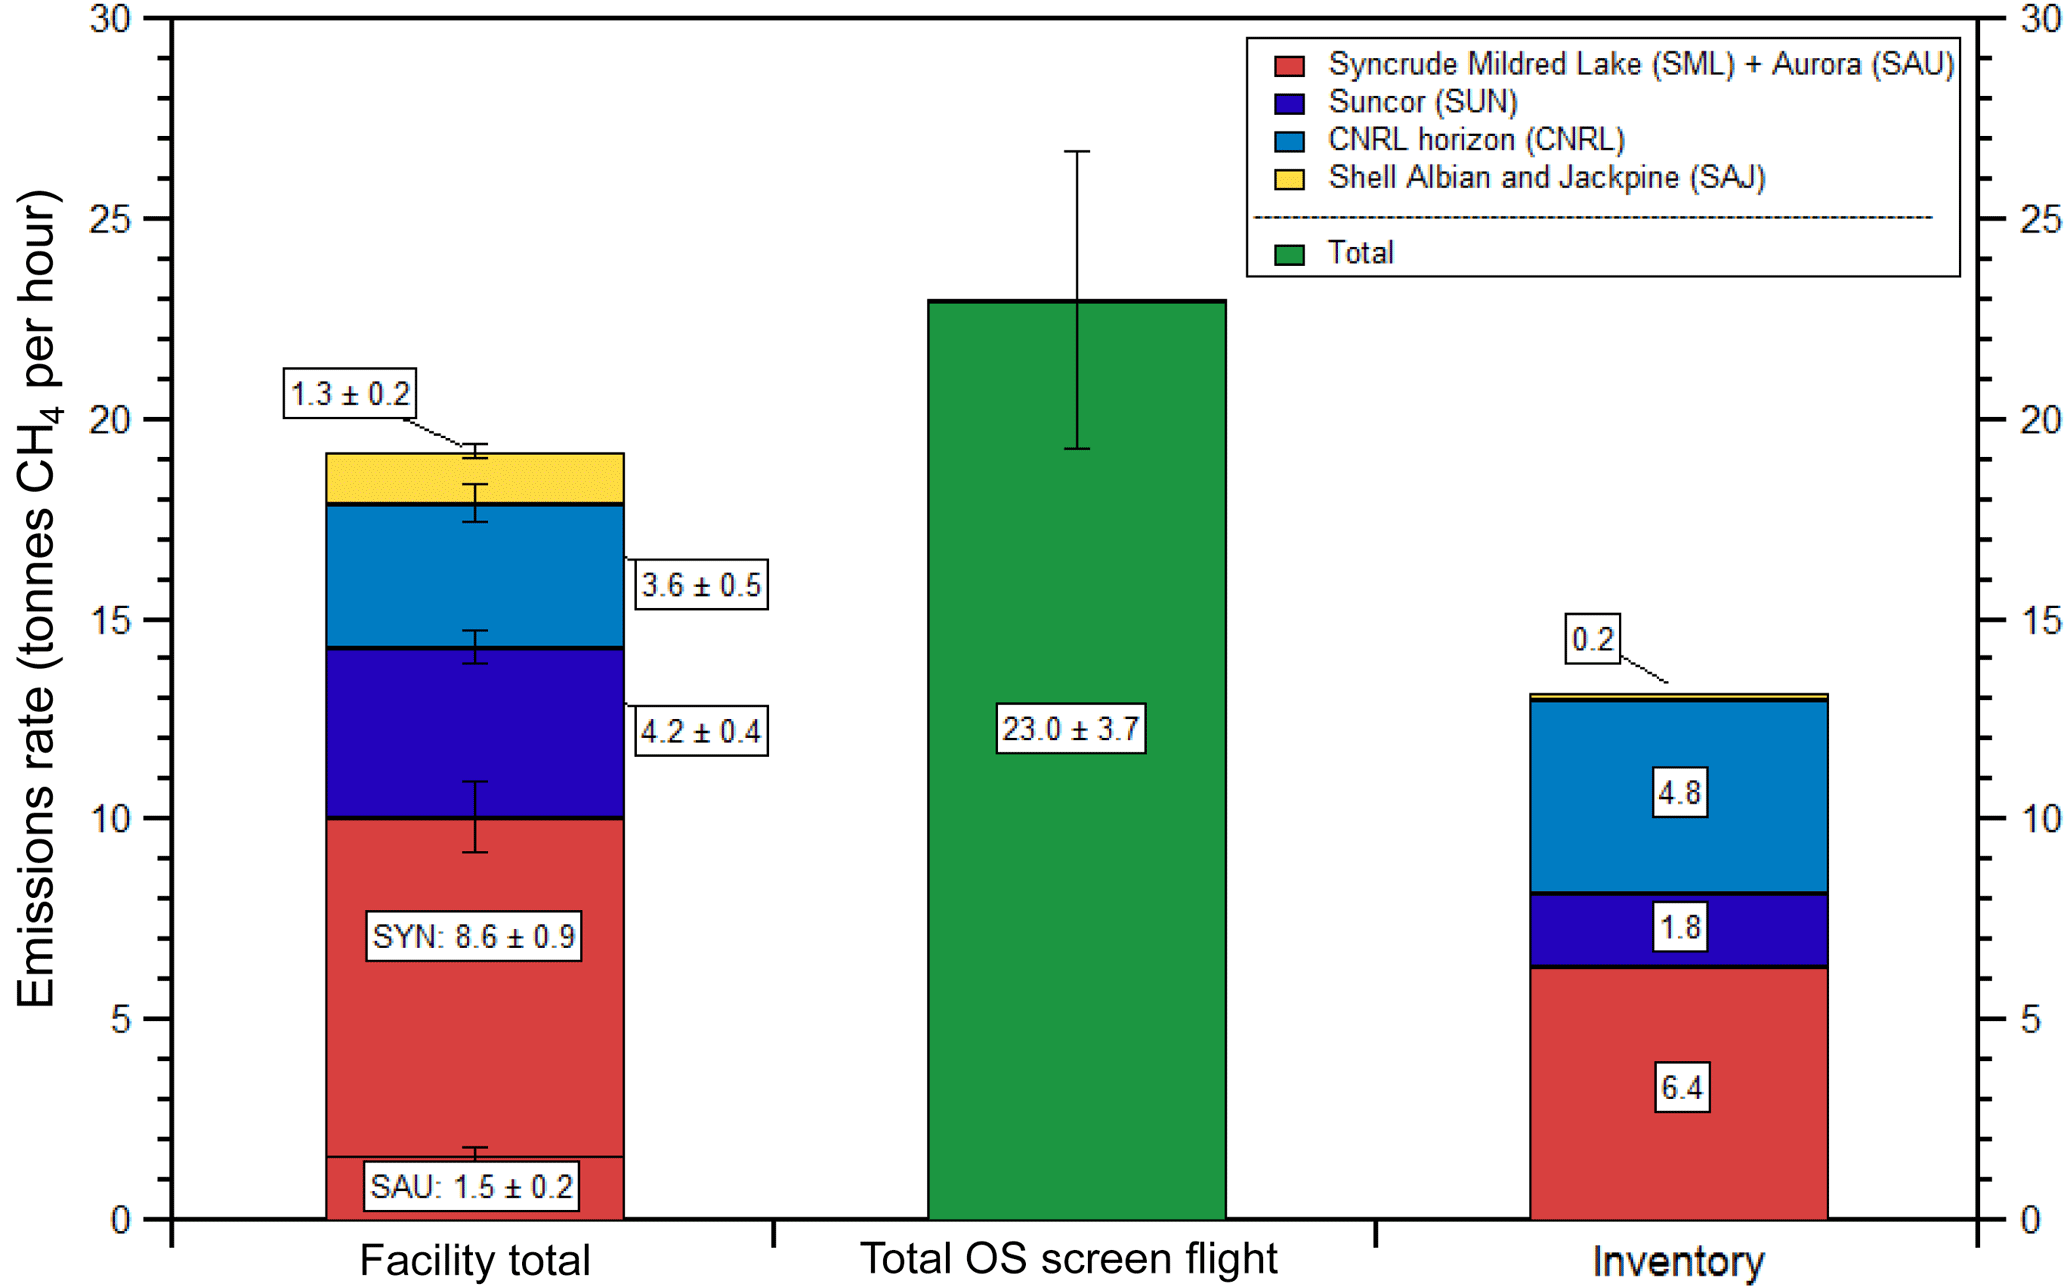
Figure 8Comparison of emissions rates determined for the five major facilities (SML, SAU, SUN, CNRL, SAJ, SAU) with the total OS screen flight (see Fig. 7 for the flight track). Also shown is the CH4 emissions taken from the Canadian GHGRP Emissions Inventory for the year 2013, scaled down from annual to hourly emissions assuming constant temporal emissions. Note that in the inventory, SML and SAU emissions are reported as a single facility, while our estimates are derived separately.
3.5 Comparison to emission inventories
Emissions of anthropogenic greenhouse gases are estimated by ECCC in Canada's GHG Inventory, which forms the basis for Canada's annual report to the United Nations Framework Convention on Climate Change, UNFCCC (ECCC, 2016). Currently, industrial facilities that emit more than 50 kt CO2 eq yr−1 are required to report their emissions annually to ECCC using the Greenhouse Gas Reporting Program (GHGRP), which is Canada's legislated, publicly accessible inventory of facility-reported greenhouse gas (GHG) data (ECCC, 2017a). Although the GHGRP inventory data are not necessarily used in Canada's GHG Inventory, changes are being proposed to expand monitoring requirements in the GHGRP, including lowering the reporting threshold to 10 kt CO2 eq yr−1 in order to enable direct use of the reported data in Canada's GHG Inventory (ECCC, 2017b). Emissions of CH4 from all five major oil sands facilities discussed in this paper are present in the GHGRP Emissions Inventory on an annual basis. The annual emission rates of CH4 extracted from the inventory were downscaled to hourly emissions rates for comparison with our measurements with an assumption of equal seasonal and diurnal profiles 365 days a year and 24 h per day for consistency with upscaling factors used to generate annual emissions (see Fig. 8). While this may be questioned, it should be noted that fugitive emissions of CH4 from mine faces and tailings ponds in the inventories are estimated based upon emission factors measured at oil sands facilities during summer months (June–September), which are then upscaled from hourly emissions to annual emissions using the same assumption that we used to downscale (365×24), as per the recommendation by the government of Alberta (GOA, 2014). Specifically, it is noted from the GOA report that emissions of gaseous species such as CH4 (and CO2) are not temperature dependent (unlike VOCs that have temperature-dependent vapor pressures; Li et al., 2017). The argument used to justify the use of a constant seasonal temporal factor in the GOA report is that temperatures at depth in a tailings pond are said to remain relatively constant throughout the year, and thus biogenic gas formation continues in the winter (GOA, 2014). For mine faces, the GHG component of the oil sand does not change with temperature and is likely released completely in a short period of time after being mined. Thus, the government recommendation to oil sand facilities in preparing annual emission estimates of fugitive GHGs is that reduction factors should not to be used in extrapolating summertime emissions over the rest of the year (GOA, 2014). Figure 8 shows a comparison of the total measured emission rates of CH4 from the five industrial facilities (2013), the total measured CH4 emission rate in the AOSR from the single downwind screen on 16 August 2013 and the sum of the facility emission rates from the Canadian GHGRP Emissions Inventory for 2013 expressed in hourly units. The combined facility emissions rate of 19.6 ± 1.1 t h−1 is approximately 48 ± 8 % higher than the five-facility total of 13.2 t h−1 extracted from the inventory for 2013. Facility-to-facility comparisons show higher measured than reported emission rates for three out of the four facilities (the SML and SAU facilities are combined as one in the inventory). In contrast, for CNRL our measured emission rate is 1.2 t h−1 lower than the inventory. Since we have determined the composition of SML, SUN and SAJ emissions to be primarily from tailings ponds and open pit mining, there appears to be an underestimation in the inventory of those particular area sources within these sites.
These discrepancies indicate a need for inventory reconciliation between the bottom-up and top-down estimates. It has been shown that it is possible to reconcile divergent bottom-up and top-down CH4 estimates for the Barnett Shale by using more comprehensive activity factors and better characterization of emissions from high emitter sites (Lyon et al., 2015) and continuous monitoring to identify these super emitters (Zavala-Araiza et al., 2015). Currently, bottom-up estimates in the AOSR are accomplished by systematic surface flux chamber measurements of area sources (surface mines, tailings ponds) to derive area-based emissions factors (GOA, 2014). While surface flux chamber measurements (Klenbusch, 1986; Conen and Smith, 1998) are estimated to be 50–124 % of the true emissions rate for a homogenous source (Klenbusch, 1986), it is unclear how the uncertainty propagates when the emissions factors are scaled to the full surface area of the heterogeneous AOSR emissions sources. The official survey protocol for open pit sources attempts to minimize the possibility of underestimating emissions by explicitly requiring fugitive surveys to include sampling at a range of locations within the open pit mine, where safe to do so, including high-priority zones (disturbed in the last week), normal-priority zones (disturbed from 1 week to 6 months ago) and low-priority zones (disturbed > 6 months ago; GOA, 2014). However, it seems that the recent core sampling methodology outlined by Johnson et al. (2016) has great promise and reduced uncertainty for estimating fugitive emissions from open pit mining.
We present a detailed approach to identifying and quantifying CH4 emission sources from the surface mining facilities in the Athabasca Oil Sands Region of Alberta in the year 2013. Emissions of CH4 are attributed to three major fugitive source types: tailings ponds, open pit mining activity and emissions from plant facilities. Our method demonstrates the use of BTEX VOCs as tracers for tailings pond CH4 plumes due to the use of diluent, and NOy and rBC as tracers for surface mining due to heavy hauler diesel trucks operating co-spatially at mine faces in the open pit mines. The combination of SO2 and NOy is used as a tracer for stack facility plumes, which are observed to contain minor but detectable quantities of CH4, although infrequently. We use the chemical signatures of sources and the screen mass-balance approach for seven flights to determine total emissions rates of 8.8 ± 0.9 t h−1 from tailings ponds, 45 % of total CH4 emissions in AOSR, 9.8 ± 0.9 t h−1 from open pit surface mining (50 %) and 1.0 ± 0.3 t h−1 primary facility-associated and other sources (5 %). Open pit mining emissions are measured from all five facilities in the range of 1.2–2.8 t h−1. In contrast amongst the 19 tailings ponds in the region, CH4 emissions above determinable levels were only measured from two facilities, SML and SUN. These emissions are likely due to two tailings ponds, MLSB (5.8 ± 0.8 t h−1) and Ponds 2–3 (2.0 ± 0.3), which are ranked amongst the highest area sources of CH4 in the region. These results demonstrate the large contributions (∼ 45 %) of a few tailings ponds sources to total fugitive CH4 emissions in the AOSR and highlight opportunities for strategic GHG mitigation. Our individual plume sum is consistent with estimates derived using the TERRA box approach to determine total emissions within facility boundaries. The agreement between these two methods demonstrates that the three source types listed are representative of the major emissions of CH4 in the AOSR. Further results from a ∼ 75 km flight screen that captured almost all AOSR emissions are able to reproduce total emissions derived from the sum of the five major facilities. Our final top-down estimate of the 2013 summertime emission rate in the region is 19.6 ± 1.1 t CH4 h−1 or 0.17 ± 0.1 Tg CH4 yr−1. We note that the annual emissions rate is only a first-order approximation of what annual emissions might be if the temporal emissions are constant throughout the year; however, we consider this assumption to be highly uncertain as the seasonality of fugitive emissions rates of CH4 in the Athabasca Oil Sands Region is still a major uncertainty. Further effort should be devoted to measurements of these emission rates in different seasons and to understand if ambient temperature and ice coverage on tailings ponds are important parameters or not. Our limited measurements of ethane and methane downwind of the AOSR facilities suggest that the EMRs are quite low, < 1.4 %, likely because the fundamental sources of the majority of the methane emissions are methanogenic, not thermogenic, in nature. Thus, global estimates of the relative contributions of oil and gas emissions to increases in atmospheric CH4 based on EMR measurements in the free troposphere would not capture AOSR emissions due to the low C2H6 emissions in the region.
The aircraft datasets from the 2013 study utilized in this analysis have been published in the Joint Oil Sands Monitoring Plan open data portal (ECCC Data, 2016).
The supplement related to this article is available online at: https://doi.org/10.5194/acp-18-7361-2018-supplement.
The authors declare that they have no conflict of interest.
This article is part of the special issue “Atmospheric emissions from oil sands development and their transport, transformation and deposition (ACP/AMT inter-journal SI)”. It is not associated with a conference.
Funding for the measurement campaign and the subsequent analysis was
provided by the Climate Change and Air Pollution Program of Environment and
Climate Change Canada and from the Canada–Alberta Joint Oil Sands Monitoring
Program. We thank the Convair 580 flight crew of the National Research
Council of Canada, especially the pilots (Paul Kissmann, Rob Erdos and Tim Leslie),
for conducting the aircraft flights. We thank the technical support
staff, especially Andrew Sheppard, and the data management team of the Air
Quality Research Division for their hard work and support throughout the
aircraft campaign. We thank Stewart Cober for his review of this paper,
management in the field and skills as a flight director. Robert McLaren and Sabour Baray
acknowledge funding from NSERC Discovery and a grant from ECCC to support
some of this work. Sabour Baray and Robert McLaren also acknowledge funding from the NSERC CREATE
program Integrating Atmospheric Chemistry and Physics from Earth to Space
(IACPES).
Edited by: Jennifer G. Murphy
Reviewed by: two anonymous referees
Allen, D., Pickering, K., and Fox-Rabinovitz, M.: Evaluation of pollutant outflow and CO sources during TRACE-P using model-calculated, aircraft-based, and Measurements of Pollution in the Troposphere (MOPITT)-derived CO concentrations, J. Geophys. Res.- Atmos., 109, D15S03, https://doi.org/10.1029/2003JD004250, 2004.
Brandt, A. R., Heath, G. A., Kort, E. A., O'Sullivan, F., Pétron, G., Jordaan, S. M., Tans, P., Wilcox, J., Gopstein, A. M., Arent, D., Wofsy, S., Brown, N. J., Bradley, R., Stucky, G. D., Eardley, D., and Harriss, R.: Methane Leaks from North American Natural Gas Systems, Science, 343, 733–735, https://doi.org/10.1126/science.1247045, 2014.
Bruhwiler, L. M., Basu, S., Bergamaschi, P., Bousquet, P., Dlugokencky, E., Houweling, S., Ishizawa, M., Kim, H. S., Locatelli, R., Maksyutov, S., Montzka, S., Pandey, S., Patra, P. K., Petron, G., Saunois, M., Sweeney, C., Schwietzke, S., Tans, P., and Weatherhead, E. C.: U.S. CH4 emissions from oil and gas production: Have recent large increases been detected?, J. Geophys. Res.-Atmos., 122, 4070–4083, https://doi.org/10.1002/2016JD026157, 2017.
Cambaliza, M. O. L., Shepson, P. B., Caulton, D. R., Stirm, B., Samarov, D., Gurney, K. R., Turnbull, J., Davis, K. J., Possolo, A., Karion, A., Sweeney, C., Moser, B., Hendricks, A., Lauvaux, T., Mays, K., Whetstone, J., Huang, J., Razlivanov, I., Miles, N. L., and Richardson, S. J.: Assessment of uncertainties of an aircraft-based mass balance approach for quantifying urban greenhouse gas emissions, Atmos. Chem. Phys., 14, 9029–9050, https://doi.org/10.5194/acp-14-9029-2014, 2014.
Cheng, Y., Li, S.-M., Gordon, M., and Liu, P.: Size distribution and coating thickness of black carbon from the Canadian oil sands operations, Atmos. Chem. Phys., 18, 2653–2667, https://doi.org/10.5194/acp-18-2653-2018, 2018.
Conen, F. and Smith, K. A.: A re-examination of closed flux chamber methods for the measurement of trace gas emissions from soils to the atmosphere, Eur. J. Soil Sci., 49, 701–707, 1998.
ECCC: National Inventory Report 1990–2014: Greenhouse Gas Sources and Sinks in Canada, Executive Summary, Environment and Climate Change Canada, Gatineau, QC, 1–14, 2016.
ECCC: Facility Greenhouse Gas Reporting: Greenhouse Gas Emissions Reporting Program, available at: https://www.ec.gc.ca/ges-ghg/default.asp?lang=_En&n=_040E378D-1, last access: 27 July 2017a.
ECCC: Greenhouse Gas Emissions Reporting Program: Expansion of the GHGRP, available at: https://www.ec.gc.ca/ges-ghg/default.asp?lang=_En&n=_F891687A-1, last access: 27 July 2017b.
ECCC Data: Pollutant Transformation, Summer 2013 Aircraft Intensive Multi Parameters, Oil Sands Region, http://donnees.ec.gc.ca/data/air/monitor/ambient-air-quality-oil-sands-region/pollutant-transformation-summer-2013-aircraft-intensive-multi-parameters-oil-sands-region/?lang=en (last access: 25 May 2018), 2016.
Edwards, P. M., Young, C. J., Aikin, K., deGouw, J., Dubé, W. P., Geiger, F., Gilman, J., Helmig, D., Holloway, J. S., Kercher, J., Lerner, B., Martin, R., McLaren, R., Parrish, D. D., Peischl, J., Roberts, J. M., Ryerson, T. B., Thornton, J., Warneke, C., Williams, E. J., and Brown, S. S.: Ozone photochemistry in an oil and natural gas extraction region during winter: simulations of a snow-free season in the Uintah Basin, Utah, Atmos. Chem. Phys., 13, 8955–8971, https://doi.org/10.5194/acp-13-8955-2013, 2013.
Edwards, P. M., Brown, S. S., Roberts, J. M., Ahmadov, R., Banta, R. M., deGouw, J. A., Dube, W. P., Field, R. A., Flynn, J. H., Gilman, J. B., Graus, M., Helmig, D., Koss, A., Langford, A. O., Lefer, B. L., Lerner, B. M., Li, R., Li, S.-M., McKeen, S. A., Murphy, S. M., Parrish, D. D., Senff, C. J., Soltis, J., Stutz, J., Sweeney, C., Thompson, C. R., Trainer, M. K., Tsai, C., Veres, P. R., Washenfelder, R. A., Warneke, C., Wild, R. J., Young, C. J., Yuan, B., and Zamora, R.: High winter ozone pollution from carbonyl photolysis in an oil and gas basin, Nature, 514, 351–354, https://doi.org/10.1038/nature13767, 2014.
Environment Canada: National Inventory Report 1990–2013: Greenhouse Gas Sources and Sinks in Canada – Part 2, Gatineau, QC, En81-4/2013E-PDF, 1–226 (see p. 199), 2015.
Fujita, E. M., Croes, B. E., Bennett, C. L., Lawson, D. R., Lurmann, F. W., and Main, H. H.: Comparison of Emission Inventory and Ambient Concentration Ratios of CO, NMOG, and NOx in California's South Coast Air Basin, JAPCA J. Air Waste Ma., 42, 264–276, https://doi.org/10.1080/10473289.1992.10466989, 1992.
Fujita, E. M., Watson, J. G., Chow, J. C., and Magliano, K. L.: Receptor model and emissions inventory source appontionments of nonmethane organic gases in California's San Joaquin valley and San Francisco bay area, Atmos. Environ., 29, 3019–3035, 1995.
Gatti, L. V., Gloor, M., Miller, J. B., Doughty, C. E., Malhi, Y., Domingues, L. G., Basso, L. S., Martinewski, A., Correia, C. S. C., Borges, V. F., Freitas, S., Braz, R., Anderson, L. O., Rocha, H., Grace, J., Phillips, O. L., and Lloyd, J.: Drought sensitivity of Amazonian carbon balance revealed by atmospheric measurements, Nature, 506, 76–80, https://doi.org/10.1038/nature12957, 2014.
GOA: Quantification of area fugitive emissions at oil sands mines, Government of Alberta, AlbertaESRD, Climate Change, 2014, 1–15, 2014.
Gordon, M., Li, S.-M., Staebler, R., Darlington, A., Hayden, K., O'Brien, J., and Wolde, M.: Determining air pollutant emission rates based on mass balance using airborne measurement data over the Alberta oil sands operations, Atmos. Meas. Tech., 8, 3745–3765, https://doi.org/10.5194/amt-8-3745-2015, 2015.
Hausmann, P., Sussmann, R., and Smale, D.: Contribution of oil and natural gas production to renewed increase in atmospheric methane (2007–2014): top–down estimate from ethane and methane column observations, Atmos. Chem. Phys., 16, 3227–3244, https://doi.org/10.5194/acp-16-3227-2016, 2016.
Helmig, D., Rossabi, S., Hueber, J., Tans, P., Montzka, S. A., Masarie, K., Thoning, K., Plass-Duelmer, C., Claude, A., Carpenter, L. J., Lewis, A. C., Punjabi, S., Reimann, S., Vollmer, M. K., Steinbrecher, R., Hannigan, J. W., Emmons, L. K., Mahieu, E., Franco, B., Smale, D., and Pozzer, A.: Reversal of global atmospheric ethane and propane trends largely due to US oil and natural gas production, Nat. Geosci., 9, 490–495, https://doi.org/10.1038/ngeo2721, 2016.
Hendrick, M. F., Ackley, R., Sanaie-Movahed, B., Tang, X., and Phillips, N. G.: Fugitive methane emissions from leak-prone natural gas distribution infrastructure in urban environments, Environ. Pollut., 213, 710–716, 2016.
IPCC: Climate Change 2013: The Physical Science Basis. Contribution of Working Group I to the Fifth Assessment Report of the Intergovernmental Panel on Climate Change, Cambridge University Press, Cambridge, United Kingdom and New York, NY, USA, 1535 p., 2013.
Jacob, D. J., Turner, A. J., Maasakkers, J. D., Sheng, J., Sun, K., Liu, X., Chance, K., Aben, I., McKeever, J., and Frankenberg, C.: Satellite observations of atmospheric methane and their value for quantifying methane emissions, Atmos. Chem. Phys., 16, 14371–14396, https://doi.org/10.5194/acp-16-14371-2016, 2016.
Jiang, W., Singleton, D. L., Hedley, M., McLaren, R., Dann, T., and Wang, D.: Comparison of Organic Compound Compositions in the Emissions Inventory and Ambient Data for the Lower Fraser Valley, JAPCA J. Air Waste Ma., 47, 851–860, https://doi.org/10.1080/10473289.1997.10464457, 1997.
Johnson, M. R., Crosland, B. M., McEwen, J. D., Hager, D. B., Armitage, J. R., Karimi-Golpayegani, M., and Picard, D. J.: Estimating fugitive methane emissions from oil sands mining using extractive core samples, Atmos. Environ., 144, 111–123, 2016.
JOSM: Joint Canada/Alberta Implementation Plan for Oil Sands Monitoring, ISBN: 978-1-100-21630-0, 1–26, 2012.
Karion, A., Sweeney, C., Pétron, G., Frost, G., Michael Hardesty, R., Kofler, J., Miller, B. R., Newberger, T., Wolter, S., Banta, R., Brewer, A., Dlugokencky, E., Lang, P., Montzka, S. A., Schnell, R., Tans, P., Trainer, M., Zamora, R., and Conley, S.: Methane emissions estimate from airborne measurements over a western United States natural gas field, Geophys. Res. Lett., 40, 4393–4397, https://doi.org/10.1002/grl.50811, 2013.
Karion, A., Sweeney, C., Kort, E. A., Shepson, P. B., Brewer, A., Cambaliza, M., Conley, S. A., Davis, K., Deng, A., Hardesty, M., Herndon, S. C., Lauvaux, T., Lavoie, T., Lyon, D., Newberger, T., Pétron, G., Rella, C., Smith, M., Wolter, S., Yacovitch, T. I., and Tans, P.: Aircraft-Based Estimate of Total Methane Emissions from the Barnett Shale Region, Environ. Sci. Technol., 49, 8124–8131, https://doi.org/10.1021/acs.est.5b00217, 2015.
Klenbusch, M. R.: Measurement of gaseous emission rates from land surfaces using an emission isolation chamber, Radian CorporationEPA/600/8-86/008, 58 p., 1986.
Kort, E. A., Frankenberg, C., Costigan, K. R., Lindenmaier, R., Dubey, M. K., and Wunch, D.: Four corners: The largest US methane anomaly viewed from space, Geophys. Res. Lett., 41, 6898–6903, https://doi.org/10.1002/2014GL061503, 2014.
Lavoie, T. N., Shepson, P. B., Cambaliza, M. O. L., Stirm, B. H., Karion, A., Sweeney, C., Yacovitch, T. I., Herndon, S. C., Lan, X., and Lyon, D.: Aircraft-Based Measurements of Point Source Methane Emissions in the Barnett Shale Basin, Environ. Sci. Technol., 49, 7904–7913, https://doi.org/10.1021/acs.est.5b00410, 2015.
Li, S.-M., Leithead, A., Moussa, S. G., Liggio, J., Moran, M. D., Wang, D., Hayden, K., Darlington, A., Gordon, M., Staebler, R., Makar, P. A., Stroud, C. A., McLaren, R., Liu, P. S. K., O'Brien, J., Mittermeier, R. L., Zhang, J., Marson, G., Cober, S. G., Wolde, M., and Wentzell, J. J. B.: Differences between measured and reported volatile organic compound emissions from oil sands facilities in Alberta, Canada, P. Natl. Acad. Sci. USA, 114, E3756–E3765, https://doi.org/10.1073/pnas.1617862114, 2017.
Liggio, J., Li, S.-M., Hayden, K., Taha, Y. M., Stroud, C., Darlington, A., Drollette, B. D., Gordon, M., Lee, P., Liu, P., Leithead, A., Moussa, S. G., Wang, D., O'Brien, J., Mittermeier, R. L., Brook, J. R., Lu, G., Staebler, R. M., Han, Y., Tokarek, T. W., Osthoff, H. D., Makar, P. A., Zhang, J., L. Plata, D., and Gentner, D. R.: Oil sands operations as a large source of secondary organic aerosols, Nature, 534, 91–94, https://doi.org/10.1038/nature17646, 2016.
Lyon, D. R., Zavala-Araiza, D., Alvarez, R. A., Harriss, R., Palacios, V., Lan, X., Talbot, R., Lavoie, T., Shepson, P., Yacovitch, T. I., Herndon, S. C., Marchese, A. J., Zimmerle, D., Robinson, A. L., and Hamburg, S. P.: Constructing a Spatially Resolved Methane Emission Inventory for the Barnett Shale Region, Environ. Sci. Technol., 49, 8147–8157, https://doi.org/10.1021/es506359c, 2015.
Mays, K. L., Shepson, P. B., Stirm, B. H., Karion, A., Sweeney, C., and Gurney, K. R.: Aircraft-Based Measurements of the Carbon Footprint of Indianapolis, Environ. Sci. Technol., 43, 7816–7823, https://doi.org/10.1021/es901326b, 2009.
McLaren, R., Gertler, A. W., Wittorff, D. N., Belzer, W., Dann, T., and Singleton, D. L.: Real-World Measurements of Exhaust and Evaporative Emissions in the Cassiar Tunnel Predicted by Chemical Mass Balance Modeling, Environ. Sci. Technol., 30, 3001–3009, https://doi.org/10.1021/es960036k, 1996.
McLinden, C. A., Fioletov, V., Boersma, K. F., Krotkov, N., Sioris, C. E., Veefkind, J. P., and Yang, K.: Air quality over the Canadian oil sands: A first assessment using satellite observations, Geophys. Res. Lett., 39, L04804, https://doi.org/10.1029/2011GL050273, 2012.
McLinden, C. A., Fioletov, V., Boersma, K. F., Kharol, S. K., Krotkov, N., Lamsal, L., Makar, P. A., Martin, R. V., Veefkind, J. P., and Yang, K.: Improved satellite retrievals of NO2 and SO2 over the Canadian oil sands and comparisons with surface measurements, Atmos. Chem. Phys., 14, 3637–3656, https://doi.org/10.5194/acp-14-3637-2014, 2014.
Montzka, S. A., Dlugokencky, E. J., and Butler, J. H.: Non-CO2 greenhouse gases and climate change, Nature, 476, 43–50, 2011.
Orbach, R. L.: Chapter 1 – Energy production: A Global Perspective, in: Alberta Oil Sands: Energy, Industry and the Environment, edited by: Percy, K. E., Developments in Environmental Science, 11, Elsevier, Oxford, UK, 2–18, 2012.
Peischl, J., Ryerson, T. B., Brioude, J., Aikin, K. C., Andrews, A. E., Atlas, E., Blake, D., Daube, B. C., de Gouw, J. A., Dlugokencky, E., Frost, G. J., Gentner, D. R., Gilman, J. B., Goldstein, A. H., Harley, R. A., Holloway, J. S., Kofler, J., Kuster, W. C., Lang, P. M., Novelli, P. C., Santoni, G. W., Trainer, M., Wofsy, S. C., and Parrish, D. D.: Quantifying sources of methane using light alkanes in the Los Angeles basin, California, J. Geophys. Res.-Atmos., 118, 4974–4990, https://doi.org/10.1002/jgrd.50413, 2013.
Peischl, J., Ryerson, T. B., Aikin, K. C., de Gouw, J. A., Gilman, J. B., Holloway, J. S., Lerner, B. M., Nadkarni, R., Neuman, J. A., Nowak, J. B., Trainer, M., Warneke, C., and Parrish, D. D.: Quantifying atmospheric methane emissions from the Haynesville, Fayetteville, and northeastern Marcellus shale gas production regions, J. Geophys. Res.-Atmos., 120, 2119–2139, https://doi.org/10.1002/2014JD022697, 2015.
Peischl, J., Karion, A., Sweeney, C., Kort, E. A., Smith, M. L., Brandt, A. R., Yeskoo, T., Aikin, K. C., Conley, S. A., Gvakharia, A., Trainer, M., Wolter, S., and Ryerson, T. B.: Quantifying atmospheric methane emissions from oil and natural gas production in the Bakken shale region of North Dakota, J. Geophys. Res.-Atmos., 121, 6101–6111, https://doi.org/10.1002/2015JD024631, 2016.
Pinto, J.: Atmospheric Chemistry: Wyoming winter smog, Nat. Geosci., 2, 88–89, 2009.
Scheff, P. A. and Wadden, R. A.: Receptor modeling of volatile organic compounds. 1. Emission inventory and validation, Environ. Sci. Technol., 27, 617–625, https://doi.org/10.1021/es00041a005, 1993.
Schneising, O., Burrows, J. P., Dickerson, R. R., Buchwitz, M., Reuter, M., and Bovensmann, H.: Remote sensing of fugitive methane emissions from oil and gas production in North American tight geologic formations, Earth's Future, 2, 548–558, https://doi.org/10.1002/2014EF000265, 2014.
Schnell, R. C., Oltmans, S. J., Neely, R. R., Endres, M. S., Molenar, J. V., and White, A. B.: Rapid photochemical production of ozone at high concentrations in a rural site during winter, Nat. Geosci., 2, 120–122, 2009.
Schnell, R. C., Johnson, B. J., Oltmans, S. J., Cullis, P., Sterling, C., Hall, E., Jordan, A., Helmig, D., Petron, G., Ahmadov, R., Wendell, J., Albee, R., Boylan, P., Thompson, C. R., Evans, J., Hueber, J., Curtis, A. J., and Park, J.-H.: Quantifying wintertime boundary layer ozone production from frequent profile measurements in the Uinta Basin, UT, oil and gas region, J. Geophys. Res.-Atmos., 121, 11038–11054, https://doi.org/10.1002/2016JD025130, 2016.
Shephard, M. W., McLinden, C. A., Cady-Pereira, K. E., Luo, M., Moussa, S. G., Leithead, A., Liggio, J., Staebler, R. M., Akingunola, A., Makar, P., Lehr, P., Zhang, J., Henze, D. K., Millet, D. B., Bash, J. O., Zhu, L., Wells, K. C., Capps, S. L., Chaliyakunnel, S., Gordon, M., Hayden, K., Brook, J. R., Wolde, M., and Li, S.-M.: Tropospheric Emission Spectrometer (TES) satellite observations of ammonia, methanol, formic acid, and carbon monoxide over the Canadian oil sands: validation and model evaluation, Atmos. Meas. Tech., 8, 5189–5211, https://doi.org/10.5194/amt-8-5189-2015, 2015.
Siddique, T., Penner, T., Klassen, J., Nesbø, C., and Foght, J. M.: Microbial Communities Involved in Methane Production from Hydrocarbons in Oil Sands Tailings, Environ. Sci. Technol., 46, 9802–9810, https://doi.org/10.1021/es302202c, 2012.
Simpson, I. J., Blake, N. J., Barletta, B., Diskin, G. S., Fuelberg, H. E., Gorham, K., Huey, L. G., Meinardi, S., Rowland, F. S., Vay, S. A., Weinheimer, A. J., Yang, M., and Blake, D. R.: Characterization of trace gases measured over Alberta oil sands mining operations: 76 speciated C2–C10 volatile organic compounds (VOCs), CO2, CH4, CO, NO, NO2, NOy, O3 and SO2, Atmos. Chem. Phys., 10, 11931–11954, https://doi.org/10.5194/acp-10-11931-2010, 2010.
Small, C. C., Cho, S., Hashisho, Z., and Ulrich, A. C.: Emissions from oil sands tailings ponds: Review of tailings pond parameters and emission estimates, J. Petrol. Sci. Eng., 127, 490–501, 2015.
Smith, M. L., Kort, E. A., Karion, A., Sweeney, C., Herndon, S. C., and Yacovitch, T. I.: Airborne Ethane Observations in the Barnett Shale: Quantification of Ethane Flux and Attribution of Methane Emissions, Environ. Sci. Technol., 49, 8158–8166, https://doi.org/10.1021/acs.est.5b00219, 2015.
Strausz, O. P. L. and Elizabeth M. : The Chemistry of Alberta Oil Sands, Bitumens and Heavy Oils, Alberta Energy Research Institute, Edmonton, AB, 2003.
Stringham, G.: Chapter 2 – Energy Developments in Canada's Oil Sands, in: Developments in Environmental Science, edited by: Kevin, E. P., Alberta Oil Sands Energy, Industry and the Environment, 11, Elsevier, Oxford, UK, 19–34, 2012.
Tokarek, T. W., Odame-Ankrah, C. A., Huo, J. A., McLaren, R., Lee, A. K. Y., Adam, M. G., Willis, M. D., Abbatt, J. P. D., Mihele, C., Darlington, A., Mittermeier, R. L., Strawbridge, K., Hayden, K. L., Olfert, J. S., Schnitzler, E. G., Brownsey, D. K., Assad, F. V., Wentworth, G. R., Tevlin, A. G., Worthy, D. E. J., Li, S.-M., Liggio, J., Brook, J. R., and Osthoff, H. D.: Principal component analysis of summertime ground site measurements in the Athabasca oil sands: Sources of IVOCs, Atmos. Chem. Phys. Discuss., https://doi.org/10.5194/acp-2017-1026, in review, 2018.
Turner, A. J., Jacob, D. J., Benmergui, J., Wofsy, S. C., Maasakkers, J. D., Butz, A., Hasekamp, O., and Biraud, S. C.: A large increase in U.S. methane emissions over the past decade inferred from satellite data and surface observations, Geophys. Res. Lett., 43, 2218–2224, https://doi.org/10.1002/2016GL067987, 2016.
Turner, A. J., Frankenberg, C., Wennberg, P. O., and Jacob, D. J.: Ambiguity in the causes for decadal trends in atmospheric methane and hydroxyl, P. Natl. Acad. Sci. USA, 114, 5367–5372, https://doi.org/10.1073/pnas.1616020114, 2017.
Vaghjiani, G. L. and Ravishankara, A.: New measurement of the rate coefficient for the reaction of OH with methane, Nature, 350, 406–409, 1991.
Walter, D., Heue, K. P., Rauthe-Schöch, A., Brenninkmeijer, C. A. M., Lamsal, L. N., Krotkov, N. A., and Platt, U.: Flux calculation using CARIBIC DOAS aircraft measurements: SO2 emission of Norilsk, J. Geophys. Res.-Atmos., 117, D11305, https://doi.org/10.1029/2011JD017335, 2012.
Williams, A. and Marcotte, D.: Wind Measurements on a Maneuvering Twin-Engine Turboprop Aircraft Accounting for Flow Distortion, J. Atmos. Ocean. Tech., 17, 795–810, 2000.
Worthy, D. E. J., Chan, E., Ishizawa, M., Chan, D., Poss, C., Dlugokencky, E. J., Maksyutov, S., and Levin, I.: Decreasing anthropogenic methane emissions in Europe and Siberia inferred from continuous carbon dioxide and methane observations at Alert, Canada, J. Geophys. Res.-Atmos., 114, D10301, https://doi.org/10.1029/2008JD011239, 2009.
Wratt, D. S., Gimson, N. R., Brailsford, G. W., Lassey, K. R., Bromley, A. M., and Bell, M. J.: Estimating regional methane emissions from agriculture using aircraft measurements of concentration profiles, Atmos. Environ., 35, 497–508, 2001.
Zavala-Araiza, D., Lyon, D., Alvarez, R. A., Palacios, V., Harriss, R., Lan, X., Talbot, R., and Hamburg, S. P.: Toward a Functional Definition of Methane Super-Emitters: Application to Natural Gas Production Sites, Environ. Sci. Technol., 49, 8167–8174, https://doi.org/10.1021/acs.est.5b00133, 2015.