the Creative Commons Attribution 3.0 License.
the Creative Commons Attribution 3.0 License.
Vertical distribution of aerosols over the Maritime Continent during El Niño
Daniel Hui Loong Ng
Alan Wei Lun Lim
Xin Rong Chua
The vertical distribution of aerosols over Southeast Asia, a critical factor impacting aerosol lifetime, radiative forcing, and precipitation, is examined for the 2006 post El Niño fire burning season. Combining these measurements with remotely sensed land, fire, and meteorological measurements, and fire plume modeling, we have reconfirmed that fire radiative power (FRP) is underestimated over Southeast Asia by MODIS measurements. These results are derived using a significantly different approach from other previously attempted approaches found in the literature. The horizontally constrained Maritime Continent's fire plume median height, using the maximum variance of satellite observed aerosol optical depth as the spatial and temporal constraint, is found to be 2.04 ± 1.52 km during the entirety of the 2006 El Niño fire season, and 2.19±1.50 km for October 2006. This is 0.83 km (0.98 km) higher than random sampling and all other past studies. Additionally, it is determined that 61 (+6–10) % of the bottom of the smoke plume and 83 (+8–11) % of the median of the smoke plume is in the free troposphere during the October maximum; while 49 (+7–9) % and 75 (+12–12) % of the total aerosol plume and the median of the aerosol plume, are correspondingly found in the free troposphere during the entire fire season. This vastly different vertical distribution will have impacts on aerosol lifetime and dispersal. Application of a simple plume rise model using measurements of fire properties underestimates the median plume height by 0.26 km over the entire fire season and 0.34 km over the maximum fire period. It is noted that the model underestimation over the bottom portions of the plume are much larger. The center of the plume can be reproduced when fire radiative power is increased by 20 % (with other parts of the plume ranging from an increase of 0 to 60 % depending on the portion of the plume and the length of the fire season considered). However, to reduce the biases found, improvements including fire properties under cloudy conditions, representation of small-scale convection, and inclusion of aerosol direct and semi-direct effects are required.
- Article
(1877 KB) - Full-text XML
-
Supplement
(2262 KB) - BibTeX
- EndNote


Properly quantifying the vertical distribution of aerosols is essential to constrain their atmospheric distribution, which in turn impacts the atmospheric energy budget (Ming et al., 2010; Kim et al., 2008), circulation, clouds and precipitation (Tao et al., 2012; Wang 2013), and human health (Burnett et al., 2014). However, there are complicating factors including spatial and temporal heterogeneity in emissions (Cohen and Wang, 2014; Cohen, 2014; Giglio et al., 2006; Petrenko et al., 2012; Wooster et al., 2012), and uncertainties and non-linearities associated with aerosol processing and removal from the atmosphere (Tao et al., 2012; Cohen and Prinn, 2011; Cohen et al., 2011). Furthermore, a lack of sufficiently dense measurements leads to difficulty constraining the measured distribution of aerosols over scales from hundreds to thousands of kilometers or over time frames on the decadal to longer timescales (Cohen and Wang, 2014; Delene and Ogren, 2002; Dubovik et al., 2000; Cohen et al., 2017).
Models are very poor at reproducing the actual vertical distribution of atmospheric aerosols (Cheng et al., 2012; Schuster et al., 2005; Tsigaridis et al., 2014). They also tend to strongly underestimate the total atmospheric column loading of aerosols (Colarco et al., 2004; Leung et al., 2007). Furthermore, vertical measurements are sparse, and in many regions do not provide adequate statistics to make informed comparisons with real world conditions. This is no more apparent than over Southeast Asia, where model studies (Tosca et al., 2011; Martin et al., 2012) have concluded that almost all aerosols are narrowly confined in the planetary boundary layer, although measurements demonstrate otherwise (Lin et al., 2014). Presently, there are no known modeling efforts that have been able to reproduce this significant atmospheric loading and the ensuing vertical distribution
Additionally, aerosol emissions databases in Southeast Asia are quantified using a bottom-up approach, where small samples and statistics of the activity, land use, economics, population, and hotspots are aggregated (van der Werf, 2010; Lamarque, 2010; Bond et al., 2004). This problem is further exacerbated by the fact that emissions from organic soils have not been well studied, even in non-tropical regions (Urbanski, 2014). This generally then leads to sizable bias: there are few measurements and rapidly changing land-surface features. Some recent studies have used measurements and models in tandem to quantify a significant underestimation in aerosol emissions over Southeast Asia. This underestimation occurs both in terms of magnitude (Cohen and Wang, 2014) and in the spatial and temporal distribution of the emissions (Cohen, 2014). It is furthermore significantly impacted on an interannual and intra-annual basis by fires.
The vertical distribution of aerosols is further ill-constrained due to an incomplete understanding of in situ production and removal mechanisms which are dependent on washout, which is also poorly modeled (Tao et al., 2012; Wang 2013), especially in the tropics during the dry season (Petersen and Rutledge, 2001; Ekman et al., 2012). Heterogeneous aerosol processing may also change the hygroscopicity, which in turn impacts the washout rate and vertical distribution of the aerosols (Kim et al., 2008; Cohen et al., 2011). These factors have been shown to combine such that small changes in the initial vertical distribution can lead to differences in atmospheric transport thousands of kilometers apart (Wang, 2013).
The Maritime Continent of Southeast Asia has faced widespread and ubiquitous fires the past few decades, due to expanding agriculture, urban development, economic growth, and changes in the base climatology that induce drought (Center, 2005; Dennis et al., 2005; van der Werf et al., 2008; Taylor, 2010). These fires contribute the major fraction of the atmospheric aerosol burden during the dry season (Cohen, 2014). However, these fires are unique: they are relatively low in radiative power and temperature yet cover a massive net surface area, making their statistics and extent hard to characterize from remote sensing. Their total emissions are very high, and thus during the burning season they dominate the aerosol optical depth (AOD) and PM2.5 levels over thousands of kilometers (Field et al., 2009; Nakajima et al., 1999). Due to their widespread and dispersed nature, the fires as a whole in this region are geospatially coherent in timing and geography; however they may individually burn for different lengths of time, as a function of localized precipitation and soil moisture, and global circulation patterns such as El Niño (Cohen, 2014; Wooster et al., 2012; Hansen, 2008).
A comprehensive previous attempt to study aerosol height over Southeast Asia was performed by Lee et al. (2016). They used the total Cloud-Aerosol Lidar with Orthogonal Polarization (CALIOP) profile, but were not specific about how they cleared or accounted for high ice clouds that are frequently found in this part of the world. They also used daytime data without considering the issues of solar reflection and backscatter (Winker et al., 2013). Furthermore, they used satellite derived single scattering albedo (SSA) approximated by each pass, although this product has been shown to be highly error-prone over Southeast Asia (Rogers et al., 2009; Hostetler, 2008). This work did not address how the spatially disparate individual path measurements from CALIOP were analyzed or separated in terms of those sampling parts of the fire plume as compared to those sampling regions not impacted by fires, such as in Cohen (2014) and Cohen et al. (2017). Over this region of the world, there has been no direct local validation of the CALIOP product by other lidar related instruments (Sugimoto et al., 2014a). The only comparisons made so far have been model-based validation studies (Campbell et al., 2013).
This work describes a new approach to comprehensively sample the vertical distribution of smoke aerosols, by first using decadal-scale measurements of AOD from the Multi-angle Imaging SpectroRadiometer (MISR) satellite (Cohen, 2014), and then separating the smoke impacted regions by the magnitude of the measured variability. During the 2006 El Niño enhanced burning, one of the 2 largest such events over the past 15-year measurement record, this approach yields a much higher vertical aerosol height than the traditional random sampling approach. A simple plume rise model (Achtemeier et al., 2011; Briggs, 1965) using reanalysis meteorology (Kalnay et al., 1996) and measured fire properties was found to underestimate the measured heights. However, the model could be improved to match the median heights by increasing the measured fire radiative power (FRP) (Sessions et al., 2011; Sofiev et al., 2012). This finding implies that measured fires may be underestimated in terms of their strength, or that there are missing fires. However even with scaling, the top and bottom heights of the measured plume still cannot be reproduced. The data shows that an improved representation of both localized convective transport and the aerosol direct and semi-direct effects (Ekman et al., 2007; Wang, 2007) are required to make further improvements. It is hoped that these results will provide insight to those working on understanding the strong 2015–2016 El Niño conditions.

Figure 1Map of Maritime Continent. The smoke plume impacts the subregion contained within the dashed lines, or the so-called “fire-constrained” region. On the other hand, the region outside of the dashed lines is the so-called “non-fire-constrained” region. The colors on the plot correspond to the intensity of the variance, as explained in Cohen (2014). The plot is based on a variance maximization technique applied to the measurements from all MISR overpasses from 2000 through 2014 (Cohen, 2014). Note that in this part of the world 1∘ of latitude or longitude is approximately 100 km, leading to a fire-impacted region over 2500 km across.
2.1 Geography
This work is focused on the Maritime Continent, a subregion of Southeast Asia (8∘ S to 8∘ N, 95 to 125∘ E) (Fig. 1) that experiences wide-spread and highly emitting fires on a yearly basis during the local dry season (starting in August–September and proceeding continuously through October–November). The combined magnitudes of so many small fires effectively produce a single massive smoke plume in the atmosphere, which covers much of the region, extending thousands of kilometers (Cohen, 2014). These wide spread fires are due to anthropogenic clearing of rainforest and agriculture (Cohen et al., 2017; Dennis et al., 2005; van der Werf et al., 2008; Taylor, 2010; Miettinen et al., 2013; Langmann et al., 2009). Over this region, during the dry season, the removal of aerosols is quite slow, leading to the overall properties of the plume being relatively consistent over space and time (Cohen, 2014). Therefore, the overall properties of the smoke plume, when correctly bound in space and time, can be robustly related to the overall properties of individual fires and daily measurements of AOD from the MISR satellite (Fig. 1) (Cohen, 2014).
In 2006, the El Niño conditions led to an enhanced drought, with subsequent fires lasting from early September through to mid-November. To ensure that this event is uniquely and completely analyzed, data from 3 September through 9 November is ultimately used (more details are given in Figs. 2 and 3a, which are defined later). The region in Fig. 1 consists of the empirical orthogonal functions (EOFs) larger than 2.2 (Bjornsson and Venegas, 1997; Cohen et al., 2017) as calculated from the measured MISR AOD. This region forms the boundary of the fire source regions (over land) and downwind regions (over both land and sea). This approach analytically provides a holistic representation in space and time of the impact of individual fires on the large-scale structure of the aerosol plume. Therefore, the approach allows the vertical distribution of the smoke to be comprehensively sampled, including those obscured by clouds (very common in this region), and aged aerosols which were emitted in the fire and transported significantly downwind.
2.2 Measurements
The CALIOP instrument is an active lidar, quantifying the vertically resolved atmospheric backscatter strength at 532 and 1064 nm (a reasonable approximation of the vertical profile of aerosols), and polarization at 532 nm. The combination of these measurements allows an indication of particle size (large or small) and whether the particle is a cloud or an aerosol (Winker et al., 2003). Specifically, we use the backscatter at 532nm and the vertical feature mask (vertical resolution 30 m below 8.2 km and 60 m from 8.2 to 20.2 km, horizontal resolution 1/3 km) (Hostetler et al., 2006). To avoid issues of cloud contamination and solar reflectance only nighttime data only is used, and any identified clouds are removed (Winker et al., 2013).
Since the width of each pass is narrow, it is not spatially representative in general. However, given the relative consistency of the plume as a whole, samples constrained within the plume's spatial extent, taken on the same day, are statistically representative of the smoke plume as a whole (Cohen, 2014). This approach improves upon the approach of Winker et al. (2013) by relaxing the uniform “horizontal box size”. Instead, the area of analysis is constrained in a more general spatial and temporal domain based on a homogeneous response in measurement space. Specifically, by constraining the region using AOD, each region therefore has a much larger number of lidar measurements that are consistent with the physical effects occurring within the region, thereby allowing for improved statistical representation.
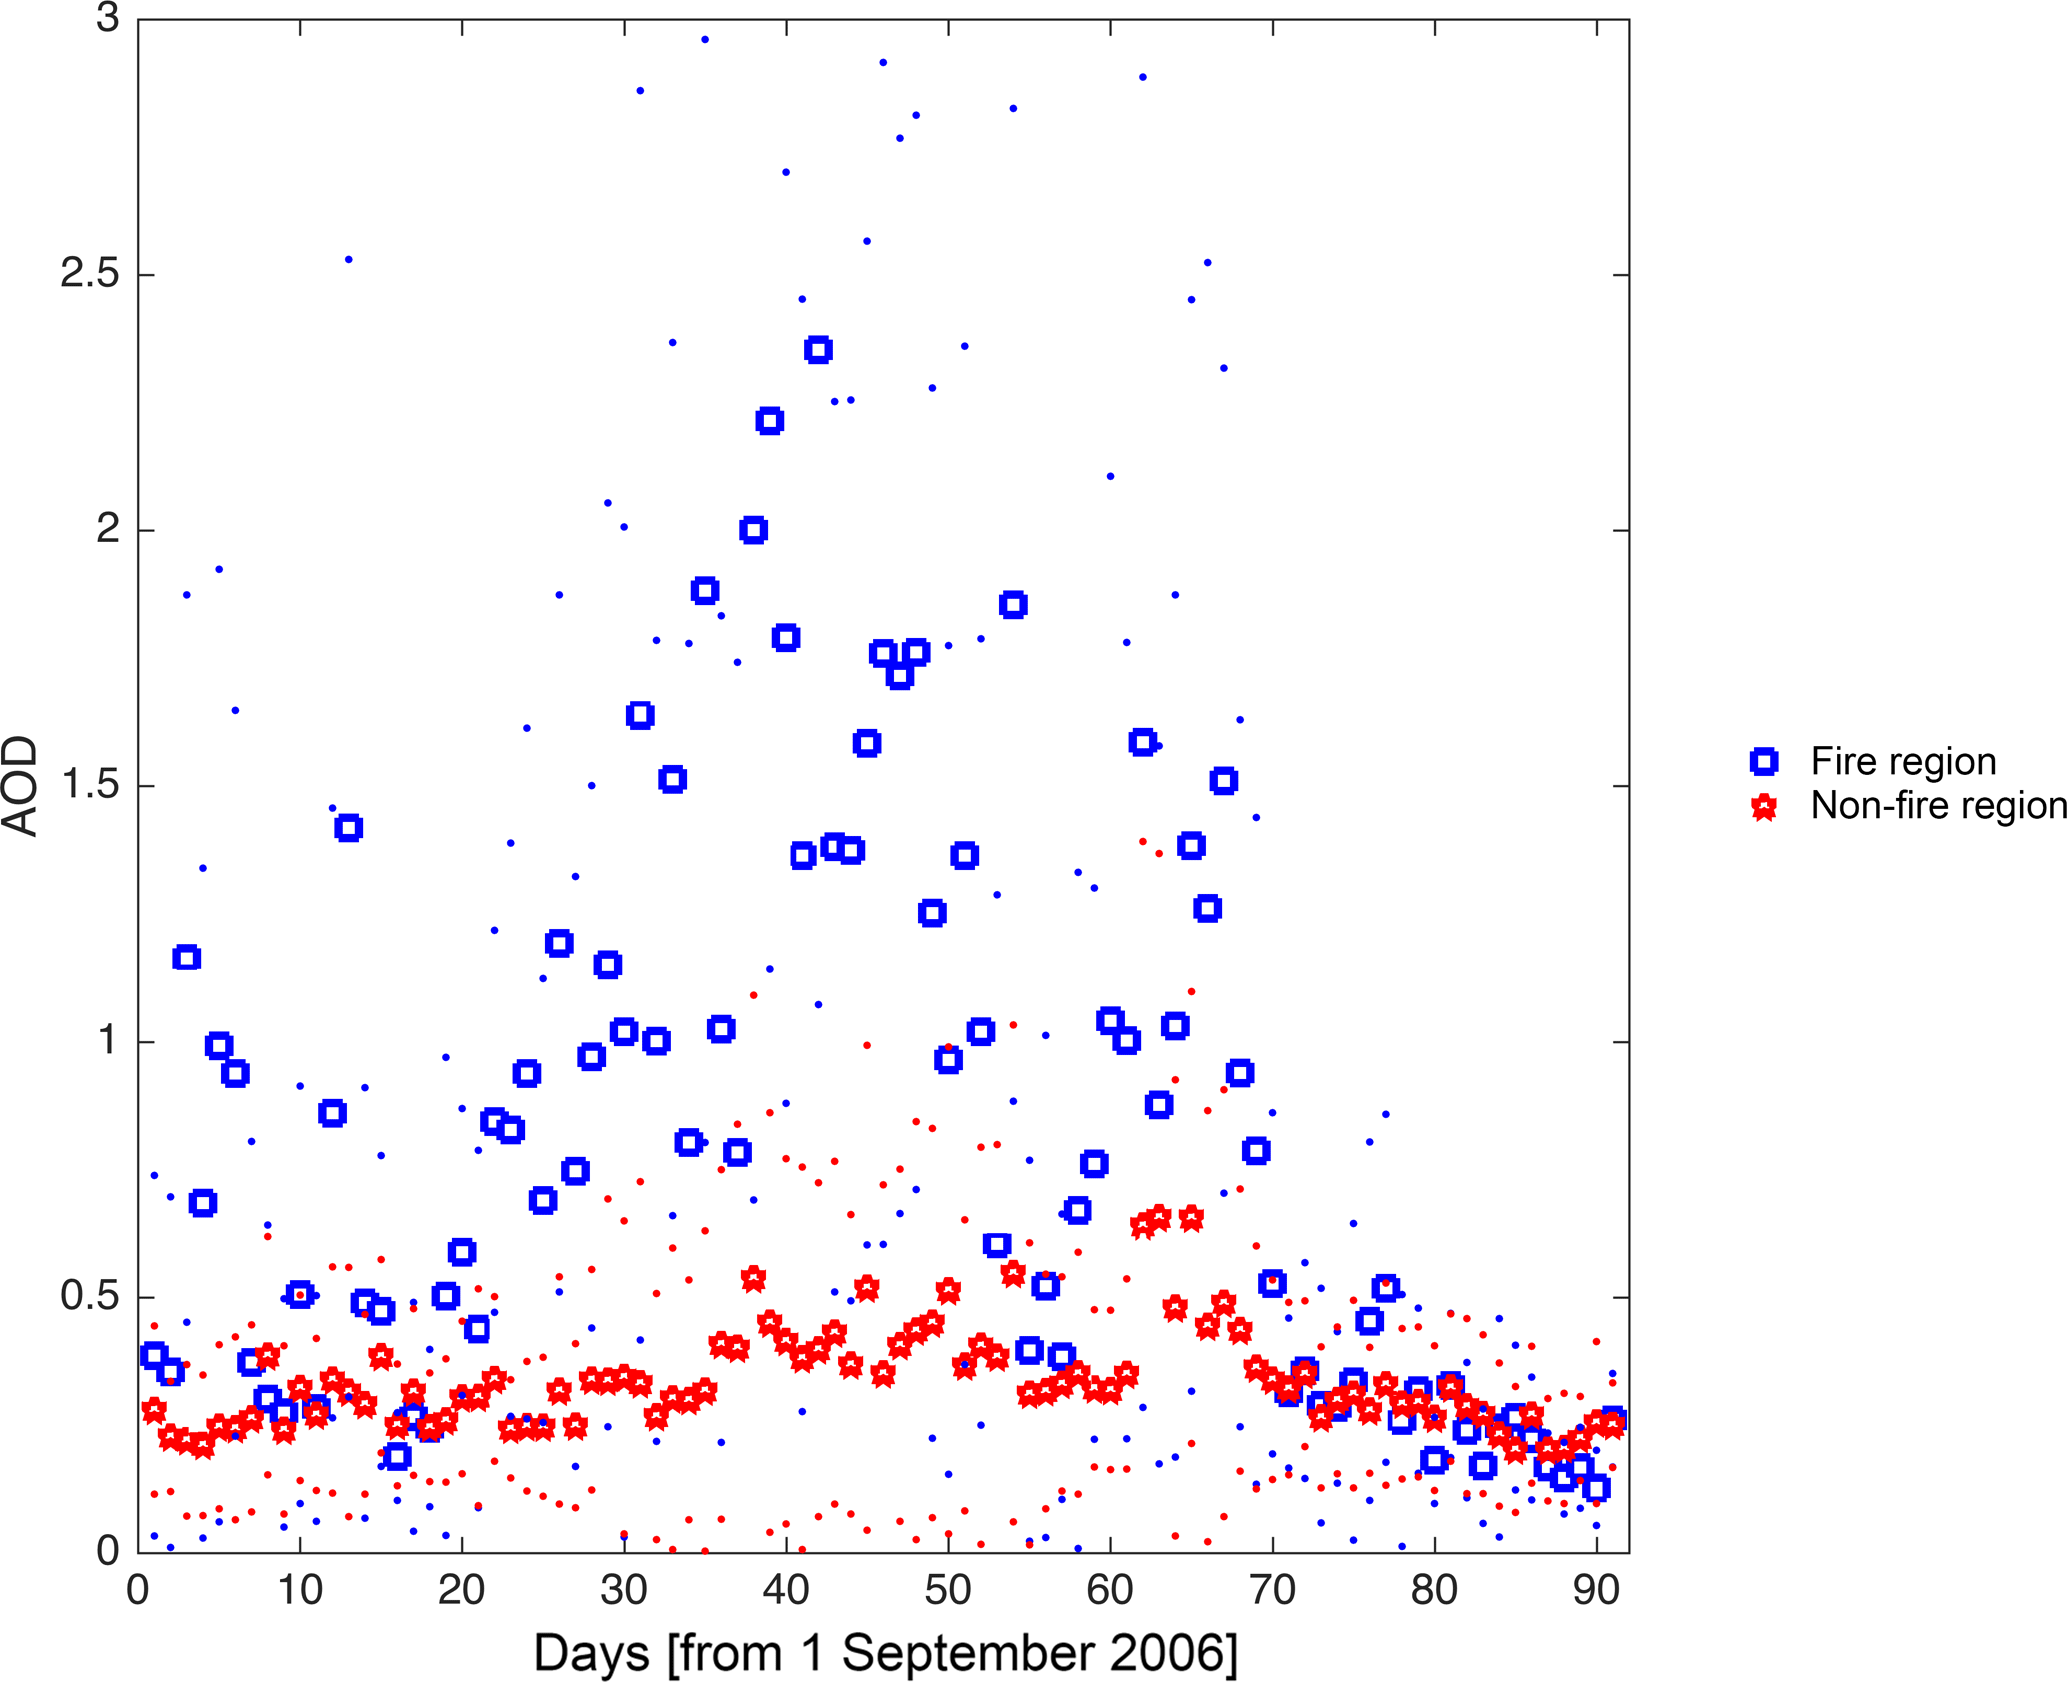
Figure 2Time series of daily averaged measured AOD over the fire-constrained regions of the Maritime Continent (blue), and the non-fire-constrained regions of the Maritime Continent (red), as given in Fig. 1. Circles are computed daily mean values, while dots are computed daily standard deviation bands. Note that this figure contains the daily data from 1 September 2006 through 30 November 2006.
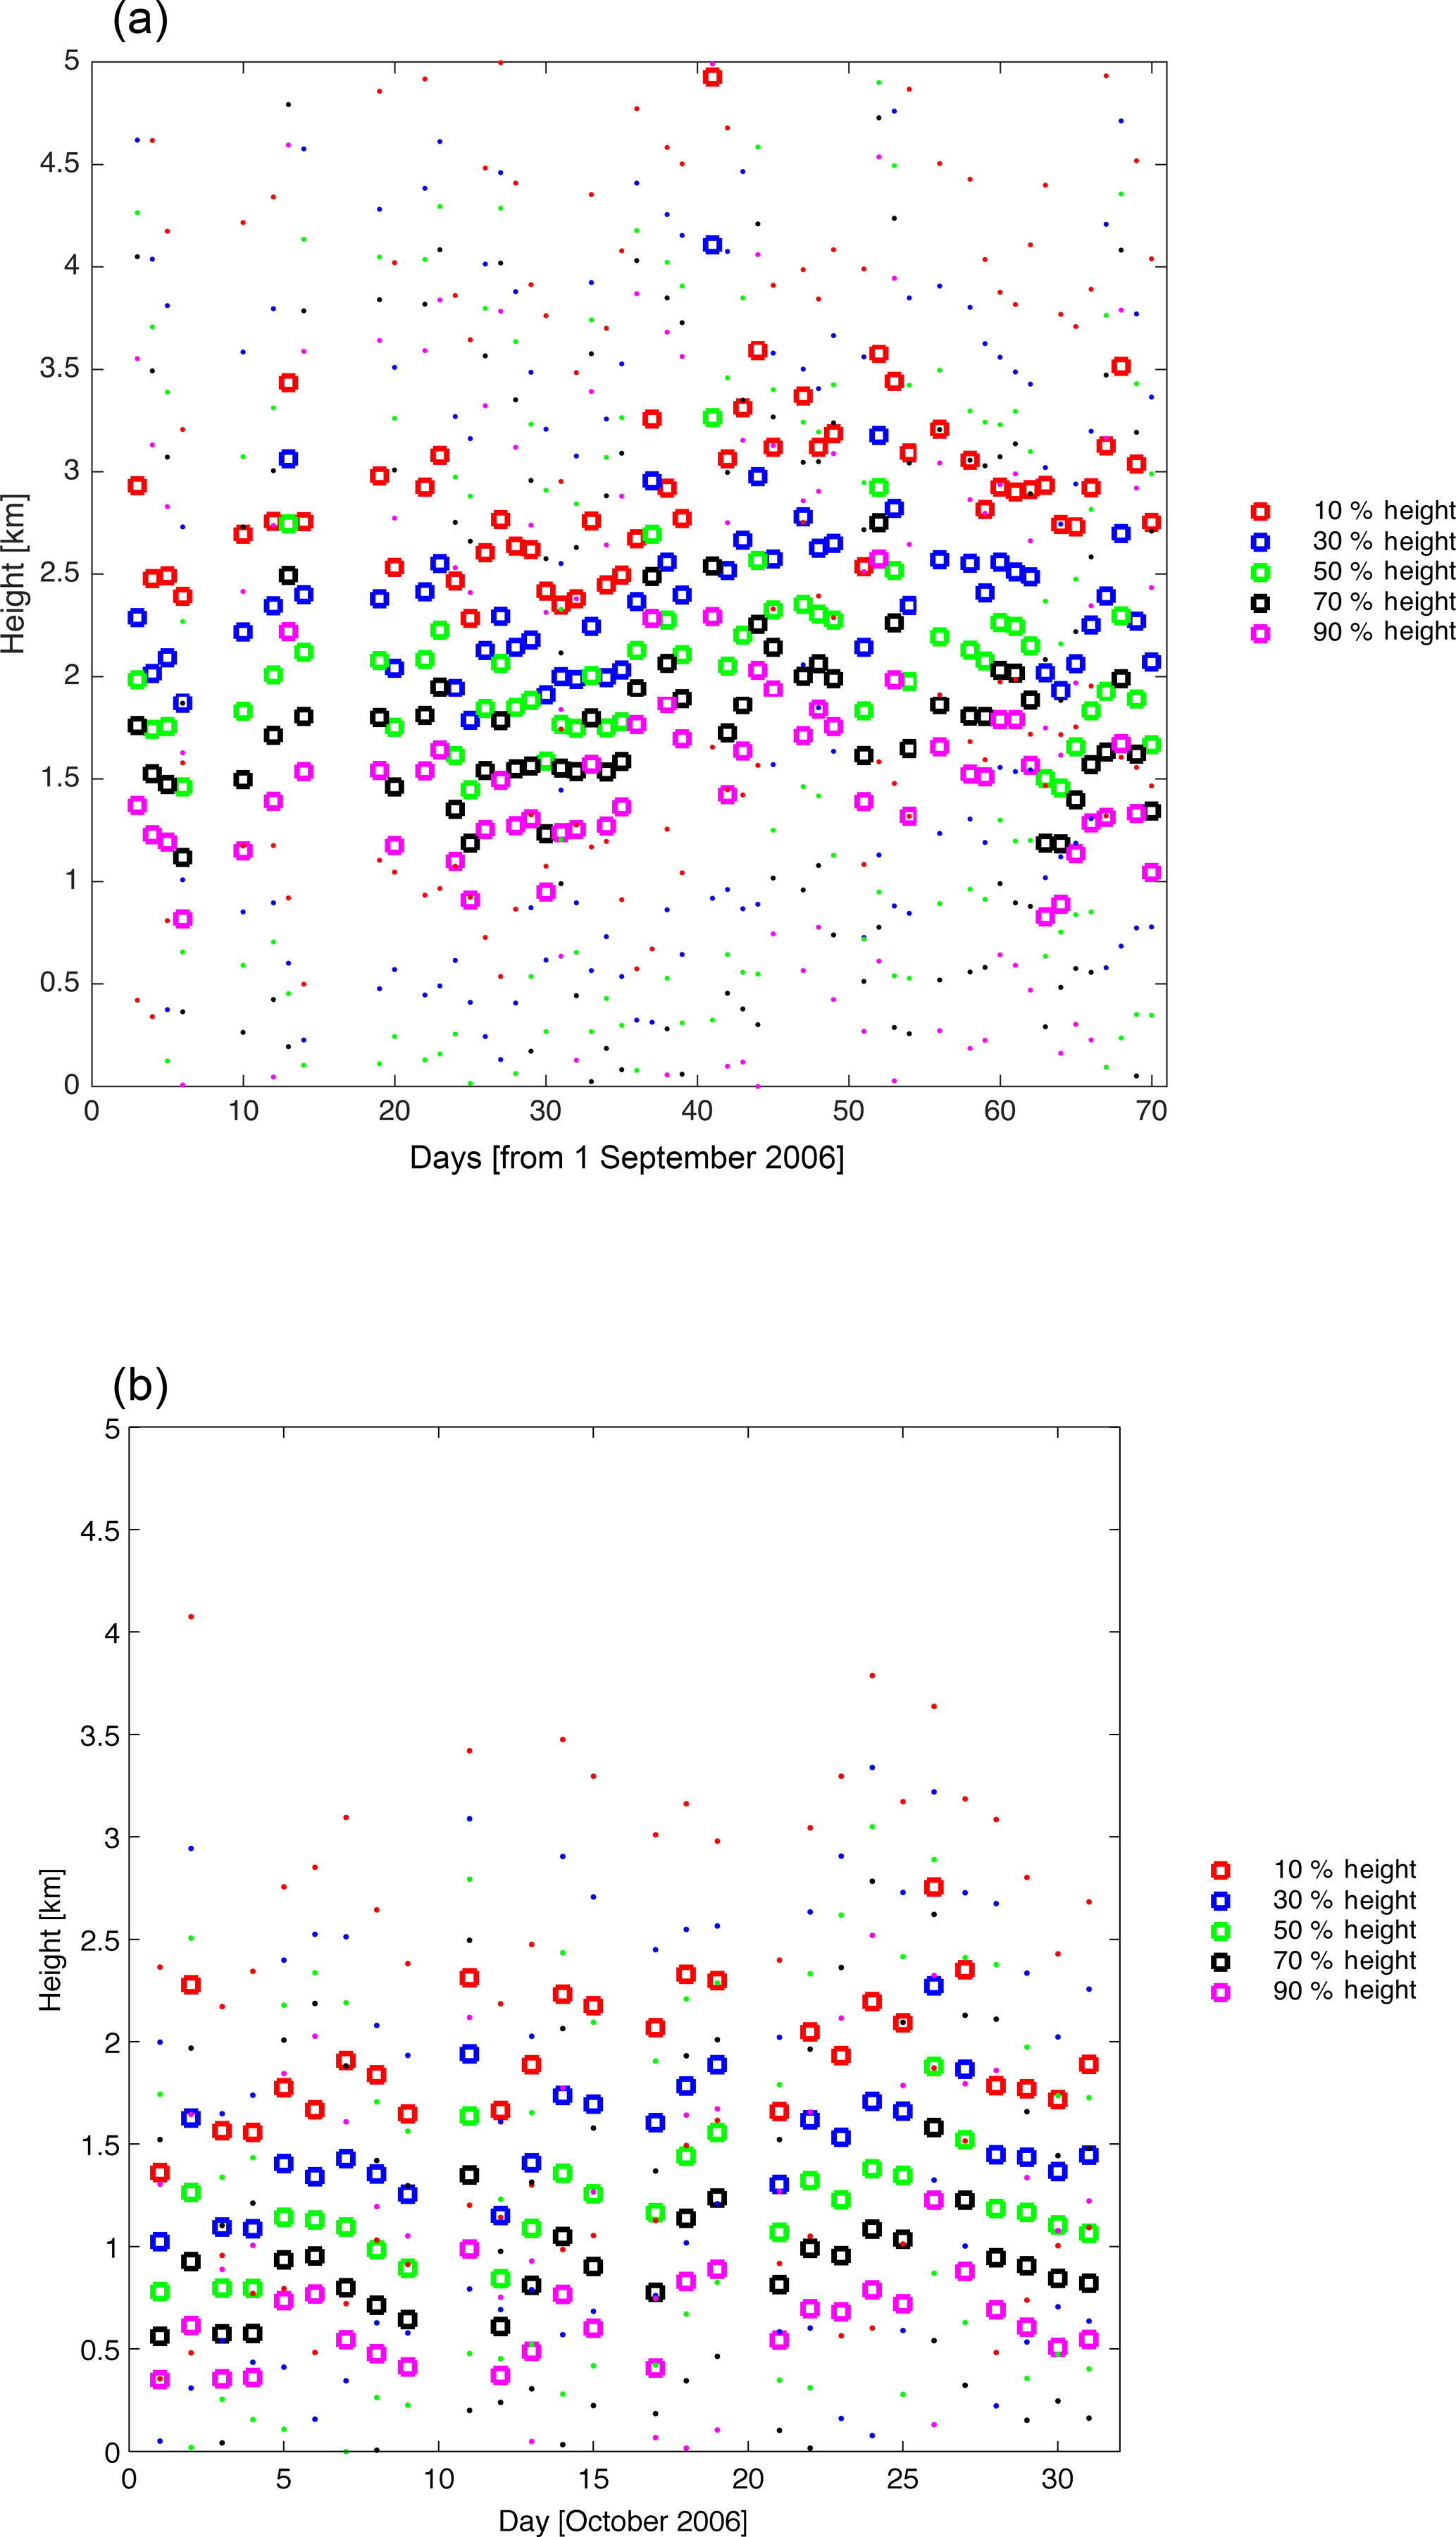
Figure 3Time series of measured CALIPSO extinction heights over the fire-constrained (a) and non-fire-constrained (b) regions as given in Fig. 1. Note that for the fire-constrained region, the analysis (and hence the data) has been extended for the period from 3 September through 9 November. For both plots, the dots correspond to the height of the column integrated backscatter at: 10 % (red) (top), 30 % (dark blue), 50 % (green), 70 % (black), and 90 % (magenta) (bottom). The circles are computed daily means, while dots are the computed daily standard deviation bands. There was no measurement over the region on 7, 8, 9, 11, 15, 16, 17, 18, and 21 September and 10, 16, 20, 25, and 27 October.
The extinction-weighted top (10 % vertically integrated height), middle-upper (30 % vertically integrated height), median (50 % vertically integrated height), middle-lower (70 % vertically integrated height), and bottom (90 % vertically integrated height) are computed for each individual measurement, with the values retained if the aerosol is not in the stratosphere (assumed to be 15 km) (Supplement Fig. S1). The data is then aggregated first by day, and second by geography, either into the fire-impacted region, or the non-fire-impacted region, based on (Fig. 1) (Cohen, 2014). The aggregated set of measurements is used to compute probability densities and statistics, demonstrating the vast difference over the fire-impacted and non-fire-impacted regions (Fig. 3a, b). The vertical heights are both significantly higher and less variable (p<0.01) over the fire region than the non-fire region, from 3 September through 9 November.
Measurements of aerosol optical depth (AOD) (Kaufman et al., 2003), FRP, and fire temperature (TF) (Freeborn et al., 2014; Ichoku et al., 2008) are obtained from the MODIS instrument aboard both the TERRA and AQUA satellites. Version 5, level 2, swath-by-swath measurements, at daily resolution are used for AOD (best solution 0.55 micron), with a spatial resolution of 10 km by 10 km, and FRP ∕ TF, with a spatial resolution of 1 km by 1 km. Given the prevalence of clouds in this region, the cloud-cleared products are used, leading to a possible low bias in the FRP ∕ TF measurements, as well as some fires not being measured at all (Cohen et al., 2017; Freeborn et al., 2014; Ichoku et al., 2008; Kahn et al., 2008, 2007). While some grids are found to be contaminated, the sheer spatial distance of the plume and the fact that the overwhelming majority of atmospheric aerosols during this time of the year are due to fires, results in no observable bias in the overall statistics of the measured AOD (Cohen, 2014); this is observed by looking at the spatially averaged MODIS AOD and statistics over the fire-constrained and non-fire-constrained regions (Fig. 2). The AOD is higher (p<0.01) over the fire-constrained region, from 3 September through 9 November, making the findings consistent with the approach employing the 12 years worth of MISR measurements, as well as the results from the CALIOP observations already discussed.
In terms of MODIS retrieval uncertainties over land, especially during fire events, there are two important issues to consider. The first is that under extremely high AOD conditions (AOD > 2), aerosols are frequently flagged/reclassified as clouds, which brings about a negative bias. This bias would lead to an even higher AOD over the fire plume region if it were properly handled, resulting in an even larger difference between the “fire region” and the “non-fire region”. The second is that the error in the over-land retrieval can go as high as 15 %. However, based on the results in (Figs. 2, S2), the difference between the “fire region” and the “non-fire region” is statistically sound even assuming the error is larger than 15 %. It is also the reason why MISR was used for the initial definition of the two regions, since its ability to cloud clear is better than MODIS over this region (Kahn et al., 2010).
While there are many errors involved with using the satellite data, the errors in this case are small enough as not to impact the analysis and results over Southeast Asia during the fire season (Cohen, 2014; Cohen et al., 2017). The AOD and certain surface products, when used to run models, have been found to compare in magnitude, spatial, and temporal extent, to various ground-based surface and column measurements, such as from the Aerosol Robotic Network (AERONET), the United States National Oceanic and Atmospheric Administration surface measurement network (NOAA), and other available air pollution networks. The data-driven models have been shown to lead to a reduction in the annualized RMSE as compared with the Intergovernmental Panel on Climate Change Representative Concentration Pathways (IPCC RCP) emissions scenarios by a factor of 2 to 8 against AERONET stations throughout Asia (Cohen and Wang, 2014). Furthermore, on a month-to-month basis, the results of the data-driven models have been shown to lead to a reduction in the RMSE by a factor of 1.8 and of an improvement in the coefficient of determination statistic (R2) by a value of 0.2 to 0.3, when compared against the Global Fire Emissions Database dataset (Cohen 2014; Cohen et al., 2017). Given these findings, it is reasonable to assume that the methodology is as reliable as anything else presently available.
2.3 Plume rise model
A simple model is employed to simulate the height to which a parcel of air initially at the surface over the fire will rise, based on buoyancy and vertical and horizontal advection (Supplement). The formulation requires information about the temperature and radiative power of the fire as well as local meteorology (Achtemeier et al., 2011; Briggs, 1965), and yields an idealized height to which aerosols emitted will rise. The buoyant plume rise is a thermodynamic approximation in nature and thus not as physically realistic as a large eddy approach, which solves the atmospheric fluid dynamical equations by parameterizing turbulence at the scale of tens of meters. However, it is less computationally expensive and more generalizable in the context of approximating the thousands of fires spread geographically over hundreds of thousands of square kilometers. Furthermore, it is more physically realistic than empirical relationships from multi-angle measurements (Sofiev et al., 2012), which have also been attempted, but show poor performance in Southeast Asia.
These relationships are efficiently solved using measurements of meteorological and fire properties, allowing them to be used as rapid parameterizations within regional or global models. However, there are errors associated with reconciling the different temporal and spatial scales of reanalysis meteorology, especially convection and associated transport. Firstly, cloud cover in this region leads to both missing fires and low bias in measurements of fire properties (Sofiev et al., 2012; Kaufman et al., 2003). Secondly, cloud cover also leads to a heavier contribution of model results in the reanalysis meteorology. Finally, the effects of the optically thick aerosol plume's feedback on the radiative profile is likely important, but beyond the scope of this work and is therefore not taken into consideration (Ekman et al., 2007; Wang, 2007).
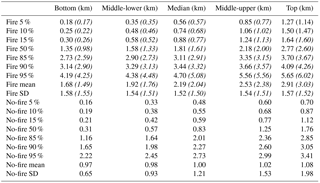
Table 1Statistical summary of measured CALIPSO smoke plume heights in the El Niño Season of 2006, at different percentiles of extinction height (top: Z=10 %, middle-upper: Z=30 %, median: Z=50 %, middle-lower: Z=70 %, and bottom: Z=90 %). The numbers in normal print correspond to the data during the maximum of the fire season in October, while those numbers in (italics) correspond to the entire fire season from 3 September through 9 November. All data is further divided into the subset of the Maritime Continent impacted by smoke (Fire), and not impacted by smoke (No-fire) (Fig. 1). “Mean” is the average, “SD” is the standard deviation, and percentages XX% are the corresponding distribution's percentiles.
3.1 Measured aerosol vertical distribution
The fire-constrained aggregated daily statistics of the measured vertical aerosol height from CALIPSO (Winker et al., 2003) are given in (Fig. 3a), with the aggregated statistics from the October fire-maximum time and (the entirety of the fire season) over the fire-constrained region of the bottom, middle-lower, median, middle-upper, and top heights, respectively: 1.68±1.55 km (1.49±1.58 km), 1.92±1.51 km (1.76±1.54 km), 2.19±1.50 km (2.04 ± 1.52 km), 2.53±1.51 km (2.38±1.54 km), and 303±1.52 km (2.91±1.57 km) (Table 1). These results are supported by the statistical values of aerosol heights measured by the micro-pulse lidar station in Singapore throughout the period from 1 September to 30 November 2015 (Fig. S3), which are found to range from 1.6 to 2.4 km. 2015 was selected to compare against ground-based lidar measurements, since it was an El Niño year, and there were no such measurements available from 2006. It is also known that in 2015 Singapore contained large amounts of aerosols advected from downwind burning sources. Overall, the close resemblance between these years allows inference from the results.
In comparison, the non-fire-constrained region's aggregated statistics of the measured vertical aerosol height is quite different (Fig. 3b), with the respective bottom, middle-lower, median, middle-upper, and top heights during the October maximum-fire period being 0.65±0.98 km, 0.93±0.98 km, 1.21±1.00 km, 1.53±1.02 km, and 1.98±1.08 km, respectively (Table 1). The average aerosol height over the fire-constrained region is both much higher and more variable at every vertical level as compared to the non-fire-constrained domain. This difference leads to 61 (+6–10) % of the bottom of the smoke plume and 83 (+8–11) % of the median of the smoke plume in the free troposphere during the October maximum; while 49 (+7–9) % and 75 (+12–12) % of the respective bottom and median of the aerosol loading is in the free troposphere over the entirety of the fire season, in the fire-constrained domain. Conversely only 17 (+10–9) % of the median of the aerosol loading is located in the free troposphere over the non-fire-constrained domain during the October maximum fire period. However, the variability is roughly constant at all levels over the fire-constrained region, while the variability increases with vertical level, over the non-fire-constrained region. These results are based on more than 10 000 daily CALIOP measurements.
All three findings, higher average aerosol height, larger variance of height, and a consistent variance of height at all levels, are consistent with areas where most of the aerosol loading is due to surface fires. Firstly, the buoyancy from fires increases the expected height, with differences in buoyancy from different strength fires producing random variability in the measured heights. Therefore, as long as the distribution of fire strength and meteorology do not differ too much from day to day, the variance in aerosol heights should also not vary much. Over non-fire-constrained regions, however, the major contribution to the vertical aerosol variability is convection, which is expected to increase in variability the higher one moves upwards from the surface.
Furthermore, the relatively constant variability across the heights in the fire-constrained region is consistent with a proposed radiative-stabilization effect. The extremely high measured AOD values found by MODIS (Kaufman et al., 2003) over the fire-constrained domain (from 0.5 to 2.0, with most days over 1.0), leads to observable surface cooling (Fig. 2). Additionally, black carbon aerosols (BC) emitted from the fire, absorbs incoming solar radiation near the upper portion of the plume, providing a source of warming. This combination leads to additional stabilization of the atmosphere, and therefore reinforces the observed vertical aerosol distribution.
These results are thus consistent with the observed reduction in in situ vertical processing over the regions downwind from the fire sources, but still within the fire-constrained plume region, where buoyancy from the fires and the self-stabilization effect seem to contribute more than random deep convection. However, over the non-fire-constrained region, given the low AOD and lack of fires, both of these effects are not observed, and convection dominates, which is consistent with the less uniform vertical distribution. Given these clear and observed differences, only results from the fire-constrained region will be considered further.
A significant amount of aerosol mass exists in the free troposphere over this region. Assuming the measured boundary layer height can be represented by the range from 700 to 1300 m, with a central value of 1000 m (as observed in Singapore, Chew et al., 2013) and applied over the domain, the resulting total loading of aerosols over the boundary layer can be computed. This value, when applied over the entire geographical domain, gives measurements above the boundary layer in October of (67, 61, 51) %, (80, 70, 61) %, (91, 83, 72) %, (96, 92, 83) %, and (99, 97, 94) % of the respective bottom, lower-middle, median, upper-middle, and top extinction. Although October is slightly more intense, the same pattern, just to a slightly lesser extent, is found throughout the entire season, with (56, 49, 40) %, (72, 61, 51) %, (87, 75, 63) %, (96, 90, 77) %, and (99, 97, 93) % of the measurements of the bottom, lower-middle, median, upper-middle and top extinction, respectively. This is much higher than previous studies, which indicated most of the smoke remained within the boundary layer (Tosca et al., 2011).
Table 2Summary of measured (CALIPSO) smoke plume heights over the entire fire season from 3 September to 9 November 2006, for days that are statistical outliers. The values here correspond to having a mean value more than 85 % or less than 15 % in bold, or a mean value from 80 to 85 % or from 15 to 20 % in regular text. The levels are given as a percentile of extinction height over the subset of the Maritime Continent impacted by smoke (fire-constrained), based on the MISR observations (Fig. 1).
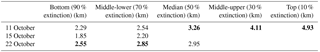
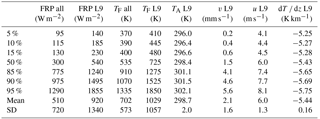
Table 3Statistics of measured fire properties (FRP and TF), for all measured fires (ALL) and level 9 confidence fires (L9) and MERRA meteorological properties (TA, v, u, dT ∕ dz) corresponding to the geographic locations of L9. All data is constrained by the boundaries of the fire extent, and is applicable to results from the maximum of the fire season corresponding to October 2006 (Fig. 1). The distribution's percentile is given as “XX %”, the mean and standard deviation are given as “mean” and “SD”, respectively. Note that there were no observed fires of L9 on the following dates: 17, 22, 23, 24, 25, 26, 27, 29, 31 October.
Analysis of the daily measured heights demonstrates three statistically unique days: 11, 15 and 22 October (Table 2). On the 11 October, the top and upper-middle measurements fall within the top 15 %, while the median measurements fall within the top 20 % of the month's measurements, implying that the result is consistent with a deep, single layer, extending throughout the lower and middle free troposphere. The 15 and 22 October, while not being as high in the middle troposphere, also have little to no aerosol in the planetary boundary layer due to being more confined in the vertical, implying a narrow layer in the middle free troposphere. These results are consistent with the measured aerosol layer being mostly in the free troposphere, a result that is not consistent with the measured FRP or meteorology. This leads to two important implications. First, that aerosol lifetime on these days will be considerably longer than models typically reproduce, and thus the radiative forcing will be considerably more warming. Secondly, that the typical modeling approach which places fresh aerosols directly emitted from the surface, to the given top of the plume, is likely not true. These are two serious issues impacting the ability of most models to be able to correctly capture the aerosol loading.
On the remaining days, the measured heights are consistent on a daily average basis with relatively uniform emissions, meteorology, and vertical buoyant rise. Although there is some intense but heterogeneous forcing impacting the vertical distribution, such as localized convection and aerosol–cloud interactions, these are generally not observed to bias the overall plume's properties. Only on 11, 15, and 22 October are there higher heights or a narrower vertical structure, combined with no readily available explanation to be found in the fire, AOD, or meteorological properties. This combination can only be explained by either a clear change in the convection on the abovementioned days, or some other phenomena not considered in or otherwise represented by the reanalysis meteorology. The robustness of this approach assures the validity of these results over the region and time period herein.
A comparison between the inverse model by Campbell et al. (2013; Fig. S6) and this work's underlying Kalman filter plus variance maximization modeled fields, shows that this new modeling approach performs better during the biomass burning season (Cohen, 2014, 2017; Cohen and Wang, 2014). Furthermore, the results found using the approach employed here, match well with individual measurement campaigns lead by Lin Neng-Hui, et al. (2013, 2014, etc.), and the AD-Net measurement network (Sugimoto et al, 2014b). The common finding is that a small number of ground-based lidar at multiple places within the northern portion of Southeast Asia and greater East Asia also observe something similar. However, as the geographic regions are not identical, they cannot be used to directly validate the region studied here. There is, however, a sufficient amount of similarity, to make an anecdotal connection. Given these factors, we present the results here as the best available for use at this time, for targeting this region of the world during the biomass burning season.
3.2 Measured fire and meteorological properties
The daily aggregated measurements of fire radiative power (FRP) (Freeborn et al., 2014; Ichoku et al., 2008) indicate there are 109 395 actively burning 1 km × 1 km pixels in October 2006. However, filtering for high confidence (level 9) active fires, reduces this number to 6941 1 km × 1 km pixels. The respective measurements have 10 %, median, and 90 % values of FRP of (115, 300, 975) W m−2 for all fires and (185, 540, 1495) W m−2 for high confidence fires (Table 3). Overall, these values are much lower than FRP measured over other intensely burning regions (Giglio et al., 2006). However, the results are consistent with the fact that fires in the Maritime Continent occur under relatively wet surface conditions, due to high levels of mineral-soil moisture, extensive peat, and intermittent localized precipitation (Couwenberg et al., 2010). These results are based on more than 3000 daily MODIS fire hotspots and associated meteorological measurements.
There is only 1 day, 2 October, with a statistically high FRP (daily mean more than monthly 90 % value), for high confidence fires. Similarly, there are 2 days, 28 and 30 October, with an abnormally low FRP (daily mean less than monthly 15 % value), for high confidence fires. None of these days have a statistically abnormal fire vertical height distribution. However, 28 and 30 October both show a sizable increase in AOD over the fire constrained region, with the AOD more than two standard deviations greater than the mean over the non-fire-constrained region, as compared to the period of time from the 25 through to the 27. One consistent rationale is that there was a large-scale precipitation event at that time, which increased both aerosol removal and wetting of the surface. This in turn led to a lower temperature and FRP and a correspondingly higher aerosol emissions factor on these days. Overall, there is no apparent impact of day-to-day variability of measured FRP driving observed variation in measured aerosol heights, and hence only high confidence fire data is subsequently used.
To examine this hypothesis, the GPCP (Global Precipitation Climatology Project) “one-degree daily precipitation data set” of global precipitation has been employed to study the amount and duration of rainfall over the fire-burning and non-fire-burning regions (Huffman et al., 2012). A spatial–temporal analysis of this dataset, over both the fire region and the no-fire region confirms the abovementioned hypothesis (Fig. S4). Overall, there was considerably lower rainfall over the fire region than the no-fire region, however, there was a decrease in AOD and FRP over the fire region on all days; there was also heavy rainfall at the same time, or 1 or 2 days before. The measurements have a correlation coefficient of −0.39 with a corresponding p<0.01. There is no other statistically significant correlation found over any other combination of the regions with any other combination of rainfall.
The Modern-Era Retrospective Analysis for Research and Applications (MERRA) (Rienecker et al., 2011) reanalysis meteorology is used for the horizontal and vertical wind, and vertical temperature profile at each location where a fire is measured (Table 3). MERRA was chosen because it is based on NASA satellite measurements, and thus should be more consistent with the measurements used here. With the exceptions of 5 and 20 October, the horizontal wind is relatively calm 6.0±1.3 m s−1. Throughout the entire month, the vertical temperature gradient is also relatively stable K km−1, with only seven individual fires occurring under unstable atmospheric conditions. Therefore, dynamical instability is not expected to contribute greatly to the vertical distribution (Stone and Carlson, 1979). Furthermore, the role played by the large-scale vertical wind is small 2.1±1.6 mm s−1. Given the atmospheric stability and fire-controlled buoyancy conditions, the plume rise model approach should offer a reasonable approximation of the aerosol vertical distribution.
The approach used here relies upon the atmosphere being either stable or barely unstable. In this part of the world there are two reasons that contribute to most fires occurring under such conditions. Firstly, that major instability frequently leads to rain, fire suppression, and aerosol wash-out. Secondly that induced surface cooling and atmospheric heating by the extensive aerosol layer itself tends to increase atmospheric stability. Such points are made clear in terms of the major unaccounted for processes in the MERRA data at this resolution: localized convection (due to model resolution), and aerosol cooling and in situ heating effects (not incorporated into the underlying model). In theory the direct and semi-direct effects may be able to be parameterized, but this would require a higher order model. Since these conditions and effects are not considered by the plume rise model, they cannot therefore be explained for by discrepancies in the modeled vertical distribution.
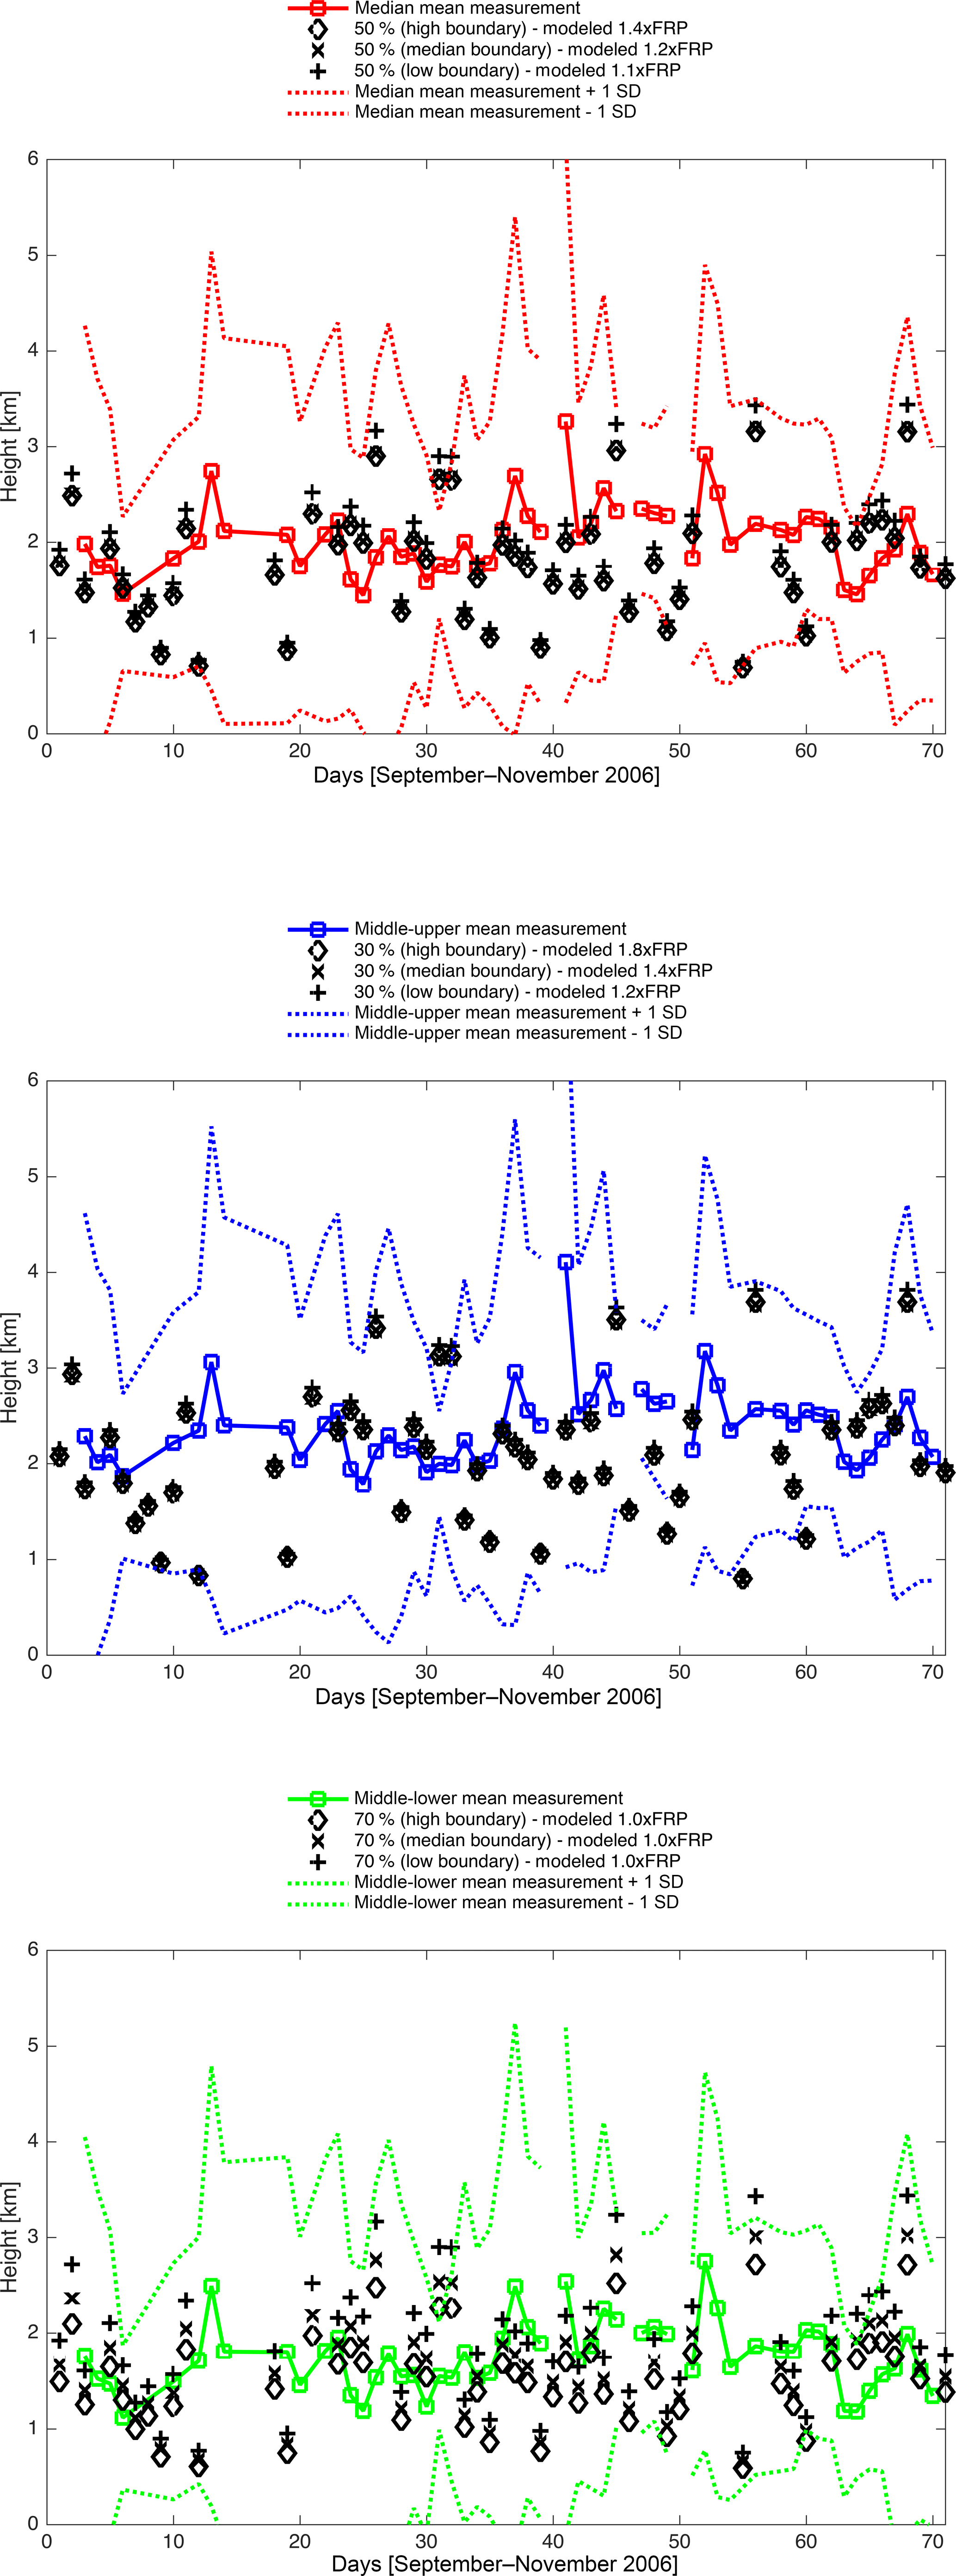
Figure 4Time series of measured extinction height levels for the median heights (a) (red circles and line) with their corresponding ±1 standard deviation range (red dotted line), and respective middle-upper (b) (blue), and middle-lower (c) (green), are given below. The best fitting modeled heights for the median daily boundary layer height of 1000 m are given as black x's, and are found to be respective FRP enhancements of 1.0, 1.2, and 1.4. The best fitting modeled heights for the low daily boundary layer height of 700 m are given as black +'s, and are found to be respective FRP enhancements of 1.0, 1.1, and 1.2. The best fitting modeled heights for the high daily boundary layer height of 1300 m are given as black o's, and are found to be respective FRP enhancements of 1.0, 1.4, and 1.8.
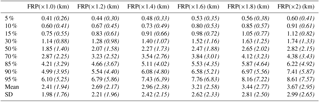
Table 4Statistics of the modeled fire heights corresponding to the maximum fire season of October and the (entire fire season). All values are computed using level 9 confidence fires (L9) and MERRA meteorology (TA, v, u, dT ∕ dz) at the corresponding geographic locations, with the daily average boundary layer assumed to be 1000 m. Sensitivity tests are shown with their respective weighting factor (1.2, 1.4, 1.6, 1.8, or 2.0) applied to the measured FRP. The modeled heights are given by percentile from the bottom (5 %) to the top (95 %), while the mean and standard deviation are given as “mean” and “SD”. Note that the model was not run on the following days, during which there were no observed L9 fires: 13, 14, 15, 16, 17, and 27 September, and 17, 22, 23, 24, 26, 27, and 31 October, and 2, 9, 14, 16 through 28 and 30 November.
3.3 Modeled aerosol vertical distribution
Applying the plume rise model, the aggregated daily statistics of the vertical aerosol height at the bottom, lower-middle, median, upper-middle, and top for the October fire-maximum time and (the entirety of the fire season) are 0.60 km (0.41 km), 1.14 km (0.88 km), 1.85 km (1.40 km), 2.87 km (2.25 km), and 4.99 km (3.95 km), respectively, (Fig. 4, Table 4). The mean of the daily median, lower-middle, and bottom modeled heights are consistently lower than the respective mean of the measured heights for the October fire-maximum time and (the entirety of the fire season) by 0.34 km (0.64 km), 0.78 km (0.88 km), and 1.08 km (1.08 km), respectively. The day-to-day differences show that the model generally underestimates the measurements, with the minimum and maximum differences between the two both ranging from −0.92 to 1.36 km, −0.63 to 2.20 km, and −0.19 to 3.02 km, respectively. The upper-middle modeled height is about equal to measurements, with a mean difference for the October fire-maximum time (and the entirety of the fire season) of an underestimate of 0.34 km over the October maximum to an overestimate of (0.13 km) through the entire fire season. The associated day-to-day variations are wide, but are roughly centered around zero, and vary from −1.22 to 1.06 km. Finally, the top modeled heights are considerably higher than measurements, with an average overestimate for the October fire-maximum time (andthe entirety of the fire season) being 1.96 km (and 1.04 km). The day-to-day difference between the model and the measurements generally overestimates the measurements, with a value varying from −1.54 to 0.81 km.
The model underestimates the height of the median through bottom of the plume, while simultaneously overestimating the top. Firstly, this means that the model is not accounting for enough energy to obtain the average rise of the plume. At the same time, the modeled vertical spread is too large, implying other factors limit the height gain near the top of the plume and enhance the height near the bottom. These results are consistent with one or both of the two hypothesized effects; first, that a low bias exists in the measured values of FRP (Kahn et al., 2007, 2008), leading to insufficient buoyancy. Second, that in situ stabilization occurs due to aerosol radiative cooling in the lower parts of the plume and aerosol radiative heating within the upper parts of the plume. This combination of factors is also consistent with the observed underestimate in measured FRP to match the median height, as well as the hypothesized complete non-detection of small fires (Kaufman et al., 2003). There are also uncertainties in the MERRA reanalysis products, but given the large sample size and the narrowness of the MERRA distribution, the impact of these uncertainties is around 10 %, which as we show later is considerably smaller than changes in the FRP.
A sensitivity analysis is used to quantify the effects of a low bias in FRP, by applying a constant multiplicative factor to the measured FRP for each fire, from 1.0 to 2.0 in steps of 0.1 (although only the results in steps of 0.2 are given in Table 4). Although there are also uncertainties associated with measured vertical wind and temperature structure, this is not considered (Table 3), since there is no way to couple meteorological effects at a sub-grid scale, or otherwise include these factors in the reanalysis meteorology. The results are obtained by minimizing the root mean square (rms) difference between the daily measured and modeled heights, for each FRP scaling factor, at each of the middle-upper, median, and middle-lower levels. The respective best-fit enhancement factors over the October fire maximum (and the entire fire season) are 1.0 (1.0) for middle-upper measurements, having an RMSE of 0.69 km (0.66 km); 1.2 (1.2) for median measurements, having an RMSE of 0.78 km (0.72 km); and 1.6 (1.4) for middle-lower measurements, having an RMSE of 0.92 km (0.82 km) (Fig. 4).
Another source of uncertainty is the height of the boundary layer itself, due to both a lack of measurements and the poor ability of reanalysis and other global-scale products to simulate the boundary layer in this part of the world. As before, the model was run in a sensitivity mode, assuming three different average boundary layer heights. The results for the middle-upper, median, and middle-lower levels' best fit values over the October fire maximum (and the entirety of the fire season) are enhancements of 1.0, 1.4, and 1.8 and (1.0, 1.1, and 1.5), respectively, for a boundary layer height of 1300 m, and 1.0, 1.3, and 1.6 and (1.0, 1.1, and 1.4) for a boundary layer height of 700 m. These results show that this factor is highly important in terms of modulating the magnitude of the best-fitting FRP scaling factor. However, a similar bias still exists, where the model is reasonably good at reproducing the upper-middle levels of the plume, but is incapable of reproducing the median and middle-lower levels of the plume. Additionally, the larger values of the RMS error at the two more extreme boundary layer heights lend further support to the initial supposition: overall the boundary layer height throughout the fire region, lies between 700 m and 1300 m.
Although there is no single best-fit FRP scaling factor, a reasonable fit of the model, based on measured values from the middle-lower to the middle-upper plume levels can be obtained by using an appropriate FRP enhancement. The results establish that current plume rise models can reproduce the median vertical plume height over Southeast Asia by increasing the FRP by 20 %, a finding consistent with the FRP generally being underestimated over this region. By changing the FRP enhancement from 0 to 60 %, the central 40 % of the aerosol plume's vertical extent can be modeled, although the top and bottom heights of the plume cannot be reproduced. Additionally, the modeled plume is widely spread as compared to the narrowness of the measured plume. Unfortunately, rectifying these limitations will likely require the use of a more complex modeling approach and the improvement of measured fire data.
There are additional errors associated with the non-complete complexity of the models employed. The models do not capture the contribution of atmospheric stabilization due to both the direct and semi-direct aerosol effects. Furthermore, these models do not take the impacts of localized convection into account. However, the majority of the other studies that employ regional and global models use this exact same methodology, and hence also neglect these same small-scale phenomena in terms of communication between the chemistry, radiation, and meteorology.
This work quantifies the significant present-day underestimation of the vertical distribution of aerosols over the Maritime Continent during an El Niño influenced fire season, by introducing a new method to appropriately constrain the measurements over the geographical region of the aerosol plume. While this was a large-scale fire event, it was very unique, because it occurred throughout almost all of September, and all the way through the first third of November. Typically, the wet season arrives in this part of the world by the middle of October. The wetness of the soil and the large-scale meteorological flow of the study period were, therefore, both different from a more typical year. As a result, the measured heights over the constrained region were found to be higher than previously thought. During the study period about 61 (+6–10) % of the bottom of the aerosol layer and 83 (+8–11) % of the median of the aerosol layer were in the free troposphere during the October maximum; while 49 (+7–9) % and 75 (+12–12) % of the respective total aerosol height and the median of the aerosol plume were found in the free troposphere during the entirety of the fire season. Due to the considerably higher vertical rise, the aerosols can be advected thousands of kilometers from their sources and have a greater impact on the atmospheric and climatic systems. Additionally, over the fire-constrained region, the vertical variability of the plume was found to be uniform throughout its height, implying that it is mostly controlled by local forcing, such as the buoyancy released by fires, localized convection, and aerosol–radiative feedbacks, including direct and semi-direct effects.
Application of a plume rise model showed that there was an overall low bias against measured heights. This is consistent with the FRP being underestimated in this region of the world due to large-scale cloud cover. It was also determined that measured vertical heights are more narrowly confined in the vertical than those simulated by models. A robust sensitivity analysis found that the middle-lower through middle-upper extent of the plume can be reproduced if an appropriate (although changing) enhancement is applied to the FRP ranging from 1.0∗FRP to 1.6∗FRP over the maximum period of the fire season, through the month of October (and from 1.0∗FRP to 1.4∗FRP over the fire season as a whole, for most of September, all of October, and the first third of November). Hence, the variable FRP enhancement factor approach can allow for improved modeling of the height statistics for the middle-upper to middle-lower extent of the plume.
It is not possible, however, to reproduce either the top or bottom of the measured heights, the knowledge of which is important to constrain the impacts of long-range transport and aerosol–climate interactions. Nor is it possible to reproduce the narrow spread of the measured heights. These results are consistent with the general understanding of current model shortcomings. Hence both the underestimation of FRP values and current shortcomings in models need to be addressed, if we are to successfully model the vertical aerosol distribution over this region of the world.
The results have been found to be robust over a region that behaves roughly uniformly over thousands of kilometers, including regions both near and far from the source of the fires. Since there are only a few days that have relatively unique aerosol and meteorological properties over the period studied, the results support a few robust conclusions. Firstly, if we want to improve the ability to model aerosol heights, newer modeling approaches and improvements which will be able to resolve local-scale forcing, such as deep convection, aerosol–radiation interactions, and aerosol–cloud interactions need to be considered. Secondly, the biased underestimation of FRP is also an important point to improve the aerosol height modeling, especially under conditions where cloudiness occurs or the measured AOD levels are very high. These errors are exacerbated over regions where large-scale precipitation is very low or where there is substantial aerosol–cloud intermixing. In all cases, until these model and measurement improvements are made, there is expected to be a significant underestimation of the aerosol loadings and radiative forcing distribution regionally, and to some extent globally. It is hoped that in the interim, the scientific community will adapt a variable enhancement of FRP in tandem with measurement-constrained boundaries of smoke plumes, as a way to more precisely reproduce the statistics of the vertical aerosol distribution.
All of the base data used, from MODIS, MISR, and CALIPSO, came directly from the NASA data servers. All data overlapping the regions mentioned in this paper, over the time analyzed, were used. In addition, higher-level analytical results from the raw data and the model outputs are given at https://doi.org/10.6084/m9.figshare.6269192.v1.
The supplement related to this article is available online at: https://doi.org/10.5194/acp-18-7095-2018-supplement.
The authors declare that they have no conflict of interest.
We would like to acknowledge the PIs of the NASA MODIS, MISR, and CALIPSO
projects for providing the data. The work was supported by the Chinese
National Young Thousand Talents Program (Project 74110-41180002), the
Chinese National Natural Science Foundation (Project 74110-41030028), and
the Guangdong Provincial Young Talent Support Fund (Project 74110-42150003).
Edited by: Aijun Ding
Reviewed by: four anonymous referees
Achtemeier, G., Goodrick, S., Liu, Y., Garcia-Menendez, F., Hu, Y., and Odman, M.: Modeling smoke plume-rise and dispersion from Southern United States prescribed burns with daysmoke, Atmosphere, 2, 358–388, 2011.
Bjornsson, H. and Venegas, S.: A Manual for EOF and SVD Analyses of Climate Data, Department of Atmospheric and Oceanic Sciences and Centre for Climate and Global Change Research, McGill University, Tech. Rep., 1997.
Bond, T. C., Streets, D. G., Yarber, K. F., Nelson, S. M., Woo, J. H., and Klimont, Z.: A technology-based global inventory of black and organic carbon emissions from combustion, J. Geophys. Res., 109, D14203, https://doi.org/10.1029/2003JD003697, 2004.
Briggs, G. A.: A plume rise model compared with observations. J. Air Pollut. Con. Assoc., 15, 433–438, 1965.
Burnett, R., Pope, A., Ezzati, M., Olives, C., Lim, S., Mehta, S., Shin, H., Singh, G., Hubbell, B., Brauer, M., Anderson, R., Smith, K., Balmes, J., Bruce, N., Kan, H., Laden, F., Pruss-Ustun, A., Turner, M., Gapstur, S., Diver, R., and Cohen, A.: An Integrated Risk Function for Estimating the Global Burden of Disease Attributable to Ambient Fine Particulate Matter Exposure, Environ Health Pers., 122, https://doi.org/10.1289/ehp.1307049, 2014.
Campbell, J. R., Reid, J. S., Westphal, D. L., Zhang, J. L., Tackett, J. L., Chew, B. N., Welton, E. J., Shimizu, A., Sugimoto, N., Aoki, K., and Winker, D. M.: Characterizing the vertical profile of aerosol particle extinction and linear depolarization over Southeast Asia and the Maritime Continent: The 2007–2009 view from CALIOP, Atmos. Res., 122, 520–543, https://doi.org/10.1016/j.atmosres.2012.05.007, 2013.
Chew, B. N., Campbell, J. R., Salinas, S. V., Chang, C.,W., Reid, J. S., Welton, E. J., and Liew, S. C.: Aerosol particle vertical distributions and optical properties over Singapore, Atmos. Environ., 79, 599–613, 2013.
Cohen, J. B. and Prinn, R. G.: Development of a fast, urban chemistry metamodel for inclusion in global models, Atmos. Chem. Phys., 11, 7629–7656, https://doi.org/10.5194/acp-11-7629-2011, 2011.
Cohen, J. B.: Quantifying the occurrence and magnitude of the Southeast Asian fire climatology, Environ. Res. Lett., 9, 114018, https://doi.org/10.1088/1748-9326/9/11/114018, 2014.
Cohen, J. B., Lecoeur, E., and Hui Loong Ng, D.: Decadal-scale relationship between measurements of aerosols, land-use change, and fire over Southeast Asia, Atmos. Chem. Phys., 17, 721–743, https://doi.org/10.5194/acp-17-721-2017, 2017.
Cohen, J. B. and Wang C.: Estimating Global Black Carbon Emissions Using a Top-Down Kalman Filter Approach, J. Geophys. Res., 119, 307–323, https://doi.org/10.1002/2013JD019912, 2014.
Colarco, P., Schoeberl, M., Doddridge, B., Marufu, L., Torres, O., and Welton, E.: Transport of smoke from Canadian forest fires to the surface near Washington, D.C.: Injection height, entrainment, and optical properties, J. Geophys. Res., 109, D06203, https://doi.org/10.1029/2003jd00424, 2004.
Couwenberg, J., Dommain, R., and Joosten, H.: Greenhouse gas fluxes from tropical peatlands in south-east Asia, Glob. Change Biol., 16, 1715–1732, https://doi.org/10.1111/j.1365-2486.2009.02016, 2010.
Delene, D. J. and Ogren, J. A.: Variability of aerosol optical properties at four North American surface monitoring sites, J. Atmos. Sci., 59, 1135–1150, 2002.
Dennis, R. A., Mayer, J., Applegate, G., Chokkalingam, U., Colfer, C. J. P., Kurniawan, I., and Tomich, T. P.: Fire, people and pixels: linking social science and remote sensing to understand underlying causes and impacts of fires in Indonesia, Human Ecol., 33, 465–504, 2005.
Dubovik, O., Smirnov, A., Holben, B. N., King, M. D., Kaufman, Y. J., Eck, T. F., and Slutsker, I: Accuracy assessments of aerosol optical properties retrieved from Aerosol Robotic Network (AERONET) Sun and sky radiance measurements, J. Geophys. Res., 105, 9791–9806, 2000.
Ekman, A., Engstrom, A., and Wang, C.: The effect of aerosol composition and concentration on the development and anvil properties of a continental deep convective cloud, Q. J. Roy. Meteor. Soc., 133, 1439–1452, 2007.
Ekman, A. M. L., Hermann, M., Gross, P., Heintzenberg, J., Kim, D., and Wang, C.: Sub-micrometer aerosol particles in the upper troposphere/lowermost stratosphere as measured by CARIBIC and modeled using the MIT-CAM3 global climate model, J. Geophys. Res., 117, D11202, https://doi.org/10.1029/2011JD016777, 2012.
Field, R. D., van der Werf, G. R., and Shen S. P. P.: Human amplification of drought-induced biomass burning in Indonesia since 1960, Nat. Geosci., https://doi.org/10.1038/ngeo443, 2009.
Freeborn, P. H., Wooster, M. J., Roy, D. P., and Cochrane, M. A.: Quantification of MODIS fire radiative power (FRP) measurement uncertainty for use in satellite-based active fire characterization and biomass burning estimation, Geophys. Res. Lett., 41, 1988–1994, https://doi.org/10.1002/2013GL59086, 2014.
Giglio, L., Csiszar, I., and Justice, C. O.: Global distribution and seasonality of active fires as observed with the Terra and Aqua MODIS sensors, J. Geophys. Res., https://doi.org/10.1029/2005JG000142, 2006.
Hansen, M. C.: Humid tropical forest clearing from 2000 to 2005 quantified by using multitemporal and multiresolution remotely sensed data, P. Natl. Acad. Sci. USA, 105, 9439–9444, 2008.
Hostetler, C., Hair, J., Liu, Z. Y., Ferrare, R., Harper, D., Cook, A., Vaughan, M., Trepte, C., and Winker, D.: Validation of CALIPSO Lidar Observations Using Data From the NASA Langley Airborne High Spectral Resolution Lidar (retrieved from: https://ntrs.nasa.gov/archive/nasa/casi.ntrs.nasa.gov/20080014234.pdf), 2008.
Hostetler, C., Liu, Z., Reagan, J., Vaughan, M., Winker, D., Osborn, M., Hunt, W., Powell, K., and Trepte, C.: CALIOP Algorithm Theoretical Basis Document – Part 1: Calibration and Level 1 Data Products, Doc. PC-SCI, 201, 2006.
Huffman, G. J., Bolvin, D. T., and Adler, R. F.: last updated 2012: GPCP Version 1.2 1-Degree Daily (1DD) Precipitation Data Set, WDC-A, NCDC, Asheville, NC, Data set accessed November 1, 2017 at http://www.ncdc.noaa.gov/oa/wmo/wdcametncdc.html, 2012.
Ichoku, C., Giglio, L., Wooster, M., and Remer, L.: Global characterization of biomass-burning patterns using satellite measurements of fire radiative energy, Remote Sens. Environ., 112, 2950–2962, 2008.
Kahn, R. A., Gaitley B. J., Garay M. J., Diner, D. J., Eck, T. F., Smirnov, A., and Holben, B. N.: Multiangle Imaging SpectroRadiometer global aerosol product assessment by comparison with the Aerosol Robotic Network, J. Geophys. Res. Atmos., 115, D23209, https://doi.org/10.1029/2010JD014601, 2010.
Kahn, R. A., Chen, Y., Nelson, D. L., Leung, F. Y., Li, Q. B., Diner, D. J., and Logan, J. A.: Wildfire smoke injection heights: Two perspectives from space, Geophys. Res. Lett., 35, L04809, https://doi.org/10.1029/2007GL032165, 2008.
Kahn, R. A., Li, W. H., Moroney, C., Diner, D. J., Martonchik, J. V., and Fishbein, E.: Aerosol source plume physical characteristics from space-based multiangle imaging, J. Geophys. Res., 112, D11205, https://doi.org/10.1029/2006JD007647, 2007.
Kalnay, E., Kanamitsu, M., Kistler, R., Collins, W., Deaven, D., Gandin, L., Iredell, M., Saha, S., White, G., Woollen, J., Zhu, Y., Leetmaa, A., Reynolds, R., Chelliah, M., Ebisuzaki, W., Higgins, W., Janowiak, J., Mo, K. C., Ropelewski, C., Wang, J., Jenne, R., and Joseph, D.: The NCEP/NCAR 40-year reanalysis project, B. Am. Meteor. Soc., 77, 437–470, 1996.
Kaufman, Y. J., Ichoku, C., Giglio, L., Korontzi, S., Chu, D. A., Hao, W. M., and Justice, C. O.: Fire and smoke observed from the Earth Observing System MODIS instrument–products, validation, and operational use. Int. J. Remote Sens., 24, 1765–1781, 2003.
Kim, D., Wang, C., Ekman, A. M. L., Barth, M. C., and Rasch, P.: Distribution and direct radiative forcing of carbonaceous and sulfate aerosols in an interactive size-resolving aerosol-climate model, J. Geophys. Res., 113, D16309, https://doi.org/10.1029/2007JD009756, 2008.
Lamarque, J.-F., Bond, T. C., Eyring, V., Granier, C., Heil, A., Klimont, Z., Lee, D., Liousse, C., Mieville, A., Owen, B., Schultz, M. G., Shindell, D., Smith, S. J., Stehfest, E., Van Aardenne, J., Cooper, O. R., Kainuma, M., Mahowald, N., McConnell, J. R., Naik, V., Riahi, K., and van Vuuren, D. P.: Historical (1850–2000) gridded anthropogenic and biomass burning emissions of reactive gases and aerosols: methodology and application, Atmos. Chem. Phys., 10, 7017–7039, https://doi.org/10.5194/acp-10-7017-2010, 2010.
Langmann, B., Duncan, B., Textor, C., Trentmann, J., and van der Werf, G. R.: Vegetation fire emissions and their impact on air pollution and climate, Atmos. Environ., 43, 107–116, 2009.
Lee, J., Hsu, N. C., Bettenhausen, C., Sayer, A. M., Seftor, C. J., Jeong, M. J., Tsay, S. C., Welton, E. J., Wang, S. H., and Chen, W. N.: Evaluating the Height of Biomass Burning Smoke Aerosols Retrieved from Synergistic Use of Multiple Satellite Sensors over Southeast Asia, Aerosol. Air Qual. Res., 16, 2831–2842, https://doi.org/10.4209/aaqr.2015.08.0506, 2016.
Leung, F. Y. T., Logan, J. A., Park, R., Hyer, E., Kasischke, E., Streets, D., and Yurganov, L.: Impacts of enhanced biomass burning in the boreal forests in 1998 on tropospheric chemistry and the sensitivity of model results to the injection height to emissions, J. Geophys. Res., 112, D10313, https://doi.org/10.1029/2006JD008132, 2007.
Lin, N. H., Sayer, A. M., Wang, S. H., Loftus, A. M., Hsiao, T. C., Sheu, G. R., and Chantara, S.: Interactions between biomass-burning aerosols and clouds over Southeast Asia: Current status, challenges, and perspectives, Environ. Pollut., 195, 292–307, 2014.
Martin, V. M., Kahn, R. A., Logan, J. A., Paugam, R., Wooster, M., and Ichoku, C.: Space-based observational constraints for 1-D fire smoke plume-rise models, J. Geophys. Res.-Atmos., 117, https://doi.org/10.1029/2012JD018370, 2012.
Miettinen, J., Hyer, E., Chia, A. S., Kwoh, L. K., and Liew, S. C.: Detection of vegetation fires and burnt areas by remote sensing in insular Southeast Asian conditions: current status of knowledge and future challenges, Int. J. Remote Sens., 34, 4344–4366, 2013.
Ming, Y., Ramaswamy, V., and Persad, G.: Two opposing effects of absorbing aerosols on global-mean precipitation, Geophys. Res. Lett., 37, https://doi.org/10.1029/2010GL042895, 2010.
Nakajima, T., Higurashi, A., Takeuchi, N., and Herman, J. R.: Satellite and ground-based study of optical properties of 1997 Indonesian Forest Fire aerosols, Geophys. Res. Lett., 26, https://doi.org/10.1029/1999GL900208, 1999.
Petersen, W. and Rutledge, S.: Regional Variability in Tropical Convection: Observations from TRMM, J. Climate, 14, 3566–3586, 2001.
Petrenko, M., Kahn, R. A., Chin, M., Soja, A. J., Kucsera, T., and Harshvardhan: The use of satellite-measured aerosol optical depth to constrain biomass burning emissions source strength in the global model GOCART, J. Geophys. Res., https://doi.org/10.1029/2012JD017870, 2012.
Rienecker, M. M., Suarez, M. J., Gelaro, R., Todling, R., Bacmeister, J., Liu, E., Bosilovich, M. G., Schubert, S. D., Takacs, L., Kim, G.-K., Bloom, S., Chen, J., Collins, D., Conaty, A., and da Silva, A.: MERRA: NASA's Modern-Era Retrospective Analysis for Research and Applications, J. Climate, 24, 3624–3648, https://doi.org/10.1175/JCLI-D-11-00015.1, 2011.
Rogers, R. R., Hostetler, C. A., Ferrare, R. A., Hair, J. W., Obland, M. D., Cook, A. L., Harper, D. B., and Swanson, A. J.: Validation of CALIOP Aerosol Backscatter and Extinction Profile Products Using Airborne High Spectral Resolution Lidar Data (retrieved from: http://cimss.ssec.wisc.edu/calipso/meetings/cloudsat_calipso_2009/Posters/Rogers.pdf), 2009.
Schuster, G. L., Dubovik, O., Holben, B., and Clothiaux, E.: Inferring black carbon content and specific absorption from Aerosol Robotic Network (AERONET) aerosol retrievals, J. Geophys. Res., 110, D10S17, https://doi.org/10.1029/2004JD004548, 2005.
Sessions, W. R., Fuelberg, H. E., Kahn, R. A., and Winker, D. M.: An investigation of methods for injecting emissions from boreal wildfires using WRF-Chem during ARCTAS, Atmos. Chem. Phys., 11, 5719–5744, https://doi.org/10.5194/acp-11-5719-2011, 2011.
Sofiev, M., Ermakova, T., and Vankevich, R.: Evaluation of the smoke-injection height from wild-land fires using remote-sensing data, Atmos. Chem. Phys., 12, 1995–2006, https://doi.org/10.5194/acp-12-1995-2012, 2012.
Stone, P. and Carlson, J.: Atmospheric Lapse Rate Regimes and Their Parameterization, J. Atmos. Sci., 36, 415–423, 1979.
Sugimoto, N., Nishizawa T., Shimizu A., Matsui I., and Jin, Y.: Characterization of aerosols in East Asia with the Asian dust and aerosol lidar observation network (AD-Net) Proc. SPIE, 9262 92620K, https://doi.org/10.1117/12.2069892, 2014a.
Sugimoto, N., Shimizu, A., Nishizawa, T., Matsui, I., Jin, Y., Khatri, P., Irie, H., Takamura, T., Aoki, K., and Thana, B.: Aerosol characteristics in Phimai, Thailand determined by continuous observation with a polarization sensitive Mie–Raman lidar and a sky radiometer, Environ. Res. Lett., 10, 6, https://doi.org/10.1088/1748-9326/10/6/065003, 2014b.
Tao, W. K., Chen, J. P., Li, Z. Q., Wang, C., and Zhang, C. D.: The Impact of Aerosol on convective cloud and precipitation, Rev. Geophys., 50, RG2001, https://doi.org/10.1029/2011RG000369, 2012.
Taylor, D.: Biomass burning, humans and climate change in Southeast Asia, Biodiversity and conservation, 19, 1025–1042, 2010.
Tosca, M. G., Randerson, J. T., Zender, C. S., Nelson, D. L., Diner, D. J., and Logan, J. A.: Dynamics of fire plumes and smoke clouds associated with peat and deforestation fires in Indonesia, J. Geophys. Res., 116, D08207, https://doi.org/10.1029/2010JD015148, 2011.
Tsigaridis, K., Daskalakis, N., Kanakidou, M., Adams, P. J., Artaxo, P., Bahadur, R., Balkanski, Y., Bauer, S. E., Bellouin, N., Benedetti, A., Bergman, T., Berntsen, T. K., Beukes, J. P., Bian, H., Carslaw, K. S., Chin, M., Curci, G., Diehl, T., Easter, R. C., Ghan, S. J., Gong, S. L., Hodzic, A., Hoyle, C. R., Iversen, T., Jathar, S., Jimenez, J. L., Kaiser, J. W., Kirkevåg, A., Koch, D., Kokkola, H., Lee, Y. H., Lin, G., Liu, X., Luo, G., Ma, X., Mann, G. W., Mihalopoulos, N., Morcrette, J.-J., Müller, J.-F., Myhre, G., Myriokefalitakis, S., Ng, N. L., O'Donnell, D., Penner, J. E., Pozzoli, L., Pringle, K. J., Russell, L. M., Schulz, M., Sciare, J., Seland, Ø., Shindell, D. T., Sillman, S., Skeie, R. B., Spracklen, D., Stavrakou, T., Steenrod, S. D., Takemura, T., Tiitta, P., Tilmes, S., Tost, H., van Noije, T., van Zyl, P. G., von Salzen, K., Yu, F., Wang, Z., Wang, Z., Zaveri, R. A., Zhang, H., Zhang, K., Zhang, Q., and Zhang, X.: The AeroCom evaluation and intercomparison of organic aerosol in global models, Atmos. Chem. Phys., 14, 10845–10895, https://doi.org/10.5194/acp-14-10845-2014, 2014.
Urbanski, S.: Wildland fire emissions, carbon, and climate: Emission factors, Forest Ecol. Manage., 317, 51–60, 2014.
van der Werf, G. R., Randerson, J. T., Giglio, L., Collatz, G. J., Mu, M., Kasibhatla, P. S., Morton, D. C., DeFries, R. S., Jin, Y., and van Leeuwen, T. T.: Global fire emissions and the contribution of deforestation, savanna, forest, agricultural, and peat fires (1997–2009), Atmos. Chem. Phys., 10, 11707–11735, https://doi.org/10.5194/acp-10-11707-2010, 2010.
van der Werf, G. R., Dempewolf, J., Trigg, S. N., Randerson, J. T., Kasibhatla, P. S., Giglio, L., and DeFries, R. S.: Climate regulation of fire emissions and deforestation in equatorial Asia, P. Natl. Acad. Sci., 105, 20350–20355, 2008.
Wang, C.: Impact of anthropogenic absorbing aerosols on clouds and precipitation: A review of recent progresses, Atmos. Res., 122, 237–249, 2013.
Wang, C.: Impact of direct radiative forcing of black carbon aerosols on tropical convective precipitation, Geophys. Res. Lett., 34, L05709, https://doi.org/10.1029/2006GL028416, 2007.
Winker, D. M., Pelon, J., and McCormick, M. P.: The CALIPSO mission: Spaceborne lidar for observation of aerosols and clouds, Proc. SPIE, 4893, 1–11, 2003.
Winker, D. M., Tackett, J. L., Getzewich, B. J., Liu, Z., Vaughan, M. A., and Rogers, R. R.: The global 3-D distribution of tropospheric aerosols as characterized by CALIOP, Atmos. Chem. Phys., 13, 3345–3361, https://doi.org/10.5194/acp-13-3345-2013, 2013.
Woodward, J. L.: Estimating the Flammable Mass of a Vapour Cloud: A CCPS Concept Book, John Wiley & Sons, ISBN 0470935359, 9780470935354, 2010.
Wooster, M. J., Perry, G. L. W., and Zoumas, A.: Fire, drought and El Niño relationships on Borneo (Southeast Asia) in the pre-MODIS era (1980–2000), Biogeosciences, 9, 317–340, https://doi.org/10.5194/bg-9-317-2012, 2012.