the Creative Commons Attribution 4.0 License.
the Creative Commons Attribution 4.0 License.
 | 26 Apr 2018
Chemical characteristics of size-resolved atmospheric aerosols in Iasi, north-eastern Romania: nitrogen-containing inorganic compounds control aerosol chemistry in the area
Alina Giorgiana Galon-Negru
Romeo Iulian Olariu
Cecilia Arsene
This study assesses the effects of particle size and season on the content of the major inorganic and organic aerosol ionic components in the Iasi urban area, north-eastern Romania. Continuous measurements were carried out over 2016 using a cascade Dekati low-pressure impactor (DLPI) performing aerosol size classification in 13 specific fractions over the 0.0276–9.94 µm size range. Fine-particulate Cl−, NO, NH, and K+ exhibited clear minima during the warm season and clear maxima over the cold season, mainly due to trends in emission sources, changes in the mixing layer depth and specific meteorological conditions. Fine-particulate SO did not show much variation with respect to seasons. Particulate NH and NO ions were identified as critical parameters controlling aerosol chemistry in the area, and their measured concentrations in fine-mode (PM2.5) aerosols were found to be in reasonable good agreement with modelled values for winter but not for summer. The likely reason is that NH4NO3 aerosols are lost due to volatility over the warm season. We found that NH in PM2.5 is primarily associated with SO and NO but not with Cl−. Actually, indirect ISORROPIA-II estimations showed that the atmosphere in the Iasi area might be ammonia rich during both the cold and warm seasons, enabling enough NH3 to be present to neutralize H2SO4, HNO3, and HCl acidic components and to generate fine-particulate ammonium salts, in the form of (NH4)2SO4, NH4NO3, and NH4Cl. ISORROPIA-II runs allowed us to estimate that over the warm season ∼ 35 % of the total analysed samples had very strongly acidic pH (0–3), a fraction that rose to ∼ 43 % over the cold season. Moreover, while in the cold season the acidity is mainly accounted for by inorganic acids, in the warm ones there is an important contribution by other compounds, possibly organic. Indeed, changes in aerosol acidity would most likely impact the gas–particle partitioning of semi-volatile organic acids. Overall, we estimate that within the aerosol mass concentration the ionic mass brings a contribution as high as 40.6 %, with the rest still being unaccounted for.
- Article
(5318 KB) - Full-text XML
-
Supplement
(1479 KB) - BibTeX
- EndNote


Despite dramatic progress made to improve air quality, global air pollution continues to harm people's health and the environment. The problem of aerosols or particulate matter (PM) is still a great concern (Olariu et al., 2015) in Europe and many other areas in the world (e.g. China, India, USA). Atmospheric aerosols, described as complex mixtures of liquid and/or solid particles suspended in a gas (Olariu et al., 2015), mainly originate from anthropogenic and natural sources (Querol et al., 2004). Fine PM2.5 particles (airborne particles with an equivalent aerodynamic diameter < 2.5 µm) are air pollutants with significant effects on human health (Pope et al., 2004; Dominici et al., 2006; WHO, 2006a; Directive 2008/50/EC, 2008; Sicard et al., 2011; Ostro et al., 2014) as well as air quality (Directive 2008/50/EC, 2008; Freney et al., 2014), visibility (Directive 2008/50/EC, 2008; Tsai and Cheng, 1999), ecosystems, weather, and climate (Ramanathan et al., 2001; Directive 2008/50/EC, 2008; IPCC, 2013). Aerosols are also known to play a significant role within the chemistry of the atmosphere (Prinn, 2003), acting as surfaces for heterogeneous chemical reactions (Ravishankara, 1997).
Safety threshold values for both PM2.5 (10 or 17 µg m−3 air, as annual mean) and PM10 (airborne particles with an equivalent aerodynamic diameter < 10 µm; 20 or 28 µg m−3 air, as annual mean) are addressed by the WHO (2006b) or by the 2008/50/EC Directive (2008) on ambient air quality and cleaner air for Europe. With regard to the PM2.5 fraction, the EEA Report (2015) indicates that in 2013 the European Union daily limit values for PM10 and PM2.5 were exceeded in, respectively, 22 and 7 out of the 28 European Union member states. However, a decreasing trend was observed when compared with the WHO report data (2006b). Moreover, on a global scale the PM2.5 exposure leads to about 3.3 million premature deaths per year (predominantly in Asia), a figure that could double by 2050 (Lelieveld et al., 2015). Indeed, PM air pollution imparts a tremendous burden to the global public health because it ranks as the 13th leading cause of mortality (Brook, 2008).
Up to now the chemical composition of atmospheric aerosols has been reported for various urban European sites (Bardouki et al., 2003; Hitzenberger et al., 2006; Tursic et al., 2006; Gerasopoulos et al., 2007; Schwarz et al., 2012; Laongsri and Harrison, 2013; Wonaschutz et al., 2015; Sandrini et al., 2016), but such information is very scarce in eastern Europe (Arsene et al., 2011). Sulfate (SO, nitrate (NO, and ammonium (NH ions, which are major inorganic particle constituents (Wang et al., 2005; Bressi et al., 2013; Hasheminassab et al., 2014; Voutsa et al., 2014), are mainly secondary species formed in the atmosphere by chemical reactions of their precursor gases and by physical processes (nucleation, condensation, etc.) (Aksoyoglu et al., 2017). Ammonium aerosols, with an atmospheric lifetime of 1–15 days, have a clear tendency to deposit at large distances from their emission sources (Aneja et al., 2000) and seem to play a very important role in atmospheric chemistry. In urban air, the abundance of NO on fine particles seems to mainly depend on the reaction between HNO3 and NH3 (Stockwell et al., 2000). On a global scale, HNO3 heterogeneous reactions on mineral dust and sea salt particles might be the predominant source of particulate NO (Athanasopoulou et al., 2008; Karydis et al., 2011). The human health effects of atmospheric ammonia, primarily exerted through particulate NH4NO3, are gradually acquiring importance compared to NOx emissions (Sutton et al., 2011).
Relative humidity (RH; Jang et al., 2002) and gas–particle partitioning processes of semi-volatile species (NH3, HNO3, HCl, and some organic acids) affect the hydronium ion (H3O+) concentrations (Keene et al., 2004; Guo et al., 2016) as well as aerosol formation and chemical composition. Aerosol acidity is often estimated with ion balance methods (Trebs et al., 2005; Metzger et al., 2006; Arsene et al., 2011), phase partitioning (Meskhidze et al., 2003; Keene et al., 2004), and thermodynamic equilibrium models, e.g. E-AIM (Clegg et al., 1998; Wexler and Clegg, 2002) or ISORROPIA-II (Nenes et al., 1999; Fountoukis and Nenes, 2007; Hennigan et al., 2015; Guo et al., 2015, 2016; Fang et al., 2017). Acidity might influence transition metals' solubility and enhance aerosol toxicity and the delivery of nutrients by atmospheric deposition in marine areas (Meskhidze et al., 2003; Fang et al., 2017).
Unfortunately, the aerosols' role in the global atmospheric system is not yet sufficiently understood. The main related challenges are the occurrence of multiple sources (e.g. soil erosion, sea spray, biogenic emissions, volcano eruptions, soot from combustion, condensation of precursor gases) and the complexity of interactions with other atmospheric constituents (Zhang et al., 2015). Today, sources, distribution, and behaviour of natural and anthropogenic aerosols are still a matter of debate, exacerbated by the scarcity of aerosol-related work for eastern European Union countries (EEA Report, 2015) but also by the existing discrepancies between models and field measurements. The main uncertainties are related to secondary inorganic aerosols that control the availability of atmospheric sulfuric acid (H2SO4), nitric acid (HNO3), and ammonia (NH3) (Ianniello et al., 2011). The existing knowledge gaps bring high uncertainty in the estimated radiative forcing, although they do not impair the conclusion that warming of the climate system is unequivocal (IPCC, 2013).
Despite a growing international recognition of the importance of air pollution and air quality problems, there is a definite need to assess air pollution patterns in Romania. The existing data for north-eastern Romania concern the chemical characteristics of ambient air pollutants such as the water-soluble ionic constituents of aerosols (Arsene et al., 2011) and rainwater (Arsene et al., 2007). Recent work performed by Arsene's group in the field of atmospheric chemistry has clearly shown that, in the Iasi urban environment (north-eastern Romania), ∼ 59 % of the total aerosol mass concentration is still unaccounted for. The present work reports, for the first time, detailed information on the chemical composition and seasonal variation in size-segregated, water-soluble ions in aerosol samples collected throughout 2016 in the Iasi urban area, also taking into account the potential ongoing chemistry and the contributions of critical driving forces such as meteorological factors (RH, temperature), mixing layer depth, and emission source intensity. As a first attempt to assess particle acidity in the area, the present work highlights the existence of significant aerosol fractions characterized by pH values in the very strong acidity range (0–3 pH units), with potentially important implications for acid rain. Moreover, the potential importance of gaseous precursors (e.g. NH3, HNO3, HCl) in secondary inorganic PM is also discussed.
2.1 Measurement site
Measurements were performed in Iasi, north-eastern Romania, at the Air Quality Monitoring Station (AMOS, 47∘9′ N latitude and 27∘35′ E longitude) of the Integrated Centre of Environmental Science Studies in the North-Eastern Development Region, ”Alexandru Ioan Cuza” University of Iasi, CERNESIM-UAIC, Romania. AMOS is located north-east from the city centre, on the rooftop of the highest university building (∼ 35 m above the ground level), in a totally open area that characterizes the site as an urban receptor point most probably influenced by well-mixed air masses. A comprehensive demo-geographical characterization of Iasi is described in detail by Arsene et al. (2007, 2011). However, according to a more recent estimate of the Romanian National Institute of Statistics, in 2016 the population in Iasi reached about 362 142 inhabitants (Ichim et al., 2016).
2.2 Field measurements
Size-resolved atmospheric aerosols were collected on ungreased aluminium filters (25 mm diameter) using a cascade Dekati low-pressure impactor (DLPI) operating at a flow rate of 29.85 L min−1. Similar devices have been successfully used in other studies (Kocak et al., 2007; Wonaschutz et al., 2015). The DLPI unit performs aerosol size classification in 13 specific fractions (with size cuts at 0.0276, 0.0556, 0.0945, 0.155, 0.260, 0.381, 0.612, 0.946, 1.60, 2.39, 3.99, 6.58, and 9.94 µm at 50 % calibrated aerodynamic cut-point diameters and at 21.7 ∘C, inlet pressure 1013.3 mbar, outlet pressure 100 mbar, and 29.85 L min−1 flow rate). Sampling performance of the DLPI unit was verified through comparison with simultaneous measurements performed with a stacked filter unit (SFU) system previously used by Arsene et al. (2011). Before each reuse the sampler's components were cleaned with ultra-pure water and methanol. Dispensable polyethylene gloves were always used to avoid hand contact with sampler's components, which were assembled and disassembled in a Labgard Class II Biological Safety Cabinet, NuAire. The DLPI sampler was transported to and from the field in tightened polyethylene bags.
Sampling was performed in 2016 twice a week, on the weekend and working days, for a total of 84 sampling events (41 during the cold season from October to March, and 43 during the warm season from April to September), generating 1092 size-resolved aerosol samples. Sampling took place on a 36 h basis, with each sampling event starting at 18:00 local time. An average volume of 64.33 ± 0.85 m3 per sampling was collected. At least two field blanks (consisting of a loaded sampler taken to and from the field but never removed from its tightened bag) were generated and simultaneously analysed together with the laboratory blanks, in order to assess possible contamination during sampler loading, transport, or analysis.
Meteorological parameters including atmospheric temperature, RH, wind speed, wind direction, and global radiation were provided by a Hawk GSM-240 weather station, running at the AMOS site. Information about the mixing layer depth (atmospheric boundary layer) and its ability to dilute atmospheric pollutants at the investigated site was obtained from the NOAA Air Resources Laboratory (ARL) website (Stein et al., 2015; Rolph et al., 2017).
2.3 Sample analyses
Aerosol masses for both the PM2.5 and PM10 fractions were gravimetrically determined with a Sartorius microbalance (MSU2.7S-000-DF, ±0.2 µg sensitivity) by weighing aluminium filters before and after sampling. Before weighing, filters stored in petri dishes were kept for at least 3 days in a conditioned room at 40 ± 2 % RH and at 20 ± 2 ∘C. In between different procedures, they were appropriately stored in zipped plastic bags.
Chemical analyses for water-soluble anions (i.e. acetate, (C2H3O, formate, (HCO, fluoride, (F−), chloride, (Cl−), nitrite, (NO, nitrate, (NO, phosphate, (PO, sulfate, (SO, and oxalate, (C2O and water-soluble cations (i.e. sodium, (Na+), potassium, (K+), ammonium, (NH, magnesium, (Mg2+), and calcium (Ca2+)) were performed using ion chromatography (IC) on a ICS-5000+ DP Dionex system (Thermo Scientific, USA). Analyses were performed within a week from sampling, in aqueous extracts of the collected samples. For chemical analysis, steps in the analytical procedures were strictly quality controlled to avoid contamination.
After sampling and all other required preparative steps, one half of each collected filter was ultrasonically extracted for 45 min in 5 mL deionized water (resistivity of 18.2 MΩ.cm) produced by a Milli-Q Advantage A10 system (Millipore). Filtered extracts (0.2 µm pore size cellulose acetate filters, Advantec) were analysed on an IonPac CS12A (4 × 250 mm) analytical column for cations and an IonPac AS22 (4 × 250 mm) column for anions, running simultaneously on the IC system. The chromatographic instrumental set-up was completed by CSRS 300 × 4 mm and AERS 500 × 4 mm electrochemical suppressors and conductivity detectors. Ion analyses were performed under isocratic elution mode, using CO ∕ HCO (4.5∕1.4 mM, 1.2 mL min−1) as the mobile phase for anions and methanesulfonic acid (20 mM, 1.0 mL min−1) for cations.
Traceable standard solutions (Dionex Seven Anions II and Dionex Six Cations II) were used to generate calibration curves for each species of interest, all with correlation coefficients R2 well above 0.995. The detection limits of the major species (defined as 3 times the standard deviation of blank measurements relative to the method sensitivity) on a 36 h measurement period were 0.0003 µg m−3 for NH (3.2 µg L−1), 0.001 µg m−3 for Na+ (13.4 µg L−1), 0.0015 µg m−3 for K+ (19.8 µg L−1), 0.0002 µg m−3 for Mg2+ (3.2 µg L−1), 0.0016 µg m−3 for Ca2+ (20.6 µg L−1), 0.0010 µg m−3 for SO (13.2 µg L−1), 0.0012 µg m−3 for NO (15.1 µg L−1), and 0.0019 µg m−3 for Cl− (24.9 µg L−1). Ion concentrations in analysed blank filters (laboratory and field) were subtracted from their corresponding concentrations in the aerosol samples.
The sum of the detected ions, or of the gravimetrically determined mass concentration, over all DLPI stages is hereafter termed “PM10 fraction”, while the sum over impactor stages from 1 to 10 is termed “PM2.5 fraction”. Modal diameters of the size-segregated aerosol particles or of the analysed ionic components (individual or as a sum) were determined by fitting lognormal distributions.
2.4 Estimation of the aerosol acidity
The thermodynamic model proposed by Fountoukis and Nenes (2007), i.e. ISORROPIA-II (http://isorropia.eas.gatech.edu/), was used to get an estimate of the in situ potential acidity of our PM2.5 fractions. The ISORROPIA-II thermodynamic equilibrium model calculates the gas–liquid–solid equilibrium partitioning of K+, Ca2+, Mg2+, NH, Na+, SO, NO, Cl−, and aerosol water content, and it can predict particle pH. Up to now the model has been used in various field campaigns' data analysis (Nowak et al., 2006; Fountoukis et al., 2009).
To obtain the best predictions of aerosol pH, ISORROPIA-II was run in the “forward mode” for the metastable aerosol state, as preliminary runs of the experimental data in the “reverse mode” did not supply suitable information. In the metastable mode the aerosol is assumed to be present only in the aqueous phase, either supersaturated or not (Fountoukis and Nenes, 2007). As model input data we used just aerosol-phase ion concentrations measured with IC, along with RH and temperature data from the Hawk GSM-240 weather station. Actually, in the absence of accompanying gas-phase data required to constrain the thermodynamic models, the accuracy of aerosol pH predictions can be enhanced by using the aerosol concentrations in forward mode calculations (Guo et al., 2015; Hennigan et al., 2015), which seem to be less sensitive to measurement errors than the reverse mode. Where required, NH3 data predicted by ISORROPIA-II were used for the interpretation of the results.
2.5 Air mass back trajectories and air mass origin
Air mass back trajectories were calculated using the HYSPLIT 4 model of the NOAA Air Resources Laboratory (Stein et al., 2015; Rolph et al., 2017). Arriving at the investigated site at 18:00 local time (15:00 UTC), 48 h back trajectories were computed at 500, 1000, and 2000 m altitude above the ground level. Four major sectors of air mass origin were distinguished, and their contributions are shown in Fig. 1. The most and least frequent sectors were the north-eastern (N–E, 36.6 %) and the south-south-eastern (S–SE, 11.4 %) ones, respectively. The W-SW sector mainly prevails during winter, while the NE sector is most common during summer. The NW sector had a slightly enhanced frequency in winter and summer that, according to James (2007), could reflect a possible European monsoon circulation. Events from the S-SE sector, prevailing mainly in spring, carried out marine chemical features highly influenced by the Black Sea. Air masses undertaking faster vertical transport most probably due to the locally or continentally driven buoyancy (Holton, 1979; Seinfeld and Pandis, 1998), travelling above large (long-range transport) or short (local) continental areas, were also identified. For instance, in April 2016 five sampled events out of a total of eight were highly influenced by fast vertical air mass transport. In these events, air masses from both 500 and 1000 m altitude went down to below 500 m (brushing the ground surface), with a strong impact on the chemical composition of the collected particles (vide infra).
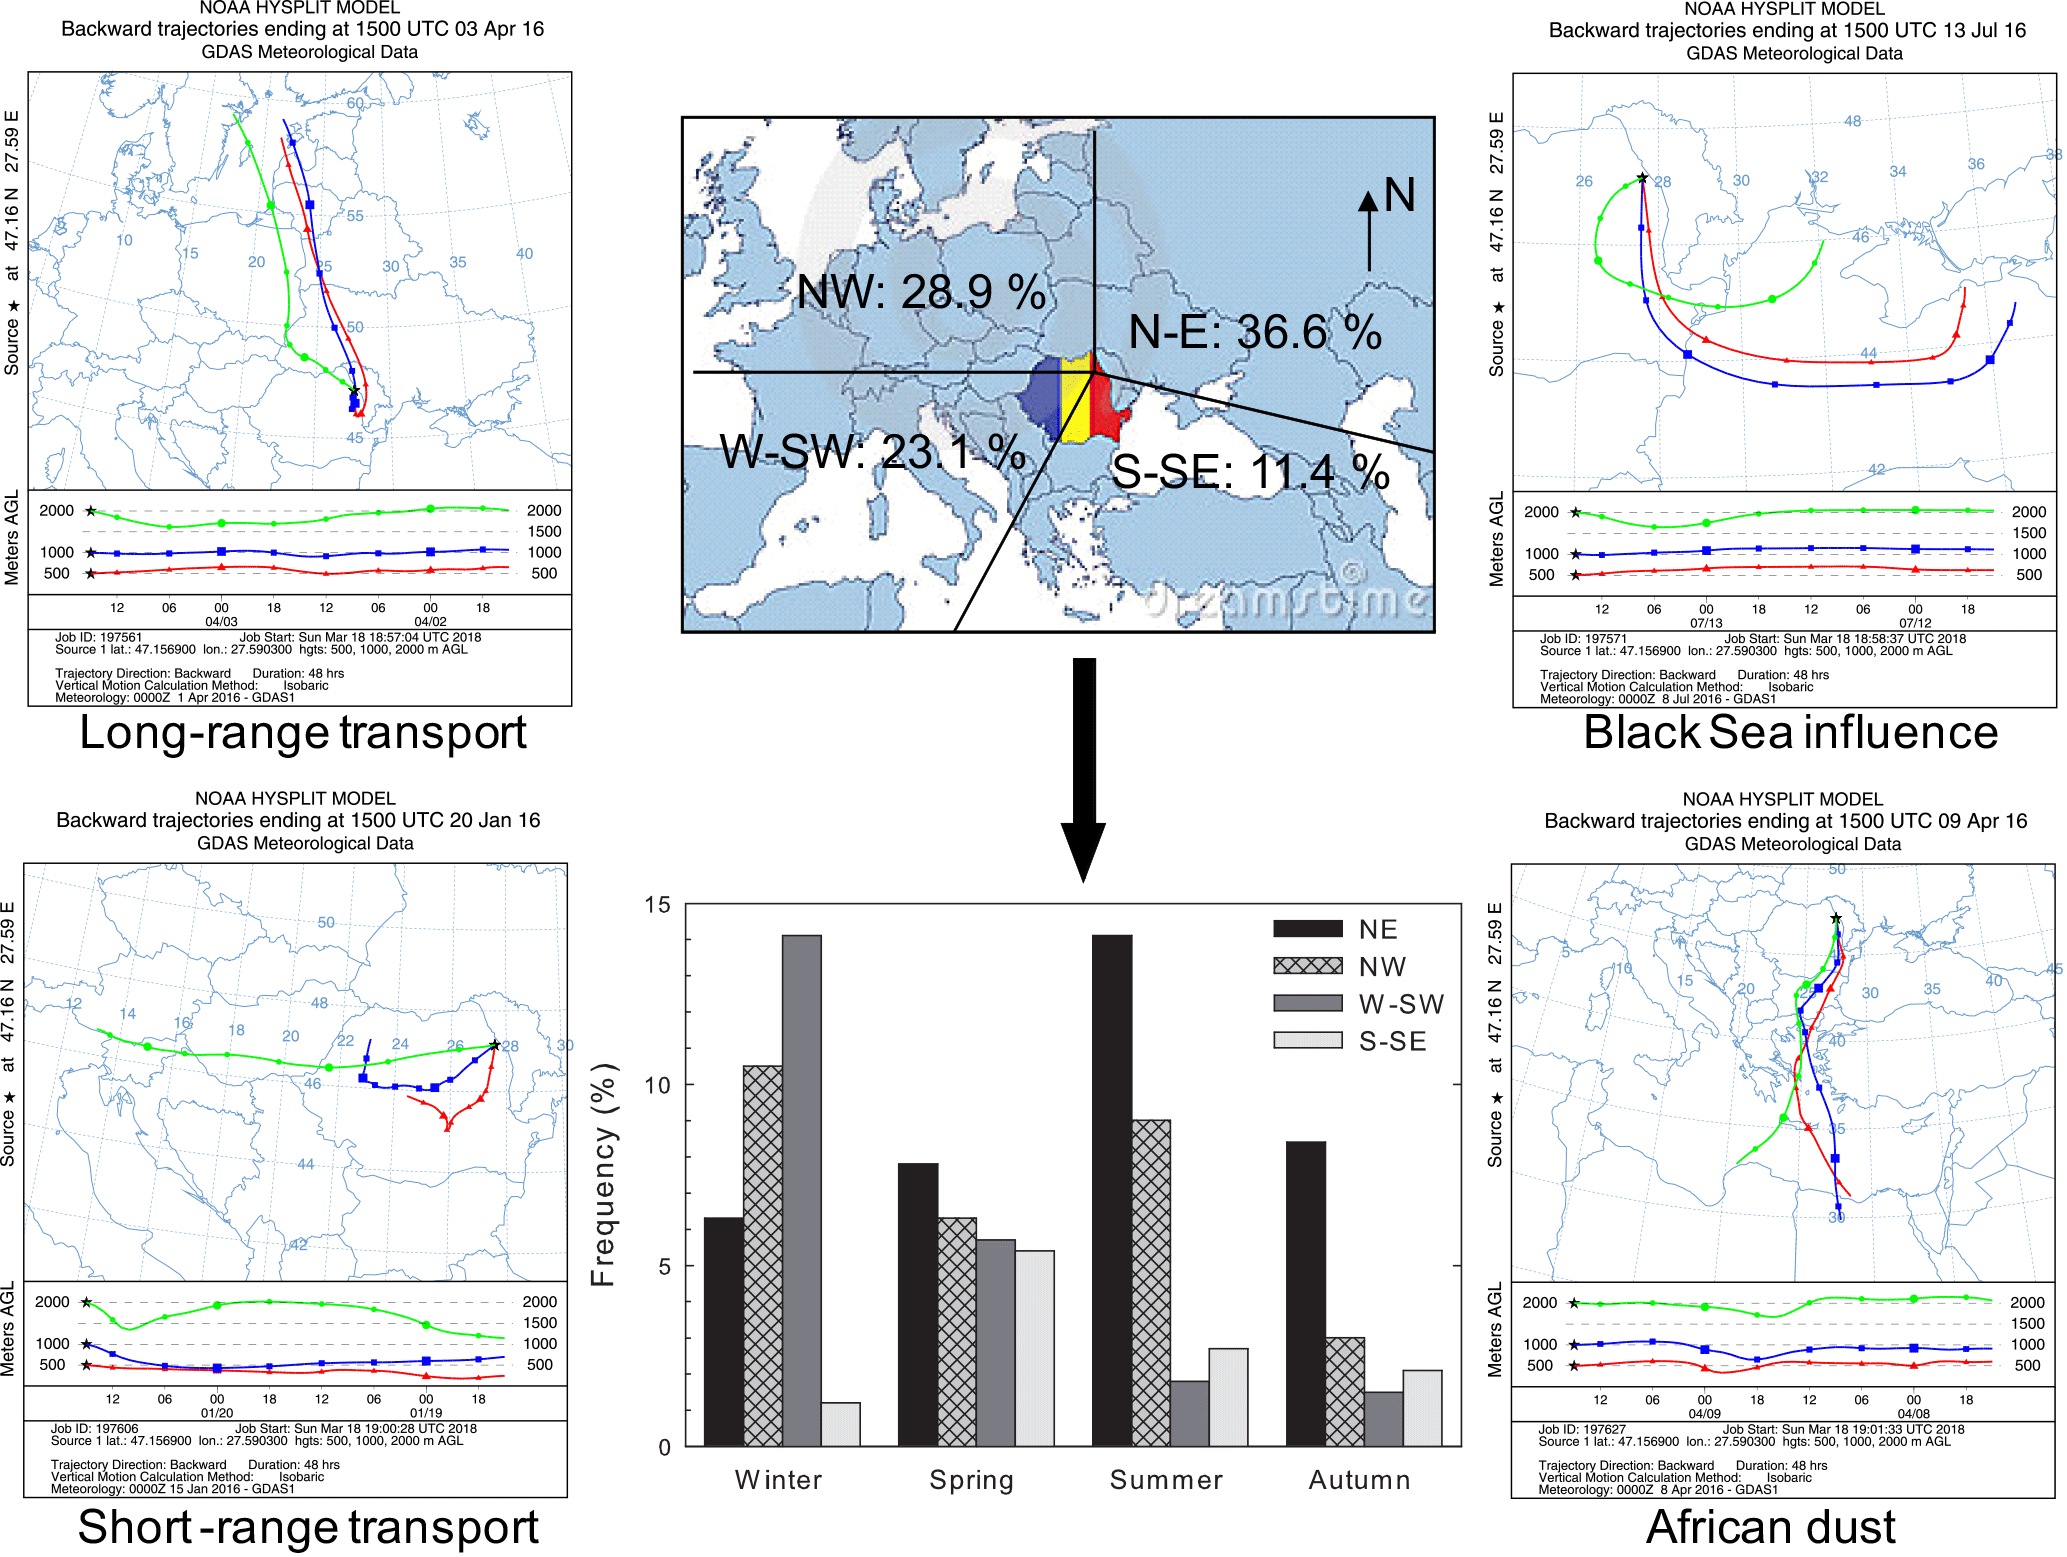
Figure 1Sector contributions identified from classification of 2-day back trajectories of air masses ending at Iasi and representative backward trajectories of long- and short-range transport, Black Sea influence, and African dust (shown trajectories correspond to sampling events).
3.1 Variability in PM10 and PM2.5 mass concentrations
Table 1 shows summary statistics (median, geometric mean, arithmetic mean, standard deviation, minimum, and maximum) for PM10 and PM2.5 mass concentrations at the AMOS site for both working days and weekends. Statistical tests were applied to determine whether there are significant differences among working days and weekends. The Shapiro–Wilk normality test applied to both PM2.5 and PM10 indicated that the entire database was normally distributed (detailed statistics are given in Table S1 in the Supplement). Moreover, the difference in the mean values of the two groups was not high enough to exclude random sampling variability, thereby suggesting that the differences are not statistically significant. Therefore, local anthropogenic activities seem to bring similar contribution to the aerosol burden in the area on both working days and weekends. However, the PM10 annual mean mass concentration (18.95 µg m−3) did not exceed the WHO 20 µg m−3 air annual mean value, while the PM2.5 annual mean mass concentration (16.92 µg m−3) exceeded the 10 µg m−3 air annual mean value set by WHO (2006b).
Table 1Basic statistics for the PM10 and PM2.5 fractions' mass concentrations determined over the investigated period (n= 84 sampling events) in Iasi, north-eastern Romania.
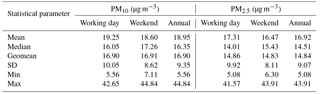
Table 2 presents the annual and/or seasonal arithmetic means of PM10 and PM2.5 mass concentrations in Iasi, compared to other European sites (mean ± SD). The annual averages obtained in the present work show differences in comparison with those reported by Arsene et al. (2011) for the same site. Arsene et al. (2011) have used a SFU system consisting of a 8.0 µm pore size, 47 mm diameter Isopore polycarbonate filter mounted in front of a 0.4 µm pore size, 47 mm diameter Isopore filter. However, the values determined in the present work for the fractions PM0.027–1.6 (15.6 ± 8.7 µg m−3) and PM0.381–1.6 (9.1 ± 5.6 µg m−3) are much closer to those reported by Arsene et al. (2011) for PM1.5 (10.5 ± 11.2 µg m−3). The potential influence on the PM levels of particle size cut-off, differences in sampling site altitude, occurrence of precipitation events, long-range transport phenomena, and air mass buoyancy is presented in detail in Sect. S1 in the Supplement.
Table 2Annual and/or seasonal arithmetic means of the PM10 and PM2.5 fraction mass concentrations in Iasi, north-eastern Romania, and other various European sites (mean ± SD).
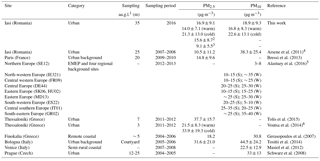
1 Sampling altitude above ground level. 2 PM0.027-1.6 and 3 PM0.381–1.6 annual values given for discussion and comparison purposes with Arsene et al. (2011) study. 4 The total (coarse + fine) and the fine fractions reported (coarse fraction – particles of AED > 1.5 µm and fine fractions – particles of AED < 1.5 µm). 5 S: summer (8 June–12 July 2012); W: winter (11 January–8 February 2013). 6 Averaged value of warm and cold season data (error propagation method for uncertainty estimation); SE12: Aspvreten (Sweden); IE321: Mace Head (Ireland); FR09: Revin (France); DE44: Melpitz (Germany); SK06: Starina (Slovak Republic); HU02: K-Puszta (Hungary); MD13: Leova II (Moldavian Republic); ES22: Montsec (Spain); IT01: Montelibretti (Italy); GR02: Finokalia (Greece).
Figure 2 shows monthly arithmetic mean mass concentrations (±standard deviations) of PM10 and PM2.5 in Iasi. The distribution of the PM2.5 ∕ PM10 ratio is presented in the same figure. The relative contribution of PM2.5 toward PM10 showed low variability amongst the months of the year, with ratios ranging from ∼ 0.75 to ∼ 1.0. For urban background and/or traffic sites, WHO (2006a) suggests PM2.5 ∕ PM10 ratios in the 0.42–0.82 range. Seasonal patterns, with maxima during the cold season and minima during the warm season, are observed for all of the PM2.5, PM10, and PM2.5 ∕ PM10 profiles and might be the combined result of seasonal emissions variations, local- and long-range air transport and dispersion, chemical processes, and deposition (Wang et al., 2016). The maxima of PM2.5 ∕ PM10 during the cold season are most probably caused by combustion processes as the burning of coal or petroleum for heating purposes enhances secondary aerosol generation (Li et al., 2012). The lower PM2.5 ∕ PM10 values during the warm season might be due to dust events and to more intense anthropogenic activities near the sampling site (e.g. excavation, construction, and building renewal) that would cause higher loading of coarse particles in the atmosphere. As suggested by Zhang et al. (2001), various land use categories (e.g. grass, crops, mixed farming, shrubs) corroborated with other particle-related characteristics (i.e. particle density, relevant meteorological variables) may enhance the dry deposition of sub-micron particles during the warm season and hence their fine ∕ coarse ratio.
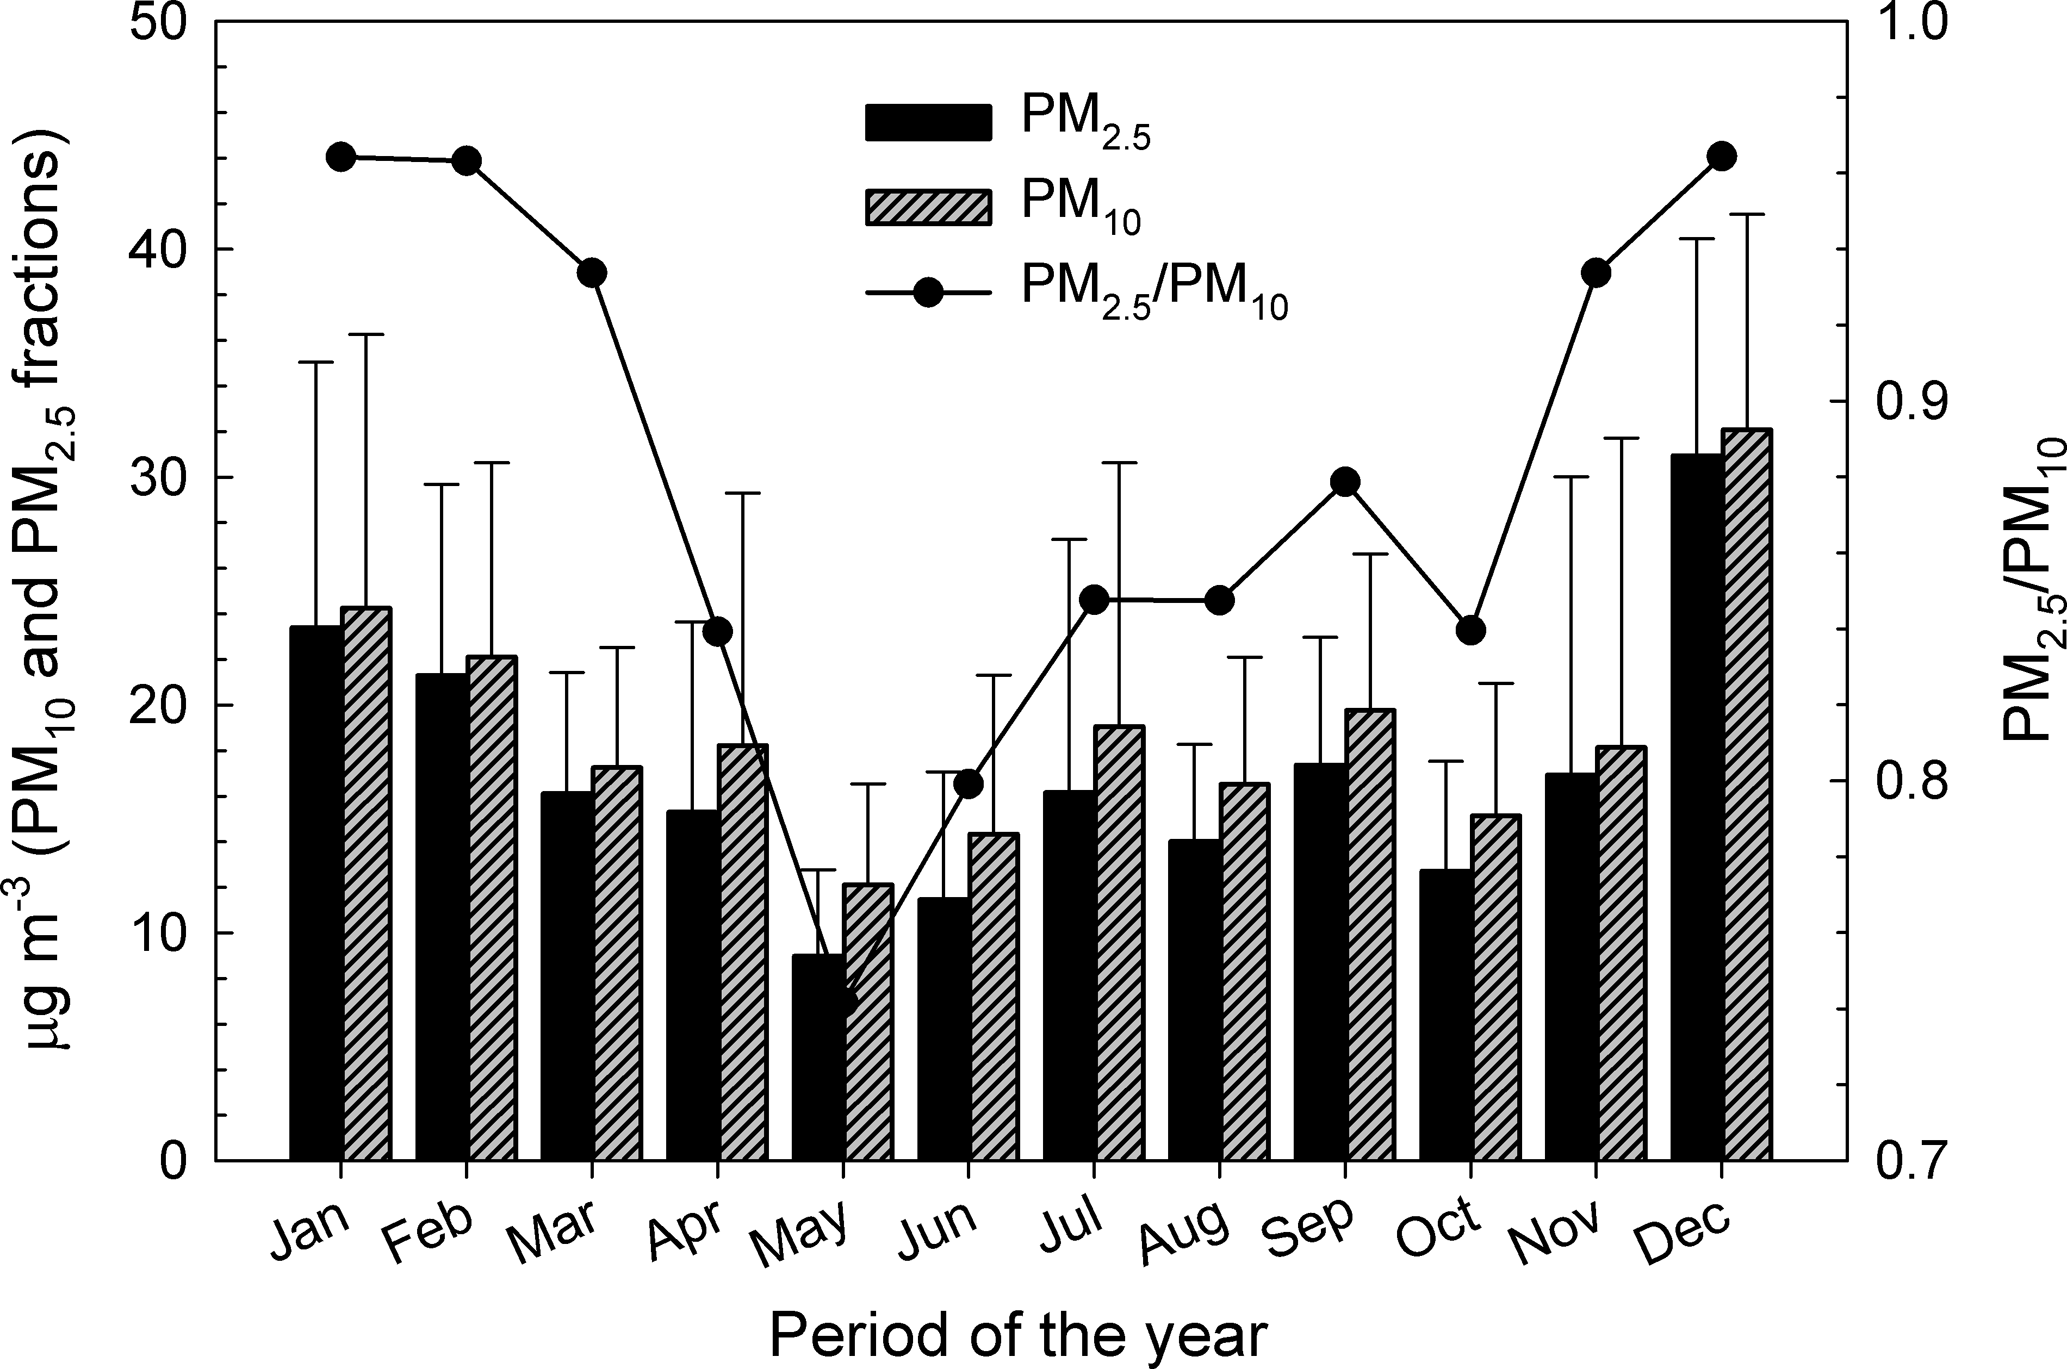
Figure 2Patterns of the monthly arithmetic mean concentrations and standard deviations in the PM10, PM2.5, and PM2.5 ∕ PM10 variables at Iasi, north-eastern Romania.
Another clear seasonal pattern was observed for the mass concentration size distribution (Fig. 3). Over the cold season, it had a clear monomodal feature with a maximum at 381 nm. In contrast, the warm season was characterized by the same dominant fine mode, but also by the occurrence of a super-micron mode between 1.60 and 2.39 µm. Again, changes in source contributions and meteorological conditions could account for the observed differences (details in Sect. S2).
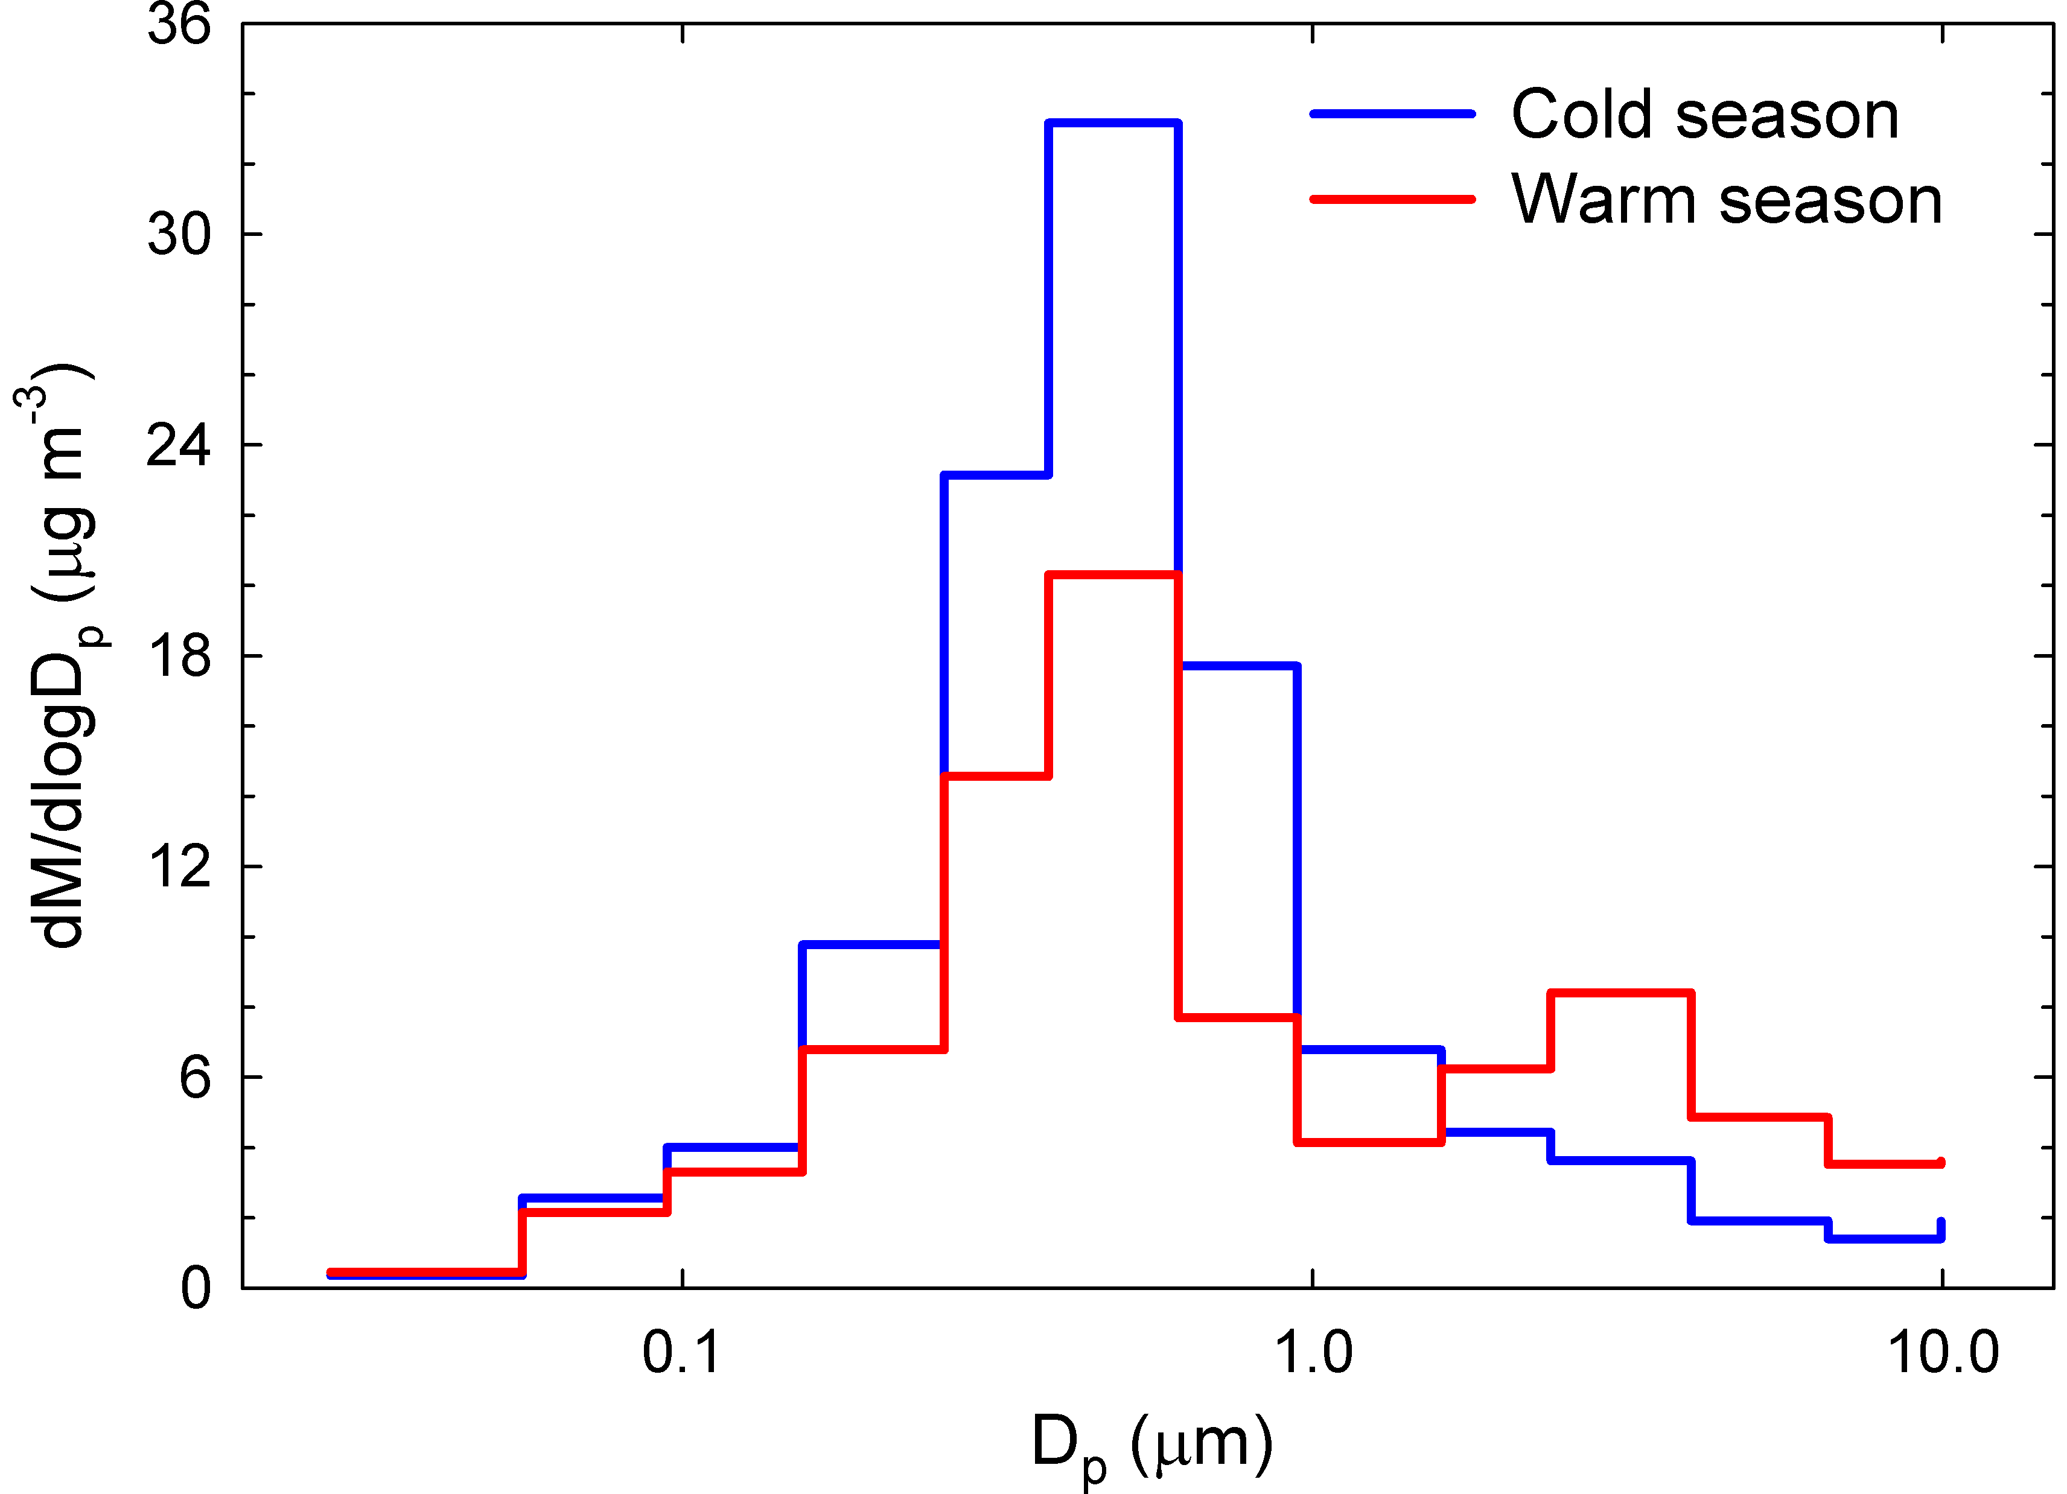
Figure 3Size distribution histograms of aerosol particle mass concentration gravimetrically determined over both the cold and warm seasons.
3.2 Ionic balance, seasonality of water-soluble ions, and stoichiometry of (NH4)2SO4 and NH4NO3
3.2.1 Ionic balance and potential aerosol acidity
The completeness of the ionic balance was checked for the identified and quantified species (F−, Cl−, NO, NO, PO, SO, HCO, C2H3O, C2O, Na+, K+, NH, Mg2+, and Ca2+) in both PM10 and PM2.5. The slopes in the raw IC data related to ∑cations vs. ∑anions were < 1 in both PM2.5 and PM10 (detailed statistics in Table S2), pointing to an important cation deficit that was higher in the cold compared to the warm season. However, for each sampling event, either cation or anion deficit was observed in various impactor stages. It should also be noted that, at the investigated site, a RH of ∼ 82 % was even observed during the cold season.
Predicting pH is suggested as the best method to analyse particle acidity (Guo et al., 2015). The ion balance method is usually based upon the principle of electroneutrality, and any deficit in measured cationic compared to anionic charge is assigned to the presence of unmeasured protons (H+). The reverse occurs for unmeasured hydroxyl (OH−) (Hennigan et al., 2015) or bicarbonate ∕ carbonate (HCO ∕ CO (Fountoukis and Nenes, 2007). In the present work, HCO ∕ CO was assigned as the missing anion (details in Sect. S3 for HCO ∕ CO estimation) while NH was assigned as the main missing cation (details in Sect. S4 for the missing NH assumptions). Detailed statistics of the ∑cations vs. ∑anions dependences, with HCO ∕ CO and missing NH included in the ionic balance, are presented in Table S3.
In an attempt to investigate whether or not the H+ species would bring an important contribution within the ionic balance, the ISORROPIA-II thermodynamic equilibrium model proposed by Fountoukis and Nenes (2007) has been used in the present work (more details about ISORROPIA-II can be found in Sect. S5). We investigated the relationship between ISORROPIA-II-predicted aerosol pH and the ionic balance for the present database, and the results are presented in Fig. 4a. The data remarkably follow a traditional titration curve, and they also clearly show that many of the analysed particles were approximately neutral (dashed lines at 0). A very important fraction of the investigated samples were in the acidic range (pH < 3 if samples were in cation deficit mode), while the remaining fraction were alkaline (pH slightly above 7 with anion deficit mode). However, as suggested by Hennigan et al. (2015), small uncertainties in the ionic balance (mainly due to measurement uncertainties and more likely in approximately neutral conditions) may lead to shifts that span over about 10 pH units. Moreover, the sensitivity to changes in the aerosol NH concentration has been checked in predicted aerosol pH under forward-mode calculation. As shown in Fig. 4b, it seems that the predicted pH might decrease by 2 % when the ionic balance takes into account NH(total) concentration (defined as the sum between that derived from raw IC data and the part estimated by using the rationale of Arsene et al., 2011). Details on the pH sensitivity tests for NH concentrations are given in Sect. S6.
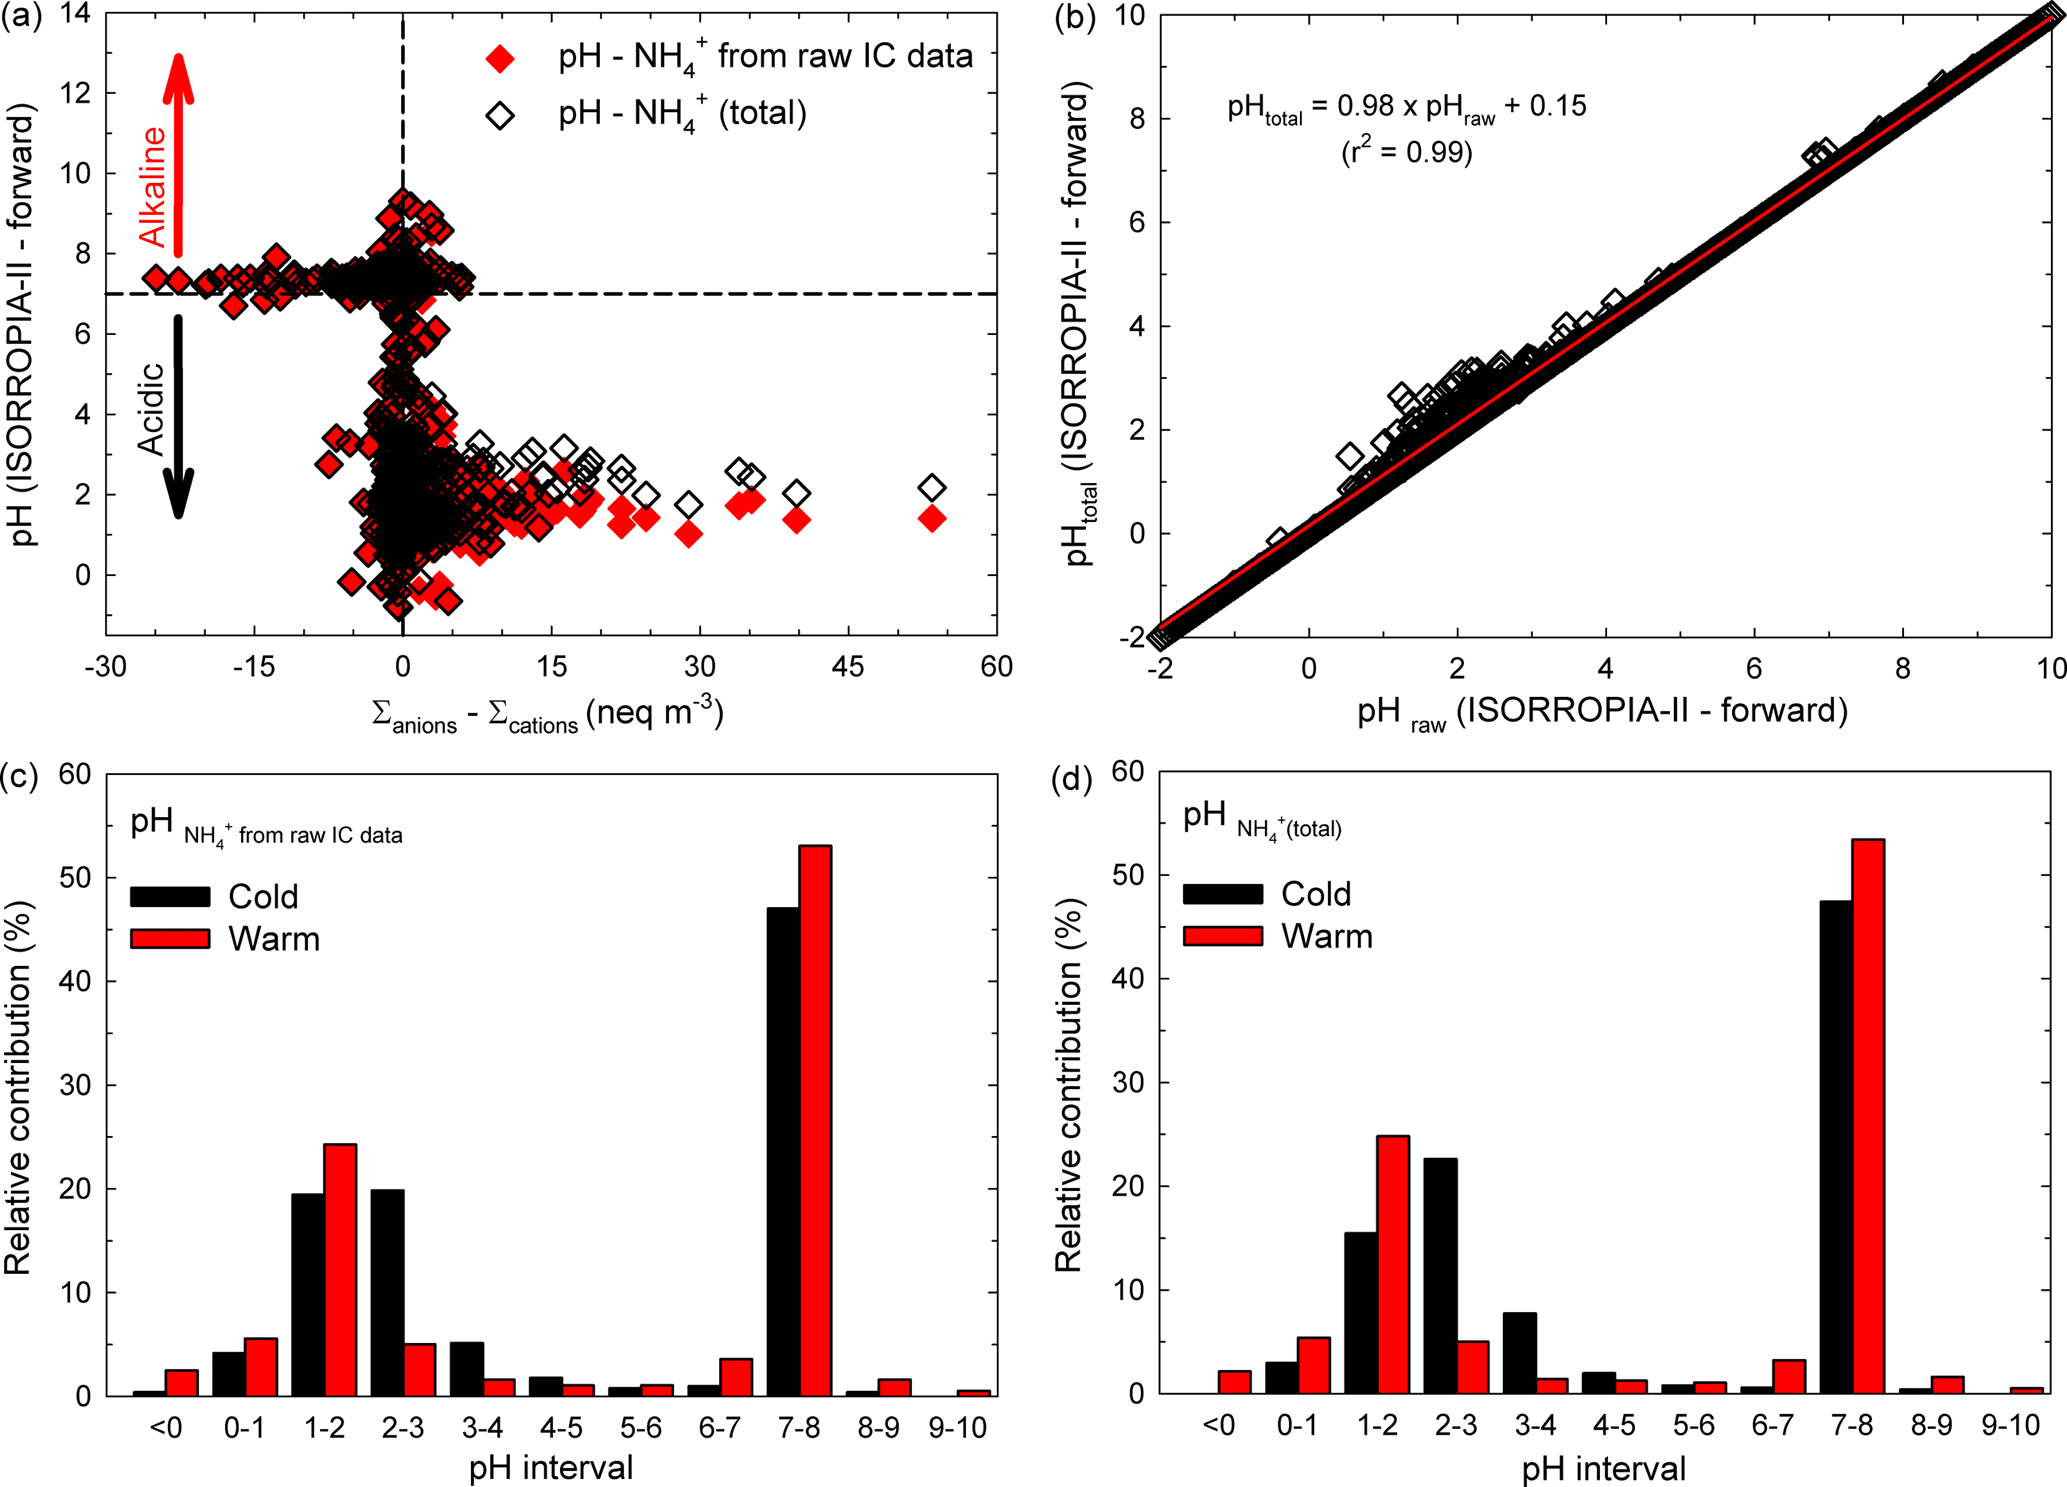
Figure 4Distribution of the aerosol pH predicted by ISORROPIA-II (forward mode) vs. the ion balance (a), sensitivity of aerosol pH predicted with the model to small changes in the input aerosol NH concentration (b), and bar chart distribution in aerosol pH over the warm and cold seasons for both NH derived from raw IC data (c) and NH(total) (d).
In Iasi, north-eastern Romania, an important fraction of the total analysed samples were alkaline while the remaining samples were acidic. A more detailed view of the samples' pH distribution can be obtained from the data presented in Fig. 4c, d. It seems that over the warm season about 55–56 % of the analysed samples were alkaline (pH > 7) and about 44–45 % were acidic (pH < 7), with the last fraction mainly distributed in the very strong acidity fraction (∼ 35 % of the samples with pH in the 0–3 range, and about 2 % with an aerosol pH less than 0). Over the cold season only 47 % of the total analysed samples were alkaline (pH > 7) and 53 % were acidic (pH < 7). The acidity was also mainly distributed in the very strong acidity fraction (∼ 43 % of the acidic samples with pH in the 0–3 range). Sulfuric, nitric, hydrochloric, and formic acids are the most likely contributors to aerosol pH in the 0–3 range. Note that strongly acidic aerosols affect air quality, health of aquatic and terrestrial ecosystems (especially through acid deposition), and atmospheric visibility and climate (Dockery et al., 1996; Gwynn et al., 2000; Hennigan et al., 2015). Possible impacts of strongly acidic aerosols are presented in more detail in Sect. S7. Moreover, aerosol acidity can impact the gas–particle partitioning of semi-volatile organic acids. While under strongly acidic conditions (pH 1–3) the pH contribution of organic acids is expected to be negligible as these conditions prevent their dissociation, the scenario may change completely at pH values of 3–7 (vide infra). Under these circumstances, formic acid with pKa= 3.75 (Bacarella et al., 1955) might give a significant pH contribution to ∼ 7 % of the warm season samples and ∼ 10 % of the cold season ones.
Figure 5a, b present the size distribution of averaged aerosol mass and NO, SO, and NH concentrations while Fig. 5c, d present ISORROPIA-II estimates for pH and H+ mass concentration distributions, for both the cold (Fig. 5a, c) and the warm (Fig. 5b, d) seasons. Clear monomodal distribution seems to be specific for the cold season, while for the warm season the second mode (1.60–2.39 µm) mass concentration distribution seems to be predominated by NO. For the 155–612 nm size range, from details presented in Fig. 5c, d, it is quite clear that pH ≤ 2. In the present work, the aerosol H+ levels inferred indirectly from the ion balance as proposed by Hennigan et al. (2015) showed statistically significant correlation with the H+ loadings predicted by ISORROPIA-II in the forward mode (Pearson coefficient of 0.72, p < 0.001). However, despite the good correlation, there were important discrepancies between the two estimated H+ levels (intended as absolute values), with those from ISORROPIA-II being considerably lower than those from the ionic balance. The main issue with the model is that it may account only for partial dissociation, while the ionic balance may be affected by the uncertainty due to the propagation of measurement error. The latter may be particularly important in the presence of a slight anion deficit balance, which is interpreted as an H+-loaded system. Despite the uncertainties in the actual pH values, it is very likely that the 155–612 nm aerosol particles are strongly acidic and that H+ is mainly contributed by completely dissociated strong acids such as H2SO4 and HNO3. Contributions from free acidity (dissociated H+) or total acidity (free H+ and undissociated H+ bound to weak acids) are expected to be more important in all other remaining fractions, and especially in the 27.6–94.5 nm particle size range (vide infra). Of course, a higher confidence in the estimate of particle pH would allow better prediction of the chemical behaviour of organics that, if dissociated at relatively low acidities, would significantly contribute to the ion balance.
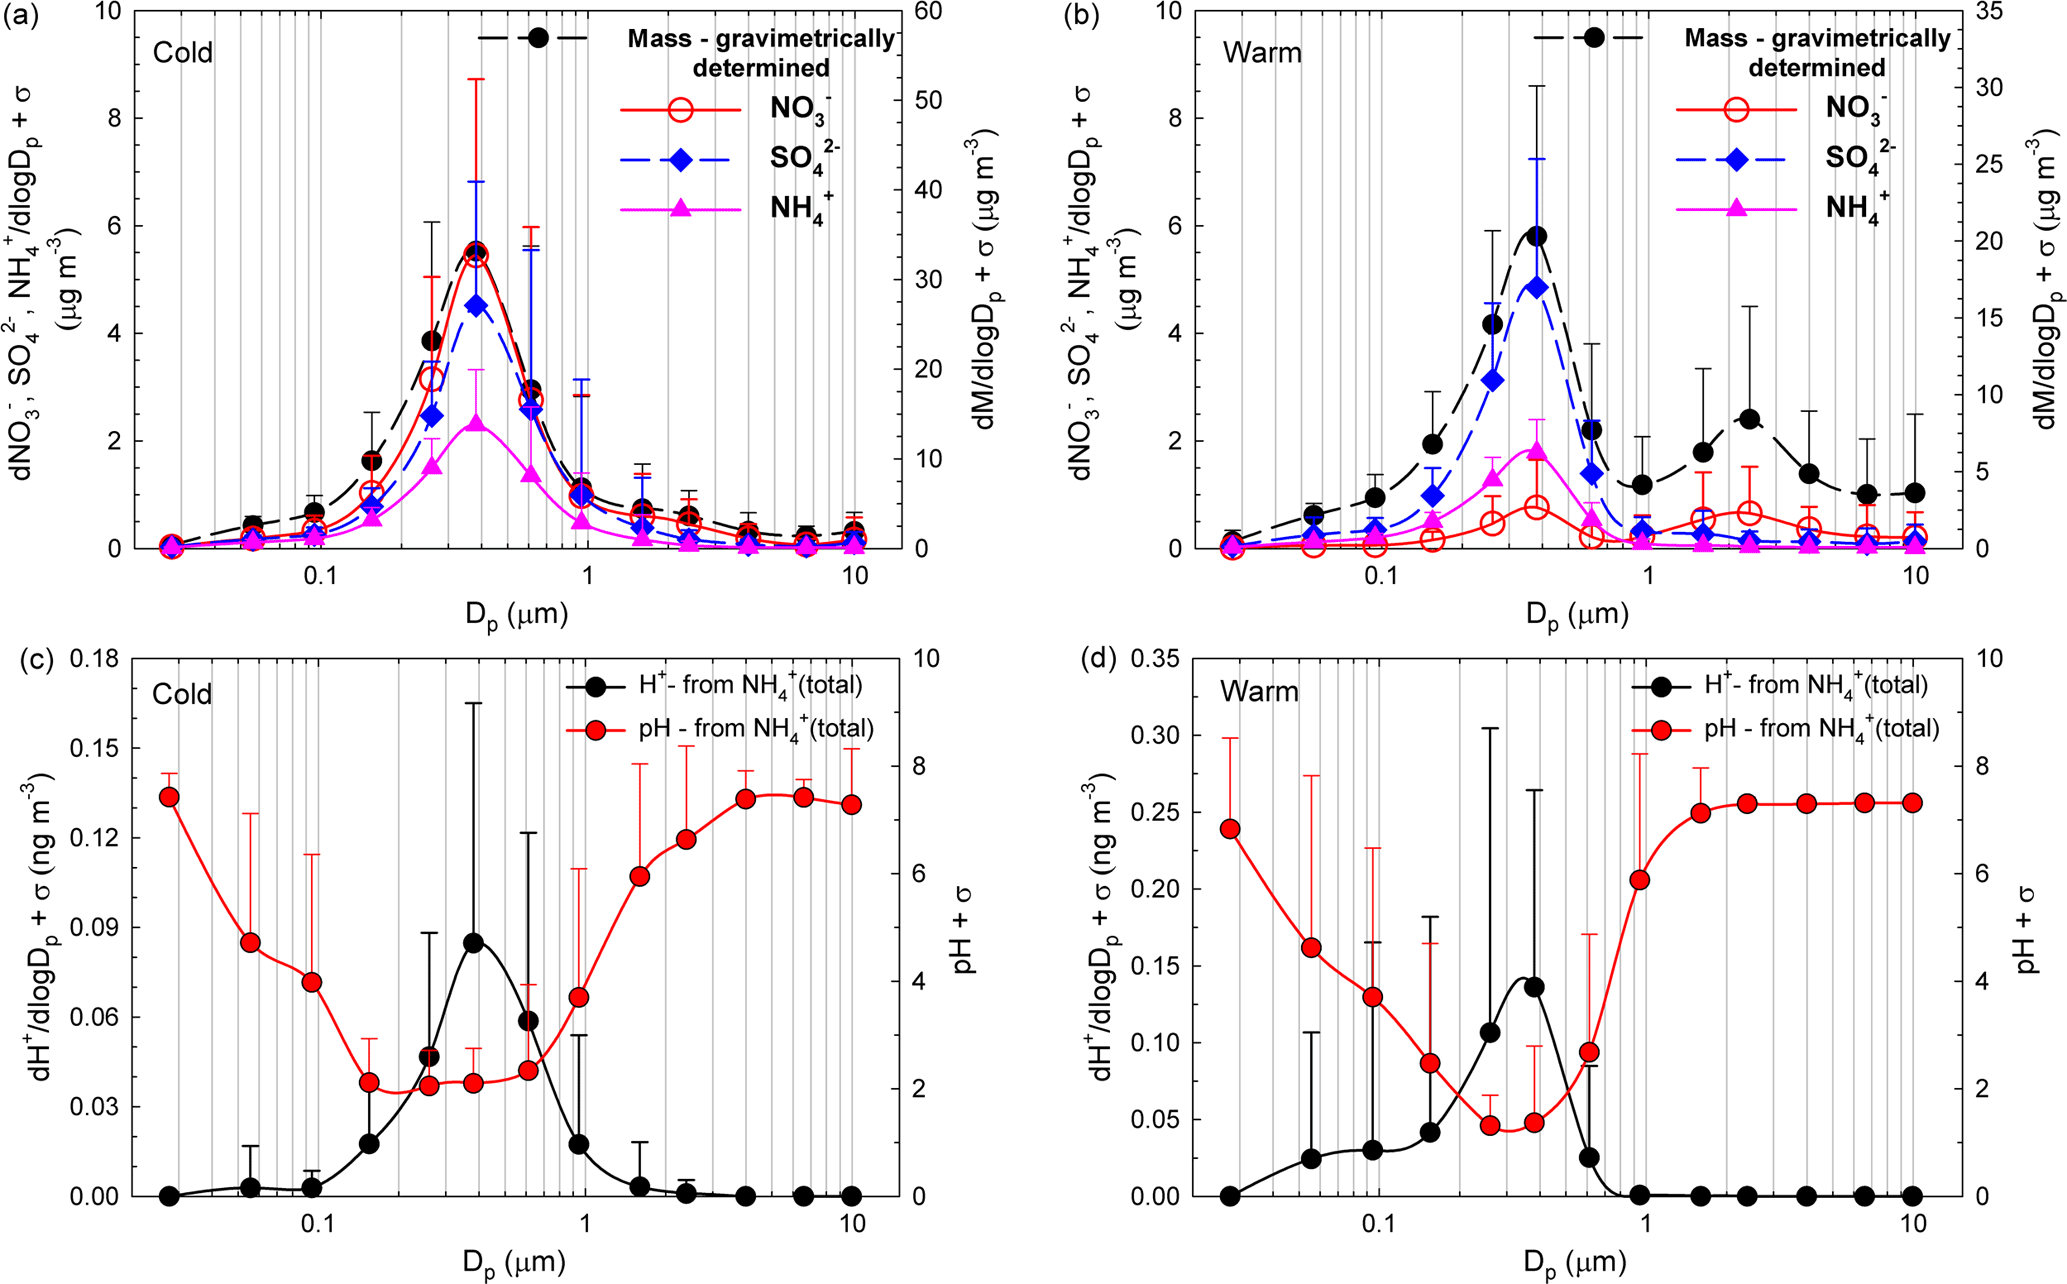
Figure 5Size distribution of averaged aerosol mass and NO SO, and NH concentrations over the cold (a) and warm (b) seasons accompanied by the size distribution of ISORROPIA-II-estimated pH and H+ mass concentration over both the cold (c) and the warm (d) seasons.
In the literature it is suggested that the molar ratio approach may be a proxy for aerosol pH estimation (Hennigan et al., 2015). However, such a procedure is highly susceptible to bias in the results, either due to exclusion of minor ionic species or because it does not consider the effects of aerosol water or species activities on particle acidity. In this work, even when the aerosol was inferred to be highly acidic (samples with a molar ratio of NH ∕ (Cl NO + 2 × SO < 0.75), there was no statistically significant correlation between the cation ∕ anion molar ratio and [H+] from either ion balance or model predictions. Therefore, the molar ratio does not appear to be a suitable tool to infer the acidity of atmospheric particles at the study site, but it could be a good parameter to distinguish between alkaline and acidic particles.
Data on gaseous NH3 were not available, but the potential relationship was also investigated between NH3 ∕ NH phase partitioning (with NH3 values predicted by ISORROPIA-II) and particle pH. The hypothesis of phase partitioning equilibrium is justified by the fact that the sampling time interval (36 h) was much longer than the equilibration time for submicron particles (seconds to minutes; Meng et al., 1995). As previously mentioned, in the present work the number of samples with a pH < 0 was significantly lower compared to those with a pH > 0. Moreover, ISORROPIA-II predicted that in the 94.5–612 nm size range there would be a significant NH3 fraction in the gas phase.
The detailed NH3 ∕ NH partitioning as a function of RH is presented below, and considerations on the potential effects on the partitioning brought about by changes in the SO and NO concentrations, and by temperature affecting both SO and NO production, is given in Sect. S8. The potential role played by temperature on NH3 ∕ NH partition seems to be minimal, but one should also consider that highly acidic aerosols will affect a variety of processes and definitely the partitioning of HNO3 to the gas phase, producing low nitrate aerosol levels. ISORROPIA-II runs predicted gas-phase NH3 concentrations in Iasi as high as 0.52 ± 0.28 (0.46) (mean ± SD (median)) µg m−3 at RH < 40 %, 0.61 ± 0.26 (0.49) µg m−3 at RH = 40–60 %, and 0.96 ± 0.54 (0.92) µg m−3 at RH > 60 %. These warm season values are smaller than those reported in a modelling study by Backes et al. (2016), who predicted NH3 abundances as high as 1.6 to 2.4 µg m−3 (data extracted from NH3 concentration for the reference case, i.e. Fig. 3 in Backes et al., 2016, for north-eastern Romania). In contrast, the 0.96 ± 0.54 (0.92) µg m−3 value at RH > 60 %, which would be mainly found during the cold season, seems to be in reasonable agreement with the ≤ 0.8 µg m−3 value modelled by Backes et al. (2016) over winter. Moreover, from ISORROPIA-II runs performed at RH < 40 %, it was estimated that (77.6 ± 28.4) % or (79.3 ± 26.2) % (mean ± SD) of the NH3 predicted by ISORROPIA-II could be present in the gaseous phase (with reference to both NH derived from raw IC data and to the NH(total) fraction). Similar but slightly decreasing values were predicted for gas-phase NH3 as RH increased, namely (76.5 ± 30.9) % or (78.6 ± 28.2) % (raw IC and NH(total), respectively) at RH = 40–60 % and (68.3 ± 36.7) % or (74.5 ± 29.7) % at RH > 60 %.
In other studies, thermodynamic equilibrium calculations predicted that all of the NH3 was mainly susceptible to partitioning to the particle phase at the equilibrium, and also that > 44 or 51 % of the investigated samples presented an aerosol pH < 0 (Hennigan et al., 2015). However, it seems that at the investigated Romanian site the atmosphere could be rich enough in NH3 so as to allow its occurrence in the gas phase while also promoting particle-phase partitioning. The seasonal trends in the NH3 concentrations derived from ISORROPIA runs for Iasi are reported in Fig. S1 (Sect. S9). The same section reports considerations on possible interrelated emission factors governing the distribution in the NH3 concentration levels in Iasi.
The ISORROPIA-II data referring to the 155–612 nm size range (regardless of RH) suggested that the aerosol ammonium fraction (NH ∕ (NH3 + NH was over 0.20 irrespective of the calculation procedure (raw IC or NH(total)). Clear (NH ∕ (NH3 + NH maxima were observed at 381 nm (raw IC data: 0.71 at RH < 40 %, 0.63 at RH = 40–60 %, and 0.76 at RH > 60 %; NH(total), defined as the sum between that derived from raw IC data and the part estimated by using the rationale of Arsene et al. (2011): 0.66 at RH < 40 %, 0.56 at RH = 40–60 %, 0.65 at RH > 60 %). As seen in Fig. 5c, d, the aerosol pH is very low in the 155–612 nm size range, while it often approaches 8 in the 27.6–94.5 and 612–9940 nm size ranges. Although not presented, in the 155–612 nm size range the aerosol ammonium fraction (NH ∕ (NH3 + NH approaches 1, while in other two size ranges it is very low or close to 0, thereby suggesting the occurrence of gaseous NH3.
3.2.2 Seasonality of the major water-soluble ions
Table 3 shows monthly statistics for meteorological variables and mass concentrations of PM10, PM2.5, and major water-soluble ions in PM2.5. Compared to the PM2.5 fraction, in the PM10 fraction we observed increases in the mass concentrations of the following ions (notation for the % increase: min–max (mean)): 13–80 % (35 %) for Cl−; 1–107 % (32 %) for NO; 1–170 % (17 %) for SO; 38–185 % (63 %) for HCO; 14–171 % (41 %) for acetate; 4–136 % (22 %) for formate; 0–294 % (27 %) for oxalate; 16–48 % (32 %) for Na+; 6–58 % (20 %) for K+; 1–105 % (12 %) for NH(total); 28–83 % (46 %) for Mg2+, and 33–123 % (61 %) for Ca2+. However, the PM10 and PM2.5 mass concentration fractions show statistically significant correlation with a ratio of 1.1 (Pearson coefficient of 0.99, p < 0.001). Higher mass concentrations of specific water-soluble ions (Cl−, NO, K+, NH, and, to some extent, SO were observed during the cold compared to the warm season, probably because of the combination of increased strength of pollution sources and meteorological effects (inducing lower mixing heights or even temperature inversion), or due to different chemical or photochemical processing. Although lowering mixing heights over the cold season might increase pollutant concentration in the atmosphere, for some species additional phenomena should be taken into account in order to explain their distribution. For particulate SO, high concentrations can be observed during winter and autumn but also in summer, and in the latter case they can be due to higher temperature and solar radiation that enhance photochemical reactions and the atmospheric oxidation potential because of the elevated occurrence of oxidant species such as ozone, hydroxyl, and nitrate radicals. These conditions favour the oxidation of SO2 to particulate SO. Also particulate C2O was maximum in summer, possibly due to enhanced photochemical processing. Moreover, the maxima observed for SO during the cold season might be due to the intensification of coal burning for heating purposes. Higher abundances of particulate NO, SO, NH, and K+ in winter compared to summer are reported for other European (Schwarz et al., 2012; Voutsa et al., 2014) and non-European sites as well (Sharma et al., 2007). Sharma et al. (2007) also suggest a potential role of CaCO3 in controlling particulate NO abundance in Kanpur, India.
Table 3Monthly averages of meteorological variables, PM10 and PM2.5 fractions, and water-soluble ion mass concentrations (µg m−3) in PM2.5 aerosol particles from Iasi, north-eastern Romania. Data are presented as mean ± SD (median). WS: wind speed; AT: atmospheric temperature.
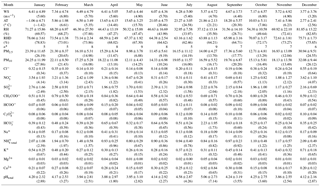
Note: * n represents the number of aerosol sample events collected each month.
Seasonal variations for selected water-soluble ionic components in PM2.5 are shown in Fig. 6a–h, while Fig. 6i shows the variation in the mixing layer depth at the investigated site. Fine-particulate Cl−, NO, K+, NH(total), and to some extent even SO seem to exhibit distinct seasonal variations with maxima during the cold season and minima over the warm season, which might be related to changes in the mixing layer depth. The summer minima observed for both NO and NH are not surprising because NH4NO3 is volatile and tends to dissociate to gas-phase NH3 and HNO3 at high temperatures. Coarse particulate C2O, Ca2+, and Na+ did not show much variation with respect to seasons. However, SO and C2O showed similar patterns (implying most probably common sources), and the Ca2+ trend suggests prevalent contribution from soil dust. Higher ion concentrations in winter than in summer are reported by Sharma et al. (2007) for Kanpur (India), while Ianniello et al. (2011) report opposite trends for Beijing (China).
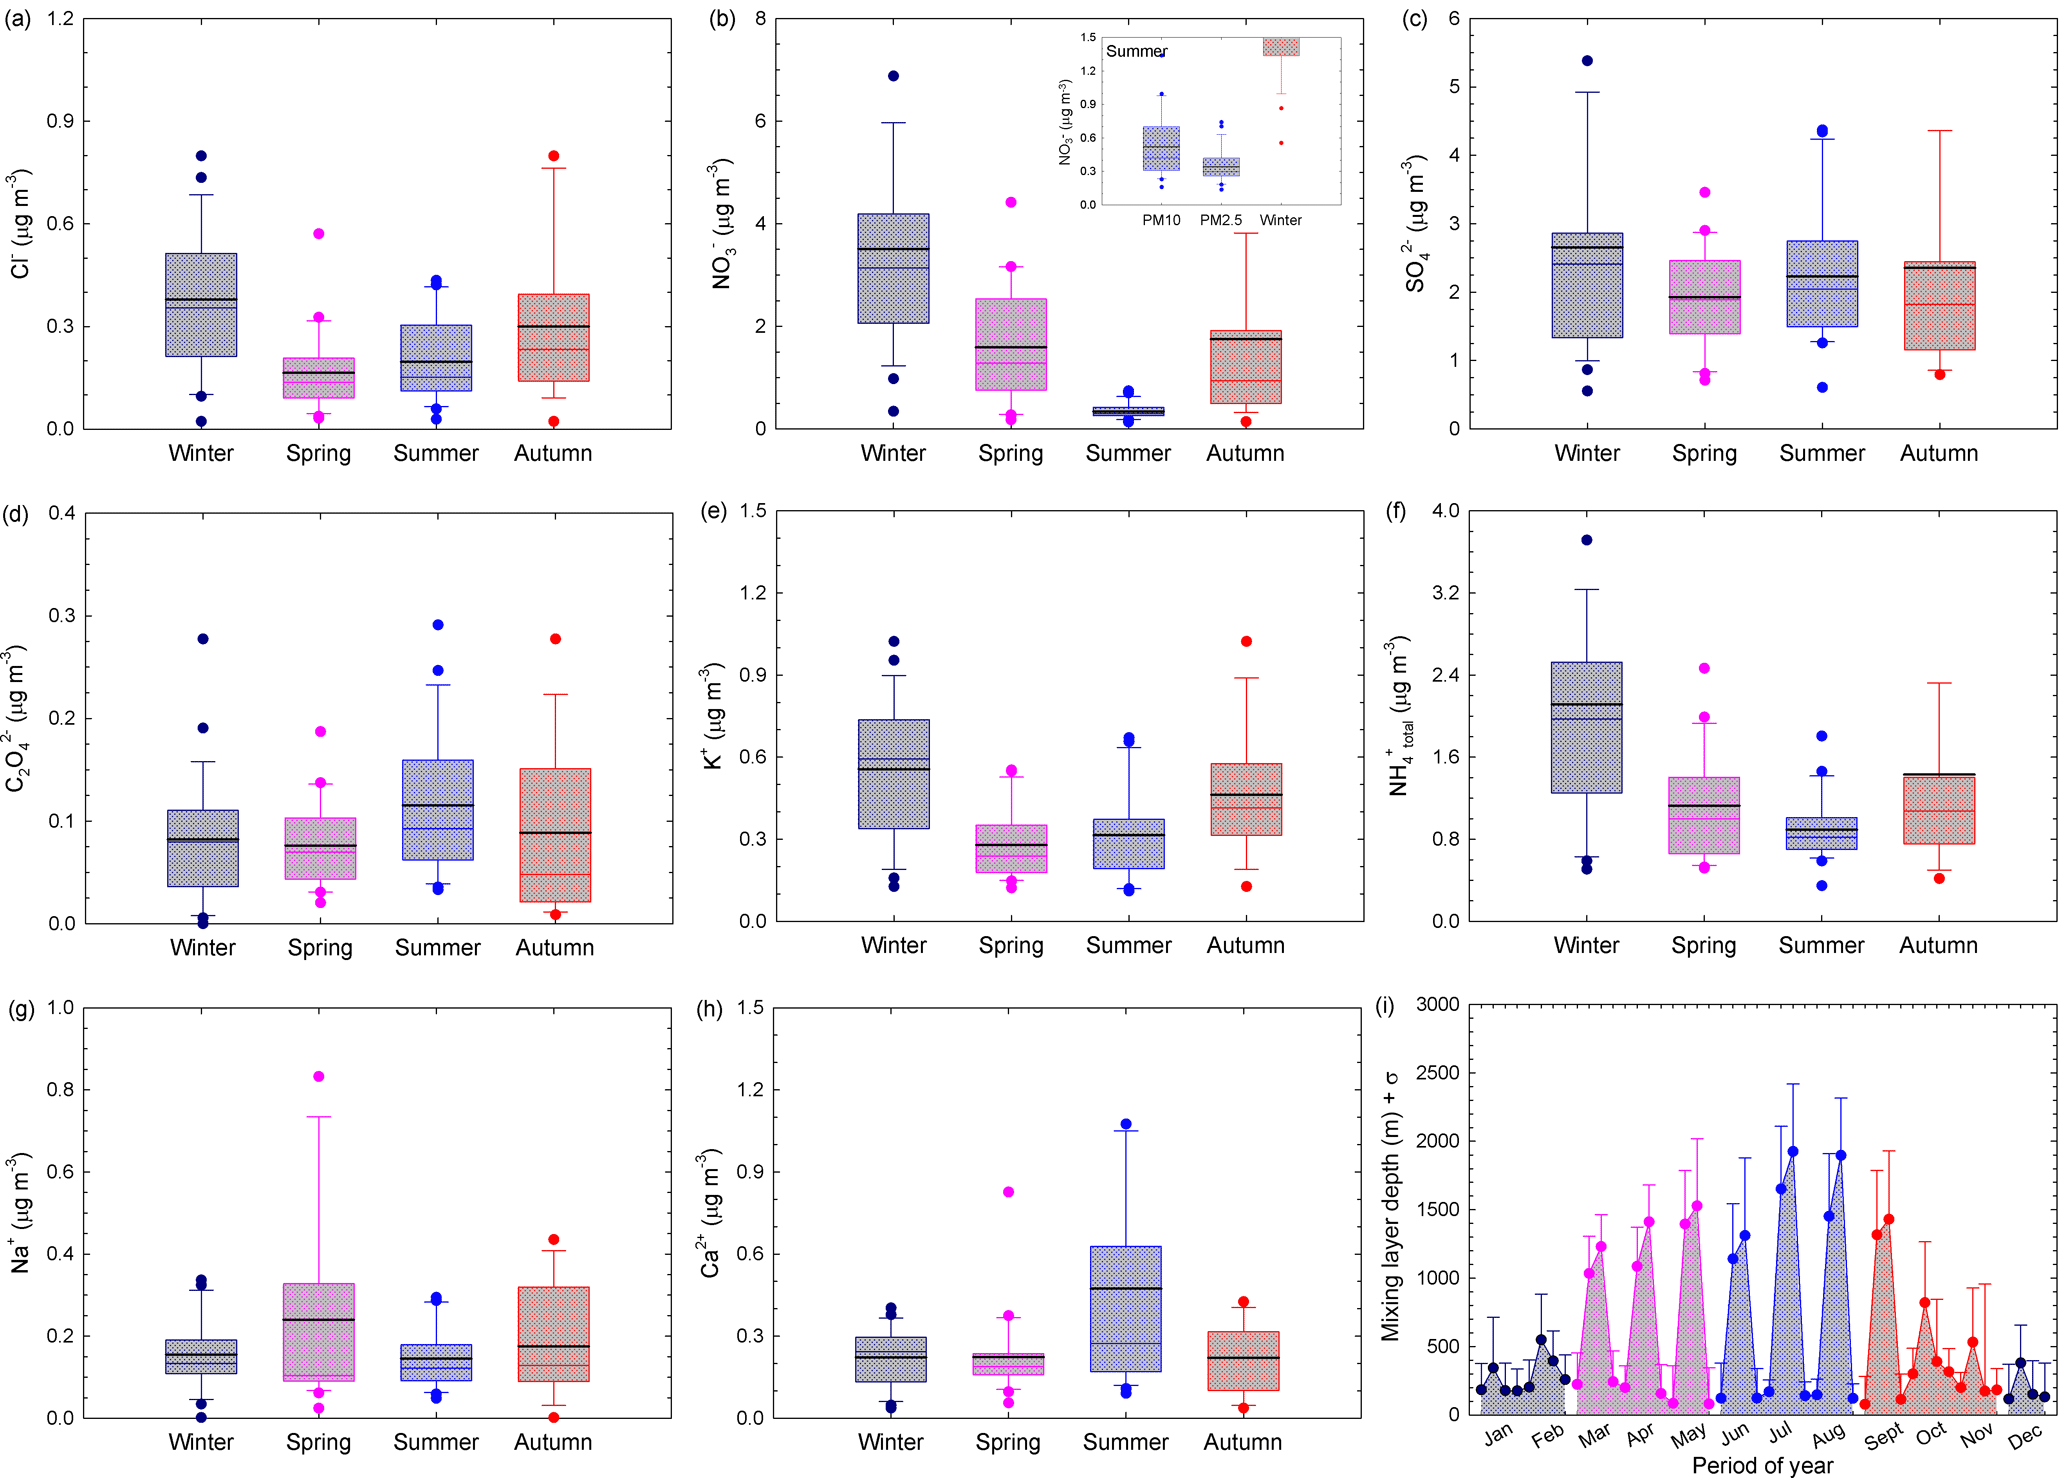
Figure 6Seasonal variations for selected water-soluble ionic components in the PM2.5 fraction (a–h) and variation in the mixing layer depth at the investigated site (i). The inset distribution presented within NO seasonal variation reflects the contribution of the coarse fraction over the warm season. The horizontal black line represents the mean, the horizontal coloured line the median, the box the 25–75 % percentiles, the length of the whiskers plot 10 and 90 % of observed concentrations, and circles the outliers.
Particulate Cl− mass concentrations show a clear seasonal pattern, with higher values during the cold season than during the warm season (Fig. 6a). The chloride mass concentration in both PM2.5 and PM10 had a statistically significant correlation with RH, temperature (only for PM10 fraction), particle loading, and mixing layer depth (detailed statistics in Table S4). The chloride maxima during the cold season might be the result of increased coal burning for heating purposes or of the use of NaCl in winter on icy and snowy roads. These observations are in agreement with other studies at eastern European sites (Arsene et al., 2011; Alastuey et al., 2016). However, the Cl− mass concentration follows a pattern similar to that of K+ (tracer of biomass burning), thereby suggesting that over the cold season wood burning might become an important heating source (Christian et al., 2010; Akagi et al., 2011).
Nitrate also shows cold season maxima and warm season minima (see Table 3 and Fig. 6b). The inset distribution presented within NO seasonal variation (Fig. 6b) suggests that, in summer, the coarse PM fraction can bring significant contributions to the aerosol atmospheric burden of nitrate. In our work, fine-particulate NO mass concentrations varied from 0.31 to 3.62 µg m−3 (Table 3) and these data are in very good agreement with those predicted for Europe in a modelling study performed by Backes et al. (2016). The data obtained in the present work over the cold season (3.62 ± 1.10 µg m−3 in January, February, and December as the coldest months of the year, and 2.65 ± 0.38 µg m−3 over January, February, March, October, November, and December) seem to be in reasonably good agreement with those predicted for Europe by Backes et al. (2016). In contrast, the 0.59 ± 0.30 µg m−3 NO concentration in PM2.5 measured over the warm season (including the April month characterized by predominant air mass buoyancy, and decreasing down to 0.44 ± 0.12 µg m−3 if the April month is excluded) is lower than that predicted by Backes et al. (2016) (abundances as high as 0.8 µg m−3 over summer). Similar to the NH case, this might reflect the susceptibility of NO to be transferred to the gas phase over the warm season.
The NO mass concentrations in both PM2.5 and PM10 had a statistically significant correlation with RH, temperature, mixing layer depth, and particle loading (Table 3, detailed statistics in Table S4). However, it has to be observed that highly acidic aerosols expected over all seasons have the potential to affect the partitioning of HNO3 to the gas phase, producing low nitrate aerosol levels. Guo et al. (2015) also report low nitrate aerosol levels during summer. Moreover, NO heterogeneous formation (i.e. condensation or absorption of NO2 in moist aerosols or N2O5 oxidation and HNO3 condensation) generally relates to RH and the particulate loading (Wang et al., 2006; Ianniello et al., 2011). At the investigated site, this process might be of similar importance as the gas–particle conversion, which implies oxidation of precursor gases, such as NOx, to nitrate via HNO3 formation and involving photochemical processes. The high concentration of NO during the cold season might also be caused by higher NH3 atmospheric levels from yet unaccounted sources, which could neutralize gas-phase H2SO4 and HNO3 to produce ammonium salts (vide infra). Reactive nitrogen species are emitted to the atmosphere mainly in the forms of NOx (from transport or power generation) and NH3 (agriculture). In Iasi, the animal husbandry sector (open and closed barns, manure storage or spreading) is most likely an important NH3 source. Moreover, the high RH observed in the cold season could offer suitable conditions for significant fractions of HNO3 and NH3 to be dissolved in humid particles, therefore enhancing particulate-phase NO and NH (Pathak et al., 2009, 2011; Ianniello et al., 2010; Sun et al., 2010). From measurements performed in October 2004 in Beijing, China, Kai et al. (2007) also concluded that high RH, stable atmosphere, and high NH3 levels can enhance transformation of NOx into NO.
Particulate SO maxima are observable during both cold and warm seasons. However, the particulate SO mass concentrations showed statistically significant correlation with the measured meteorological parameters only at a 68 % confidence level (detailed statistics in Table S4). The data presented in Fig. 6c show that the seasonal trend of the monthly SO mean mass concentrations is not as clear as that of NO and NH, which might suggest the occurrence of regional SO sources as well (Wang et al., 2016). Moreover, high RH (in Iasi, especially during cold months) may aid the conversion of SO2 to SO (Kadowaki, 1986), with a significant enhancement of SO production rate in the aqueous phase (Sharma et al., 2007). However, the oxidation of SO2 to sulfate may be induced not only by H2O2 in the aqueous phase, but also by gas-phase radical hydroxyl (Vione et al., 2003). This issue can explain the PM sulfate maxima during the warm season because of higher sunlight irradiance and temperature (Stelson and Seinfeld, 1982; Stockwell and Calvert, 1983; Kadowaki, 1986; Wang et al., 2005).
The data reported in Table 3 and Fig. 6f show that particulate NH(total) has a clear seasonal pattern with maxima during the cold and minima over the warm season, in agreement with reports at other European (Schwarz et al., 2012; Bressi et al., 2013; Tositti et al., 2014; Voutsa et al., 2014) or non-European sites (Sharma et al., 2007; Wang et al., 2016). This behaviour is opposite to that reported by Ianniello et al. (2011). The cold season maxima and warm season minima we observed can be due to the effect of variations in the mixing layer depth, combined with gas-phase transfer of NH4NO3 to NH3 and HNO3 as temperature increases. In our dataset, NH(total) varied from 0.8 to 2.09 µg m−3, a much lower range than that reported by Meng et al. (2011) for a more polluted site (Beijing, China, with concentrations varying between 4.73 and 9.04 µg m−3 among various seasons). However, the data we measured in the cold season (2.03 ± 0.30 µg m−3 over January, February, and December; 1.65 ± 0.23 µg m−3 over January, February, March, October, November, and December) seem to be in reasonable agreement with those predicted for Europe by Backes et al. (2016). In contrast, the 0.90 ± 0.09 µg m−3 NH(total) measured concentration over the warm season is much lower than that predicted by Backes et al. (2016), and the discrepancy might actually reflect the limitation of the experimental measurement techniques concerning NH4NO3 volatility. Moreover, the NH(total) mass concentration correlated significantly with RH and particle loading in both the PM2.5 and PM10 fractions, and it anticorrelated significantly with temperature and mixing layer depth (detailed statistics in Table S4). The PM2.5 fraction also showed statistically significant correlation with the mixing depth (Pearson coefficient higher than 0.67, p = 0.016). The seasonal variation in particulate NH(total) especially follows that of particulate NO and Cl−, which would indicate that most probably NH(total) largely originates from neutralization among NH3, HNO3, and HCl (Wang et al., 2006), or that the cited particulate species derive from similar gas-to-particle processes (Huang et al., 2010). Although in the present work gaseous NH3 was not measured, ISORROPIA-II runs predicted that the atmosphere was often in a gaseous ammonia-rich state, independent of the RH values ([NH3] ∕ ([HNO3] + [HCl]) ≫ 1).
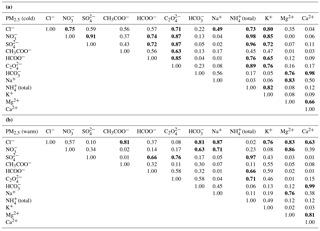
Table 4Correlation matrix (Pearson coefficients) for major ionic species (Cl−, NO, SO, CH3COO−, HCOO−, C2O, HCO, Na+, NH(total), K+, Mg2+, Ca2+) in fine aerosol particles from Iasi, north-eastern Romania, for both cold (a) and warm (b) seasons. Bold font reflects statistical significant correlation at the 99.9 % confidence level.
At the investigated site, C2O and SO show similar behaviour and the C2O maxima during summer may suggest photochemical and/or biogenic contributions to its abundance (Laongsri and Harrison, 2013). The Na+ ion, tracer of sea salt or NaCl aerosols, shows higher concentrations during spring when one has a predominant long-range transport of air masses from the S-SE sector, with contributions from natural sources and especially sea spray aerosols from the Black Sea. Particulate K+ mass concentrations also show a clear seasonal pattern, with higher values during the cold season compared to the warm season (Fig. 6e). This phenomenon could be due to increased wood burning combined with a limited mixing layer depth. However, particulate K+ mass concentrations also had some maxima when one expects intense agricultural biomass burning for field clearing (i.e. April, July, and September). The K+ mass concentrations follow a pattern similar to Cl− (Pearson coefficient of 0.79, p = 0.002) but a different one compared to SO. Therefore, we suggest that intense wood burning may be a common source for K+ and Cl− species in the study area (Christian et al., 2010; Akagi et al., 2011).
High mass concentrations of Ca2+ and Mg2+ (with Mg2+ shown in Table 3 but not in Fig. 6), as soil or dust tracers, were observed especially during spring and summer. Over these seasons, lower precipitation frequency and high wind speed contribute to the observed behaviour. During the cold season, low wind speeds might prevent mineral dust resuspension and produce low values for these ions. However, Mg2+ and Ca2+ as mineral ions did not correlate with either PM2.5 or PM10, which suggests that inorganic particles would be mainly produced by NH3-triggered secondary processes.
3.2.3 Stoichiometry of (NH4)2SO4, NH4NO3, and NH4Cl
Table 4 presents the correlation matrix (Pearson coefficients) for the major ionic species (Cl−, NO, SO, CH3COO−, HCOO−, C2O, HCO, Na+, NH(total), K+, Mg2+, Ca2+) in PM2.5, for both the cold (Table 4a) and the warm seasons (Table 4b). Despite similar correlations in PM10 as well, PM2.5 was selected for the correlation matrix analysis because of higher representativeness. For the cold season there are significant correlations (at the 99.9 % confidence level) among many chemical pairs, suggesting an important occurrence of (NH4)2SO4, NH4NO3, and (NH4)2C2O4. In the warm season, (NH4)2SO4, Mg(NO3)2, and NaCl seem to be the most important. However, Ca(HCO3)2 might play a role during both cold and warm seasons. Over the cold season, K+ shows statistically significant correlation with many inorganic (NO, Cl−, and SO and organic (HCOO− and C2O anions, thereby suggesting that at least some of these species might have common biomass burning sources (Ianniello et al., 2011, and references therein). However, in the case of SO and NO the most likely explanation would rather be the use of both coal and wood for burning, as well as the effect of the mixing layer depth.
In the ambient atmosphere, inorganic ammonium salts such as NH4HSO4, (NH4)2SO4, NH4NO3, and NH4Cl are known to be produced by gas-to-particle conversion processes. In the present work, from the ionic balance analysis the NH ion was assigned as the most critical parameter in the chemical composition analysis of aerosol particles (with 274 analysed samples, i.e. about one-quarter of the total, being highly deficient in cations). Figure 7a, b present the relationship between the molar concentrations of fine-particulate NH (i.e. from raw IC data and also in the total form estimated under the assumptions from Arsene et al., 2011) and that of particulate SO for both the cold (Fig. 7a) and warm (Fig. 7b) seasons. Correlations between particulate NH and SO are statistically significant in both cases (detailed statistics in Table S5).
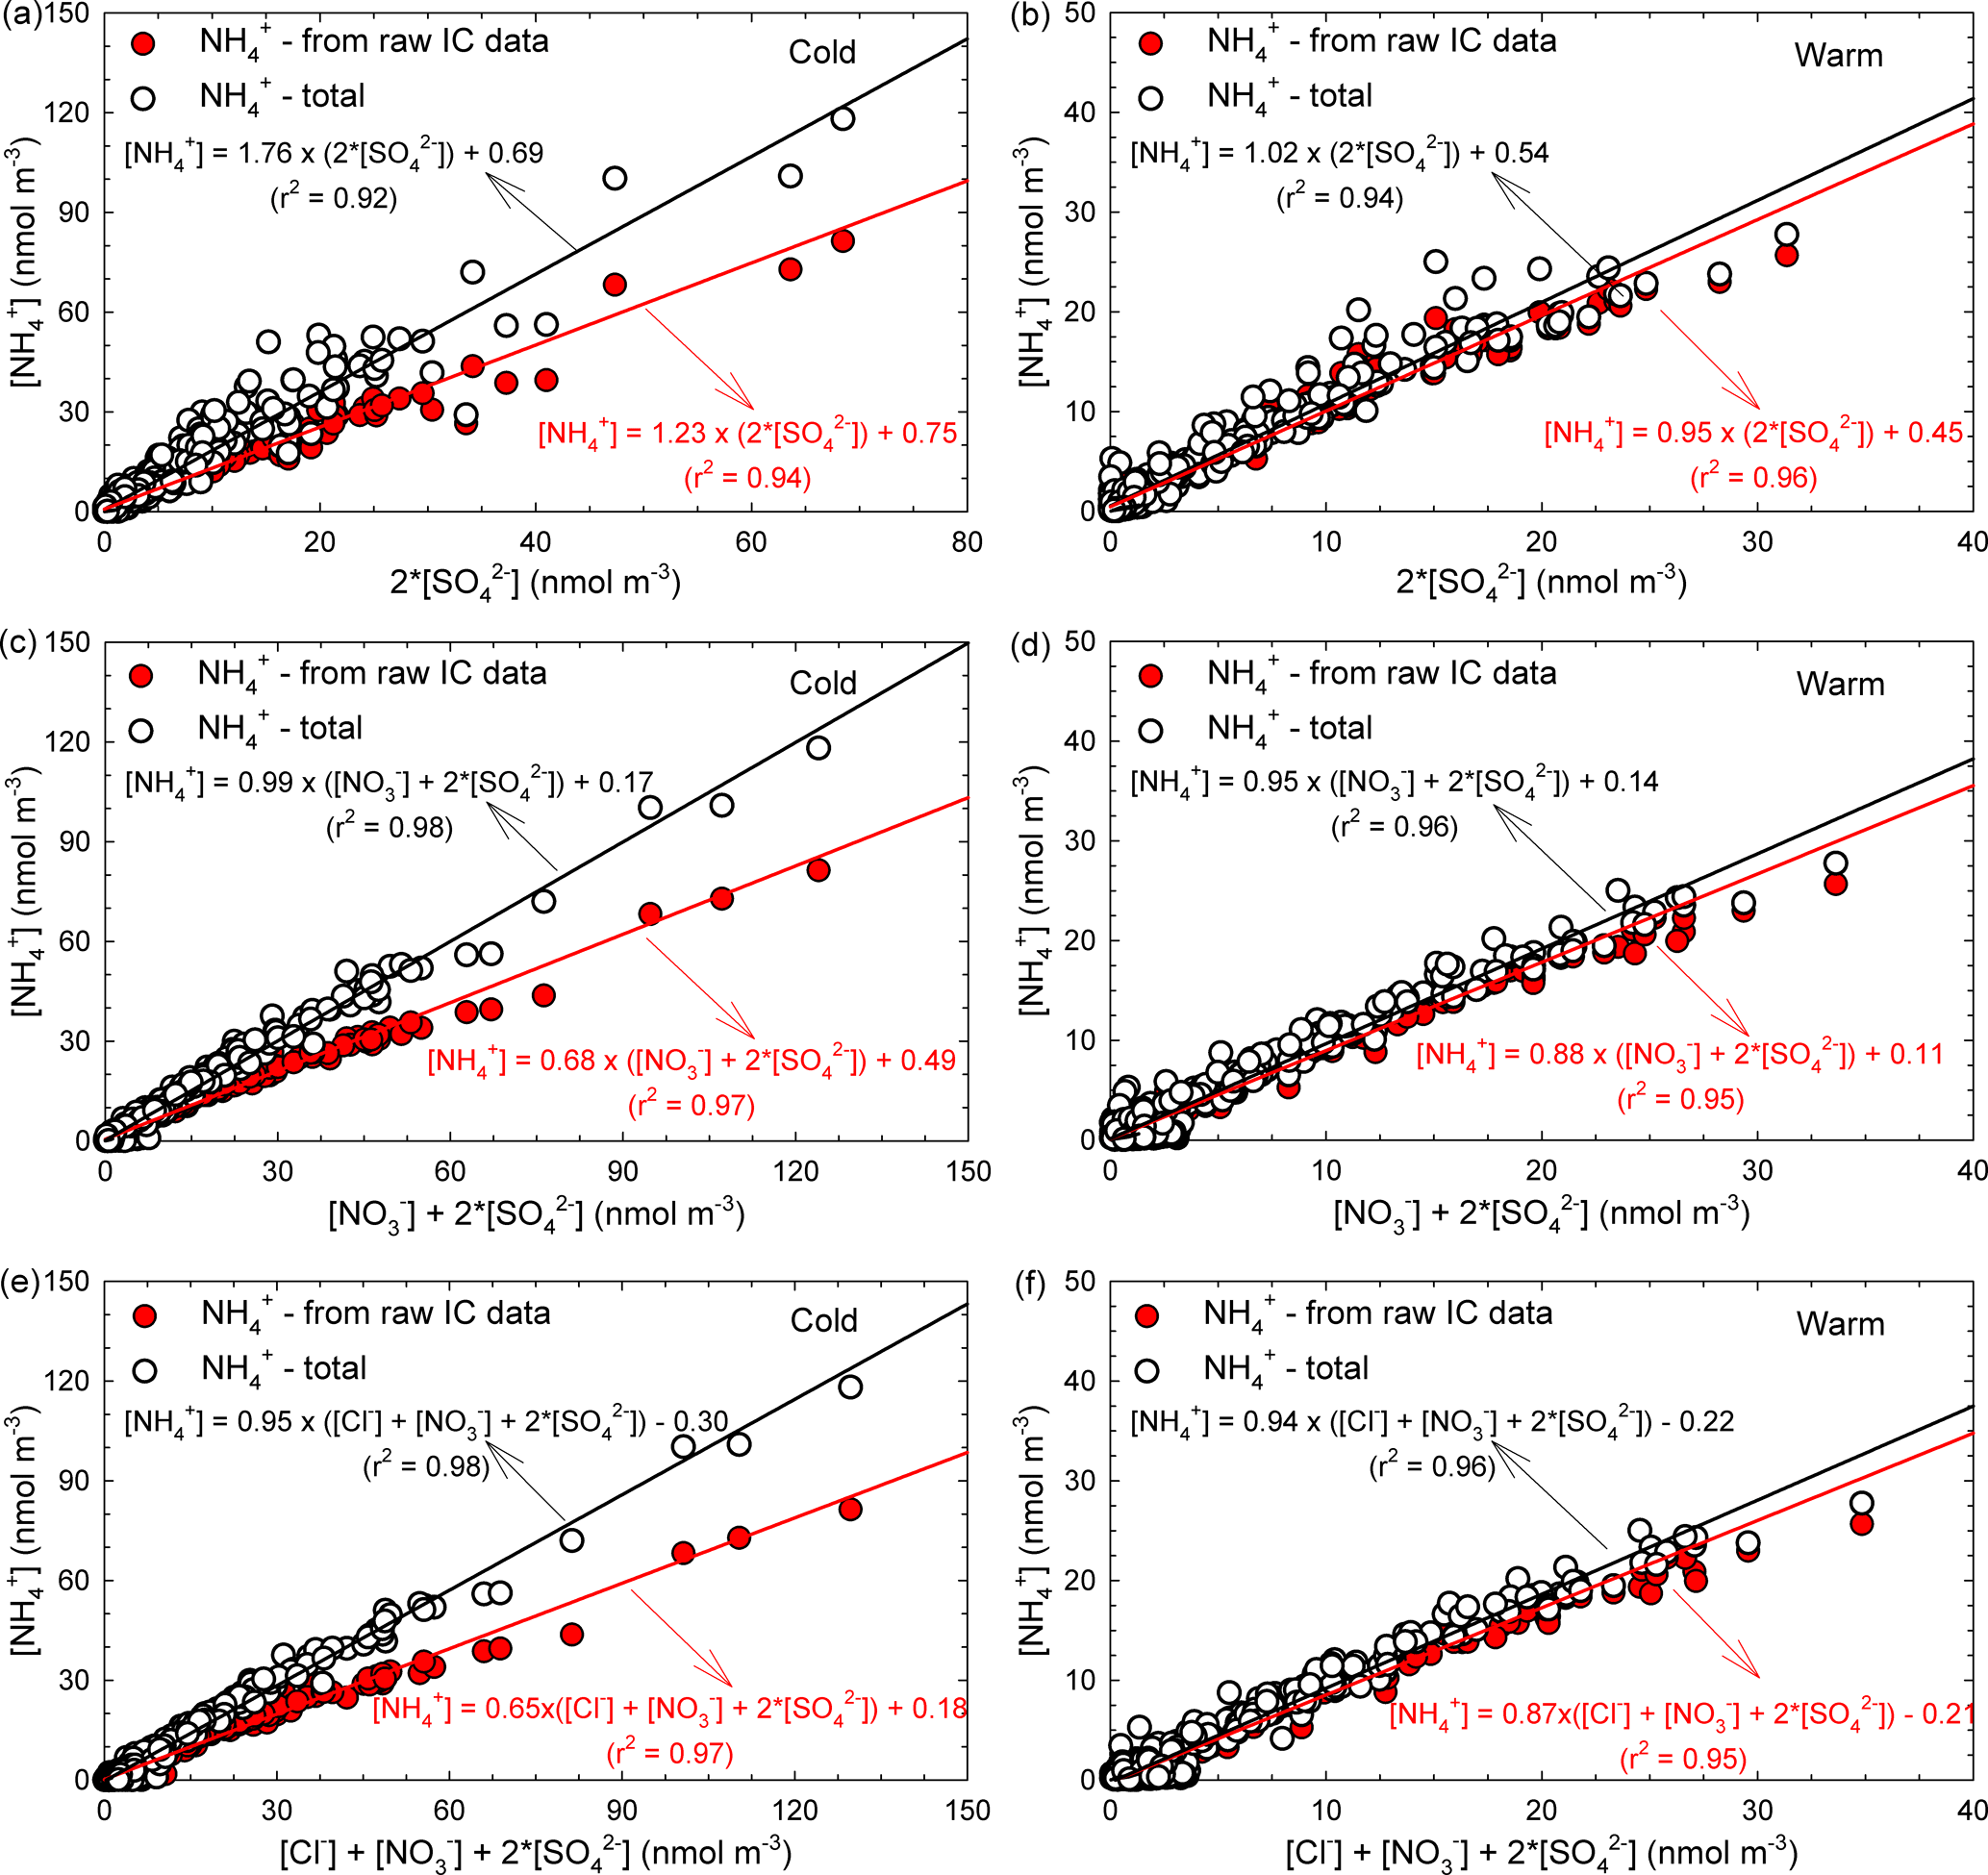
Figure 7Regression analysis of the [NH] vs. (2 × [SO]) (a, b), [NH] vs. ([NO] + 2 × [SO]) (c, d), and [NH] vs. ([Cl−] + [NO] + 2 × [SO]) (e, f) dependences specific to PM2.5 particles.
During cold and warm seasons, the [NH] ∕ (2× [SO]) molar ratio was either ∼ 1 (raw IC data) or (NH(total) values) equal to 1.76 (cold season) and 1.02 (warm season). These data suggest the existence of enough NH3 for the complete neutralization of H2SO4, and also a predominance of particulate (NH4)2SO4 in agreement with the observations of Ianniello et al. (2011). Moreover, as shown in Table 4, for particulate SO and NH(total) the correlation was statistically significant (with Pearson coefficients of 0.96, p < 0.001 for the cold season and 0.97, p < 0.001 for the warm season), thereby suggesting that (NH4)2SO4 could be formed from H2SO4(g) and NH3(g) in either case. However, the 1.76 value for the [NH](total) ∕ (2 × [SO]) molar ratio during the cold season will indicate that there should still be particulate NH potentially available for combination with other anions (or the existence of enough excess ammonia to neutralize acidic species such as HNO3 and HCl). Zhao et al. (2016) report a [NH] ∕ (2× [SO]) molar ratio of 1.54 (R2= 0.63), indicating the complete neutralization of H2SO4 and a predominance of (NH4)2SO4 in sulfate salts during the cold season.
Unfortunately, at present, no measured NH3 values are available for the site of interest but it is still believed that, in the atmosphere of Iasi, sufficient gas-phase NH3 occurs to promote both the homogeneous and heterogeneous formation of nitrate salts in the collected aerosol particles. The NH4NO3 formation routes might involve either the homogeneous reaction between gaseous HNO3 and NH3 (Ianniello et al., 2011) or the heterogeneous reaction between NH3 and the products formed upon hydrolysis of N2O5 that could be present on the surface of the pre-existing moist aerosols under relatively high humidity (Pathak et al., 2011; Shon et al., 2013). Actually, gaseous NH3 can influence both the inorganic ions and the aqueous-phase H+ distribution in aerosols. The concentration of H+ in aqueous aerosols is mainly determined by the balance of the acidic ionic components with the basic ones. During both cold and warm seasons, about half or slightly more than half of the collected samples were found to be alkaline with pH values fluctuating between 7 and 8. The remaining samples were acidic and with pH values ranging mainly from 1 to 3. Zhao et al. (2016) report that, on average, a +25 % perturbation in the NH3 level could lead to a 0.14 unit pH increase, and a – 25 % perturbation could cause a 0.23 unit pH decrease. They concluded that sufficient NH3 was frequently present in the wintertime atmosphere, and also that the fine collected particulates were almost fully neutralized by NH3.
Figure 7c, d, e, f show the relationships between the fine-particulate molar concentrations of (i) NH and the sum of SO and NO (Fig. 7c, d), and (ii) NH and the sum of SO, NO, and Cl− (Fig. 7e, f), for both cold and warm seasons. From details given in Fig. 7c, d, e, f it can be easily observed that NH, with both calculation methods (IC and total), was in deficit over the cold and warm seasons. Under these circumstances, it is believed that both particulate NO and Cl− could be associated with other alkaline species or be part of acidic aerosol. Because the neutralizing capacity of NH toward SO, NO and Cl− acidic species might give a rough indication on the potential particle acidity (Li et al., 2015); from Fig. 7c, d, e, f it is quite clear that at the study site, if NH derived from raw IC data is used, the neutralization ratios in the investigated particles are less than unity. This suggests that the atmospheric particles are most likely acidic, and also that a more complex chemistry involving the HNO3 and HCl species is ongoing. However, when NH(total) is used, the neutralization ratio approaches 1 and suggests a possibly complete neutralization of particle acidity. From details in Fig. 7e, f it can be easily seen that actually the available NH is not enough to compensate for other species. However, it should be noted that Cl− does not significantly influence the neutralization of particle acidity. In a study performed by Zhao et al. (2016) the authors reported a [NH] ∕ (2 × [SO] + [NO]) molar ratio of 0.86 (R2= 0.78) and an [NH] ∕ (2 × [SO] + [NO] + [Cl−]) molar ratio of 0.60 (R2= 0.86). Details presented in Fig. 7c, d clearly show that when NH(total) is taken into account, a complete neutralization of H2SO4 and HNO3 can be achieved during the cold season (Fig. 7c). In contrast, during the warm season (Fig. 7d) the molar ratio is slightly lower than 1 (i.e. 0.95). According to Seinfeld and Pandis (1998), during the warm season the high temperature and the low RH would be favourable for NH to reach a minimum concentration because it is mainly transformed into NH3. Actually, temperature values above 25 ∘C, such as those often encountered at the investigated site over the warm season, are known to prevent formation of particulate NH4NO3 (Adams et al., 1999). Under these circumstances, a considerable decrease in the [NH](total) ∕ ([NO] + 2 × [SO]) molar ratio is to be expected during the warm season. The cold season temperature and RH at the investigated site were, respectively, 5.3 ± 3.9 ∘C and (65.3 ± 12.8) %. Coherently, the data presented in Table 4 show that the (NO, NH(total)) pair has a significant correlation (Pearson coefficient of 0.98, p < 0.001) only during the cold season, while during the warm season (temperature and RH of, respectively, 18.9 ± 3.8 ∘C and 40.5 ± 7.7 %) the correlation is very poor as increasing temperature and decreasing RH limit the production of the NH4NO3 aerosol (Matsumoto and Tanaka, 1996; Utsunomiya and Wakamatsu, 1996; Alastuey et al., 2004).
In the atmosphere, both H2SO4 and HNO3 are known to compete for the reaction with NH3 to form (NH4)2SO4 and NH4NO3. As presented in Sect. 3.2.2, at the investigated site a reduction in both in NO and SO was observed over the warm season and this may cause a further increase in gas-phase NH3. It is also interesting to observe that the reaction rate constant of (NH4)2SO4 aerosol formation is similar to the rate constant of NH4NO3 formation (Harrison and Kitto, 1992; Pandolfi et al., 2012; Behera et al., 2013), and both are much higher than the rate constant between NH3 and HCl (Behera and Sharma, 2012). This issue probably dictates the competition of any of the particulate SO, NO, and Cl− for the available NH. Usually, when a sufficient amount of NH3 is available for neutralization of H2SO4 and HNO3, fine-mode (NH4)2SO4 and NH4NO3 will be formed via Reactions (R1) (Cziczo et al., 1997; Zhang et al., 2015) and (R2) (Fountoukis and Nenes, 2007; Zhang et al., 2015).
In contrast, in NH3-limited environments, coarse-mode NO is formed through Reaction (R3) involving Mg2+ (but not Ca2+):
During the warm season, however, higher concentrations of (NH4)2SO4 compared to NH4NO3 are expected because (NH4)2SO4 is less volatile than NH4NO3 (Utsunomiya and Wakamatsu, 1996). Moreover, NH4NO3 will be formed only when excess NH3 is available to react with HNO3. A modelling study by Backes et al. (2016) suggests that a reduction of NH3 emissions by 50 % may lead to a 24 % reduction of the total PM2.5 concentrations in north-western Europe, mainly due to reduced formation of NH4NO3. However, the NH3 concentration in the atmosphere over Europe seems to be high enough to saturate the reaction forming (NH4)2SO4 particles, even in a scenario of reduced NH3 levels, while on the contrary it is not high enough to saturate the reaction with HNO3 to form NH4NO3 particles. A reduced formation of NH4NO3 particles may lead to an increase in gas-phase HNO3 during winter. In our study, results from the ISORROPIA-II thermodynamic model foresee an increase in gas-phase HNO3 at higher RH values during the cold season. Higher levels of gas-phase HNO3 may increase its condensation onto existing particles such as sodium chloride (NaCl), and the replacement of Cl− with NO may enhance the concentration of HCl in the atmosphere (similar processes are described in Arsene et al., 2011).
In the atmosphere, additional non-volatile species containing nitrate and chloride might also be present; thus we investigated the potential of fine-particulate NO and Cl− to be chemically bound to Ca2+, Mg2+, K+, or Na+. The free NO and Cl− concentrations, defined as the fractions of excess nitrate and chloride that are not bound to alkali or alkaline earth metals, were estimated for both the cold and warm seasons according to the concept described in Ianniello et al. (2011). Zero or negative values of free NO and Cl− imply that NH4NO3 and NH4Cl are not present. Estimated free NO and Cl− concentrations showed similar contributions in both the PM2.5 and PM10 fractions. Over the cold season we calculated (6.5 ± 7.9) × 10−3 µmol m−3 (0.4 ± 0.5 µg m−3) for NO, and negative values for free Cl−; over the warm season we had (1.6 ± 1.8) × 10−3 µmol m−3 (0.1 ± 0.1 µg m−3) for NO, and again negative values for free Cl− (data provided as mean ± SD). This result suggests the potential presence of NH4NO3, especially during the cold season, but it excludes the occurrence of NH4Cl. During the cold season, particulate NO did not show correlation with either Ca2+ or Mg2+, but it showed significant correlation with K+ (r = 0.85, p < 0.001; see Table 4), which indicates the possible formation of the non-volatile KNO3 salt along with NH4NO3. Over the warm season, fine-particulate NO did not show correlation with K+, but it showed significant correlation with Na+ and Mg2+ (respectively, r = 0.71, p < 0.001 and r = 0.86, p < 0.001), indicating possible formation of non-volatile NaNO3 and Mg(NO3)2 but not of Ca(NO3)2 salts. Moreover, in the warm season the fine-particulate NO also showed statistically significant correlation with HCO (r = 0.63, p < 0.001), which suggests a prevalence of particulate NO formation via the mineral route over the homogeneous reactions. The interaction between NO and Mg2+ could increase in importance during the warm season because, as NH is not available, neutralization of HNO3 could occur on coarse soil particles rich in Mg2+ (Matsumoto and Tanaka, 1996; Utsunomiya and Wakamatsu, 1996; Alastuey et al., 2004).
From the literature it is known that species such as (NH4)2SO4 and NH4HSO4, at room temperature, uptake water (deliquesce) at RH values of, respectively, (79 ± 1) % and 39 % (Cziczo et al., 1997). The (NH4)2SO4 aerosol particles might remain in metastable or supersaturated state liquid phase until a very low RH (crystallization point, RH around 33 %) is reached (only thereafter a solid might be formed). In contrast, for NH4HSO4 it has been shown that the solid phase is difficult to form. In the present work, it is very likely that only over July (RH of 32.95 %), August (RH of 37.12 %), and September (RH of 31.56 %) could the formation of solid (NH4)2SO4 or NH4HSO4 occur.
Pure NH4NO3 deliquesces at 62 % RH and there is suggestion that sometimes even at 8 % RH the crystallization point is not reached (Dougle et al., 1998). According to suggestions from the literature, only during months when the ambient RH is lower than the RH at deliquescence (RHD), is the NH4NO3 considered as a solid (Seinfeld and Pandis, 1998). In the present work, from March to October the ambient RH was always lower than the RHD and NH4NO3 could thus be assumed to be in equilibrium with the solid phase. Within all the other months, from the estimated RHD values there is the possibility that NH4NO3 is in equilibrium with the aqueous phase and deliquescent particles. However, in the investigated site, solid NH4NO3 could be formed almost over the entire year due to either the very complex chemical composition of the collected particles or the abundant contribution of organic carbon to the particle mass concentration (Dougle et al., 1998). Formation of NH4NO3 over the warm season has also been reported by Ianniello et al. (2011) but under different conditions. For deliquesced particles it is suggested that most of the fine-particulate NO occurs as an internal mixture with SO, and also that HNO3 can easily be absorbed into the droplets (Huang et al., 2010). In specific circumstances, the fine-particulate NO can be formed from HNO3 and NH3 through heterogeneous reactions on fully neutralized fine-particulate SO, which is abundant in urban areas (Stockwell et al., 2000). In the present work, a statistically significant correlation between SO and NO was observed during the cold season in the PM2.5 fraction (r = 0.91, p < 0.001). High concentrations of NO were found in the presence of elevated RH levels (significant correlation: r = 0.84, p < 0.001), while SO concentrations were high over the entire RH range (non-significant correlation: r = 0.44, p = 0.177). These results can be interpreted as nitrate being produced on pre-existing sulfate aerosols, which could provide sufficient surface area and water content for the heterogeneous reactions to occur. Although the formation of fine-particulate NO can take place via Reaction (R2), in particular circumstances and especially at high RH values, the amounts of the gaseous precursors such as NH3 and HNO3 may have relatively little influence on the fine-particulate NO formation (Markovic et al., 2011).
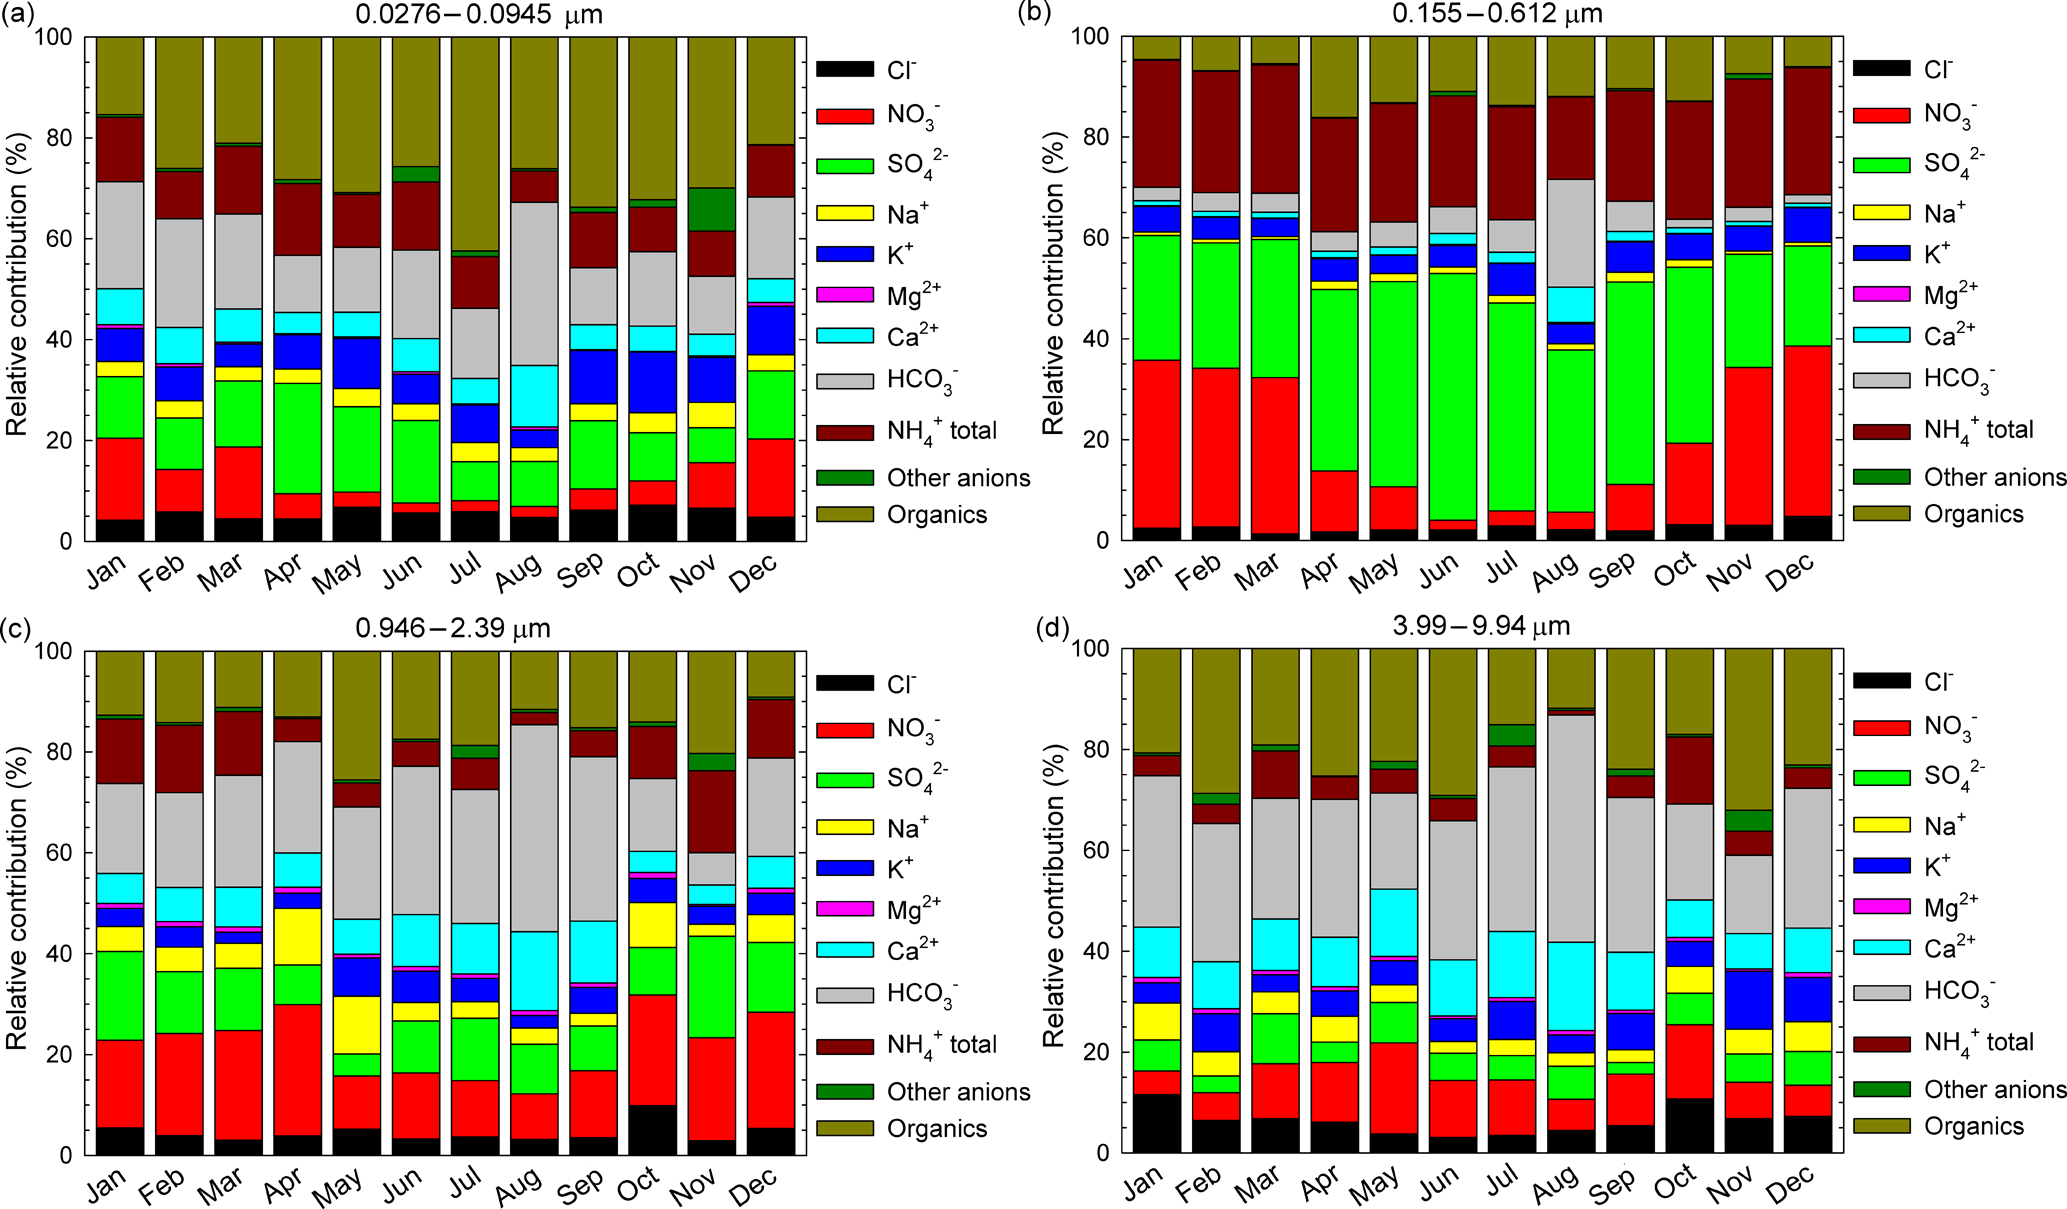
Figure 8The relative contributions, as monthly averages, of identified and quantified water-soluble ions to total detected components in the 0.0276–0.0945 µm (a), 0.155–0.612 µm (b), 0.946–2.39 µm (c), and 3.99–9.94 µm (d) size range grouped fractions.
The salt NH4Cl is known to be 2–3 times more volatile than NH4NO3, as HCl is more volatile than HNO3. Moreover, at RH < 75–85 %, particulate NH4Cl is in equilibrium with the gaseous compounds (Ianniello et al., 2011, and references therein). Coherently, during the cold season particulate NH(total) showed a statistically significant correlation with particulate Cl− (Pearson coefficient of 0.73, p < 0.001), but during the warm season the correlation was very poor. Finally, only during the cold season were significant correlations between fine-particulate Cl− and SO (Pearson coefficient of 0.59, p < 0.001) and between fine-particulate Cl− and RH (Pearson coefficient of 0.71, p = 0.010) observed. Usually, high concentrations of fine-particulate Cl− and SO were found at high levels of RH (35–83 %). Under these circumstances, the amount of gaseous precursors is believed to have relatively little influence on the formation of fine-particulate Cl−. If formed, NH4Cl is most probably generated from HCl and NH3 through heterogeneous reactions on neutralized sulfate particles. However, in the present work, estimation of free Cl− suggests that no Cl− was available to be bound with other chemical species (i.e. NH apart from alkali or alkaline earth metals, thereby excluding a significant occurrence of NH4Cl (especially over the warm season).
3.3 Relative ionic contribution in size-resolved aerosol particles from Iasi and potential influence of long-range transport phenomena on particle size distribution
Figure 8a, b, c, d present, as monthly averages, the relative contributions of identified and quantified water-soluble ions to total detected components in fractions grouped in four stages, i.e. 0.0276–0.0945 µm size range (Fig. 8a), 0.155–0.612 µm size range (Fig. 8b), 0.946–2.39 µm size range (Fig. 8c), and 3.99–9.94 µm size range (Fig. 8d). From details presented in Fig. 8a, for the 0.0276–0.0945 µm fraction there is an important contribution of formate, acetate, and oxalate that may actually indicate a possible important role of organic acids in secondary organic aerosol formation. Higher values of these components over the warm season may suggest an enhancement in the role of biogenic emission sources. Important contributions come from SO, NH(total), K+, and even (unexpectedly high) HCO. However, high particulate HCO is also evident for the 0.946–2.39 µm (Fig. 8c) and 3.99–9.94 µm size range (Fig. 8d) fractions. The 0.155–0.612 µm fraction (Fig. 8b) seems to be mainly constituted by SO, NO, and NH(total), with very small contributions from other ions.
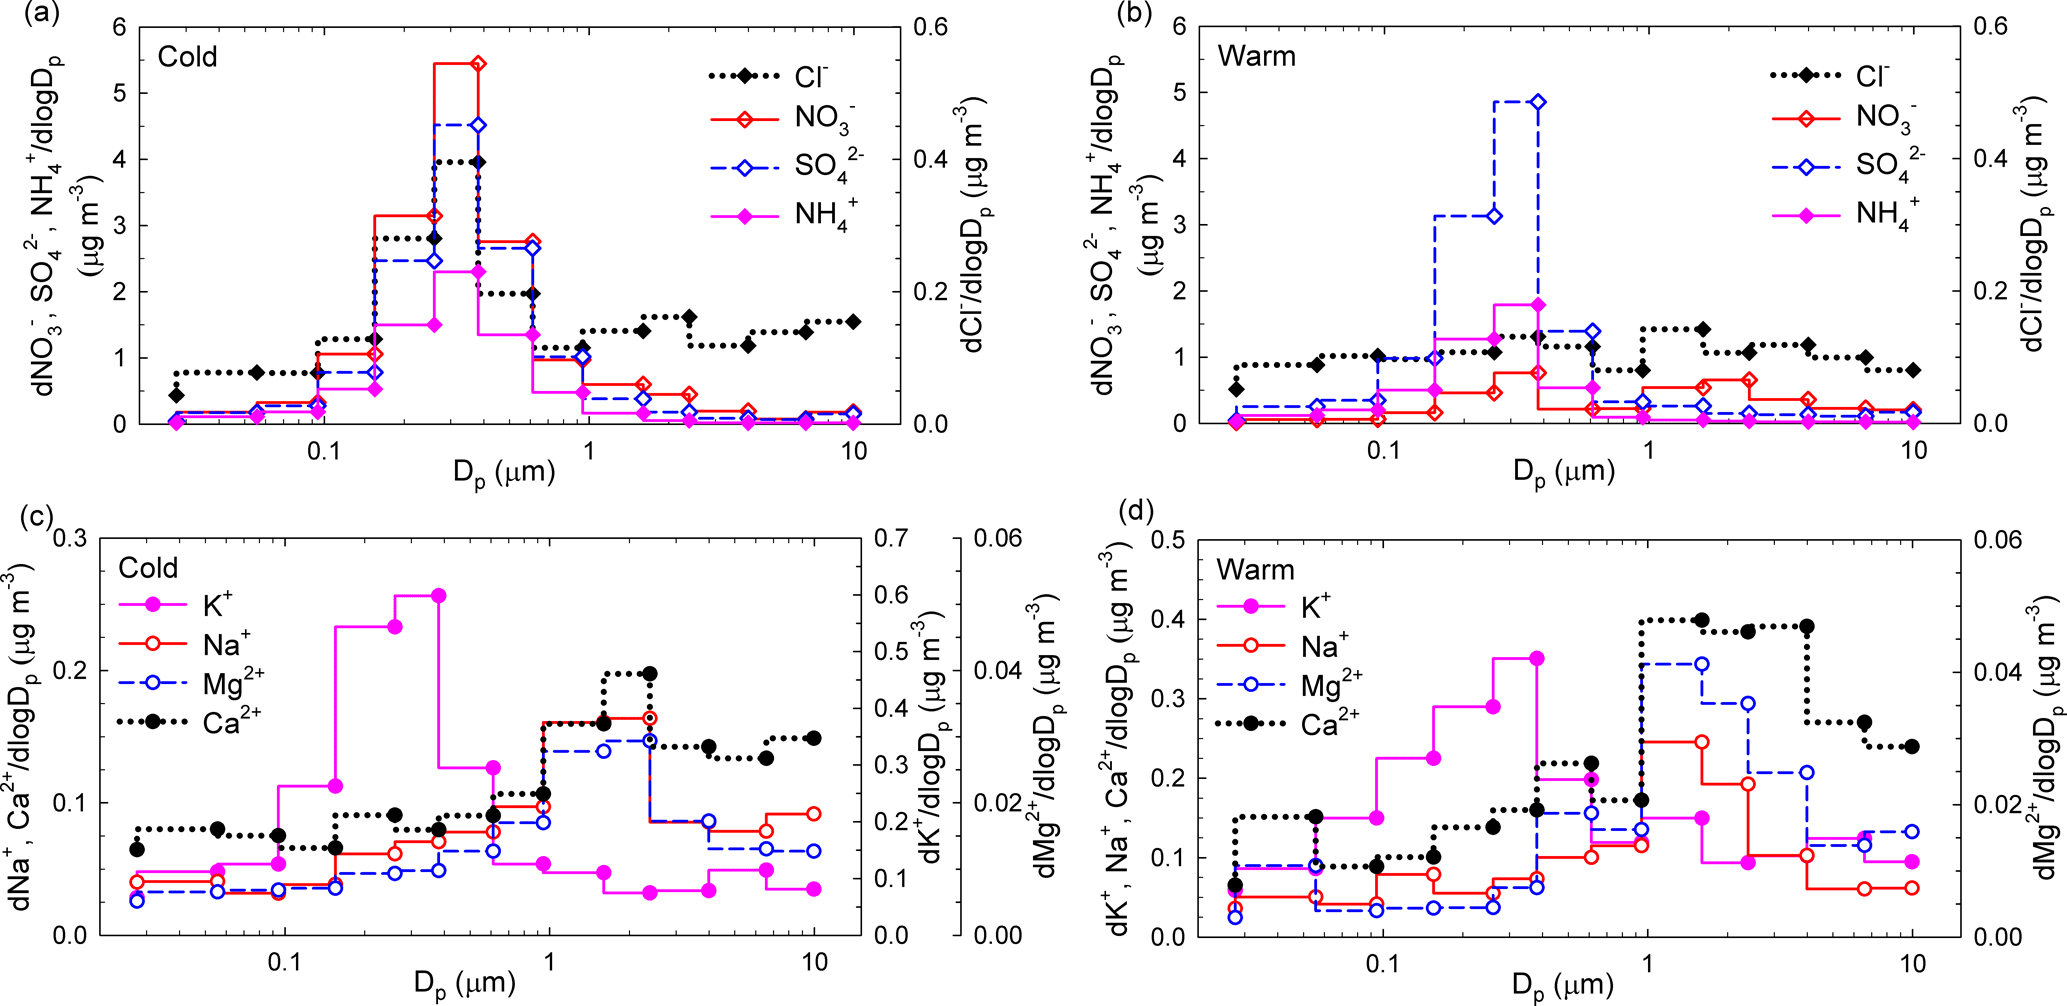
Figure 9Size distributions of seasonal averaged mass concentrations for Cl−, NO, SO, and NH (a, b) and K+, Na+, Mg2+, and Ca2+ (c, d) ions in atmospheric aerosols from Iasi, during both the cold season and the warm season, respectively.
The seasonal variation observed mainly for SO and NO might suggest an enhancement of photo-oxidative processes over the warm season. The 0.946–2.39 µm (Fig. 8c) and 3.99–9.94 µm size range (Fig. 8d) fractions have a non-homogeneous chemical composition dominated mainly by HCO, NO, and organics. Among all the analysed ions in the investigated period, in the PM10 fraction SO was the most abundant with (26.0 ± 4.3) %, followed by NO (26.0 ± 10.7 %), NH(total) (15.0 ± 3.4 %), organics including acetate, formate, and oxalate (12.2 ± 3.7 %), and HCO (10 ± 7.7 %). Similarly, in the PM2.5 fraction SO was again the most abundant (28.9 ± 5.6 %) followed by NO (19.6 ± 12.1 %), NH(total) (16.6 ± 3.2 %), organics including acetate, formate, and oxalate (11.4 ± 4.0 %), and HCO (8.0 ± 6.8 %). In both the PM10 and PM2.5 fractions, the largest contribution of SO was observed in June 2016 with, respectively, (34.6 ± 10.9 %) and (40.8 ± 11.0 %). During the cold season, particulate SO and NO contributions were, respectively, (23.6 ± 2.3 %) and (28.6 ± 4.9 %) for PM10 and (25.5 ± 2.9 %) and (30.1 ± 5.8 %) for PM2.5. During the warm season, the SO and NO contributions, were, respectively, (28.5 ± 4.7 %) and (10.1 ± 4.8 %) for PM10 and (32.4 ± 5.6 %) and (9.2 ± 5.4 %) for PM2.5. Wonaschutz et al. (2015) report NO contributions of 31.3 % during winter and 6.9 % during summer for Vienna (Austria).
Particulate Ca2+ and HCO, as dust tracer ions, contributed significantly, especially over the warm season (43.8 ± 11.2 % in PM10 and 37.8 ± 12.3 % in PM2.5 in August 2016), suggesting that Ca2+ and HCO mostly originate from soil dust resuspension during the dry season. In 2016, spring was the season with predominant air masses undertaking long-range transport from the S-SE sector (see Fig. 1), thereby suggesting the presence of sea spray aerosols from the Black Sea or other marine areas. The highest contributions from sea spray aerosol tracers (i.e. Na+ and Mg2+; Masiol et al., 2012) were actually recorded in April (5.8 % for Na+ and 0.7 % for Mg2+). Although the most abundant ions are SO, NO, and NH(total), organics (including acetate, formate, and oxalate) might also bring significant contributions ((17.3 ± 4.4) % in PM10 and 18.2 ± 5.1 % in PM2.5 in July 2016, much higher than that reported by Arsene et al., 2011, for Iasi). The difference might reflect either an inversion of the photochemistry taking place at the investigated location, or differences in the sampling efficiency between the two studies.
Figure 9a, b, c, d show the size distributions of seasonal averaged mass concentrations for Cl−, NO, SO, and NH (Fig. 9a, b) and K+, Na+, Mg2+, and Ca2+ (Fig. 9c, d). While during the cold season NO, SO, NH, and K+ reside mainly in the fine mode with maxima at ∼ 381 nm, all the other ions (i.e. Cl−, Na+, Mg2+, Ca2+) have major contributions in the super-micron mode (maxima between 1.6 and 2.39 µm). Over the cold season, clear evidence was obtained of the occurrence of chloride in a bimodal distribution. During the warm season only SO and K+ presented clear maxima at 381 nm, while all the other identified or quantified species had more important contributions in the super-micron mode. For SO, a larger modal diameter in the cold season compared to the warm season is most likely due to hygroscopic growth under high RH and/or to increased secondary aerosol production (lower temperatures facilitate condensation). Secondary aerosol mass from aqueous-phase reactions may also play a role (Wonaschutz et al., 2015). The maxima observed in the coarse mode could also be explained considering that heterogeneous chemistry on dust particles might act as a source for some particulate species (Wang et al., 2012).
While particulate NO over the cold season presented monomodal distributions in the sub-micron size range (maxima at 381 nm), over the warm season a second mode was observed with maxima in the 1.60–2.39 µm size range. Such a size distribution suggests that NO during the warm season is produced by adsorption of HNO3 on sea salt and soil particles (Park et al., 2004). According to Karydis et al. (2016), particulate NO is not only associated with NH in the fine mode. Light metal ions such as Ca2+, Mg2+, Na+, and K+, which mainly occur in the coarse mode, can be associated with NO and affect its partitioning into the aerosol phase. Dust effects on the distribution of particulate species might include a decrease in fine-mode NH and a shift of particulate NO from the fine to the coarse mode (Wang et al., 2012). In addition, the presence of significant levels of NO, Cl−, Mg2+, Ca2+, and Na+ in the coarse fraction might suggest that NO possibly originates upon reaction of HNO3 with MgCO3, CaCO3, or NaCl. Similar patterns were identified in Vienna, Austria (Wonaschutz et al., 2015), and in Prague, Czech Republic (Schwarz et al., 2012). Significant amounts of particulate NO formed upon reaction of HNO3 with CaCO3 on soil-derived particles have also been observed and reported (Yao et al., 2003; Sharma et al., 2007). Moreover, sea salt aerosols may also undergo chemical transformation of NaCl into NaNO3 during transport (Schwarz et al., 2012).
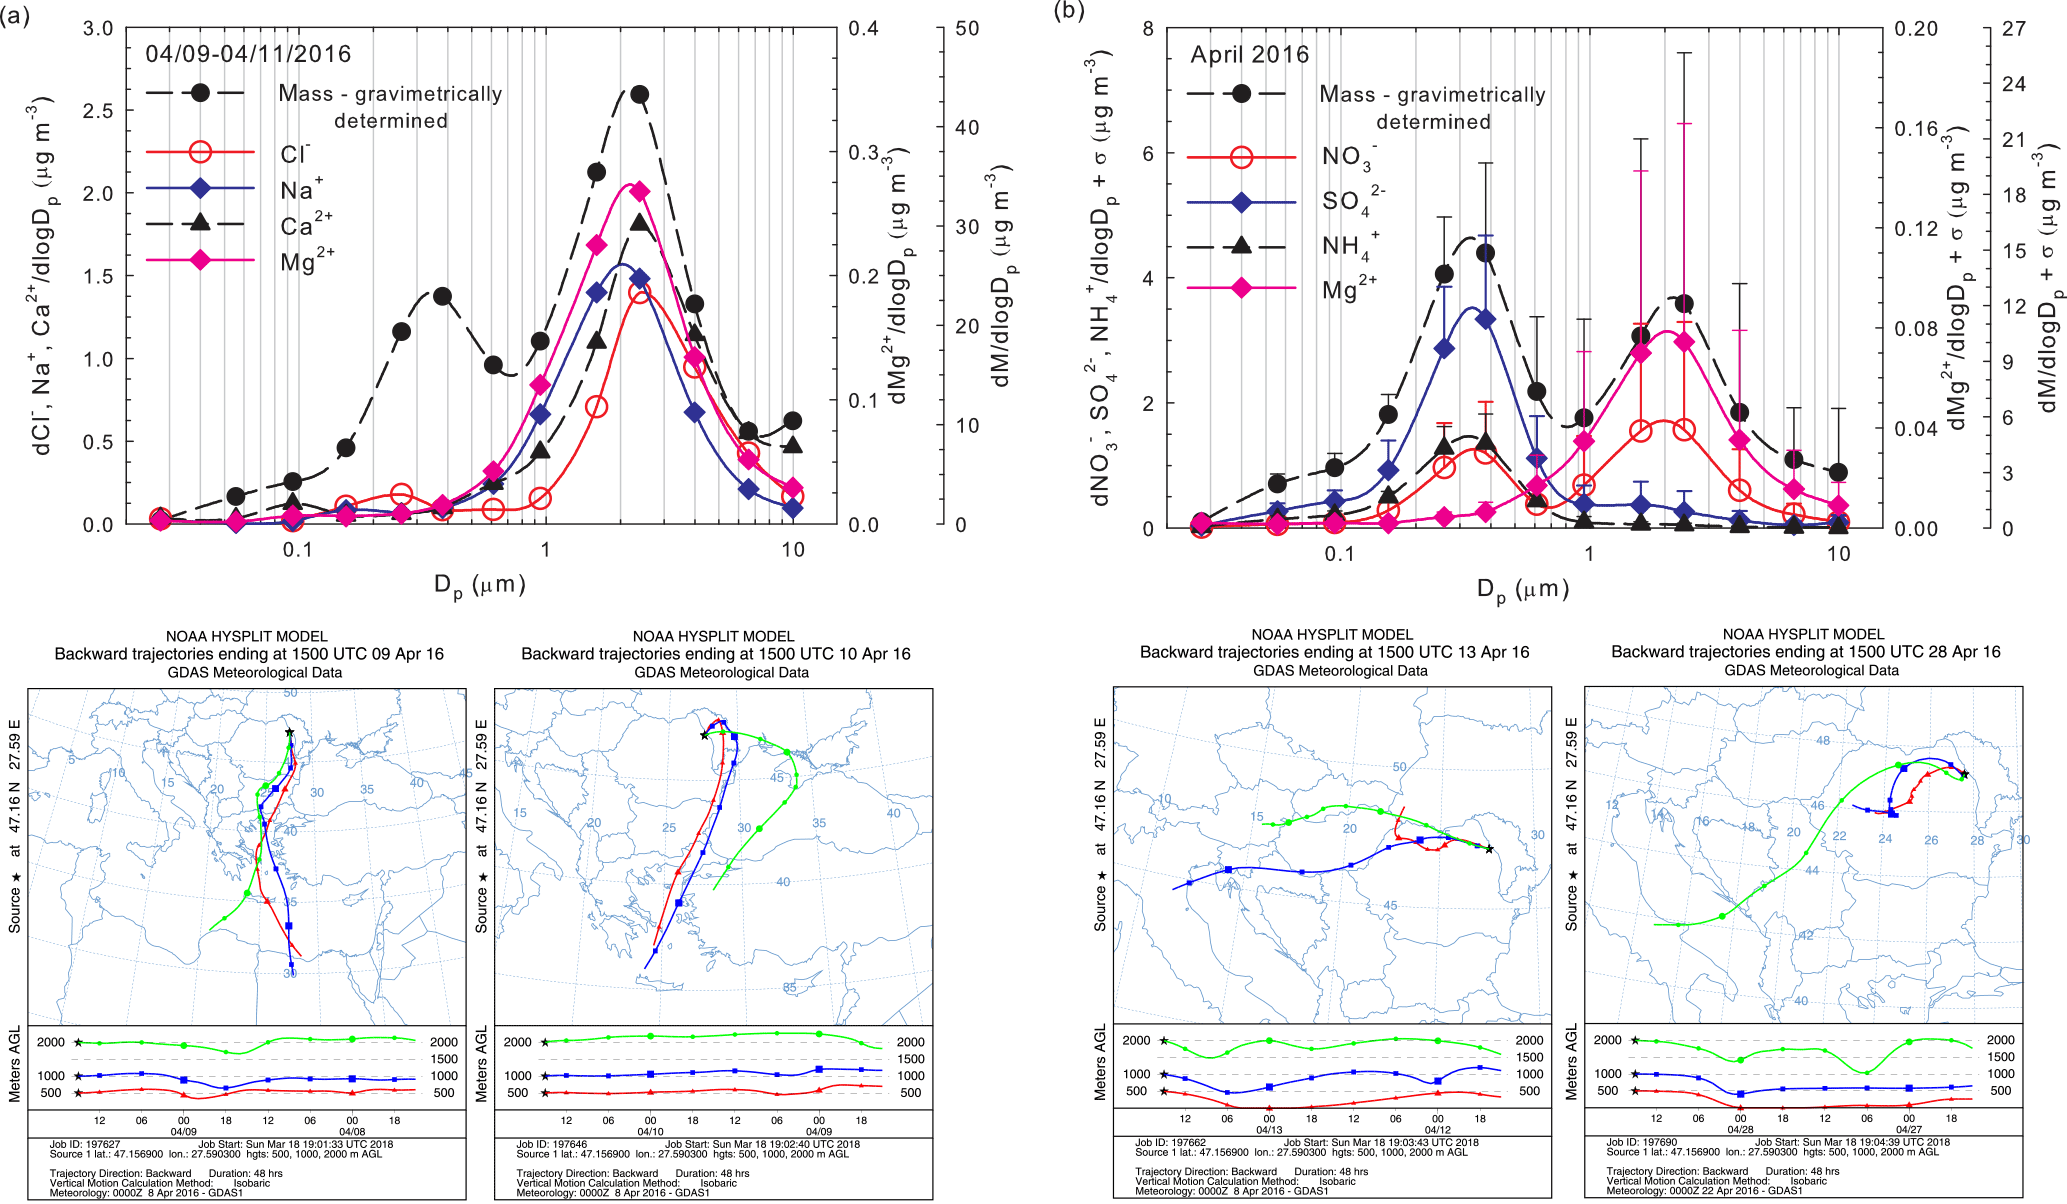
Figure 10Evidence of long-range transport contributions from Saharan dust within the size distribution of particulate Na+, Ca2+, Mg2+, Cl− ions, and aerosol mass (a) and of air mass buoyancy phenomena within the size distribution of particulate NH, NO, SO, Mg2+ ions, and aerosol mass (b).
The size distributions of particulate K+ reflect the occurrence of one dominant fine mode (with maxima at 381 nm) during both the cold and the warm seasons and of a second, less important mode during the warm season (with maxima in the 0.946–1.6 µm range). Such behaviour most likely reflects contributions from biomass burning over the entire year (Schmidl et al., 2008; Pachon et al., 2013). For both Ca2+ and Mg2+ ions, clear monomodal mass distributions with maxima in the 1.6 to 2.39 µm size range were observed over the investigated period. Over the warm season, Ca2+ accounts for (7.0 ± 2.9) % of the PM10 fraction and for (5.5 ± 2.9) % of the PM2.5 fraction, while over the cold season it accounts for only (3.0 ± 0.6) % of the PM10 and (2.2 ± 0.5) % of the PM2.5 fraction. These observations indicate that the impact from soil dust resuspension could be more important during the warm (dry) season. Mineral dust may also explain the higher coarse fraction of Mg2+ (mineral source being MgCO3).
Clear evidence was obtained in this work that air mass origin highly influences the aerosol chemical composition at the investigated site. Annual averaged sector contributions, in terms of PM long-range transport, are shown in Fig. S2 while the seasonal contributions of PM and particulate inorganic and organic ions associated with different air mass origins are reported as radar charts in Fig. S3 (within Sect. S10). Figure S4 (within Sect. S10) highlights the percentage distributions for the identified and quantified ions and the gaseous concentrations of NH3, HNO3, and HCl for selected investigated events, predicted by ISORROPIA-II. Wonaschutz et al. (2015) suggested that in Vienna, Austria, air mass origin is the most important factor for bulk PM concentrations, chemical composition of the coarse fraction (> 1.5 µm), and mass size distribution, while it is less important for the chemical composition of the fine fraction (< 1.5 µm). Although Iasi is located far from the Mediterranean or Black Sea, over the warm season the sea salt chloride contribution to the aerosol budget in the area is not entirely excluded (Arsene et al., 2011). Moreover, dust particles originating from the Sahara are acknowledged as travelling across the tropical Atlantic Ocean (10–90 µg m−3) and across the Mediterranean, affecting air quality in southern Europe (10–60 µg m−3) (Karydis et al., 2016). In the present work, particulate Na+ and Cl− ions as tracers of sea salt aerosols (Tositti et al., 2014) were mainly observed in conditions predominated by contributions from air masses arriving in Iasi from the S-SE direction. However, one of the most interesting collected events was that of 9–11 April 2016. For this event, the PM10 fraction mass concentration was as high as 43.9 µg m−3, a value which is about 2 times higher than the average of the total events. These conditions were highly influenced by air masses originating from both the Saharan desert and the Mediterranean Sea. As shown in Fig. 10a, the size distributions of particulate Na+, Ca2+, Mg2+, Cl− ions, and their mass concentrations present a highly dominating mode with maxima at 2.39 µm. For this event, the (Ca2+, Mg2+) and (Na+, Cl−) pairs showed statistically significant correlations (respectively, r = 0.94, p < 0.001 and r = 0.85, p < 0.001), suggesting common contributions from mineral Saharan dust (Ca2+, Mg2+) and from sea salt marine aerosols (Na+, Cl−). Moreover, Fig. 10a clearly shows that Na+, Ca2+, Mg2+, and Cl− make a very significant contribution to the total aerosol mass in the super-micron mode, with the maxima at 2.39 µm.
In April 2016, an interesting behaviour was also observed for the averaged mass size distributions of particulate NH, NO, SO, and Mg2+ (Fig. 10b). This month is highly affected by the atmospheric air mass buoyancy phenomenon, as shown by trajectory analysis for selected events and, while particulate NH and SO mainly resided in the fine mode with clear maxima at 381 nm, NO and Mg2+ also presented a predominant mode in the 1.6–2.39 µm fraction. Such distributions, corroborated with meteorological conditions, would actually suggest a possible heterogeneous formation route for SO (Wang et al., 2012). In contrast, the adsorption of HNO3 on mineral dust and sea salt particles (Karydis et al., 2016) would become more important for NO.
The atmospheric concentrations of particulate species including acetate, formate, fluoride, chloride, nitrite, nitrate, phosphate, sulfate, oxalate, sodium, potassium, ammonium, magnesium, and calcium were measured over 2016 at an urban site in Iasi, north-eastern Romania. The measurements were carried out using a cascade Dekati low-pressure impactor (DLPI), performing aerosol size classification in 13 specific fractions evenly distributed over the 0.0276–9.94 µm size range.
The entire data set was analysed to investigate the seasonal variations in fine-particulate species and the meteorological effects and to examine the contributions of local and regional sources. ISORROPIA-II thermodynamic model runs were used to estimate the pH values of the collected atmospheric particles, as on the present database it was the best method to analyse particle acidity.
Within the aerosol mass concentration, the identified ions' mass brings contributions as high as 40.6 % with the rest being unaccounted for yet. Fine-particulate Cl−, NO, NH, and K+ exhibited clear seasonal variations with minima during the warm season, mainly due to cold season enhancement in the emission sources, changes in the mixing layer depth, and specific meteorological conditions (e.g. higher RH values prevailing in Iasi during the cold season). Fine-particulate SO did not show much variation with respect to seasons. The measured concentrations of NH and NO in fine-mode (PM2.5) aerosols were in reasonably good agreement with modelled values for the cold season but not for the warm season. This observation reflects the susceptibility of NH4NO3 aerosols to be lost due to volatility.
Clear evidences were obtained that NH in PM2.5 was primarily associated with SO and NO. However, indirect ISORROPIA-II estimations showed that the atmosphere of Iasi might be ammonia rich during both cold and warm seasons, so that enough NH3 would be present to neutralize the H2SO4, HNO3, and HCl acidic components and to generate fine-particulate ammonium salts in the form of (NH4)2SO4, NH4NO3, and NH4Cl. Significant amounts of fine-particulate NO were in fact detected during the cold season. The presence of possibly large amounts of NH3, the domination of (NH4)2SO4 over NH4NO3 and NH4Cl, and the high RH conditions in the cold season (likely leading to dissolution of a significant fraction of atmospheric HNO3 and NH3) are among the most important driving forces enhancing the fine-particulate NO and NH distribution at the investigated site.
Most probably, gaseous NH3 is not only a precursor of NH formation, but it also affects the occurrence of NO and eventually Cl− in PM2.5 via neutralization processes. The chemical composition database concerning PM2.5 (and PM10), combined with predictions from ISORROPIA-II run in the forward mode, allow us to suggest that NH3 was most probably present at a sufficiently high concentration to promote fine-particle acidity neutralization during both the cold and the warm seasons. Although it is known that running ISORROPIA-II in the forward mode with only aerosol concentrations as input may result in a bias in the predicted pH due to the repartitioning of ammonia in the model, this approach was the only one that allowed for a reasonable interpretation of the obtained results.
Over the warm season, ∼ 35 % of the total analysed samples presented pH values in the very strong acidity fraction (0–3 pH units range), while over the cold season the fraction of samples in this pH range was ∼ 43 %. However, while during the warm season ∼ 24–25 % of the acidic samples were in the 1–2 pH range (reflecting mainly contributions from very strong inorganic acids), over the cold season an ∼ 40 % fraction in the 1–3 pH range would reflect possible contributions from other acidic type species (i.e. organics). The observed changes in aerosol acidity could potentially impact the gas–particle partitioning of semi-volatile organic acids.
Data are available upon request to the contact author Cecilia Arsene (carsene@uaic.ro).
The supplement related to this article is available online at: https://doi.org/10.5194/acp-18-5879-2018-supplement.
The authors declare that they have no conflict of interest.
The authors acknowledge the financial support provided by UEFISCDI within the
PN-III-P4-ID-PCE-2016-0299 (AI-FORECAST), PN-II-PCE-2011-3-0471
(EVOLUTION-AIR), and PN-II-RU-TE-2014-4-2461 (SOS-AROMATIC) projects. The European
Union's Horizon 2020 research and innovation programme, through the
EUROCHAMP-2020 Infrastructure Activity Grant (grant agreement no. 730997) and
Chemical On-Line cOmpoSition and Source Apportionment of fine aerosoLs
COLOSSAL grant (CA16109), is gratefully acknowledged. The authors also acknowledge
the NOAA Air Resources Laboratory (ARL) for the provision of the HYSPLIT
transport and dispersion model and/or READY website
(http://www.ready.noaa.gov) used in
this publication.
Edited by: Leiming
Zhang
Reviewed by: two anonymous referees
Adams, P. J., Seinfeld, J. H., and Koch, D. M.: Global concentration of tropospheric sulfate, nitrate and ammonium aerosol simulated in a general circulation model, J. Geophys. Res., 104, 13791–13823, https://doi.org/10.1029/1999JD900083, 1999.
Akagi, S. K., Yokelson, R. J., Wiedinmyer, C., Alvarado, M. J., Reid, J. S., Karl, T., Crounse, J. D., and Wennberg, P. O.: Emission factors for open and domestic biomass burning for use in atmospheric models, Atmos. Chem. Phys., 11, 4039–4072, https://doi.org/10.5194/acp-11-4039-2011, 2011.
Aksoyoglu, S., Ciarelli, G., El-Haddad, I., Baltensperger, U., and Prévôt, A. S. H.: Secondary inorganic aerosols in Europe: sources and the significant influence of biogenic VOC emissions, especially on ammonium nitrate, Atmos. Chem. Phys., 17, 7757–7773, https://doi.org/10.5194/acp-17-7757-2017, 2017.
Alastuey, A., Querol, X., Rodríguez, S., Plana, F., Lopez-Soler, A., Ruiz, C., and Mantilla, E.: Monitoring of atmospheric particulate matter around sources of inorganic secondary inorganic aerosol, Atmos. Environ., 38, 4979–4992, https://doi.org/10.1016/j.atmosenv.2004.06.026, 2004.
Alastuey, A., Querol, X., Aas, W., Lucarelli, F., Pérez, N., Moreno, T., Cavalli, F., Areskoug, H., Balan, V., Catrambone, M., Ceburnis, D., Cerro, J. C., Conil, S., Gevorgyan, L., Hueglin, C., Imre, K., Jaffrezo, J.-L., Leeson, S. R., Mihalopoulos, N., Mitosinkova, M., O'Dowd, C. D., Pey, J., Putaud, J.-P., Riffault, V., Ripoll, A., Sciare, J., Sellegri, K., Spindler, G., and Yttri, K. E.: Geochemistry of PM10 over Europe during the EMEP intensive measurement periods in summer 2012 and winter 2013, Atmos. Chem. Phys., 16, 6107–6129, https://doi.org/10.5194/acp-16-6107-2016, 2016.
Aneja, V. P., Chauhan, J. P., and Walker, J. T.: Characterization of atmospheric ammonia emissions from swine waste storage and treatment lagoons, J. Geophys. Res., 105, 11535–11545, https://doi.org/10.1029/2000JD900066, 2000.
Arsene, C., Olariu, R. I., and Mihalopoulos, N.: Chemical composition of rainwater in the north-eastern Romania, Iasi region (2003–2006), Atmos. Environ., 41, 9452–9467, https://doi.org/10.1016/j.atmosenv.2007.08.046, 2007.
Arsene, C., Olariu, R. I., Zarmpas, P., Kanakidou, M., and Mihalopoulos, N.: Ion composition of coarse and fine particles in Iasi, north-eastern Romania. Implications for aerosols chemistry in the area, Atmos. Environ., 45, 906–916, https://doi.org/10.1029/2000JD900066, 2011.
Athanasopoulou, E., Tombrou, M., Pandis, S. N., and Russell, A. G.: The role of sea-salt emissions and heterogeneous chemistry in the air quality of polluted coastal areas, Atmos. Chem. Phys., 8, 5755–5769, https://doi.org/10.5194/acp-8-5755-2008, 2008.
Bacarella, A. L., Grunwald, E., Marshall, H. P., and Purlee, E. L.: The potentiometric measurement of acid dissociation constants and pH in the system methanol-water. pKa values for carboxylic acids and anilinium ions, J. Org. Chem., 20, 747–762, https://doi.org/10.1021/jo01124a007, 1955.
Backes, A. M., Aulinger, A., Bieser, J., Matthias, V., and Quante, M.: Ammonia emissions in Europe, part II: How ammonia emission abatement strategies affect secondary aerosols, Atmos. Environ., 126, 153–161, https://doi.org/10.1016/j.atmosenv.2015.11.039, 2016.
Bardouki, H., Liakakou, H., Economou, C., Sciare, J., Smolik, J., Zdimal, V., Eleftheriadis, K., Lazaridis, M., Dye, C., and Mihalopoulos, N.: Chemical composition of size-resolved atmospheric aerosols in the eastern Mediterranean during summer and winter, Atmos. Environ., 37, 195–208, https://doi.org/10.1016/S1352-2310(02)00859-2, 2003.
Behera, S. N. and Sharma, M.: Transformation of atmospheric ammonia and acid gases into components of PM2.5: an environmental chamber study, Environ. Sci. Pollut. R., 19, 1187–1197, https://doi.org/10.4209/aaqr.2012.11.0328, 2012.
Behera, S. N., Betha, R., and Balasubramanian, R.: Insights into chemical coupling among acidic gases, ammonia and secondary inorganic aerosols, Aerosol Air Qual. Res., 13, 1282–1296, https://doi.org/10.1007/s11356-011-0635-9, 2013.
Bressi, M., Sciare, J., Ghersi, V., Bonnaire, N., Nicolas, J. B., Petit, J.-E., Moukhtar, S., Rosso, A., Mihalopoulos, N., and Féron, A.: A one-year comprehensive chemical characterisation of fine aerosol (PM2.5) at urban, suburban and rural background sites in the region of Paris (France), Atmos. Chem. Phys., 13, 7825–7844, https://doi.org/10.5194/acp-13-7825-2013, 2013.
Brook, R. D.: Cardiovascular effects of air pollution, Clin. Sci., 115, 175–187, https://doi.org/10.1042/CS20070444, 2008.
Christian, T. J., Yokelson, R. J., Cárdenas, B., Molina, L. T., Engling, G., and Hsu, S.-C.: Trace gas and particle emissions from domestic and industrial biofuel use and garbage burning in central Mexico, Atmos. Chem. Phys., 10, 565–584, https://doi.org/10.5194/acp-10-565-2010, 2010.
Clegg, S. L., Brimblecombe, P., and Wexler, A. S.: Thermodynamic model of the system H+–NH– SO–NO–H2O at tropospheric temperatures, J. Phys. Chem. A, 102, 2137–2154, https://doi.org/10.1021/jp973042r, 1998.
Cziczo, D. J., Nowak, J. B., Hu, J. H., and Abbatt, J. P. D.: Infrared spectroscopy of model tropospheric aerosols as a function of relative humidity: observation of deliquescence and crystallization, J. Geophys. Res., 102, 18843–18850, https://doi.org/10.1029/97JD01361, 1997.
Directive 2008/50/EC: European Parliament and of the Council of 21 May 2008 on ambient air quality and cleaner air for Europe, Official Journal L 152, 11/06/2008, 0001–0044, 2008.
Dockery, D. W., Cunningham, J., Damokosh, A. I., Neas, L. M., Spengler, J. D., Koutrakis, P., Ware, J. H., Raizenne, M., and Speizer, F. E.: Health effects of acid aerosols on North American children: respiratory symptoms, Environ. Health Persp., 104, 500–505, 1996.
Dominici, F., Peng, D. K., Bell, M. L., Pham, L., McDermott, A., Zeger, S. L., and Samet, J. M.: Fine particulate air pollution and hospital admission for cardiovascular and respiratory diseases, JAMA, 295, 1127–1134, https://doi.org/10.1001/jama.295.10.1127, 2006.
Dougle P. G., Veefkind J. P., and ten Brink, H. M.: Cristallisation of mixtures of ammonium nitrate, ammonium sulfate and soot, J. Aerosol Sci., 29, 375–386, https://doi.org/10.1016/S0021-8502(97)10003-9, 1998.
European Environment Agency (EEA) Report: Air quality in Europe-2015 report, ISSN 1977–8449, Report No. 5, 2015.
Fang, T., Guo, H., Zeng, L., Verma, V., Nenes, A., and Weber, R. J.: Highly acidic ambient particles, soluble metals, and oxidative potential: A link between sulfate and aerosol toxicity, Environ. Sci. Technol., 51, 2611–2620, https://doi.org/10.1021/acs.est.6b06151, 2017.
Fountoukis, C. and Nenes, A.: ISORROPIA II: a computationally efficient thermodynamic equilibrium model for K+–Ca2+–Mg2+–NH–Na+–SO–NO–Cl−, and H2O aerosols, Atmos. Chem. Phys., 7, 4639–4659, https://doi.org/10.5194/acp-7-4639-2007, 2007.
Fountoukis, C., Nenes, A., Sullivan, A., Weber, R., Van Reken, T., Fischer, M., Matías, E., Moya, M., Farmer, D., and Cohen, R. C.: Thermodynamic characterization of Mexico City aerosol during MILAGRO 2006, Atmos. Chem. Phys., 9, 2141–2156, https://doi.org/10.5194/acp-9-2141-2009, 2009.
Freney, E. J., Sellegri, K., Canonaco, F., Colomb, A., Borbon, A., Michoud, V., Doussin, J.-F., Crumeyrolle, S., Amarouche, N., Pichon, J.-M., Bourianne, T., Gomes, L., Prevot, A. S. H., Beekmann, M., and Schwarzenböeck, A.: Characterizing the impact of urban emissions on regional aerosol particles: airborne measurements during the MEGAPOLI experiment, Atmos. Chem. Phys., 14, 1397–1412, https://doi.org/10.5194/acp-14-1397-2014, 2014.
Gerasopoulos, E., Koulouri, E., Kalivitis, N., Kouvarakis, G., Saarikoski, S., Mäkelä, T., Hillamo, R., and Mihalopoulos, N.: Size-segregated mass distributions of aerosols over Eastern Mediterranean: seasonal variability and comparison with AERONET columnar size-distributions, Atmos. Chem. Phys., 7, 2551–2561, https://doi.org/10.5194/acp-7-2551-2007, 2007.
Guo, H., Xu, L., Bougiatioti, A., Cerully, K. M., Capps, S. L., Hite Jr., J. R., Carlton, A. G., Lee, S.-H., Bergin, M. H., Ng, N. L., Nenes, A., and Weber, R. J.: Fine-particle water and pH in the southeastern United States, Atmos. Chem. Phys., 15, 5211–5228, https://doi.org/10.5194/acp-15-5211-2015, 2015.
Guo, H., Sullivan, A. P., Campuzano-Jost, P., Schroder, J. C., Lopez-Hilfiker, F. D., Dibb, J. E., Jimenez, J. L., Thornton, J. A., Brown, S. S., Nenes, A., and Weber, R. J.: Fine particle pH and the partitioning of nitric acid during winter in the northeastern United States, J. Geophys. Res.-Atmos., 121, 10355–10376, https://doi.org/10.1002/2016JD025311, 2016.
Gwynn, R. C., Burnett, R. T., and Thurston, G. D.: A time-series analysis of acidic particulate matter and daily mortality and morbidity in the Buffalo, New York, region, Environ. Health Persp., 108, 125–133, 2000.
Harrison, R. M. and Kitto, A. M. N.: Estimation of the rate constant for the reaction of acid sulfate aerosol with NH3 gas from atmospheric measurements, J. Atmos. Chem., 15, 133–143, https://doi.org/10.1007/BF00053755, 1992.
Hasheminassab, S., Daher, N., Saffari, A., Wang, D., Ostro, B. D., and Sioutas, C.: Spatial and temporal variability of sources of ambient fine particulate matter (PM2.5) in California, Atmos. Chem. Phys., 14, 12085–12097, https://doi.org/10.5194/acp-14-12085-2014, 2014.
Hennigan, C. J., Izumi, J., Sullivan, A. P., Weber, R. J., and Nenes, A.: A critical evaluation of proxy methods used to estimate the acidity of atmospheric particles, Atmos. Chem. Phys., 15, 2775–2790, https://doi.org/10.5194/acp-15-2775-2015, 2015.
Hitzenberger, R., Ctyroky, P., Berner, A., Tursic, J., Podkrajsek, B., and Grgic, I.: Size distribution of black (BC) and total carbon (TC) in Vienna and Ljubljana, Chemosphere, 65, 2106–2113, https://doi.org/10.1016/j.chemosphere.2006.06.042, 2006.
Holton, J. R.: An Introduction to Dynamic Meteorology, 4th Edn., Academic Press, New York, 1979.
Huang, X.-F., He, L.-Y., Hu, M., Canagaratna, M. R., Sun, Y., Zhang, Q., Zhu, T., Xue, L., Zeng, L.-W., Liu, X.-G., Zhang, Y.-H., Jayne, J. T., Ng, N. L., and Worsnop, D. R.: Highly time-resolved chemical characterization of atmospheric submicron particles during 2008 Beijing Olympic Games using an Aerodyne High-Resolution Aerosol Mass Spectrometer, Atmos. Chem. Phys., 10, 8933–8945, https://doi.org/10.5194/acp-10-8933-2010, 2010.
Ianniello, A., Spataro, F., Esposito, G., Allegrini, I., Rantica, E., Ancora, M. P., Hu, M., and Zhu, T.: Occurrence of gas phase ammonia in the area of Beijing (China), Atmos. Chem. Phys., 10, 9487–9503, https://doi.org/10.5194/acp-10-9487-2010, 2010.
Ianniello, A., Spataro, F., Esposito, G., Allegrini, I., Hu, M., and Zhu, T.: Chemical characteristics of inorganic ammonium salts in PM2.5 in the atmosphere of Beijing (China), Atmos. Chem. Phys., 11, 10803–10822, https://doi.org/10.5194/acp-11-10803-2011, 2011.
Ichim, L., Vlaicu, M., Draxineanu, A., and Alexandru, C.: Populatia Romaniei pe localitati la 1 Ianuarie 2016, in INS 2016, edited by: Iagar, E. M., Pisica, S., and Baltateanu, L., ISSN: 2066-2181, Institutul National de Statistica, Romania, 130 pp., 2016.
IPCC, 2013: Summary for Policymakers, in: Climate Change 2013: The Physical Science Basis. Contribution of Working Group I to the Fifth Assessment Report of the Intergovernmental Panel on Climate Change, edited by: Stocker, T. F., Qin, D., Plattner, G. K., Tignor, M., Allen, S. K., Boschung, J., Nauels, A., Xia, Y., Bex, V., and Midgley, P. M., Cambridge University Press, Cambridge, United Kingdom and New York, NY, USA, 1–30, https://doi.org/10.1017/CBO9781107415324.004, 2013.
ISORROPIA: http://isorropia.eas.gatech.edu/, last access: 11 July 2017.
James, P. M.: An objective classification method for Hess and Brezowsky Grosswetterlagen over Europe, Theor. Appl. Climatol., 88, 17–42, https://doi.org/10.1007/s00704-006-0239-3, 2007.
Jang, M., Czoschke, N. M., Lee, S., and Kamens, R. M.: Heterogeneous atmospheric aerosol production by acid-catalyzed particle-phase reactions, Science, 298, 814–817, https://doi.org/10.1126/science.1075798, 2002.
Kadowaki, S.: On the nature of the atmospheric oxidation processes of SO2 to sulfate and of NO2 to nitrate on the basis of diurnal variations of sulfate, nitrate, and other pollutants in an urban area, Environ. Sci. Technol., 20, 1249–1253, https://doi.org/10.1021/es00154a009, 1986.
Kai, Z., Yuesi, W., Tianxue, W., Yousef, M., and Frank, M.: Properties of nitrate, sulfate and ammonium in typical polluted atmospheric aerosols (PM10) in Beijing, Atmos. Res., 84, 67–77, https://doi.org/10.1016/j.atmosres.2006.05.004, 2007.
Karydis, V. A., Tsimpidi, A. P., Lei, W., Molina, L. T., and Pandis, S. N.: Formation of semivolatile inorganic aerosols in the Mexico City Metropolitan Area during the MILAGRO campaign, Atmos. Chem. Phys., 11, 13305–13323, https://doi.org/10.5194/acp-11-13305-2011, 2011.
Karydis, V. A., Tsimpidi, A. P., Pozzer, A., Astitha, M., and Lelieveld, J.: Effects of mineral dust on global atmospheric nitrate concentrations, Atmos. Chem. Phys., 16, 1491–1509, https://doi.org/10.5194/acp-16-1491-2016, 2016.
Keene, W. C., Pszenny, A. A. P., Maben, J. R., Stevenson, E., and Wall, A.: Closure evaluation of size-resolved aerosol pH in the New England coastal atmosphere during summer, J. Geophys. Res., 109, D23307, https://doi.org/10.1029/2004JD004801, 2004.
Kocak, M., Mihalopoulos, N., and Kubilay, N.: Contributions of natural sources to high PM10 and PM2.5 events in the eastern Mediterranean, Atmos. Environ., 41, 3806–3818, https://doi.org/10.1016/j.atmosenv.2007.01.009, 2007.
Laongsri, B. and Harrison, R. M.: Atmospheric behaviour of particulate oxalate at UK urban background and rural sites, Atmos. Environ., 71, 319–326, https://doi.org/10.1016/j.atmosenv.2013.02.015, 2013.
Lelieveld, J., Evans, J. S., Fnais, M., Giannadaki, D., and Pozzer, A.: The contribution of outdoor air pollution sources to premature mortality on a global scale, Nature, 525, 367–371, https://doi.org/10.1038/nature15371, 2015.
Li, T. C., Yuan, C. S., Lo, K. C., Hung, C. H., Wu, S. P., and Tong, C.: Seasonal variation and chemical characteristics of atmospheric particles at Three Islands in the Taiwan Street, Aerosol Air Qual. Res., 15, 2277–2290, https://doi.org/10.4209/aaqr.2015.03.0153, 2015.
Li, W., Shi, Z., Zhang, D., Zhang, X., Li, P., Feng, Q., Yuan, Q., and Wang, W.: Haze particles over a coal-burning region in the China Loess Plateau in winter: three flight missions in December 2010, J. Geophys. Res., 117, D12306, https://doi.org/10.1029/2012JD017720, 2012.
Markovic, M. Z., Hayden, K. L., Murphy, J. G., Makar, P. A., Ellis, R. A., Chang, R. Y.-W., Slowik, J. G., Mihele, C., and Brook, J.: The effect of meteorological and chemical factors on the agreement between observations and predictions of fine aerosol composition in southwestern Ontario during BAQS-Met, Atmos. Chem. Phys., 11, 3195–3210, https://doi.org/10.5194/acp-11-3195-2011, 2011.
Masiol, M., Squizzato, S., Ceccato, D., Rampazzo, G., and Pavoni, B.: Determining the influence of different atmospheric circulation patterns on PM10 chemical composition in a source apportionment study, Atmos. Environ., 63, 117–124, https://doi.org/10.1016/j.atmosenv.2012.09.025, 2012.
Matsumoto, K. and Tanaka, H.: Formation and dissociation of atmospheric particulate nitrate and chloride: an approach based on phase equilibrium, Atmos. Environ., 30, 639–648, https://doi.org/10.1016/1352-2310(95)00290-1, 1996.
Meng, Z. Y., Seinfeld, J. H., Saxena, P., and Kim, Y. P.: Atmospheric gas – aerosol equilibrium IV. Thermodynamics of carbonates, Aerosol Sci. Tech., 23, 131–154, https://doi.org/10.1080/02786829508965300, 1995.
Meng, Z. Y., Lin, W. L., Jiang, X. M., Yan, P., Wang, Y., Zhang, Y. M., Jia, X. F., and Yu, X. L.: Characteristics of atmospheric ammonia over Beijing, China, Atmos. Chem. Phys., 11, 6139–6151, https://doi.org/10.5194/acp-11-6139-2011, 2011.
Meskhidze, N., Chameides, W. L., Nenes, A., and Chen, G.: Iron mobilization in mineral dust: Can anthropogenic SO2 emissions affect ocean productivity?, Geophys. Res. Lett., 30, 2085, https://doi.org/10.1029/2003GL018035, 2003.
Metzger, S., Mihalopoulos, N., and Lelieveld, J.: Importance of mineral cations and organics in gas-aerosol partitioning of reactive nitrogen compounds: case study based on MINOS results, Atmos. Chem. Phys., 6, 2549–2567, https://doi.org/10.5194/acp-6-2549-2006, 2006.
Nenes, A., Pilinis, C., and Pandis, S. N.: Continued development and testing of a new thermodynamic aerosol module for urban and regional air quality models, Atmos. Environ., 33, 1553–1560, https://doi.org/10.1016/S1352-2310(98)00352-5, 1999.
Nowak, J. B., Huey, L. G., Russell, A. G., Tian, D., Neuman, J. A., Orsini, D., Sjostedt, S. J., Sullivan, A. P., Tanner, D. J., Weber, R. J., Nenes, A., Edgerton, E., and Fehsenfeld, F. C.: Analysis of urban gas phase ammonia measurements from the 2002 Atlanta Aerosol Nucleation and Real-Time Characterization Experiment (ANARChE), J. Geophys. Res., 111, D17308, https://doi.org/10.1029/2006JD007113, 2006.
Olariu, R. I., Vione, D., Grinberg, N., and Arsene C.: Applications of liquid chromatographic techniques in the chemical characterization of atmospheric aerosols, J. Liq. Chromatogr. R. T., 38, 322–348, https://doi.org/10.1080/10826076.2014.941256, 2015.
Ostro, B., Malig, B., Broadwin, R., Basu, R., Gold, E. B., Bromberger, J. T., Derby, C., Feinstein, S., Greendale, G. A., Jackson, E. A., Kravitz, H. M., Matthews, K. A., Sternfeld, B., Tomey, K., Green, R. R., and Green, R.: Chronic PM2.5 exposure and inflammation: determining sensitive subgroups in mid-life women, Environ. Res., 132, 168–175, https://doi.org/10.1016/j.envres.2014.03.042, 2014.
Pachon, J. E., Weber, R. J., Zhang, X., Mulholland, J. A., and Russell, A. G.: Revising the use of potassium (K) in the source apportionment of PM2.5, Atmos. Pollut. Res., 4, 14–21, https://doi.org/10.5094/APR.2013.002, 2013.
Pandolfi, M., Amato, F., Reche, C., Alastuey, A., Otjes, R. P., Blom, M. J., and Querol, X.: Summer ammonia measurements in a densely populated Mediterranean city, Atmos. Chem. Phys., 12, 7557–7575, https://doi.org/10.5194/acp-12-7557-2012, 2012.
Park, R. J., Jacob, D. J., Field, B. D., Yantosca, R. M., and Chin, M.: Natural and transboundary pollution influences on sulfate-nitrate-ammonium aerosols in the United States: implications for policy, J. Geophys. Res., 109, D15204, https://doi.org/10.1029/2003JD004473, 2004.
Pathak, R. K., Wu, W. S., and Wang, T.: Summertime PM2.5 ionic species in four major cities of China: nitrate formation in an ammonia-deficient atmosphere, Atmos. Chem. Phys., 9, 1711–1722, https://doi.org/10.5194/acp-9-1711-2009, 2009.
Pathak, R. K., Wang, T., and Wu, W. S.: Nighttime enhancement of PM2.5 nitrate in ammonia-poor atmospheric conditions in Beijing and Shanghai: Plausible contributions of heterogeneous hydrolysis of N2O5 and HNO3 partitioning, Atmos. Environ., 45, 1183–1191, https://doi.org/10.1016/j.atmosenv.2010.09.003, 2011.
Pope, C. A., Burnett, R. T., Thurston, G. D., Thun, M. J., Calle, E. E., Krewski, D., and Godleski, J. J.: Cardiovascular mortality and long-term exposure to particulate air pollution: epidemiological evidence of general pathophysiological pathways of disease, Circulation, 109, 71–77, https://doi.org/10.1161/01.CIR.0000108927.80044.7F, 2004.
Prinn, R. G.: The cleansing capacity of atmosphere, Annu. Rev. Env. Resour., 28, https://doi.org/10.1146/annurev.energy.28.011503.163425, 2003.
Querol, X., Alastuey, A., Ruiz, C. R., Artinano, B., Hansson, H. C., Harrison, R. M., Buringh, E., ten Brink, H. M., Lutz, M., Bruckmann, P., Straehl, P., and Schneider, J.: Speciation and origin of PM10 and PM2.5 in selected European cities, Atmos. Environ., 38, 6547–6555, https://doi.org/10.1016/j.atmosenv.2004.08.037, 2004.
Ramanathan, V., Crutzen, P. J., Kiehl, J. T., and Rosenfeld, D., Aerosols, climate, and the hydrological cycle, Science, 294, 2119–2124, https://doi.org/10.1126/science.1064034, 2001.
Ravishankara, A. R.: Heterogeneous and multiphase chemistry in the troposphere, Science, 276, 1058–1065, https://doi.org/10.1126/science.276.5315.1058, 1997.
Rolph, G., Stein, A., and Stunder, B.: Real-time Environmental Applications and Display sYstem: READY, Environ. Modell. Softw., 95, 210–228, https://doi.org/10.1016/j.envsoft.2017.06.025, 2017.
Sandrini, S., van Pinxteren, D., Giulianelli, L., Herrmann, H., Poulain, L., Facchini, M. C., Gilardoni, S., Rinaldi, M., Paglione, M., Turpin, B. J., Pollini, F., Bucci, S., Zanca, N., and Decesari, S.: Size-resolved aerosol composition at an urban and a rural site in the Po Valley in summertime: implications for secondary aerosol formation, Atmos. Chem. Phys., 16, 10879–10897, https://doi.org/10.5194/acp-16-10879-2016, 2016.
Schmidl, C., Marr, I. L., Caseiro, A., Kotianova, P., Berner, A., Bauer, H., Kasper-Giebla A., and Puxbaum, H.: Chemical characterisation of fine particle emissions from wood stove combustion of common woods growing in mid-European Alpine regions, Atmos. Environ., 42, 126–141, https://doi.org/10.1016/j.atmosenv.2007.09.028, 2008.
Schwarz, J., Chi, X., Maenhaut, W., Civis, M., Hovorka, J., and Smolik, J.: Elemental and organic carbon in atmospheric aerosols at downtown and suburban sites in Prague, Atmos. Res., 90, 287–302, https://doi.org/10.1016/j.atmosres.2008.05.006, 2008.
Schwarz, J., Stefancova, L., Maenhaut, W., Smolik, J., and Zdimal, V.: Mass and chemically speciated size distribution of Prague aerosol using an aerosol dryer – The influence of air mass origin, Sci Total. Environ., 437, 348–362, https://doi.org/10.1016/j.scitotenv.2012.07.050, 2012.
Seinfeld, J. H. and Pandis, S. N.: Atmospheric Chemistry and Physics: From Air Pollution to Climate Change, Wiley, New York, 1998.
Sharma, M., Kishore, S., Tripathi, S. N., and Behera, S. N.: Role of atmospheric ammonia in the secondary particulate matter: a study at Kanpur, India, J. Atmos. Chem., 58, 1–17, https://doi.org/10.1007/s10874-007-9074-x, 2007.
Shon, Z., Ghosh, S., Kim, K., Song, S., Jung, K., and Kim, N.: Analysis of water-soluble ions and their precursor gases over diurnal cycle, Atmos. Res., 132–133, 309–321, https://doi.org/10.1016/j.atmosres.2013.06.003, 2013.
Sicard, P., Lesne, O., Alexandre, N., Mangin, A., and Collomp, R.: Air quality trends and potential health effects e development of an aggregate risk index, Atmos. Environ., 45, 1145–1153, https://doi.org/10.1016/j.atmosenv.2010.12.052, 2011.
Stein, A. F., Draxler, R. R., Rolph, G. D., Stunder, B. J. B., Cohen, M. D., and Ngan, F.: NOAA's HYSPLIT atmospheric transport and dispersion modeling system, B. Am. Meteorol. Soc., 96, 2059–2077, https://doi.org/10.1175/BAMS-D-14-00110.1, 2015.
Stelson, A. W. and Seinfeld, J. H.: Relative humidity and pH dependence of the vapour pressure of ammonium nitrate-nitric acid solutions at 25 ∘C, Atmos. Environ., 16, 993–1000, https://doi.org/10.1016/0004-6981(82)90185-8, 1982.
Stockwell, W. R. and Calvert, J. G.: The mechanism of the HO-SO2 reaction, Atmos. Environ., 17, 2231–2235, https://doi.org/10.1016/0004-6981(83)90220-2, 1983.
Stockwell, W. R., Watson, J. G., Robinson, N. F., Steiner, W., and Sylte, W.: The ammonium nitrate particle equivalent of NOx emissions for wintertime conditions in Central California's San Joaquin Valley, Atmos. Environ., 34, 4711–4717, https://doi.org/10.1016/S1352-2310(00)00148-5, 2000.
Sun, J., Zhang, Q., Canagaratna, M. R., Zhang, Y., Ng, N. L., Sun, Y., Jayne, J. T., Zhang, X., Zhang, X., and Worsnop, D. R.: Highly time- and size-resolved characterization of submicron aerosol particles in Beijing using an Aerodyne Aerosol Mass Spectrometer, Atmos. Environ., 44, 131–140, https://doi.org/10.1016/j.atmosenv.2009.03.020, 2010.
Sutton, M. A., Howard, C. M., Erisman, J. W., Billen, G., Bleeker, A., Grennfelt, P., van Grinsven, H., and Grizzetti, B.: The European Nitrogen Assessment: Sources, Effects and Policy Perspectives, Cambridge University Press, 2011.
Tolis, E. I., Saraga, D. E., Lytra, M. K., Papathanasiou, A. C., Bougaidis, P. N., Prekas-Patronakis, O. E., Ioannidis, I. I., and Bartzis, J. G.: Concentration and chemical composition of PM2.5 for a one-year period at Thessaloniki, Greece: a comparison between city and port area, Atmos. Environ., 113, 197–207, https://doi.org/10.1016/j.atmosenv.2015.05.014, 2015.
Tositti, L., Brattich, E., Masiol, M., Baldacci, D., Ceccato, D., Parmeggiani, S., Stracquadanio, M., and Zappoli, S.: Source apportionment of particulate matter in a large city of southeastern Po Valley (Bologna, Italy), Environ. Sci. Pollut. R., 21, 872–890, https://doi.org/10.1007/s11356-013-1911-7, 2014.
Trebs, I., Metzger, S., Meixner, F. X., Helas, G., Hoffer, A., Andreae, M. O., Moura, M. A. L., da Silva Jr., R. S., Rudich, Y., Falkovich, A. H., Artaxo, P., and Slanina, J.: The NH–NO–Cl−–SO–H2O aerosol system and its gas phase precursors at a pasture site in the Amazon Basin: How relevant are mineral cations and soluble organic acids?, J. Geophys. Res., 110, D07303, https://doi.org/10.1029/2004JD005478, 2005.
Tsai, Y. I. and Cheng, M. T.: Visibility and aerosol chemical compositions near the coastal area in Central Taiwan, Sci. Total Environ., 231, 37–51, https://doi.org/10.1016/S0048-9697(99)00093-5, 1999.
Tursic, J., Podkrajsek, B., Grgic, I., Ctyroky, P., Berner, A., Dusek, U., and Hitzenberger, R.: Chemical composition and hygroscopic properties of size-segregated aerosol particles collected at the Adriatic coast of Slovenia, Chemosphere, 63, 1193–1202, https://doi.org/10.1016/j.chemosphere.2005.08.040, 2006.
Utsunomiya, A. and Wakamatsu, S.: Temperature and humidity dependence on aerosol composition in the northern Kyushu, Japan, Atmos. Environ., 30, 2379–2386, https://doi.org/10.1016/1352-2310(95)00350-9, 1996.
Vione, D., Maurino, V., Minero, C., and Pelizzetti, E.: The atmospheric chemistry of hydrogen peroxide: A Review, Ann. Chim. (Rome), 93, 477–488, 2003.
Voutsa, D., Samara, C., Manoli, E., Lazarou, D., and Tzoumaka, P.: Ionic composition of PM2.5 at urban sites of northern Greece: secondary inorganic aerosol formation, Environ. Sci. Pollut. R., 21, 4995–5006, https://doi.org/10.1007/s11356-013-2445-8, 2014.
Wang, H. L., Qiao, L. P., Lou, S. R., Zhou, M., Ding, A. J., Huang, H. Y., Chen, J. M., Wang, Q., Tao, S. K., Chen, C. H., Li, L., and Huang, C.: Chemical composition of PM2.5 and meteorological impact among three years in urban Shanghai, China, J. Clean. Prod., 112, 1302–1311, https://doi.org/10.1016/j.jclepro.2015.04.099, 2016.
Wang, K., Zhang, Y., Nenes, A., and Fountoukis, C.: Implementation of dust emission and chemistry into the Community Multiscale Air Quality modeling system and initial application to an Asian dust storm episode, Atmos. Chem. Phys., 12, 10209–10237, https://doi.org/10.5194/acp-12-10209-2012, 2012.
Wang, Y., Zhuang, G., Tang, A., Yuan, H., Sun, Y., Chen, Sh., and Zheng, A.: The ion chemistry and the source of PM2.5 aerosol in Beijing, Atmos. Environ., 39, 3771–3784, https://doi.org/10.1016/j.atmosenv.2005.03.013, 2005.
Wang, Y., Zhuang, G., Zhang, X., Huang, K., Xu, C., Tang, A., Chen, J., and Zheng, A.: The ion chemistry, seasonal cycle, and sources of PM2.5 and TSP aerosol in Shanghai, Atmos. Environ., 40, 2935–2952, https://doi.org/10.1016/j.atmosenv.2005.12.051, 2006.
Wexler, A. S. and Clegg, S. L.: Atmospheric aerosol models for systems including the ions H+, NH, Na+, SO, NO, Cl−, Br−, and H2O, J. Geophys. Res., 107, 4207, https://doi.org/10.1029/2001JD000451, 2002.
WHO: Health Risks of Particulate Matter from Long-range Transbounday Air Pollution, E88189. European Centre for Environment and Health, WHO Regional Office for Europe, Denmark, 2006a.
WHO: WHO Air quality guidelines for particulate matter, ozone, nitrogen dioxide and sulphur dioxide, Global update 2005, Summary of risk assessment, WHO/SDE/PHE/ OEH/06.02, Geneva, Switzerland, 2006b.
Wonaschutz, A., Demattio, A., Wagner, R., Burkart, J., Zikova, N., Vodicka, P., Ludwig, W., Steiner, G., Schwarz, J., and Hitzenberger, R.: Seasonality of new particle formation in Vienna, Austria – Influence of air mass origin and aerosol chemical composition, Atmos. Environ., 118, 118–126, https://doi.org/10.1016/j.atmosenv.2015.07.035, 2015.
Yao, X. H., Lau, A. P. S., Fang, M., Chan, C. K., and Hu, M.: Size distributions and formation of ionic species in atmospheric particulate pollutants in Beijing, China: 1 – inorganic ions, Atmos. Environ., 37, 2991–3000, https://doi.org/10.1016/S1352-2310(03)00255-3, 2003.
Zhang, L. M., Gong, S. L., Padro, J., and Barrie, L.: A size segregated particle dry deposition scheme for an atmospheric aerosol module, Atmos. Environ., 35, 549–560, https://doi.org/10.1016/S1352-2310(00)00326-5, 2001.
Zhang, R., Wang, G., Guo, S., Zamora, M. L., Ying, Q., Lin, Y., Wang, W., Hu, M., and Wang, Y.: Formation of urban fine particulate matter, Chem. Rev., 115, 3803–3855, https://doi.org/10.1021/acs.chemrev.5b00067, 2015.
Zhao, M., Wang, S., Tan, J., Hua, Y., Wu, D., and Hao, J.: Variation of urban atmospheric ammonia pollution and its relation with PM2.5 chemical property in winter of Beijing, China, Aerosol Air Qual. Res., 16, 1378–1389, https://doi.org/10.4209/aaqr.2015.12.0699, 2016.