the Creative Commons Attribution 4.0 License.
the Creative Commons Attribution 4.0 License.
 | 26 Apr 2018
Organic aerosol in the summertime southeastern United States: components and their link to volatility distribution, oxidation state and hygroscopicity
Evangelia Kostenidou
Eleni Karnezi
James R. Hite Jr.
Aikaterini Bougiatioti
Kate Cerully
Nga L. Ng
Athanasios Nenes
Spyros N. Pandis
The volatility distribution of the organic aerosol (OA) and its sources during the Southern Oxidant and Aerosol Study (SOAS; Centreville, Alabama) was constrained using measurements from an Aerodyne high-resolution time-of-flight aerosol mass spectrometer (HR-ToF-AMS) and a thermodenuder (TD). Positive matrix factorization (PMF) analysis was applied on both the ambient and thermodenuded high-resolution mass spectra, leading to four factors: more oxidized oxygenated OA (MO-OOA), less oxidized oxygenated OA (LO-OOA), an isoprene epoxydiol (IEPOX)-related factor (isoprene-OA) and biomass burning OA (BBOA). BBOA had the highest mass fraction remaining (MFR) at 100 ∘C, followed by the isoprene-OA, and the LO-OOA. Surprisingly the MO-OOA evaporated the most in the TD. The estimated effective vaporization enthalpies assuming an evaporation coefficient equal to unity were 58 ± 13 kJ mol−1 for the LO-OOA, 89 ± 10 kJ mol−1 for the MO-OOA, 55 ± 11 kJ mol−1 for the BBOA, and 63 ± 15 kJ mol−1 for the isoprene-OA. The estimated volatility distribution of all factors covered a wide range including both semi-volatile and low-volatility components. BBOA had the lowest average volatility of all factors, even though it had the lowest O : C ratio among all factors. LO-OOA was the more volatile factor and its high MFR was due to its low enthalpy of vaporization according to the model. The isoprene-OA factor had intermediate volatility, quite higher than suggested by a few other studies. The analysis suggests that deducing the volatility of a factor only from its MFR could lead to erroneous conclusions. The oxygen content of the factors can be combined with their estimated volatility and hygroscopicity to provide a better view of their physical properties.
- Article
(6025 KB) - Full-text XML
-
Supplement
(5888 KB) - BibTeX
- EndNote


Population exposure to atmospheric particulate matter (PM) increases premature mortality from cardiovascular and respiratory diseases (Pope et al., 2002; IARC, 2016; Cohen et al., 2017). The same particles also modulate the planetary radiative balance and hydrological cycle (IPCC, 2013; NASEM, 2016; Seinfeld et al., 2016). Organic aerosol (OA) constitutes a significant part of submicron aerosol mass (Zhang et al., 2007) and it is characterized by daunting chemical complexity (Kanakidou et al., 2005; Hallquist et al., 2009). OA is directly emitted from anthropogenic and natural sources, but it is also produced by condensation of products formed during the oxidation of gas-phase organic compounds with O3, NO3 and OH radicals (secondary organic aerosol, SOA; Kanakidou et al., 2005). OA formation can be further promoted by the interactions of anthropogenic and biogenic compounds; in the southeastern United States, anthropogenic sulfate enhances OA formation through rapid reactive uptake of isoprene epoxydiol (IEPOX) to particles and aqueous-phase reactions (Xu et al., 2015a, 2016a; Budisulistiorini et al., 2017).
Several approaches have been developed to unravel the sources and the degree of atmospheric processing of aerosol sampled by the AMS. These include custom principal component analysis (Zhang et al., 2005), multiple component analysis (Zhang et al., 2007), positive matrix factorization (PMF) (Paatero and Tapper, 1994; Lanz et al., 2007) and the multilinear engine (ME-2) (Lanz et al., 2008; Canonaco et al., 2013). Applying the above source apportionment techniques on AMS mass spectra, information about the aerosol sources and the degree of the atmospheric processing can be derived. Important primary components include hydrocarbon-like OA (HOA) (Zhang et al., 2005) and biomass burning OA (BBOA) (Aiken et al., 2009). The most abundant and ubiquitous OA component is the oxygenated OA (OOA), which often consists of a more oxygenated (MO-OOA) and a less oxygenated OA (LO-OOA) factor (Lanz et al., 2007). In the southeastern (SE) United States, MO-OOA and LO-OOA are dominant factors, comprising 47–79 % of the total OA (Xu et al., 2015b). Factors related to biogenic secondary OA have been identified in urban, suburban and remote areas (Budisulistiorini et al., 2013; Chen et al., 2015; Kostenidou et al., 2015). In the SE United States, an isoprene-derived OA factor (isoprene-OA) linked to IEPOX uptake is present during warm periods, contributing up to 36 % of the total OA in the summertime (Xu et al., 2015b).
Central to understanding the atmospheric impacts of OA is constraining its volatility and hygroscopicity (Kanakidou et al., 2005). Volatility measurements are mostly carried out using heated laminar flow reactors, known as thermodenuders (TDs) (Burtscher et al., 2001; An et al., 2007) or isothermal dilution (Grieshop et al., 2009). In these systems, changes in OA mass concentration are related to the OA evaporation rate and its volatility can be estimated. The comparison of aerosol evaporation measurements across studies and conditions with TD or isothermal dilution chambers is not straightforward. The established proxy for volatility is the mass fraction remaining (MFR), i.e., the mass of the aerosol remaining after a volatility measurement (Huffman et al., 2009; Cerully et al., 2015; Xu et al., 2016b). MFR has often been used as a relative measure of volatility, as it is assumed that the volatility of particulate matter increases as MFR decreases for similar particle sizes and TD operation conditions. Although clearly linked to volatility, the MFR depends on the enthalpy of vaporization (ΔHvap), the aerosol concentration, the heating section residence time, the particle size distribution, and potential particle-to-gas mass transfer resistances. All these parameters therefore complicate the linking of the measured MFR to the volatility. An additional complication is that organic aerosol mixtures are characterized by a distribution of volatilities. A number of studies have attempted to estimate this volatility distribution with appropriate TD models (Cappa and Jimenez, 2010; Lee et al., 2010; Paciga et al., 2016; Saha and Grieshop, 2016; Louvaris et al., 2017; Saha et al., 2017).
Three studies have reported volatility distributions of the isoprene (or IEPOX) SOA and the total OA for the southeastern United States. Lopez-Hilfiker et al. (2016) suggested that the IEPOX SOA had a very low saturation concentration with C∗ = 10−4 µg m−3, based on the Filter Inlet for Gases and AEROsols coupled to a Chemical-Ionization Mass Spectrometer (FIGAERO-CIMS) signals of C5H12O4 and C5H10O3. They assumed that these signals correspond to 2-methyltetrols and 3-MeTHF-3,4-diols and/or C5 alkene triols, which are tracers for isoprene SOA. Using the total FIGAERO-CIMS signal (CxHyOzN0−1) the same authors estimated an extremely low total OA average volatility of C∗ = 3.7 × 10⁻⁷ µg m−3 for the OA with extremely low-volatility organic compounds (ELVOCs) representing 99 % of the total OA. This is the lowest reported volatility for ambient OA in the literature. Hu et al. (2016) estimated an average volatility of × 10−5 µg m−3 for the IEPOX SOA. Their results were based on the MFR of the IEPOX SOA (calculated by PMF) using ambient and thermodenuded AMS measurements. The volatility distribution of IEPOX SOA was estimated applying the technique of Faulhaber et al. (2009). The corresponding total OA volatility distribution covered the range from to 1 µg m−3. Saha et al. (2017) used an aerosol chemical speciation monitor (ACSM) and a thermodenuder to estimate an average total OA volatility of C∗ = 0.21 µg m−3 and a vaporization enthalpy of 100 kJ mol−1.
The two-dimensional volatility basis set (2D-VBS) framework, describing the OA concentration as a function of its oxygen content and volatility, is a promising approach to describe the partitioning and chemical evolution of the thousands of compounds present in OA (Donahue et al., 2012). If expanded to include hygroscopicity, the framework can be strengthened considerably. Several studies have attempted to link hygroscopicity and volatility (Kuwata et al., 2007; Asa-Awuku et al., 2009; Frosch et al., 2013) or hygroscopicity and oxidation state (Masoli et al., 2010; Chang et al., 2010; Lathem et al., 2013; Thalman et al., 2017); however, only a few focus on all the properties combined (Jimenez et al., 2009; Tritscher et al., 2011; Cerully et al., 2015). Jimenez et al. (2009) combined data from various studies and suggested that hygroscopicity and oxidation state increase as volatility decreases. The generality of this finding has been questioned by subsequent studies (Meyer et al., 2009; Tritscher et al., 2011; Lathem et al., 2013). Recently, Nakao (2017) proposed a theoretical framework, in which the hygroscopicity is explicitly related to oxidation state and volatility. With this approach, each OA “source” can have a unique set of volatility and hygroscopicity parameters that evolve with atmospheric oxidative aging along a path that requires further constraints from chemistry.
Xu et al. (2015a) estimated the contribution of different sources to the measured OA, while Cerully et al. (2015) quantified the OA hygroscopicity during the Southern Oxidant and Aerosol Study (SOAS) field campaign at Centreville, Alabama. In this work we build upon these studies and attempt to constrain the volatility distributions and effective vaporization enthalpy of each PMF factor of OA sampled during the same field campaign. We then proceed to associate the hygroscopicity parameters estimated by Cerully et al. (2015) with the volatility distributions and test their consistency with the Nakao (2017) theoretical framework.
2.1 Measurement site and campaign
The measurements were performed in Centreville, Alabama, (32∘54′11.81 N, 87∘14′59 W). The station was located in an area significantly influenced by biogenic emissions (Liao et al., 2007; Spracklen et al., 2011). Anthropogenic emissions also affect the site. The measurements were conducted during the Southern Oxidant and Aerosol Study, which was part of the Southern Atmosphere Study (SAS; http://www.eol.ucar.edu/projects/sas) from 1 June to 15 July 2013. A summary of important findings can be found in Carlton et al. (2018), while additional results relevant to our study can be found in Xu et al. (2015a), Cerully et al. (2015), Guo et al. (2015) and Saha et al. (2017).
2.2 Instrumentation
The aim of the specific measurements was to characterize both the ambient and the water-soluble fraction of the non-thermally and thermally denuded PM1. For the vaporization a thermodenuder (Cerully et al., 2014) was used. A particle-into-liquid sampler (PILS) (Weber et al., 2001) was used to collect the water-soluble aerosol components and then the solution was nebulized. The aerosol passed every 12 or 15 min through four lines: ambient bypass, ambient TD, PILS bypass and PILS TD. In this work we used the ambient denuded measurements only. Details about the experimental setup can be found in Cerully et al. (2015).
The sampling instrumentation included an Aerodyne HR-AMS (DeCarlo et al., 2006), a scanning mobility particle sizer (SMPS, Classifier model 3080, DMA model 3081, CPC model 3022A, TSI) and a cloud condensation nuclei counter (Droplet Measurement Technologies) (Roberts and Nenes, 2005). The TD used in this campaign has been characterized by Cerully et al. (2014). Briefly, the TD consisted of a heating and a cooling section. The first part was a stainless steel tube of 30 in length and 0.68 in inner diameter. The cooling section was removed during this campaign, as the recondensation of the vapors is minimal when the ambient mass concentration is low, which was the case for this campaign (Cappa and Jimenez, 2010; Saleh et al., 2011; Cerully et al., 2014). The temperature in the TD was 60, 80 and 100 ∘C. The total flow rate passing though the TD was 1.5 L min−1 and so the average TD residence time was approximately 7 s.
3.1 PMF and elemental ratios
PMF (Lanz et al., 2007) was applied to both ambient bypass and TD HR organic mass spectra according to the procedure of Ulbrich et al. (2009). Details about the PMF solution are provided in the Supplement (Figs. S1 and S2). The O : C and H : C elemental ratios were estimated using the approach of Canagaratna et al. (2015). Xu et al. (2015a) also used the Canagaratna et al. (2015) O : C approach; however, Cerully et al. (2015) applied the older algorithm of Aiken et al. (2008). For any comparisons between this work and previous studies we converted the old O : C to the new O : C ratios using the corresponding f44 fraction according to the following equation: O : C = 0.079 + 4.31 f44 (Canagaratna et al., 2015).
3.2 Collection efficiency (CE)
Xu et al. (2015a) estimated the AMS CE using the composition-dependent approach of Middlebrook et al. (2012). The average bypass CE was estimated to be 0.65 ± 0.12, while the average TD CE was slightly higher at 0.7 ± 0.11. The difference was statistically significant with a p value less than 0.0001. These estimates can be more uncertain than their variability suggests, due to their sensitivity to aerosol ammonium and neutralization. The sensitivity of our results is discussed in Sect. 5.3.
3.3 TD losses
The thermodenuded OA was corrected for particle losses due to sedimentation, diffusion and thermophoresis inside the thermodenuder. More details about the thermodenuder characterization are provided by Cerully et al. (2014).
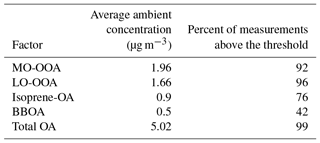
Table 1Average ambient concentration of each factor and total OA, and the corresponding fraction of the data above the threshold (0.2 µg m−3).
3.4 MFR
For the MFR calculations only data with ambient OA concentration higher than 0.2 µg m−3 were used in order to avoid extreme variations of the MFR. For such low concentrations the corresponding TD concentrations can be very low, introducing significant error in the MFR calculation. The fractions of the data for each factor above the threshold of 0.2 µg m−3 are given in Table 1. For the total OA, MO-OOA and LO-OOA, this fraction was above 92 % but for the isoprene-OA and BBOA was lower (76 and 42 % respectively). The four (or five) consecutive ambient and TD measurements during each hour were averaged. The variability of the four (or five) averaged values was 4–16 %.
3.5 Volatility distribution estimation
The dynamic mass transfer model of Riipinen et al. (2010) was used to estimate the OA volatility distributions. The model simulates the particle evaporation inside the thermodenuder solving the corresponding system of differential equations describing the mass transfer between the particle and gas phases:
where mp is the organic particle mass, Ci is the gas-phase concentration of compound i, Ntot is the total number concentration of the particles, n is the number of the assumed organic aerosol components, and Ii is the mass flux of the compound i given by the Vesala et al. (1997) equation:
where dp is the particle diameter, R the molar gas constant, and Mi and Di the molar mass and the diffusion coefficient of compound i at temperature TTD. The diffusion coefficient (Di) depends on the temperature and is calculated according to Chen and Othmer (1962) and βmi is the correction factor given by Fuchs and Sutugin (1970). p is the total gas pressure, while pi and are the partial vapor pressures of the compound i at the particle surface and far away from the particle respectively. is given by
where xi is the mole fraction of i, γi the activity coefficient of i in the particle, psat,i the pure component vapor pressure of i over a flat surface, Tp the particle temperature (we assume that Tp=TTD), xmi the mass fraction of i in the particle, ρ the particle density and σ the particle surface tension. is the effective saturation concentration of i at 298 K.
The change in the vapor pressure with temperature is calculated by the Clausius–Clapeyron equation:
where ΔHvap is the vaporization enthalpy of component i.
The model inputs include the loss-corrected MFR, the thermodenuder temperature and residence time, the bypass average particle size, the average ambient OA concentration and the aerosol density (assumed 1.4 g cm−3 for all cases). The output of the model is the OA volatility distribution in terms of effective saturation concentrations (C∗) at 298 K, in combination with its effective vaporization enthalpy (ΔHvap) and the mass accommodation (evaporation) coefficient (am). We fit the measured thermograms using a consecutive three-bin C∗ distribution, with varying mass fraction in each bin. The bins corresponded to saturation concentrations of 0.1, 1 and 10 µg m−3 at 298 K. The enthalpy of vaporization (ΔHvap) was also estimated, while the accommodation coefficient was assumed to be equal to unity. The best (optimum) solutions and the corresponding uncertainties are calculated using the algorithm of Karnezi et al. (2014). The Karnezi et al. (2014) approach searches the full parameter space for solutions that are consistent with the measured thermograms, within a predetermined error consistent with the experimental uncertainty. The algorithm usually finds a number of such solutions. It then calculates a weighted average (the closer a solution is to the data the higher its weight) and a weighted standard deviation using all these “acceptable” solutions. In this study for the comparison between volatilities we will also use the average volatility based on mass-fraction-weighted log10C∗.
3.6 Hygroscopicity
Using a CCN counter Cerully et al. (2015) estimated the hygroscopicity parameter κ of the total and water-soluble ambient and thermodenuded PM1 OA. The same authors performed linear regression of the ambient water-soluble κorg with the PMF factors of the ambient water-soluble OA. During the periods of the water solubility measurements the BBOA concentration was too low to allow the separation of the factor, so its hygroscopicity was not determined. The PMF results of the ambient total and the ambient water-soluble data were practically the same. Additional details about the hygroscopicity analysis can be found in Cerully et al. (2015).
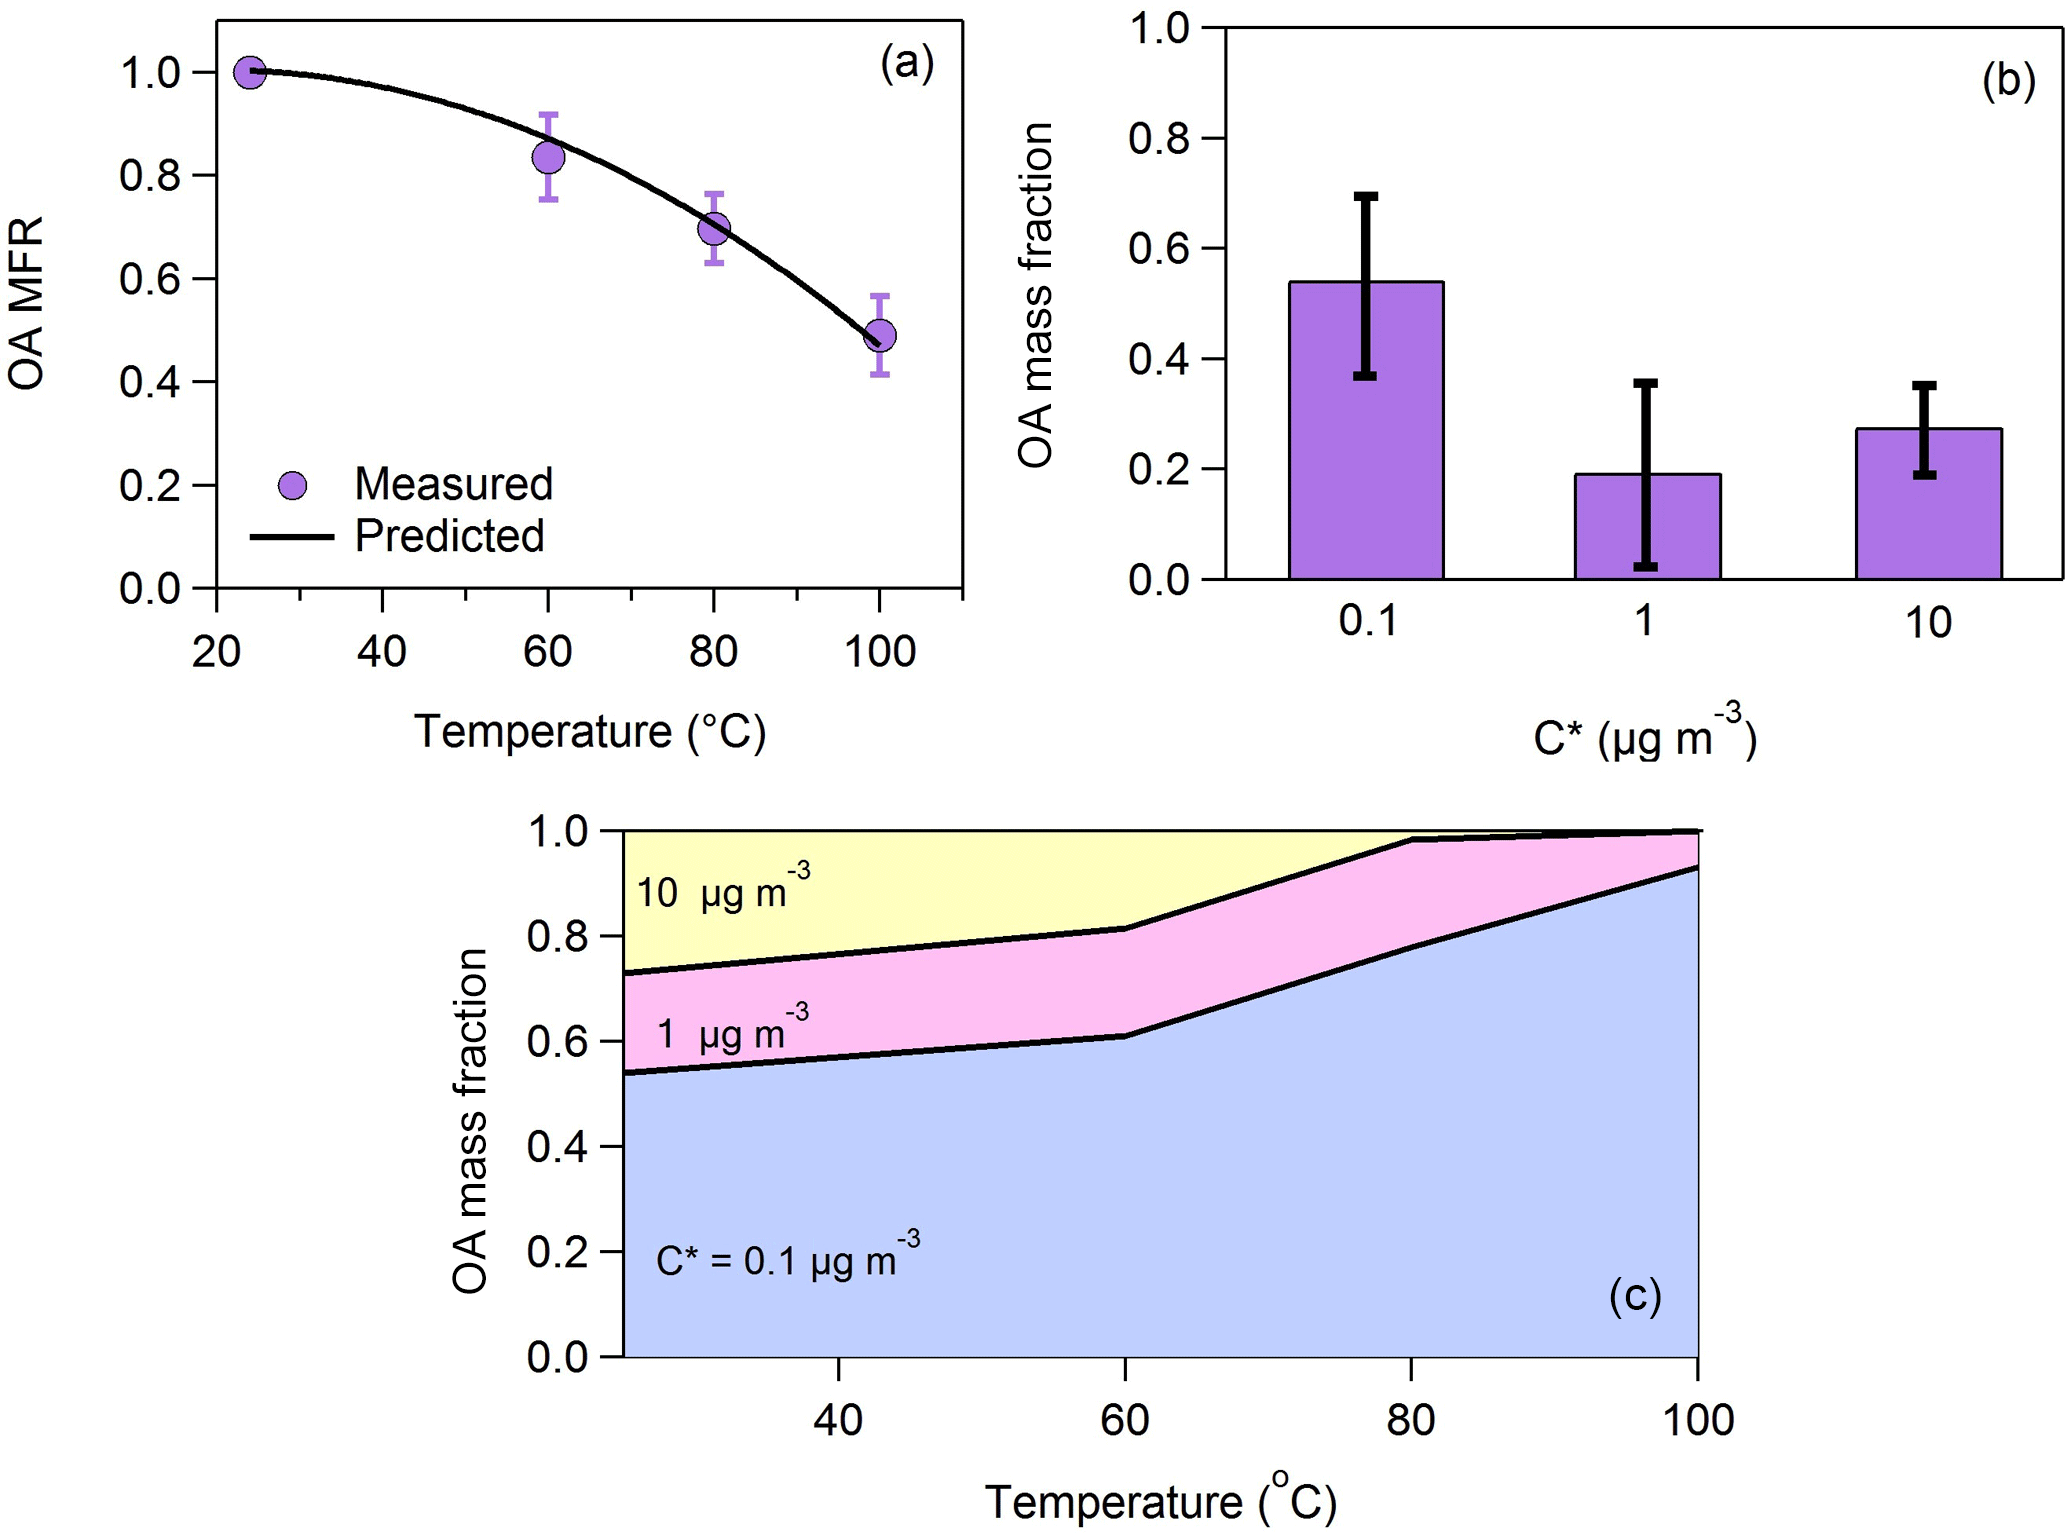
Figure 1(a) Loss-corrected MFR of the total OA. The purple circles correspond to the measurements and the uncertainties to 1 standard deviation of the mean. It is assumed that MFR = 1 at T = 24 ∘C. The black line is the model fit estimated using the approach of Karnezi et al. (2014). (b) The total OA volatility distribution. The uncertainties have been estimated according to the algorithm of Karnezi et al. (2014). (c) The predicted volatility distribution after passing through the thermodenuder as a function of the temperature.
4.1 Volatility of organic aerosol
The average OA mass concentration was 5 µg m−3. The loss-corrected OA MFR is depicted in Fig. 1a. Half of the total OA evaporated at 100 ∘C (T50=100 ∘C). The estimated volatility distribution (Fig. 1b) indicates that 46 % of the organic aerosol was semi-volatile organic compounds (SVOCs) (compounds with 1 ≤ C∗ ≤ 100 µg m−3) and 54 % was low-volatility organic compounds (LVOCs) (0.001 ≤ C∗ ≤ 0.1 µg m−3). Part of the material assigned to the 0.1 µg m−3 bin has volatility less than this value. The fact that there were no measurements above 100 ∘C does not allow us to constrain further the contributions of the LVOCs and ELVOCs. The number of bins that can be used in the analysis of thermodenuder data is in general determined by the ambient OA concentration (the bin range can extend up to an order of magnitude higher than the measured values), the number of temperature steps used in the analysis (the number of bins cannot be higher than the number of data points available for fitting), and the maximum fraction of the OA evaporated during the analysis. In theory, the thermodenuder approach can go down to concentrations as low as 10−5 µg m−3 or even lower if a high enough temperature is used. For example, Louvaris et al. (2017) used temperatures up to 400 ∘C. The availability of measurements at 25, 60, 80 and 100 ∘C means a maximum of four bins are possible; however, since the OA was on the order 5 µg m−3, the thermograms contain little information on the partitioning of compounds with saturation concentration exceeding 100 µg m−3. These two constraints together resulted in the choice of three volatility bins: 0.1, 1 and 10 µg m−3. The average volatility based on mass-fraction-weighted log10C∗ values was C∗ = 0.55 ± 0.29 µg m−3. Please note that this value is useful only for comparisons of volatility distributions in the same VBS volatility range. The mass fraction of each volatility bin is provided in Table S1 in the Supplement. The effective vaporization enthalpy of the total OA was 86 ± 9 kJ mol−1.
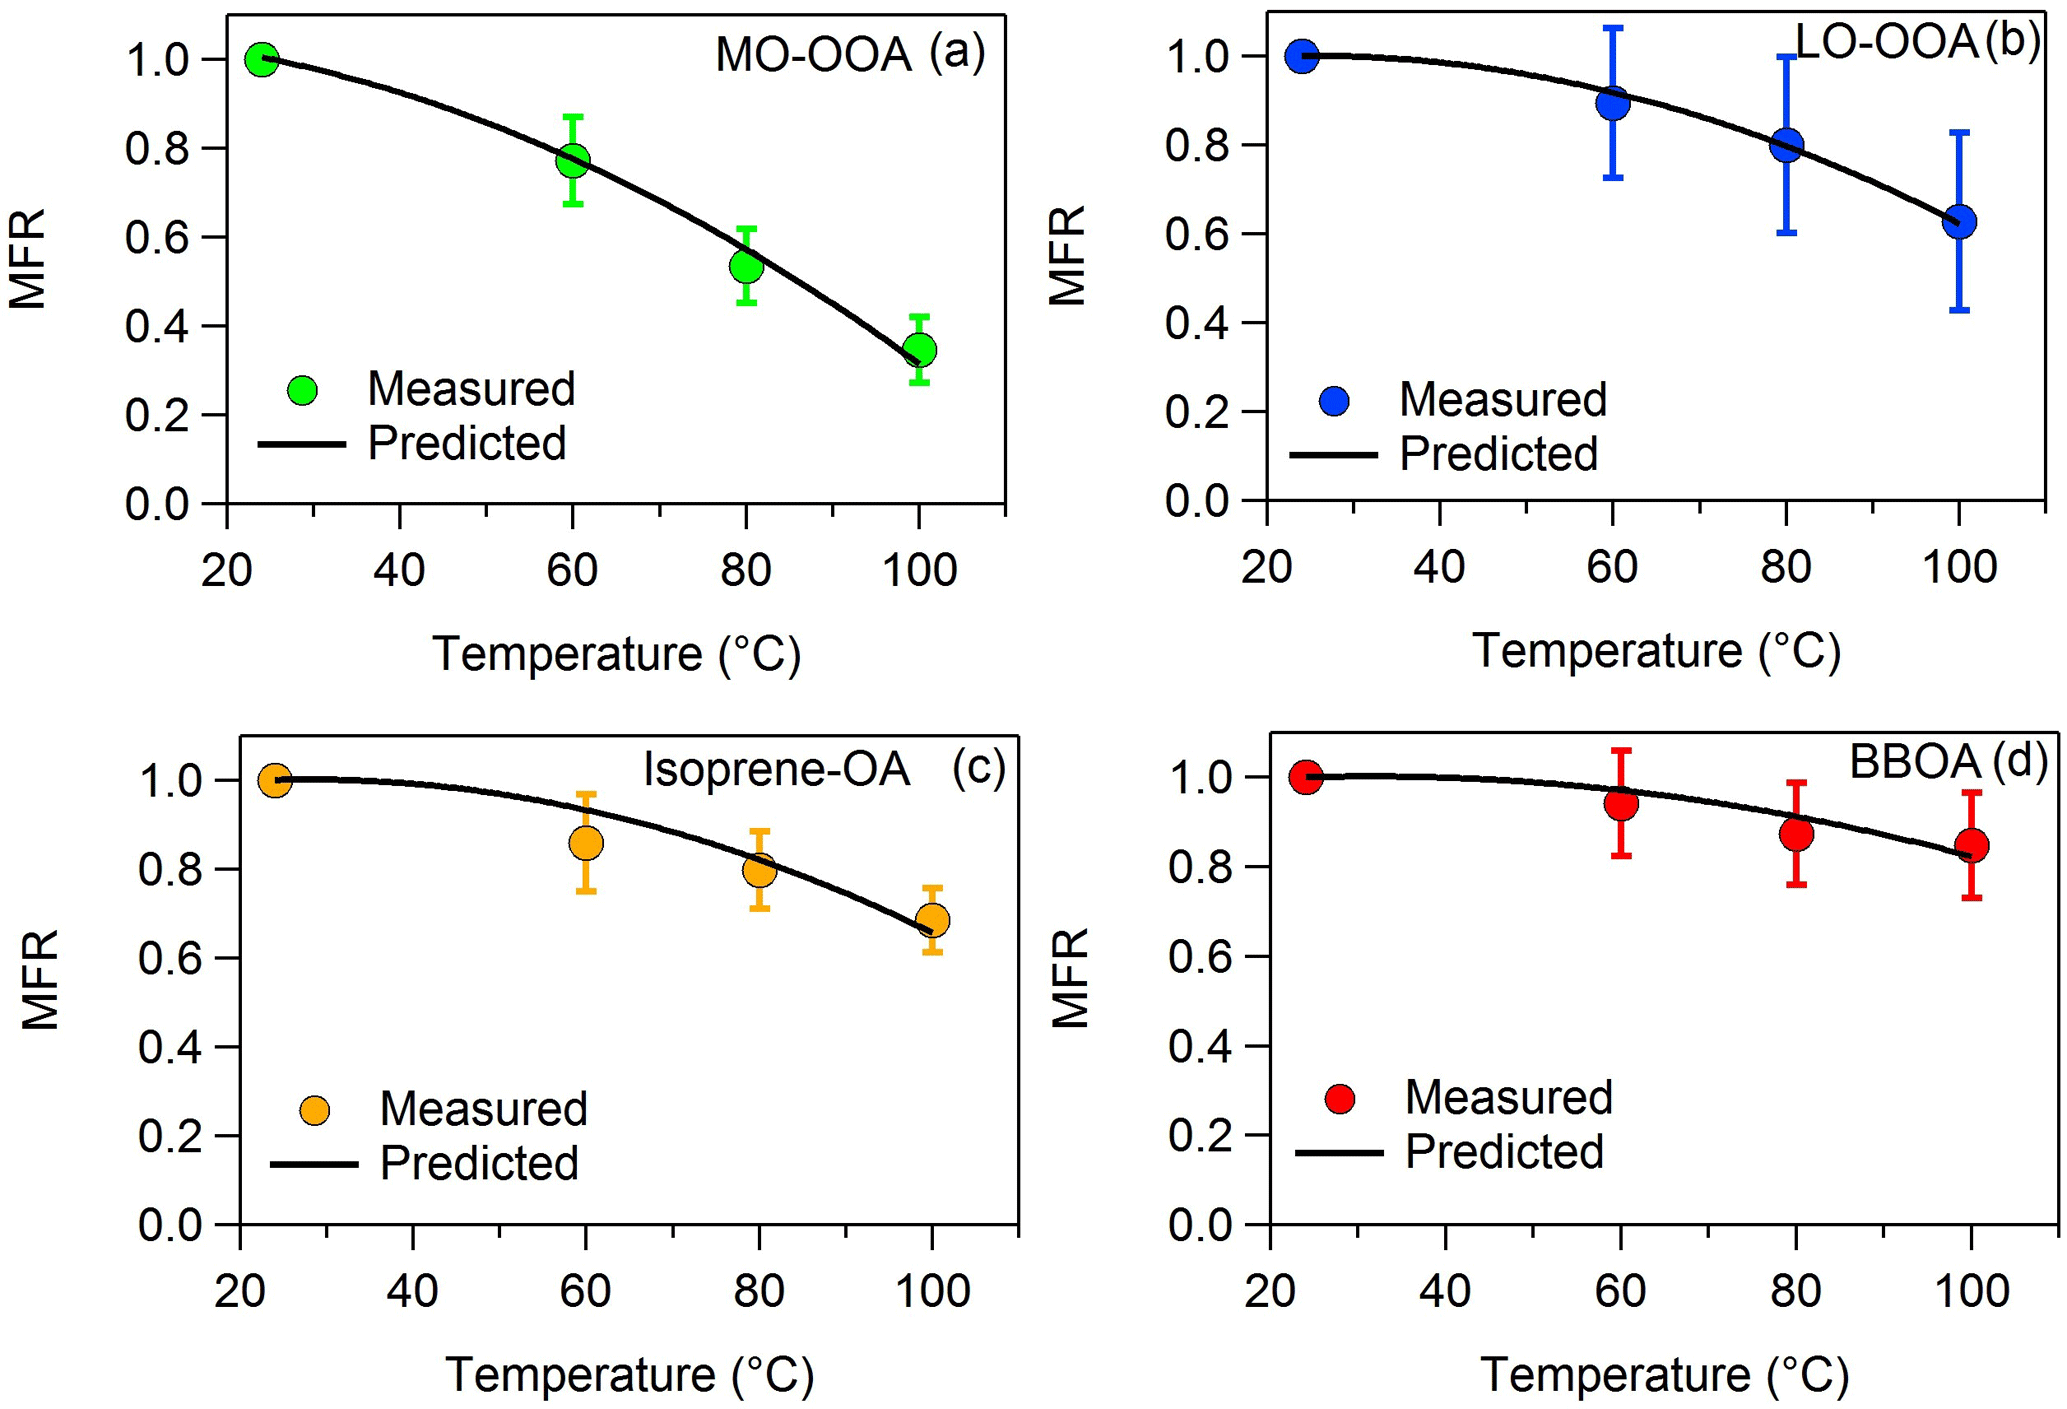
Figure 2MFRs of the loss-corrected (a) MO-OOA, (b) LO-OOA, (c) isoprene-OA and (d) BBOA. The circles represent the measurements with the 1 standard deviation of the mean. The black line corresponds to the best-predicted MFR using the algorithm of Karnezi et al. (2014).
Table 2OA mass fractions of the ambient and ambient and TD PMF factors.
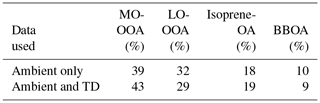
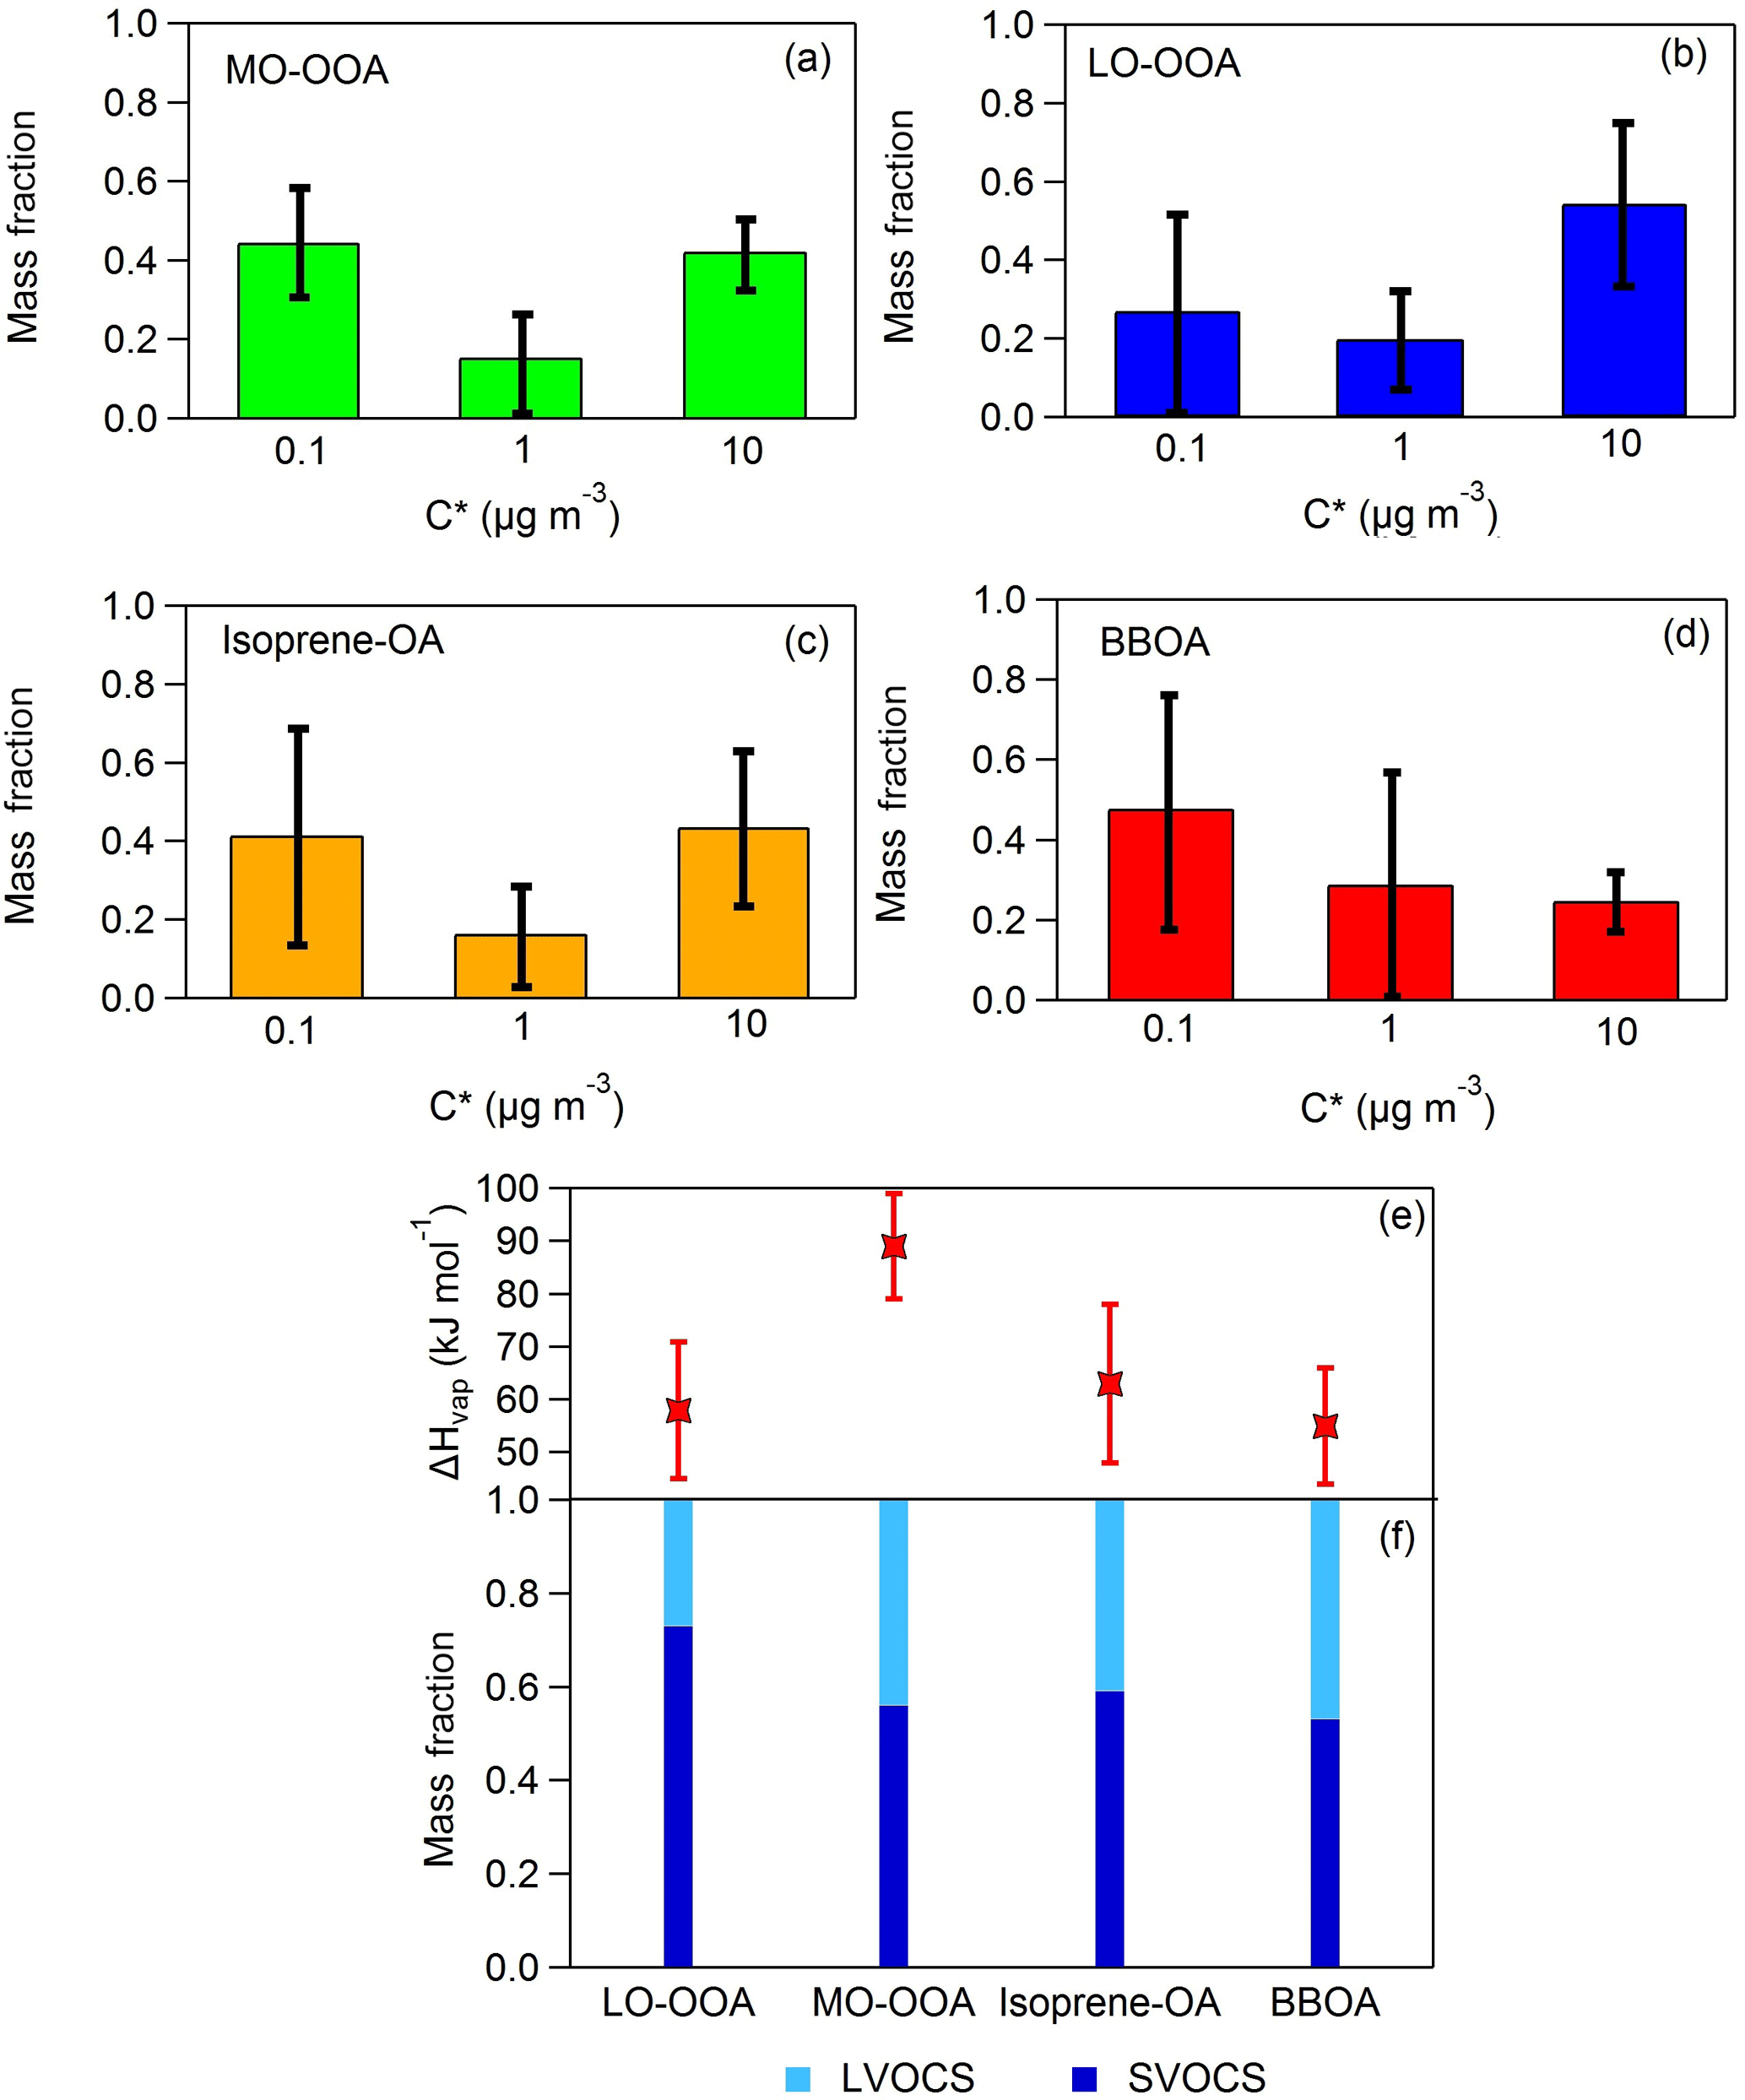
Figure 3(a–d) Predicted volatility distributions of the OA PMF factors. The error bars correspond to the uncertainties derived using the approach of Karnezi et al. (2014), (e) vaporization enthalpies comparison between the four OA factors and (f) volatility compositions comparison between the four OA factors.
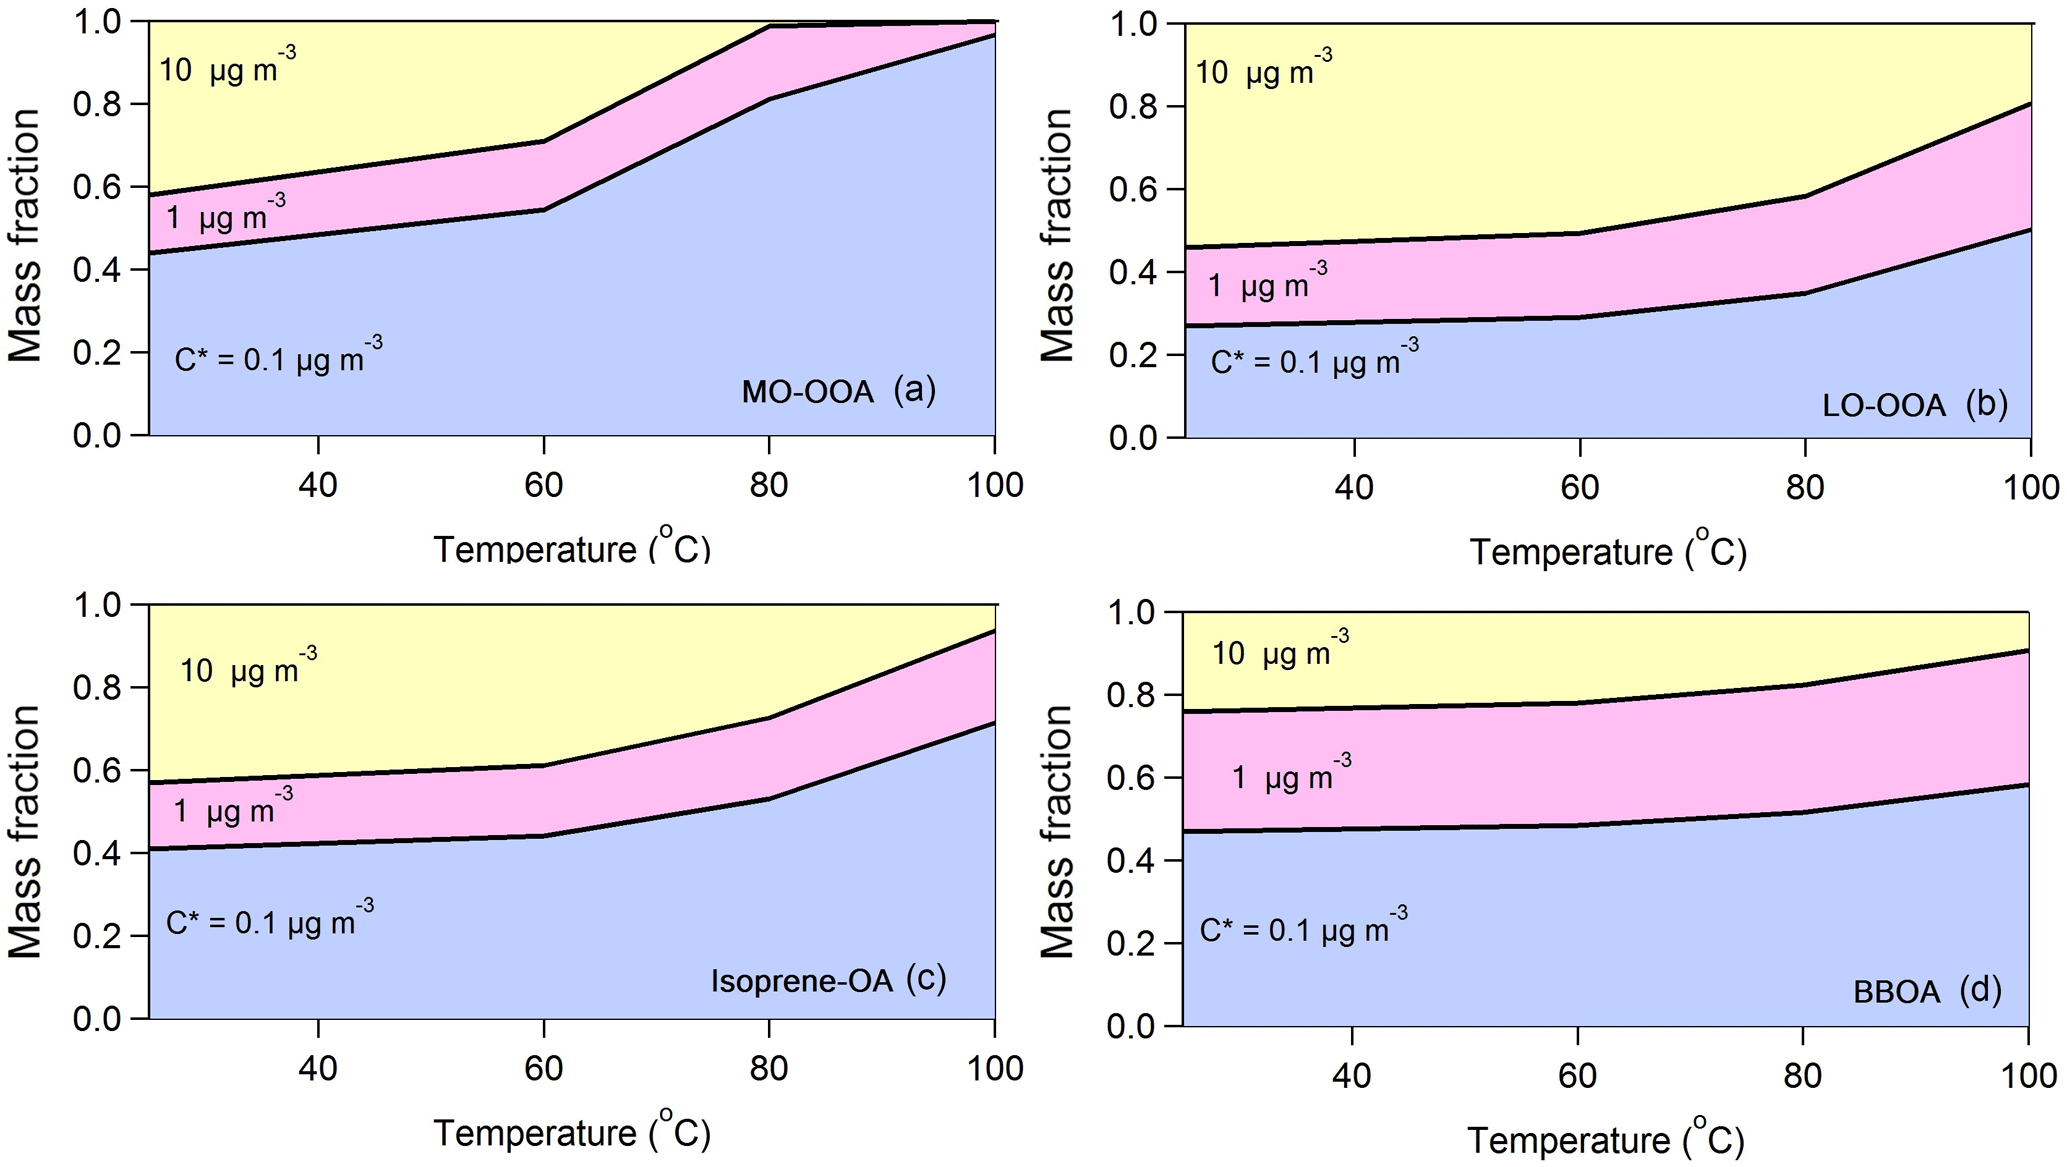
Figure 4The predicted composition in terms of C∗ for (a) MO-OOA, (b) LO-OOA, (c) isoprene-OA and (d) BBOA after passing through the thermodenuder as a function of the temperature. The model predicts, as expected, that the less volatile material with C∗ = 0.1 µg m−3 dominates the composition of the remaining aerosol after the TD as the temperature increases for all factors. However, there are significant differences in the evolution of the composition of the various factors.
4.2 Volatility of OA components
The PMF analysis using both the ambient and TD measurements suggested four factors. The OA consisted of 43 % more oxidized OOA (MO-OOA), 29 % less oxidized OOA (LO-OOA), 19 % isoprene-OA and 9 % biomass burning OA (BBOA). The same four factors and OA composition were obtained by Xu et al. (2015a) using only the ambient AMS HR mass spectra (Table 2). Details about their characteristics, correlation with external tracers and justification of their names are provided by Xu et al. (2015a). The ambient OA factor time series were practically the same in the two analyses with R2 > 0.93; the mass spectra were also similar with angle θ equal to 3–4∘ for LO-OOA, MO-OOA and isoprene-OA and 12∘ for the BBOA factor (Fig. S3 in the Supplement). Thus, our PMF results are robust and quite consistent with the previous analysis.
The loss-corrected MFRs of the four factors are depicted in Fig. 2. BBOA evaporated less, as its MFR was close to unity at all temperatures. The BBOA factor was quite oxygenated with an O : C of 0.58 compared to previous studies (e.g., Crippa et al., 2013; Florou et al., 2017). The corresponding BBOA could be chemically aged or PMF may be mixing the BBOA with aged background OA. Even though BBOA and isoprene-OA had similar O : C ratios (0.58 and 0.59 correspondingly), the isoprene-OA MFR was lower. Surprisingly the MFR of MO-OOA was lower than that of LO-OOA, even though MO-OOA had a higher a O : C ratio (0.99) than LO-OOA (0.63). Relying only on MFR one would reach the conclusion that MO-OOA was more volatile that LO-OOA.
The predicted thermograms for each factor are also depicted in Fig. 2 and the resulting volatility distributions are shown in Fig. 3a–d. Figure 3e and f show the comparison of the volatility compositions and the vaporization enthalpies between the four OA factors. The mass fractions of each volatility bin (in the aerosol phase), average volatility (C∗) and the vaporization enthalpy of each factor are given in Table S1 in the Supplement.
The average LO-OOA mass concentration was 1.66 µg m−3 and this factor based on the model was composed of 73 % SVOCs and 27 % LVOCs. Its average volatility was C∗ = 1.88 ± 0.32 µg m−3 and its effective vaporization enthalpy 58 ± 13 kJ mol−1. The average MO-OOA mass concentration was 1.96 µg m−3. According to its volatility distribution 56 % of the MO-OOA was SVOCs and 44 % was LVOCs. Its effective vaporization enthalpy was 89 ± 10 kJ mol−1 and its average volatility 0.95 ± 0.31 µg m−3. According at least to the model the MO-OOA was less volatile on average than the LO-OOA even if it evaporated more in the TD. This counterintuitive behavior is explained by the TD model by the higher effective vaporization enthalpy of the MO-OOA, probably due to the contribution of dicarboxylic and tricarboxylic acids which have vaporization enthalpies higher than 100 kJ mol−1 (e.g., Saleh et al., 2008, 2010; Kostenidou et al., 2018). In addition, the C∗ distributions as a function of the mass fraction and the temperature indicate that, as the temperature increases, MO-OOA is composed of a higher fraction of less volatile species (C∗ = 0.1 µg m−3) compared to LO-OOA (Fig. 4a and b). This supports our finding that the MO-OOA factor contains less volatile species than LO-OOA.
Our results suggest that deducing the volatility of a component using only its MFR or its O : C ratio may lead to incorrect conclusions. It has often been assumed that a lower MFR means more volatile OA and vice versa. However, this applies to the temperature of the measurement. The volatility of an OA component at a given temperature in the TD depends not only on its volatility at ambient conditions, but also on its enthalpy of vaporization. A high enthalpy of vaporization leads to drastic increases in the volatility as the temperature increases and substantially affects the slope of the thermogram over the full temperature range. The Karnezi et al. (2014) algorithm looks at all potential explanations for the observed behavior and it reports them. These results are shown in Fig. 3. The model finds that the observed behavior of the thermograms is probably related to differences in the effective enthalpy of vaporization (higher value for the MO-OOA than for the LO-OOA). This difference appears to be robust, considering the estimated uncertainties (Fig. 3e). In addition, Xu et al. (2016b) observed contradictions between the O : C ratio and MFRs and they suggested that different O : C distributions could result in the same bulk O : C but different volatility distributions, which may lead to particles with the same O : C but different MFR.
BBOA was the less abundant factor with average mass concentration equal to 0.5 µg m−3. According to the TD model, 53 % of the BBOA consisted of SVOCs and the other 47 % was LVOCs. Its average volatility was C∗ = 0.59 ± 0.22 µg m−3 and its effective vaporization enthalpy was 55 ± 11 kJ mol−1. The BBOA volatility distribution did not change significantly with temperature (Fig. 4d). Finally, the average isoprene-OA mass concentration was 0.9 ± 0.5 µg m−3 and contained of 59 % SVOCs and 41 % LVOCs. Its estimated average volatility was C∗ = 1.05 ± 0.30 µg m−3 and its vaporization enthalpy was 63 ± 15 kJ mol−1. Even though isoprene-OA had a very distinct thermogram compared to that of MO-OOA, their estimated volatility distribution at 25 ∘C was similar. However, at higher temperatures (e.g., at 100 ∘C), the remaining MO-OOA after the TD was composed almost entirely of C∗ = 0.1 µg m−3, while the remaining isoprene-OA included material of higher volatility.
These results suggest that all factors contained components with a wide range of volatilities and vaporization enthalpy. Based on their average volatility, BBOA was the least volatile, followed by MO-OOA, isoprene-OA and finally LO-OOA. The availability of measurements at only three temperatures above ambient, however, introduces uncertainty in the above results. A detailed sensitivity analysis is presented in Sect. 5.
The correlation between the MFR of each factor at each temperature with the RH, temperature, O3, NO, NO2, acidity and OA loading was also investigated. There was a tendency of the MFR of all factors at higher temperatures to increase as the ozone concentration increased. For example, the R2 between O3 and the MFR of MO-OOA at 80 ∘C was 0.25, R2=0.36 for the MFR of LO-OOA at 100 ∘C, R2=0.26 for the MFR of isoprene-OA at 100 ∘C and R2=0.22 for the MFR of BBOA at 100 ∘C. This suggests that when the photochemistry is more intense the OA evaporates less in the TD. The R2 between acidity and the MFR of LO-OOA at 100 ∘C was 0.26, suggesting that acidity may be also affecting the MFR. The MFR of BBOA at 100 ∘C on the other hand was anti-correlated with the NO and NO2 concentrations (R2 of 0.23 and 0.37 correspondingly). This indicates that at lower NOx levels (away from the source) BBOA evaporated less, suggesting that this factor may contain both fresh and aged BBOA or fresh BBOA aerosols mixed with aged background. This is also supported by the relatively high O : C ratio of this factor (0.58). All the other R2 values examined were lower than 0.2. There was no distinct diurnal profile for the MO-OOA, BBOA and isoprene-OA MFR. For LO-OOA MFR at 80 and 100 ∘C there was a slight increase (with considerable noise though) between 11:00 and 16:00 LT. As a result, a significant diurnal variation of the MFR of the various factors was not observed.
5.1 Effective enthalpy of vaporization (ΔHvap)
We estimated the volatility distributions for three fixed vaporization enthalpies – 50, 80 and 100 kJ mol−1 – for all factors (Table S2 in the Supplement). While the corresponding thermograms do not reproduce as well the corresponding measurements, it is instructive to examine the corresponding volatility distributions taking into account this time the measurement uncertainties.
The 80 and 100 kJ mol−1 values lead to thermograms for MO-OOA consistent with the measurements given the uncertainty of the latter (Fig. A1, Appendix). The resulting MO-OOA volatility distributions (Fig. A2, Appendix) are within the uncertainty range of the distributions shown in Fig. 3. The LVOC content of the factor varies from 35 to 60 % as the ΔHvap varies from 80 to 100 kJ mol−1. The optimum (base case) solution suggested a 44 % LVOC content.
The situation is a little more complex for LO-OOA due to the higher variability of the corresponding MFR measurements. All three ΔHvap values lead to solutions that are consistent with the observations within experimental uncertainty. This results in a wide range of volatility distributions with the LVOC content varying from 25 to 90 % (Fig. A2). The best (base case) solution suggested 27 % LVOCs, so the sensitivity analysis suggests that the LO-OOA may have been significantly less volatile.
Only the 50 and 80 kJ mol−1 values lead to acceptable thermograms for the isoprene-OA (Fig. A1). The LVOCs are predicted to contribute to the factor from 35 to 75 % (Fig. A2) as the assumed ΔHvap varies from 50 to 80 kJ mol−1. The optimum (base case) solution corresponded to 41 % LVOCs.
Finally, for the BBOA as the ΔHvap varies from 50 to 80 kJ mol−1 (the 100 kJ mol−1 value does not lead to acceptable solutions) the LVOC content increases from 65 to 87 % (Fig. A2), values that are higher than the estimated 47 % LVOCs in the optimum (base case) solution.
5.2 Accommodation coefficient
It has been assumed in the analysis so far that there were no resistances to the evaporation of the OA in the TD and that the accommodation coefficient, am, was equal to one. We performed two sensitivity tests using accommodation coefficients of 1 and 2 orders of magnitude lower (0.1, 0.01). The volatility distributions, the average volatility C∗ and the vaporization enthalpy of each factor are given in Table S1 in the Supplement. The corresponding MFRs are illustrated in Fig. A3 and the volatility distributions in Fig. A4.
A value of am equal to 0.01 is inconsistent with the measured thermograms of MO-OOA, isoprene-OA and total OA (Fig. A3). For LO-OOA and BBOA the predicted thermograms are within the experimental error of the measured values and the resulting volatility distributions are quite close to those of the base case. For example, for LO-OOA the LVOC content is 40 % (Fig. A4) compared to 27 % in the optimum solution. This rather surprising insensitivity of the volatility distribution is due to the fact that the model balances the effects of the lower am by increasing the predicted ΔHvap. In the case of the LO-OOA the estimated enthalpy of vaporization increases to 121 kJ mol−1.
The intermediate value of am=0.1 leads to predicted MFR values within the experimental error for LO-OOA, isoprene-OA and BBOA, but not for MO-OOA or total OA (Fig. A3). For the acceptable cases the average volatility of the OA components decreases by a factor of 2–3 and the effective ΔHvap increases by 30–40 kJ mol−1. The LVOC content of LO-OOA increases from 27 to 52 %, while the increase in the isoprene-OA and BBOA LVOCs is small (from 41 to 47 % and from 60 to 64 %) respectively (Fig. A4). For the MO-OOA and the total OA only the am=1 simulations provided results consistent with the observations.
The above analysis suggests that the estimated volatility distributions have a surprisingly low sensitivity to the assumed accommodation (evaporation) coefficient, but the ΔHvap is quite sensitive to this value. This result is quite different from other studies (e.g., Lee et al., 2010; Cappa and Jimenez, 2010; Riipinen et al., 2010) and is due to the limited temperature range of the measurements in the present work.
5.3 TD collection efficiency
In this case we repeated the calculations assuming a lower AMS CE for the aerosol that passed through the TD. Assuming a 10 % lower CE in the TD, the volatility distribution of MO-OOA and isoprene-OA changed by less than 10 % (Table S1 in the Supplement). However, the volatility distribution of LO-OOA and BBOA shifted towards lower values with the average volatility decreasing by around a factor of 2. The reasons for this behavior could be the high LO-OOA MFR uncertainty and the low mass concentration of the BBOA. The corresponding thermograms and volatility distribution are shown in Figs. S4 and S5 in the Supplement.
MO-OOA and LO-OOA: the volatility distributions of the MO-OOA and LO-OOA were similar to those of the aged aerosol in Finokalia (FAME-08) (Lee et al., 2010) in which the SVOCs accounted for 60 % and LVOCs for 40 % of the OA using an am=0.05 and ΔHvap=80 kJ mol−1 (Fig. S6 in the Supplement). The SOAS LO-OOA appears to be a little more volatile than the summertime SV-OOA in Paris (Paciga et al., 2016) and Mexico City (Cappa et al., 2010), while the MO-OOA is a lot more volatile than the low-volatility oxygenated OA (LV-OOA) in these locations. These summertime OOA components in SOAS were more volatile compared to the wintertime OOA in Paris and Athens (Louvaris et al., 2017), which had a lower SVOC content (45 % for Paris and 31 % in Athens).
BBOA: Figure S6b in the Supplement illustrates the volatility comparisons between the BBOA factor and the BBOA factors from Mexico City, Paris (winter) and Athens (winter). The estimated SVOC content of all four BBOA factors was surprisingly similar around 50 % with the Mexico City BBOA having the higher fraction (70 %). The differences in LVOCs and ELVOCs are at least partially due to the temperature ranges used in the corresponding measurements. The corresponding O : C ratios of the factors were quite different: 0.58 for SOAS, 0.4 for Mexico City, 0.29 for Paris, and 0.23 for Athens (all estimated using the Canagaratha et al., 2015, approach). Part of the reason of the discrepancy may be hidden in the least volatile components of BBOA that were not examined in the present study.
Isoprene-OA: Lopez-Hilfiker et al. (2016) suggested that the IEPOX SOA had much lower saturation concentration, C∗ = 10−4 µg m−3, compared to the volatility of the isoprene-OA estimated here. However, Lopez-Hilfiker et al. (2016) results are strictly for the IEPOX SOA which is a subset of the isoprene-OA investigated here. So, a quantitative comparison of the corresponding volatilities is not possible. Also, the analysis of Lopez-Hilfiker et al. (2016) does not account for the effect of the vaporization enthalpy. There is also a potentially important experimental difference in this case, as in our work the OA just evaporates in the TD, while the Lopez-Hilfiker et al. (2016) experimental approach involves collection of the OA on a filter and then heating and desorption. As a consistency test, we used the volatility distribution of Lopez-Hilfiker et al. (2016) as input to the code of Riipinen et al. (2010) varying the enthalpy of vaporization. The best result was obtained for an abnormally high value of ΔHvap = 208 kJ mol−1 and even then the model underestimates the observed evaporation of isoprene-OA (Fig. S7 in the Supplement). Using more reasonable values of ΔHvap for such compounds the discrepancies between our measurements and the predictions are even larger, suggesting that the Lopez-Hilfiker et al. (2016) volatility estimates are not consistent with our results and appear not to represent the full volatility range of isoprene-OA.
A similar discrepancy exists with the low estimated volatility for the IEPOX SOA by Hu et al. (2016) which is even lower than that of Lopez-Hilfiker et al. (2016) (Fig. S6c in the Supplement). Even though Hu et al. (2016) used the same AMS–thermodenuder technique, their approach for the measurement interpretation was very different. Hu et al. (2016) used the empirical method of Faulhaber et al. (2009) and not an aerosol dynamics model for the estimation of the volatility distributions from their MFR measurements. Their method was based on a relationship between TD temperature and organic species saturation concentration at 298 K (C∗) that has been obtained using five compounds (acids) with known saturation concentration. This approach is applicable to organic compounds with similar properties (e.g., enthalpy of vaporization) to the five known compounds, but it may encounter significant difficulties for OA that are quite different from the model compounds. A related weakness of that approach is that it does not account for the enthalpy of vaporization as the model used in this work does.
These discrepancies clearly show that there is need for additional investigation of the volatility of the various components of the isoprene SOA in the atmosphere.
Total OA: Fig. S6d in the Supplement compares the total OA volatility estimated in this study to those of Lopez-Hilfiker et al. (2016), Hu et al. (2016) and Saha et al. (2017) for the same location (Centreville) and period. To facilitate the comparison, given that different temperature ranges were used in the above studies, the C∗ = 0.1 µg m−3 bin is used to represent compounds of even lower volatility than this value. Our results are quite consistent with those of Saha et al. (2017), especially considering the differences in both the TD design and modeling of the results. Saha et al. (2017) obtained the total OA thermogram using a thermodenuder system and then estimated the corresponding volatility distribution using an aerosol dynamics model and the volatility basis set (Donahue et al., 2006; Lee et al., 2011; Saha et al., 2015; Saha and Grieshop, 2016). Their experimental and data analysis approach is a lot closer to ours compared to Hu et al. (2016) and Lopez-Hilfiker et al. (2016) and their results for the total OA are quite consistent with ours. Their model takes into account the vaporization enthalpy as well and this is probably the key difference among the various approaches.
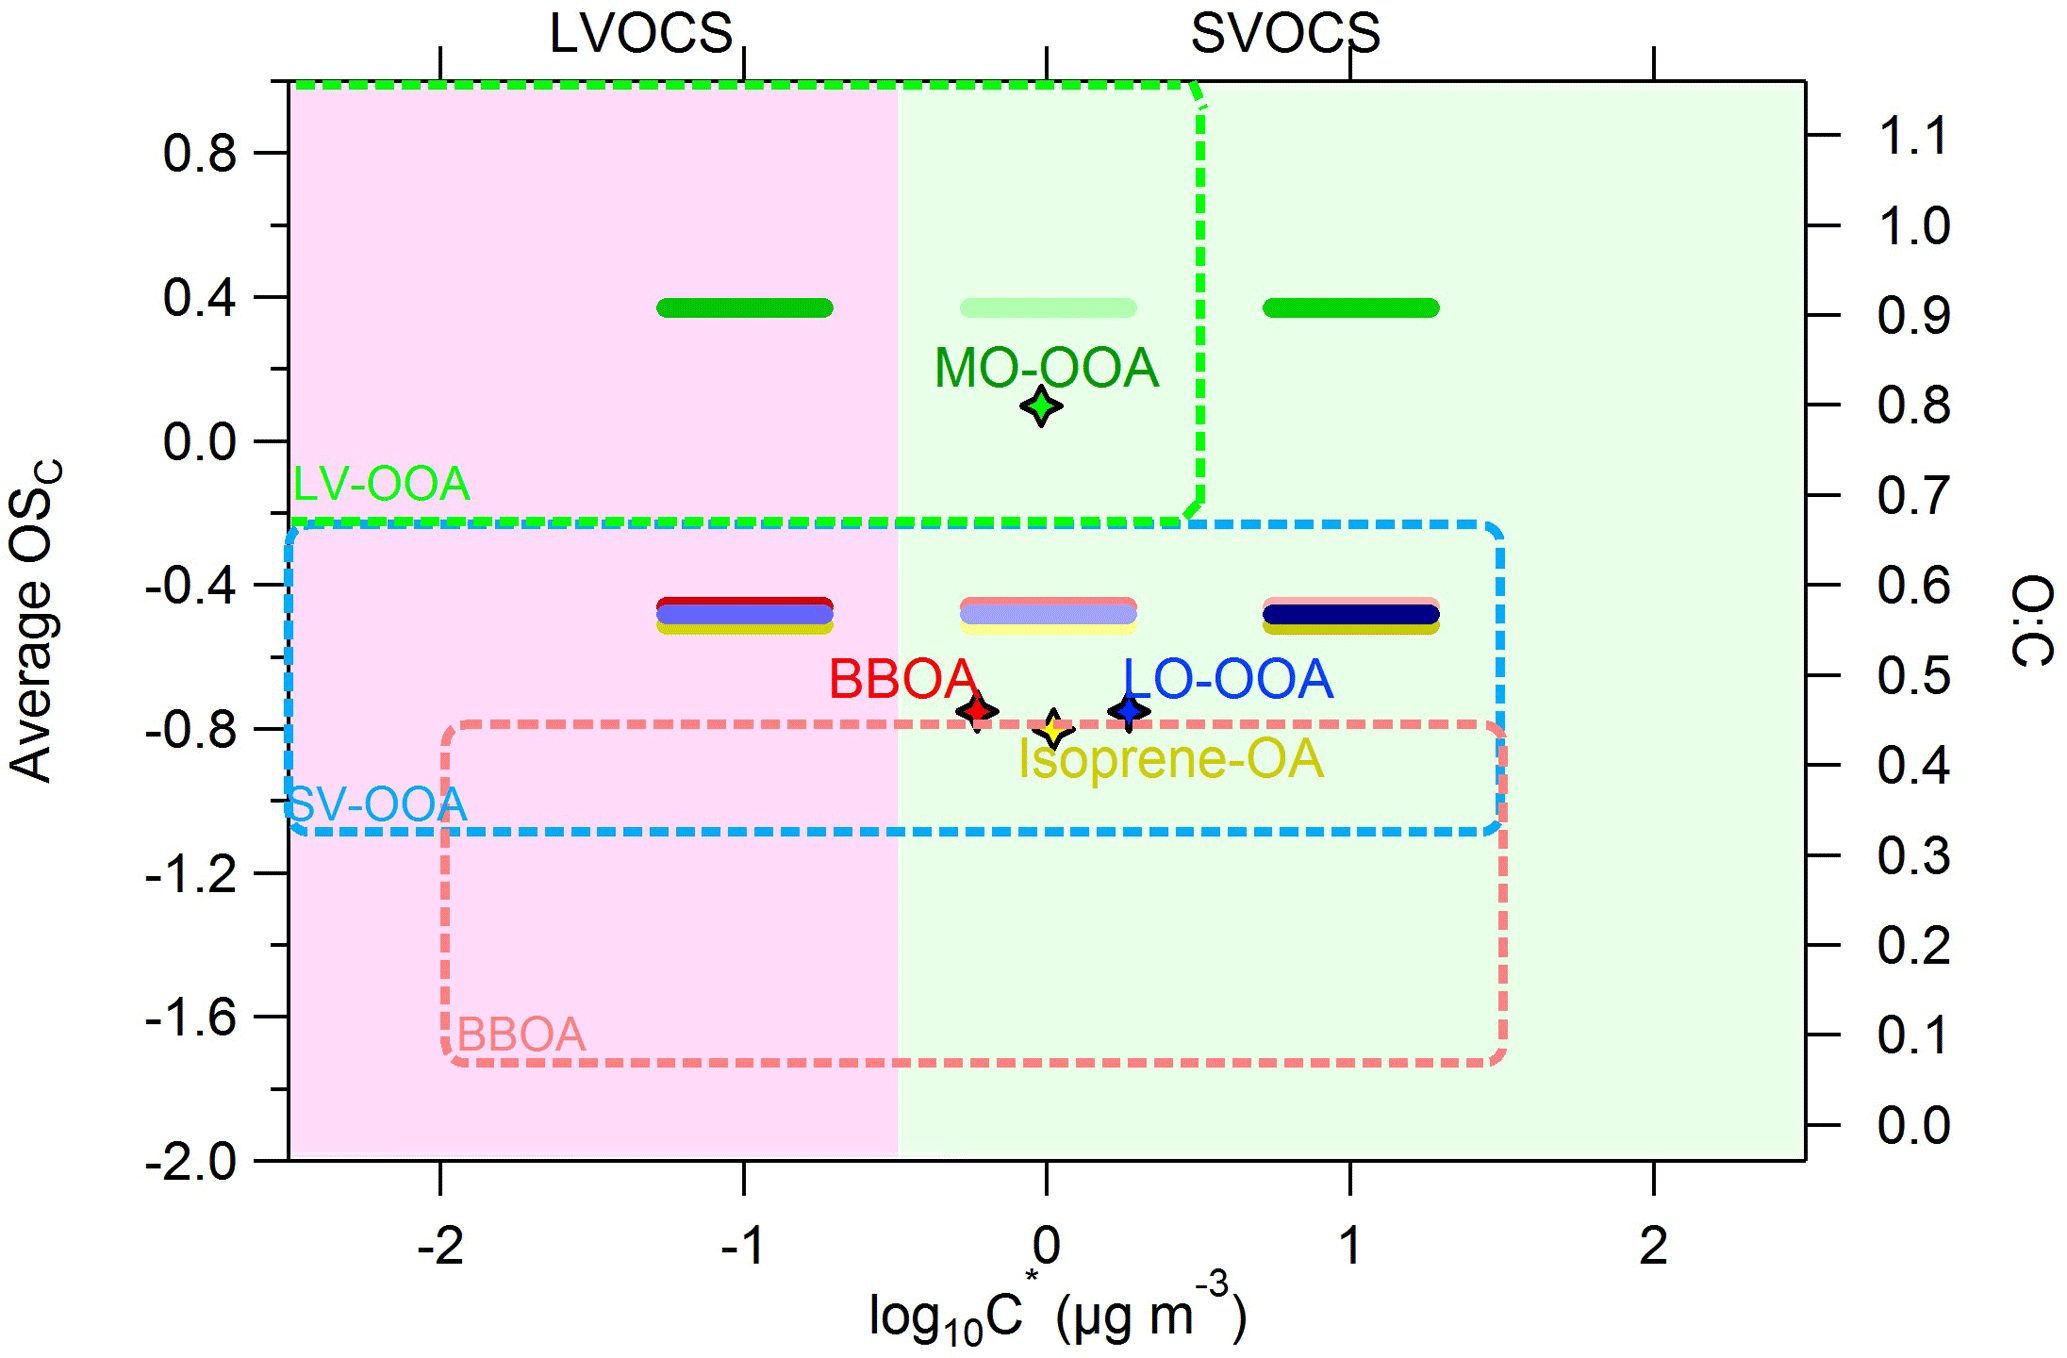
Figure 5Average carbon oxidation state OSC (left y axis) and O : C ratio (right axis) versus the saturation concentration in terms of log10C∗. The horizontal bars are the volatility distributions of the SOAS PMF factors: MO-OOA (green), LO-OOA (blue), isoprene-OA (yellow) and BBOA (red). The darker the color of the horizontal bars the higher the mass fractional contribution for the corresponding C∗ bin. The diamonds represent the average log10C∗ value for a given PMF factor. The green, light blue and pink dashed areas are the locations of the LV-OOA, SV-OOA and BBOA PMF factors as proposed by Donahue et al. (2012).
Figure 5 shows the location of our factors in the 2D-VBS framework of Donahue et al. (2012). The PMF source locations in the 2D-VBS were estimated using the elemental ratios derived by the method of Aiken et al. (2008) for consistency with the original figure. The O : C of the MO-OOA, LO-OOA, isoprene-OA and BBOA factors was 0.8, 0.46, 0.44 and 0.46 correspondingly. The MO-OOA factor is in the proposed LV-OOA area but it includes an SVOC component that does not exist in the original 2D-VBS. The LO-OOA factor is quite consistent with the proposed SV-OOA area. The isoprene-OA is also located in the SV-OOA area based on our results. Finally, the BBOA factor has the expected volatility range, but is in the upper border of the 2D-VBS BBOA area due to its high oxidation state observed during SOAS.
Cerrully et al. (2015) estimated the hygroscopicity κ parameter for each factor for the SOAS campaign for supersaturation s = 0.4 % using PMF analysis on the PILS aerosol. The resulting values were κMO−OOA = 0.16 ± 0.02, κLO−OOA = 0.08 ± 0.02 and κisoprene−OA = 0.20 ± 0.02. During the periods of the PILS measurements the BBOA contribution was very low and PMF could not resolve this factor. The isoprene-OA factor had a higher κ than MO-OOA, but its O : C ratio was lower (0.62) than MO-OOA (1.02). This contradicts Jimenez et al. (2009), who proposed that the hygroscopicity increases linearly as the O : C ratio increases and the recent study of Thalman et al. (2017), which suggested that for OOA factors the relationship between the hygroscopicity and the O : C is linear. A possible explanation for this contradiction could be that the O : C–hygroscopicity relationship may not be monotonic, but there may be systems for which the relationship may be highly nonlinear. For example, Cain and Pandis (2017) showed that the hygroscopicity could exhibit a maximum at intermediate volatilities.
A recent study by Nakao (2017) proposed a theoretical description for the linkage between the O : C ratio, volatility and hygroscopicity. Figure S8 in the Supplement illustrates the experimental saturation concentrations and κ parameters for known compounds found in the literature (Table S3 and S4 in the Supplement) together with the Nakao (2017) estimations. The isolines in this figure represent the intrinsic κ which corresponds to the upper limit of κ assuming that the organic species are entirely soluble. The location of the selected known compounds was generally in agreement with the suggested by Nakao (2017) intrinsic κ isolines for κ higher than 0.1. For κ lower than 0.1 the experimental values were lower than the theoretical κ. This discrepancy could be due to the fact that the compounds in the area with κ above 0.1 are more water soluble than those in the area with κ below 0.1. For example, the solubility of malonic acid is 1161 g L−1 (Saxena and Hildemann, 1996), while the water solubility of suberic acid is 2.46 g L−1 (Bretti et al., 2006).
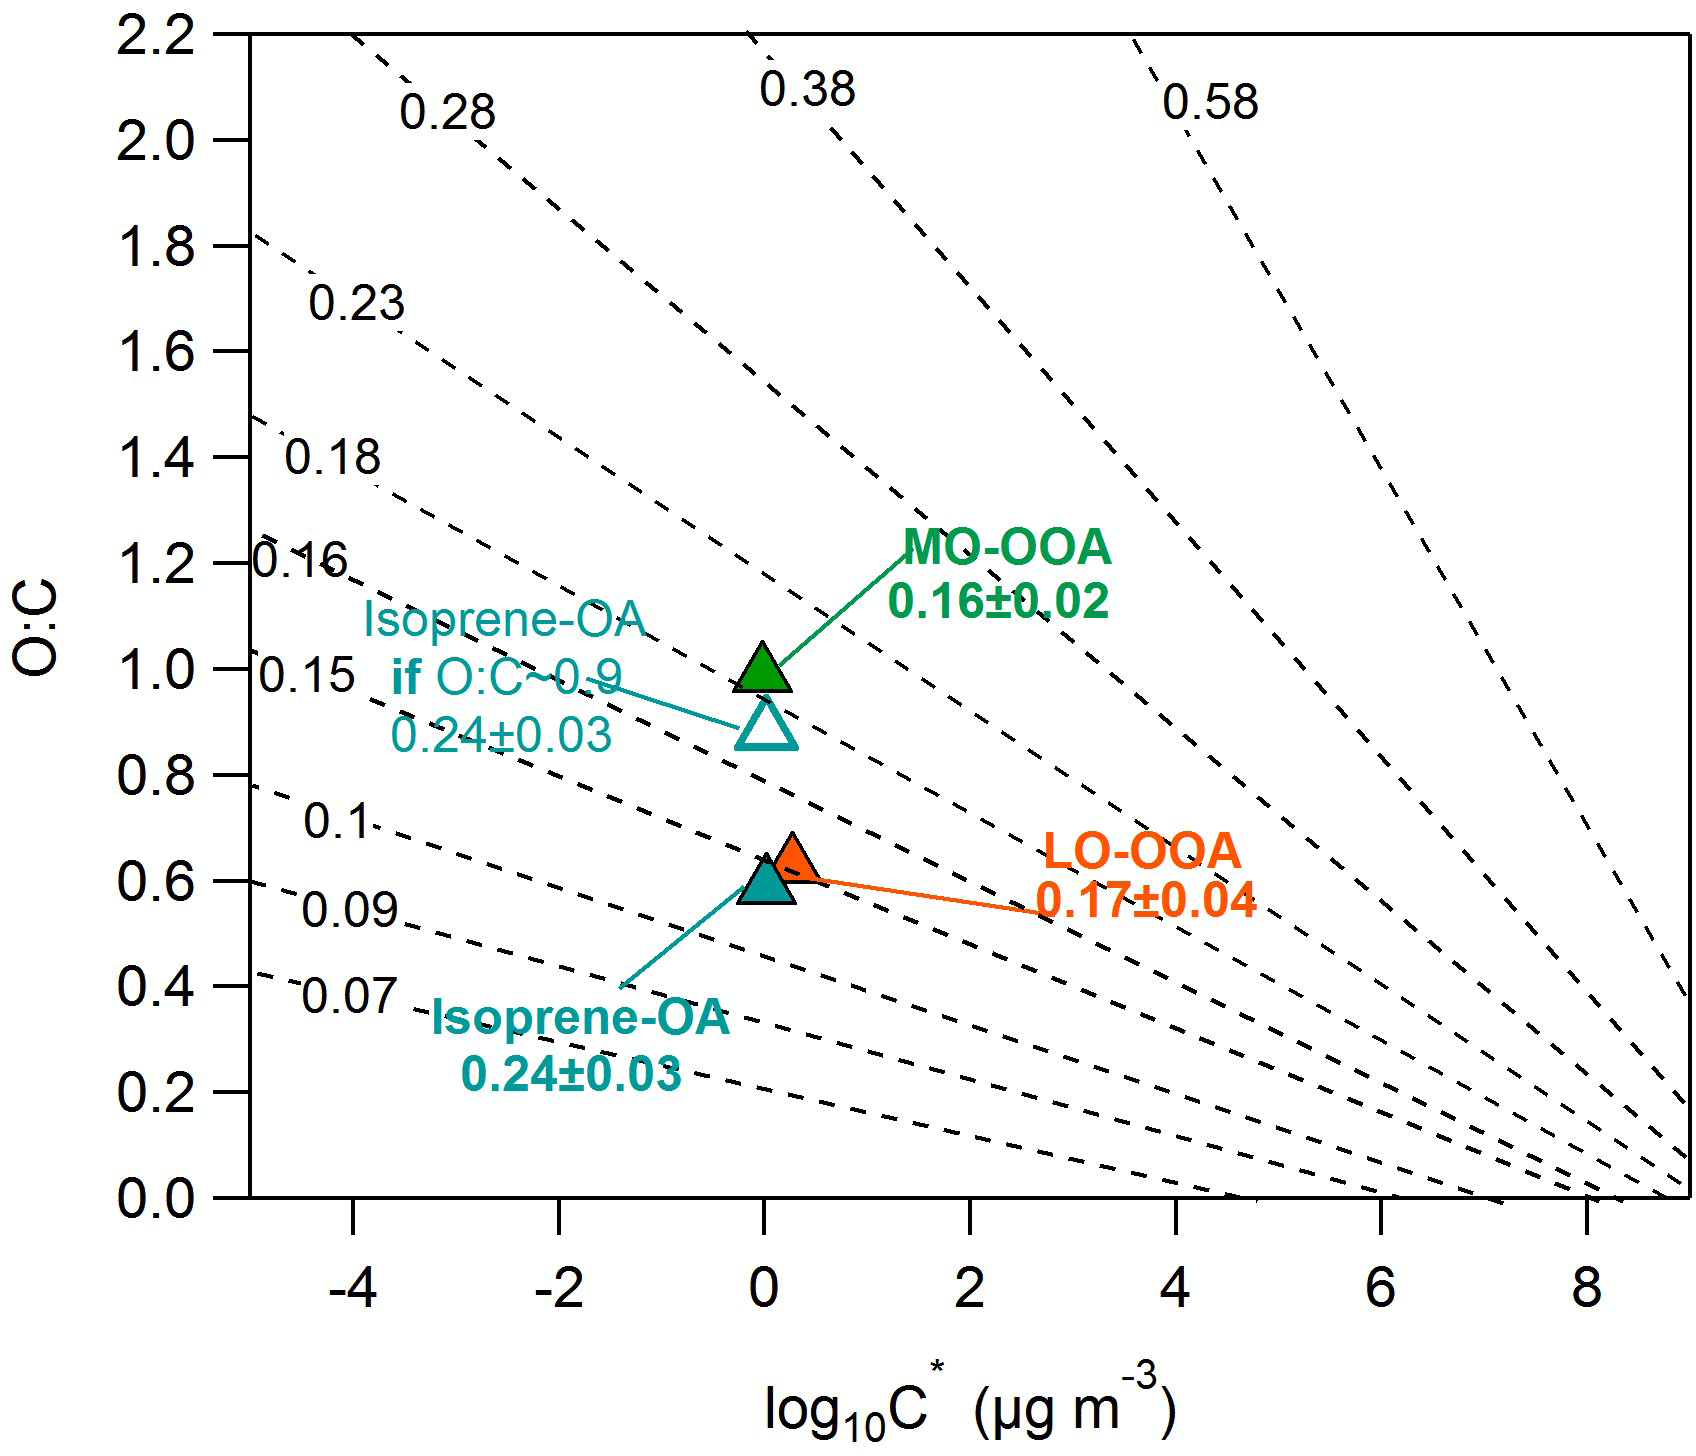
Figure 6O : C ratios versus the average volatility as log10C∗. The black isolines correspond to the theoretically intrinsic κ suggested by Nakao (2017). The triangles denote the SOAS PMF factors. The hygroscopicity of the SOAS PMF factors has been transformed into the intrinsic κ, using the water solubility results of Xu et al. (2017). The open cyan triangle corresponds to the isoprene-OA with a hypothetical O : C = 0.9.
Xu et al. (2017) calculated the water solubility of the MO-OOA, LO-OOA and isoprene-OA in Centreville during the SOAS campaign and found it to be 100, 47 and 83 % correspondingly. Thus, the intrinsic κ of MO-OOA, LO-OOA and isoprene-OA is correspondingly 0.16 ± 0.02, 0.17 ± 0.04 and 0.24 ± 0.03. Figure 6 shows the intrinsic κ values of our factors in the 2D-VBS and the Nakao (2017) frameworks. The MO-OOA and LO-OOA values are close to the Nakao (2017) proposed intrinsic κ isolines. However, the isoprene-OA experimental intrinsic κ (0.24) is higher than the theoretical (0.13). One reason for this disagreement could be the O : C estimate by the AMS. Canagaratna et al. (2015) measured the O : C ratio of a racemic mixture of δ-isoprene epoxydiols (C5H10O3) and found it to be around 0.4, which is 1.5 times lower than the theoretical (0.6). If the isoprene-OA factor behaves similarly to the racemic mixture, its O : C may in fact be as high as 0.9, corresponding to a higher theoretical (Nakao, 2017) intrinsic κ = 0.19, which is closer to the experimental value (0.24). Although our results cannot be fully explained by the theoretical framework of Nakao (2017), they denote that the relationship between the hygroscopicity, volatility and O : C ratio is rather complicated. The model of Nakao (2017) is based on numerous assumptions that may not always be valid and which could introduce errors in the κ isolines estimation. Recently, Rastak et al. (2017) concluded that the hygroscopicity should be described using more than a single parameter. In addition, Cain and Pandis (2017) suggested that the hygroscopicity could exhibit a maximum at intermediate volatilities.
The volatility distribution of the OA factors found during the SOAS campaign was estimated using measurements by a thermodenuder coupled with a HR-AMS. Using both the ambient and the thermodenuder data, the same four sources were identified compared to the ambient-only PMF analysis. The four sources were attributed to MO-OOA, LO-OOA, isoprene-OA and BBOA. The contribution, the times series and the mass spectra of each factor were similar to the case of the ambient-only PMF. Using the MFRs and the thermodenuder model of Riipinen et al. (2010), the volatility distribution and the vaporization enthalpy of each factor was estimated assuming an accommodation coefficient of unity.
MO-OOA was significantly more oxygenated than LO-OOA, but, in contrast with previous studies, its MFR was much lower. According to the model, the MO-OOA was less volatile than the LO-OOA and the implausible behavior of the measured MFR was due to their different effective enthalpies of evaporation: 89 ± 10 kJ mol−1 for the MO-OOA and 58 ± 13 kJ mol−1 for the LO-OOA. Isoprene-OA had a similar volatility distribution with MO-OOA, but its vaporization enthalpy was lower at 63 ± 15 kJ mol−1. BBOA had the lowest O : C ratio but it was the least volatile OA component with a vaporization enthalpy of 55 ± 11 kJ mol−1. All factors included components with a wide range of volatilities, both semi-volatile and low volatility. The use of a relatively modest highest temperature (100 ∘C) did not allow the characterization of the least volatile components of the various factors. The above results suggest that variations in the enthalpy of vaporization can introduce significant variability in the links between the measured MFR and the estimated volatility. We strongly recommend the use of higher temperatures in additional steps in future studies.
The contradicting result of the higher MFR of the MO-OOA compared to that of LO-OOA denotes that depending on the study the behavior of the OOA factors can be quite variable. It shows that OOA factors are composed of organic compounds with a wide range of volatility distributions, which may overlap a lot with each other. One possible reason could be the existence of small highly oxygenated molecules. However, the high-resolution time-of-flight aerosol mass spectrometer (HR-ToF-AMS) cannot provide detailed information about the identity of the compounds in each volatility bin and so the use of other chemical analysis techniques is required. The direct comparison of the MFR of OOA factors from different or even from the same study is risky since MFR depends on the TD operation and characteristics, the aerosol size distribution, the volatility, etc. The effective enthalpy of vaporization is a parameter that has to be taken under consideration when we estimate volatility distributions. It may explain why the relationship between MO-OOA and LO-OOA MFR and volatility is complex and the apparent similarity between the MO-OOA and isoprene-OA volatility distributions. However, in the second case the uncertainties of the isoprene-OA volatility distribution for all bins were significant. There are solutions for which the MO-OOA is a lot less volatile than the isoprene-OA. So the measurements in this case are not sufficient to compare the volatilities of the two factors.
The counterintuitive findings of Cerully et al. (2015), that isoprene-OA was more hygroscopic than MO-OOA even though it had a lower O : C ratio but similar volatility distribution, are close but not fully explained by the framework proposed by Nakao (2017). The proposed relationship of Jimenez et al. (2009) may not apply to all environments and especially when multiple aerosol sources and types are present. This suggests that the relationship between the hygroscopicity and the volatility may also be nonlinear. Future studies are necessary for a comprehensive understanding of the relationship between the hygroscopicity, volatility and O : C ratio.
The data from this work are available upon request from Spyros Pandis (spyros@chemeng.upatras.gr).
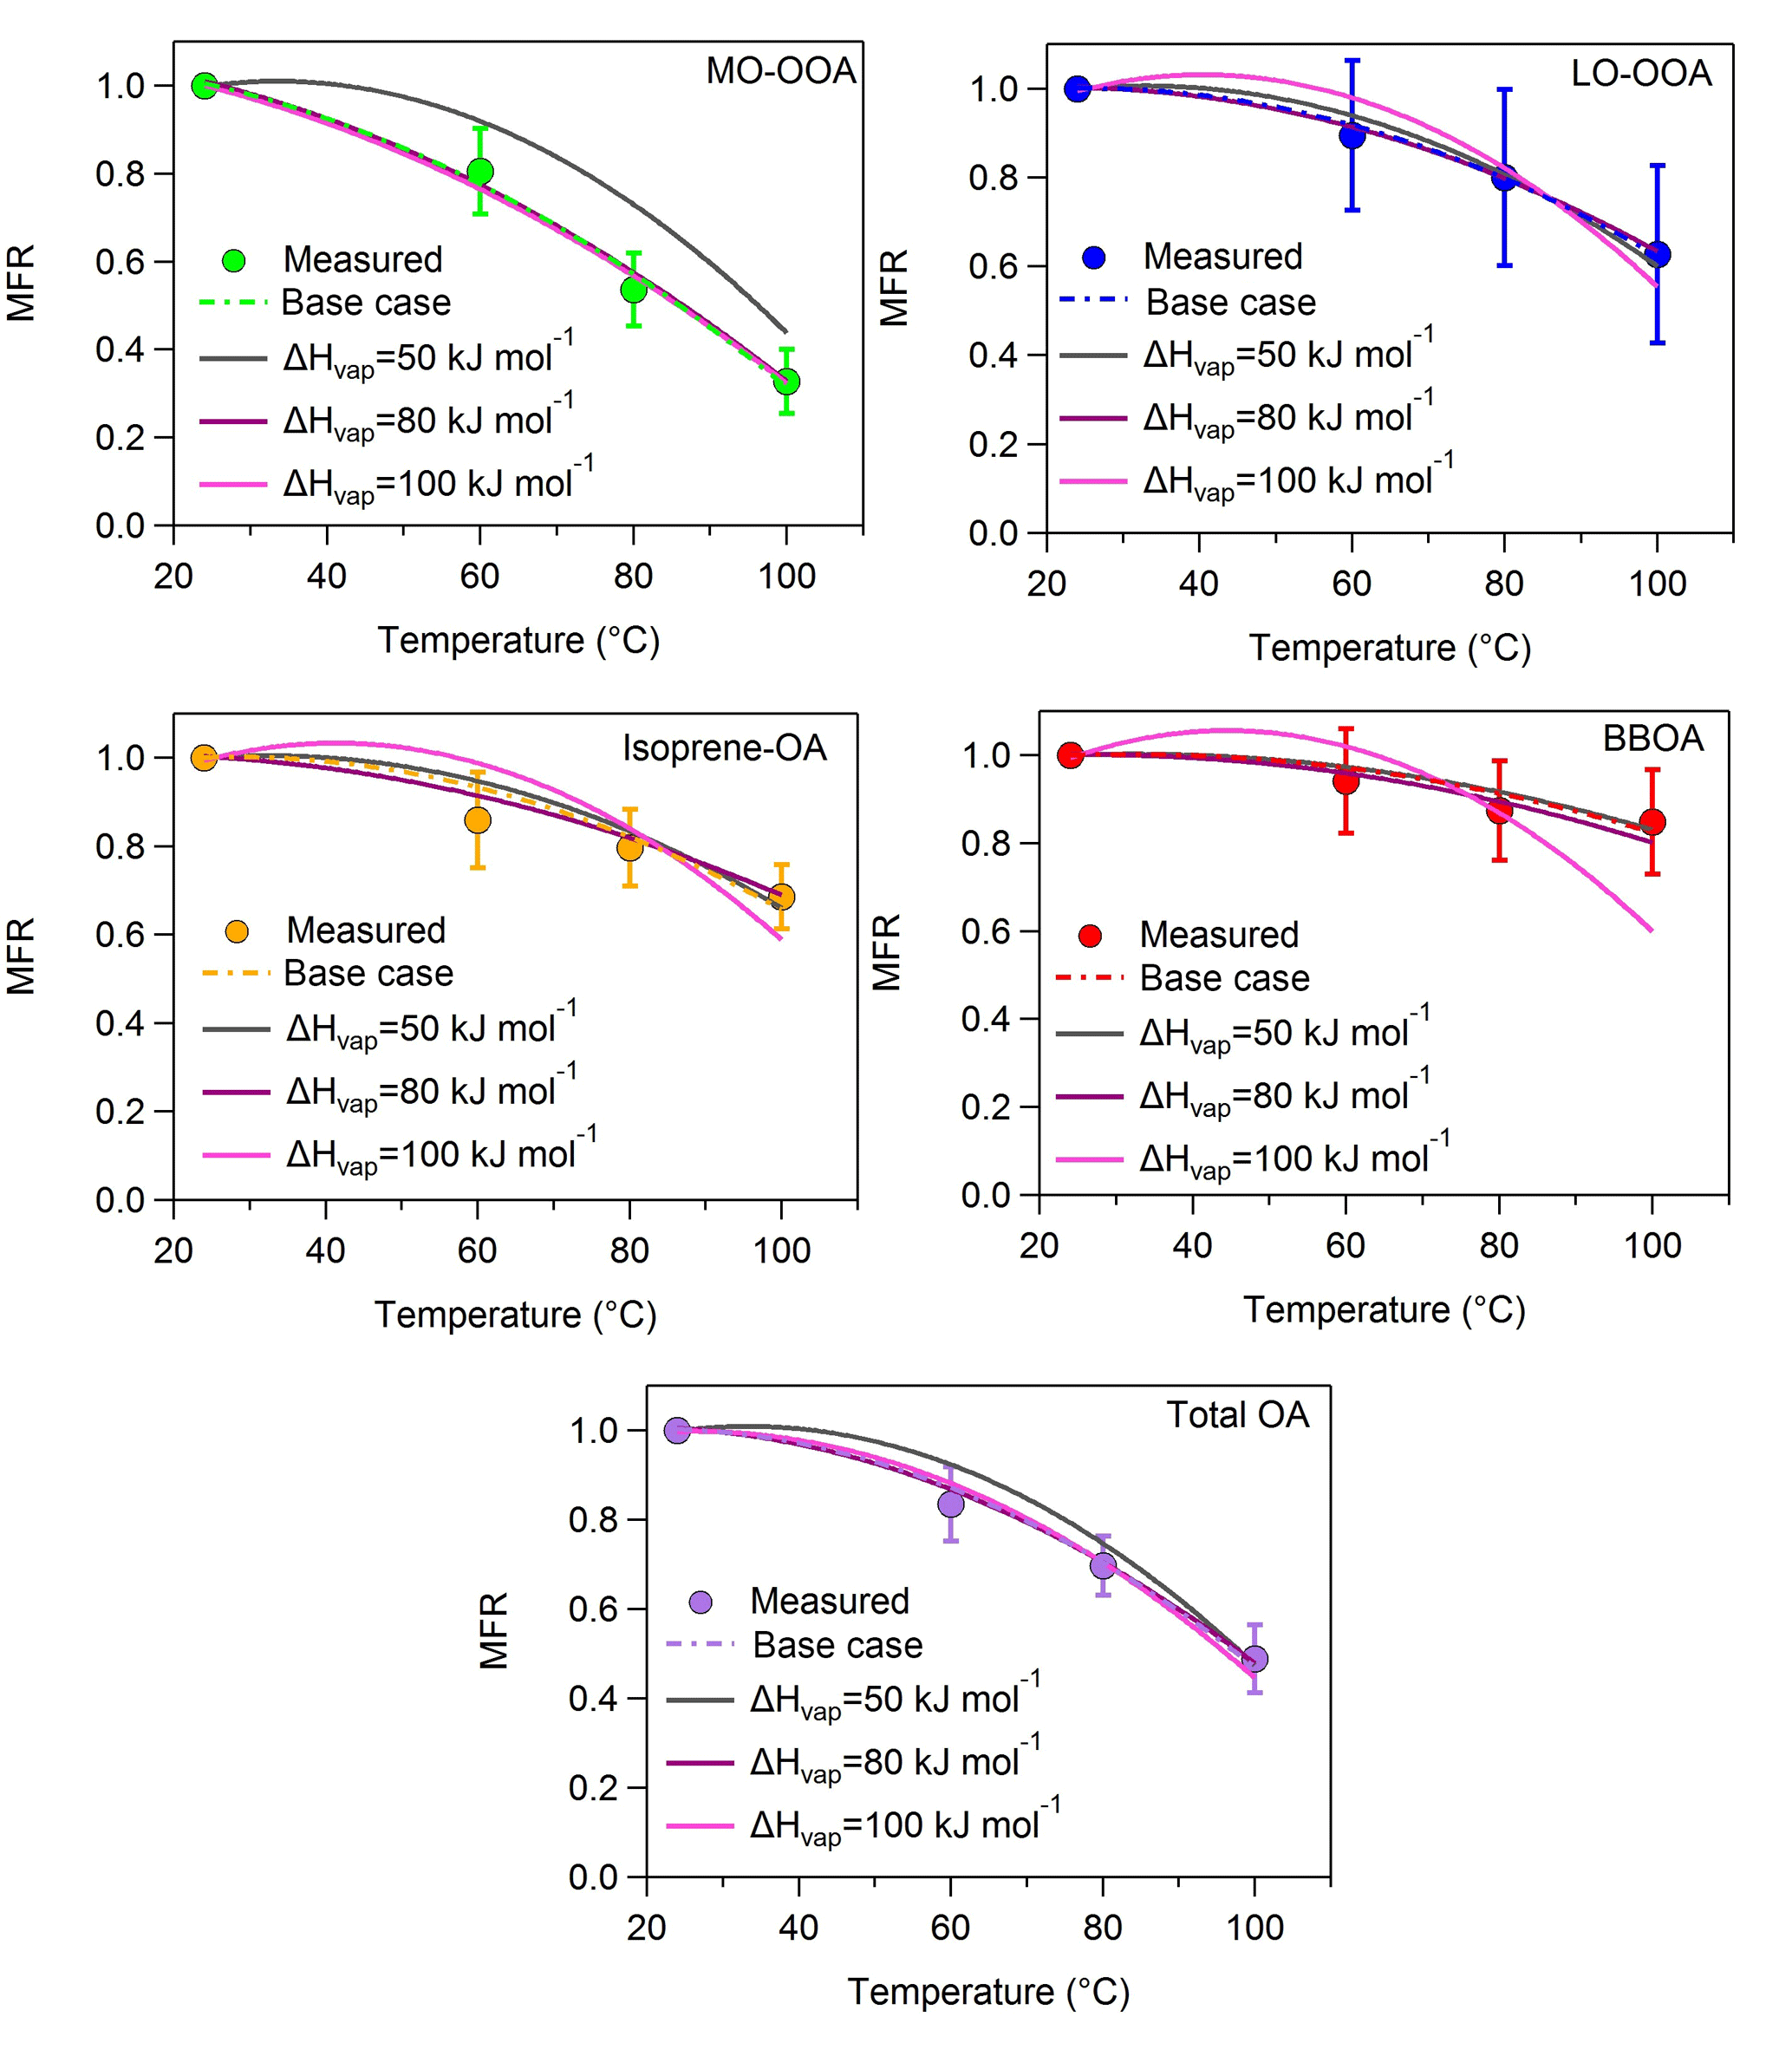
Figure A1MFRs of the loss-corrected PMF OA factors and total OA for fixed values of the vaporization enthalpy. The circles denote the measurements with the 1 standard deviation of the mean, the dash lines correspond to the base case, the grey lines represent the case of a constant ΔHvap of 50 kJ mol−1, the magenta lines stand for the case of a constant ΔHvap of 80 kJ mol−1 and the pink lines correspond to the case of a constant ΔHvap of 100 kJ mol−1.
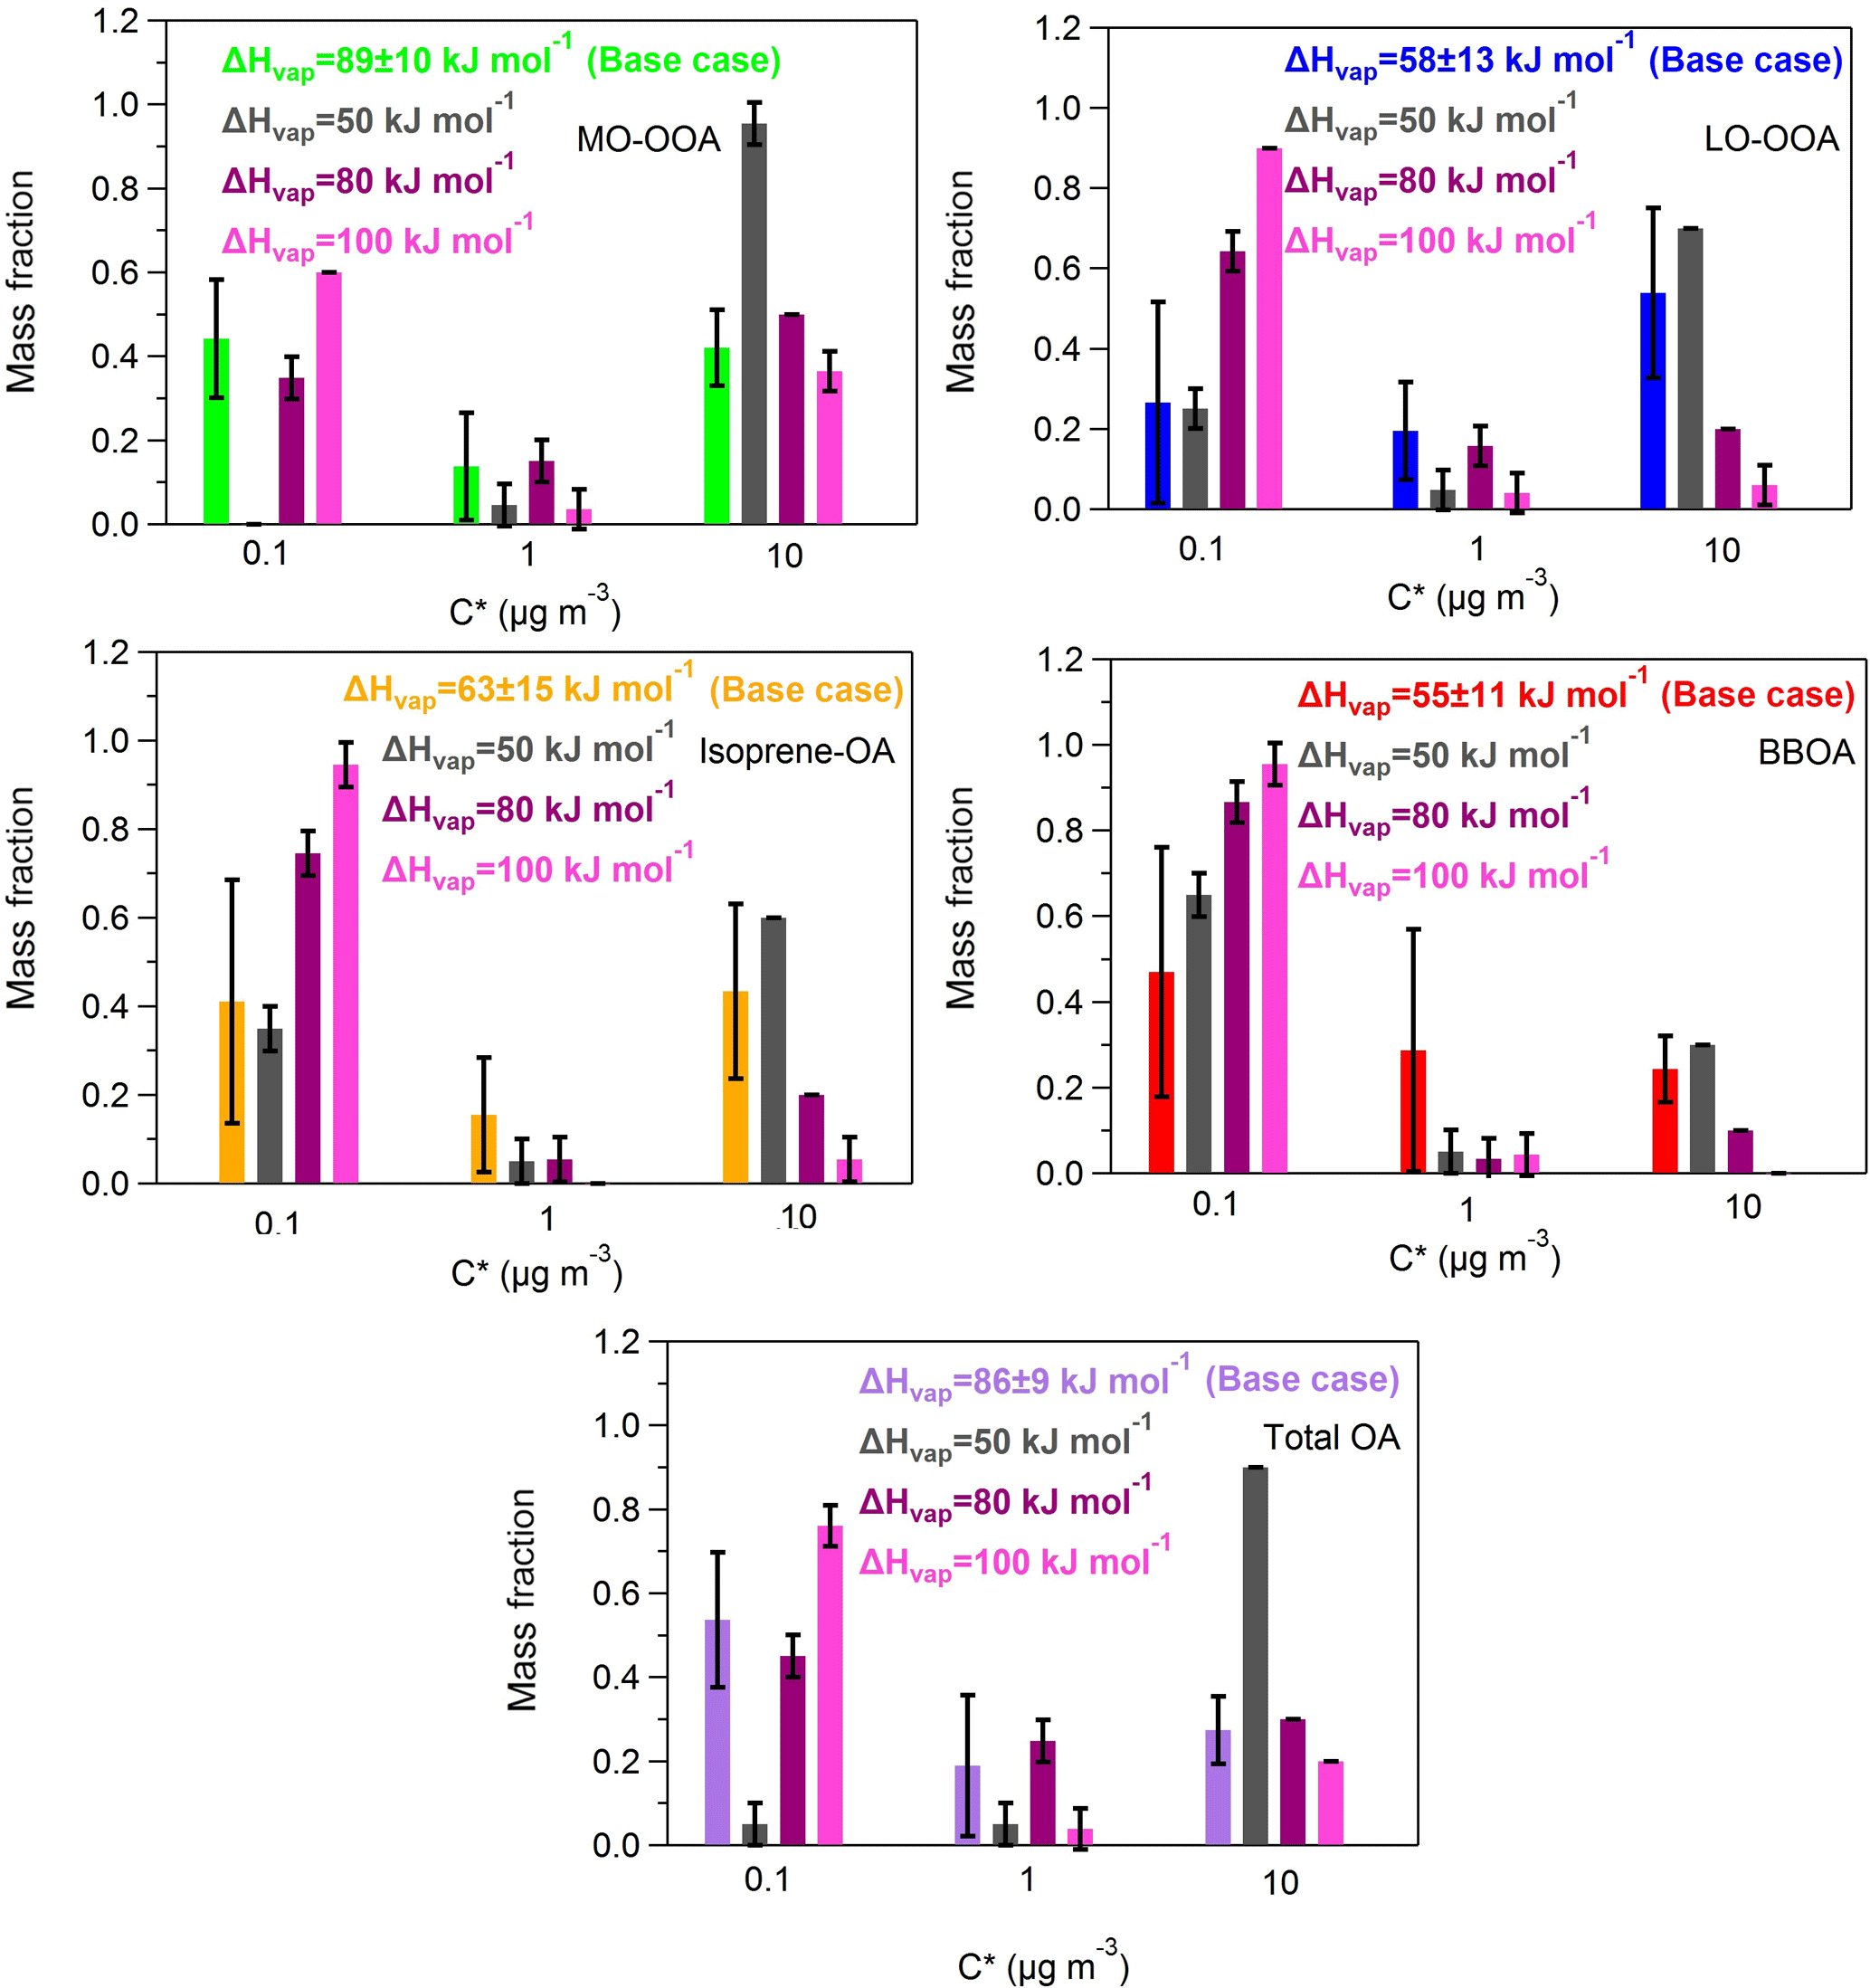
Figure A2Predicted volatility distributions of the OA PMF factors and total OA for fixed vaporization enthalpy. The error bars are estimated using the approach of Karnezi et al. (2014). The grey bars represent the results of a constant ΔHvap of 50 kJ mol−1, the magenta bars correspond to the solution of a constant ΔHvap of 80 kJ mol−1 and the pink bars are the results for the case of a constant ΔHvap of 100 kJ mol−1. The green, blue, orange, red and purple bars stand for the base case solutions of MO-OOA, LO-OOA, isoprene-OA, BBOA and total OA.
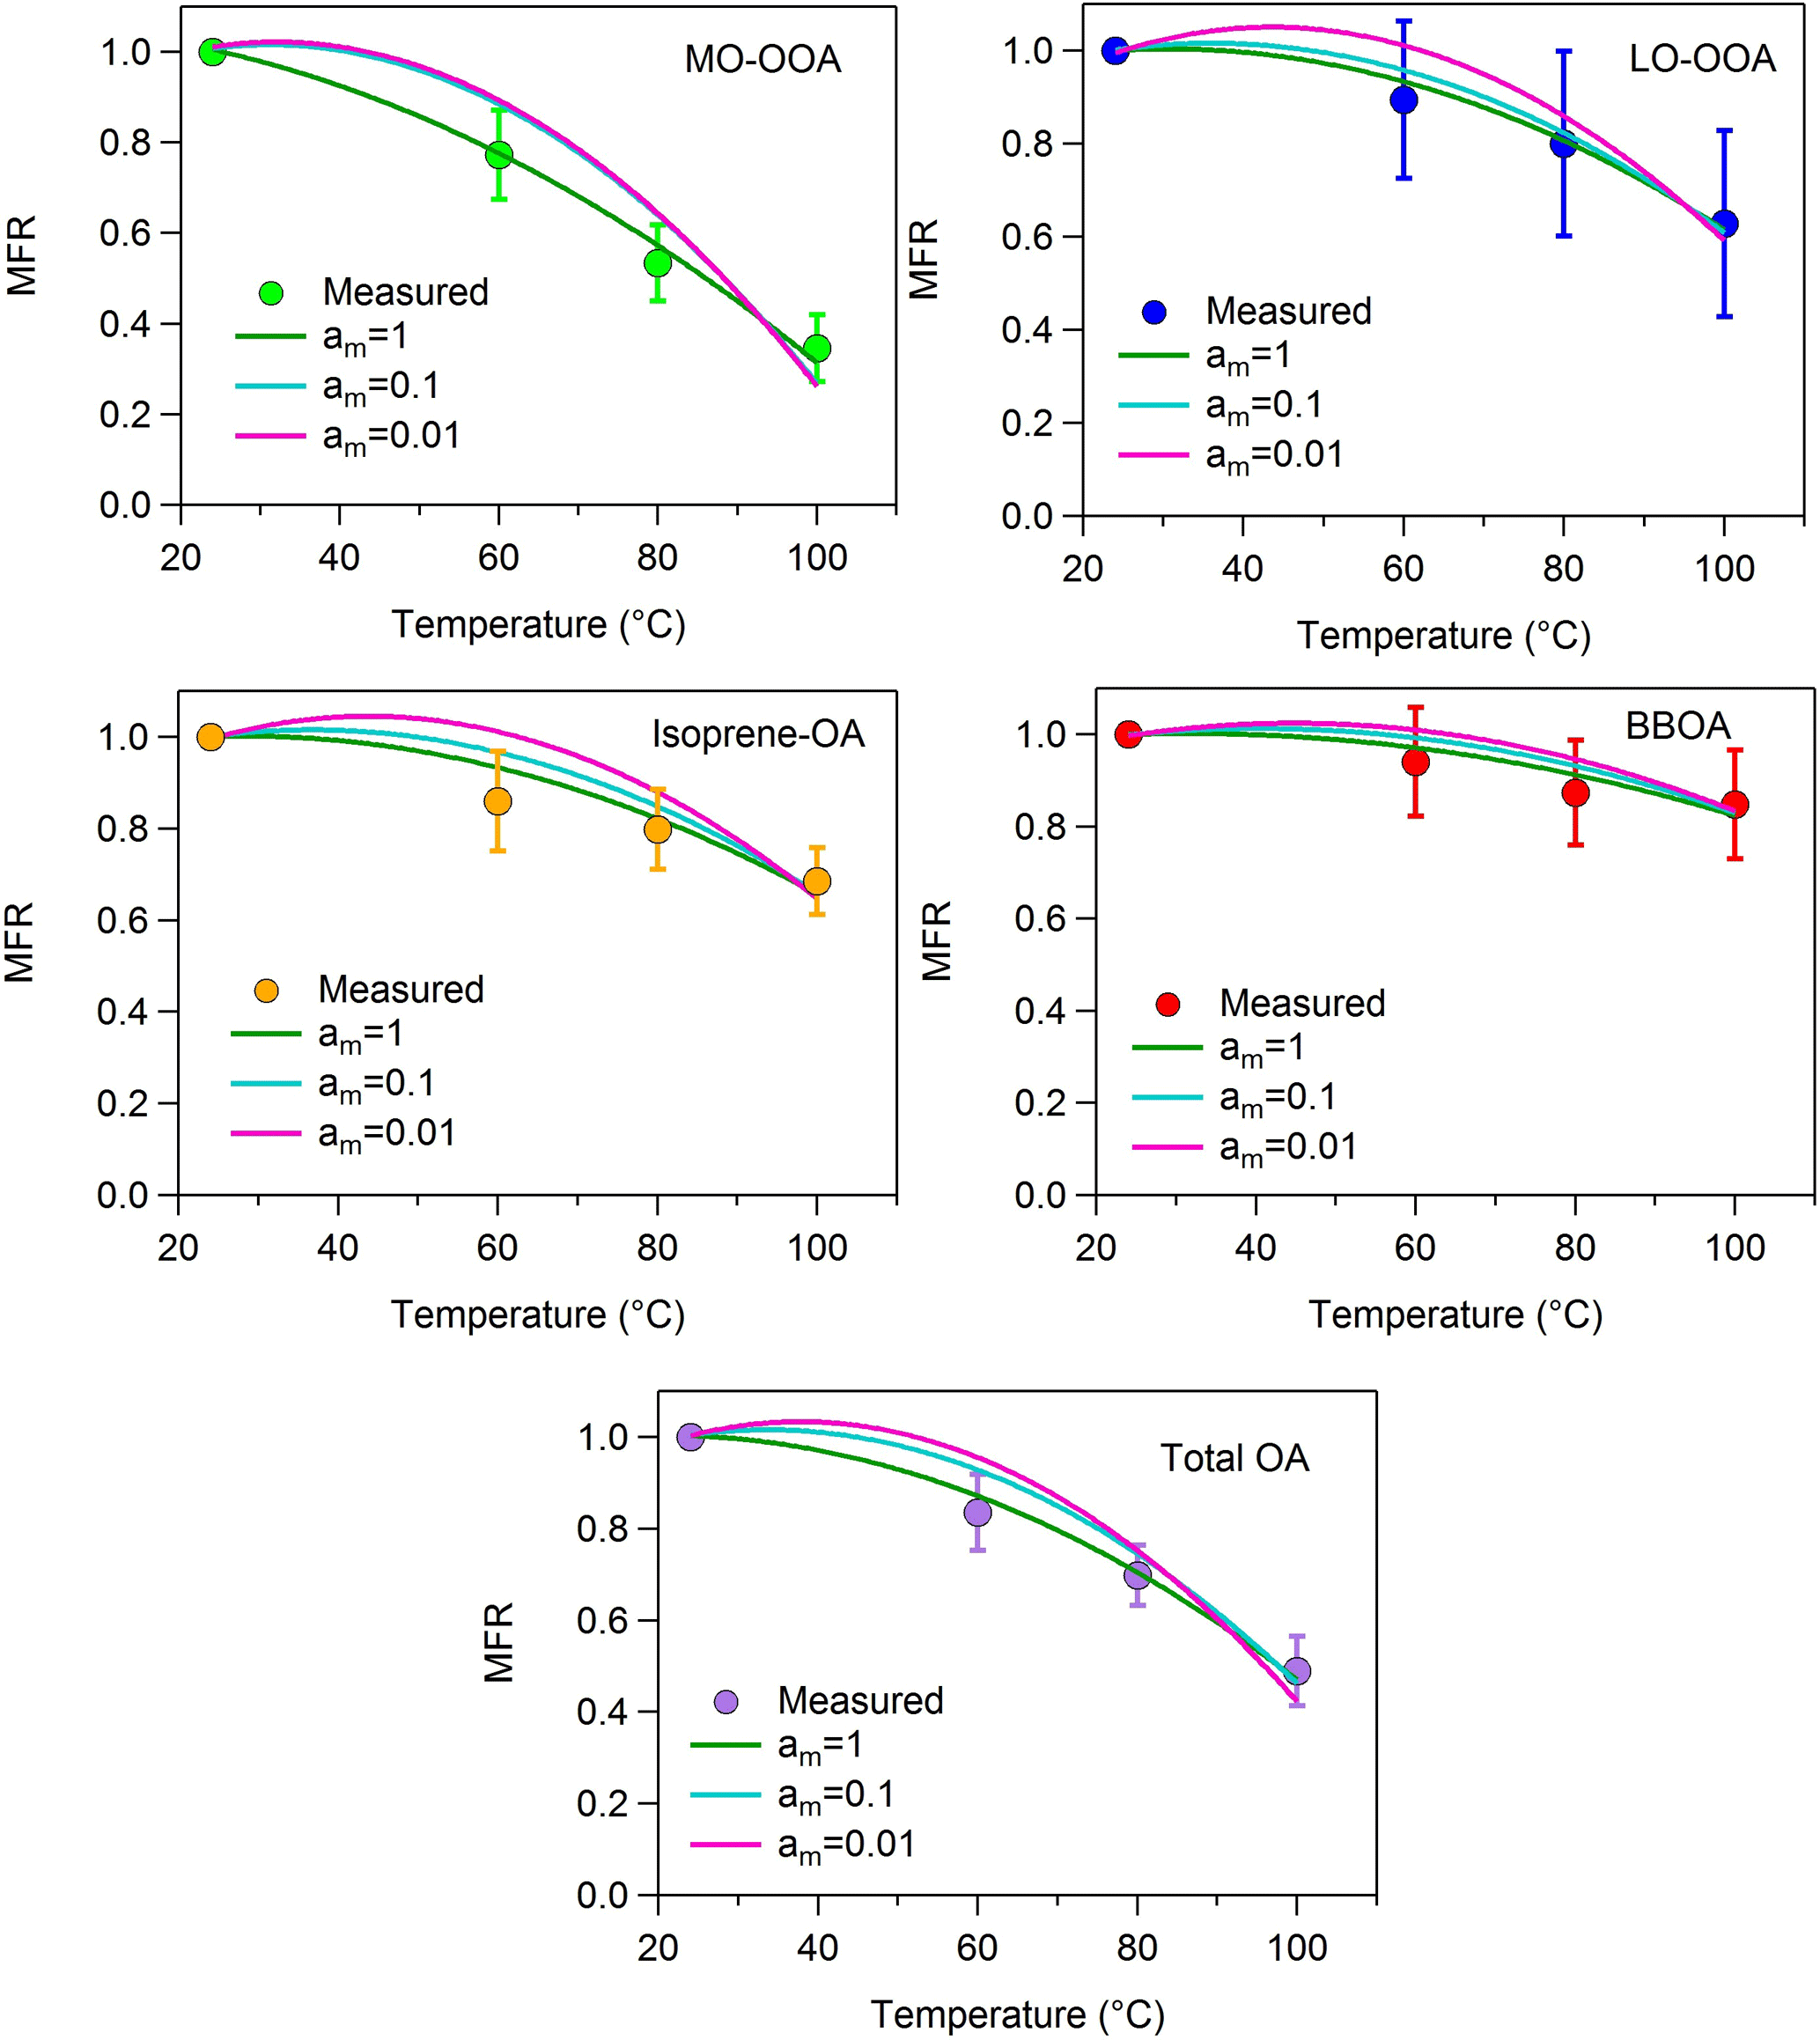
Figure A3MFRs of the loss-corrected PMF OA factors and total OA. The circles denote the measurements with the 1 standard deviation of the mean, the green lines represent the best-predicted MFR for am=1 (base case), the cyan lines correspond to the best-predicted MFR for am=0.1 and the pink lines stand for the predicted MFR for am=0.01.
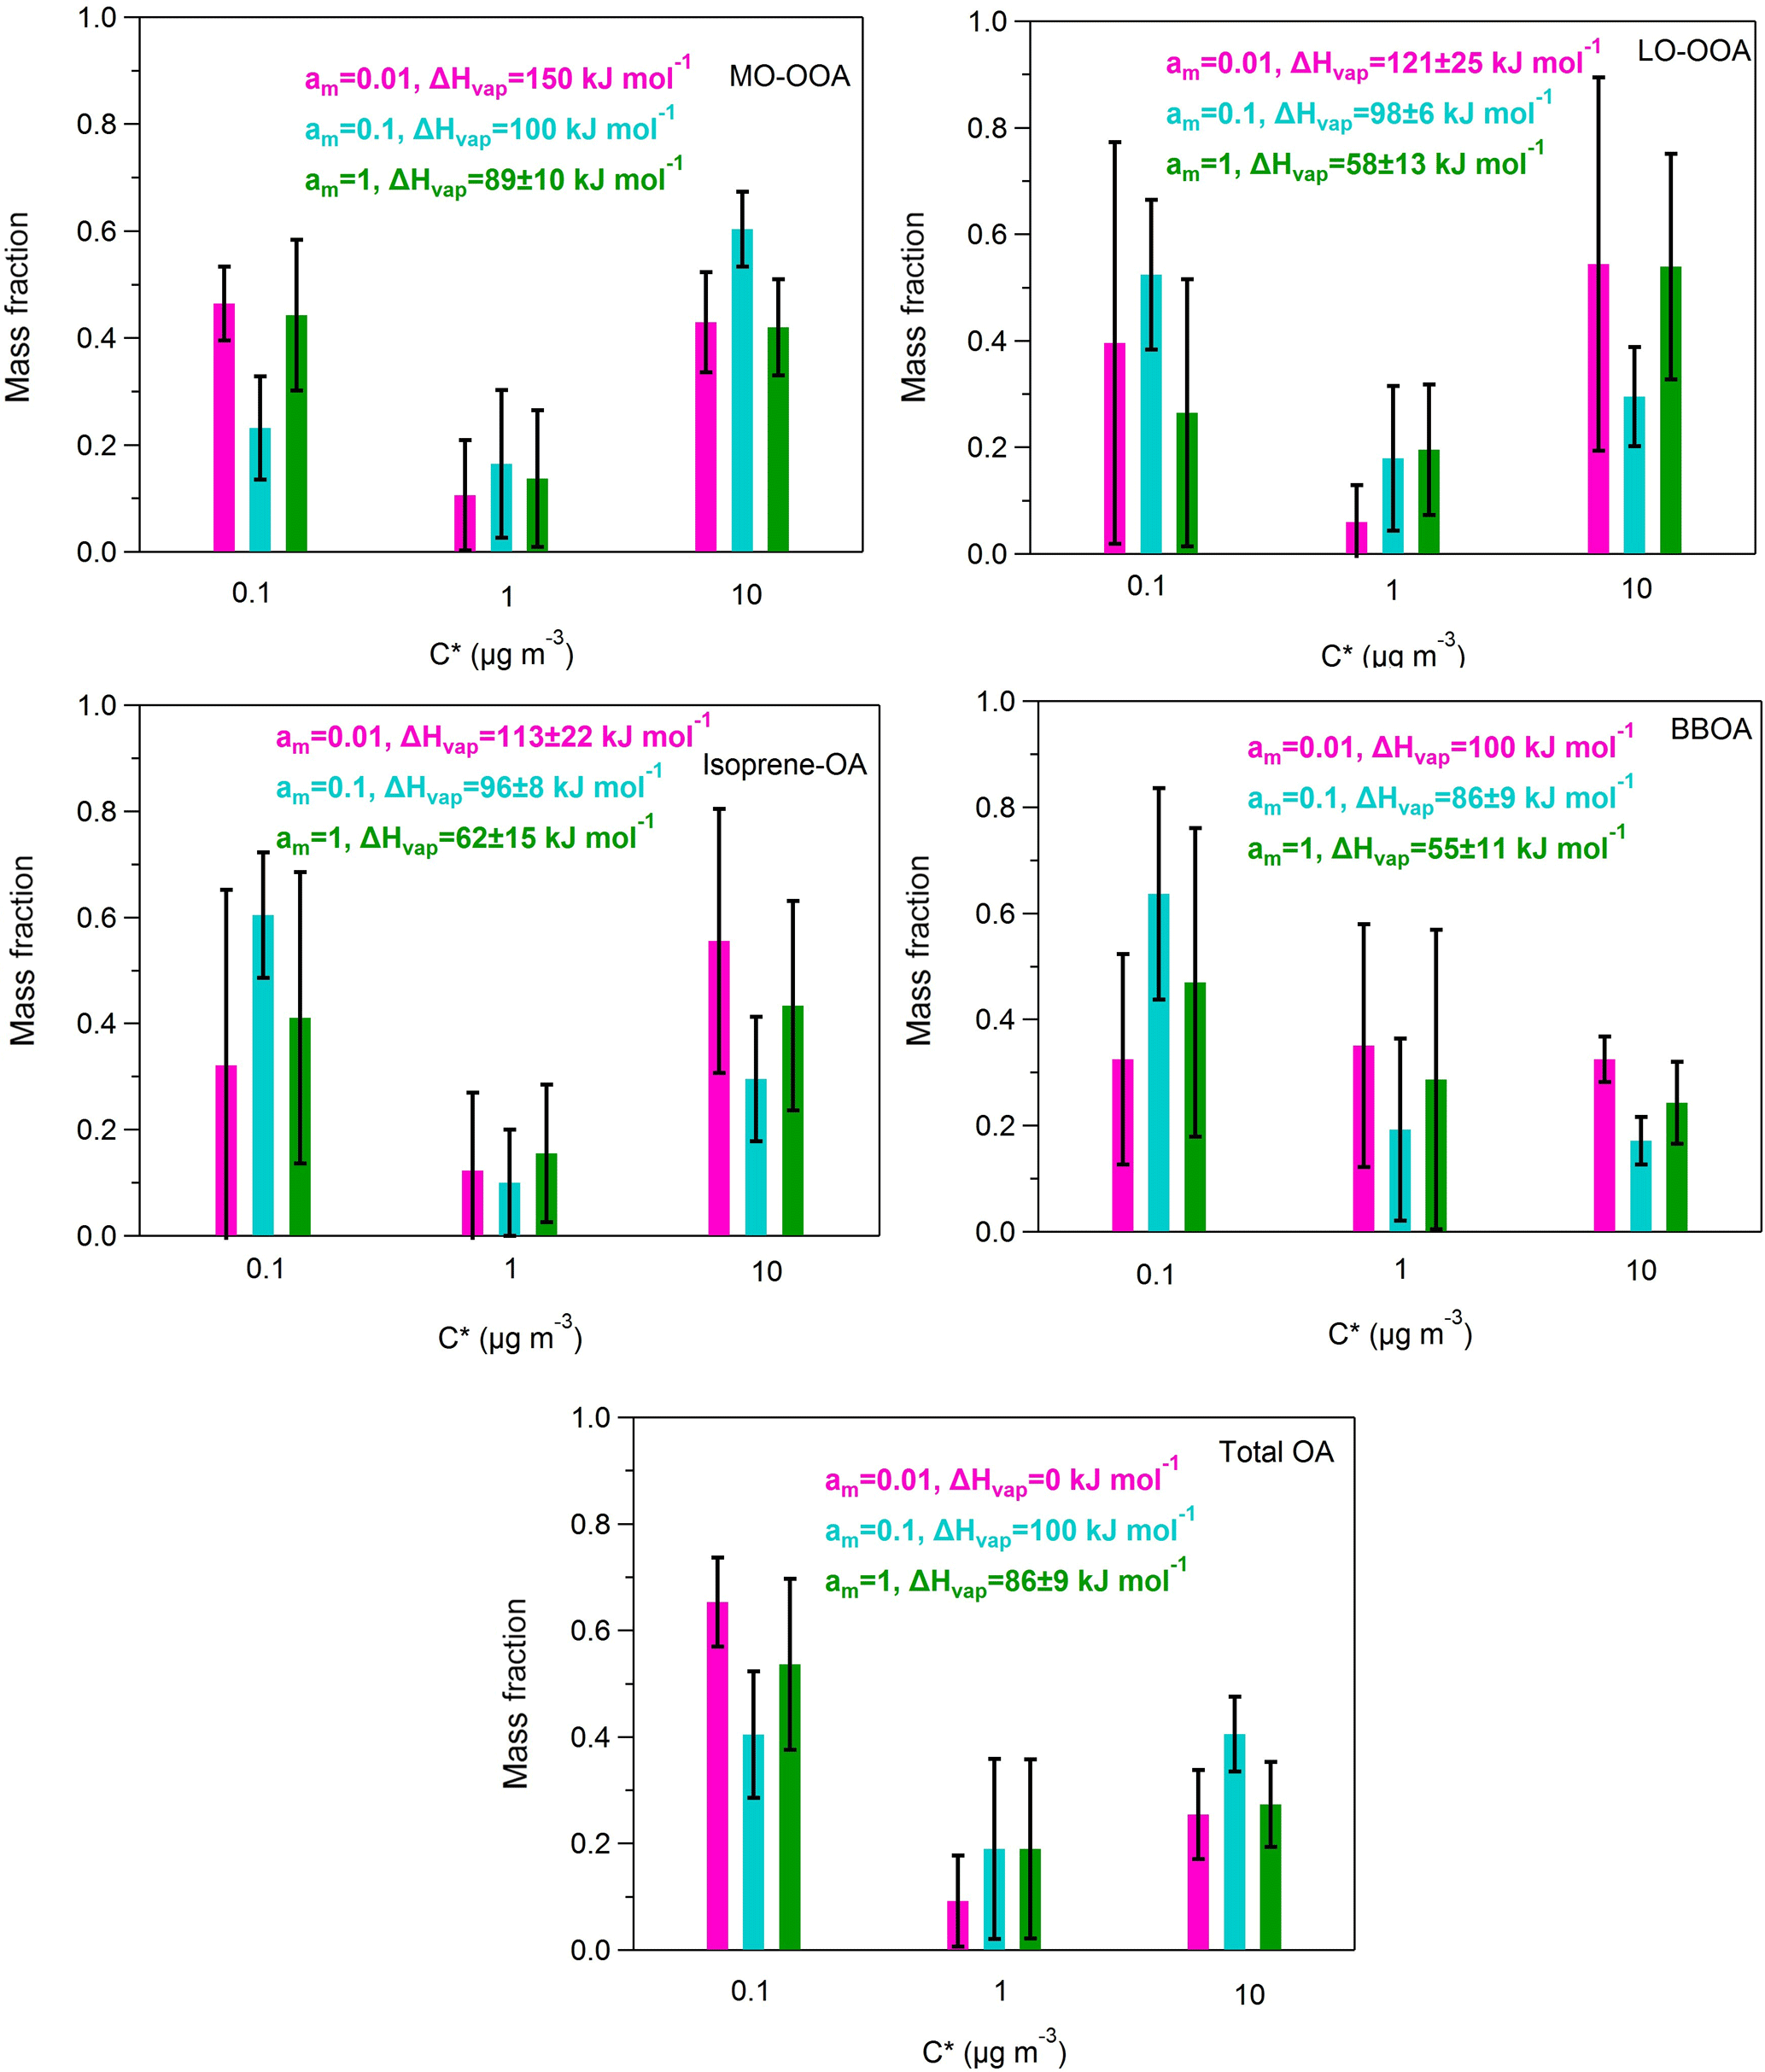
Figure A4Predicted volatility distributions of the OA PMF factors and total OA. The error bars are estimated using the approach of Karnezi et al. (2014). The green bars represent the results for am=1 (base case), the cyan bars correspond to the solution for am=0.1 and the pink bars are the results for am=0.01.
The supplement related to this article is available online at: https://doi.org/10.5194/acp-18-5799-2018-supplement.
The authors declare that they have no conflict of interest.
This work was funded by the National Oceanic and Atmospheric Administration
CPO Award NA10OAR4310102 and the US Environmental Protection Agency
(EPA-STAR) through grants RD-835410 and RD-835405. This research was also
supported by the European Research Council Project PyroTRACH (Pyrogenic
TRansformations Affecting Climate and Health) grant agreement 726165.
Athanasios Nenes, Lu Xu, and Nga L. Ng acknowledge support from an NSF grant
(1242258). Lu Xu and Nga L. Ng acknowledge support from EPA STAR grant
RD-83540301. The authors acknowledge the Atmospheric Research and Analysis
Institute (ARA) for providing meteorological and gas-phase species data. The
contents of this publication are solely the responsibility of the authors and
do not necessarily represent the official views of the US EPA. Further, the
US EPA does not endorse the purchase of any commercial products or services
mentioned in the publication. Edited by: Manabu
Shiraiwa
Reviewed by: two anonymous referees
Aiken, A. C., DeCarlo, P. F., Kroll, J. H., Worsnop, D. R., Huffman, J. A., Docherty, K., Ulbrich, I. M., Mohr, C., Kimmel, J. R., Sueper, D., Zhang, Q., Sun, Y., Trimborn, A., Northway, M., Ziemann, P. J., Canagaratna, M. R., Onasch, T. B., Alfarra, R., Prévôt, A. S. H., Dommen, J., Duplissy, J., Metzger, A., Baltensperger,U., and Jimenez, J. L.: O/C and OM/OC ratios of primary, secondary, and ambient organic aerosols with High Resolution Time-of-Flight Aerosol Mass Spectrometry, Environ. Sci. Tech., 42, 4478–4485, 2008.
Aiken, A. C., Salcedo, D., Cubison, M. J., Huffman, J. A., DeCarlo, P. F., Ulbrich, I. M., Docherty, K. S., Sueper, D., Kimmel, J. R., Worsnop, D. R., Trimborn, A., Northway, M., Stone, E. A., Schauer, J. J., Volkamer, R. M., Fortner, E., de Foy, B., Wang, J., Laskin, A., Shutthanandan, V., Zheng, J., Zhang, R., Gaffney, J., Marley, N. A., Paredes-Miranda, G., Arnott, W. P., Molina, L. T., Sosa, G., and Jimenez, J. L.: Mexico City aerosol analysis during MILAGRO using high resolution aerosol mass spectrometry at the urban supersite (T0) – Part 1: Fine particle composition and organic source apportionment, Atmos. Chem. Phys., 9, 6633–6653, https://doi.org/10.5194/acp-9-6633-2009, 2009.
An, W. J., Pathak, R. K., Lee, B. H., and Pandis, S. N.: Aerosol volatility measurement using an improved thermodenuder: Application to secondary organic aerosol, J. Aerosol Sci., 38, 305–314, 2007.
Asa-Awuku, A., Engelhart, G. J., Lee, B. H., Pandis, S. N., and Nenes, A.: Relating CCN activity, volatility, and droplet growth kinetics of β-caryophyllene secondary organic aerosol, Atmos. Chem. Phys., 9, 795–812, https://doi.org/10.5194/acp-9-795-2009, 2009.
Bretti, C., Crea, F., Foti, C., and Sammartano, S.: Solubility and activity coefficients of acidic and basic nonelectrolytes in aqueous salt solutions. 2. Solubility and activity coefficients of suberic, azelaic, and sebacic acids in NaCl(aq), (CH3)4NCl(aq), and (C2H5)4NI(aq) at different ionic strengths and at t = 25 ∘C, J. Chem. Eng. Data, 51, 1660–1667, 2006.
Budisulistiorini, S. H., Canagaratna, M. R., Croteau, P. L., Marth, W. J., Baumann, K., Edgerton, E. S., Shaw, S. L., Knipping, E. M., Worsnop, D. R., Jayne, J. T., Gold, A., and Surratt, J. D.: Real-time continuous characterization of secondary organic aerosol derived from isoprene epoxydiols in downtown Atlanta, Georgia, using the Aerodyne aerosol chemical speciation monitor, Environ. Sci. Technol., 47, 5686–5694, 2013.
Budisulistiorini, S. H., Nenes, A., Carlton, A. G., Surratt, J. D., McNeill, V. F., and Pye, H. O. T.: Simulating aqueous-phase Isoprene-Epoxydiol (IEPOX) secondary organic aerosol production during the 2013 Southern Oxidant and Aerosol Study (SOAS), Environ. Sci. Tech., 51, 5026–5034, 2017.
Burtscher, H., Baltensperger, U., Bukowiecki, N., Cohn, P., Huglin, C., Mohr, M., Matter, U., Nyeki S., Schmatloch V., Streit, N., and Weingartner, E.: Separation of volatile and non-volatile aerosol fractions by thermodesorption: Instrumental development and applications, J. Aerosol Sci., 32, 427–442, 2001.
Cain, K. P. and Pandis, S. N.: A technique for the measurement of organic aerosol hygroscopicity, oxidation level, and volatility distributions, Atmos. Meas. Tech., 10, 4865–4876, https://doi.org/10.5194/amt-10-4865-2017, 2017.
Canagaratna, M. R., Jimenez, J. L., Kroll, J. H., Chen, Q., Kessler, S. H., Massoli, P., Hildebrandt Ruiz, L., Fortner, E., Williams, L. R., Wilson, K. R., Surratt, J. D., Donahue, N. M., Jayne, J. T., and Worsnop, D. R.: Elemental ratio measurements of organic compounds using aerosol mass spectrometry: characterization, improved calibration, and implications, Atmos. Chem. Phys., 15, 253–272, https://doi.org/10.5194/acp-15-253-2015, 2015.
Cappa, C. D. and Jimenez, J. L.: Quantitative estimates of the volatility of ambient organic aerosol, Atmos. Chem. Phys., 10, 5409–5424, https://doi.org/10.5194/acp-10-5409-2010, 2010.
Carlton, A. G., de Gouw, J., Jimenez, J. L., Ambrose, J. L., Attwood, A. R., Brown, S., Baker, K. R., Brock, C., Cohen, R. C., Edgerton, S., Farkas, C., Farmer, D., Goldstein, A. H., Gratz, L., Guenther, A., Hunt, S., Jaeglé, L., Jaffe, D. A., Mak, J., McClure, C., Nenes, A., Nguyen, T. K., Pierce, J. R., de Sa, S., Selin, N. E., Shah, V., Shaw, S., Shepson, P. B., Song, S., Stutz, J., Surratt, J., Turpin, B. J., Warneke, C., Washenfelder, R. A., Wennberg, P. O., and Zhou, X.: Synthesis of the Southeast Atmosphere Studies: Investigating Fundamental Atmospheric Chemistry Questions, B. Am. Meteor. Soc., 99, 547–567, 2018.
Cerully, K. M., Hite, J., McLaughlin, M., and Nenes, A.: Towards the determination of joint volatility-hygroscopicity distributions: instrument development and response characterization for single-component aerosol, Aerosol. Sci. Tech., 48, 296–312, 2014.
Cerully, K. M., Bougiatioti, A., Hite Jr., J. R., Guo, H., Xu, L., Ng, N. L., Weber, R., and Nenes, A.: On the link between hygroscopicity, volatility, and oxidation state of ambient and water-soluble aerosols in the southeastern United States, Atmos. Chem. Phys., 15, 8679–8694, https://doi.org/10.5194/acp-15-8679-2015, 2015.
Chang, R. Y.-W., Slowik, J. G., Shantz, N. C., Vlasenko, A., Liggio, J., Sjostedt, S. J., Leaitch, W. R., and Abbatt, J. P. D.: The hygroscopicity parameter (κ) of ambient organic aerosol at a field site subject to biogenic and anthropogenic influences: relationship to degree of aerosol oxidation, Atmos. Chem. Phys., 10, 5047–5064, https://doi.org/10.5194/acp-10-5047-2010, 2010.
Chen, N. H. and Othmer, D. F.: New generalized equation for gas diffusion coefficient, J. Chem. Eng. Data, 7, 37–41, 1962.
Chen, Q., Farmer, D. K., Rizzo, L. V., Pauliquevis, T., Kuwata, M., Karl, T. G., Guenther, A., Allan, J. D., Coe, H., Andreae, M. O., Pöschl, U., Jimenez, J. L., Artaxo, P., and Martin, S. T.: Submicron particle mass concentrations and sources in the Amazonian wet season (AMAZE-08), Atmos. Chem. Phys., 15, 3687–3701, https://doi.org/10.5194/acp-15-3687-2015, 2015.
Cohen, A. J., Brauer, M., Burnett, R., Anderson, H. R., Frostad, J., Estep, K., Balakrishnan, K., Brunekreef, B., Dandona, L., Dandona, R., Feigin, V., Freedman, G., Hubbell, B., Jobling, A., Kan, H., Knibbs, L., Liu, Y., Martin, R., Morawska, L., Pope III,C. A., Shin, H., Straif, K., Shaddick, G., Thomas, M., van Dingenen, R., van Donkelaar, A., Vos, T., Murray, C. J. L., and Forouzanfar, M. F.: Estimates and 25-year trends of the global burden of disease attributable to ambient air pollution: an analysis of data from the Global Burden of Diseases Study 2015, The Lancet, 389, 1907–1918, 2017.
Crippa, M., DeCarlo, P. F., Slowik, J. G., Mohr, C., Heringa, M. F., Chirico, R., Poulain, L., Freutel, F., Sciare, J., Cozic, J., Di Marco, C. F., Elsasser, M., Nicolas, J. B., Marchand, N., Abidi, E., Wiedensohler, A., Drewnick, F., Schneider, J., Borrmann, S., Nemitz, E., Zimmermann, R., Jaffrezo, J.-L., Prévôt, A. S. H., and Baltensperger, U.: Wintertime aerosol chemical composition and source apportionment of the organic fraction in the metropolitan area of Paris, Atmos. Chem. Phys., 13, 961–981, https://doi.org/10.5194/acp-13-961-2013, 2013.
DeCarlo, P. F., Kimmel, J. R., Trimborn, A., Northway, M. J., Jayne, J. T., Aiken, A. C., Gonin, M., Fuhrer, K., Horvath, T., Docherty, K., Worsnop, D. R., and Jimenez, J. L.: Field-Deployable, High-Resolution, Time-of-Flight Aerosol Mass Spectrometer, Anal. Chem., 78, 8281–8289, 2006.
Donahue, N. M., Robinson, A. L., Stanier, C. O., and Pandis, S. N.: Coupled Partitioning, Dilution, and Chemical Aging of Semivolatile Organics, Environ. Sci. Tech., 40, 2635–2643, 2006.
Donahue, N. M., Kroll, J. H., Pandis, S. N., and Robinson, A. L.: A two-dimensional volatility basis set – Part 2: Diagnostics of organic-aerosol evolution, Atmos. Chem. Phys., 12, 615–634, https://doi.org/10.5194/acp-12-615-2012, 2012.
Faulhaber, A. E., Thomas, B. M., Jimenez, J. L., Jayne, J. T., Worsnop, D. R., and Ziemann, P. J.: Characterization of a thermodenuder-particle beam mass spectrometer system for the study of organic aerosol volatility and composition, Atmos. Meas. Tech., 2, 15–31, https://doi.org/10.5194/amt-2-15-2009, 2009.
Florou, K., Papanastasiou, D. K., Pikridas, M., Kaltsonoudis, C., Louvaris, E., Gkatzelis, E., Patoulias, D., Mihalopoulos, N., and Pandis, S. N.: The contribution of wood burning and other pollution sources to wintertime organic aerosol levels in two Greek cities, Atmos. Chem. Phys., 17, 3145–3163, https://doi.org/10.5194/acp-17-3145-2017, 2017.
Frosch, M., Bilde, M., Nenes, A., Praplan, A. P., Jurányi, Z., Dommen, J., Gysel, M., Weingartner, E., and Baltensperger, U.: CCN activity and volatility of β-caryophyllene secondary organic aerosol, Atmos. Chem. Phys., 13, 2283–2297, https://doi.org/10.5194/acp-13-2283-2013, 2013.
Fuchs, N. A. and Sutugin, A. G.: Highly Dispersed Aerosols. Ann Arbor Science Publishers, Ann Arbor, London, p. 105, 1970.
Guo, H., Xu, L., Bougiatioti, A., Cerully, K. M., Capps, S. L., Hite Jr., J. R., Carlton, A. G., Lee, S.-H., Bergin, M. H., Ng, N. L., Nenes, A., and Weber, R. J.: Fine-particle water and pH in the southeastern United States, Atmos. Chem. Phys., 15, 5211–5228, https://doi.org/10.5194/acp-15-5211-2015, 2015.
Hallquist, M., Wenger, J. C., Baltensperger, U., Rudich, Y., Simpson, D., Claeys, M., Dommen, J., Donahue, N. M., George, C., Goldstein, A. H., Hamilton, J. F., Herrmann, H., Hoffmann, T., Iinuma, Y., Jang, M., Jenkin, M. E., Jimenez, J. L., Kiendler-Scharr, A., Maenhaut, W., McFiggans, G., Mentel, Th. F., Monod, A., Prévôt, A. S. H., Seinfeld, J. H., Surratt, J. D., Szmigielski, R., and Wildt, J.: The formation, properties and impact of secondary organic aerosol: current and emerging issues, Atmos. Chem. Phys., 9, 5155–5236, https://doi.org/10.5194/acp-9-5155-2009, 2009.
Hu, W., Palm, B. B., Day, D. A., Campuzano-Jost, P., Krechmer, J. E., Peng, Z., de Sá, S. S., Martin, S. T., Alexander, M. L., Baumann, K., Hacker, L., Kiendler-Scharr, A., Koss, A. R., de Gouw, J. A., Goldstein, A. H., Seco, R., Sjostedt, S. J., Park, J.-H., Guenther, A. B., Kim, S., Canonaco, F., Prévôt, A. S. H., Brune, W. H., and Jimenez, J. L.: Volatility and lifetime against OH heterogeneous reaction of ambient isoprene-epoxydiols-derived secondary organic aerosol (IEPOX-SOA), Atmos. Chem. Phys., 16, 11563–11580, https://doi.org/10.5194/acp-16-11563-2016, 2016.
Huffman, J. A., Docherty, K. S., Aiken, A. C., Cubison, M. J., Ulbrich, I. M., DeCarlo, P. F., Sueper, D., Jayne, J. T., Worsnop, D. R., Ziemann, P. J., and Jimenez, J. L.: Chemically-resolved aerosol volatility measurements from two megacity field studies, Atmos. Chem. Phys., 9, 7161–7182, https://doi.org/10.5194/acp-9-7161-2009, 2009.
IARC (International Agency for Research on Cancer), Outdoor Air Pollution, IARC Monogr. Eval. Carcinog. Risks Hum., 109, 1–454, 2016.
IPCC (Intergovernmental Panel on Climate Change): Climate change 2013: The Physical Science Basis, Cambridge University Press, Cambridge, 2013.
Jimenez, J. L., Canagaratna, M. R., Donahue, N. M., Prevot, A. S. H., Zhang, Q., Kroll, J. H., DeCarlo, P. F., Allan, J. D., Coe, H., Ng, N. L., Aiken, A. C., Docherty, K. D., Ulbrich, I. M., Grieshop, A. P., Robinson, A. L., Duplissy, J., Smith, J. D., Wilson, K. R., Lanz, V. A., Hueglin, C., Sun, Y. L., Tian, J., Laaksonen, A., Raatikainen, T., Rautiainen, J., Vaattovaara, P., Ehn, M., Kulmala, M., Tomlinson, J. M., Collins, D. R., Cubison, M. J., Dunlea, E. J., Huffman, J. A., Onasch, T. B., Alfarra, M. R., Williams, P. I., Bower, K., Kondo, Y., Schneider, J., Drewnick, F., Borrmann, S., Weimer, S., Demerjian, K., Salcedo, D., Cottrell, L., Griffin, R., Takami, A., Miyoshi, T., Hatakeyama, S., Shimono, A., Sun, J. Y., Zhang, Y. M., Dzepina, K., Kimmel, J. R., Sueper, D., Jayne, J. T., Herndon, S. C., Trimborn, A. M., Williams, L. R.,Wood, E. C., Kolb, C. E., Baltensperger, U., and Worsnop, D. R.: Evolution of organic aerosols in the atmosphere, Science, 326, 1525–1529, 2009.
Kanakidou, M., Seinfeld, J. H., Pandis, S. N., Barnes, I., Dentener, F. J., Facchini, M. C., Van Dingenen, R., Ervens, B., Nenes, A., Nielsen, C. J., Swietlicki, E., Putaud, J. P., Balkanski, Y., Fuzzi, S., Horth, J., Moortgat, G. K., Winterhalter, R., Myhre, C. E. L., Tsigaridis, K., Vignati, E., Stephanou, E. G., and Wilson, J.: Organic aerosol and global climate modelling: a review, Atmos. Chem. Phys., 5, 1053–1123, https://doi.org/10.5194/acp-5-1053-2005, 2005.
Karnezi, E., Riipinen, I., and Pandis, S. N.: Measuring the atmospheric organic aerosol volatility distribution: a theoretical analysis, Atmos. Meas. Tech., 7, 2953–2965, https://doi.org/10.5194/amt-7-2953-2014, 2014.
Kostenidou, E., Florou, K., Kaltsonoudis, C., Tsiflikiotou, M., Vratolis, S., Eleftheriadis, K., and Pandis, S. N.: Sources and chemical characterization of organic aerosol during the summer in the eastern Mediterranean, Atmos. Chem. Phys., 15, 11355–11371, https://doi.org/10.5194/acp-15-11355-2015, 2015.
Kostenidou, E., Karnezi, E., Kolodziejczyk, A., Szmigielski, R., and Pandis, S. N.: Physical and chemical properties of 3-methyl-1,2,3-butanetricarboxylic acid (MBTCA) aerosol, Environ. Sci. Tech., 52, 1150–1155, 2018.
Kuwata, M., Kondo, Y., Mochida, M., Takegawa, N., and Kawamura, K.: Dependence of CCN activity of less volatile particles on the amount of coating observed in Tokyo, J. Geophys. Res., 112, D11207, doi:10.1029/2006JD007758, 2007.
Lanz, V. A., Alfarra, M. R., Baltensperger, U., Buchmann, B., Hueglin, C., and Prévôt, A. S. H.: Source apportionment of submicron organic aerosols at an urban site by factor analytical modeling of aerosol mass spectra, Atmos. Chem. Phys., 7, 1503–1522, https://doi.org/10.5194/acp-7-1503-2007, 2007.
Lanz, V. A., Alfarra, M. R., Baltensperger, U., Buchmann, B., Hueglin, C., Szidat, S., Wehrli, M. N., Wacker, L., Weimer, S., Caseiro, A., Puxbaum, J., and Prévôt, A. S. H.: Source attribution of submicron organic aerosols during wintertime inversions by advanced factor analysis of aerosol mass spectra, Environ. Sci. Tech., 42, 214–220, 2008.
Lathem, T. L., Beyersdorf, A. J., Thornhill, K. L., Winstead, E. L., Cubison, M. J., Hecobian, A., Jimenez, J. L., Weber, R. J., Anderson, B. E., and Nenes, A.: Analysis of CCN activity of Arctic aerosol and Canadian biomass burning during summer 2008, Atmos. Chem. Phys., 13, 2735–2756, https://doi.org/10.5194/acp-13-2735-2013, 2013.
Lee, B. H., Kostenidou, E., Hildebrandt, L. Riipinen, I., Engelhart, G. J., Mohr, C., DeCarlo, P. F., Mihalopoulos, N., Prevot, A. S. H., Baltensperger, U., and Pandis, S. N.: Measurement of the ambient organic aerosol volatility distribution: application during the Finokalia Aerosol Measurement Experiment (FAME- 2008), Atmos. Chem. Phys., 10, 12149–12160, https://doi.org/10.5194/acp-10-12149-2010, 2010.
Lee, B. H., Pierce, J. R., Engelhart, G. J., and Pandis, S. N.: Volatility of secondary organic aerosol from the ozonolysis of monoterpenes, Atmos. Environ., 45, 2443–2452, 2011.
Liao, H., Henze, D. K., Seinfeld, J. H., Wu, S., and Mickley, L. J.: Biogenic secondary organic aerosol over the United States: Comparison of climatological simulations with observations, J. Geophys. Res., 112, D06201, doi:10.1029/2006JD007813, 2007.
Lopez-Hilfiker, F. D., Mohr, C., D'Ambro, E. L., Lutz, A., Riedel, T. P., Gaston, C. J., Iyer, S., Zhang, X., Gold, A., Surratt, J. D., Lee, B. H., Kurten, T., Hu, W. W., Jimenez, J., Hallquist, M., and Thornton, J. A.: Molecular composition and volatility of organic aerosol in the Southeastern U.S.: Implications for IEPOX derived SOA, Environ. Sci. Tech., 50, 2200–2209, 2016.
Louvaris, E., Florou, K., Karnezi, E., Papanastasiou, D. K., Gkatzelis, G, I., and Pandis, S. N.: Volatility of source apportioned wintertime organic aerosol in the city of Athens, Atmos. Environ., 158, 138–147, 2017.
Meyer, N. K., Duplissy, J., Gysel, M., Metzger, A., Dommen, J., Weingartner, E., Alfarra, M. R., Prevot, A. S. H., Fletcher, C., Good, N., McFiggans, G., Jonsson, Å. M., Hallquist, M., Baltensperger, U., and Ristovski, Z. D.: Analysis of the hygroscopic and volatile properties of ammonium sulphate seeded and unseeded SOA particles, Atmos. Chem. Phys., 9, 721–732, https://doi.org/10.5194/acp-9-721-2009, 2009.
Middlebrook, A. M., Bahreini, R., Jimenez, J. L., and Canagaratna, M. R.: Evaluation of composition – dependent collection efficiencies for the Aerodyne Aerosol Mass Spectrometer using field data, Aerosol Sci. Technol., 46, 258–271, 2012.
Nakao, S.: Why would apparent κ linearly change with O∕C? Assessing the role of volatility, solubility, and surface activity of organic aerosols, Aerosol Sci. Tech., 51, 1377–1388, 2017.
National Academies of Sciences, Engineering, and Medicine (NASEM): The Future of Atmospheric Chemistry Research: Remembering Yesterday, Understanding Today, Anticipating Tomorrow Washington, DC, The National Academies Press, doi:10.17226/235730, 2016.
Paatero, P. and Tapper, U.: Positive matrix factorization – a nonnegative factor model with optimal utilization of error-estimates of data values, Environmetrics, 5, 111–126, 1994.
Paciga, A., Karnezi, E., Kostenidou, E., Hildebrandt, L., Psichoudaki, M., Engelhart, G. J., Lee, B.-H., Crippa, M., Prévôt, A. S. H., Baltensperger, U., and Pandis, S. N.: Volatility of organic aerosol and its components in the megacity of Paris, Atmos. Chem. Phys., 16, 2013–2023, https://doi.org/10.5194/acp-16-2013-2016, 2016.
Pope, C. A., Burnett, R. T., Thun, M. J., Calle, E. E., Krewski, D., Ito, K., Thurston, G. D.: Lung cancer, cardiopulmonary mortality, and long-term exposure to fine particulate air pollution, JAMA, 287, 1132–1141, 2002.
Rastak, N., A. Pajunola, Navarro, J. C. A., Ma, J., Song, M., Partridge, D. G., Kirkevåg, A., Leong, Y., Hu, W. W., Taylor, N. F., Lambe, A., Cerully, K., Bougiatioti, A., Liu, P., Krejci, R., Petäjä, T., Percival, C., Davidovits, P., Worsnop, D. R., Ekman, A. M. L., Nenes, A., Martin, S., Jimenez, J. L., Collins, D. R., Topping, D. O., Bertram, A. K., Zuend, A., Virtanen, A., and Riipinen, I.: Microphysical explanation of the RH-dependent water affinity of biogenic organic aerosol and its importance for climate, Geoph. Res. Lett., 44, 5167–5177, doi:10.102/2017GL073056, 2017.
Riipinen, I., Pierce, J. R., Donahue, N. M., and Pandis, S. N.: Equilibration time scales of organic aerosol inside thermodenuders: Evaporation kinetics versus thermodynamics, Atmos. Environ., 44, 597–607, 2010.
Roberts, G. C. and Nenes, A.: A continuous-flow streamwise thermal-gradient CCN chamber for atmospheric measurements, Aerosol Sci. Tech., 39, 206–221, 2005.
Saha, P. K. and Grieshop, A. P.: Exploring divergent volatility properties from yield and thermodenuder measurements of secondary organic aerosol from α-pinene ozonolysis, Environ. Sci. Tech., 50, 5740–5749, 2016.
Saha, P. K., Khlystov, A., and Grieshop, A. P.: Determining aerosol volatility parameters using a “dual themodenuder” system: Application to laboratory-generated organic aerosols, Aerosol Sci. Tech., 49, 620–632, 2015.
Saha, P. K., Khlystov, A., Yahya, K., Zhang, Y., Xu, L., Ng, N. L., and Grieshop, A. P.: Quantifying the volatility of organic aerosol in the southeastern US, Atmos. Chem. Phys., 17, 501–520, https://doi.org/10.5194/acp-17-501-2017, 2017.
Saleh, R., Walkerb, J., and Khlystov, A.: Determination of saturation pressure and enthalpy of vaporization of semi-volatile aerosols: The integrated volume method, Aerosol Sci., 39, 876–887, 2008.
Saleh, R., Khlystov, A., and Shihadeh, A.: Effect of aerosol generation method on measured saturation pressure and enthalpy of vaporization for dicarboxylic acids aerosol, Aerosol Sci. Tech., 44, 302–307, 2010.
Saleh, R., Shihadeh, A., and Khlystov, A.: On transport phenomena and equilibration time scales in thermodenuders, Atmos. Meas. Tech., 4, 571–581, https://doi.org/10.5194/acp-11-571-2011, 2011.
Saxena, P. and Hildemann, L.: Water-soluble organics in atmospheric particles: a critical view of the literature and application of thermodynamics to identify candidate compounds. J. Atmos. Chem., 24, 57–109, 1996.
Seinfeld, J. H., Bretherton, C., Carslaw, K. S., Coe, H., DeMott, P. J., Dunlea, E. J., Feingold, G., Ghan, S., Guenther, A. B., Kahn, R., Kraucunas, I., Kreidenweis, S. M., Molina, M. J., Nenes, A., Penner, J. E., Prather, K. A., Ramanathan, V., Ramaswamy, V., Rasch, P. J., Ravishankara, A. R., Rosenfeld, D., Stephens, G., and Wood, R.: Improving our fundamental understanding of the role of aerosol-cloud interactions in the climate system, P. Natl. Acad. Sci. USA, 113, 21, 5781–5790, 2016.
Spracklen, D. V., Jimenez, J. L., Carslaw, K. S., Worsnop, D. R., Evans, M. J., Mann, G. W., Zhang, Q., Canagaratna, M. R., Allan, J., Coe, H., McFiggans, G., Rap, A., and Forster, P.: Aerosol mass spectrometer constraint on the global secondary organic aerosol budget, Atmos. Chem. Phys., 11, 12109–12136, https://doi.org/10.5194/acp-11-12109-2011, 2011.
Thalman, R., de Sá, S. S., Palm, B. B., Barbosa, H. M. J., Pöhlker, M. L., Alexander, M. L., Brito, J., Carbone, S., Castillo, P., Day, D. A., Kuang, C., Manzi, A., Ng, N. L., Sedlacek III, A. J., Souza, R., Springston, S., Watson, T., Pöhlker, C., Pöschl, U., Andreae, M. O., Artaxo, P., Jimenez, J. L., Martin, S. T., and Wang, J.: CCN activity and organic hygroscopicity of aerosols downwind of an urban region in central Amazonia: seasonal and diel variations and impact of anthropogenic emissions, Atmos. Chem. Phys., 17, 11779–11801, https://doi.org/10.5194/acp-17-11779-2017, 2017.
Tritscher, T., Dommen, J., DeCarlo, P. F., Gysel, M., Barmet, P. B., Praplan, A. P., Weingartner, E., Prévôt, A. S. H., Riipinen, I., Donahue, N. M., and Baltensperger, U.: Volatility and hygroscopicity of aging secondary organic aerosol in a smog chamber, Atmos. Chem. Phys., 11, 11477–11496, https://doi.org/10.5194/acp-11-11477-2011, 2011.
Ulbrich, I. M., Canagaratna, M. R., Zhang, Q., Worsnop, D. R., and Jimenez, J. L.: Interpretation of organic components from Positive Matrix Factorization of aerosol mass spectrometric data, Atmos. Chem. Phys., 9, 2891–2918, https://doi.org/10.5194/acp-9-2891-2009, 2009.
Vesala, T., Kulmala, M., Rudolf, R., Vrtala, A., and Wagner, P. E.: Models for condensational growth and evaporation of binary aerosol particles, J. Aerosol Sci., 28, 565–598, 1997.
Weber, R. J., Orsini, D., Daun, Y., Lee, Y.-N., Klotz, P., and Brechtel, F.: A particle-into-liquid collector for rapid measurements of aerosol chemical composition, Aerosol Sci. Tech., 35, 718–727, 2001.
Xu, L., Guo, H., Boyd, C. M., Klein, M., Bougiatioti, A., Cerully, K, M., Hite, J. R., Isaacman-VanWertz, G., Kreisberg, N. M., Knote, C., Olson, K., Koss, A., Goldstein, A. H., Hering, S. V., de Gouw, J., Baumann, K., Lee, S.-H., Nenes, A., Weber, R. J., and Ng, N. L.: Effects of anthropogenic emissions on aerosol formation from isoprene and monoterpenes in the Southeastern United States, P. Natl. Acad. Sci. USA, 112, 37–42, 2015a.
Xu, L., Suresh, S., Guo, H., Weber, R. J., and Ng, N. L.: Aerosol characterization over the southeastern United States using High-Resolution Aerosol Mass Spectrometry: spatial and seasonal variation of aerosol composition and sources with a focus on organic nitrates, Atmos. Chem. Phys., 15, 7307–7336, https://doi.org/10.5194/acp-15-7307-2015, 2015b.
Xu, L., Middlebrook, A. M., Liao, J., de Gouw, J. A., Guo, H., Weber, R. J., Nenes, A., Lopez?Hilfiker, F. D., Lee, B. H., Thornton, J. A., Brock, C. A., Neuman, J., A., Nowak, J. B., Pollack, I. B., Welti, A., Graus, M., Warneke, C., and Ng, N. L.: Enhanced formation of isoprene-derived organic aerosol in power plant plumes during Southeast Nexus (SENEX), J. Geophys. Res., 121, 11137–11153, 2016a.
Xu, L., Williams, L. R., Young, D. E., Allan, J. D., Coe, H., Massoli, P., Fortner, E., Chhabra, P., Herndon, S., Brooks, W. A., Jayne, J. T., Worsnop, D. R., Aiken, A. C., Liu, S., Gorkowski, K., Dubey, M. K., Fleming, Z. L., Visser, S., Prévôt, A. S. H., and Ng, N. L.: Wintertime aerosol chemical composition, volatility, and spatial variability in the greater London area, Atmos. Chem. Phys., 16, 1139–1160, https://doi.org/10.5194/acp-16-1139-2016, 2016b.
Xu, L., Guo, H., Weber, R. J., and Ng, N. L.: Chemical characterization of water soluble soluble organic aerosol in contrasting rural and urban environments in the Southeastern United States, Environ. Sci. Tech., 51, 78–88, 2017.
Zhang, Q., Alfarra, M. R., Wornsop, D. R., Allan, J. D., Coe, H., Canagaratna, M., and Jimenez, J. L.: Deconvolution and quantification of hydrocarbon-like and oxygenated organic aerosols based on aerosol mass spectrometry, Environ. Sci. Tech., 39, 4938–4952, 2005.
Zhang, Q., Jimenez, J. L., Canagaratna, M. R., Allan, J. D., Coe, H., Ulbrich, I., Alfarra, M. R., Takami, A., Middlebrook, A. M., Sun, Y. L., Dzepina, K., Dunlea, E., Docherty, K., De Carlo, P. F., Salcedo, D., Onasch, T., Jayne, J. T., Miyoshi, T., Shimono, A., Hatakeyama, S., Takegawa, N., Kondo, Y., Schneider, J., Drewnick, F., Borrmann, S., Weimer, S., Demerjian, K., Williams, P., Bower, K., Bahreini, R., Cottrell, L., Griffin, R. J., Rautiainen, J., Sun, J. Y., Zhang, Y. M., and Worsnop, D. R.: Ubiquity and dominance of oxygenated species in organic aerosols in anthropogenically-influenced Northern Hemisphere midlatitudes, Geophys. Res. Lett., 34, L13801, doi:10.1029/2007gl029979, 2007.
- Abstract
- Introduction
- Experimental
- Data analysis
- Results and discussion
- Sensitivity analysis
- Comparisons with other studies
- Link to the 2D-VBS framework
- Linking the hygroscopicity of OA components to their O : C ratio and volatility
- Conclusions
- Data availability
- Appendix A
- Competing interests
- Acknowledgements
- References
- Supplement