the Creative Commons Attribution 4.0 License.
the Creative Commons Attribution 4.0 License.
Using satellite measurements of N2O to remove dynamical variability from HCl measurements
Richard S. Stolarski
Anne R. Douglass
Susan E. Strahan
Column HCl measurements show deviations from the expected slow decline following the regulation of chlorine-containing compounds by the Montreal Protocol. We use the simultaneous measurements of N2O and HCl by the Microwave Limb Sounder (MLS) instrument on the Aura satellite to examine this problem. We find that the use of N2O measurements at a specific altitude to represent the impact of dynamical variability on HCl results in a derived linear trend in HCl that is negative (ranging from −2.5 to 5.3 % decade−1) at all altitudes between 68 and 10 hPa. These trends are at or near 2σ statistical significance at all pressure levels between 68 and 10 hPa. This shows that analysis of simultaneous measurements of several constituents is a useful approach to identify small trends from data records that are strongly influenced by dynamical interannual variability.
- Article
(3032 KB) - Full-text XML
- BibTeX
- EndNote
HCl is the primary constituent of inorganic chlorine in the stratosphere, comprising 75–80 % of the inorganic chlorine in the vertical pressure range from 68 to 10 hPa (Zander et al., 1992; Nassar et al., 2006). As such it provides a convenient marker for the total amount of inorganic stratospheric chlorine. This marker can be measured from the ground as a total column amount and from satellites as a vertical profile. The column amount of HCl is expected to follow the behavior of the concentration of the organic sources of chlorine as measured at the surface (e.g., CFCs) with a time delay of a few years for the CFCs to reach the stratosphere, where they are converted to inorganic chlorine compounds.
Rinsland et al. (2003), using the Network for the Detection of Atmospheric Composition Change (NDACC) record of ground-based column measurements of HCl and ClONO2 (∼ 1990–2002), showed that their total stratospheric burden had leveled out by approximately 1995. These two gases comprise most of stratospheric inorganic chlorine outside the winter polar vortices.
The next step would be to observe the expected decrease in inorganic chlorine. Recently Mahieu et al. (2014) have shown that, in fact, the measured HCl column over Jungfraujoch decreased more rapidly than expected from in situ ground-based measurements of source gases during the early 2000s. The rapid decrease in measured HCl column was followed by an increase from about 2007 to 2010 even as the chlorine gases were decreasing. We show, as Mahieu et al. (2014) indicated, that the Microwave Limb Sounder (MLS) measurements of the lower-stratospheric column of HCl also decrease and increase in concert with the Jungfraujoch data, followed by a decrease from 2011 to mid-2013 and a subsequent increase from that time to the present (see Fig. 1).
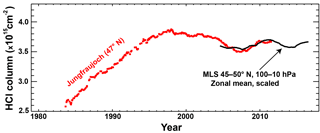
Figure 1Total column measurements of HCl above Jungfraujoch (latitude = 46.5∘ N) smoothed with a 3-year running mean as shown by Mahieu et al. (2014) (red curve). Also shown are the 3-year running mean smoothed zonal mean of measurements of the lower-stratospheric column of HCl (100–10 hPa) from the MLS instrument on Aura for the latitude band from 45 to 50∘ N (black curve). The MLS measurements are of partial column and have been scaled upward to match the Jungfraujoch FTIR measurements for better visual comparison.
Mahieu et al. (2014) use results from model simulations with the SLIMCAT model driven by ERA-Interim meteorological fields from the European Centre for Medium-Range Weather Forecasts (ECMWF) to suggest that variability in the stratospheric circulation causes the accelerated decrease and the unexpected increase in HCl column. We will explore this explanation using measurements of N2O from MLS as a measure of this variability in circulation.
We use the MLS HCl and N2O data together to test whether chlorine is decreasing in the stratosphere as expected from adherence to the provisions of the Montreal Protocol. MLS was launched on the Aura satellite in July 2004 (Waters et al., 2006) and continues to operate in 2018. The record is now more than 13 years in length with vertical profiles of HCl, HNO3, N2O and many other species measured globally on a daily basis.
For HCl we use the version 4.2 product, measured by the 640 GHz receiver, which shows little change from the previous version 3 products. According to the MLS data quality document (Livesey et al., 2017), the useful range for HCl measurements is from 100 to 0.32 hPa. However, the useful data for trends are limited to pressures greater than 10 hPa due to the insufficient reliability of the retrievals in the upper stratosphere. The possibility of a temporal drift in the HCl product was evaluated by comparing the drift between the 240 GHz O3 and 640 GHz O3 (L. Froidevaux, personal communication, 2017). Because the ozone products had a drift of ≤ 0.1 % yr−1, other measurements obtained with the 640 GHz receiver, e.g., HCl and N2O, are expected to be comparably stable. An evaluation of the 240 GHz O3 product compared to correlative satellite and ground-based measurements shows no evidence of a temporal drift (Hubert et al., 2016).
For N2O we use the version 4.2 data product from the 190 GHz receiver because the N2O 640 GHz data set ends in summer 2013 due to failure of the N2O primary band. The MLS measurements with the 190 GHz receiver have been found to have a temporal drift relative to the 640 GHz receiver (N. Livesey, personal communication, 2017). Later in this section we will compare 190 GHz N2O and 640 GHz N2O measurements to correct for the drift observed between these two channels prior to 2013. The 190 GHz N2O data are stated to be useful in the 68–0.46 hPa range. We will thus restrict our analyses to pressure levels between 68 and 10 hPa in this paper, where both the HCl and N2O-190 measurements are useful.
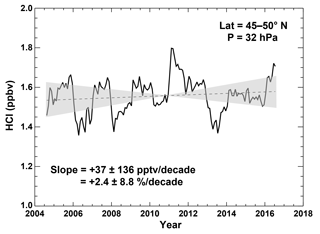
Figure 2Deseasonalized monthly-mean MLS measurements of HCl concentration at 32 hPa. Measurements are area-weighted between 45 and 50∘ N. The dashed line is a linear least squares fit to the data, and the shaded area indicates the 2σ uncertainty in that fit including consideration of autocorrelation in the time series.
To better understand the variations in HCl column amounts at 47∘ N observed by Mahieu et al. (2014), we begin with consideration of the MLS measurements of the HCl profile at specific pressure levels in the stratosphere. For example, Figure 2 shows the deseasonalized monthly-mean measurements by MLS of HCl averaged between 45 and 50∘ N latitude at 32 hPa. The data are shown as mixing ratio after removal of the repeating seasonal cycle. The data clearly show deviations of as much as ±10 % with significant autocorrelation.
One way to examine the HCl time series shown in Fig. 2 is to attempt to “explain” the variance by fitting to various measures of dynamical variability such as the Quasi-Biennial Oscillation (QBO) or El Niño–Southern Oscillation (ENSO). This method may remove much of the dynamical variance but has at least two potential problems: (1) the fitting parameters may only remove part of the dynamical variability because of incomplete representation of that variability, and (2) they may overrepresent the variability because of correlation between parameters. Either of these problems could lead to difficulties in separating real trends from apparent trends in the residual over short timescales, such as the 12 years of data since 2004.
For example, the impact of the QBO on southern mid-latitude composition depends on the QBO phase during early (southern) winter (Strahan et al., 2015). The resulting dynamical variability is not easily represented by fitting a QBO plus a seasonal term in a statistical model, because the actual variability depends on the QBO phase during a particular season. We have attempted to model the HCl time series with standard proxies for QBO and other effects with unsatisfactory results.
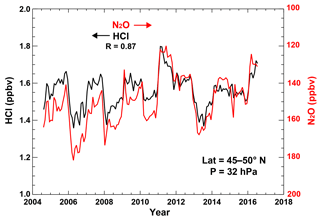
We use a different method to remove dynamical variability in the HCl data set, taking advantage of simultaneous measurements of another species made by the MLS instrument on the Aura satellite. The observed deviations from the seasonal variation of HCl and other constituents including N2O are the result of dynamical variability acting on mixing ratio gradients. These gradients may be vertical, horizontal or a combination of both. If two constituents have gradients in the same or opposite directions, the impact of dynamic variability will be to cause deviations that are either correlated or anticorrelated with each other depending on the sign of the gradients. An example is shown in Fig. 3, where we plot the deseasonalized HCl mixing ratios at 32 hPa for the latitude band 45–50∘ N as in Fig. 2 and the deseasonalized N2O mixing ratios on a reverse scale for the same latitude band and pressure level. The correlation coefficient is −0.87 between these two time series. A similar correlation, with opposite sign, is found between HCl and HNO3 data from MLS.
The trend that we are trying to isolate and confirm for the HCl time series is determined by the change in abundance of chlorine-containing halocarbons driven by the provisions of the Montreal Protocol on ozone-depleting substances. Inorganic chlorine in the stratosphere is expected to have decreased since 2000 in response to the decreases in the chlorine-containing source gases. N2O, on the other hand, is known to be increasing at a rate of about 2.8 % decade−1 (NOAA GMDL data updated from Elkins and Dutton (2009) available at ftp://ftp.cmdl.noaa.gov/hats/n2o/combined/HATS_global_N2O.txt). Our approach is to use the N2O time series at each altitude, such as that shown in Fig. 3, as an explanatory variable in a time series regression to remove the dynamical variability from the HCl time series. Trends calculated for HCl in this time series regression are then corrected for the underlying trend in N2O.
The time series method used is a simple regression with two fitting terms, a linear trend and the N2O time series. Uncertainties are estimated by calculating the standard deviation of the residual time series after removing the fit to linear trend plus the N2O time series and then multiplying the result by the factor to obtain the uncertainty including auto-regression (see Weatherhead et al., 1998), where Φ is the autocorrelation lag 1 coefficient.
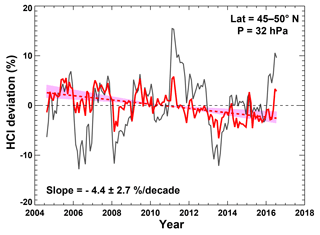
Figure 4HCl anomaly time series as in Figs. 2 and 3 with the mean removed (black) and the residual time series after regression to N2O time series (red). Red dashed line is linear fit to residual series with 2σ uncertainty bounds indicated by shaded area.
Table 1HCl trends derived from MLS data at six pressure levels. Column 1 gives the pressure level. Column 2 gives the raw trend derived directly from the MLS HCl measurements in percent per decade. Column 3 gives the HCl trend derived using MLS N2O measurements as an explanatory variable. Column 4 gives the derived trend in the 190 GHz channel of MLS N2O measurements relative to the 640 GHz channel during the time of their overlap. Column 5 gives the slope of the NOAA global surface measurements of N2O over the period from 2001 to 2012. Column 6 gives the overall resulting trend obtained by combining the information in columns 3 to 5. All uncertainties are quoted at 2σ.

The result of using N2O as a fitting parameter for the 32 hPa MLS time series for HCl is shown in Fig. 4. The solid red line in the figure is the residual time series after fitting, which takes advantage of the substantial covariance and shows significantly reduced variability. The resulting trend shown by the red dashed line is −4.4 ± 2.7 (2σ) % decade−1. The HCl trend at this pressure level is now negative and statistically significant at more than the 3σ level. The same procedure has been carried out at each of the pressure levels for MLS retrievals. The result is shown in the third column of Table 1.
The second column of Table 1 shows the raw trend obtained from the MLS HCl measurements. We can see that the raw trend is essentially the same as the N2O-fitted trend at the two highest levels (10 and 15 hPa), where inorganic chlorine is relatively insensitive to dynamical variability due to its small vertical gradient. At higher pressures, where inorganic chlorine has a larger vertical gradient, the trend is substantially different when using N2O as a fitting parameter. Using N2O as a fitting parameter changes the lower-level trends from positive to negative with a substantial reduction in the uncertainty.
A further problem alluded to earlier in this section is that MLS now uses the 190 GHz band for its standard N2O product because the 640 GHz band is no longer usable. The problem arises because the 190 GHz band displays a drift in N2O measurements with respect to the 640 GHz band (Lucien Froidevaux, personal communication, 2017). Since the 640 GHz band was found to be stable during its operational period, we use the drift rate of the 190 GHz band with respect to the 640 GHz band calculated by the time-independent drift rates for the time period in which they both were operational (2004–2012). We assume that the drift rate computed over the overlap time period continues through the end of the data record. This assumption is subject to an uncertainty that we have no way of evaluating. The results for the computation of the drift between the 190 GHz band with respect to the 640 GHz band are shown in the fourth column of Table 1 with estimated uncertainties in the fit.
We chose to show the trend resulting from the fit to the N2O product before adjusting it for the drift between the two N2O bands and then following that with a correction for the N2O drift. Because we are making a simple straight-line trend correction with no time variability except the trend, the result is the same as that obtained by first correcting the N2O product time series and using that result as a fitting parameter to the HCl data.
Finally, we note that the surface levels of N2O increased by about 2.8 % decade−1. We used the “global” nitrous oxide data reported at the NOAA ESRL Global Monitoring Division website (https://www.esrl.noaa.gov/gmd/hats/combined/N2O.html). We fit a trend to the data between 2001 and 2012 to represent the ground values that should be seen in the stratosphere about 3 years later in the MLS data. The time delay represents the approximate mean age of air in the lower stratosphere (see, e.g., Waugh and Hall, 2002). Since N2O has been increasing at a nearly constant rate, the choice of time period for estimating its trend does not lead to a significant uncertainty.
The final result is obtained by summing the trends in columns 3 to 5 of Table 1 and is shown in column 6 of the table. The uncertainties were obtained by using the root sum of squares (RSS) of the uncertainties in columns 3 to 5. This final result is also shown in Fig. 5. The blue solid line indicates the trend result obtained from a linear fit to the deseasonalized residuals with no attempt to account for dynamical variability (column 2 of Table 1). The red solid curve is the result when the N2O time series is used as a dynamical surrogate, with corrections for drift and surface trends, in the fitting procedure (column 6 of Table 1). The shaded areas represent 2σ uncertainties in the linear trends.
Note in Fig. 5 that the use of N2O as a surrogate for dynamical variability reduces the uncertainty in the calculated trend for all of the pressure levels between 15 and 68 hPa, where the MLS data for both HCl and N2O are considered to be suitable for trend analysis. Figure 5 also shows that the calculated linear trend in HCl using the N2O surrogate with corrections is negative at all pressure levels and is significantly negative (2σ) at all levels from 68 to 10 hPa with the exception of 22 hPa, where it has nearly 2σ significance. These results are consistent with the observed decrease in organic chlorine species at the surface.
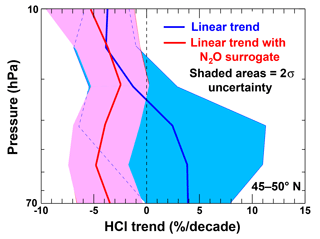
Figure 5Linear trend in HCl concentrations determined from MLS measurements between 70 and 10 hPa (approximately 20 to 30 km altitude) for the latitude band of 45–50∘ N. The blue line is the trend determined from the raw deseasonalized data. The red curve is the trend determined while including the N2O time series as an explanatory variable. The shaded areas represent 2σ uncertainties for each.
In their paper, Mahieu et al. (2014) reported that total column HCl measured at Jungfraujoch showed significant variation from the expected simple linear decrease. We have attempted to quantitatively evaluate the effect of dynamical variability on the concentrations of HCl in the stratosphere by using N2O measurements since late 2004 made by the Aura MLS instrument. Since both HCl and N2O have concentration gradients (horizontal and vertical) that are acted upon by dynamical processes to create interannual variability, we have used the variability of N2O concentrations determined from MLS observations as a measure of the dynamical variability that should be expected in HCl concentrations. We suggest that this method more reliably removes the real atmospheric variability than does the use of other proxies.
We have shown that using an N2O surrogate in trend analysis of the MLS HCl time series results in a trend that is negative at all measured levels from 68 hPa upward to 10 hPa and that these negative trends are 2σ statistically significant or nearly so. The N2O surrogate had little effect at the upper two levels of 10 and 15 hPa, where inorganic chlorine is less sensitive to dynamical variability. The surrogate had significant impact on the derived trends lower in the stratosphere, where the inorganic chlorine vertical gradient is larger and most of the HCl column resides.
Previous data-based estimates of HCl decrease in the stratosphere include Froidevaux et al. (2006), Jones et al. (2011), Brown et al. (2011) and Kohlhepp et al. (2012). All of these studies had to consider the issues we have discussed in this paper, namely the contribution of dynamic variability to the apparent trend. In each case, the shortness of the data record was a significant limitation to the interpretation of potential trends due to the decrease in tropospheric organic chlorine sources.
The results from these authors are summarized in the 2014 ozone assessment report by Carpenter and Reimann (2014). Specifically Froidevaux et al. (2006) derived a trend for the 50–65 km altitude range of −8 % decade−1 from MLS data for the years 2004–2006. Jones et al. (2011) derived a trend of −5 % decade−1 using Halogen Occultation Experiment (HALOE) and Atmospheric Chemistry Experiment Fourier Transform Spectrometer (ACE FTS) data between 35 and 45 km from 1997 to 2008 at midlatitudes. Brown et al. (2011) deduced a trend of −7 % decade−1 for the 50–54 km range from ACE FTS data from 2004 to 2010. Finally, Kohlhepp et al. (2012) analyzed the total column HCl data from 17 NDACC Fourier transform infrared (FTIR) stations for the years 2000 to 2009, obtaining trends that ranged from −4 to −16 % decade−1 depending on station.
The best comparison for evaluating our results is considering the change in the organic chlorine sources at the surface. Chapter 1 of the 2014 ozone assessment (Carpenter and Reimann, 2014) estimates changes in the tropospheric available organic chlorine of −6 % decade−1 from 2000 to 2004, followed by −4.6 % decade−1 from 2004 to 2008 and −4 % decade−1 from 2008 to 2012. Assuming a 3–5-year delay between changes in the tropospheric source gases for the stratospheric chlorine implies an average change from 2004 to 2016 of about −5 % decade−1, in agreement with our estimate from MLS data within the uncertainty bounds.
These results indicate the potential power of using the time series of measurements of one constituent to understand, and possibly remove, the dynamical variability in another constituent. In the case we have presented, we had to apply a drift correction to the MLS N2O data to get the best estimate of trend. We have attempted to make an estimate of the uncertainty in this drift correction and include it in the estimate of the overall uncertainty in the trend calculation. Although the drift correction was a large enough fraction of the overall trend to cause some worry about the results, we assert that this does not diminish the value of the concept of using the dynamical variability of another measured constituents to provide complementary information about trends and variability of the constituent whose possible trends are under consideration.
MLS N2O data are available from the Goddard Earth Sciences Data and Information Services Center (Lambert et al. 2015). MLS HCl data are available from the Goddard Earth Sciences Data and Information Services Center (Froidevaux et al., 2015).
The authors declare that they have no conflict of interest.
This article is part of the special issue “Quadrennial Ozone Symposium 2016 – Status and trends of atmospheric ozone (ACP/AMT inter-journal SI)”. It is a result of the Quadrennial Ozone Symposium 2016, Edinburgh, United Kingdom, 4–9 September 2016.
Richard S. Stolarski would like to
acknowledge support from NASA grant NASA NNH16ZDA001N-ACMAP to Johns Hopkins
University.
Edited by: Irina Petropavlovskikh
Reviewed by: two anonymous referees
Brown, A. T., Chipperfield, M. P., Boone, C., Wilson, C., Walker, K. A., and Bernath, P. F.: Trends in atmospheric halogen containing gases since 2004, J. Quant. Spectrosc. Radiat. Transf., 112 , 2552–2566, https://doi.org/10.1016/j.jqsrt.2011.07.005, 2011.
Carpenter, L. J. and Reimann, S.: Lead Authors, Scientific Assessment of Ozone Depletion: 2014, Chapter 1: Update on Ozone-Depleting Substances (ODSs) and Other Gases of Interest to the Montreal Protocol Global Ozone Research and Monitoring Project – Report No. 55, 1.1–1.101, 2014.
Elkins, J. W. and Dutton, G. S.: Nitrous oxide and sulfur hexafluoride in: State of the Climate in 2008, B. Am. Meteor. Soc., 90 S38–S39, 2009.
Froidevaux, L., Livesey, N. J., Read, W. G., Salawitch, R. J., Waters, J. W., Drouin, B., MacKenzie, I. A., Pumphrey, H. C., Bernath, P., Boone, C., Nassar, R., Montzka, S., Elkins, J., Cunnold, D., and Waugh, D.: Temporal decrease in upper atmospheric chlorine, Geophys. Res. Lett., 33, L23812, https://doi.org/10.1029/2006GL027600, 2006.
Froidevaux, L., Livesey, N., and Read, W.: MLS/Aura Level 2 Hydrogen Chloride (HCl) Mixing Ratio V004, Greenbelt, MD, USA, Goddard Earth Sciences Data and Information Services Center (GES DISC), https://doi.org/10.5067/Aura/MLS/DATA2010, 2015.
Hubert, D., Lambert, J.-C., Verhoelst, T., Granville, J., Keppens, A., Baray, J.-L., Bourassa, A. E., Cortesi, U., Degenstein, D. A., Froidevaux, L., Godin-Beekmann, S., Hoppel, K. W., Johnson, B. J., Kyrölä, E., Leblanc, T., Lichtenberg, G., Marchand, M., McElroy, C. T., Murtagh, D., Nakane, H., Portafaix, T., Querel, R., Russell III, J. M., Salvador, J., Smit, H. G. J., Stebel, K., Steinbrecht, W., Strawbridge, K. B., Stübi, R., Swart, D. P. J., Taha, G., Tarasick, D. W., Thompson, A. M., Urban, J., van Gijsel, J. A. E., Van Malderen, R., von der Gathen, P., Walker, K. A., Wolfram, E., and Zawodny, J. M.: Ground-based assessment of the bias and long-term stability of 14 limb and occultation ozone profile data records, Atmos. Meas. Tech., 9, 2497–2534, https://doi.org/10.5194/amt-9-2497-2016, 2016.
Jones, A., Urban, J., Murtagh, D. P., Sanchez, C., Walker, K. A., Livesey, N. J., Froidevaux, L., and Santee, M. L.: Analysis of HCl and ClO time series in the upper stratosphere using satellite data sets, Atmos. Chem. Phys., 11, 5321–5333, https://doi.org/10.5194/acp-11-5321-2011, 2011.
Kohlhepp, R., Ruhnke, R., Chipperfield, M. P., De Maziére, M., Notholt, J., Barthlott, S., Batchelor, R. L., Blatherwick, R. D., Blumenstock, Th., Coffey, M. T., Demoulin, P., Fast, H., Feng, W., Goldman, A., Griffith, D. W. T., Hamann, K., Hannigan, J. W., Hase, F., Jones, N. B., Kagawa, A., Kaiser, I., Kasai, Y., Kirner, O., Kouker, W., Lindenmaier, R., Mahieu, E., Mittermeier, R. L., Monge-Sanz, B., Morino, I., Murata, I., Nakajima, H., Palm, M., Paton-Walsh, C., Raffalski, U., Reddmann, Th., Rettinger, M., Rinsland, C. P., Rozanov, E., Schneider, M., Senten, C., Servais, C., Sinnhuber, B.-M., Smale, D., Strong, K., Sussmann, R., Taylor, J. R., Vanhaelewyn, G., Warneke, T., Whaley, C., Wiehle, M., and Wood, S. W.: Observed and simulated time evolution of HCl, ClONO2, and HF total column abundances, Atmos. Chem. Phys., 12, 3527–3556, https://doi.org/10.5194/acp-12-3527-2012, 2012.
Lambert, A., Livesey, N., and Read, W.: MLS/Aura Level 2 Nitrous Oxide (N2O) Mixing Ratio V004, Greenbelt, MD, USA, Goddard Earth Sciences Data and Information Services Center (GES DISC), https://doi.org/10.5067/AURA/MLS/DATA2016, 2015.
Livesey, N. J., Read, W. G., Wagner, P. A., Froidevaux, L., Lambert, A., Manney, G. L., Valle, L. F. M., Pumphrey, H. C., Santee, M. L., Schwartz, M. J., Wang, S., Fuller, R. A., Jarnot, R. F., Knosp, B. W., and Martinez, E.: Jet Propulsion Laboratory Report JPL D-33509 Rev. B, Earth Observing System (EOS) Aura Microwave Limb Sounder (MLS) Version 4.2x-3.0: Level 2 data quality and description document, 2017.
Mahieu, E., Chipperfield, M. P., Notholt, J., Reddmann, T., Anderson, J., Bernath, P. F., Blumenstock, T., Coffey, M. T., Dhomse, S. S., Feng, W., Franco, B., Froidevaux, L., Griffith, D. W. T., Hannigan, J. W., Hase, F., Hossaini, R., Jones, N. B., Morino, I., Murata, I., Nakajima, H., Palm, M., Paton-Walsh, C., Russell III, J. M., Schneider, M., Servais, C., Smale, D., and Walker, K. A.: Recent Northern Hemisphere stratospheric HCl increase due to atmospheric circulation changes, Nature, 515, 104–107, https://doi.org/10.1038/nature13857, 2014.
Nassar, R., Bernath, P. F., Boone, C. D., Clerbaux, C., Coheur, P. F., Dufour, G., Froidevaux, L., Mahieu, E., McConnell, J. C., McLeod, S. D., Murtagh, D. P., Rinsland, C. P., Semeniuk, K., Skelton, R., Walker, K. A., and Zander, R.: A global inventory of stratospheric chlorine in 2004, J. Geophys. Res., 111, D22312, https://doi.org/10.1029/2006JD007073, 2006.
Rinsland, C. P., Mahieu, E., Zander, R., Jones, N. B., Chipperfield, M. P., Goldman, A., Anderson, J., Russell III, J. M., Demoulin, P., Notholt, J., Toon, G. C., Blavier, J.-F., Sen, B., Sussmann, R., Wood, S. W., Meier, A., Griffith, D. W. T., Chiou, L. S., Murcray, F. J., Stephen, T. M., Hase, F., Mikuteit, S., Schulz, A., and Blumenstock, T.: Long-term trends of inorganic chlorine from ground-based infrared solar spectra: Past increases and evidence for stabilization, J. Geophys. Res., 108, 4252, https://doi.org/10.1029/2002JD003001, 2003.
Strahan, S. E., Oman, L. D., Douglass, A. R., and Coy, L.: Modulation of Antarctic vortex composition by the quasi-biennial oscillation, Geophys. Res. Lett., 42, 4216–4223, https://doi.org/10.1002/2015GL063759, 2015.
Waters, J. W., Froidevaux, L., Harwood, R. S., Jarnot, R. F., Pickett, H. M., Read, W. G., Siegel, P. H., Cofield, R. E., Filipiak, M. J., Flower, D. A., Holden, J. R., Lau, G. K., Livesey, N. J., Manney, G. L., Pumphrey, H. C., Santee, M. L., Wu, D. L., Cuddy, D. T., Lay, R. R., Loo, M. S., Perun, V. S., Schwartz, M. J., Stek, P. C., Thurstans, R. P., Boyles, M. A., Chandra, S., Chavez, M. C., Chen, G.-S., Chudasama, B. V., Dodge, R., Fuller, R. A., Girard, M. A., Jiang, J. H., Jiang, Y., Knosp, B. W., LaBelle, R. C., Lam, J. C., Lee, K. A., Miller, D., Oswald, J. E., Patel, N. C., Pukala, D. M., Quintero, O., Scaff, D. M., Snyder, W. V., Tope, M. C., Wagner, P. A., and Walch, M. J.: The Earth Observing System Microwave Limb Sounder (EOS MLS) on the Aura satellite, IEEE T. Geosci. Remote Sens., 44, https://doi.org/10.1109/TGRS.2006.873771, 2006.
Waugh, D. and Hall, T.: Age of stratospheric air: Theory, observations, and models, Rev. Geophys., 40, 1–26, https://doi.org/10.1029/2000RG000101, 2002.
Weatherhead, E. C., Reinsel, G. C., Tiao, G. C., Meng, X.-L., Choi, D., Cheang, W.-K., Keller, T., DeLuisi, J., Wuebbles, D. J., Kerr, J. B., Miller, A. J., Oltmans, S. J., and Frederick, J. E.: Factors affecting the detection of trends: Statistical considerations and applications to environmental data, J. Geophys. Res., 103, 17149–17161, 1998.
Zander, R., Gunson, M. R., Farmer, C. B., Rinsland, C. P., Irion, F. W., and Mahieu, E.: The 1985 chlorine and fluorine inventories in the stratosphere based on ATMOS observations at 30-degrees north latitude, J. Atmos. Chem., 15, 171–186, 1992.


