the Creative Commons Attribution 4.0 License.
the Creative Commons Attribution 4.0 License.
 | 21 Mar 2018
Sources of PM2.5 carbonaceous aerosol in Riyadh, Saudi Arabia
Badr Alharbi
Mohammed M. Shareef
Tahir Husain
Mohammad J. Pasha
Samuel A. Atwood
Sonia M. Kreidenweis
Knowledge of the sources of carbonaceous aerosol affecting air quality in Riyadh, Saudi Arabia, is limited but needed for the development of pollution control strategies. We conducted sampling of PM2.5 from April to September 2012 at various sites in the city and used a thermo-optical semi-continuous method to quantify the organic carbon (OC) and elemental carbon (EC) concentrations. The average OC and EC concentrations were 4.7 ± 4.4 and 2.1 ± 2.5 µg m−3, respectively, during this period. Both OC and EC concentrations had strong diurnal variations, with peaks at 06:00–08:00 LT and 20:00–22:00 LT, attributed to the combined effect of increased vehicle emissions during rush hour and the shallow boundary layer in the early morning and at night. This finding suggested a significant influence of local vehicular emissions on OC and EC. The OC ∕ EC ratio in primary emissions was estimated to be 1.01, close to documented values for diesel emissions. Estimated primary organic carbon (POC) and secondary organic carbon (SOC) concentrations were comparable, with average concentrations of 2.0 ± 2.4 and 2.8 ± 3.4 µg m−3, respectively.
We also collected 24 h samples of PM10 onto quartz microfiber filters and analyzed these for an array of metals by inductively coupled plasma atomic emission spectroscopy (ICP-AES). Total OC was correlated with Ca (R2 of 0.63), suggesting that OC precursors and Ca may have similar sources, and the possibility that they underwent similar atmospheric processing. In addition to a ubiquitous dust source, Ca is emitted during desalting processes in the numerous refineries in the region and from cement kilns, suggesting these sources may also contribute to observed OC concentrations in Riyadh. Concentration weighted trajectory (CWT) analysis showed that high OC and EC concentrations were associated with air masses arriving from the Persian Gulf and the region around Baghdad, locations with high densities of oil fields and refineries as well as a large Saudi Arabian cement plant. We further applied positive matrix factorization to the aligned dataset of EC, OC, and metal concentrations (Al, Ca, Cu, Fe, K, Mg, Mn, Na, Ni, Pb, and V). Three factors were derived and were proposed to be associated with oil combustion, industrial emissions (Pb based), and a combined source from oil fields, cement production, and local vehicular emissions. The dominant OC and EC source was the combined source, contributing 3.9 µg m−3 (80 %) to observed OC and 1.9 µg m−3 (92 %) to observed EC.
- Article
(4852 KB) - Full-text XML
-
Supplement
(945 KB) - BibTeX
- EndNote


Organic carbon (OC) and elemental carbon (EC) (or black carbon, BC, operationally identified based on detection method) are key components of the atmospheric aerosol (Jacobson et al., 2000). The contribution of carbonaceous components to total particulate matter (PM) concentrations varies with site and season, comprising from 20 to 90 % of the total mass (Kanakidou et al., 2005). EC is emitted from a variety of combustion processes (Bond et al., 2013), classified as a short-lived climate forcer that contributes to atmospheric warming (Ramanathan and Carmichael, 2008), and also associated with human morbidity and mortality (Weinhold, 2012). OC includes both direct emissions (primary organic carbon, POC) and secondary OC (SOC) formed in the atmosphere via oxidation (Robinson et al., 2007). Common sources of atmospheric POC and of SOC precursors are vehicular exhaust, industrial emissions, biogenic emissions, and biomass burning (Millet et al., 2005; Saarikoski et al., 2008; Genberg et al., 2011; Hu et al., 2012; Vodička et al., 2013; Heal and Hammonds, 2014; Huang et al., 2014a, b). Except near strong emission sources, secondary organic aerosol is the main contributor to the total organic aerosol mass concentration, frequently accounting for 72 ± 21 % (Zhang et al., 2007; Jimenez et al., 2009).
Trace metals account for only a small fraction of PM mass concentrations, but they can adversely impact human health (e.g., Lippmann et al., 2006; Hong et al., 2010). As some emission sources release specific trace elements, these elements can serve as useful source markers in PM source apportionment studies (Lee et al., 2011; Peltier and Lippmann, 2010; Han et al., 2005; Harrison et al., 2012; Karanasiou et al., 2009; Ondov et al., 2006; Querol et al., 2007; Viana et al., 2008; Yu et al., 2013). Elemental enrichments can also be used to roughly differentiate natural and anthropogenic sources (Khodeir et al., 2012; Rushdi et al., 2013). Relative abundances of crustal elements can help identify the sources of suspended dust, as these abundances are known to be different for different dust source regions (Engelbrecht et al., 2009).
In this study, we report measurements of ambient particulate matter in Riyadh, the capital of Saudi Arabia. In prior studies conducted in the Middle East, dust was identified as the major source of PM10 (Givehchi et al., 2013); however, contributions from anthropogenic sources to PM mass concentrations were found to be significant (> 82 % of total PM10 mass, Al-Dabbous and Kumar, 2015; > 50 % of PM10, Tsiouri et al., 2015). Tsiouri et al. (2015) summarized the major sources of PM10 in ambient air in the Middle East as oil combustion, resuspended soil, road traffic, crustal dust, and marine aerosol; significant sources of PM2.5 were oil combustion in power plants, resuspended soil, sand dust, and road traffic. Carbonaceous particles were estimated to account for 50–60 % of PM2.5 in cities in the State of Palestine, Jordan, and Israel (Abdeen et al., 2014). Not surprisingly, since oil production and processing was widespread across the Middle East, heavy oil combustion was estimated to contribute 69 % to PM2.5 mass and 18 % to PM10 in Jeddah, Saudi Arabia (Khodeir et al., 2012). Air quality in Riyadh reflects not only the impact of local and regional dust and regional oil extraction and refining but also significant local sources that include a heavy traffic load and multiple industries. We focus here on identifying the major sources of PM2.5 carbonaceous aerosol in Riyadh to provide a basis for formulating air pollutant mitigation strategies.
2.1 Sampling sites and data collection
Riyadh and its surroundings were divided into 16 12 km × 12 km sampling cells as shown in Fig. 1. Sampling locations within each cell were carefully chosen to best represent the mix of land use and other characteristics of the cell. From April to September 2012, an in situ semi-continuous OC ∕ EC analyzer (Sunset Laboratory Inc., Model-4), installed in a mobile laboratory, moved from cell to cell and measured hourly EC and OC, with some interruptions due to instrument maintenance or holidays. The sampling strategy is documented in Table S1 in the Supplement. In this instrument, volatile gases were removed from the samples by carbon denuders prior to collection. Airborne particles smaller than 2.5 µm were then collected on quartz fiber filters at a flow rate of 8 L min−1. Upon completion of a preset sampling duration, all carbon that had been accumulated on the filter was removed by heating the sample in multiple increasing temperature steps, first in a completely oxygen-free helium environment and then in a He/O2 environment. The vaporized compounds flowed through an oxidizer oven, were oxidized to carbon dioxide, and were detected via an infrared analyzer. An external methane (CH4) standard was injected at the end of every analysis and used to normalize the analytical result. Since in theory the quartz filter has had all of the collected carbonaceous aerosol removed during each analysis cycle, the filter was reused for multiple samples and changed only periodically.
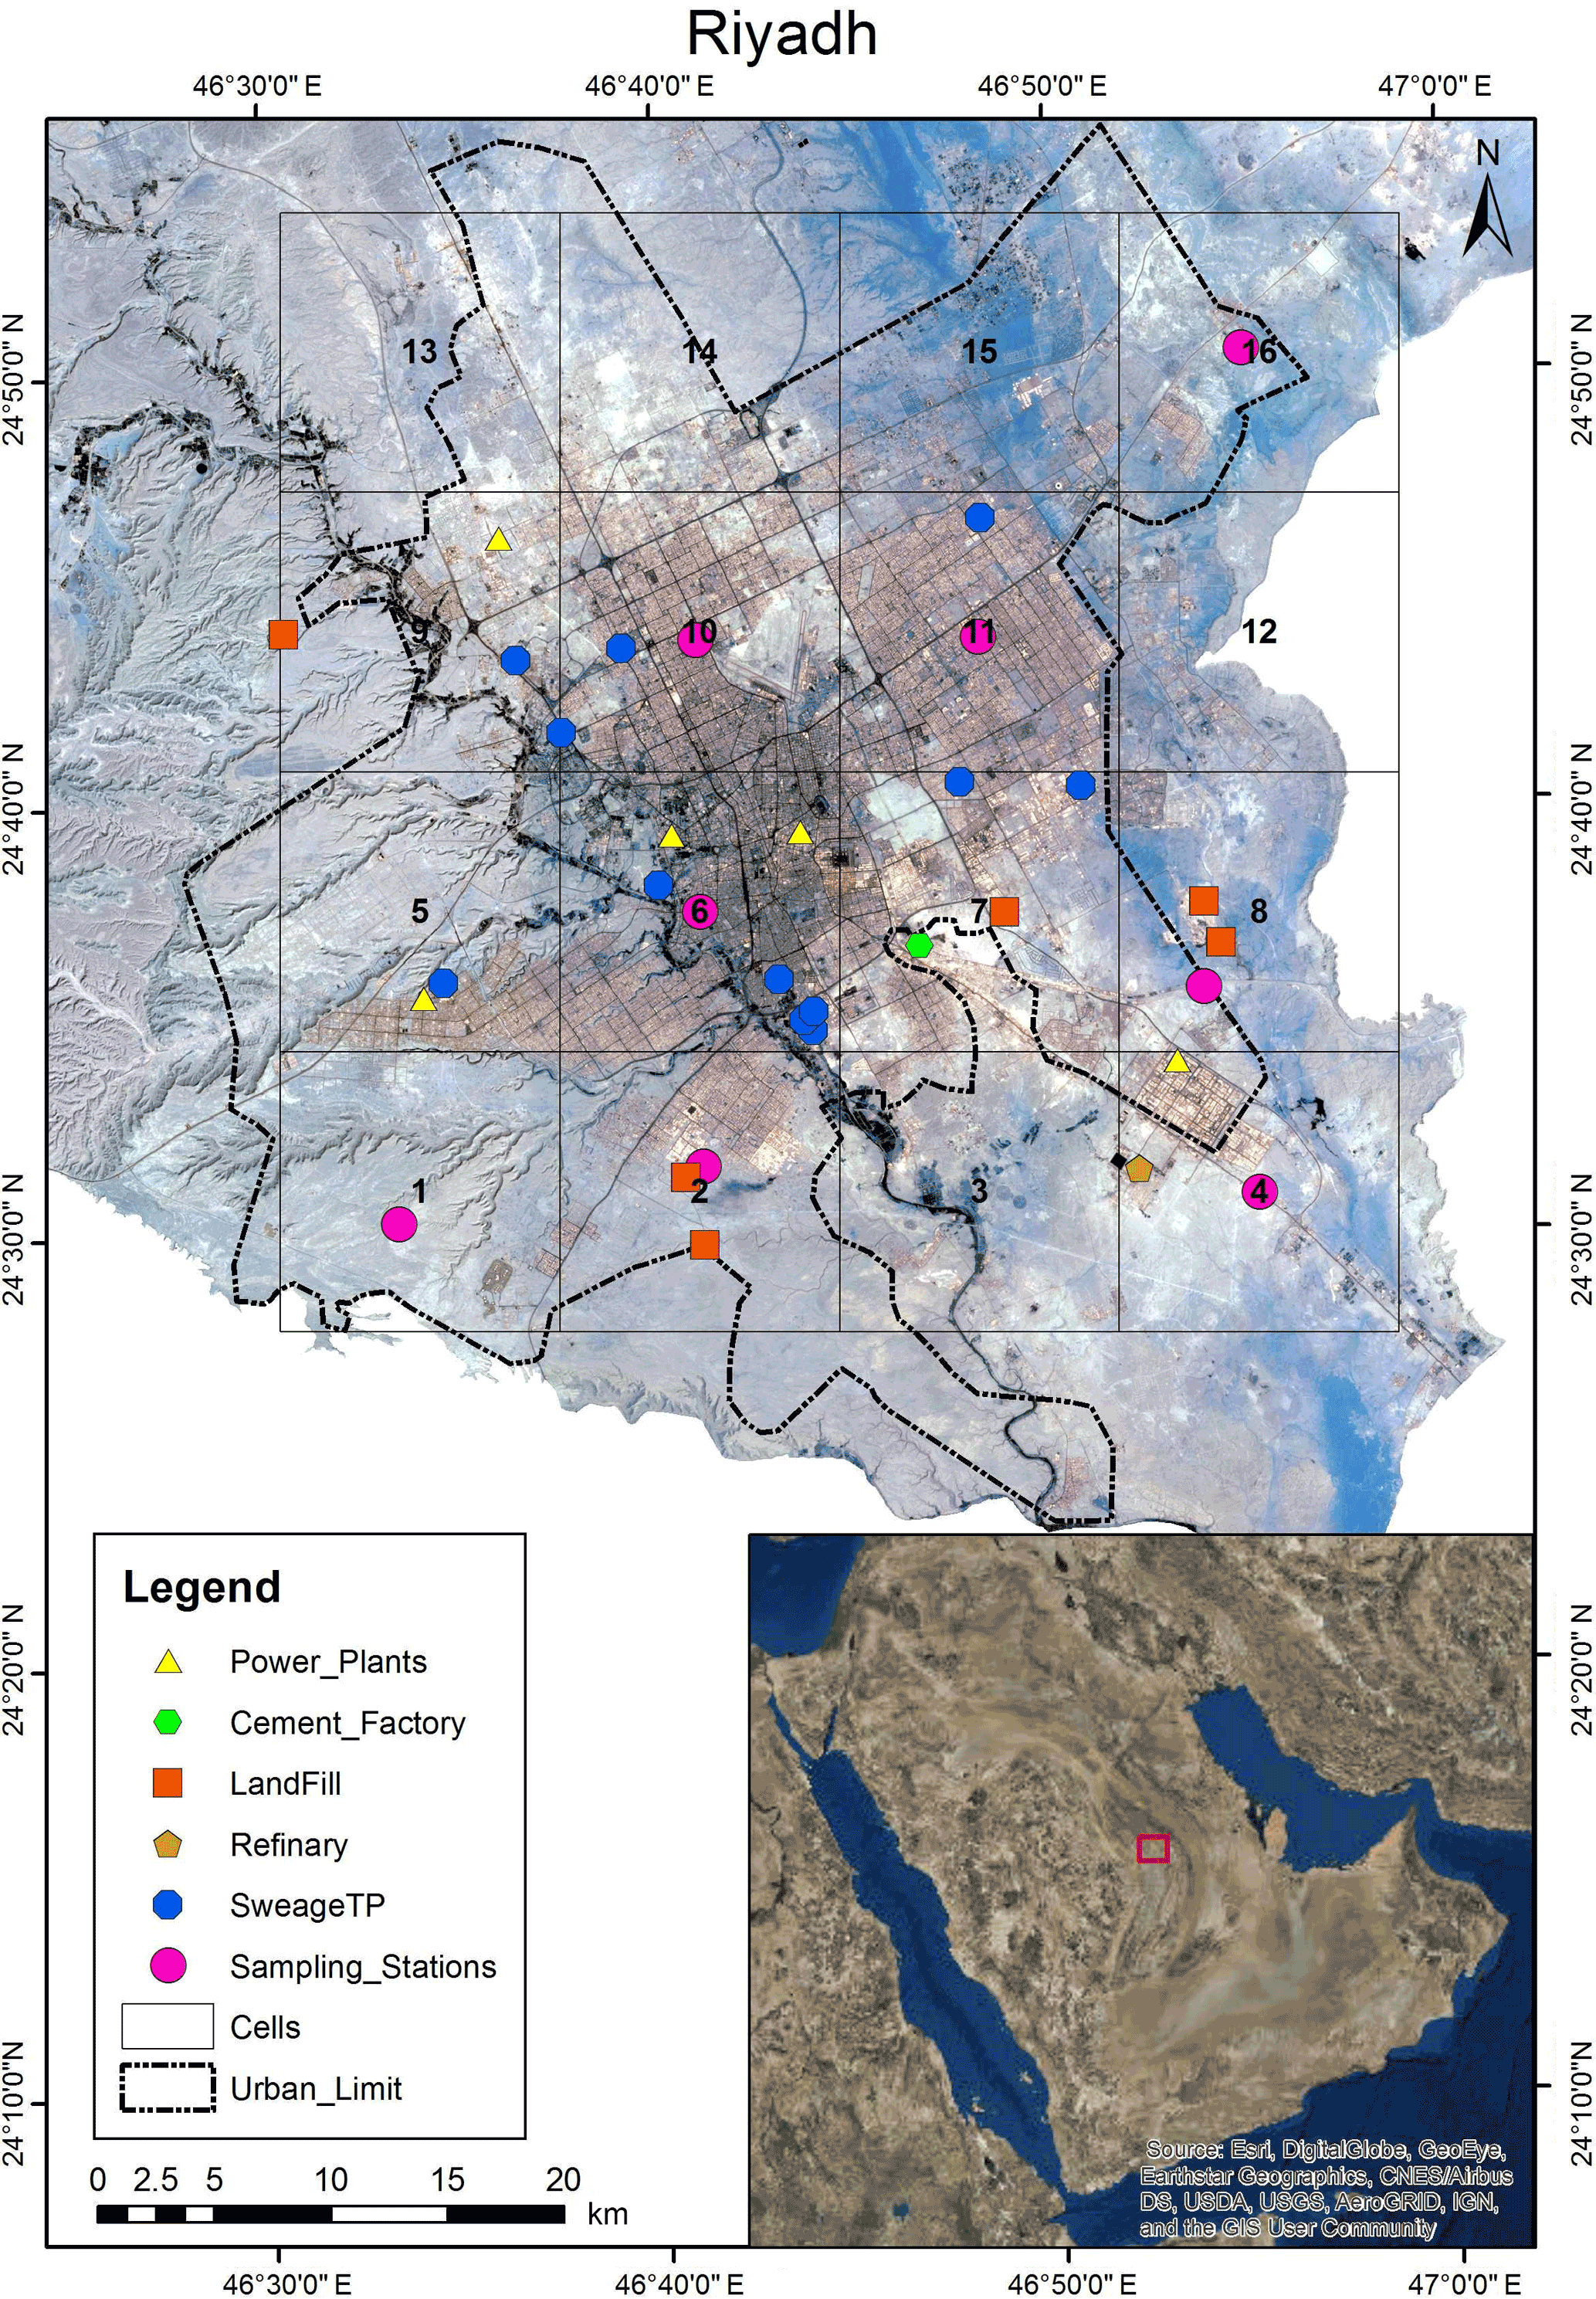
Figure 1Image of Riyadh and immediate surroundings. Potential emission sources and 16 sampling locations are indicated. The characteristics of the sampling locations are listed in Table 1.
A detailed description of the PM10 sample collection and elemental analysis methodologies can be found in Alharbi et al. (2015). In brief, sampling was conducted from the same mobile platform and concurrent with the OC ∕ EC sampling. A PM10 inlet was used to sample ambient aerosol onto quartz microfiber filters over a 24 h period. These samples were collected every 3 days and elemental analyses for Al, As, B, Ca, Cd, Co, Cr, Cu, Fe, K, Li, Mg, Mn, Mo, Na, Ni, Pb, Te, V, and Zn were performed by inductively coupled plasma atomic emission spectroscopy (ICP-AES). NO and NO2 (NOx) were measured by chemiluminescence and O3 was measured by UV photometer simultaneously using the Signal Ambirak air quality monitoring system (Signal Ambitech Ltd, UK).
2.2 EC and OC re-split method
The Sunset semi-continuous EC ∕ OC analyzer adopts the same thermal–optical analysis method for determination of OC and EC that is commonly applied to the offline analysis of filter samples. The OC and EC mass concentrations (as mass of C) are quantified by a calibrated non-dispersive infrared sensor (NDIR) signal that detects the evolved CO2. Ideally, OC is defined as the carbon evolved under increasing temperature ramps conducted in an inert atmosphere (100 % He), and EC is defined to be the subsequent carbon evolution in an oxidizing atmosphere (He ∕ 10 % O2 mixture). In the inert atmosphere, rather than simply volatilizing, a fraction of OC may be pyrolyzed due to insufficient oxygen, and this pyrolyzed OC may be evolved in the subsequent oxidizing atmosphere, appearing as EC. This fraction of OC is usually called pyrolyzed organic carbon (PyOC). To subtract PyOC from EC, laser transmittance or reflectance is deployed to monitor the variations in filter darkness; the transmittance or reflectance responds to the presence of EC throughout the analysis but then drops when PyOC is formed and rises again as PyOC is evolved. The fraction of total assigned EC evolved in the oxidizing atmosphere before the laser signal returns to its initial value is believed to be due to PyOC, so in post-analysis the final EC is reported as the difference between the total carbon evolved in the oxidizing atmosphere and the PyOC. This methodology has been automated in the Sunset instrument. However, unusual EC and OC splits for a large number of samples were observed during the study period: (a) split points jumped to the end of the analysis because the laser response did not rebound to its initial value before the CH4 calibration phase; or (b) split points were located in the pre-oxygen position. These split-point deviations were ascribed to refractory residue on the filters: the laser correction factor supplied in the standard manufacturer software may not be applicable to the dusty environment of Riyadh (Polidori et al., 2006; Jung et al., 2011; Wang et al., 2012). Therefore, observed relationships between laser response and temperature in the CH4+ O2 injection calibration phase were used to develop a corrected split point. The correction methodology assumed that only refractory material was present on the filter in this phase, so that effects of this refractory material on the laser response to temperature variations could be isolated, corrected, and these corrections applied during the other analysis phases. A full description of the methodology is found in the Appendix. We noted, however, that measurement artifacts from carbonates in dust may have been present in this study, which would result in a high bias in the OC measurements. As noted in Karanasiou et al. (2011) and in the standard operating procedure (SOP) document published by the Research Triangle Institute (RTI; https://www3.epa.gov/ttnamti1/files/ambient/pm25/spec/RTIIMPROVEACarbonAnalysisSSLSOP.pdf), the evolution of carbonates from filter samples during thermal analysis can occur over several carbon peaks. While it is preferred to use acid decomposition of carbonates (on separate sample punches) to obtain the best quantification, Karanasiou et al. (2011) demonstrated that the protocol used in this study completely evolves carbonates in the OC fraction, and that manual integration to isolate the carbonate concentration was possible but carried large uncertainty. Hence, we did not attempt to separately quantify carbonate in this work.
2.3 SOC estimation by minimum R2 (MRS) method
The EC tracer method is widely used to estimate secondary organic carbon mass concentrations, applying the following equations, which assume that EC has only combustion sources:
where (OC ∕ EC)pri is the OC ∕ EC ratio in fresh combustion emissions, b denotes non-combustion-derived POC, and OCtotal and EC are ambient measurements. The key to successful application of this method is to begin with an appropriate estimate of the (OC ∕ EC)pri ratio. Several approaches have been documented to determine (OC ∕ EC)pri. Gray et al. (1986) directly adopted the ratios from emission inventories. Turpin and Huntzicker (1995) used the measured OC ∕ EC ratio when local emissions were dominant in a certain location or over a specified period. Based on the expectation that co-emitted POC and EC are well correlated, Lim and Turpin (2002) took the slope of OC against EC using OC ∕ EC ratio data for the lowest 5–10 % values of that ratio. Millet et al. (2005) proposed that a critical point where SOC was independent of EC should represent the primary OC ∕ EC ratio; the critical point was found by a minimum R2 (MRS) method. Assuming that non-combustion sources (i.e., the b term in Eq. 2) are negligible, this method can derive the most accurate primary OC ∕ EC ratio, compared with previously proposed approaches (Wu and Yu, 2016). However, this method may underestimate the SOC concentration if some SOC is associated with EC: co-emitted semi-volatile POC could rapidly oxidize to low-volatility SOC and partition on the surface of EC. However, given that accurate emission inventories were not available for Riyadh, we employed this method in the absence of a priori knowledge of (OC ∕ EC)pri to provide a conservative estimate of the SOC concentration during our observational period.
The methodology for and applications of the MRS method were documented in Millet et al. (2005), Hu et al. (2012), and Wu and Yu (2016). The non-combustion source (b term) was assumed to be zero. A series of coefficients of determination (R2) between EC and SOC calculated by Eqs. (1) and (2), varying (OC ∕ EC)pri from 0 to 10 using steps of 0.01 in the ratio, was generated. At low (OC ∕ EC)pri ratio, a significant portion of the estimated SOC still belonged to POC. At high (OC ∕ EC)pri ratio, the term (OC ∕ EC)pri × EC largely exceeded OCtotal and became dominant. At the correct ratio, all the POC was removed and R2 of SOC and EC reached a minimum. This ratio was then used to estimate SOC in all samples.
2.4 Back trajectory analysis
To develop an understanding of potential regional influences on observed PM, we calculated 24 h back trajectories (BTs) every 3 h during each sampling period using the National Oceanic and Atmospheric Administration (NOAA) Hybrid Single-Particle Lagrangian Integrated Trajectory (HYSPLIT; Stein et al., 2015; Rolph et al., 2017). Trajectories were initiated for a starting height of 500 m above ground level (a.g.l.). Residence time analysis (RTA), describing the probability of air mass origins, was also performed (Ashbaugh et al., 1985). The probability (Pij), representing the residence time of a randomly selected air mass in the ijth cell during the observational period, was calculated as follows:
where nij is the number of trajectory segment endpoints that fell in the ijth cell, and N is the total number of endpoints.
Concentration weighted trajectory (CWT) analysis is another effective tool that we combined with back trajectory data and pollutant concentration to trace the source origin for certain species. The calculation formula is as follows:
where Cij is the average weighted concentration in the grid cell (i, j), Ci is the measured species concentration, τijl is the number of trajectory endpoints in the grid cell (i, j), and M is the number of samples that have trajectory endpoints in the grid cell (i, j).
2.5 Positive matrix factorization analysis
Positive matrix factorization (PMF) has been successfully applied to aerosol composition data to suggest sources impacting the sampling site (Reff et al., 2007; Viana et al., 2008). We aligned daily-average OC and EC with concurrent averaged measurements of metal concentrations in the PM10 fraction (Al, Ca, Cu, Fe, K, Mg, Mn, Na, Ni, Pb, and V) and prepared a matrix of size 35 × 13 for input to the USEPA PMF, version 5.0 (https://www.epa.gov/air-research/positive-matrix-factorization-model-environmental-data). Data points with “ND” were replaced by one-half of the detection limit and the corresponding uncertainties were assigned as five-sixths of the detection limit. The uncertainties for all other data were calculated as sij+ DLij∕3, where sij represents the analytical uncertainty for species i in the sample j, and DLij represents the detection limit (Polissar et al., 1998; Reff et al., 2007). In this study, the analytical uncertainty was assumed to be 5 % of the corresponding concentration for metal species. Uncertainties for the EC and OC data were not reported. Norris et al. (2014) suggested that, for such cases, the initial uncertainties be set to a proportion of the concentration. The uncertainties for OC and EC were therefore calculated as 10 % of the corresponding concentrations for this study.
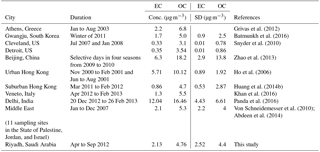
Table 1Comparison of OC and EC concentrations (µg m−3) measured in urban areas worldwide.
3.1 Overview of EC and OC concentrations
Figure S1a in the Supplement shows the time series of OC and EC concentrations during the study period and denotes the corresponding sampling cells in which the measurements were obtained. Average OC and EC concentrations during the observational period were 4.8 ± 4.4 and 2.1 ± 2.5 µg C m−3, respectively (we will use µg m−3 for OC and EC hereafter when referring to µg C m−3). Table 1 presents some comparative values of measured EC and OC concentrations in PM2.5 in urban areas worldwide, since urban areas are expected to share some similar anthropogenic source types (e.g., vehicular and industrial emissions) with Riyadh. The average concentrations in this work for both EC and OC were remarkably consistent with those reported by von Schneidemesser et al. (2010) and Abdeen et al. (2014) for 11 Middle Eastern sampling sites, including Tel Aviv, a major city in Israel (OC: 4.8 and EC: 1.6 µg m−3). The average OC concentrations were also comparable to those reported for suburban Hong Kong (4.7 µg m−3; Huang et al., 2014b), higher than Cleveland and Detroit, US (3.10 and 3.54 µg m−3; Snyder et al., 2010), but lower than those reported for Gwangju, South Korea (5.0 µg m−3; Batmunkh et al., 2016), Veneto, Italy (5.5 µg m−3; Khan et al., 2016), Athens, Greece (6.8 µg m−3; Grivas et al., 2012), urban Hong Kong (10.1 µg m−3; Ho et al., 2006), Delhi, India (16.5 ± 6.6 µg m−3; Satsangi et al., 2012), and Beijing, China (18.2 ± 13.8 µg m−3; Zhao et al., 2013), reflective of the different mix of sources and different photochemical environments. EC concentrations also vary widely among urban regions, depending on the characteristics of local sources.
The Riyadh sampling site characteristics and the corresponding average OC and EC concentrations in each grid cell are summarized in Table S1. Results of a one-sided t test (p < 0.001) on OC and EC data from industrial and residential sites suggested a significant difference in carbonaceous aerosol concentrations between the two site types: OC mass concentrations in industrial sites were 1.4 times those in the residential sites, and EC mass concentrations were 1.7 times higher (Fig. 2). The mean OC ∕ EC ratio was lower in the industrial sites (3.1) than in residential sites (6.0), suggesting the importance of POC emissions in industrial regions and a larger SOC contribution in residential areas. We also divided Riyadh into four quadrants to investigate the spatial variation of OC and EC across the city. Figure 3 shows that OC and EC concentrations were higher in the eastern quadrants.
Figure 4 shows the results of the RTA, demonstrating that air masses arriving in Riyadh were mainly from within Saudi Arabia and from the south/southwest of the city in April and May, and from the north/northeast from June to September, extending to the west coast of the Persian Gulf. These two dominant wind directions were used to stratify data in Fig. S1b, which show that the average OC concentration increased from 3.8 to 5.3 µg m−3 and EC from 1.1 to 2.7 µg m−3 when the air mass source region shifted from south/southeast to north/northeast, respectively.

Figure 2Observed OC and EC concentrations (µg m−3) separated by site types and air mass source region according to Table 1 and Fig. 1b. Box-and-whisker plots show median and quartile values; averages are shown as circles and outliers as crosses.
3.2 Diurnal variation of OC and EC
Figure 5 shows the diurnal variations in OC and EC mass concentrations. OC and EC concentrations peaked from 06:00 to 09:00 LT and were elevated during nighttime (after 16:00 LT). NOx also showed a similar diurnal pattern (Fig. S2). The morning peak coincided with traffic rush hours. The diurnal variations of OC and EC on weekdays and weekends exhibited similar trends (Fig. S3), but EC was higher during weekdays. The elevation of OC, EC, and NOx at night after 16:00 LT may be attributed to the accumulation of pollutants in the shallower nocturnal boundary layer. Average OC ∕ EC ratios showed no obvious trends; however, the median OC ∕ EC ratio decreased slightly over the time period when OC and EC concentrations built up, probably due to the increased contributions from primary emissions. The average OC ∕ EC ratio had a peak around 14:00 LT, corresponding with peak concentrations of O3, suggestive of secondary aerosol formation.
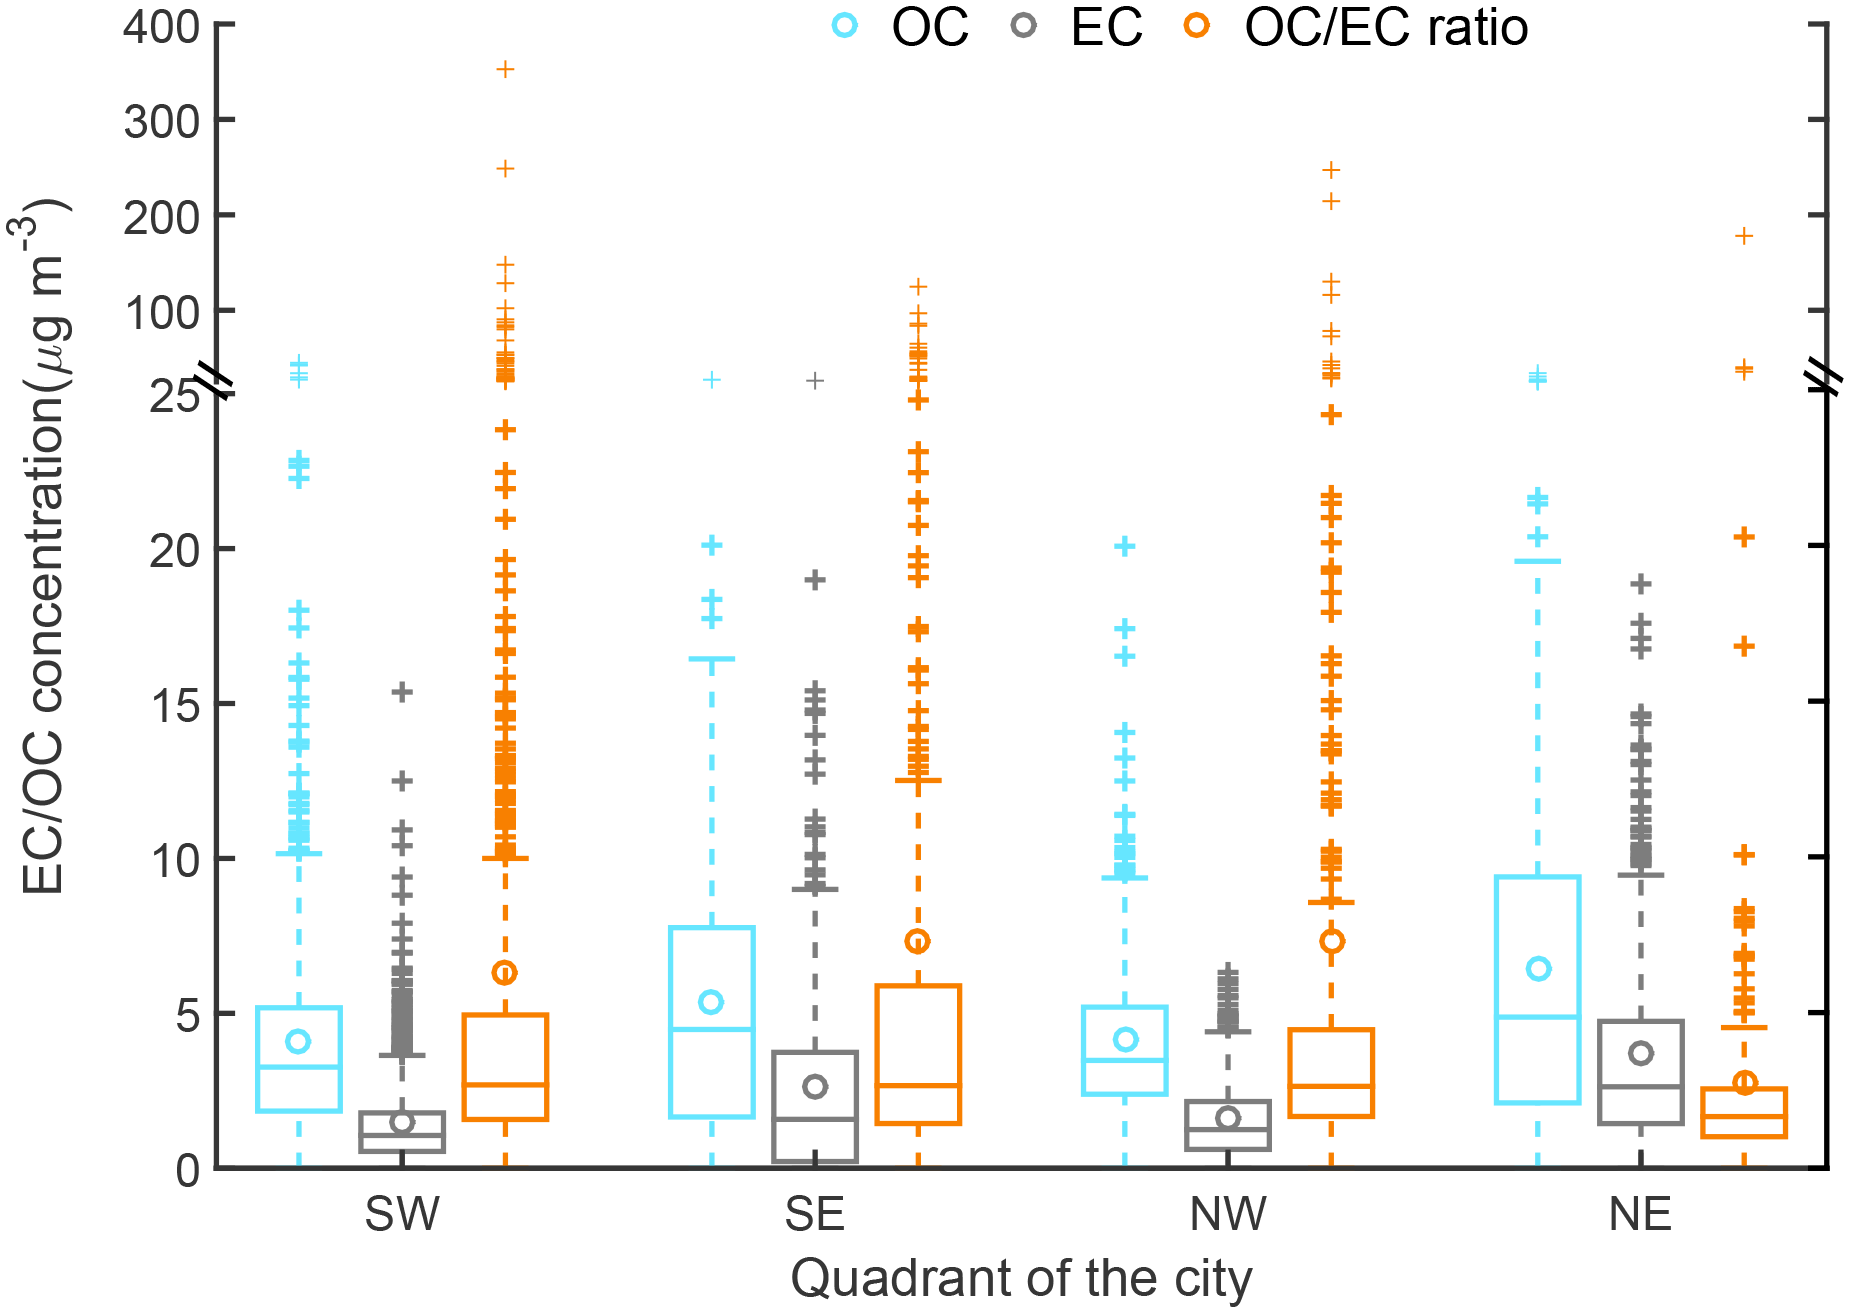
Figure 3Spatial variation of OC and EC concentrations (µg m−3) and OC ∕ EC ratios in each quadrant of Riyadh. SW represents southwest Riyadh and includes the sampling cells 1, 2, 5, and 6; SE represents southeast Riyadh and includes the cells 3, 4, 7, and 8; NW represents northwest Riyadh and includes the cells 9, 10, 13, and 14; NE represents northeast Riyadh and includes cells 11, 12, 15, and 16.
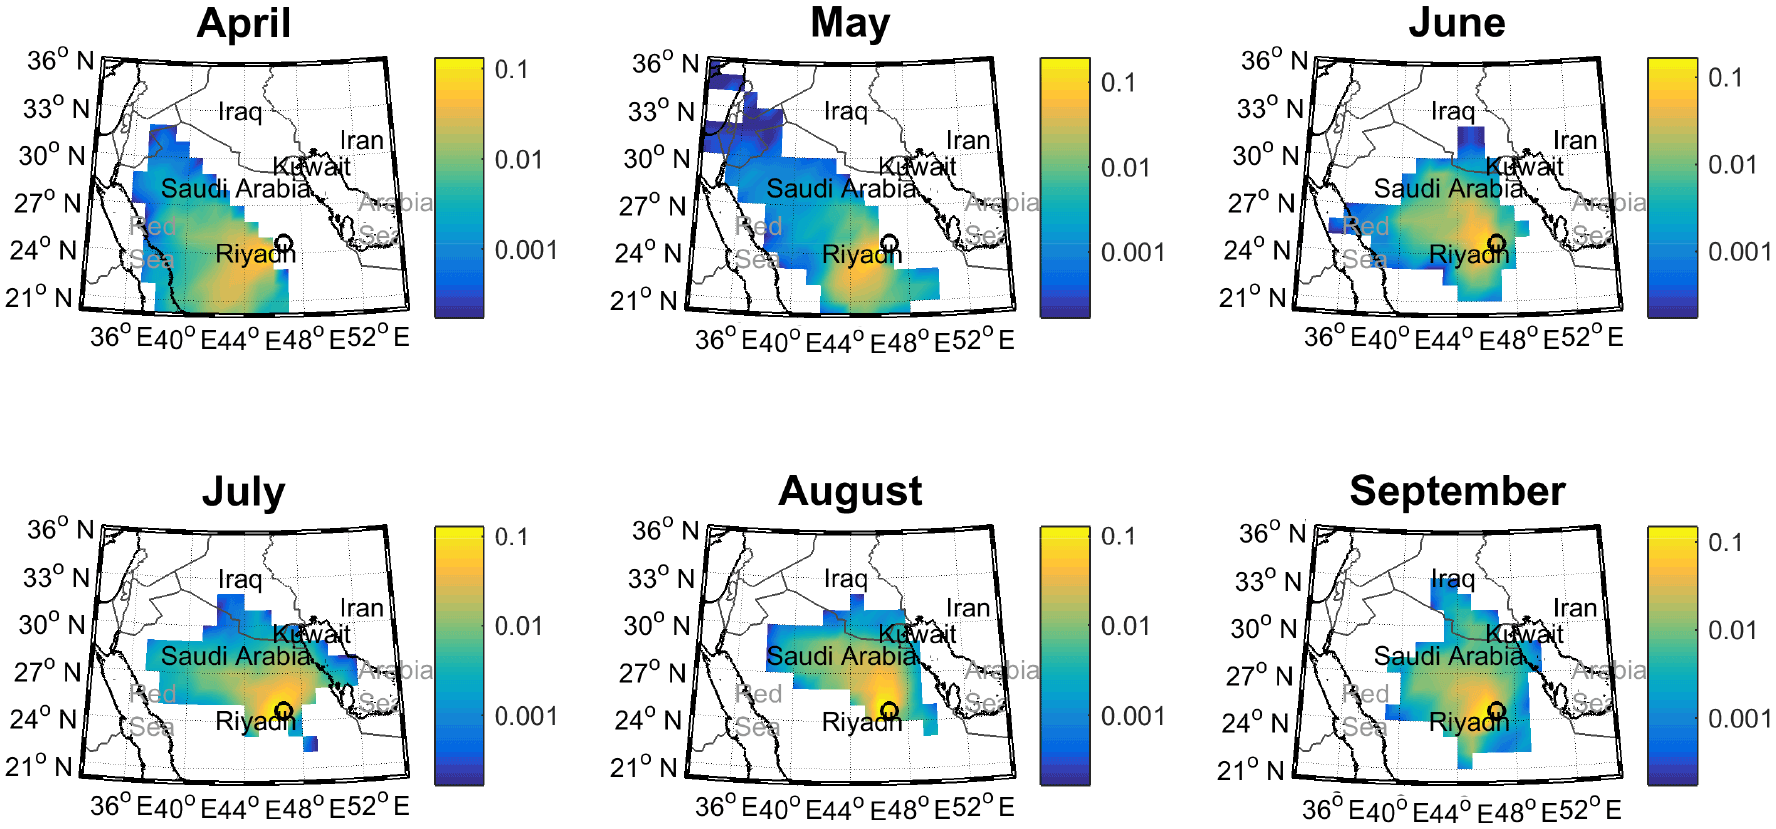
Figure 4Back trajectory (24 h) residence time analysis of air masses arriving at Riyadh from April to September 2011. Back trajectories were initiated from a starting height of 500 m a.g.l. The color bar represents the normalized number count of the endpoints.
3.3 Weekend effect in OC and EC concentrations
A “weekend effect” in concentrations of traffic-derived PM has been noted in previous studies (e.g., Grivas et al., 2012; Bae et al., 2004; Moteballi et al., 2003; Lim and Turpin, 2002; Jeong et al., 2004; Lough et al., 2006). To investigate whether a weekend effect could be discerned in the Riyadh dataset, two-sample t tests assuming unequal variances were performed for hourly EC and OC samples, grouped according to whether they were obtained on weekdays (Saturday to Wednesday) or on weekends (Thursday and Friday). The test indicated a statistically significant difference (29 % lower on weekends) in EC concentrations between weekdays and weekends, but no significant difference in OC (p < 0.001 with a 95 % confidence level), as shown in Fig. 6. NOx concentrations were also reduced during weekends, by 48 % compared to weekdays (Fig. S4). This reduction may be ascribed to the decrease in the local vehicular activities and industrial activities during the weekend. Therefore, local EC can be roughly estimated to be 0.51 µg m−3, about 22 % of total EC, by the difference in average EC concentrations between weekdays and weekends. As there were still some local traffic and industrial activities during the weekend, this estimation is likely a lower bound of the local contribution to EC concentration in this study. OC concentrations had no significant weekday–weekend variation. The decrease of EC was the main driver of the increasing OC ∕ EC ratio during the weekends, indicating the reduced primary emission and effective SOC formation/transport during the weekends.

Figure 5Diurnal variation of (a) OC, (b) EC, and the (c) OC ∕ EC ratio. The boxes represent the interquartile range and the upper and lower whiskers represent 90 and 10 %, respectively.
3.4 SOC estimation
Figure 7 shows the determination of (OC ∕ EC)pri using the MRS method. The value of this ratio derived in this study was 1.01, which occurred at the 14th percentile in the observed OC ∕ EC ratios. In the compilation of PM2.5 OC and EC emission profiles presented by Chow et al. (2011), the (OC ∕ EC)pri for oil combustion was documented to range from 0.2 to 2.5 with an average of 1.0 ± 0.2, 0.9 to 8.1 with an average of 3.4 ± 2.2 for gasoline emissions, and 0.2 to 2.7 with an average of 1.0 ± 0.8 for diesel emissions. Our estimate was within with these ranges and was closer to the averages for oil combustion and diesel emissions, consistent with expected important contributions from these sources to PM2.5 carbonaceous aerosol in Riyadh. Using our MRS-derived (OC ∕ EC)pri in Eqs. (1) and (2), we computed average POC and SOC concentrations of 2.0 ± 2.4 and 2.8 ± 3.4 µg m−3, respectively, suggesting that POC and SOC contributions to PM2.5 were comparable during our study. The average POC and SOC concentrations were 1.0 ± 1.0 and 2.7 ± 4.0 µg m−3, respectively, when transport was from the south/southwest. POC increased to 2.5 ± 2.7 µg m−3 and SOC was almost unchanged when the direction of transport was from the north/northeast. Variability in OC was thus mainly due to variability in POC. The sampling locations were in cells classified as being in the outskirts of the city when south/southwesterly transport was prevalent but included both outskirts and in-city grids when north/northeasterly transport was prevalent. The increase in POC during northerly transport regimes could not therefore be attributed solely to the influence of local primary emissions, since transport of POC from outside Riyadh was also possible.
The diurnal variation of SOC (Fig. S3) showed a small peak of SOC concentration in the morning from 07:00 to 09:00 LT, lagging behind the POC and EC morning peaks by about 2 h; this result was not unexpected since photochemical production of SOC will require time for reactions to proceed once precursors have accumulated in the atmosphere. A second small peak in SOC concentration occurred at 14:00 LT, concurrent with ozone formation (Fig. S2) and consistent with the variation in OC ∕ EC ratios discussed in Sect. 3.3. The diurnal variations of POC and SOC were similar on weekdays and weekends, but the weekday-to-weekend changes in POC and SOC had opposite trends. The estimated POC was 2.2 ± 2.5 µg m−3 on weekdays and decreased to 1.5 ± 1.9 µg m−3 on weekends. The estimated SOC was 2.6 ± 2.9 µg m−3 on weekdays and increased by 23 % to 3.2 ± 4.5 µg m−3 on weekends. The elevated SOC during weekends was likely due to regional production and transport. With regards to spatial variation, POC and SOC were 3.5 ± 2.7 and 3.2 ± 2.9 µg m−3 in the industrial sites, 2.1 ± 2.6 and 2.6 ± 3.0 µg m−3 in the residential sites, and 1.1 ± 1.1 and 2.8 ± 4.1 µg m−3 in the outskirts sites, respectively. SOC concentrations were 2.5 times those of POC in the outskirts sites, an expected result since these latter sites are farther removed from the sources of primary emissions within the city proper. The results were consistent with the study of von Schneidemesser et al. (2010) that SOC (i.e., OC that was left unapportioned by a chemical mass balance model) was estimated to be 30–74 % of the total OC in 11 sites in the Middle East, having climatological conditions similar to those in Riyadh.
3.5 Possible sources of PM2.5 carbonaceous aerosols
3.5.1 Correlation between OC, EC, and other elemental species
As a first step in seeking signatures of sources of carbonaceous aerosol in Riyadh, we conducted an analysis of the correlations between OC or EC and measured elemental species. We note that OC and EC were measured in the PM2.5 fraction, while elemental species concentrations were obtained for the PM10 fraction, which also included the PM2.5. OC and EC were poorly correlated with K, which we interpreted as indicating a negligible influence of biomass burning on PM. Al, Fe, Mg, Mn, and Ca are found in crustal soils and in PM samples of windblown dust. EC did not correlate well with these species (R2 < 0.35; not shown). However, OC had a relatively strong correlation with Ca (R2 of 0.63; Figs. 8 and S7) but, similar to EC, a poor correlation with other dust species (not shown). These findings indicated that OC may have shared a source with Ca, but this source was not likely to be associated with windblown dust. The correlation between SOC and Ca was stronger than that between POC and Ca (Fig. S6). The thermo-optical method may have measured CaCO3 as OC, and the subsequent estimates of SOC separated two sources: one associated with combustion and EC (“primary”), and another associated with CaCO3 (and mislabeled “secondary”). Concentrations of Al and of other metals (Fe, K, Mg, and Mn) were strongly correlated (R2 > 0.9), supporting their common dust origin (Fig. 8). The correlation between Ca and other dust metal species (Al, Fe, K, Fe, and Mg), however, showed two divergent regimes, suggestive of an additional Ca-containing source besides dust, that may have shared the same sources as OC. Therefore, understanding the sources of Ca became a prerequisite in understanding the sources of OC.
The enrichment factor (EF) is a practical and convenient tool to differentiate natural and anthropogenic sources of metal species (Khodeir et al., 2012; Rushdi et al., 2013). The EF can be calculated using the following equation (Taylor, 1964):
where X is the measured metal concentration, and Cref is the concentration of the reference metal species. The equation compares the ambient elemental abundance of two species with their source abundance. An EF less than 10 suggests that the sample may come from a natural crustal source and an EF value greater than 10 indicates possible anthropogenic influence (Biegalski et al., 1998). Al, Fe, and K were all used as reference species to test for robustness of the findings. Figure S6 shows that, for all three reference species, the EFs for Al, Fe, K, Mn, Mg, Na, and V were calculated to be less than 10, suggesting a dominant crustal type origin. The EFs of Ni, Zn, Cr, Co, Pb, Li, B, As, Mo, Cd, and Te were calculated to be larger than 10, suggestive of the influence of anthropogenic emissions, e.g., traffic emissions, fossil fuel combustion, and non-ferrous metal industries. The EF for Ca was calculated to be ∼ 10, consistent with the idea that it may have two sources in Riyadh, one natural and one anthropogenic.
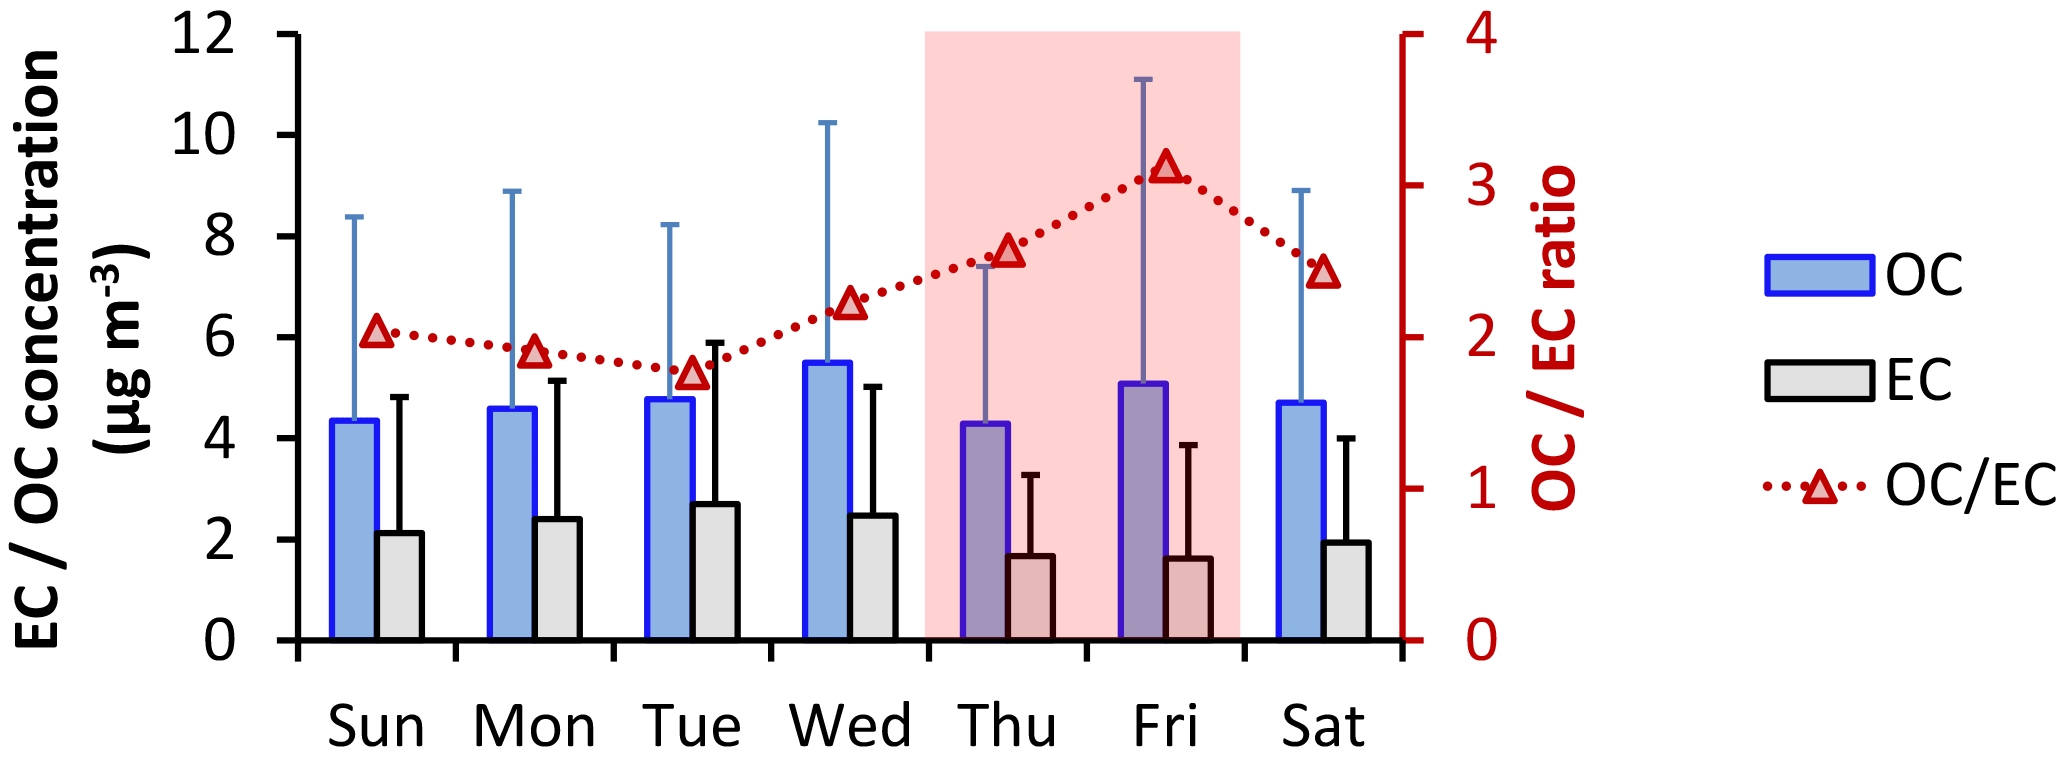
Figure 6Day-of-week variation in OC (µg m−3), EC (µg m−3), and the OC ∕ EC ratio during the observational period. The shading days (Thursday and Friday) were the weekends in Saudi Arabia in 2012.
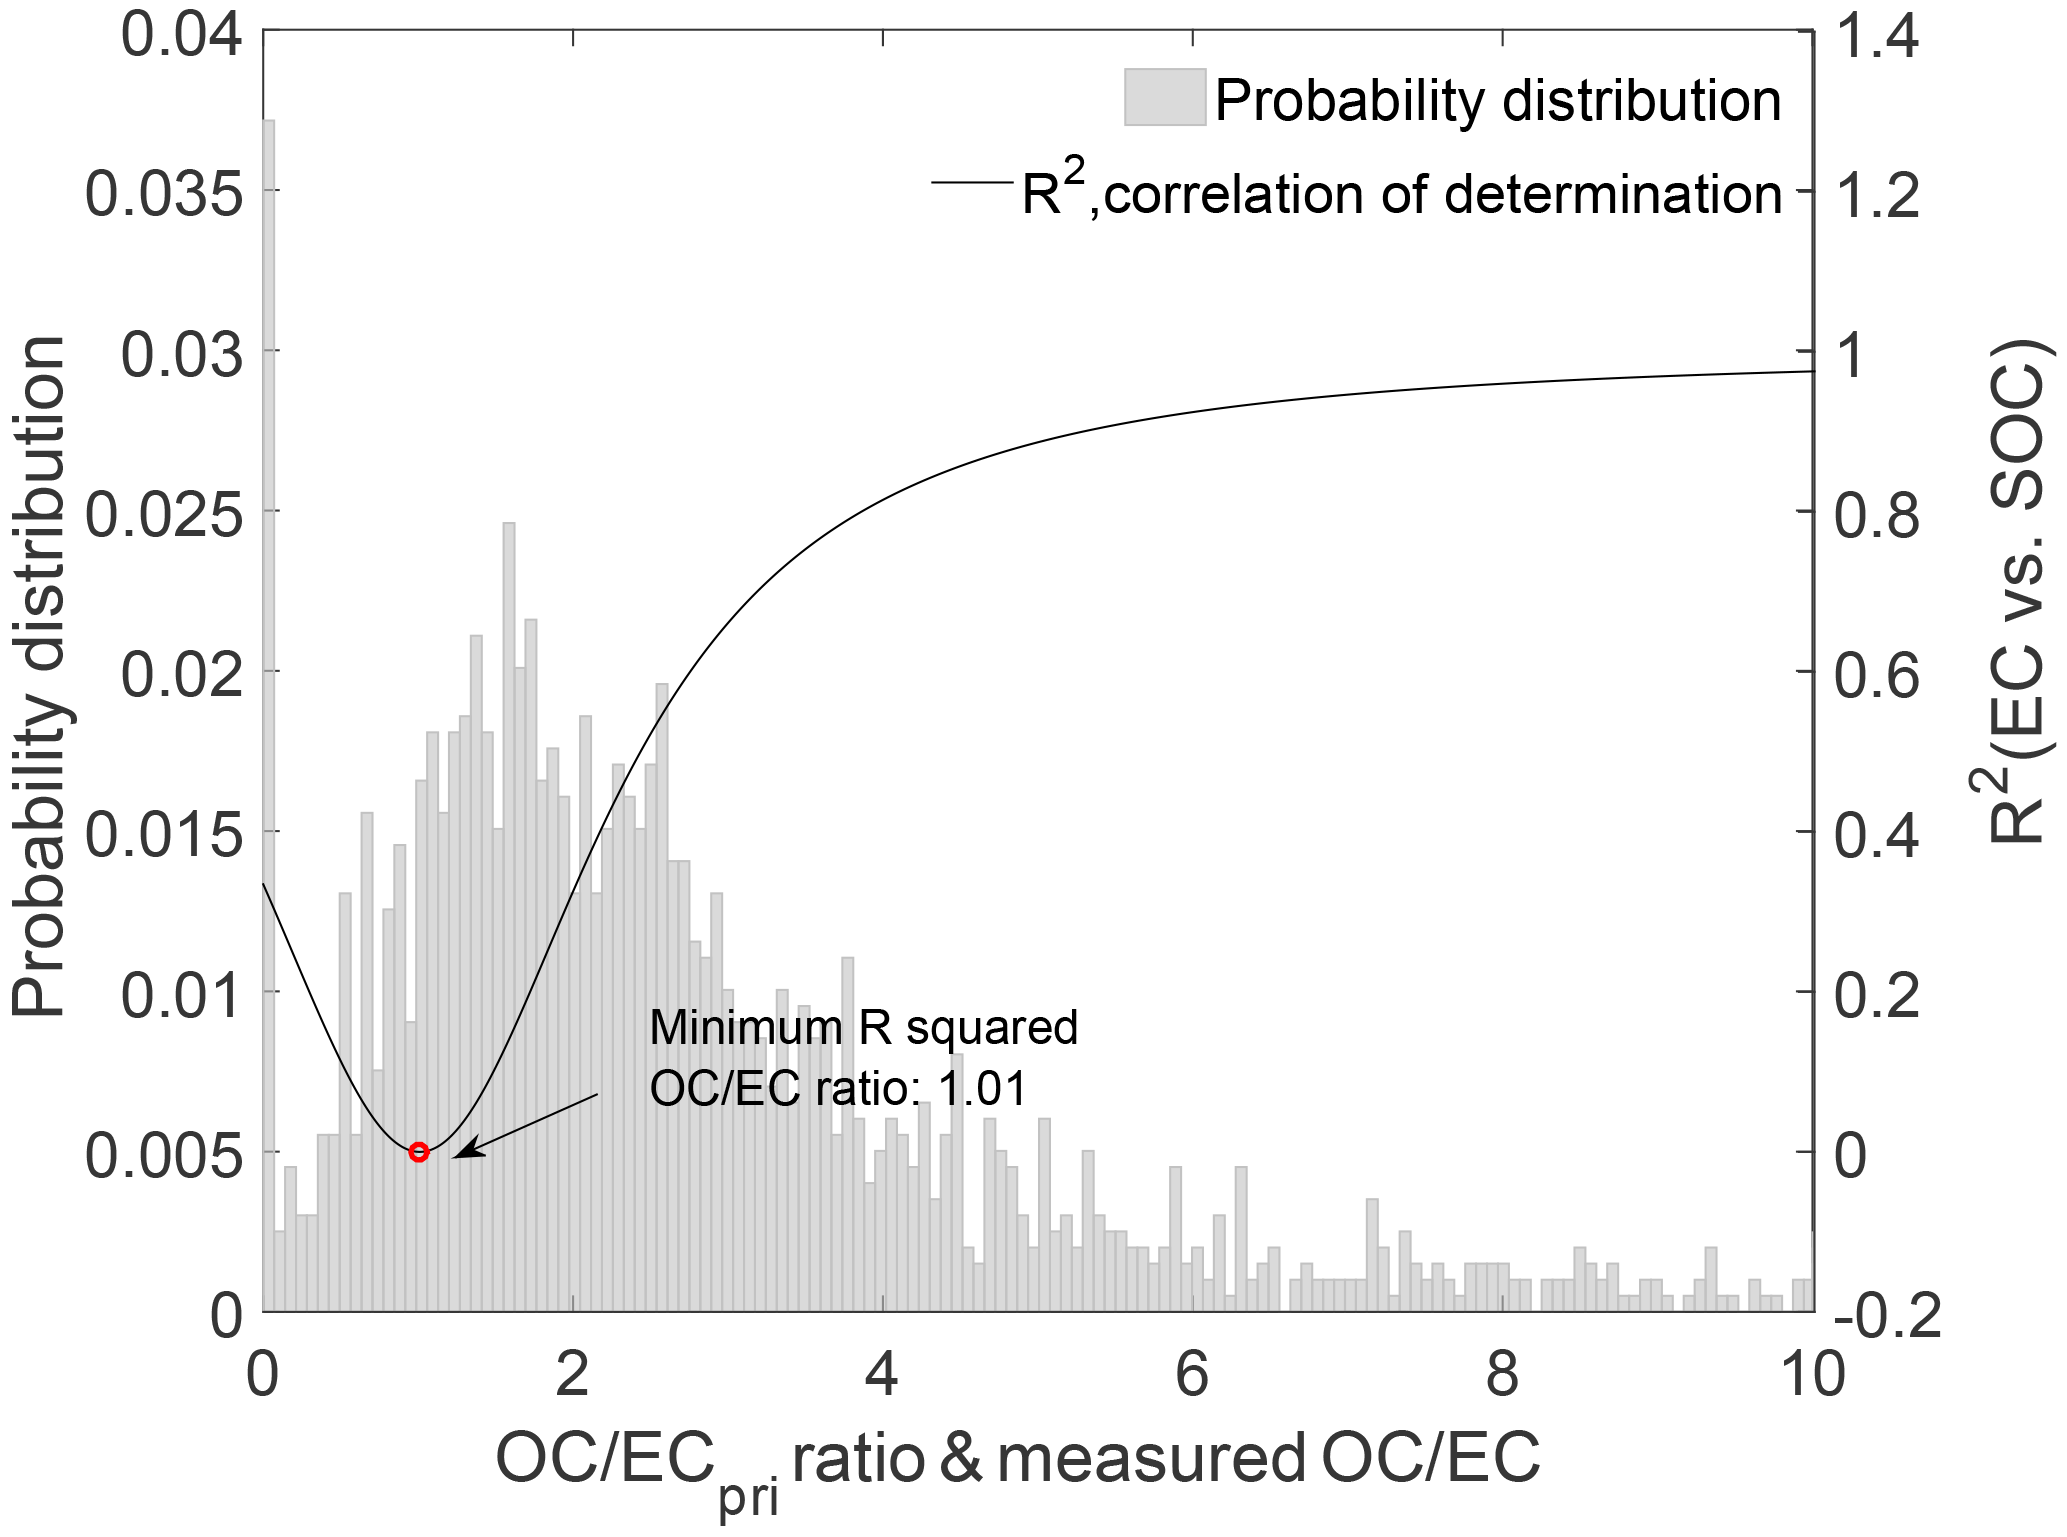
Figure 7Determination of (OC ∕ EC)pri using the MRS method. The black curve is the coefficient of determination (R2) between SOC and EC as a function of the assumed primary OC ∕ EC ratio. The grey shaded area represents the probability distribution of the measured OC ∕ EC ratios. The turning point (red circle) in the curve gives the best-fit primary emission ratio (OC ∕ EC)pri.
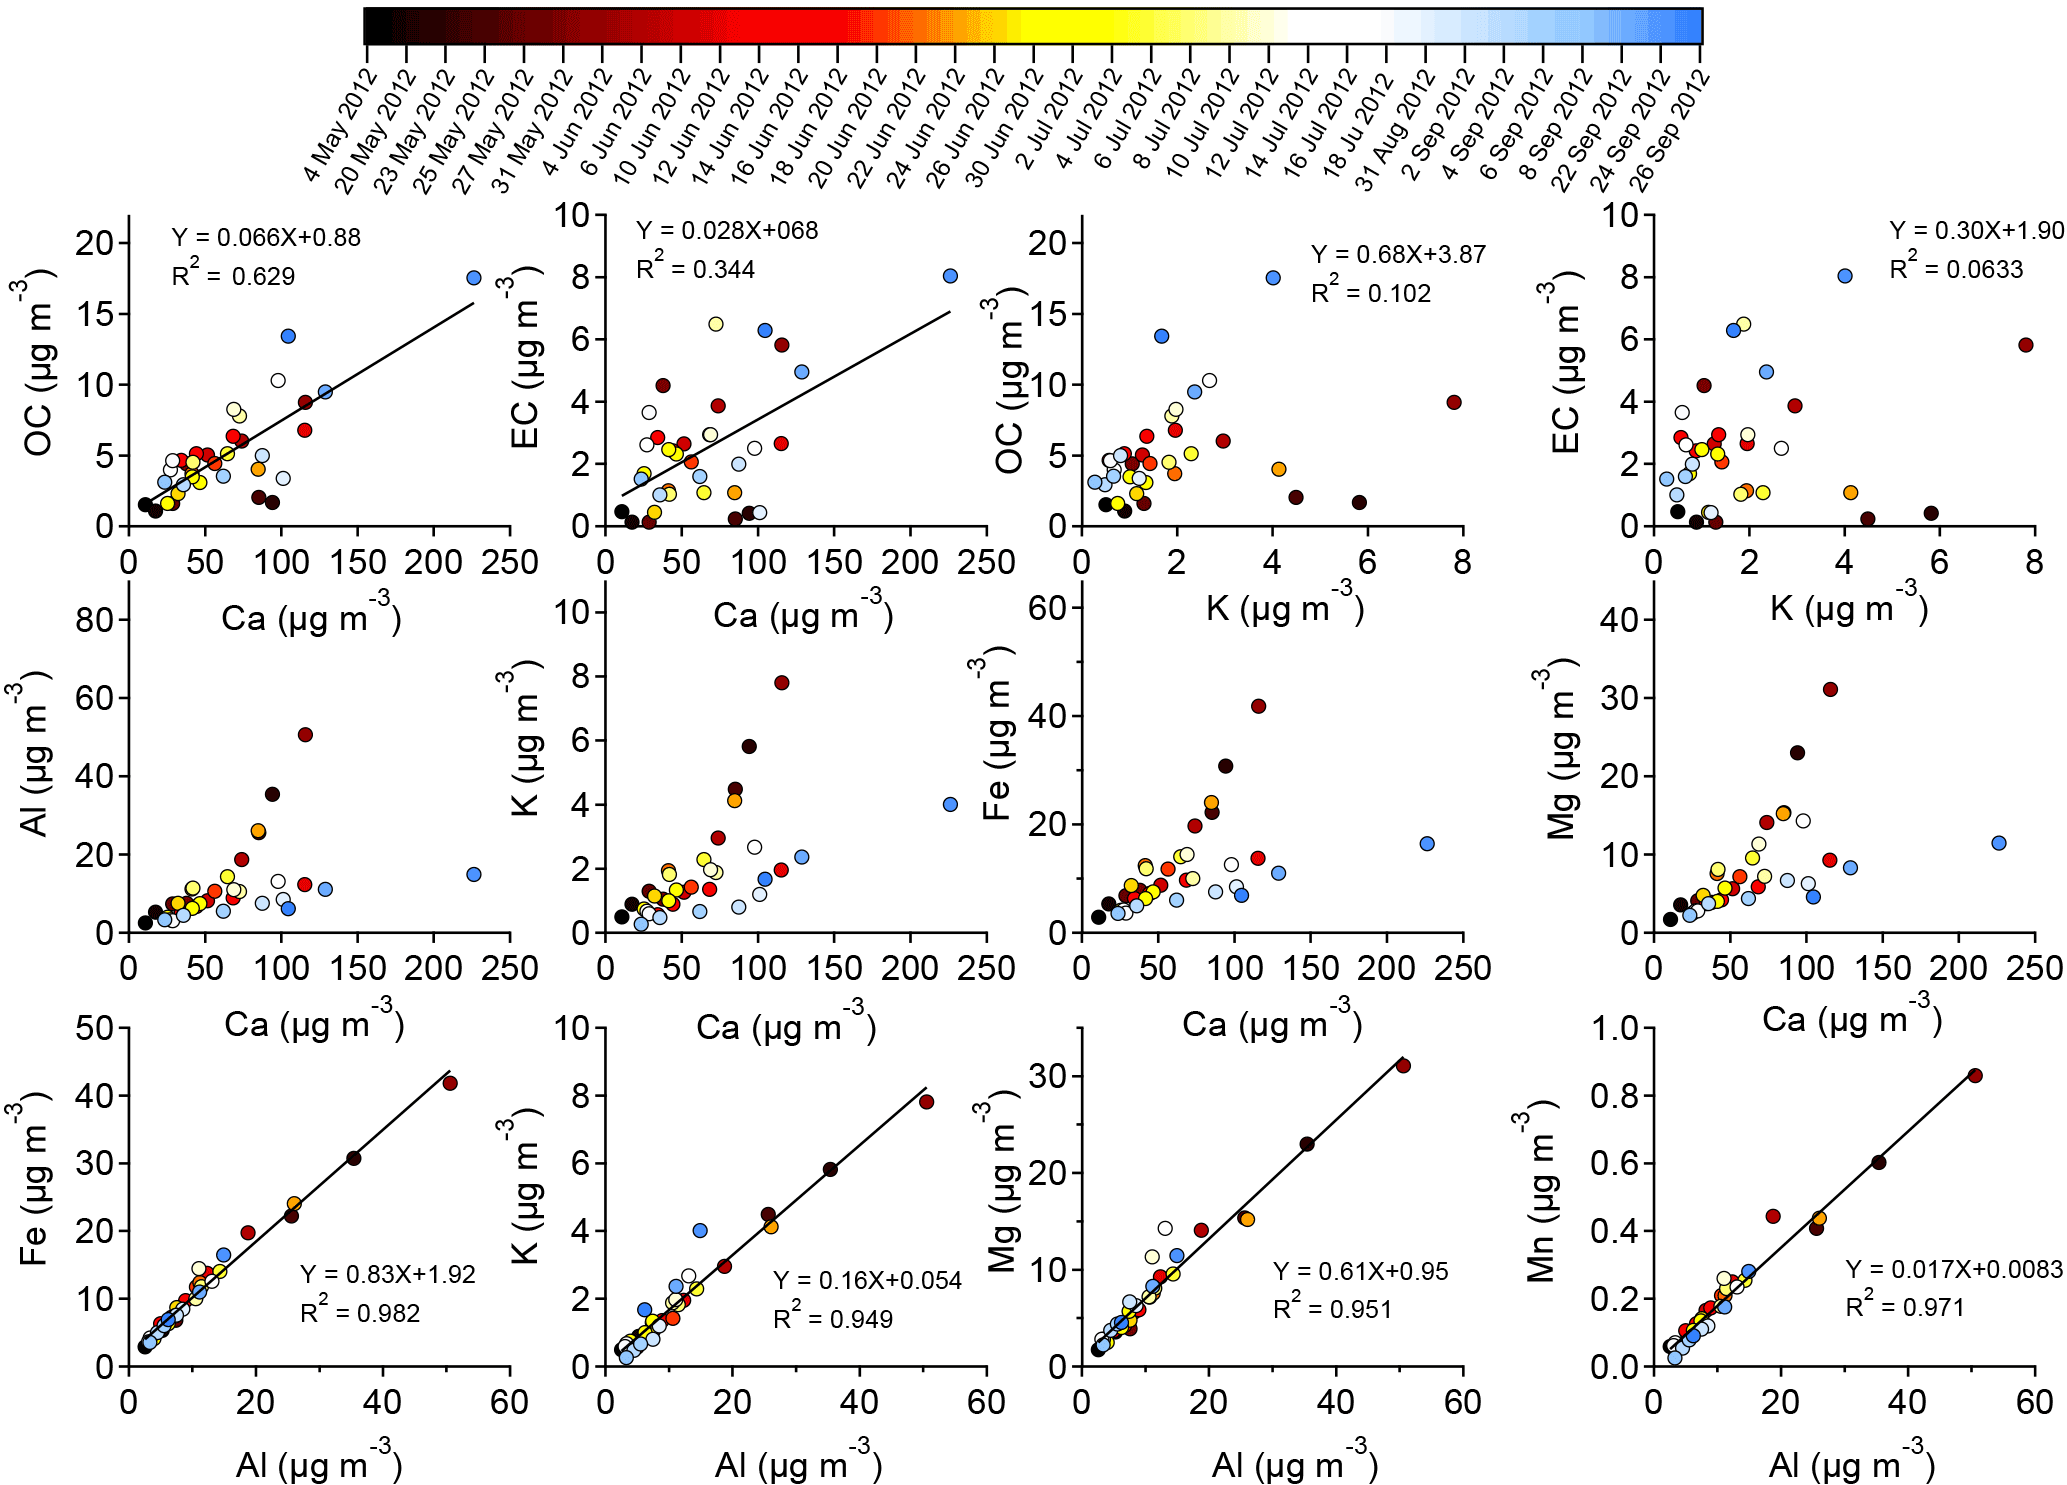
Figure 8Correlation between dust species (Al, Fe, K, Mg, Mn, and Ca), organic carbon (OC), and elemental carbon (EC) concentrations (µg m−3). The color bar represents the corresponding sampling date.
Cement kilns have been documented to be important sources of elemental Ca in the atmospheric aerosol (Zhang et al., 2014). Chow et al. (2004) noted an important contribution of PM2.5 POC from cement factories. Hence, contributions from cement production sources may have led to the good correlation between OC and Ca at the receptor sites. In the Middle East, another possible anthropogenic source for Ca is from the desalting and demetalization of crude oil in refineries (Wu et al., 2014); refineries are certainly contributing to the observed OC in Riyadh. A third possibility was that the Ca is crustal in origin but from a different source region than most of the other sampled dust. Ca enrichment in dusts may vary across the Middle East region (Coz et al., 2010), and thus the correlation between Ca and other crustal species could diverge depending upon the dust source region. Regardless of dust source region, during transport to Riyadh, as ambient SOC precursors were oxidized, the products may have partitioned to particle surfaces, resulting in simultaneous transport of Ca and OC. Finally, we note that a correlation between Ca and OC may have occurred if calcium carbonate was being sampled and the carbonate detected as OC in the thermal analysis protocol, as mentioned in the methods section above. While it was not possible to definitively distinguish between these various possibilities based only on EF, the large dust loadings that were present in nearly all samples suggest that this latter explanation could play a significant role in producing the observed Ca–OC correlations.
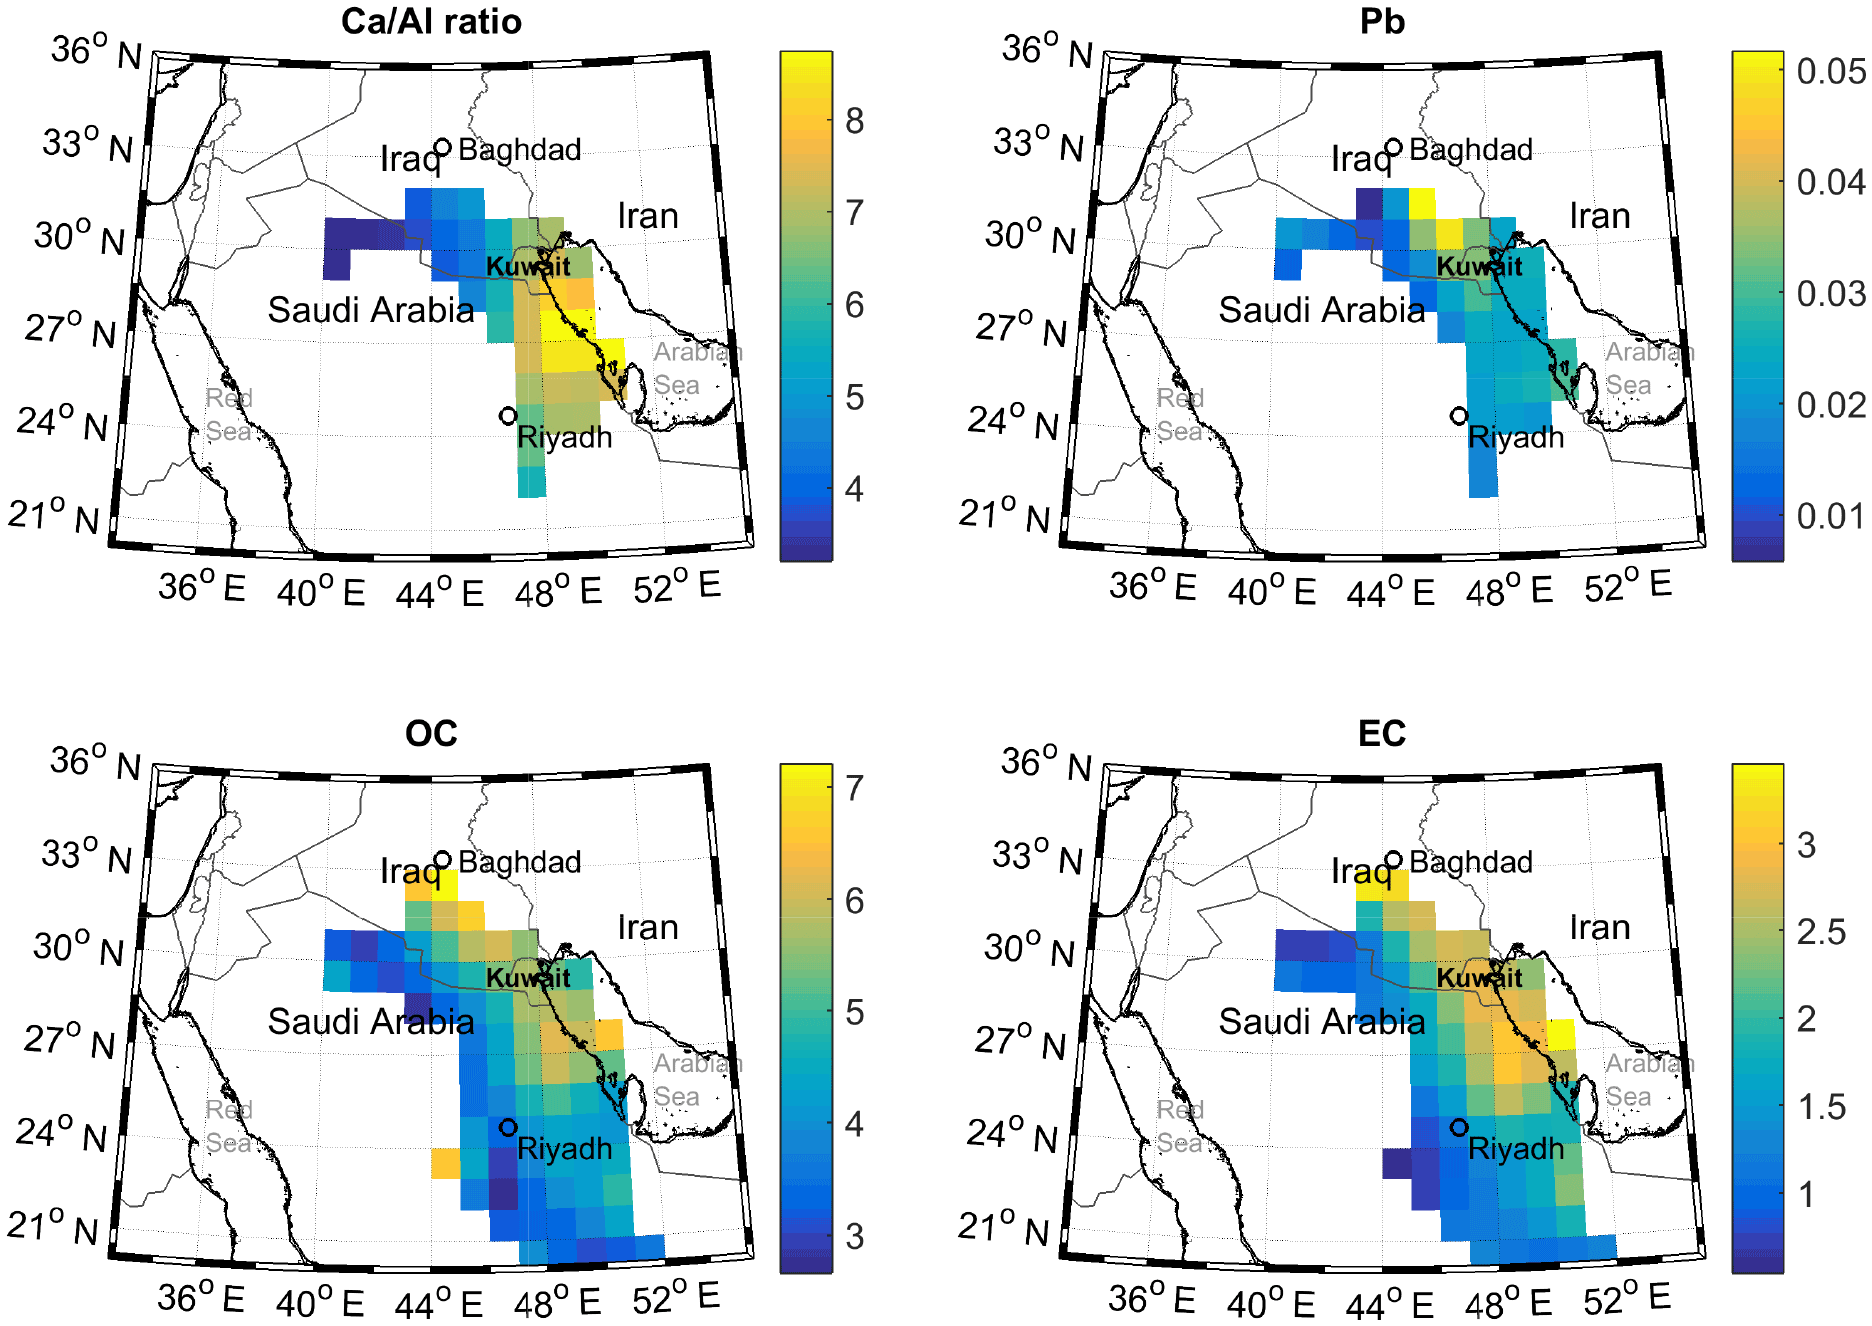
Figure 9Concentration weighted trajectory analysis for indicated species, for 24 h back trajectories with a starting height of 500 m. Color bars represent Ca ∕ Al ratio, Pb concentrations (ng m−3), OC concentrations (µg m−3), and EC concentrations (µg m−3).
3.5.2 CWT analysis for the Ca ∕ Al ratio, Pb, OC, and EC
We used CWT analysis to identify possible source origins for the observed highest values of Ca ∕ Al ratio, Pb, OC and EC (Fig. 9). The CWT plot for the Ca ∕ Al ratio showed that, when this ratio was high in Riyadh PM samples, air masses were most likely to have passed over regions along the western shoreline of the Persian Gulf, and in particular, the highest ratio was found for air masses passing over the site of a large Saudi Arabian cement plant (Fig. S8). This transport pathway was thus consistent with the idea that refineries and cement plants may represent anthropogenic sources of Ca. CWT analysis of Pb showed that high observed concentrations in Riyadh aerosol were associated with transport from Iraq, consistent with the continued usage of leaded fuel in that country (Shaik et al., 2014). PM10 Pb concentrations were 0.035 ± 0.088 µg m−3 in this study, lower than measurements reported for eastern China (0.05 to 0.5 µg m−3; Li et al., 2010) and the greater Cairo area (0.3 µg m−3; Safar and Labib, 2010), both locations for which leaded fuel has been phased out of usage, and lower than the US ambient concentration standard for lead (0.15 µg m−3 on a 3-month rolling basis; U.S. EPA, 2006). The comparison showed that although Pb may have multiple potential sources in Riyadh, the concentration levels were still below those of concern for human health. Industrial emissions along the Saudi Arabian coast may also contribute some Pb to the measured aerosol. While high OC concentrations were associated with transport from a similar region of the Persian Gulf as high Pb, the high-concentration source region extended further north, encompassing areas with oil fields and refineries and the Baghdad urban region (Fig. S9). Finally, the CWT plots for OC and EC were similar, suggesting their highest concentrations may be attributed to similar sources, i.e., refineries, cement factories, and urban pollution.
3.6 PMF analysis
Three- to five-factor solutions were tested in the PMF model; the three-factor solution was found to have the best solution characteristics (Fig. 10). Most of the OC (77 %) and EC (90 %) together with fractions of the crustal elements appeared in the first factor. We note that 54 % of Ca was loaded in this factor, as expected, since OC was found to be correlated with Ca. No significant crude oil tracers (Ni and V) appeared in the factor, indicating that this factor was not related to oil combustion (Ganor et al., 1988). The CWT analysis suggested that high OC and EC coming from the shoreline of the Persian Gulf may be associated with industrial emissions, including refineries, gas flares in oil fields, and cement production. However, we could not rule out potential contributions to this factor from local vehicular emissions. Therefore, this factor was identified as a mixed source: cement industries/gas flares/local vehicles.
A key signature in the second factor was the significant loading of Pb (98 %); it also included some dust species. While leaded fuels have been phased out in Saudi Arabia, as mentioned above, they were still in use in Iraq; further, deposition of lead to soils and resuspension is a documented exposure pathway (Laidlaw and Filippelli, 2008). CWT analysis also supported a source origin of Pb from Iraq (Fig. 9). Hence, Pb may have served as a regional transport tracer in this PMF analysis. However, Pb could also be contained in other industrial emissions, including cement manufacturing in the city. The second factor was thus identified as leaded fuel combustion from long-range transport/industrial emissions.

Figure 10Source profile of PMF analysis of combined PM2.5 OC and EC and PM10 metal concentrations. The sum of the species for all the factors was normalized to unity.
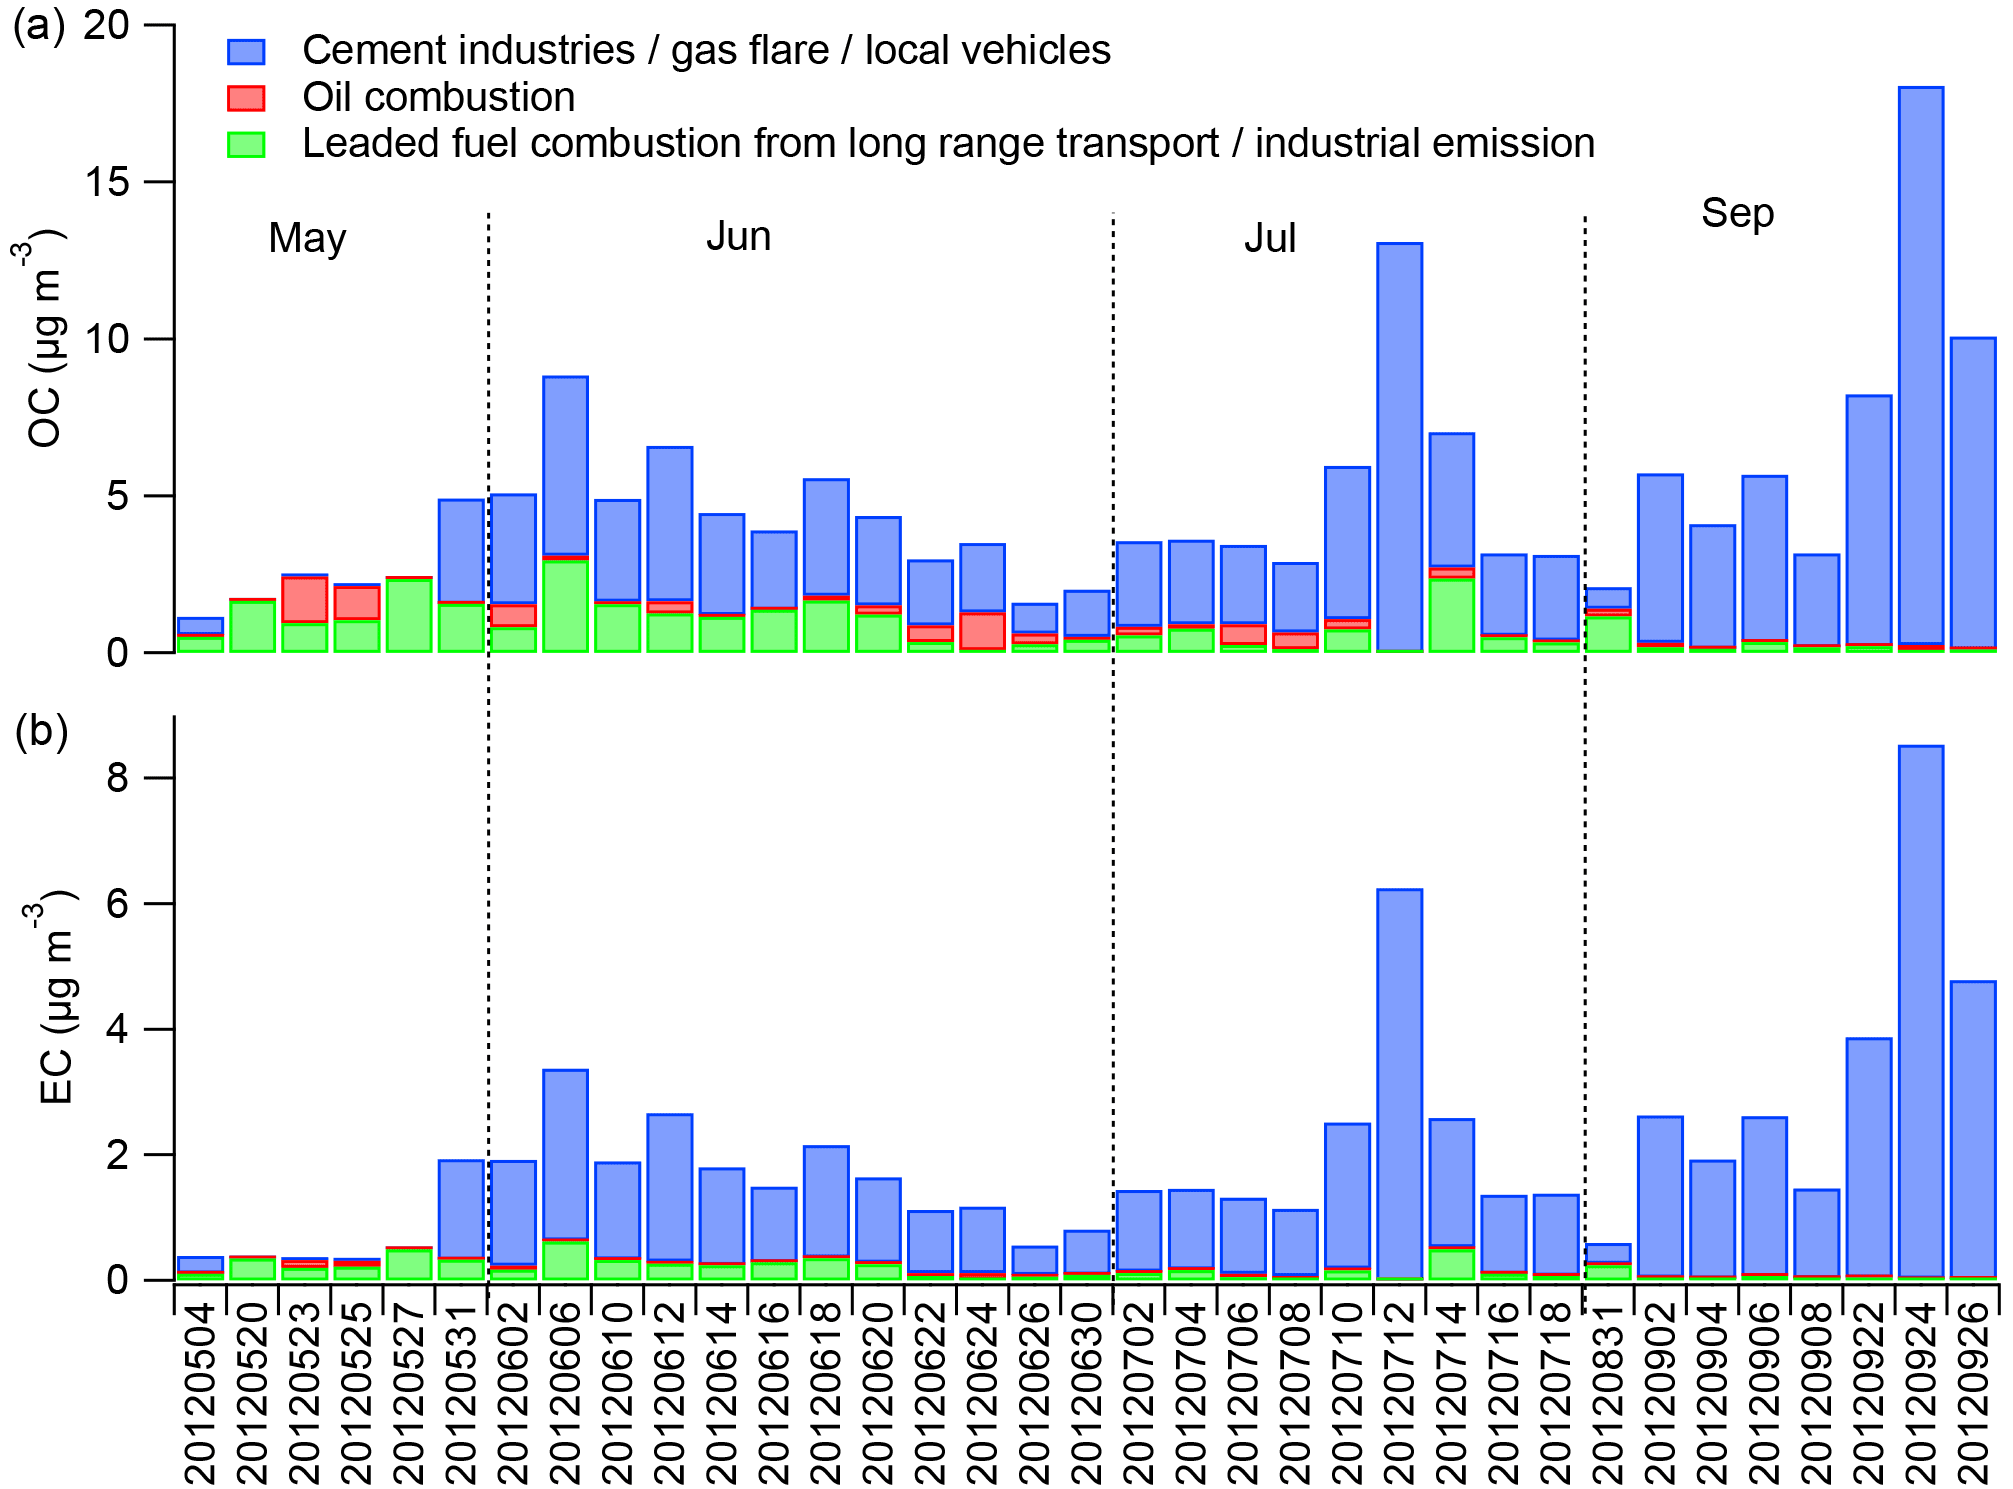
Figure 11Source contributions to (a) OC and (b) EC (µg m−3) from three sources for each sample.
The third factor contained almost all of the V and a large fraction of Ni (> 60 %), as well as some crustal elements and OC. V and Ni and their ratios have been suggested as markers of emissions from oil-fired power plants (Ganor et al., 1988). Barwise (1990) found that the highest V ∕ Ni ratios (> 1) among oil samples that they characterized were associated with Abu Dhabi and Suez oils, as contrasted with samples from the North Sea, China, Indonesia, and Australia, reflecting geological differences. The ratio of V ∕ Ni in factor 3 is 3.5, consistent with the Arabian Gulf source of oil in this region. Dust species and some OC and EC were also associated with this factor, which we therefore identified as oil combustion.
Figure 11 shows the source contribution to OC and EC from these three factors in individual samples. On average, the OC concentration was dominated by the mixed source (factor 1; 3.8 µg m−3, 77 %), followed by leaded fuel from long-range transport (0.8 µg m−3, 27 %) and oil combustion (0.3 µg m−3, 6 %). The contribution of the mixed source ranged from 37 % in May (0.7 µg m−3) to 95 % in September (6.7 µg m−3). The EC concentration was also mainly attributed to the mixed source (1.9 µg m−3, 92 %). In some May samples, the mixed source contribution was negligible, as the source tracer, EC, was only 0.1–0.4 µg m−3, about 1 order of magnitude lower than that in other periods. The tracer analysis suggested that long-range transport was dominant for those samples.
To our knowledge, this study represents the first reported long-term and spatially resolved hourly measurements of ambient OC and EC concentrations for Riyadh, Saudi Arabia, along with supporting measurements that enabled a source apportionment of these important aerosol species. We found that OC and EC average concentrations were comparable to other reported measurements in Middle Eastern cities, and diurnal and weekly variations indicated a clear influence from local emissions. However, OC and EC concentrations varied with air mass source origin, indicative of not only variations across Riyadh and its outskirts but also of the influence of regional sources on carbonaceous aerosol concentrations. About half of the measured OC was attributed to secondary formation, at least 22 % of EC was ascribed to local sources, and positive matrix factorization suggested that EC and OC were mainly attributed to a mixed source category comprising cement industries, gas flaring activities, and local vehicles.
Measurement of OC and EC via the online thermo-optical technique was found to be challenging in the dusty environment encountered year round in Riyadh. Our dataset required correction via a hand analysis, as reported in the Supplement, as the automated split method implemented by the manufacturer frequently failed for our samples. The lack of a separate independent carbonate analysis, however, meant that our reported OC concentrations may be biased high, as also suggested by the strong correlation between OC and Ca. However, the correlation between OC and Ca may also suggest co-emission of OC and its precursors with metal Ca from desalting and demetalization processes in refineries; co-emission of Ca and OC from cement plants; or condensation of OC on Ca-rich dust during long-range transport. In future studies of ambient aerosol OC concentrations in dusty environments via online thermo-optical techniques, additional observations or different measurement protocols are needed to separate the contributions of carbonates to the measured OC and EC concentrations. With such added information, the implied sources of Ca and OC can be further investigated and their potential contributions to observed OC quantified.
The datasets used in this study including EC and OC concentrations (raw and corrected datasets), and concentrations of metal species, ozone, and NOx can be accessed at https://hdl.handle.net/10217/186141 (Bian et al., 2018).
Laser response and temperature for individual blanks were well correlated, suggesting that the influence of temperature on laser response may indirectly affect the EC ∕ OC split points (Fig. A1). This phenomenon has been pointed out previously, and versions RT-Calc 114 and newer of the Sunset instrument analysis software introduced a laser correction factor to counteract the influence of temperature on the laser signal. This correction factor is calculated in each cycle from the variation in the laser signal when the analysis enters the methane calculation stage (Jung et al., 2011). However, it was obvious that this correction approach did not work well for the Riyadh samples, since many returned EC ∕ TC = 0 (where TC is total carbon), the case when the initial reflectance is not recovered in the analysis. A revised method of finding the point of return to the original laser signal, and thus determining the POC and EC contributions, was therefore proposed for this study and used to correct the dataset.
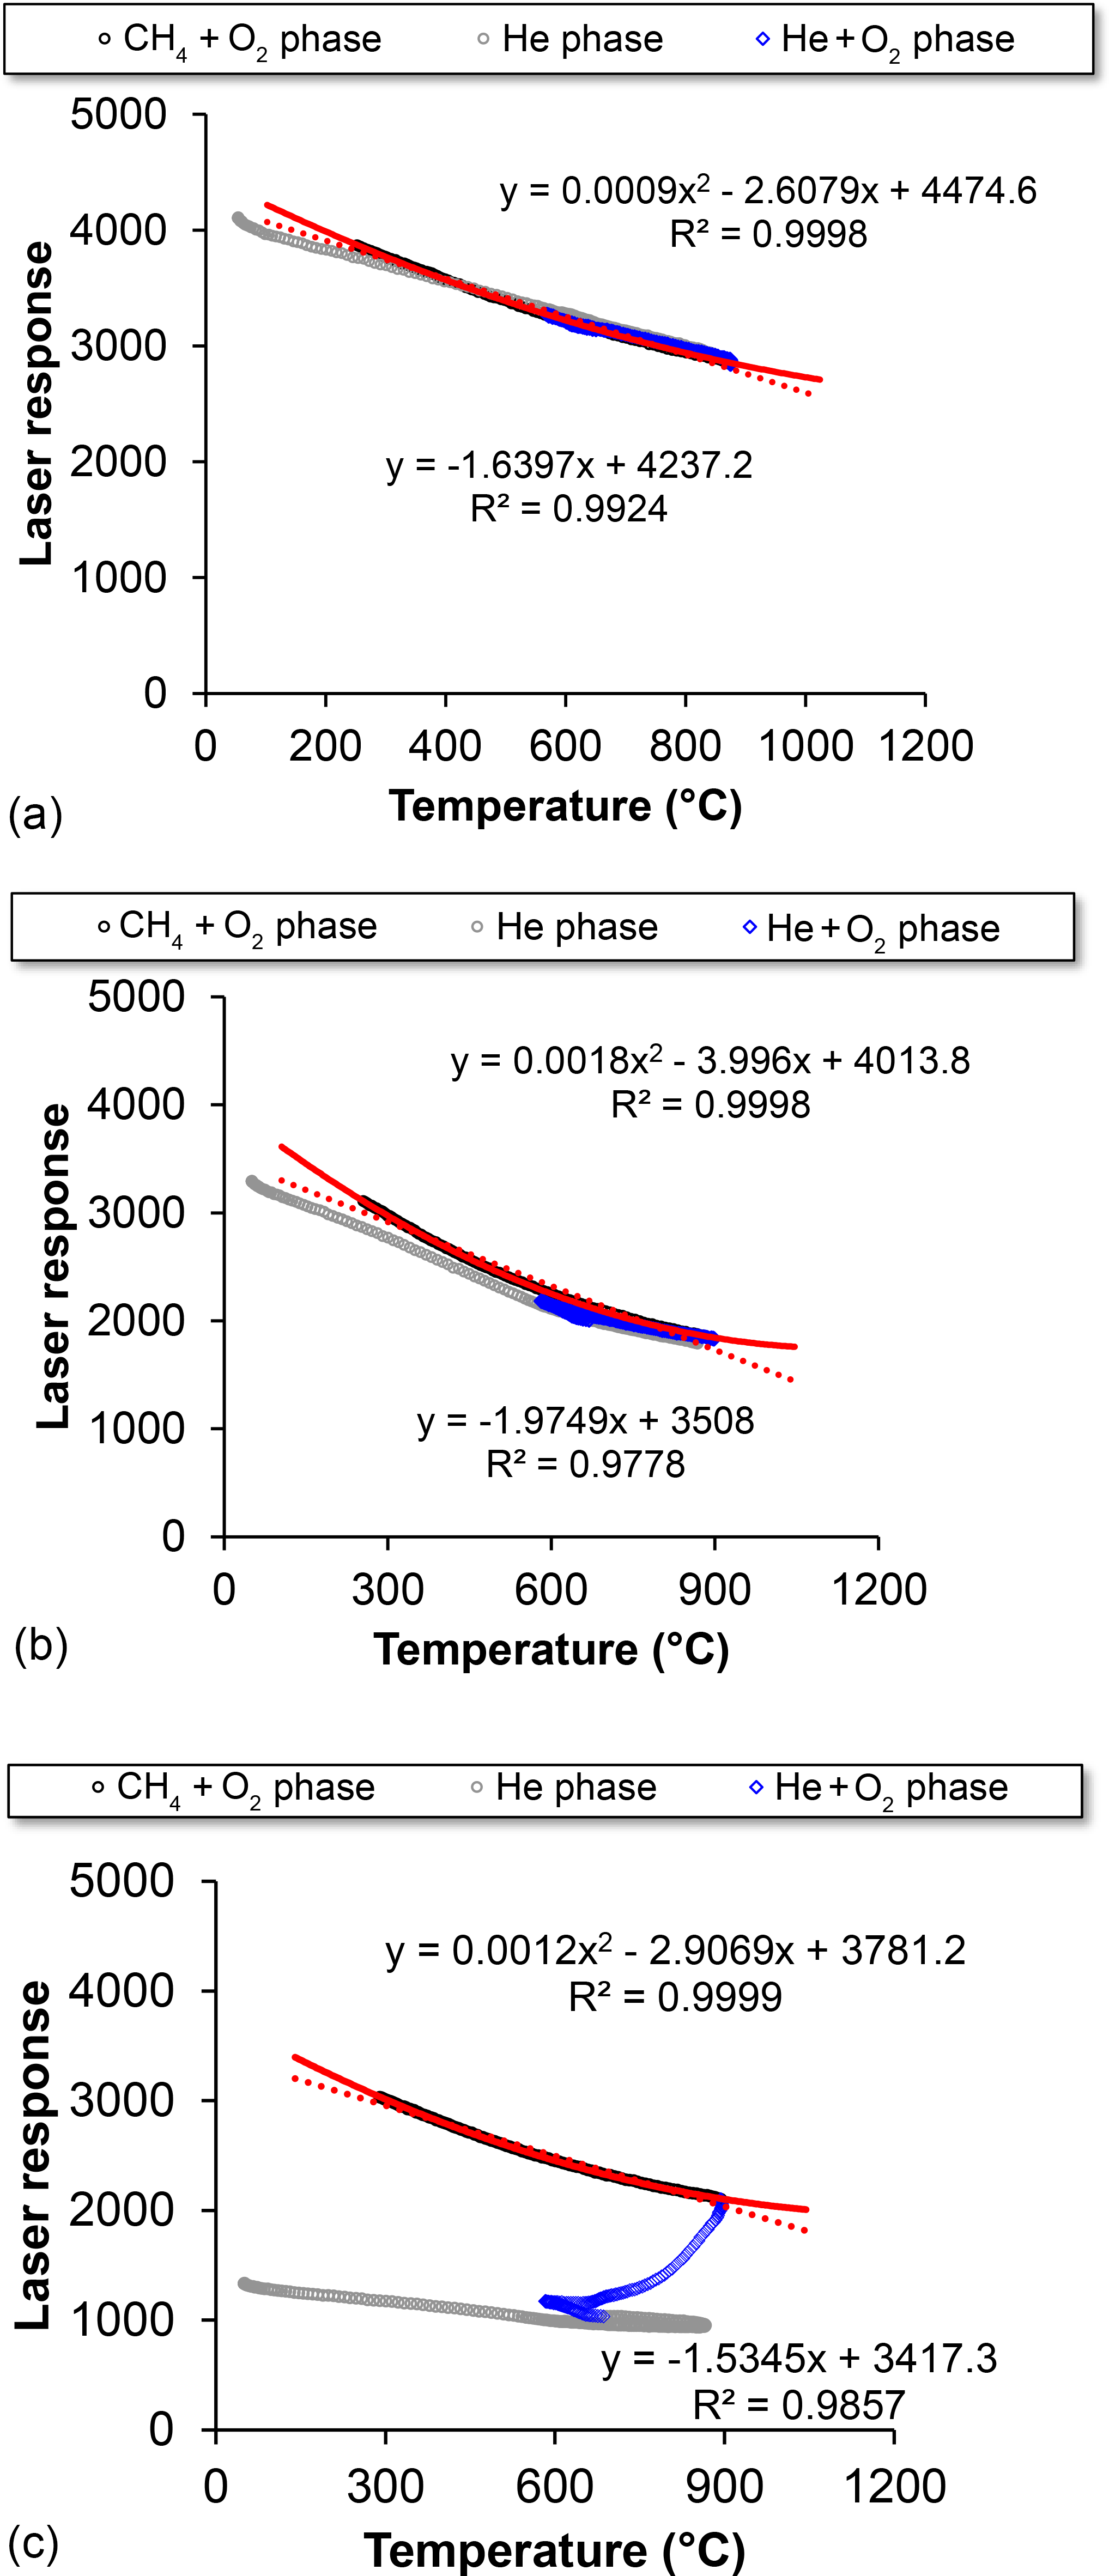
Figure A1Correlation between laser response and temperature (∘C) for the three samples whose thermograms are shown in Fig. A2. (a) blank at 00:15 LT, 6 July 2012; (b) ambient sample at 20:00 LT, 6 July 2012; (c) ambient sample at 06:00 LT, 9 July 2012. The grey lines indicate points during the oxygen-free (He only) phase of the analysis, the blue line is for points during the oxidizing stage (He + O2) of the analysis, and the black line is for the points during the calibration stage (CH4+ O2). The red line is a best-fit polynomial through the CH4+ O2 points, while the dashed red lines are linear fits.
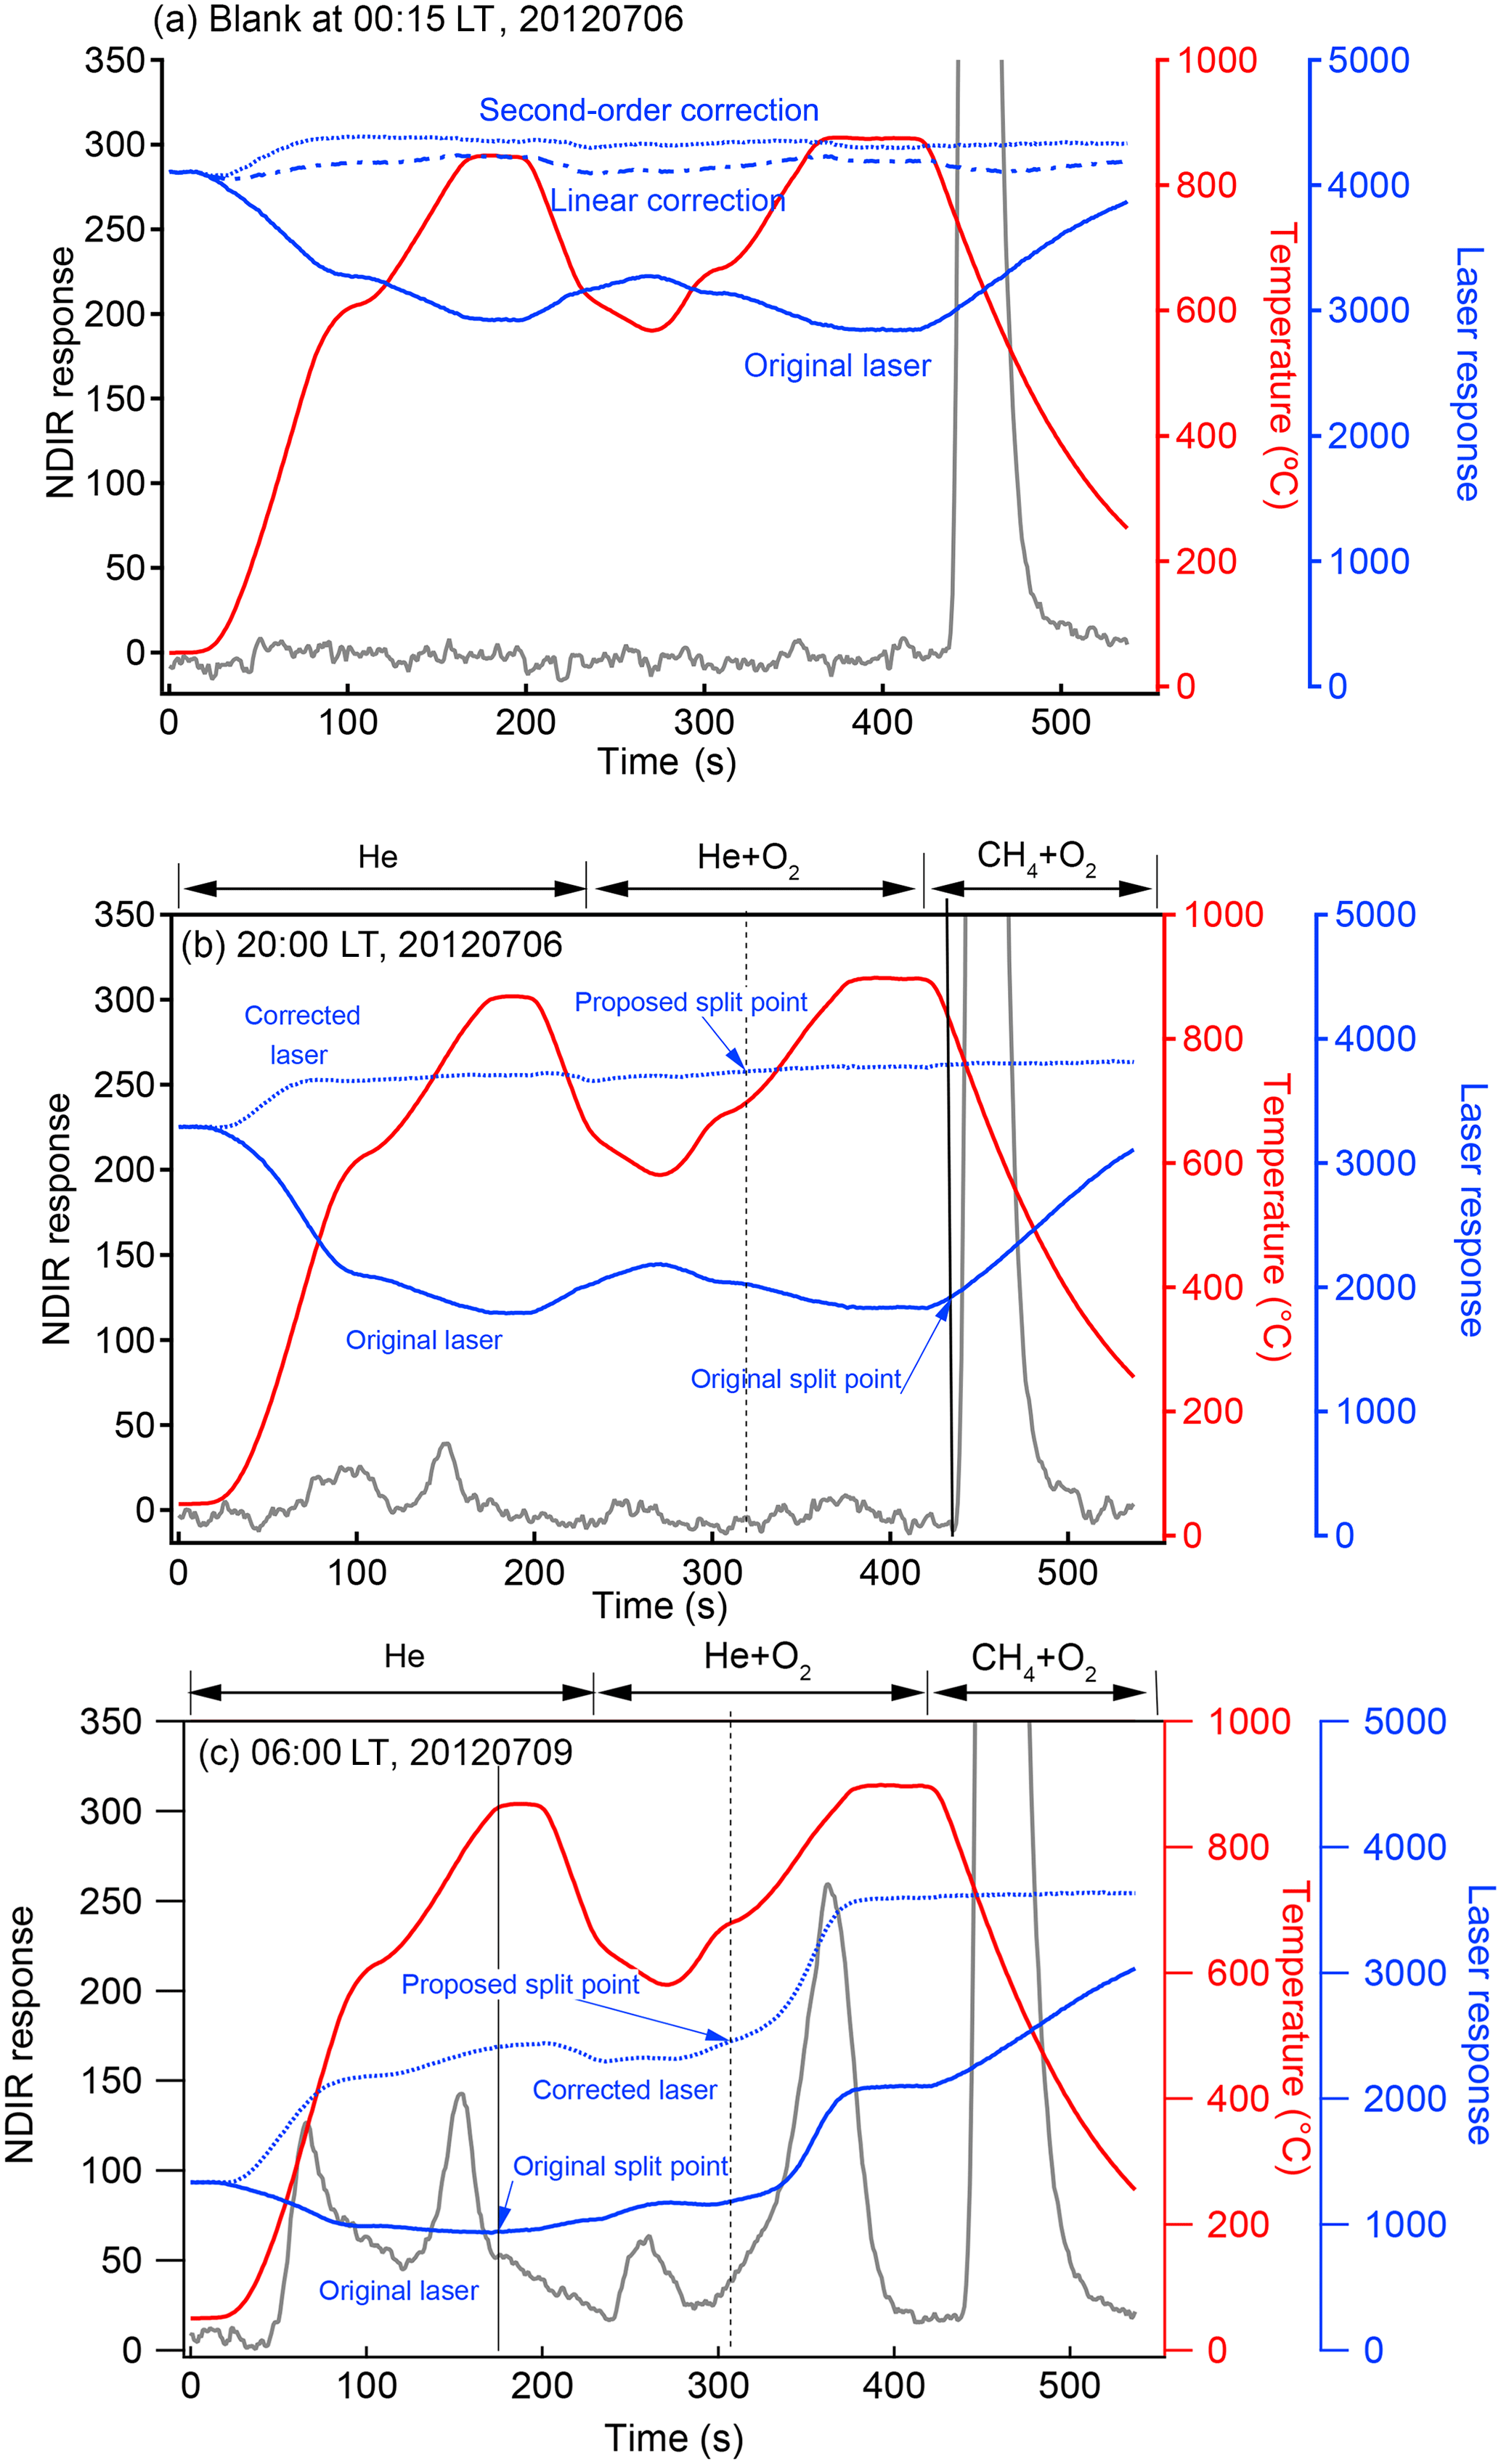
Figure A2Thermograms of selected Riyadh samples: (a) blank at 00:15 LT, 6 July 2012; (b) ambient sample at 20:00 LT, 6 July 2012 with relatively low EC loading; (c) ambient sample at 06:00 LT, 9 July 2012 with relatively high EC loading.
The relationship for the Riyadh samples between laser response and temperature during the calibration phase of the CH4+ O2 injection was used to develop a corrected split point, assuming that only refractory material is present in this phase, and the effects of this refractory material on the laser response to temperature variations could be isolated and then applied during the other analysis phases. A correlation between laser response and temperature in the calibration phase was derived using linear and quadratic functions. The derived parameters from the two functions were applied in the following equations to recompute a corrected laser signal for each analysis, instead of the laser correction factor automatically generated by the Sunset program:
where Signaloriginal represented the original laser signal, Signalnew represented the signal after correction to the initial temperature, Tempinitial represented the temperature at the initial condition when each analysis began, and Temporiginal represented the original temperature for each analysis; a and b in Eq. (A1) were derived from the quadratic equation for each analysis, and c in Eq. (A2) was derived from a linear fit.
Since refractory residues accumulated on the filter during the measurement period, the derived correlation between laser response and temperature varied sample by sample. The equations to derive the corrected laser signal were therefore applied individually to each sample. In the blank sample, the quadratic-function-generated laser signal was smoother than the linear-function-generated one, especially during the calibration phase of the CH4+ O2 injection (Fig. A2a). The relationship between the temperature and laser signal for the newly replaced filter tended to be closer to linear, while the signal for the aged filter with residue accumulation showed a better fit using a quadratic equation. A quadratic equation was therefore selected to correct the laser signal for the entire dataset. The new split points were then set to where the corrected laser signal rebounded to its value just before OC pyrolyzed and the laser signal decreased due to pyrolyzed organic carbon formation. The method worked for both incorrect split-point cases, bringing the split point back to the He + O2 phase as expected and leading to more reasonable EC ∕ OC split points, i.e., neither at the end of the analysis nor in the pre-oxygen analysis phase. It is noted that although the quadratic equation correction produced a better laser signal for purposes of the carbon analyses, this correction did not work perfectly in the low temperature He phase, where the corrected laser signal exhibited unexpected increases. However, this shortcoming did not substantially influence the accuracy of the correction during subsequent carbon evolution. We note that premature evolution of EC, leading to an increasing laser signal in the inert environment due to the existence of refractory metal oxides, was observed in the studies of Wang et al. (2012) and Bladt et al. (2012). The increases in the corrected laser signal during the He stage in this study may be partially due to the same cause, as Riyadh samples contained abundant metal oxides.
The supplement related to this article is available online at: https://doi.org/10.5194/acp-18-3969-2018-supplement.
The authors declare that they have no conflict of interest.
The authors gratefully acknowledge the financial support of King Abdulaziz
City for Science and Technology (KACST) under grant number
32-594 and the NOAA Air Resources Laboratory (ARL) for the provision of
the HYSPLIT transport and dispersion model and READY website
(https://www.ready.noaa.gov/index.php) used in this publication.
Edited by: Maria Cristina Facchini
Reviewed by: two anonymous referees
Abdeen, Z., Qasrawi, R., Heo, J., Wu, B., Shpund, J., Vanger, A., Sharf, G., Moise, T., Brenner, S., Nassar, K., Saleh, R., Al-Mahasneh, Q. M., Sarnat, J. A., and Schauer, J. J.: Spatial and Temporal Variation in Fine Particulate Matter Mass and Chemical Composition: The Middle East Consortium for Aerosol Research Study, Sci. World J., 2014, 878704, https://doi.org/10.1155/2014/878704, 2014.
Al-Dabbous, A. N. and Kumar, P.: Source apportionment of airborne nanoparticles in a Middle Eastern city using positive matrix factorization, Environ. Sci., 17, 802–812, https://doi.org/10.1039/C5EM00027K, 2015.
Alharbi, B., Shareef, M. M., and Husain, T.: Study of chemical characteristics of particulate matter concentrations in Riyadh, Saudi Arabia, Atmos. Pollut. Res., 6, 88–98, 2015.
Ashbaugh, L. L., Malm, W. C., and Sadeh, W. Z.: A residence time probability analysis of sulfur concentrations at Grand Canyon National Park, Atmos. Environ., 19, 1263–1270,1985.
Bae, M.-S., Schauer, J. J., DeMinter, J. T., and Turner, J. R.: Hourly and Daily Patterns of Particle-Phase Organic and Elemental Carbon Concentrations in the Urban Atmosphere, J. Air Waste Manage., 54, 823–833, https://doi.org/10.1080/10473289.2004.10470957, 2004.
Barwise, A. J. G.: Role of Nickel and Vanadium in Petroleum Classification, Energy Fuels, 4, 647–652, https://doi.org/10.1021/ef00024a005, 1990.
Batmunkh, T., Lee, K., Kim, Y. J., Bae, M.-S., Maskey, S., and Park, K.: Optical and thermal characteristics of carbonaceous aerosols measured at an urban site in Gwangju, Korea, in the winter of 2011, J. Air Waste Manage., 66, 151–163, https://doi.org/10.1080/10962247.2015.1101031, 2016.
Bian, Q., Alharbi, B., Shareef, M. M., Husain, T., Pasha, M. J., Atwood, S. A., and Kreidenweis, S. M.: Sources of PM2.5 carbonaceous aerosol in Riyadh, Saudi Arabia, https://hdl.handle.net/10217/186141, last access: 19 March 2018.
Biegalski, S. R., Landsberger, S., and Hoff, R. M.: Source-receptor modeling using trace metals in erosols collected at three rural Canadian Great lakes Sampling Stations, J. Air Waste Manage. Assoc., 48, 227–37, 1998.
Bladt, H., Schmid, J., Kireeva, E. D., Popovicheva, O. B., Perseantseva, N. M., Timofeev, M. A., Heister, K., Uihlein, J., Ivleva, N. P., and Niessner, R.: Impact of Fe Content in Laboratory-Produced Soot Aerosol on its Composition, Structure, and Thermo-Chemical Properties, Aerosol Sci. Technol., 46, 1337–1348, https://doi.org/10.1080/02786826.2012.711917, 2012.
Bond, T. C., Doherty, S. J., Fahey, D. W., Forster, P. M., Berntsen, T., DeAngelo, B. J., Flanner, M. G., Ghan, S., Kärcher, B., Koch, D., Kinne, S., Kondo, Y., Quinn, P. K., Sarofim, M. C., Schultz, M. G., Schulz, M., Venkataraman, C., Zhang, H., Zhang, S., Bellouin, N., Guttikunda, S. K., Hopke, P. K., Jacobson, M. Z., Kaiser, J. W., Klimont, Z., Lohmann, U., Schwarz, J. P., Shindell, D., Storelvmo, T., Warren, S. G., and Zender, C. S.: Bounding the role of black carbon in the climate system: A scientific assessment, J. Geophys. Res.-Atmos., 118, 5380–5552, https://doi.org/10.1002/jgrd.50171, 2013.
Chow, J. C., Watson, J. G., Kuhns, H., Etyemezian, V., Lowenthal., D. H., Crow, D., Kohl, S. D., Engelbrecht., J. P., and Green., M. C.: Source profiles for industrial, mobile, and area sources in the Big Bend Regional Aerosol Visibility and Observational study, Chemosphere, 54, 185–208, 2004.
Chow, J. C., Watson, J. G., Lowenthal, D. H., Chen, Antony, L.-W., and Motallebi, N.: PM2.5 source profiles for black and organic carbon emission inventories, Atmos. Environ., 45, 5407–5415, 2011.
Coz, E., Gómez-Moreno, F. J., Casuccio, G. S., and Artíñano, B.: Variations on morphology and elemental composition of mineral dust particles from local, regional, and long-range transport meteorological scenarios, J. Geophys. Res., 115, D12204, https://doi.org/10.1029/2009JD012796, 2010.
Engelbrecht, J. P., McDonald, E. V., Gillies, J. A. Jayanty, R. K. M., Casuccio, G., and Gertler, A. W.: Characterizing Mineral Dusts and Other Aerosols from the Middle East – Part 2: Grab Samples and Re-Suspensions, Inhal. Toxicol., 21, 327–36, https://doi.org/10.1080/08958370802464299, 2009.
Ganor, E., Altshuller, S., Foner, H. A. Brenner, S., and Gabbay, J.: Vanadium and nickel in dustfall as indicators of power plant pollution, Water Air Soil Poll., 42, 241–252, https://doi.org/10.1007/BF00279270, 1988.
Genberg, J., Hyder, M., Stenström, K., Bergström, R., Simpson, D., Fors, E. O., Jönsson, J. Å., and Swietlicki, E.: Source apportionment of carbonaceous aerosol in southern Sweden, Atmos. Chem. Phys., 11, 11387–11400, https://doi.org/10.5194/acp-11-11387-2011, 2011.
Givehchi, R., Arhami, M., and Tajrishy, M.: Contribution of the Middle Eastern dust source areas to PM10 levels in urban receptors: Case study of Tehran, Iran, Atmos. Environ., 75, 287–295, 2013.
Gray, H. A., Cass, G. R., Huntzicker, J. J., Heyerdahl, E. K., and Rau, J. A.: Characteristics of atmospheric organic and elemental carbon particle concentrations in Los-Angeles, Environ. Sci. Technol., 20, 580–589, https://doi.org/10.1021/es00148a006, 1986.
Grivas, G., Cheristanidis, S., and Chaloulakou, A.: Elemental and organic carbon in the urban environment of Athens. Seasonal and diurnal variations and estimates of secondary organic carbon, Sci. Total Environ., 414, 535–545, 2012.
Han, J. S., Moon, K. J., Ryu, S. Y., Kim, Y. J., and Perry, K. D.: Source estimation of anthropogenic aerosols collected by a DRUM sampler during spring of 2002 at Gosan, Korea, Atmos. Environ., 39, 3113–3125, 2005.
Harrison, R. M., Jones, A. M., Gietl, J., Yin, J., and Green, D. C.: Estimation of the Contributions of Brake Dust, Tire Wear, and Resuspension to Nonexhaust Traffic Particles Derived from Atmospheric Measurements, Environ. Sci. Technol., 46, 6523–6529, https://doi.org/10.1021/es300894r, 2012.
Heal, M. R. and Hammonds, M. D.: Insights into the Composition and Sources of Rural, Urban and Roadside Carbonaceous PM10, Environ. Sci. Technol., 48, 8995–9003, https://doi.org/10.1021/es500871k, 2014.
Ho, K. F., Lee, S. C., Cao, J. J., Li, Y. S., Chow, J. C., Watson, J. G., and Fung, K.: Variability of organic and elemental carbon, water soluble organic carbon, and isotopes in Hong Kong, Atmos. Chem. Phys., 6, 4569–4576, https://doi.org/10.5194/acp-6-4569-2006, 2006.
Hong, Y. C., Pan, X. C., Kim, S. Y., Park, K., Park, E. J., Jin, X., Yi, S. M., Kim, Y. H., Park, C. H., Song, S., and Kim, H.: Asian Dust Storm and Pulmonary Function of School Children in Seoul, Sci. Total Environ. 408, 754–759, 2010.
Hu, W. W., Hu, M., Deng, Z. Q., Xiao, R., Kondo, Y., Takegawa, N., Zhao, Y. J., Guo, S., and Zhang, Y. H.: The characteristics and origins of carbonaceous aerosol at a rural site of PRD in summer of 2006, Atmos. Chem. Phys., 12, 1811–1822, https://doi.org/10.5194/acp-12-1811-2012, 2012.
Huang, X. H. H., Bian, Q. J., Louie, P. K. K., and Yu, J. Z.: Contributions of vehicular carbonaceous aerosols to PM2.5 in a roadside environment in Hong Kong, Atmos. Chem. Phys., 14, 9279–9293, https://doi.org/10.5194/acp-14-9279-2014, 2014a.
Huang, X. H. H., Bian, Q., Ng, W. M., Louie, P. K. K., and Yu, J. Z.: Characterization of PM2.5 Major Components and Source Investigation in Suburban Hong Kong: A One Year Monitoring Study, Aerosol Air Qual. Res., 14, 237–250, https://doi.org/10.4209/aaqr.2013.01.0020, 2014b.
Jacobson, M. C., Hansson, H.-C., Noone, K. J., and Charlson, R. J.: Organic atmospheric aerosols: Review and state of the science, Rev. Geophys., 38, 267–294, https://doi.org/10.1029/1998RG000045, 2000.
Jeong, C. H., Hopke, P. K., Kim, E., and Lee, D. W.: The comparison between thermaleoptical transmittance elemental carbon and Aethalometer black carbon measured at multiple monitoring sites, Atmos. Environ., 38, 5193–5204, 2004.
Jimenez, J. L., Canagaratna, M. R., Donahue, N. M., Prevot, A. S. H., Zhang, Q., Kroll, J. H., DeCarlo, P. F., Allan, J. D., Coe, H., Ng, N. L., Aiken, A. C., Docherty, K. S., Ulbrich, I. M., Grieshop, A. P., Robinson, A. L., Duplissy, J., Smith, J. D., Wilson, K. R., Lanz, V. A., Hueglin, C., Sun, Y. L., Tian, J., Laaksonen, A., Raatikainen, T., Rautiainen, J., Vaattovaara, P., Ehn, M., Kulmala, M., Tomlinson, J. M., Collins, D. R., Cubison, D. R., Dunlea, E. J., Huffman, J. A., Onasch, T. B., Alfarra, M. R., Williams, P. I., Bower, K., Kondo, Y., Schneider, J., Drewnick, F., Borrmann, S., Weimer, S., Demerjian, K., Salcedo, D., Cottrell, L., Griffin, R., Takami, A., Miyoshi, T., Hatakeyama, S., Shimono, A., Sun, J. Y., Zhang, Y. M., Dzepina, K., Kimmel, J. R., Sueper, D., Jayne, J. T., Herndon, S. C., Trimborn, A. M., Williams, L. R., Wood, E. C., Middlebrook, A. M., Kolb, C. E., Baltensperger, U., and Worsnop, D. R.: Evolution of organic aerosols in the atmosphere, Science, 326, 1525–1529, https://doi.org/10.1126/science.1180353, 2009.
Jung, J., Kim, Y. J., Lee, K. Y., Kawamura, K., Hu, M., and Kondo, Y.: The effects of accumulated refractory particles and the peak inert mode temperature on semi-continuous organic carbon and elemental carbon measurements during the CAREBeijing 2006 campaign, Atmos. Environ., 45, 7192–7200, 2011.
Kanakidou, M., Seinfeld, J. H., Pandis, S. N., Barnes, I., Dentener, F. J., Facchini, M. C., Van Dingenen, R., Ervens, B., Nenes, A., Nielsen, C. J., Swietlicki, E., Putaud, J. P., Balkanski, Y., Fuzzi, S., Horth, J., Moortgat, G. K., Winterhalter, R., Myhre, C. E. L., Tsigaridis, K., Vignati, E., Stephanou, E. G., and Wilson, J.: Organic aerosol and global climate modelling: a review, Atmos. Chem. Phys., 5, 1053–1123, https://doi.org/10.5194/acp-5-1053-2005, 2005.
Karanasiou, A., Diapouli, E., Cavalli, F., Eleftheriadis, K., Viana, M., Alastuey, A., Querol, X., and Reche, C.: On the quantification of atmospheric carbonate carbon by thermal/optical analysis protocols, Atmos. Meas. Tech., 4, 2409–2419, https://doi.org/10.5194/amt-4-2409-2011, 2011.
Karanasiou, A. A., Siskos, P. A., and Eleftheriadis, K.: Assessment of source apportionment by positive matrix factorization analysis on fine and coarse urban aerosol size fractions, Atmos. Environ., 43, 3385–3395, 2009.
Khan, M. B., Masiol, M., Formenton, G., Gilio, A. D., de Gennaro, G., Agostinelli, C., and Pavoni, B.: Carbonaceous PM2.5 and secondary organic aerosol across the Veneto Region (NE Italy), Sci. Total Environ., 542A, 172–181, 2016.
Khodeir, M., Shamy, M., Alghamdi, M., Zhong, M., Sun, H., Costa, M., Chen, L.-C., and Maciejczyk, P.: Source Apportionment and Elemental Composition of PM2.5 and PM10 in Jeddah City, Saudi Arabia, Atmos. Pollut. Res., 3, 331–340, 2012.
Laidlaw, M. A. S. and Fillppelli, G. M.: Resuspension of urban soils as a persistent source of lead poisoning in children: A review and new directions, Appl. Geochem., 23, 2021–2039, 2008.
Lee, H. J., Gent, J. F., Leaderer, B. P., and Koutrakis, P.: Spatial and temporal variability of fine particle composition and source types in five cities of Connecticut and Massachusetts, Sci. Total Environ., 409, 2133–2142, 2011.
Li, C., Wen, T., Li, Z., Dickerson, R. R., Yang, Y., Zhao, Y., Wang, Y., and Tsay, S.-C.: Concentrations and origins of atmospheric lead and other trace species at a rural site in northern China, J. Geophys. Res., 115, D00K23, https://doi.org/10.1029/2009JD013639, 2010.
Lim, H.-J. and Turpin, B. J.: Origins of Primary and Secondary Organic Aerosol in Atlanta: Results of Time-Resolved Measurements during the Atlanta Supersite Experiment, Environ. Sci. Technol., 36, 4489–4496, https://doi.org/10.1021/es0206487, 2002.
Lippmann, M., Ito, K., Hwang, J.-S., Maciejczyk, P., and Chen, L.-C.: Cardiovascular Effects of Nickel in Ambient Air, Environ. Health Perspect., 114, 1662–1669, https://doi.org/10.1289/ehp.9150, 2006.
Lough, G. C., Schauer, J. J., and Lawson, D. R.: Day of week trends in carbonaceous aerosol composition in the urban atmosphere, Atmos. Environ., 40, 4137–4149, 2006.
Millet, D. B., Donahue, N. M., Pandis, S. N., Polidori, A., Stanier, C. O., Turpin, B. J., and Goldstein, A. H.: Atmospheric volatile organic compound measurements during the Pittsburgh Air Quality Study: Results, interpretation, and quantification of primary and secondary contributions, J. Geophys. Res., 110, D07S07, https://doi.org/10.1029/2004JD004601, 2005.
Motallebi, N., Tran, H., Croes, B. E., and Larsen, L. C.: Day-of-week patterns of particulate matter and its chemical components at selected sites in California, J. Air Waste Manage., 53, 876–88, 2003.
Norris, G., Duvall, R., Brown, S., and Bai S.: EPA Positive Matrix Factorization (PMF) 5.0 Fundamentals and User Guide, available at: https://www.epa.gov/sites/production/files/2015-02/documents/pmf_5.0_user_guide.pdf (last access: 15 March 2018), 2014.
Ondov, J. M., Buckley, T. J., Hopke, P. K., Ogulei, D., Parlange, M. B., Rogge, W. F., Squibb, K. S., Johnston, M. V., and Wexler, A. S.: Baltimore supersite: highly time- and size- resolved concentrations of urban PM2.5 and its constituents for resolution of sources and immune response, Atmos. Environ., 40, 224–237, 2006.
Panda, S., Sharma, S. K., Mahapatra, P. S., Panda, U., Rath, S., Mahapatra, M., Mandal, T. K., and Das, T.: Organic and elemental carbon variation in PM2.5 over megacity Delhi and Bhubaneswar, a semi-urban coastal site in India, Nat. Hazards, 80, 1709–1728, 2016.
Peltier, R. E. and Lippmann, M.: Residual oil combustion: 2. Distributions of airborne nickel and vanadium within New York City, J. Expo. Sci. Env. Epid., 20, 342–50, https://doi.org/10.1038/jes.2009.28, 2010.
Polidori, A., Turpin, B. J., Lim, H.-J., Cabada, J. C., Subramanina, R., Pandis, S. N., and Robinson, A. L.: Local and regional secondary organic aerosol: insights from a year of semi-continuous carbon measurements at Pittsburgh, Aerosol Sci. Tech., 40, 861–872, https://doi.org/10.1080/02786820600754649, 20076
Polissar, A. V., Hopke, P. K., Malm, W. C., and Sisler, J. F.: Atmospheric Aerosol over Alaska: 2. Elemental Composition and Sources, J. Geophys. Res. 103, 19045–19057, https://doi.org/10.1029/98JD01212, 1998.
Querol, X., Viana, M., Alastuey, A., Amato, F., Moreno, T., Castillo, S., Pey, J., de la Rosa, J., Artinano, B. Salvador, P., Garcia Dos Santos, S., Fernandez-Patier, R., Moreno-Grau, S., Negral, L., Minguillon, M. C., Monfort, E., Gil, J. I., Inza, A., Ortega, L. A., Santamaria, J. M., and Zabalza, J.: Source origin of trace elements in PM from regional background, urban and industrial sites of Spain, Atmos. Environ., 41, 7219–7231, 2007.
Ramanathan, V. and Carmichael., G.: Global and regional climate changes due to black carbon, Nat. Geosci., 1, 221–227, https://doi.org/10.1038/ngeo156, 2008.
Reff, A., Eberly, S. I., and Bhave, P. V.: Receptor modeling of ambient particulate matter data using positive matrix factorization: review of existing methods, J. Air Waste Manage., 57, 146–154, 2007.
Robinson, A. L., Donahue, N. M., Shrivastava, M. K., Weikamp, E. A., Sage, A. M., Greishop, A. P., Lane, T. E., Pierce, J. R., and Pandis, S. N.: Rethinking Organic Aerosols: Semivolatile Emissions and Photochemical Aging, Science, 315, 1259–1262, https://doi.org/10.1126/science.1133061, 2007.
Rolph, G., Stein, A., and Stunder, B.: Real-time Environmental Applications and Display sYstem: READY, Environ. Modell. Softw., 95, 210–228, https://doi.org/10.1016/j.envsoft.2017.06.025, 2017.
Rushdi, A. I., Al-Mutlaq, K. F., Al-Otaibi, M., El-Mubarak, A. H., and Simoneit, B. R. T: Air quality and elemental enrichment factors of aerosol particulate matter in Riyadh City, Saudi Arabia, Arab. J. Geosci., 6, 585–599, https://doi.org/10.1007/s12517-011-0357-9, 2013.
Saarikoski, S., Timonen, H., Saarnio, K., Aurela, M., Järvi, L., Keronen, P., Kerminen, V.-M., and Hillamo, R.: Sources of organic carbon in fine particulate matter in northern European urban air, Atmos. Chem. Phys., 8, 6281–6295, https://doi.org/10.5194/acp-8-6281-2008, 2008.
Safar, Z. S. and Labib, M. W.: Assessment of particulate matter and lead levels in the Greater Cairo for the period 1998–2007, J. Adv. Res., 1, 53–63, 2010.
Satsangi, A., Pachauri, T., Singla, V., Lakhani, A., and Kumari, K. M.: Organic and elemental carbon aerosols at a suburban site, Atmos. Res., 113, 13–21, 2012.
Shaik, A. P., Sultana, S. A., and Alsaeed, A. H.: Lead Exposure: A Summary of Global Studies and the Need for New Studies from Saudi Arabia, Dis. Markers, 2014, 415160, https://doi.org/10.1155/2014/415160, 2014.
Snyder, D. C., Rutter, A. P., Worley, C., Olson, M., Plourde, A., Bader, R. C., Dallmann, T., and Schauer, J. J.: Spatial variability of carbonaceous aerosols and associated source tracers in two cities in the Midwestern United States, Atmos. Environ., 44, 1597–1608, 2010.
Stein, A. F., Draxler, R. R., Rolph, G. D., Stunder, B. J. B., Cohen, M. D., and Ngan, F.: NOAA's HYSPLIT atmospheric transport and dispersion modeling system, B. Amer. Meteorol. Soc., 96, 2059–2077, 2015.
Taylor, S. R.: Abundance of chemical elements in the continental crust: A new table, Geochim. Cosmochim. Ac., 28, 1273–1285, 1964.
Tsiouri, V., Kakosimos, K. E., and Kumar, P.: Concentrations, sources and exposure risks associated with particulate matter in the Middle East Area – a review, Air. Qual. Atmos. Hlth., 8, 67–80, https://doi.org/10.1007/s11869-014-0277-4, 2015.
Turpin, B. J. and Huntzicker, J. J.: Identification of secondary organic aerosol episodes and quantification of primary and secondary organic aerosol concentrations during SCAQS, Atmos. Environ., 29, 3527–3544, 1995.
U.S. EPA: Air Quality Criteria for Lead (Final Report, 2006), U.S. Environmental Protection Agency, Washington, DC, EPA/600/R-05/144aF-bF, 2006.
Viana, M., Kuhlbusch, T.A., Querol, X., Alastuey, A., Harrison, R. M., Hopke, R. M., Winiwarter, P. K., Vallius, M., Szidat, S., Prevot, A. S. H., Hueglin, C., Bloemen, H., Wahlin, P., Vecchi, R., Miranda, A. I., Kasper-Giebl, A., Maenhaut, W., and Hitzenberger, R.,: Source apportionment of particulate matter in Europe: a review of methods and results, J. Aerosol Sci., 39, 827–849, 2008.
Vodička, P., Scharz, J., and Ždímal, V., Analysis of one year's OC ∕ EC data at a Prague suburban site with 2h time resolution, Atmos. Environ., 77, 865–872, 2013.
von Schneidemesser, E., Zhou, J., Stone, E. A., Schauer, J. J., Qasrawi, R., Abdeen, Z., Shpund, J., Vanger, A., Sharf, G., Moise, T., Brenner, S., Nassar, K., Saleh, R., Al-Mahasneh., Q. M., and Sarnat, J. A.: Seasonal and spatial trends in the sources of fine particle organic carbon in Israel, Jordan, and Palestine, Atmos. Environ., 44, 3669–3678, 2010.
Wang, M., Xu, B., Zhao, H., Cao, J., Joswiak, D., Wu, G., and Lin, S.: The influence of dust on quantitative measurements of black carbon in ice and snow when using a thermal optical method, Aerosol Sci. Tech., 46, 60–69, https://doi.org/10.1080/02786826.2011.605815, 2012.
Weinhold, B.: Global Bang for the Buck Cutting Black Carbon and Methane Benefits Both Health and Climate, Environ. Health Persp., 120, A245–A245, https://doi.org/10.1289/ehp.120-a245b, 2012.
Wu, B., Zhu, J., and Li, X. : Distribution of calcium, nichkel, iron, and manganes in super-heavy oil from Liaohe Oilfield, China, Pet. Sci., 11, 590–595, https://doi.org/10.1007/s12182-014-0376-8, 2014.
Wu, C. and Yu, J. Z.: Determination of primary combustion source organic carbon-to-elemental carbon (OC ∕ EC) ratio using ambient OC and EC measurements: secondary OC-EC correlation minimization method, Atmos. Chem. Phys., 16, 5453–5465, https://doi.org/10.5194/acp-16-5453-2016, 2016.
Yu, L., Wang, G., Zhang, R., Zhang, Song, Y., Wu, B., Li, X., An, K., and Chu, J.: Characterization and Source Apportionment of PM2.5 in an Urban Environment in Beijing, Aerosol Air Qual. Res., 13, 574–583, https://doi.org/10.4209/aaqr.2012.07.0192, 2013.
Zhang, Q., Jimenez, J. L., Canagaratna, M. R., Allan, J. D., Coe, H., Ulbrich, I., Alfarra, M. R., Takami, A., Middlebrook, A. M., Sun, Y. L., Dzepina, K., Dunlea, E., Docherty, K., DeCarlo, P. F., Salcedo, D., Onasch, T., Jayne, J. T., Miyoshi, T., Shimono, A., Hatakeyama, S., Takegawa, N., Kondo, Y., Schneider, J., Drewnick, F., Borrmann, S., Weimer, S., Demerjian, K., Williams, P., Bower, K., Bahreini, R., Cottrell, L., Griffin, R. J., Rautiainen, J., Sun, J. Y., Zhang, Y. M., and Worsnop, D. R.: Ubiquity and Dominance of Oxygenated Species in Organic Aerosols in Anthropogenically-Influenced Northern Hemisphere Midlatitudes, Geophys. Res. Lett., 34, L13801, https://doi.org/10.1029/2007GL029979, 2007.
Zhang, Q., Shen, Z, Cao, J., Ho, K. F., Zhang, R., Bie, Z., Chang, H., and Liu, S.: Chemical profiles of urban fugitive dust over Xi'an in the south margin of the Loess Plateau, China, Atmos. Pollut. Res., 5, 421–430, 2014.
Zhao, P., Dong, F., Yang, Y., He, D., Zhao, X., Zhang, W., Yao, Q., and Liu, H.: Characteristics of carbonaceous aerosol in the region of Beijing, Tianjin, and Hebei, China, Atmos. Environ., 71, 389–398, 2013.