the Creative Commons Attribution 4.0 License.
the Creative Commons Attribution 4.0 License.
Multi-generation chemical aging of α-pinene ozonolysis products by reactions with OH
Ningxin Wang
Evangelia Kostenidou
Neil M. Donahue
Spyros N. Pandis
Secondary organic aerosol (SOA) formation from volatile organic compounds (VOCs) in the atmosphere can be thought of as a succession of oxidation steps. The production of later-generation SOA via continued oxidation of the first-generation products is defined as chemical aging. This study investigates aging in the α-pinene ozonolysis system with hydroxyl radicals (OH) through smog chamber experiments. The first-generation α-pinene ozonolysis products were allowed to react further with OH formed via HONO photolysis. After an equivalent of 2–4 days of typical atmospheric oxidation conditions, homogeneous OH oxidation of the α-pinene ozonolysis products resulted in a 20–40 % net increase in the SOA for the experimental conditions used in this work. A more oxygenated product distribution was observed after aging based on the increase in aerosol atomic oxygen-to-carbon ratio (O : C) by up to 0.04. Experiments performed at intermediate relative humidity (RH) of 50 % showed no significant difference in additional SOA formation during aging compared to those performed at a low RH of less than 20 %.
- Article
(2131 KB) - Full-text XML
-
Supplement
(211 KB) - BibTeX
- EndNote
Anthropogenic activities such as fuel combustion as well as biogenic sources such as emissions from vegetation can introduce particles and particle precursors into the atmosphere. In most areas, about half of the submicron aerosol mass on average is composed of organic compounds (Zhang et al., 2007). Organic particles directly emitted to the atmosphere are traditionally defined as primary organic aerosol (POA), while those formed through atmospheric reactions and condensation of species with corresponding volatility are secondary (SOA). Atmospheric aerosols represent a significant risk to human health by causing respiratory problems and heart attacks (Davidson et al., 2005; Pope et al., 2009). At the same time these particles influence the climate of our planet (Intergovernmental Panel on Climate Change, 2007).
Oxygenated OA with a high oxygen-to-carbon ratio (O : C) is often the most important component of ambient OA, suggesting the importance of atmospheric chemistry in the formation and processing of OA (Zhang et al., 2007). Early studies of SOA formation (Grosjean and Seinfeld, 1989; Izumi and Fukuyama, 1990; Odum et al., 1996) focused on the first stage of reactions involving the target precursor reacting with the chosen oxidant. In the atmosphere, organic vapors and particles interact with oxidants for days and therefore successive oxidation processes are inevitable.
Chemical aging refers to the subsequent stages of SOA formation and evolution due to the production of later-generation products via oxidation of first-generation products by oxidants such as OH free radicals (Donahue et al., 2006; Henry et al., 2012). Previous studies have explored various forms of aging, including heterogeneous reactions of oxidants and aerosols (George et al., 2008), oligomerization (Kalberer et al., 2006), photolysis of either gas- or condensed-phase products (Henry and Donahue, 2012), and homogeneous gas-phase oxidation by OH (Donahue et al., 2012). Homogeneous gas-phase oxidation reactions appear to be in general much faster than heterogeneous reactions due to diffusion limitations of the latter (Lambe et al., 2009). The first-generation oxidation reactions of most SOA precursors convert much less than 50 % of the precursor to SOA, leaving more than half of the carbon still in the gas phase. Additional oxidation of these vapors can potentially contribute additional and more oxygenated SOA components. These later-generation reactions have been proposed to be a major missing step connecting chamber studies to field measurements.
Zeroth-order parameterizations have been developed to model the chemical aging of semi-volatile POA emissions in chemistry–transport models (CTMs; Robinson et al., 2007). CTMs using these schemes show improved performance in urban areas such as Mexico City (Tsimpidi et al., 2011), but tend to overpredict OA in areas such as the southeastern United States where biogenic volatile organic compounds (VOCs) dominate if chemical aging is assumed to be a major source of additional SOA (Lane et al., 2008). As a result, the importance of aging of biogenic SOA as a source of SOA mass concentration remains an issue of debate.
The ozonolysis of α-pinene (C10H16) is considered one of the most important global SOA sources (Griffin et al., 1999). The system has been well characterized through smog chamber experiments in which researchers quantified its SOA yields under different conditions, explored the reaction pathways and mechanisms, and identified its product distributions. Recent studies suggest that there is significant potential for additional SOA formation from homogeneous gas-phase aging by OH of the first-generation α-pinene oxidation products (Donahue et al., 2012; Müller et al., 2012; Chacon-Madrid et al., 2013). Major identified products such as pinonaldehyde and pinonic acid existing in the gas phase can serve as SOA precursors and further react with OH. Pinonaldehyde reacts with OH, with SOA mass yields up to 5 % under low-NOx conditions and 20 % under high-NOx conditions (Chacon-Madrid et al., 2013). Müller et al. (2012) demonstrated the formation of 1,2,3-butanetricarboxylic acid (MBTCA), an SOA product of low volatility identified in α-pinene ozonolysis, through the gas-phase OH oxidation of pinonic acid. They reported an experimental yield of 0.6 % for MBTCA from the gas-phase OH oxidation of pinonic acid, accounting for about 10 % of the total SOA formed. The proposed formation mechanisms of MBTCA are a classic example of semi-volatile precursors going through oxidation and forming products of lower volatility.
The Multiple Chamber Aerosol Chemical Aging Study (MUCHACHAS) explored the gas-phase OH aging effects of the α-pinene ozonolysis products via experiments performed in four different smog chambers (Donahue et al., 2012). They were able to isolate the aging effect by using different OH sources (HOOH photolysis, HONO photolysis, tetramethylethylene (TME) ozonolysis), light sources (sunlight, quasi-solar lamps, 350 nm UV lamps), and chambers of different design in size and material (Teflon and aluminum). In almost all experiments, additional formation of SOA (up to 55 %) and a more oxidized product distribution (increasing O : C) were observed after aging. However, in one of the chambers, strong UV photolysis led to decreasing SOA mass concentrations in experiments with low to moderate OH levels, [OH] ≤ 2 × 10⁶ molecules cm−3 (Henry and Donahue, 2012). These authors concluded that chemical aging involves a complex set of interacting processes with competing functionalization (conserved C number with products of lower volatility and higher oxidation states) and fragmentation (cleavage of C-C bonds with products over a wide volatility range and higher oxidation states) of the various organic compounds. A 2-D volatility basis set (2D-VBS) simulation based on these two pathways and a branching ratio between them showed that homogeneous OH aging can potentially more than double the α-pinene SOA mass concentration, after about a day's equivalent of typical atmospheric oxidation conditions. Uncertainties such as “ripening” during which SOA volatility evolves but its mass remains constant, UV photolysis and heterogeneous OH uptake can further complicate the aging process.
Qi et al. (2012) also explored aging of the α-pinene ozonolysis system through smog chamber experiments using HOOH as an OH source and studied the UV photolysis effect. They observed a 7.5 % increase in the SOA volume concentration and an increase of 0.03 in the O : C after aging. Minimum photolysis effect was reported for these experiments.
One complication of chamber experiments is the interaction of particles with chamber walls. The wall-loss rate of particles is a function of particle size, charge distribution, chamber geometry, turbulence, and electric field within the chamber (Crump and Seinfeld, 1981). In order to quantify SOA yields from chamber experiments, it is important to correct for particle wall loss.
Recent findings show that organic vapors in the chamber can be directly lost to the Teflon walls as well further complicate the wall-loss correction process (Matsunaga and Ziemann, 2010; Zhang et al., 2014). Krechmer et al. (2016) measured the loss rate of vapors formed in the chamber and found the corresponding timescale to be 7–13 min. Ye et al. (2016a) determined the vapor wall-loss timescale in the Carnegie Mellon chamber used in this work to be around 15 min for semi-volatile organic compounds.
Despite the consensus from the aforementioned chamber studies that gas-phase OH aging of α-pinene ozonolysis products can contribute to additional SOA formation, there lacks consistency in the extent to which the additional mass can form for different OH exposures. Part of the problem is that the estimated amount of additional SOA formed from these long-lasting aging experiments can be extra sensitive to the particle and the vapor wall-loss correction methods deployed. The uncertainties at the end of a 10 h long aging experiment during which most particles are lost to chamber walls and the measured suspended mass is low can be relatively high. In this work, we aim to quantify the additional SOA formed during the aging step comparing measurements from a suite of instrumentation. We adopt a size-dependent particle wall-loss correction method and develop a procedure to better constrain the associated errors. We also attempt to constrain the vapor loss using both theoretical calculations and measurements.
We conducted experiments in a 12 m3 Teflon (Welch Fluorocarbons) smog chamber at Carnegie Mellon University (CMU). The reactor was suspended in a temperature-controlled room with walls covered with UV lights (GE 10526 and 10244). Prior to each experiment, we flushed the chamber overnight with purified air under UV illumination to remove any residual particles and gas-phase organics. We generated purified air by passing ambient air through a high-efficiency particulate air (HEPA) filter to remove particles, an activated carbon filter to remove any organics, a Purafil filter to remove NOx, and finally a silica gel filter, keeping relative humidity (RH) below 5 % in the chamber before each experiment.
We pumped an ammonium sulfate solution (1 g L−1) into the chamber at the beginning of each experiment through an atomizer (TSI, model 3076) at a constant rate of 90 mL h−1 to produce droplets. The droplets passed through a diffusion dryer and a neutralizer to produce dry ammonium sulfate seed particles. We injected seeds with a number mode size of 110 nm until they reached a number concentration of 2 × 104 cm−3, resulting in an initial seed mass concentration of around 40 µg m−3 and a surface area concentration of up to 1000 µm2 cm−3. Typical organic vapors with a molar weight of 250 g mol−1 thus had an initial collision frequency with these seeds of 0.01 s−1. We injected α-pinene (Sigma-Aldrich, ≥ 99 %) into the chamber using a septum injector with purified air as carrier flow. We generated ozone using a corona-discharge ozone generator (Azco, HTU500AC) to initiate the ozonolysis reaction. We prepared a fresh HONO solution in a bubbler by adding a 4.9 g L−1 sulfuric acid solution to a 6.9 g L−1 sodium nitrite solution. We then turned on the UV lights to start the photodissociation of HONO, producing OH.
At the end of each experiment, we injected additional ammonium sulfate seeds into the chamber using the same method with a more concentrated solution (5 g L−1) in order to characterize the particle wall-loss rates a second time.
We added butanol-d9 (Cambridge Isotope Laboratories, 98 %) into the chamber through the septum injector as an OH tracer before the reaction started and used the method described in Barmet et al. (2012) to calculate the OH produced by HONO photolysis. The OH concentration in these experiments was around 2.4 × 10⁷ molecules cm−3 for the first hour, then dropped to around 5 × 10⁶ molecules cm−3 afterwards. The introduction and photolysis of HONO produces hundreds of parts per billion of NOx, and thus the aging reactions in this work occurred under high-NOx conditions; the majority of the peroxy radicals reacted with NO during the aging phase of the experiments.
Table 1Initial conditions of the α-pinene ozonolysis aging experiments.
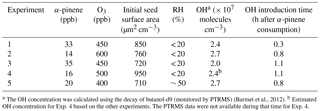
a The OH concentration was calculated using the decay of butanol-d9 (monitored by PTRMS) (Barmet et al., 2012). b Estimated OH concentration for Exp. 4 based on the other experiments. The PTRMS data were not available during that time for Exp. 4.
We performed experiments at both a low RH of less than 20 % and an intermediate RH of 50 %. To add water vapor to the chamber, we used a stream of purified air to carry ultrapure water (Millipore water purification system) in a bubbler into the chamber before the introduction of seeds.
We measured the particle size distribution using a TSI scanning mobility particle sizer, SMPS (classifier model 3080; CPC model 3010 or 3772), with flows adjusted to measure particle diameters in the 15–700 nm range. We measured the particle composition and mass spectrum of the OA with an Aerodyne high-resolution time-of-flight aerosol mass spectrometer (HR-ToF-AMS). We monitored the concentrations of α-pinene and butanol-d9 using a proton transfer reaction mass spectrometer (PTR-MS, Ionicon), the ozone concentration using a Dasibi 1008 ozone monitor, and NOx (NO + NO2) levels using a Teledyne API NOx analyzer 200A. We held the chamber temperature constant at 22 ∘C throughout all experiments. We list the initial conditions of the experiments performed for this work in Table 1.
3.1 SOA yields
The SOA mass yield, Y, is a metric of the ability of a gaseous precursor to form SOA and is defined as VOC, where CSOA is the produced SOA mass concentration (µg m−3) and ΔVOC the amount of the VOC precursor (α-pinene in this case) reacted (in µg m−3). To separate the effect of aging on SOA mass concentration, we define a first-generation SOA mass yield, VOC, and a second-generation SOA mass yield, VOC. CSOA,1 and CSOA,2 are the concentrations of SOA formed before and after aging with hydroxyl radicals. All α-pinene reacts away during the first stage and thus ΔVOC for the second stage is the same as the initial α-pinene concentration in the chamber.
3.2 Particle wall-loss correction
In this work, we try to reduce the uncertainties in the estimated SOA mass concentration associated with the particle wall-loss correction. This uncertainty can be significant due to two aspects of these aging experiments: the evolution of the particle size distribution and the duration of the experiments. In these aging experiments, where particles grow by condensation and coagulation for several hours, the particle size distribution can potentially shift, covering a wide size range over the course of an experiment. Particle wall losses are size dependent, and this shift can introduce significant errors if a constant loss rate constant is assumed. To minimize these problems, we adopted a size-dependent particle wall-loss correction method in which we determined the particle wall-loss rate constant, ki, at each particle size, Dp.
3.2.1 Determination of particle wall-loss rate constants
The size-dependent particle wall-loss correction method (Keywood et al., 2004; Ng et al., 2007; Loza et al., 2012; Nah et al., 2016) adopted in this work is based on the SMPS-measured particle size distribution. At each particle size bin i the first-order particle wall-loss rate constant ki can be determined as the slope of the following equation:
where Ni(t) is the SMPS-measured aerosol number concentration at size bin i and Q is an arbitrary constant. Applying Eq. (1) across the entire SMPS-measured particle size range, we obtain the particle wall-loss rate constant function, k(Dp).
To determine the k(Dp) profile, we utilized the initial 4 h ammonium sulfate seed wall-loss period for each experiment. Since k may also vary with time (McMurry and Rader, 1985), we determined a second k(Dp) profile for each experiment using the ammonium sulfate seed wall-loss period at the end. It is important to ensure that the k's, especially at sizes at which the majority of SOA mass is distributed, remain the same over the course of each experiment.
The k(Dp) values calculated (with an R2 > 0.5) based on SMPS measurements of the seed distribution from this work usually only cover a particle size range of 30–300 nm due to the lack of particles at either end of the particle size distribution. To determine the k(Dp) for Dp < 30 nm, we use a simple log-linear fit of k's from 30 to 50 nm and back extrapolate it to 10 nm. To determine k(Dp) for Dp > 300 nm, we assume that the constant is practically the same in the 300–700 nm range. We confirmed this with additional seed-only experiments in which there were enough particles at that size range (Wang et al., 2018). Significant increases in the rate loss constant are observed for particles larger than 1 µm, while in our experiments the particles remained smaller than 600 nm or so. A measure of the uncertainty of these corrections is the variability in the corrected mass concentration during the seed wall-loss periods as discussed in the next section. Details regarding the wall-loss profiles in the CMU chamber and the execution of the size-dependent particle wall-loss correction for this work can be found in Wang et al. (2018).
3.2.2 Correction of SMPS measurements
The corrected particle number concentration at each size bin i, Ni(t), can be calculated numerically,
from the measured values and the k(Dp) corresponding to the size bin i, ki.
For closed systems in which coagulation is slow, the number concentration corrected for particle wall loss should be constant. In order to evaluate how well the correction works, we define the parameter , where is the standard deviation of the number concentration corrected for particle wall loss for the seed wall-loss periods and the average. Similarly, we define based on the volume concentration corrected for particle wall loss for the two seed wall-loss periods. Only when all four values, εN and εV for both the initial and the final seed periods, are less than 5 % do we deem the particle wall-loss correction valid for that individual experiment. Experiments in which these criteria were not met were not included in the analysis.
To calculate the mass concentration of the formed SOA, CSOA, during the course of an experiment, we treated the aerosol volume concentration corrected for particle wall loss V(t) differently before and after its maximum, Vmax . For
where is the corresponding time at the maximum total aerosol volume concentration corrected for particle wall loss. Vs is the average seed volume concentration corrected for particle wall loss before the beginning of each experiment. ρSOA is the SOA density, assumed to be equal to 1.4 µg m−3 (Kostenidou et al., 2007). Ideally, V(t) should equal to Vmax after the reactions are completed and particle wall loss is the only process after . However, deviations of V(t) from Vmax are caused by the uncertainty associated with applying the size-dependent wall-loss corrections. By scaling Vs with , we are distributing the impact of any potential fluctuations in V(t) evenly to both the seeds and the organics and thus obtain a more stable CSOA after aging.
3.3 Analysis of AMS measurements
The HR-AMS was operated in V mode during the experiments in this work. Squirrel v1.56D was used to analyze the data. The atomic oxygen-to-carbon ratio, O : C, was determined based on the unit–resolution correlation described in Caragaratna et al. (2015). Nitrate signals were attributed to organics since the only sources of them in these experiments are organonitrates.
In an attempt to explore the functionalities and products that may have changed during aging, we used the AMS high-resolution (HR) “family” analysis. We used Pika 1.15D to analyze the HR data. Each fitted ion is grouped into a family based on its chemical formula, and the families used are CH, CHO, CHO2, Cx, HO, and NO. These are the main components of the organics formed, with the HO family calculated by subtracting the concentrations of the other families from the total organic signal. This is necessary because the fragmentation of sulfates can interfere with the HO family. The NO family can be used to represent the organonitrates formed during the aging phase of the experiments.
The evolution of aerosol number concentration corrected for particle wall loss during a typical experiment (Exp. 1) together with the SMPS raw measurements are shown in Fig. 1. Prior to the ozonolysis, 18 000 cm−3 of ammonium sulfate particles was added to the chamber as seeds. After a 4.5 h wall-loss period, 8000 cm−3 of particles remained suspended, serving as a preexisting surface for condensation. At t = 0, ozone was added into the chamber, reacting with α-pinene to form condensable first-generation products. The ozonolysis of α-pinene has been found to produce OH with a molar yield of approximately 0.7 (Paulson et al., 1998), which in our experiments resulted in approximately one-third of the precursor reacting with OH. An additional 100 cm−3 of particles was formed due to nucleation at this time. Two doses of HONO were added into the chamber in this experiment at t = 0.4 h and t = 1.3 h. HONO was allowed to mix in the chamber and then the UV lights were turned on at t = 0.8 h and t = 1.8 h to produce OH. At t = 3.5 h, another 10 000 cm−3 of ammonium sulfate particles was added into the chamber for a second 4 h long determination of the k(Dp) profile for this experiment.
The two k(Dp) profiles determined from the initial seed wall-loss period and the one at the end of the experiment are shown in Fig. 2. They agree relatively well with small discrepancies at Dp < 50 nm. The complete k(Dp) profile used for the size-dependent particle wall-loss correction is also shown.
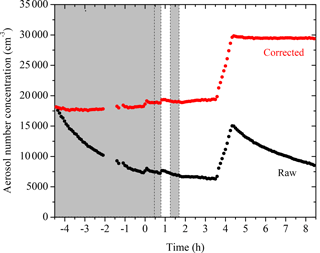
Figure 1SMPS-measured (black symbols) and size-dependent particle-wall-loss-corrected (red symbols) aerosol number concentration evolution during a typical experiment (Exp. 1). Ozone was added into the chamber at time zero to initiate α-pinene ozonolysis. The shaded areas indicate that the chamber was dark. The dashed lines mark the beginning and the end of the two times HONO were added. The increase in number concentration at t = 3.5 h is due to the injection of 5 g L−1 of ammonium sulfate particles. An additional 100 cm−3 of particles was formed due to nucleation at both the ozonolysis step and the aging step. Data were not recorded from t = −2 to −1.4 h.
As indicated in Fig. 1, the aerosol number concentration corrected for particle wall loss remains relative level at t < 0 h and t > 3.5 h, with % and %, respectively. The aerosol volume concentration corrected for particle wall loss (Fig. 3) at the initial seed wall-loss period and that at the end had variabilities equal to % and %, respectively. All parameters were less than 5 % and therefore the accuracy of the wall-loss correction was acceptable.
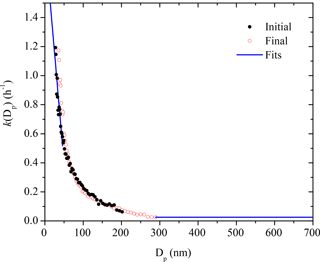
Figure 2The size-dependent particle wall-loss rate constant profile, k(Dp), for Exp. 1. The black symbols are the rate constants calculated based on the wall-loss process of the initial ammonium sulfate seed particles from t = −4.5 h to t = 0 h, while the red open symbols show those of the additional ammonium sulfate particles at the end from t = 4.5 h to t = 8.5 h. The blue line is the fit determined.
The evolution of aerosol volume concentration corrected for particle wall loss for Exp. 1 together with the corresponding SMPS raw measurements are shown in Fig. 3. Particles grew from t = 0 to 0.7 h and t = 0.8 to 1 h due to vapor condensation. The total aerosol volume peaked at t = 0.7 h during the first-generation oxidation and reached its maximum at t = 1.1 h due to aging during the second-generation oxidation. The change in volume during the second addition of OH at 1.7 h was negligible.
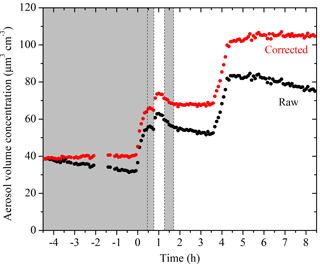
Figure 3SMPS-measured (black symbols) and size-dependent particle-wall-loss-corrected (red symbols) aerosol volume concentration evolution during a typical experiment (Exp. 1). Ozone was added into the chamber at time zero to initiate α-pinene ozonolysis. The shaded areas indicate that the chamber was dark. The dashed lines mark the beginning and the end of the two times HONO were added. An amount of 5 g L−1 of ammonium sulfate particles was injected into the chamber at t = 3.5 h. Data were not recorded from t = −2 to −1.4 h.
The SOA mass concentration evolution for Exp. 1 calculated using Eq. (3) is shown in Fig. 4. The error bars are calculated using the highest ε (in this case %). For this experiment, 37.7 ± 1.6 µg m−3 of SOA was formed during ozonolysis. An additional 11.1 ± 2.6 µg m−3 of SOA was formed during the first aging period. The SOA reached 48.8 ± 2 µg m−3 after aging and remained approximately constant until the end of the experiment. The total SOA produced and the calculated SOA yields for all experiments are listed in Table 2.
The AMS-derived atomic oxygen-to-carbon ratio (O : C) evolution for Exp. 1 is shown together with the AMS-measured aerosol composition (assuming a unit collection efficiency, CE = 1) in Fig. 5. The increase in the sulfate signals at t = 0 is caused by a change in the instrument collection efficiency. Due to the uncertainty caused by CE changes over the course of an experiment, we did not use the absolute AMS-measured organic mass concentration for any quantitative analysis. Using the algorithm derived by Kostenidou et al. (2007), we calculated the CE to be ∼ 0.25 for the initial seed period and ∼ 0.4 after the seeds were coated with organics. A quick check comparing the two stepwise increases in the CE-corrected organic mass concentration to those derived from SMPS revealed that the results from both instruments agreed reasonably well. The algorithm also estimated that the SOA density was 1.3 ± 0.15 g cm−3, in good agreement with the Kuwata et al. (2012) parameterization based on the measured O : C and H : C, which also predicted 1.3 g cm−3.
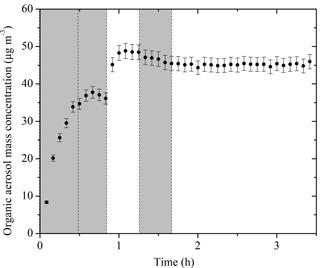
Figure 4The SOA mass concentration corrected for particle wall loss (ρ = 1.4 g cm−3) evolution for Exp. 1 derived from SMPS measurements. The corresponding error shown is due to the particle wall-loss correction. Ozone was added into the chamber at time zero to initiate α-pinene ozonolysis. The shaded areas indicate that the chamber was dark. The dashed lines mark the beginning and the end of the two times HONO were added.
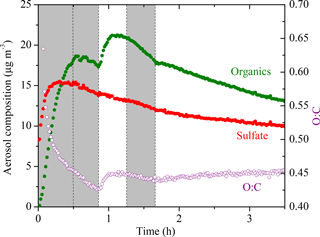
Figure 5The AMS-measured aerosol composition (CE = 1) (left axis) and the atomic oxygen-to-carbon ratio (right axis) evolving with time for Exp. 1. The increase in the sulfate signal at t = 0 is the result of a change in the collection efficiency (CE). Ozone was added into the chamber at time zero to initiate α-pinene ozonolysis. The shaded areas indicate that the chamber was dark. The dashed lines mark the beginning and the end of the two times HONO were added.
The O : C is a collective measure for the ongoing chemistry during these aging experiments. In Exp. 1, the O : C kept decreasing due to the freshly formed semi-volatile SOA condensing onto particles from t = 0 to 0.5 h. Later during the dark period (t = 0.5 to 0.8 h), the O : C ratio kept decreasing to 0.42 while the organic mass concentration stayed almost constant. This is consistent with the ripening phenomenon, first observed during the MUCHACHAS campaign, where the composition of the formed SOA keeps evolving after α-pinene has reacted while the change in SOA mass is minimal (Tritscher et al., 2011). The nature of this process is not well understood, but it probably involves heterogeneous reactions. After OH radicals were generated in the chamber at t = 0.8 h, the semi-volatile vapors were oxidized to form second-generation products of lower volatility, resulting in an increase of 0.02 in O : C in about 10 min. After t = 1 h, the O : C remained relatively constant but it started to decrease at t = 1.25 h when the UV lights were turned off. Since aging is a complex process that involves functionalization, fragmentation, and heterogeneous reactions, the trends in O : C are indicative of the competition among these processes. The decrease we observed here was associated with turning the UV lights off, and thus it is likely that some chemistry was perturbed and thus the processes resulting in decreasing O : C took over. The decrease in O : C associated with turning off the UV lights was not consistent across the five experiments. This further proves that this phenomenon is the result of several competing processes and needs further investigation on a molecular level. An inflection point at t = 1.7 h was observed after a second dose of OH being introduced in the chamber. Instead of the stepwise increase like the one observed after the first dose of OH, the O : C increased slowly but steadily this time until the end of the experiment to 0.45 with no significant increase in organic mass. This is also quite consistent with what was observed in MUCHACHAS.
We used the organic-to-sulfate ratio (org ∕ sulf) derived from AMS measurements to look at the SOA formation in these experiments due to its insensitivity to changes in CE. The org ∕ sulf time series for Exp. 1 is shown in Fig. 6. The ratio increased to 1.25 at t = 0.7 h as the result of the first-generation vapors condensing onto preexisting particles. After we first turned on the UV lights, a stepwise increase in the ratio was observed and reached the maximum value of 1.60 at t = 1.1 h as a result of the second-generation oxidation chemistry. After that, the ratio kept decreasing. A small bump was observed after the second introduction of OH and then the ratio kept decreasing. One possible explanation for this continuous decrease is the effect of the size-dependent particle wall-loss process. The faster removal of smaller particles (which contain more SOA than sulfate) than that of the bigger ones (which have a lower SOA-to-sulfate ratio) can lead to a decrease in the overall org ∕ sulf ratio. Figure 7 shows the size dependence of the org ∕ sulf ratio, together with the mass distribution of both organic and sulfate for Exp. 1. The org ∕ sulf ratio decreased dramatically from 10 to 1 over the particle vacuum aerodynamic diameter (Dva) range of 200–500 nm, indicating strong composition dependence on particle size. Since the majority of the mass is distributed in this range, the size-dependent particle wall-loss rate can contribute significantly to the decrease observed in Fig. 6 after the org ∕ sulf ratio reached its maximum.
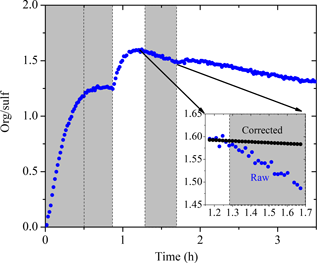
Figure 6The AMS-derived organic-to-sulfate ratio time series for Exp. 1. The inset is a blowup of the org ∕ sulf ratio from its maximum until the second time when the UV lights were turned on. The black symbols are the org ∕ sulf ratio corrected for particle wall loss during that half hour. Ozone was added into the chamber at time zero to initiate α-pinene ozonolysis. The shaded areas indicate that the chamber was dark. The dashed lines mark the beginning and the end of the two times HONO were added.
4.1 Effect of size-dependent losses on the organic-to-sulfate ratio
To quantify the effect of the size-dependence of the particle wall-loss process on the org ∕ sulf ratio, we discretized the AMS-measured mass distribution M(Dp) into 10 bins in the particle diameter space and defined a mass-weighted particle wall-loss rate constant for each species j, , as
where Mij is the aerosol mass concentration of species j for size bin i and ki is the averaged k(Dp) across size bin i. Note that the particle diameter used in this section refers to the SMPS-measured mobility equivalent diameter Dp. The particle vacuum aerodynamic diameters derived from the AMS measurements have been converted to Dp using an SOA density of 1.4 µg m−3.
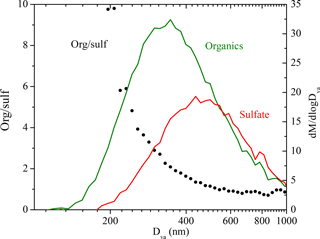
Figure 7The dependence of the AMS-derived organic-to-sulfate ratio on particle vacuum aerodynamic diameter for Exp. 1 (left axis). Also shown are the AMS-measured organic (green) and sulfate (red) mass distribution (right axis). The results are based on PToF data averaged over ∼ 2.5 h (t = 1.1 to 3.5 h).
From Eq. (4) we are able to determine a mass-weighted particle wall-loss rate constant for sulfate, , and for organics, . For the period after completion of the reactions and if there are only particle losses to the walls, the org ∕ sulf ratio should satisfy
where (org∕sulf)m(t) is the AMS-measured and (org∕sulf)(t) the loss-corrected org ∕ sulf ratio.
We can test if indeed the particle wall losses are responsible for the decreasing ratio in Exp. 1 focusing on the period from t1=1.2 h to t2=1.7 h (Fig. 6). In this example t1 corresponds to the maximum org ∕ sulf ratio and t2 is the second time in which the UV lights were turned on. Applying Eq. (4), we found the mass-weighted particle wall-loss rate constant for organics, h−1, and for sulfate, h−1. The black line in the inset graph of Fig. 6 indicates the org ∕ sulf ratio corrected for particle wall loss for the chosen time period using Eq. (5). The loss-corrected ratio remained relatively constant, indicating that the size-dependent particle wall-loss process coupled with the different size distributions of the sulfate and organics were causing the decrease in the ratio. This exercise was repeated for the other experiments, arriving at the same conclusion.
4.2 Effect of chemical aging on additional SOA formation
To quantify aging effects based on the SMPS measurements, we define the fractional change in the SOA mass concentration corrected for particle wall loss after aging, Δ[OA], as
where CSOA,UV is the aerosol mass concentration corrected for particle wall loss at the time when we first turned on the UV lights. CSOA,UV can be equal to CSOA,1 depending on how level the first-generation SOA mass concentration remains after wall-loss correction. Figure 8 summarizes the Δ[OA] for all five experiments with the values and corresponding errors listed in Table 2. The OH exposure resulted in an average increase of 24 ± 6 % in SOA mass concentration after aging, ranging from 20 to 29 %. Our HONO injection method creates OH levels of about 2.4 × 10⁷ molecules cm−3 for the first hour and then the concentration dropped to around 5 × 10⁶ molecules cm−3. The OH exposure is equivalent to 2–4 days of typical atmospheric oxidation conditions, assuming an OH concentration of 2 × 10⁶ molecules cm−3. The uncertainties displayed in Fig. 8 were propagated from uncertainties in the SOA mass concentration.
To quantify aging effects based on the AMS data, we define the fractional change in the org ∕ sulf ratio:
where [org ∕ sulf]UV refers to the org ∕ sulf ratio at the time when we first turned on the UV lights, [org ∕ sulf]1 the maximum before we first turned on the UV lights, and [org ∕ sulf]2 the maximum after the OH exposure. Figure 8 summarizes the Δ[org ∕ sulf] calculated for all five experiments with the values and corresponding errors listed in Table 2. The uncertainties are based on the deviation between the measured and the corrected org ∕ sulf (Fig. 6 inset) over the chosen time period. An associated error is calculated for [org ∕ sulf]UV, [org ∕ sulf]1 and [org ∕ sulf]2. The reported error for Δ[org ∕ sulf] in Table 2 is the propagated results of the three. For experiments in this work, the percent increase in org ∕ sulf ratios ranged from 18 to 27 % with an average increase of 21 ± 4 %. The values are fairly consistent with the SMPS-derived Δ[OA].
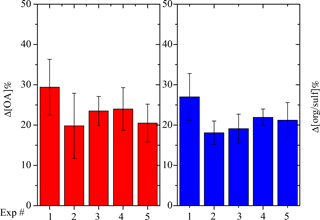
Figure 8SMPS-derived percent change in the SOA (red columns) mass concentration corrected for particle wall loss after aging and AMS-derived percent change in organic-to-sulfate ratio (blue columns) after aging for all five experiments.
4.2.1 Role of RH
Experiment 5, performed at the intermediate RH of 50 %, resulted in a comparable change in SOA formation after aging as experiments at a lower RH (Fig. 8). In this experiment, the increase in the org ∕ sulf ratio after aging was 21.2 %, 1.5 % higher than the average Δ[org ∕ sulf] of Exps. 2–4. Δ[OA] for Exp. 5 was 20.5 %, about 2 % lower than the average Δ[OA] of Exps. 2–4. The effect of RH on the SOA formation during chemical aging, at least for these conditions, appears to be small.
4.2.2 Role of organic vapor loss to the Teflon walls
For chamber SOA experiments with preexisting particles, the particles act as a competing surface against the chamber walls. We calculated the condensation sink (CS) of particles using the method described in Trump et al. (2014) with a unit accommodation coefficient, consistent with recent findings (Julin et al., 2014; Palm et al., 2016). The calculated CS in the form of timescale for vapors condensing onto particles (1 ∕ CS) for Exp. 1 is shown in Fig. 9. During the entire experiment, the timescale for vapors to condense onto particles remained less than a minute. Compared to the organic vapor wall-loss timescale of 15 min in the CMU chamber (Ye et al., 2016a), the vapors condense onto the particles 15 times faster than onto the walls. This corresponds to a 6.3 % loss of the semi-volatile vapors to the walls. Assuming the yields for the experiments conducted in this work also increase by 6.3 %, the absolute yields should be increased by 1–3 % after accounting for the vapor wall-loss effect. This approach is a conservative estimation of vapor wall loss, and yet the results are consistent with what we observed from the measurements. As indicated in Fig. 6, the org ∕ sulf ratio stayed practically constant after its first peak at t = 0.7 h until the introduction of OH. This is consistent with the fact that the semi-volatile organic compounds (SVOCs) formed in our system only accounted for a small fraction of the products. Ye et al. (2016b) studied the SVOCs formed in the α-pinene ozonolysis system and found 20 % SVOCs in the products formed from experiments with moderate precursor concentration (α-pinene = 75 ppb). They also observed that the SVOC fraction increased with increased amounts of reacted α-pinene. Since the reacted α-pinene in our experiments was less than 35 ppb, our observation of a small amount of SVOCs forming is also consistent with their results.
The situation is a little more complex for the second-generation oxidation because material with higher volatilities that could have become SOA was lost during the time after the end of the first phase and before the beginning of the second. To address this issue, OH radicals were introduced about an hour earlier in Exp. 1 as compared to the rest of the experiments. A shorter timescale ensures the first-generation vapor products react efficiently with OH instead of interacting with the chamber walls as in the case of longer timescales. There was an increase of 27 % in the org ∕ sulf ratio in this experiment after aging, 7 % more than the average of the other four experiments. Δ[OA] for Exp. 1 was 29.4 %, about 7.5 % higher than the average of the other four experiments. If we attribute this 7 % difference purely to the vapor wall-loss effect, then we estimate that vapor losses can increase the additional SOA formation by roughly another 10 % for the experiments conducted in this work.
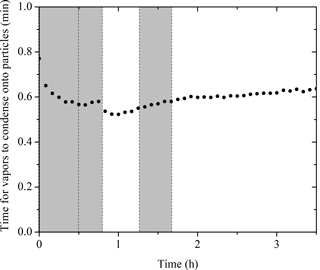
Figure 9The calculated condensation sink (CS) in the form of timescale for vapors condensing onto particles (1 ∕ CS). Ozone was added into the chamber at time zero to initiate α-pinene ozonolysis. The shaded areas indicate that the chamber was dark. The dashed lines mark the beginning and the end of the two times HONO were added.
4.3 Effect of chemical aging on aerosol composition
Figure 10 summarizes the absolute increase in O : C after the two doses of OH, with the corresponding exposure required to achieve the increase. As we discussed above using Exp. 1 as an example, the O : C in all experiments showed a stepwise increase after the first OH introduction while it grew continuously after the second OH introduction until the end of the experiment. For these five experiments, it took 10–30 min for the O : C to increase by 0.02–0.04. The stepwise increase in O : C is caused by the rapid reactions between the first-generation vapor products and the OH. One of the major products identified in the gas phase from the α-pinene ozonolysis system, pinonaldehyde, reacts with OH at a rate of 3.5 × 10⁻¹¹ cm3 molecule−1 s−1 (Davis et al., 2007). During the first hour of OH introduction, the OH concentration remains, on average, at a steady state of 2.4×10⁷ molecule cm−3. A quick estimation of 1∕kOH[OH] gives a timescale of approximately 16 min, which is consistent with what we observed in these experiments.
The second exposure corresponds to the period until the end of each experiment. The increase in O : C of 0.01 to 0.04 during this stage clearly indicates change in SOA composition, however, paired with minimum change in SOA mass. Although gas-phase reactions can contribute to these observed changes in O : C, the corresponding condensation of the products should also result in a detectable increase in SOA concentration during the same period. Given that changes in SOA concentration could not be detected, the contribution of gas-phase oxidation was probably small. In addition, we observed small quantities of SVOCs forming in our system as discussed above. The significant change in O : C without corresponding increase in SOA mass concentration was likely caused by heterogeneous reactions.
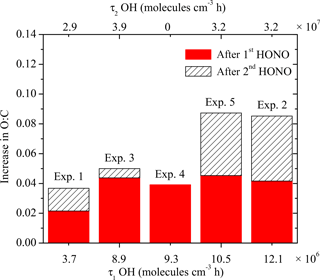
Figure 10The absolute increase in O : C after the two doses of OH, with the corresponding exposure. The solid red columns are the increase in O : C after the first introduction of OH, with the corresponding exposure on the bottom axis. The hatched columns are the increase in O : C after the second introduction of OH, with the corresponding exposure on the top axis.
Based on the HR family analysis results, the less-oxidized ion family CH decreased around 10 % during the aging process (i.e., from 41.9 to 38.1 % of the OA in Exp. 1 and from 40.5 to 35.3 % in Exp. 2) while the more oxidized CHO2 increased 4 % in Exp. 1 (from 12.8 to 13.3 %) and 16 % in Exp. 2 (from 14.9 to 17.3 %). The changes in the CHO family were +4 % in Exp. 1 and −6 % in Exp. 2, suggesting that there was both production and destruction of the corresponding family members. The concentration of organonitrates was, as expected, close to zero initially in these experiments. At the end of the aging process, the NO family represented 3–3.5 % of the OA.
CO (m∕z 44) from the CHO2 family and C2H3O+ (m∕z 43) from the CHO family are usually identified in aged and relatively fresh aerosols, respectively. Their fractions of the total organics, f44 and f43, have been used as chemical indicators in chamber experiments (Donahue et al., 2012). During the dark ozonolysis period of Exp. 1 (Fig. S2 in the Supplement), the f43 increased initially and stayed practically constant after t = 0.2 h, while f44 decreased. After the first introduction of OH, both f43 and f44 showed a stepwise increase. After the second introduction of OH, f43 decreased while f44 increased over time until the end of the experiment, indicating that the SOA was becoming progressively more oxidized during aging. During Exp. 2 (Fig. S4), f43 increased sharply initially and then slowly decreased during the dark ozonolysis period. This is consistent with the ripening effect observed during the MUCHACHAS campaign (Donahue et al., 2012). Overall, f43 decreased while f44 increased over the course of Exp. 2, indicating that the initially formed SOA was becoming more oxidized during aging.
4.4 Comparison with other studies
Overall, the results from our chamber experiments in this work are consistent with those from the MUCHACHAS chambers. After adopting a size-dependent particle wall-loss correction method, we observed 20–30 % additional SOA formation after aging. Vapor wall-loss effect can account for an additional 10 %, increasing the range to 20–40 %. The O : C presented a stepwise increase of 0.02–0.04 after the first introduction of OH and then increased gradually over time after the second introduction of OH.
During the MUCHACHAS campaign, mixtures of SOA and gas-phase products formed in the Paul Scherrer Institute (PSI) 27 m3 Teflon chamber from low (10 ppb) and high (40 ppb) initial α-pinene concentration were exposed to OH by TME ozonolysis and HONO photolysis at an RH of approximately 50 % (Tritscher et al., 2011). An OH concentration of 2 × 10⁶ to 10 × 106 molecules cm−3 was maintained for up to 4 h. The authors reported an additional 50 % SOA mass forming after aging using the first-order, size-independent particle wall-loss correction for the suspended organic mass concentration measured with an AMS. An increase of 0.04 in the oxygen-to-carbon ratio was also observed during aging.
In the 84.5 m3 Aerosol Interaction and Dynamics in the Atmosphere (AIDA) aluminum chamber at Karlsruhe Institute of Technology, an OH concentration of 2 × 10⁶ to 10 × 106 molecules cm−3 was used with a constant flow of TME (dark aging). The authors observed an increase of 17–55 % in the SMPS-derived SOA mass concentration (density corrected) after aging during four experiments with an initial α-pinene concentration ranging from 14 to 56 ppb (Salo et al., 2011). In the 270 m3 simulation of atmospheric photochemistry in a large reaction (SAPHIR) Teflon chamber at Forchungzentrum Jülich, SOA and vapors generated from the ozonolysis of 40 ppb α-pinene were aged for 3 consecutive days with OH produced by ambient light chemistry. An OH concentration of 2–5 × 10⁶ molecules cm−3 was maintained and 9, 4, and 1 % additional SOA was formed after aging each day. These values were corrected for particle wall loss using different wall-loss rate constants determined during different periods of the experiment.
Our result of 20–40 % additional SOA formation due to aging is well within the range of that from the chambers above. The difference in the results from each chamber could potentially be attributed to different OH exposure (e.g., a constant flow of HONO or TME was provided in the PSI chamber). Other plausible explanations include whether the reported values were particle wall-loss corrected and whether the same method was adopted for the correction.
For the HONO aging experiment performed in the CMU chamber during the MUCHACHAS campaign, Henry and Donahue (2012) suggested a potentially strong photolysis effect based on decreasing org ∕ sulf ratio derived from the AMS measurements. In our experiments, the org ∕ sulf ratio was affected by the size-dependent wall-loss process. Both the AMS-measured org ∕ sulf ratio and the SMPS-measured OA remained relatively constant after correcting for the size dependence of the particle–wall process in these experiments. We thus conclude that minimum photolysis was observed for our experiments.
With an OH exposure equivalent to 2–4 days of typical atmospheric oxidation conditions, the OH aging of the α-pinene ozonolysis products formed 20–40 % additional SOA mass for the experimental conditions used in this work. Elevated RH up to 50 % has a minimum effect on SOA production due to aging. We have constrained the aging effects on additional SOA formation quantitatively using both SMPS and AMS measurements.
A more oxygenated product distribution was observed after aging. A stepwise increase of 0.02–0.04 in O : C was observed within half an hour after the first introduction of OH. After the second-generation products were exposed to additional OH, the O : C grew continuously until the end of the experiments with an absolute increase of up to 0.04. During this period, minimum SOA production was observed. We attribute this phenomenon to condensed-phase reactions. Further investigation on a molecular scale is needed.
This work explored the additional SOA formation potential of the α-pinene ozonolysis products under high-NOx conditions. The aging timescale of this study of a few days corresponds to the atmospheric lifetime of the corresponding aerosol. The additional formation of SOA observed here is clearly non-negligible but is also much less than the doubling or tripling of the SOA that has been assumed in a few modeling studies (Lane et al., 2008), which resulted in overprediction of the biogenic SOA. The present results can be used for the improvements of the currently used parameterizations for the aging of α-pinene SOA products in CTMs.
The data from this work are available upon request to Spyros N. Pandis (spyros@chemeng.upatras.gr).
The supplement related to this article is available online at: https://doi.org/10.5194/acp-18-3589-2018-supplement.
The authors declare that they have no conflict of interest.
The work was funded by the EPA STAR grant 835405 and the EUROCHAMP-2020 EU
project.
Edited by: James B. Burkholder
Reviewed by: two anonymous referees
Barmet, P., Dommen, J., DeCarlo, P. F., Tritscher, T., Praplan, A. P., Platt, S. M., Prévôt, A. S. H., Donahue, N. M., and Baltensperger, U.: OH clock determination by proton transfer reaction mass spectrometry at an environmental chamber, Atmos. Meas. Tech., 5, 647–656, https://doi.org/10.5194/amt-5-647-2012, 2012.
Canagaratna, M. R., Jimenez, J. L., Kroll, J. H., Chen, Q., Kessler, S. H., Massoli, P., Hildebrandt Ruiz, L., Fortner, E., Williams, L. R., Wilson, K. R., Surratt, J. D., Donahue, N. M., Jayne, J. T., and Worsnop, D. R.: Elemental ratio measurements of organic compounds using aerosol mass spectrometry: characterization, improved calibration, and implications, Atmos. Chem. Phys., 15, 253–272, https://doi.org/10.5194/acp-15-253-2015, 2015.
Chacon-Madrid, H. J., Henry, K. M., and Donahue, N. M.: Photo-oxidation of pinonaldehyde at low NOx: from chemistry to organic aerosol formation, Atmos. Chem. Phys., 13, 3227–3236, https://doi.org/10.5194/acp-13-3227-2013, 2013.
Crump, J. G. and Seinfeld, J. H.: Turbulent deposition and gravitational sedimentation of an aerosol in a vessel of arbitrary shape, J. Aerosol Sci., 2, 405–415, 1981.
Davidson, C. I., Phalen, R. F., and Solomon, P. A.: Airborne particulate matter and human health: a review, Aerosol Sci. Technol, 39, 737–749, 2005.
Davis, M. E., Talukdar, R. K., Notte, G., Ellison, G. B., Burkholder, J. B.: Rate coefficients for the OH+Pinonaldehyde (C10H16O2) reaction between 297 and 374 K, Environ. Sci. Technol., 41, 3959–3965, 2007.
Donahue, N. M., Robinson, A. L., Stanier, C. O., and Pandis, S. N.: Coupled partitioning, dilution and chemical aging of semivolatile organics, Environ. Sci. Technol., 40, 2635–2643, 2006.
Donahue, N. M., Henry, K. M., Mentel, T. F., Kiendler-Scharr, A., Spindler, C., Bohn, B., Brauers, T., Dorn, H. P., Fuchs, H., Tillmann, R., Wahner, A., Saathoff, H., Naumann, K.-H., Mohler, O., Leisner, T., Muller, L., Reinnig, M.-C., Hoffmann, T., Salo, K., Hallquist, M., Frosch, M., Bilde, M., Tritscher, T., Barmet, P., Praplan, A. P., DeCarlo, P. F., Dommen, J., Prevot, A. S. H., and Baltensperger, U.: Aging of biogenic secondary organic aerosol via gas-phase OH radical reactions, P. Natl. Acad. Sci. USA, 109, 13503–13508, 2012.
George, I. J., Slowik J., and Abbatt J. P. D.: Chemical aging of ambient organic aerosol from heterogeneous reaction with hydroxyl radicals, Geophys. Res. Lett., 35, L13811, https://doi.org/10.1029/2008GL033884, 2008.
Griffin, R. J., Cocker, D. R., Seinfeld, J. H., and Dabdub, D.: Estimate of global atmospheric organic aerosol from oxidation of biogenic hydrocarbons, Geophys. Res. Lett., 26, 2721–2724, 1999.
Grosjean. D. and Seinfeld, J. H.: Parameterization of the formation potential of secondary organic aerosols, Atmos. Environ., 23, 1733–1747, 1989.
Henry, K. M. and Donahue, N. M.: Photochemical aging of α-pinene secondary organic aerosol: effects of OH radical sources and photolysis, J. Phys. Chem. A, 116, 5932–5940, 2012.
Henry, K. M., Lohaus T., and Donahue, N. M.: Organic aerosol yields from α-pinene oxidation: bridging the gap between first-generation yields and aging chemistry, Environ. Sci. Technol., 46, 12347–12354, 2012.
Intergovernmental Panel on Climate Change: Climate Change 2007: Synthesis Report. Contribution of Working Groups I, II and III to the Fourth Assessment Report of the Intergovernmental Panel on Climate Change, edited by: Pachauri, R. K. and Reisinger, A., 104 pp., Cambridge Univ. Press, New York, USA, 2007.
Izumi, K. and Fukyama, T.: Photochemical aerosol formation from aromatic hydrocarbons in the presence of NOx, Atmos. Environ., 24A, 1433–1441, 1990.
Julin, J., Winkler, P. M., Donahue, N. M., Wagner, P. E., and Riipinen, I.: Near-unity mass accommodation coefficient of organic molecules of varying structure, Environ. Sci. Technol., 48, 12083–12089, 2014.
Kalberer, M., Sax, M., and Samburova, V.: Molecular size evolution of oligomers in organic aerosols collected in urban atmospheres and generated in a smog chamber, Environ. Sci. Technol., 40, 5917–5922, 2006.
Keywood, M. D., Varutbangkul, V., Bahreini, R., Flagan, R. C., and Seinfeld, J. H.: Secondary organic aerosol formation from the ozonolysis of cycloalkenes and related compounds, Environ. Sci. Technol., 38, 4157–4164, 2004.
Kostenidou E., Pathak R. K., and Pandis S. N.: An algorithm for the calculation of secondary organic aerosol density combining AMS and SMPS data, Aerosol Sci. Technol., 41, 1002–1010, 2007.
Krechmer, J. E., Pagonis, D., Ziemann, P. J., and Jimenez, J. L.: Quantification of gas-wall partitioning in Teflon environmental chambers using rapid bursts of low-volatility oxidized species generated in situ, Environ. Sci. Technol., 50, 5757–5765, 2016.
Kuwata, M., Zorn S. R., and Martin S. T.: Using elemental ratios to predict the density of organic material composed of carbon, hydrogen, and oxygen, Environ. Sci. Technol., 46, 787–794, 2012.
Lambe, A. T., Miracolo, M. A., Hennigan, C. J., Robinson, A. L., and Donahue, N. M.: Effective rate constants and uptake coefficients for the reactions of organic molecular markers (n-alkanes, hopanes and steranes) in motor oil and diesel primary organic aerosols with hydroxyl radicals, Environ. Sci. Technol., 43, 8794–8800, 2009.
Lane, T., Donahue, N. M., and Pandis, S. N.: Simulating secondary organic aerosol formation using the volatility basis-set approach in a chemical transport model, Atmos. Environ., 42, 7439–7451, 2008.
Loza, C. L., Chhabra, P. S., Yee, L. D., Craven, J. S., Flagan, R. C., and Seinfeld, J. H.: Chemical aging of m-xylene secondary organic aerosol: laboratory chamber study, Atmos. Chem. Phys., 12, 151–167, https://doi.org/10.5194/acp-12-151-2012, 2012.
Matsunaga, A. and Ziemann, P. J.: Gas-wall partitioning of organic compounds in a Teflon film chamber and potential effects on reaction product and aerosol yield measurements, Aerosol Sci. Technol., 44, 881–892, 2010.
McMurry, P. H. and Rader, D. J.: Aerosol wall losses in electrically charged chambers, Aerosol Sci. Tech., 4, 249–268, 1985.
Müller, L., Reinnig, M.-C., Naumann, K. H., Saathoff, H., Mentel, T. F., Donahue, N. M., and Hoffmann, T.: Formation of 3-methyl-1,2,3-butanetricarboxylic acid via gas phase oxidation of pinonic acid – a mass spectrometric study of SOA aging, Atmos. Chem. Phys., 12, 1483–1496, https://doi.org/10.5194/acp-12-1483-2012, 2012.
Nah, T., McVay, R. C., Zhang, X., Boyd, C. M., Seinfeld, J. H., and Ng, N. L.: Influence of seed aerosol surface area and oxidation rate on vapor wall deposition and SOA mass yields: a case study with α-pinene ozonolysis, Atmos. Chem. Phys., 16, 9361–9379, https://doi.org/10.5194/acp-16-9361-2016, 2016.
Ng, N. L., Kroll, J. H., Chan, A. W. H., Chhabra, P. S., Flagan, R. C., and Seinfeld, J. H.: Secondary organic aerosol formation from m-xylene, toluene, and benzene, Atmos. Chem. Phys., 7, 3909–3922, https://doi.org/10.5194/acp-7-3909-2007, 2007.
Odum J. R., Hoffmann, T., Bowman, F., Collins, T., Flagan, R. C., and Seinfeld, J. H.: Gas-particle partitioning and secondary organic aerosol yields, Environ. Sci. Technol., 30, 2580–2585, 1996.
Palm, B. B., Campuzano-Jost, P., Ortega, A. M., Day, D. A., Kaser, L., Jud, W., Karl, T., Hansel, A., Hunter, J. F., Cross, E. S., Kroll, J. H., Peng, Z., Brune, W. H., and Jimenez, J. L.: In situ secondary organic aerosol formation from ambient pine forest air using an oxidation flow reactor, Atmos. Chem. Phys., 16, 2943–2970, https://doi.org/10.5194/acp-16-2943-2016, 2016.
Paulson, S. E., Chung, M., Sen, A. D., and Orzechowska, G.: Measurement of OH radical formation from the reaction of ozone with several biogenic alkenes, J. Geophys. Res., 103, 25533–25539, 1998.
Pope, C. A., Ezzati, M., and Dockery, D. W.: Fine-particulate air pollution and life expectancy in the United States, New Engl. J. Med., 360, 376–386, 2009.
Qi, L., Nakao, S., and Cocker, D. R.: Aging of secondary organic aerosol from α-pinene ozonolysis: Roles of hydroxyl and nitrate radicals, J. Air Waste Manage., 62, 1359–1369, 2012.
Robinson, A. L., Donahue, N. M., Shrivastava, M. K., Weitkamp, E. A., Sage, A. M., Grieshop, A. P., Lane, T. E., Pierce, J. R., and Pandis, S. N.: Rethinking organic aerosol: semivolatile emissions and photochemical aging, Science, 315, 1259–1262, 2007.
Salo, K., Hallquist, M., Jonsson, Å. M., Saathoff, H., Naumann, K.-H., Spindler, C., Tillmann, R., Fuchs, H., Bohn, B., Rubach, F., Mentel, Th. F., Müller, L., Reinnig, M., Hoffmann, T., and Donahue, N. M.: Volatility of secondary organic aerosol during OH radical induced ageing, Atmos. Chem. Phys., 11, 11055–11067, https://doi.org/10.5194/acp-11-11055-2011, 2011.
Tritscher, T., Dommen, J., DeCarlo, P. F., Gysel, M., Barmet, P. B., Praplan, A. P., Weingartner, E., Prévôt, A. S. H., Riipinen, I., Donahue, N. M., and Baltensperger, U.: Volatility and hygroscopicity of aging secondary organic aerosol in a smog chamber, Atmos. Chem. Phys., 11, 11477–11496, https://doi.org/10.5194/acp-11-11477-2011, 2011.
Trump, E. R., Riipinen, I., and Donahue, N. M.; Interactions between atmospheric ultrafine particles and secondary organic aerosol mass: a model study, Boreal Environ. Res., 19, 352–362, 2014
Tsimpidi, A. P., Karydis, V. A., Zavala, M., Lei, W., Bei, N., Molina, L., and Pandis, S. N.: Sources and production of organic aerosol in Mexico City: insights from the combination of a chemical transport model (PMCAMx-2008) and measurements during MILAGRO, Atmos. Chem. Phys., 11, 5153–5168, https://doi.org/10.5194/acp-11-5153-2011, 2011.
Wang, N., Jorga, S. D., Pierce, J. R., Donahue, N. M., and Pandis, S. N.: Particle wall-loss correction methods in smog chamber experiments, Aerosol Sci. Tech., in preparation, 2018.
Ye, P., Ding, X., Hakala, J., Hofbauer, V., Robinson, E. S., and Donahue, N. M.: Vapor wall loss of semi-volatile organic compounds in a Teflon chamber, Aerosol Sci. Tech., 50, 822–834, 2016a.
Ye, P., Ding, X., Ye, Q., and Robinson, E. S.: Uptake of semivolatile secondary organic aerosol formed from α-pinene into nonvolatile polyethylene glycol probe particles, J. Phys. Chem. A, 120, 1459–1467, 2016b.
Zhang, Q., Jimenez, J. L., Canagaratna, M. R., Allan, J. D., Coe, H., Ulbrich, I., Alfarra, M. R., Takami, A., Middlebrook, A. M., Sun, Y. L., Dzepina, K., Dunlea, E., Docherty, K., De- Carlo, P. F., Salcedo, D., Onasch, T., Jayne, J. T., Miyoshi, T., Shimono, A., Hatakeyama, S., Takegawa, N., Kondo, Y., Schneider, J., Drewnick, F., Borrmann, S., Weimer, S., Demerjian, K., Williams, P., Bower, K., Bahreini, R., Cottrell, L., Griffin, R. J., Rautiainen, J., Sun, J. Y., Zhang, Y. M., and Worsnop, D. R.: Ubiquity and dominance of oxygenated species in organic aerosols in anthropogenically-influenced Northern Hemisphere midlatitudes, Geophys. Res. Lett., 34, L13801, https://doi.org/10.1029/2007GL029979, 2007.
Zhang, X., Cappa, D. C., Jathar, S. H., McVay, R. C., Ensberg, J. J., Kleeman, M. J., and Seinfeld, J. H.: Influence of vapor wall loss in laboratory chambers on yields of secondary organic aerosol, P. Natl. Acad. Sci. USA, 111, 5802–5807, 2014.


