the Creative Commons Attribution 4.0 License.
the Creative Commons Attribution 4.0 License.
 | 08 Mar 2018
Influence of geomagnetic activity on mesopause temperature over Yakutia
Galina Gavrilyeva
Petr Ammosov
The long-term temperature changes of the mesopause region at the hydroxyl molecule OH (6-2) nighttime height and its connection with the geomagnetic activity during the 23rd and beginning of the 24th solar cycles are presented. Measurements were conducted with an infrared digital spectrograph at the Maimaga station (63∘ N, 129.5∘ E). The hydroxyl rotational temperature (TOH) is assumed to be equal to the neutral atmosphere temperature at the altitude of ∼ 87 km. The average temperatures obtained for the period 1999 to 2015 are considered. The season of observations starts at the beginning of August and lasts until the middle of May. The maximum of the seasonally averaged temperatures is delayed by 2 years relative to the maximum of the solar radio emission flux (wavelength of 10.7 cm), and correlates with a change in geomagnetic activity (Ap index). Temperature grouping in accordance with the geomagnetic activity level showed that in years with high activity (Ap > 8), the mesopause temperature from October to February is about 10 K higher than in years with low activity (Ap < = 8). Cross-correlation analysis showed no temporal shift between geomagnetic activity and temperature. The correlation coefficient is equal to 0.51 at the 95 % level.
- Article
(3313 KB) - Full-text XML
- BibTeX
- EndNote


Long-term changes in the state of the mesopause, such as the linear trend and the fluctuations associated with the 11-year cycle in solar activity, are investigated by different methods. In their review, Beig et al. (2008) list numerous studies showing that the response of the mesosphere–low thermosphere temperature to the change in solar activity reaches 4–5 K ∕ 100 SFU, where SFU is the solar radio flux at a wavelength of 10.7 cm in 10−22 W M−2 Hz−1 (F10.7). Tang et al. (2016) estimated the change in the temperature of the mesopause from 2002 to 2015 using the measurements of the SABER radiometer on board the TIMED satellite. They showed that the average global response is about 5 K/100 SFU, in agreement with the results given in the review of Beig et al. (2008). The response of the temperature to the change in F10.7 flux at high latitudes is greater than at midlatitudes and reaches up to 7–10 K/100 SFU.
Previously, according to data obtained from 1997 to 2000 at the Maimaga station, we found that the temperature response was equal to 11 K/100 SFU (Gavrilyeva and Ammosov, 2002). That study only used a very short period of observations which coincided with the maximum of solar activity. Further, Ammosov et al. (2014) presented the results of data analysis obtained in a time interval comparable to the solar cycle duration from 1999 to 2013. Analysis showed that the temperature change follows the solar activity change with 25 months' delay. If the temperature response is shifted forward by 25 months, then it reaches 7 K/100 SFU.
It is known that the geomagnetic activity maximum lags behind the solar radiation maximum, including the F10.7 index. In this study as a measure of geomagnetic activity, the widely available Ap index was used. The changes of the F10.7 radio flux and the Ap index of magnetic disturbance over the last four cycles of solar activity are shown in Fig. 1. Both indices were acquired from the National Geophysical Data Center, NGDC (ftp://ftp.ngdc.noaa.gov/STP). As can be seen from Fig. 1, the Ap index changes follow the F10.7 changes with a lag of 2–3 years. As this is similar in scale to the observed delay of 25 months, it was logical to assume that the long-term temperature fluctuation of the subauroral mesopause correlates with the change in geomagnetic activity.
Geomagnetic activity can change the composition, dynamics and thermal state of the high-latitude atmosphere through energetic particle precipitation (EPP). In the last decade, many papers have been published on the atmosphere response to the proton and electron fluxes with various energies, discussing the influence of geomagnetic activity on atmospheric temperature in two different ways. One process is the direct effect on the temperature and dynamics. The geomagnetic storm is followed in the atmosphere by ionization, excitation, Joule heating and dissociation processes (Lastovicka, 1996; Burns et al., 2014; Xu et al., 2013). There is some evidence of the upper atmosphere temperature change during EPP. Xu et al. (2013) investigated the longitudinal temperature structure in the lower thermosphere using the SABER/TIMED and MIPAS/Envisat (Michelson Interferometer for Passive Atmospheric Sounding) data obtained from 2008 to 2009. The study of these satellite measurements revealed that the maximum of the diurnally averaged temperature in the lower thermosphere is near the longitude of the magnetic pole in both the Northern Hemisphere and the Southern Hemisphere. The authors suggested that this structure of the diurnally averaged temperature in the lower thermosphere is most likely related to auroral heating, which occurs in the auroral region near the magnetic poles. A significant decrease in the occurrence rate of noctilucent clouds in the southern polar mesopause region was observed immediately after the onset of the enhanced solar particle precipitation in SCIAMACHY (an imaging spectrometer installed on satellite Envisat) data on 16 January 2005 by von Savigny et al. (2007). Simultaneously, the Microwave Limb Sounder (MLS) instrument on board NASA's satellite AURA recorded an atmospheric temperature increase at an altitude of 85 km. Hocke (2017) studied the temperature measurement with the MLS on AURA during the proton event on 7–10 November 2004. He found that the temperature of the polar mesosphere increased by 5–10 K, while the polar stratosphere temperature decreased. Analyses of SABER/TIMED temperature data conducted by Chang et al. (2009) and Jiang et al. (2014) showed that periodic oscillations of the temperature of the lower thermosphere had good correlation with oscillations in geomagnetic activity.
As well as the direct effect of EPP, there is also an indirect effect on the atmosphere from particle penetration. The energy of precipitating particles is deposited mainly in the thermosphere and upper mesosphere. Studies showed that particle precipitation, through a cascade of dissociation, ionization and recombination processes, creates odd nitrogen (NOx) and odd hydrogen (HOx) in the high-latitude thermosphere and mesosphere. HOx is relatively short-lived (of the order of days), leading mostly to local effects, while NOx can be transported by polar downwelling into the winter polar stratosphere, where it can lead to both short- and long-term (order of months) catalytic ozone destruction. These effects may further couple with atmospheric dynamics and propagate downwards through changing polar winds and atmospheric wave propagation through wave–mean flow interaction (Krivolutsky et al., 2006; Baumgaertner et al., 2009, 2011; Semenuk et al., 2011; Arsenovic et al., 2016; Randall et al., 2007).
It is known that the rotational temperature of hydroxyl corresponds to the temperature of the neutral atmosphere at the mean emission height (∼ 87 km). Consequently, the effect of geomagnetic activity on the temperature of the atmosphere can be investigated from the change in the rotational temperature of hydroxyl. The purpose of this paper is to find geomagnetic signatures in nighttime measurements of OH rotational temperature obtained for the period August 1999 to May 2015.
The mesopause region (80–100 km) is the atmosphere region where the mesosphere borders the thermosphere. The radiating layer of excited hydroxyl (OH) is located in the mesopause region.
The excited hydroxyl molecule experiences 2 × 10⁴ s−1 collisions before radiation, which is sufficient for thermalization with the surrounding medium. Therefore, the OH rotational temperature calculated from the night sky spectra indicates the neutral atmosphere temperature (see, e.g., Khomich et al., 2008).
The OH(6-2) rotational temperature data (TOH) for the this paper were obtained with the infrared spectrograph described by Ammosov and Gavrilyeva (2000). The spectrograph was installed at the optical station of Maimaga (geographic coordinates are 63∘ N, 129.5∘ E, geomagnetic coordinates are 58∘ N, 202∘ E) located about 120 km north of Yakutsk, Russia. Observations were carried out in cloudless and moonless nights, with the sun at least 9∘ below the horizon. The atomic oxygen line, which arises at high auroral activity, is superimposed on the OH(6-2) spectrum. To avoid systematic errors in evaluating the temperature because of this, the data obtained in the absence of aurora were selected for the analysis. The location of the observation station makes it possible to perform measurements only from the beginning of August to the middle of May since the summer mesopause is constantly sunlit at the Maimaga latitude.
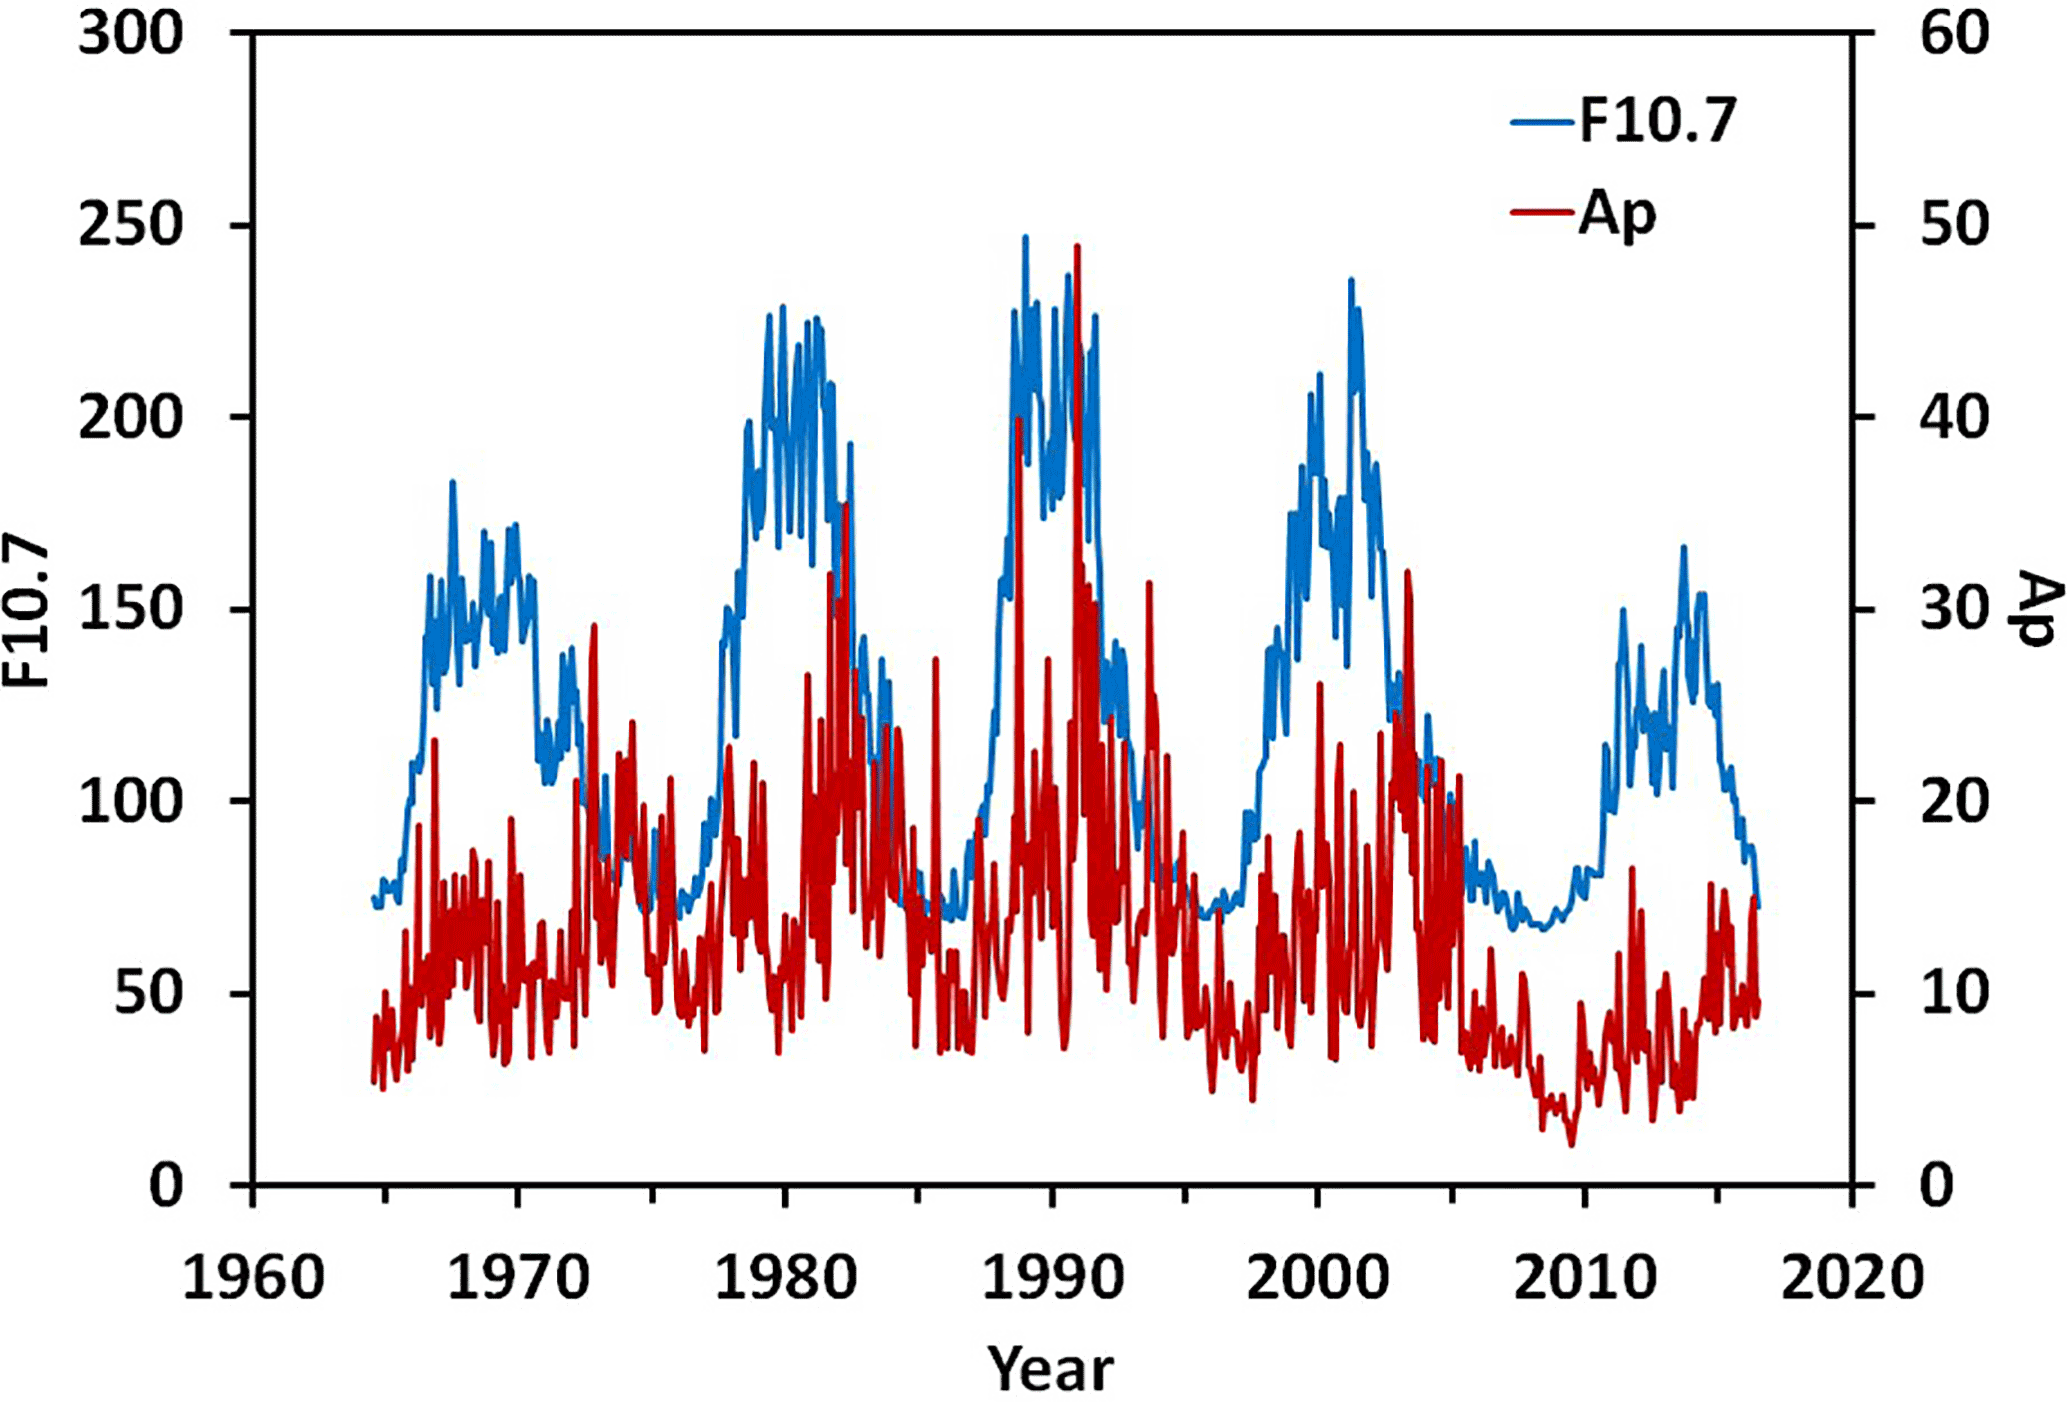
Figure 1Monthly mean F10.7 and Ap for 1965–2016. Both indices were acquired from the National Geophysical Data Center, NGDC (ftp://ftp.ngdc.noaa.gov/STP).
The method for estimating the rotational temperature of molecular emissions is based on the least-squares fit of model spectra constructed with regard to the instrument function for different previously specified temperatures to an actual measured spectrum (Ammosov and Gavrilyeva, 2000). The temperature corresponding to this model spectrum, which deviates least from the real spectrum by not more than the registration noise, is considered to be a best fit of the real hydroxyl rotational temperature. The random errors in measuring the temperature are typically 2–10 K, depending on the signal-to-noise ratio. Since different published transition probabilities lead to temperature differences of up to 12 K (Turnbull and Lowe, 1989; Greet et al., 1997) all the data are analyzed using the same Einstein coefficients by Mies (1974) for consistency.
The rotational temperature data set comprises 2864 nightly average temperatures obtained from August 1999 to May 2015. The measurements of the nightglow spectrum are conducted from the beginning of August to the beginning of May. The longest nighttime data series are registered in the winter. The number of measurements per month varies from 10 to 25 nights. The TOH and F10.7 index average values for the measurement season (from August to May) for 1999–2015 are plotted in Fig. 2a. The same TOH and Ap, averaged over the same years, are shown in Fig. 2a. The average values of the F10.7 index and Ap index were calculated in the days that coincided with the TOH measurements at the Maimaga station. As can be seen from Fig. 2, the TOH interannual variation is delayed relative to the F10.7 change and is more consistent with the Ap index variation. The correlation coefficient of TOH and the Ap index is 0.51. The significance of the correlation coefficient was tested with 14 degrees of freedom T test. The critical value of correlation coefficient is 0.46 at the 0.05 level of significance. TOH is not significantly correlated with F10.7 because the correlation coefficient 0.36 is less than the critical value. The correlation coefficient increases to 0.65 when F10.7 precedes the temperature by 2 years.
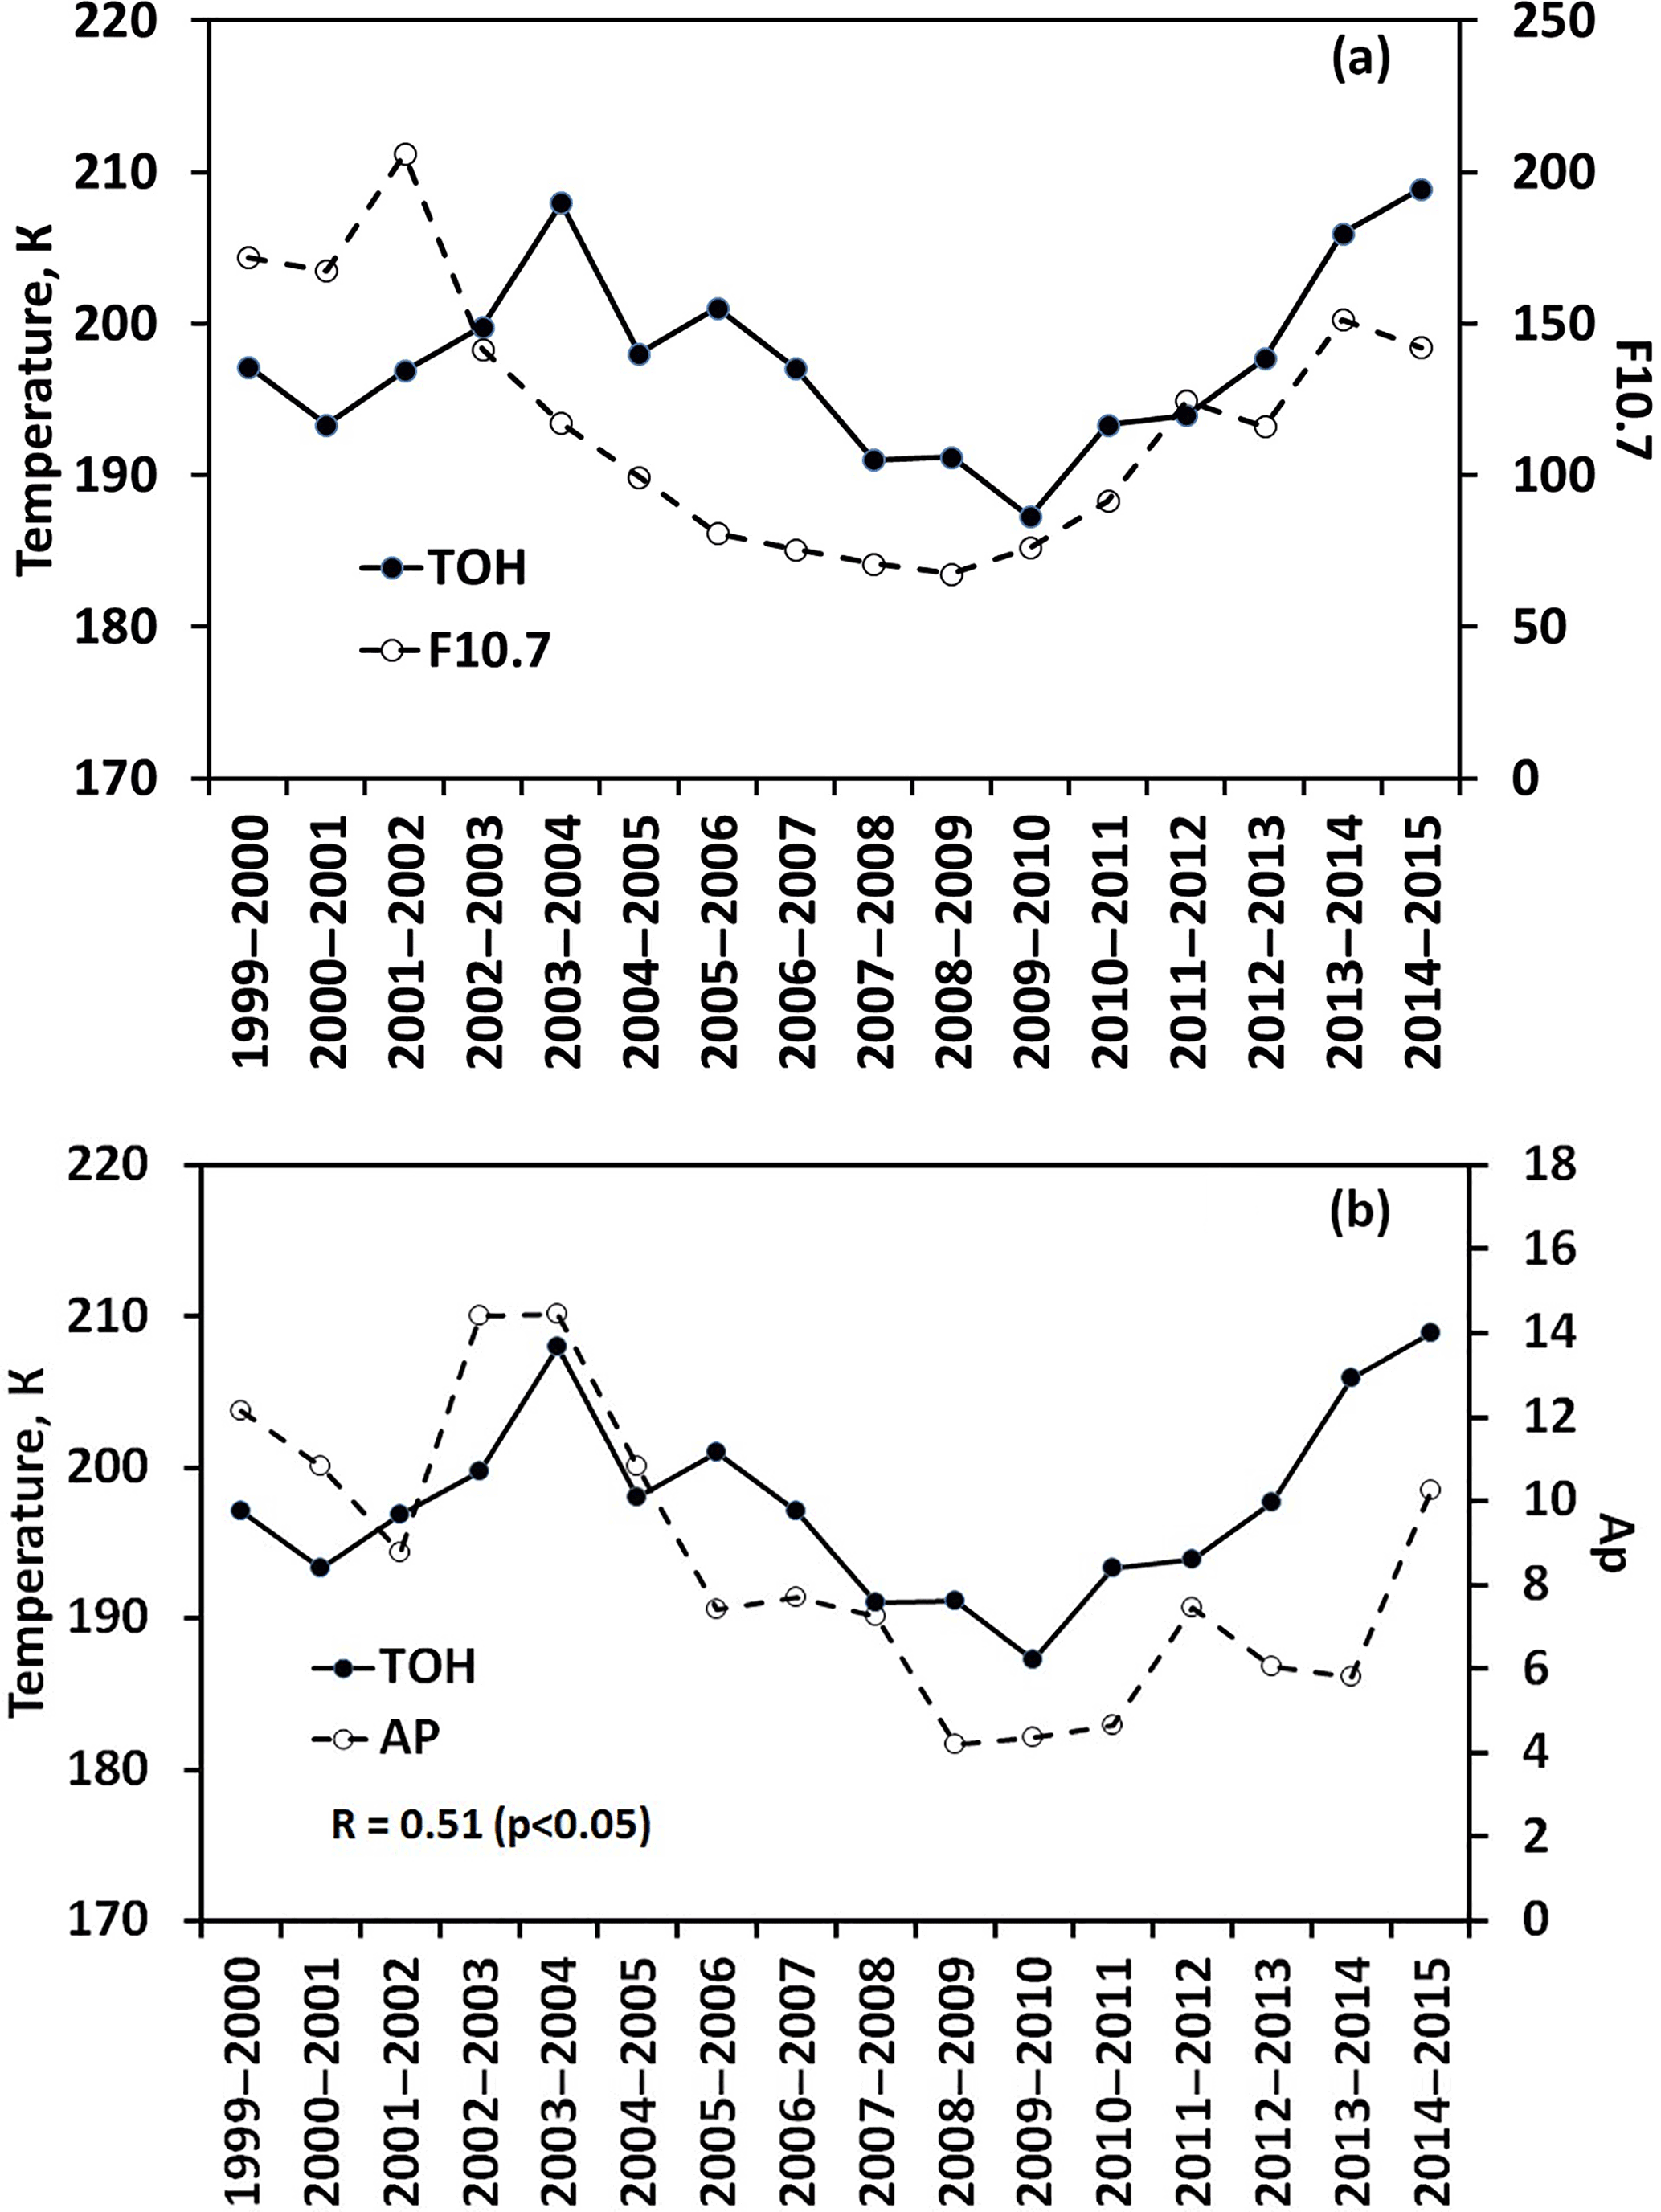
Figure 2(a) Seasonally averaged TOH and F10.7 index (from August to May) for 1999–2015. (b) The TOH and Ap index mean values for 1999–2015. The average values of the F10.7 index and Ap index were calculated in the days that coincided with the TOH measurements at the Maimaga station.
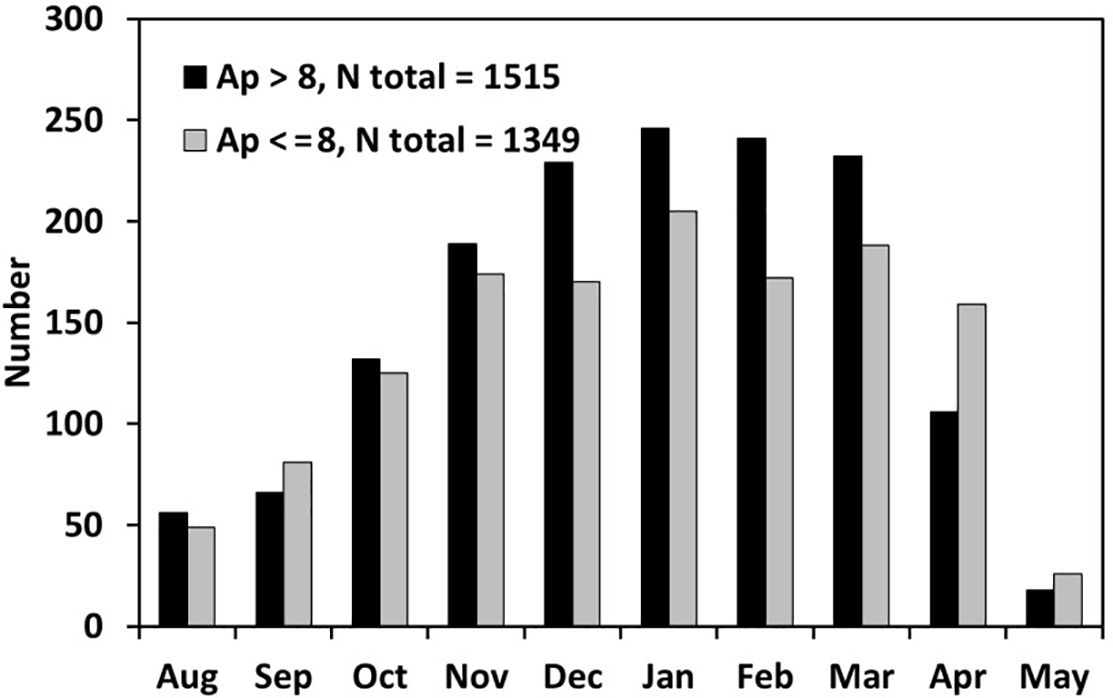
Figure 3The number of measurements per month during the geomagnetic activity years (Ap > 8) and quiet years (Ap < = 8).
The nighttime temperature means were divided into two groups for further analysis. The average AP in the observation interval of about 8 was chosen as the transition value. The first group includes the measurements which were conducted in the season with high geomagnetic activity when the average Ap index > 8. The second group consists of nighttime TOH measured during the season with an Ap index < = 8. The number of observations per month in two groups is shown in Fig. 3. The seasonal distribution of measurements is approximately similar. A monthly mean TOH in geomagnetically active years (Ap > 8) and in geomagnetic quiet years (Ap < = 8) are plotted in Fig. 4. The results show higher monthly mean OH temperature with high Ap (> 8) than with low Ap (<=8) from October through January. The difference is about 10 K (i.e., 10.5 K ± 1.4 K, or 9.6 K ± 1.4 K if February is included). There is no dependence of the TOH on the level of geomagnetic activity in autumn and spring. However, it should be noted that in this period the number of observations is not large.
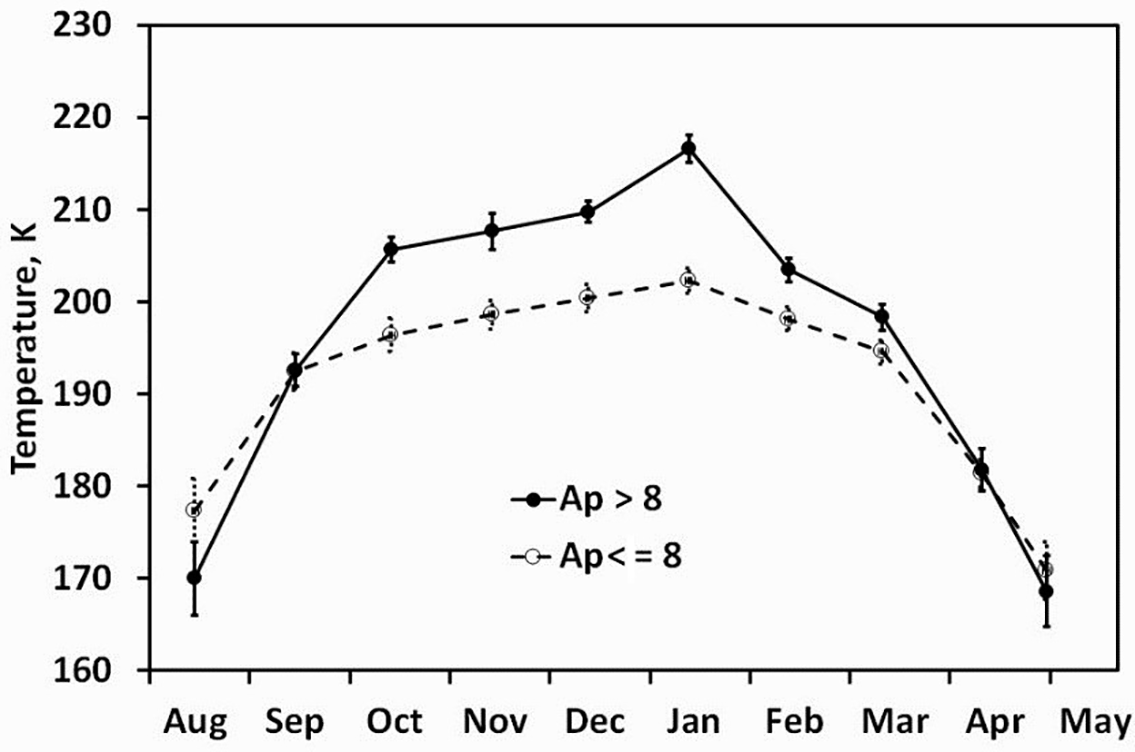
Figure 4Monthly mean TOH in geomagnetic active years (Ap > 8) and in geomagnetic quiet years (Ap ≤ 8). Vertical bars correspond to the standard deviations.
There are several publications (Lu et al., 2008; Seppälä et al., 2009, 2013), in which the authors investigated the geomagnetic activity effect in the atmosphere based on the meteorological measurements from the ERA-40 and ERA-Interim data set. The authors studied the atmosphere climatology from 1000 to 1 hPa separately in the years with high and low geomagnetic activity. They found that high geomagnetic activity can drive a strengthening of the Northern Hemisphere polar vortex, with warming in the polar upper stratosphere and cooling below. Meteorological data analysis shows that the upper stratosphere warming starts in the beginning of December and lasts until March (Seppälä et al., 2013). The heating descends downwards during winter. A similar downwards descending signal (in the same model) has already been demonstrated by Baumgaertner et al. (2011) using geopotential height anomalies.
The temperature difference in the geomagnetic active years in comparison with the geomagnetic quiet years was observed from October to February in our measurements. The heating signal appears in the mesopause region about 1–2 month earlier and has approximately the same duration as in the upper stratosphere. However, one cannot be sure that the observed temperature difference is the result of an indirect impact. The temperature signal can be related to auroral heating or in situ ozone depletion which caused short-time HOx enhancement. Unfortunately, we cannot investigate the direct effect of precipitating particles, since a line of atomic oxygen is superimposed on the hydroxyl spectrum on geomagnetic active days. Such spectra are excluded from the analysis.
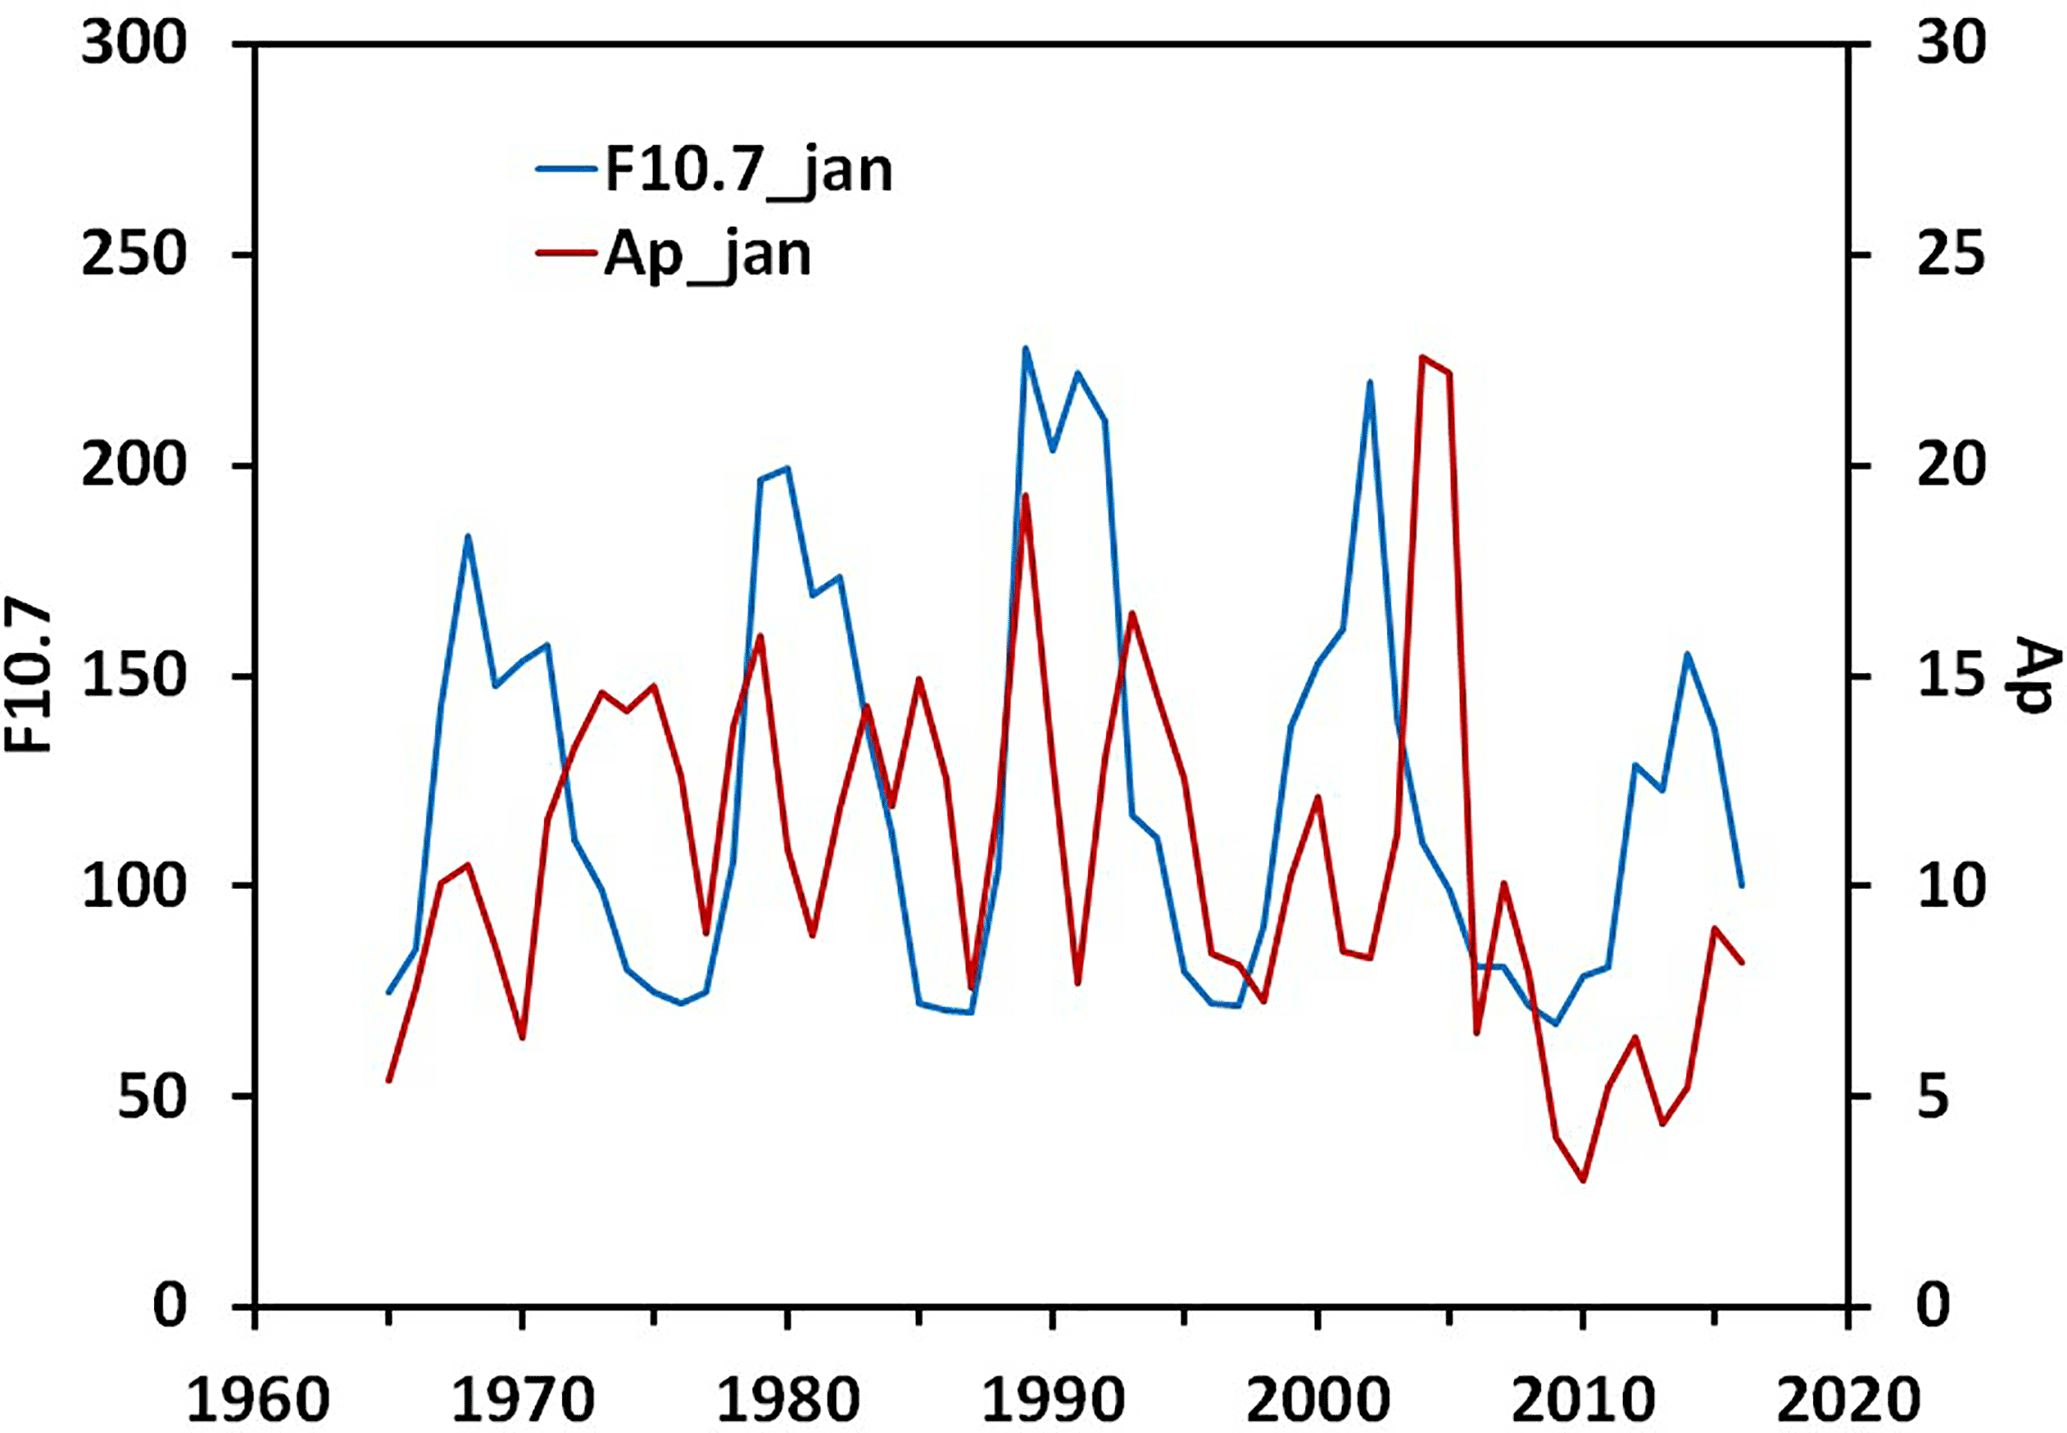
The EPP changes temperature and dynamics in the winter polar atmosphere as shown in the above studies. Also, most of the measurements of the mesopause region temperature at our latitude are carried out in the winter. Figure 5 shows the F10.7 and Ap index average variation in January from 1975 to 2016. The regular measurements of the mesopause region temperature began approximately in these years. Unlike the previous solar cycles, it is clearly seen that the F10.7 maximum precedes the Ap index maximum by about 2–3 years in the 23rd solar cycle. It should be noted that in our research the influence of the solar irradiance and the long-term linear trend on the mesopause temperature is not studied. The data of several solar cycles are necessary to separate the influence of these components correctly.
The data set of the hydroxyl emission airglow comprising 2864 nightly average temperature values obtained from August 1999 to May 2015 at the subauroral Maimaga station are considered. The measurements of rotational temperature of OH(6-2) were studied in search of a geomagnetic activity effect. Correlation between the seasonally averaged TOH and the geomagnetic activity Ap index is statistically significant and is equal to 0.51.
The winter polar mesopause is approximately 10 K warmer in the years with high geomagnetic activity (Ap > 8) than in the years with low geomagnetic activity (Ap < = 8). Warming of the mesopause starts in October and lasts until February, which is about 1–2 months earlier than the warming in the stratosphere.
Data are available from the authors upon request.
The authors declare that they have no conflict of interest.
Russian Foundation for Basic Research supported the reported study according
to the research projects no. 17-05-00855 A and 15-05-05320 A. Edited
by: Franz-Josef Lübken
Reviewed by: two anonymous referees
Ammosov, P. P. and Gavrilyeva, G. A.: Infrared digital spectrograph for hydroxyl rotational temperature measurements, Instrum. Exp. Tech., 43, 792–797, 2000.
Ammosov, P., Gavrilyeva, G., Ammosova, A., and Koltovskoi, I.: Response of the mesopause temperatures to solar activity over Yakutia in 1999–2013, Adv. Space Res., 54, 2518–2524, https://doi.org/10.1016/j.asr.2014.06.007, 2014.
Arsenovic, P., Rozanov, E., Stenke, A., Funke, B., Wissing, J. M., Mursula, K., Tummon, F., and Peter, T.: The influence of Middle Range Energy Electrons on atmospheric chemistry and regional climate, J. Atmos. Sol.-Terr. Phy., 149, 180–190, https://doi.org/10.1016/j.jastp.2016.04.008, 2016.
Baumgaertner, A. J. G., Jöckel, P., and Brühl, C.: Energetic particle precipitation in ECHAM5/MESSy1 – Part 1: Downward transport of upper atmospheric NOx produced by low energy electrons, Atmos. Chem. Phys., 9, 2729–2740, https://doi.org/10.5194/acp-9-2729-2009, 2009.
Baumgaertner, A. J. G., Seppälä, A., Joeckel, P., and Clilverd, M. A.: Geomagnetic activity related NOx enhancements and polar surface air temperature variability in a chemistry climate model: Modulation of the NAM index, Atmos. Chem. Phys., 11, 4521–4531, https://doi.org/10.5194/acp-11-4521-2011, 2011.
Beig, G., Scheer, J., Mlynczak, M. G., and Keckhut, P.: Overview of the temperature response in the mesosphere and lower thermosphere to solar activity, Rev. Geophys., 46, RG3002, https://doi.org/10.1029/2007RG000236, 2008.
Burns, A. G., Wang, W., Solomon, S. C., and Qian, L.: Energetics and Composition in the Thermosphere, in Modeling the IonosphereThermosphere System, AGU Geophys. Monogr. Ser., edited by J. Huba, R. Schunk, and G. Khazanov, John Wiley, Chichester, UK, 39–48, https://doi.org/10.1002/9781118704417.ch4, 2014.
Chang, L. C., Thayer, J. P., Lei J., and Palo, S. E.: Isolation of the global MLT thermal response to recurrent geomagnetic activity, Geophys. Res. Lett., 36, L15813, https://doi.org/10.1029/2009GL039305, 2009.
Gavrilyeva, G. A. and Ammosov, P. P.: Near-mesopause temperatures registered over Yakutia, J. Atmos. Sol.-Terr. Phy., 64, 985–990, https://doi.org/10.1016/S1364-6826(02)00052-4, 2002.
Greet, P. A., French, W. J., Burns, G. B., Williams, P. F. B., Lowe, R. P., and Finlayson, K.: OH(6-2) spectra and rotational temperature measurements at Davis, Antarctica, Ann. Geophys. 16, 77–89, https://doi.org/10.1007/s00585-997-0077-3, 1997.
Hocke, K.: Response of the middle atmosphere to the geomagnetic storm of November 2004, J. Atmos. Sol.-Terr. Phy., 154, 86–91, https://doi.org/10.1016/j.jastp.2016.12.013, 2017.
Jiang, G., Wang W., Xu J., Yue J., Burns A. G., Lei J., Mlynczak M. G., and Rusell III J. M.: Responses of the lower thermospheric temperature to the 9-day and 13.5-day oscillations of recurrent geomagnetic activity, J. Geophys. Res., 119, 4841–4859, https://doi.org/10.1002/2013JA019406, 2014.
Khomich, V. Yu., Semenov, A. I., and Shefov, N. N.: Airglow as an Indicator of Upper Atmospheric Structure and Dynamics, Springer-Verlag, Berlin, 740 pp., 2008.
Krivolutsky, A. A., Klyuchnikova, A. V., Zakharov, G. R., Vyushkova, T., Yu., and Kuminov, A. A.: Dynamical response of the middle atmosphere to solar proton event of July 2000: Three-dimensional model simulations, Adv. Space Res., 37, 1602–1613, https://doi.org/10.1016/j.asr.2005.05.115, 2006.
Lu, H., Clilverd, M. A., Seppälä, A., and Hood, L. L.: Geomagnetic perturbations on stratospheric circulation in late winter and spring, J. Geophys. Res., 113, D16106, https://doi.org/10.1029/2007JD008915, 2008.
Mies, F. H.: Calculated vibrational transition probabilities of OH (X2Π), J. Mol. Spectrosc., 53, 150–188, 1974.
Randall, C. E., Harvey, V. L., Singleton, C. S., Bailey, S. M., Bernath, P. F., Codrescu, M., Nakajima, H., and Russell III, J. M.: Energetic particle precipitation effects on the Southern Hemisphere stratosphere in 1992–2005, J. Geophys. Res., 112, D08308, https://doi.org/10.1029/2006JD007696, 2007.
Semeniuk, K., Fomichev, V. I., McConnell, J. C., Fu, C., Melo, S. M. L., and Usoskin, I. G.: Middle atmosphere response to the solar cycle in irradiance and ionizing particle precipitation, Atmos. Chem. Phys., 11, 5045–5077, https://doi.org/10.5194/acp-11-5045-2011, 2011.
Seppälä, A., Lu, H., Clilverd, M. A., and Rodger, C. J.: Geomagnetic activity signatures in wintertime stratosphere wind, temperature, and wave response, J. Geophys. Res.-Atmos., 118, 2169–2183, https://doi.org/10.1002/jgrd.50236, 2013.
Seppälä, A., Randall, C. E., Clilverd, M. A., Rozanov, E., and Rodger, C. J.: Geomagnetic activity and polar surface air temperature variability, J. Geophys. Res., 114, A10312, https://doi.org/10.1029/2008JA014029, 2009.
Tang, C., Liu, D., Wei, H., Wang, Y., Dai, C., Wu, P., Zhu, W., and Rao, R.: The response of the temperature of cold-point mesopause to solar activity based on SABER data set, J. Geophys. Res.-Space Phys., 121, 7245–7255, https://doi.org/10.1002/2016JA022538, 2016.
Turnbull, D. N. and Lowe, R. P.: New hydroxyl transition probabilities and their importance in airglow studies, Planet. Space Sci., 37, 723–738, 1989.
von Savigny, C., Sinnhuber, M., Bovensmann, H., Burrows, J. P., Kallenrode, M.-B., and Schwartz M.: On the disappearance of noctilucent clouds during the January 2005 solar proton events, Geophys. Res. Lett., 34, L02805, https://doi.org/10.1029/2006GL028106, 2007.
Xu, J., Smith, A. K., Wang, W., Jiang, G., Yuan, W., Gao, H., Yue, J., Funke, B., López-Puertas, M., and Russell III, J. M.: An observational and theoretical study of the longitudinal variation in neutral temperature induced by aurora heating in the lower thermosphere, J. Geophys. Res., 118, 7410–7425, https://doi.org/10.1002/2013JA019144, 2013.