the Creative Commons Attribution 3.0 License.
the Creative Commons Attribution 3.0 License.
Comparison of global observations and trends of total precipitable water derived from microwave radiometers and COSMIC radio occultation from 2006 to 2013
Shu-Peng Ho
Liang Peng
Carl Mears
Richard A. Anthes
We compare atmospheric total precipitable water (TPW) derived from the SSM/I (Special Sensor Microwave Imager) and SSMIS (Special Sensor Microwave Imager/Sounder) radiometers and WindSat to collocated TPW estimates derived from COSMIC (Constellation System for Meteorology, Ionosphere, and Climate) radio occultation (RO) under clear and cloudy conditions over the oceans from June 2006 to December 2013. Results show that the mean microwave (MW) radiometer – COSMIC TPW differences range from 0.06 to 0.18 mm for clear skies, from 0.79 to 0.96 mm for cloudy skies, from 0.46 to 0.49 mm for cloudy but non-precipitating conditions, and from 1.64 to 1.88 mm for precipitating conditions. Because RO measurements are not significantly affected by clouds and precipitation, the biases mainly result from MW retrieval uncertainties under cloudy and precipitating conditions. All COSMIC and MW radiometers detect a positive TPW trend over these 8 years. The trend using all COSMIC observations collocated with MW pixels for this data set is 1.79 mm decade−1, with a 95 % confidence interval of (0.96, 2.63), which is in close agreement with the trend estimated by the collocated MW observations (1.78 mm decade−1 with a 95 % confidence interval of 0.94, 2.62). The sample of MW and RO pairs used in this study is highly biased toward middle latitudes (40–60∘ N and 40–65∘ S), and thus these trends are not representative of global average trends. However, they are representative of the latitudes of extratropical storm tracks and the trend values are approximately 4 to 6 times the global average trends, which are approximately 0.3 mm decade−1. In addition, the close agreement of these two trends from independent observations, which represent an increase in TPW in our data set of about 6.9 %, are a strong indication of the positive water vapor–temperature feedback on a warming planet in regions where precipitation from extratropical storms is already large.
- Article
(11995 KB) - Full-text XML
- BibTeX
- EndNote


Clouds are important regulators for Earth's radiation and hydrological balances. Water vapor is a primary variable that affects cloud radiative effects and hydrological feedbacks. In addition, the three-dimensional distribution of water vapor is a key factor for cloud formation and distribution (Soden et al., 2002). Held and Soden (2000) and Soden and Held (2006) illustrated that water vapor amounts will increase in response to global warming. Climate models predict that the column-integrated amount of water vapor, or total precipitable water (TPW), will increase by ∼ 7 % per 1 K increase in surface temperature (Wentz and Schabel, 2000; Trenberth et al., 2005; Wentz et al., 2007). Therefore, accurate observations of long-term water vapor under both clear and cloudy skies are important for understanding the role of water vapor in climate as well as cloud formation and distribution, which is still one of the largest uncertainties in understanding climate change mechanisms (IPCC, 2013). Trends in global and regional vertically integrated total atmospheric water vapor, or TPW, are important indicators of climate warming because of the strong positive feedback between temperature and water vapor enhancements. Accurate observations of TPW are therefore important in identifying climate change and in verifying climate models, which estimate a wide range of TPW trends (Roman et al., 2014).
The TPW depends on temperature (Trenberth and Guillemot, 1998; Trenberth et al., 2005). Global TPW can be derived from satellite visible, infrared, and microwave sensors (i.e., Wentz and Spencer, 1998; Fetzer et al., 2006; John and Soden, 2007; Fetzer et al., 2008; Noël et al., 2004). However, no single remote sensing technique is capable of completely fulfilling the needs for climate studies in terms of spatial and temporal coverage and accuracy. For example, while water vapor retrievals from visible and infrared satellite sensors are limited to clear skies over both land areas and oceans, passive microwave (MW) imagers on satellites can provide all sky water vapor products, but only over oceans. These water vapor products are mainly verified by comparing to reanalyses, radiosonde measurements, or other satellite data (i.e., Soden, and Lanzante, 1996; Sohn and Smith, 2003; Noël et al., 2004; Palm et al., 2010; Sohn and Bennartz, 2008; Wick et al., 2008, hereafter Wick2008; Milz et al., 2009; Prasad and Singh, 2009; Pougatchev et al., 2009; Knuteson et al., 2010; Larar et al., 2010; Wang et al., 2010; Ho et al., 2010a, b). Results from these validation studies show that the quality of water vapor data from different satellite sensors varies under different atmospheric conditions. The change in reanalysis systems and inconsistent calibration among data may also cause uncertainty in long-term stability of water vapor estimates. In addition, it is well known that radiosonde sensor characteristics can be affected by the changing environment (Luers and Eskridge, 1998; Wang and Zhang, 2008). Ho et al. (2010b) demonstrated that the quality of radiosonde humidity measurements varies with sensor types, adding extra difficulties in making a consistent validation of long-term water vapor products.
MW imagers are among the very few satellite instruments that are able to provide long-term (close to 30 years) all-weather time series of water vapor measurements using similar sensors and retrieval techniques (Wentz, 2015). The measured radiances at 19.35, 22.235, and 37.0 GHz from SSMIS and 18.7, 23.8, and 37.0 GHz from WindSat are used to derive TPW, total cloud water (TCW), wind speed, and rainfall rates over oceans (Wentz and Spencer, 1998). These four variables are retrieved by varying their values until the brightness temperatures calculated using a forward model match satellite-observed brightness temperatures. Because MW radiation is significantly affected (absorbed or scattered) by heavy rain, these four variables are only retrieved under conditions of no or light to moderate rain (Schlüssel and Emery, 1990; Elsaesser and Kummerow, 2008; Wentz and Spencer, 1998).
Recently, version 7.0 daily ocean products mapped to a 0.25∘ grid derived from multiple MW radiometers were released by Remote Sensing Systems (RSS) (Wentz, 2013). Many validation studies have been performed by RSS by comparing the MW TPW retrievals with those from ground-based Global Positioning System (gb-GPS) stations (Mears et al., 2015; Wentz, 2015). Because the gb-GPS stations are nearly always located on land, these validation studies use stations located on small and isolated islands (Mears et al., 2015). RSS results for TPW collocated with those derived from gb-GPS over these island stations show that their mean differences vary from station to station and can be as large as 2 mm. The mean difference also varies with surface wind speed, varying from 1 mm at low wind speeds to −1 mm at high wind (20 m s−1) speeds. The difference is near zero for the most common wind speeds (6 to 12 m s−1). Because the uncertainty of the input parameters and change of antenna for each GPS receiver (Bock et al., 2013), the mean TPW(RSS) – TPW (gb-GPS) can vary from −1.5 to 1.5 mm for a single MW radiometer (see Fig. 4 in Mears et al., 2015). Wentz (2015) compared 17 years of Tropical Rainfall Measuring Mission (TRMM) Microwave Imager (TMI) TPW collocated with gb-GPS TPW over the region from 45∘ N to 45∘ S. The mean TMI gb-GPS TPW bias was estimated to be 0.45 mm with a standard deviation (σ) of 2.01 mm.
Unlike passive MW radiometers and infrared sensors, radio occultation (RO) is an active remote sensing technique. RO can provide all-weather, high-vertical-resolution (from ∼ 100 m near the surface to ∼ 1.5 km at 40 km) refractivity profiles (Anthes, 2011). The basis of the RO measurement is a timing measured against reference clocks on the ground, which are timed and calibrated by the atomic clocks at the National Institute of Standards and Technology (NIST). With a GPS receiver onboard the LEO (low Earth orbit) satellite, this technique is able to detect the bending of radio signals emitted by GPS satellites traversing the atmosphere. With the information about the relative motion of the GPS and LEO satellites, the bending angle profile of the radio waves can be used to derive all-weather refractivity, pressure, temperature, and water vapor profiles in the neutral atmosphere (Anthes et al., 2008).
Launched in June 2006, COSMIC (Constellation Observing System for Meteorology, Ionosphere, and Climate) RO data have been used to study atmospheric temperature and refractivity trends in the lower stratosphere (Ho et al., 2009a, b, 2012) and modes of variability above, within, and below clouds (Biondi et al., 2012, 2013; Teng et al., 2013; Scherllin-Pirscher et al., 2012; Zeng et al., 2012; Mears et al., 2012). Wick2008 demonstrated the feasibility of using COSMIC-derived TPW to validate SSM/I TPW products over the eastern Pacific Ocean using 1 month of data. Many studies have demonstrated the usefulness of RO-derived water vapor to detect climate signals of El Niño–Southern Oscillation (ENSO; Teng et al., 2013; Scherllin-Pirscher et al., 2012; Huang et al., 2013) and Madden–Julian Oscillation (MJO; Zeng et al., 2012) and improve moisture analysis of atmospheric rivers (Neiman et al., 2008; Ma et al., 2011).
The objective of this study is to use COSMIC RO TPW to characterize the global TPW values and trends derived from multiple MW radiometers over oceans, including under cloudy and precipitating skies. COSMIC TPW from June 2006 to December 2013 is compared to co-located TPW derived from MW radiometers over the same time period. Because RO data are not strongly sensitive to clouds and precipitation, COSMIC TPW estimates can be used to identify possible MW TPW biases under different meteorological conditions. We describe data sets and analysis methods used in the comparisons in Sect. 2. The comparison results under clear skies and cloudy skies are summarized in Sects. 3 and 4, respectively. The time series analysis is in Sect. 5. We conclude this study in Sect. 6.
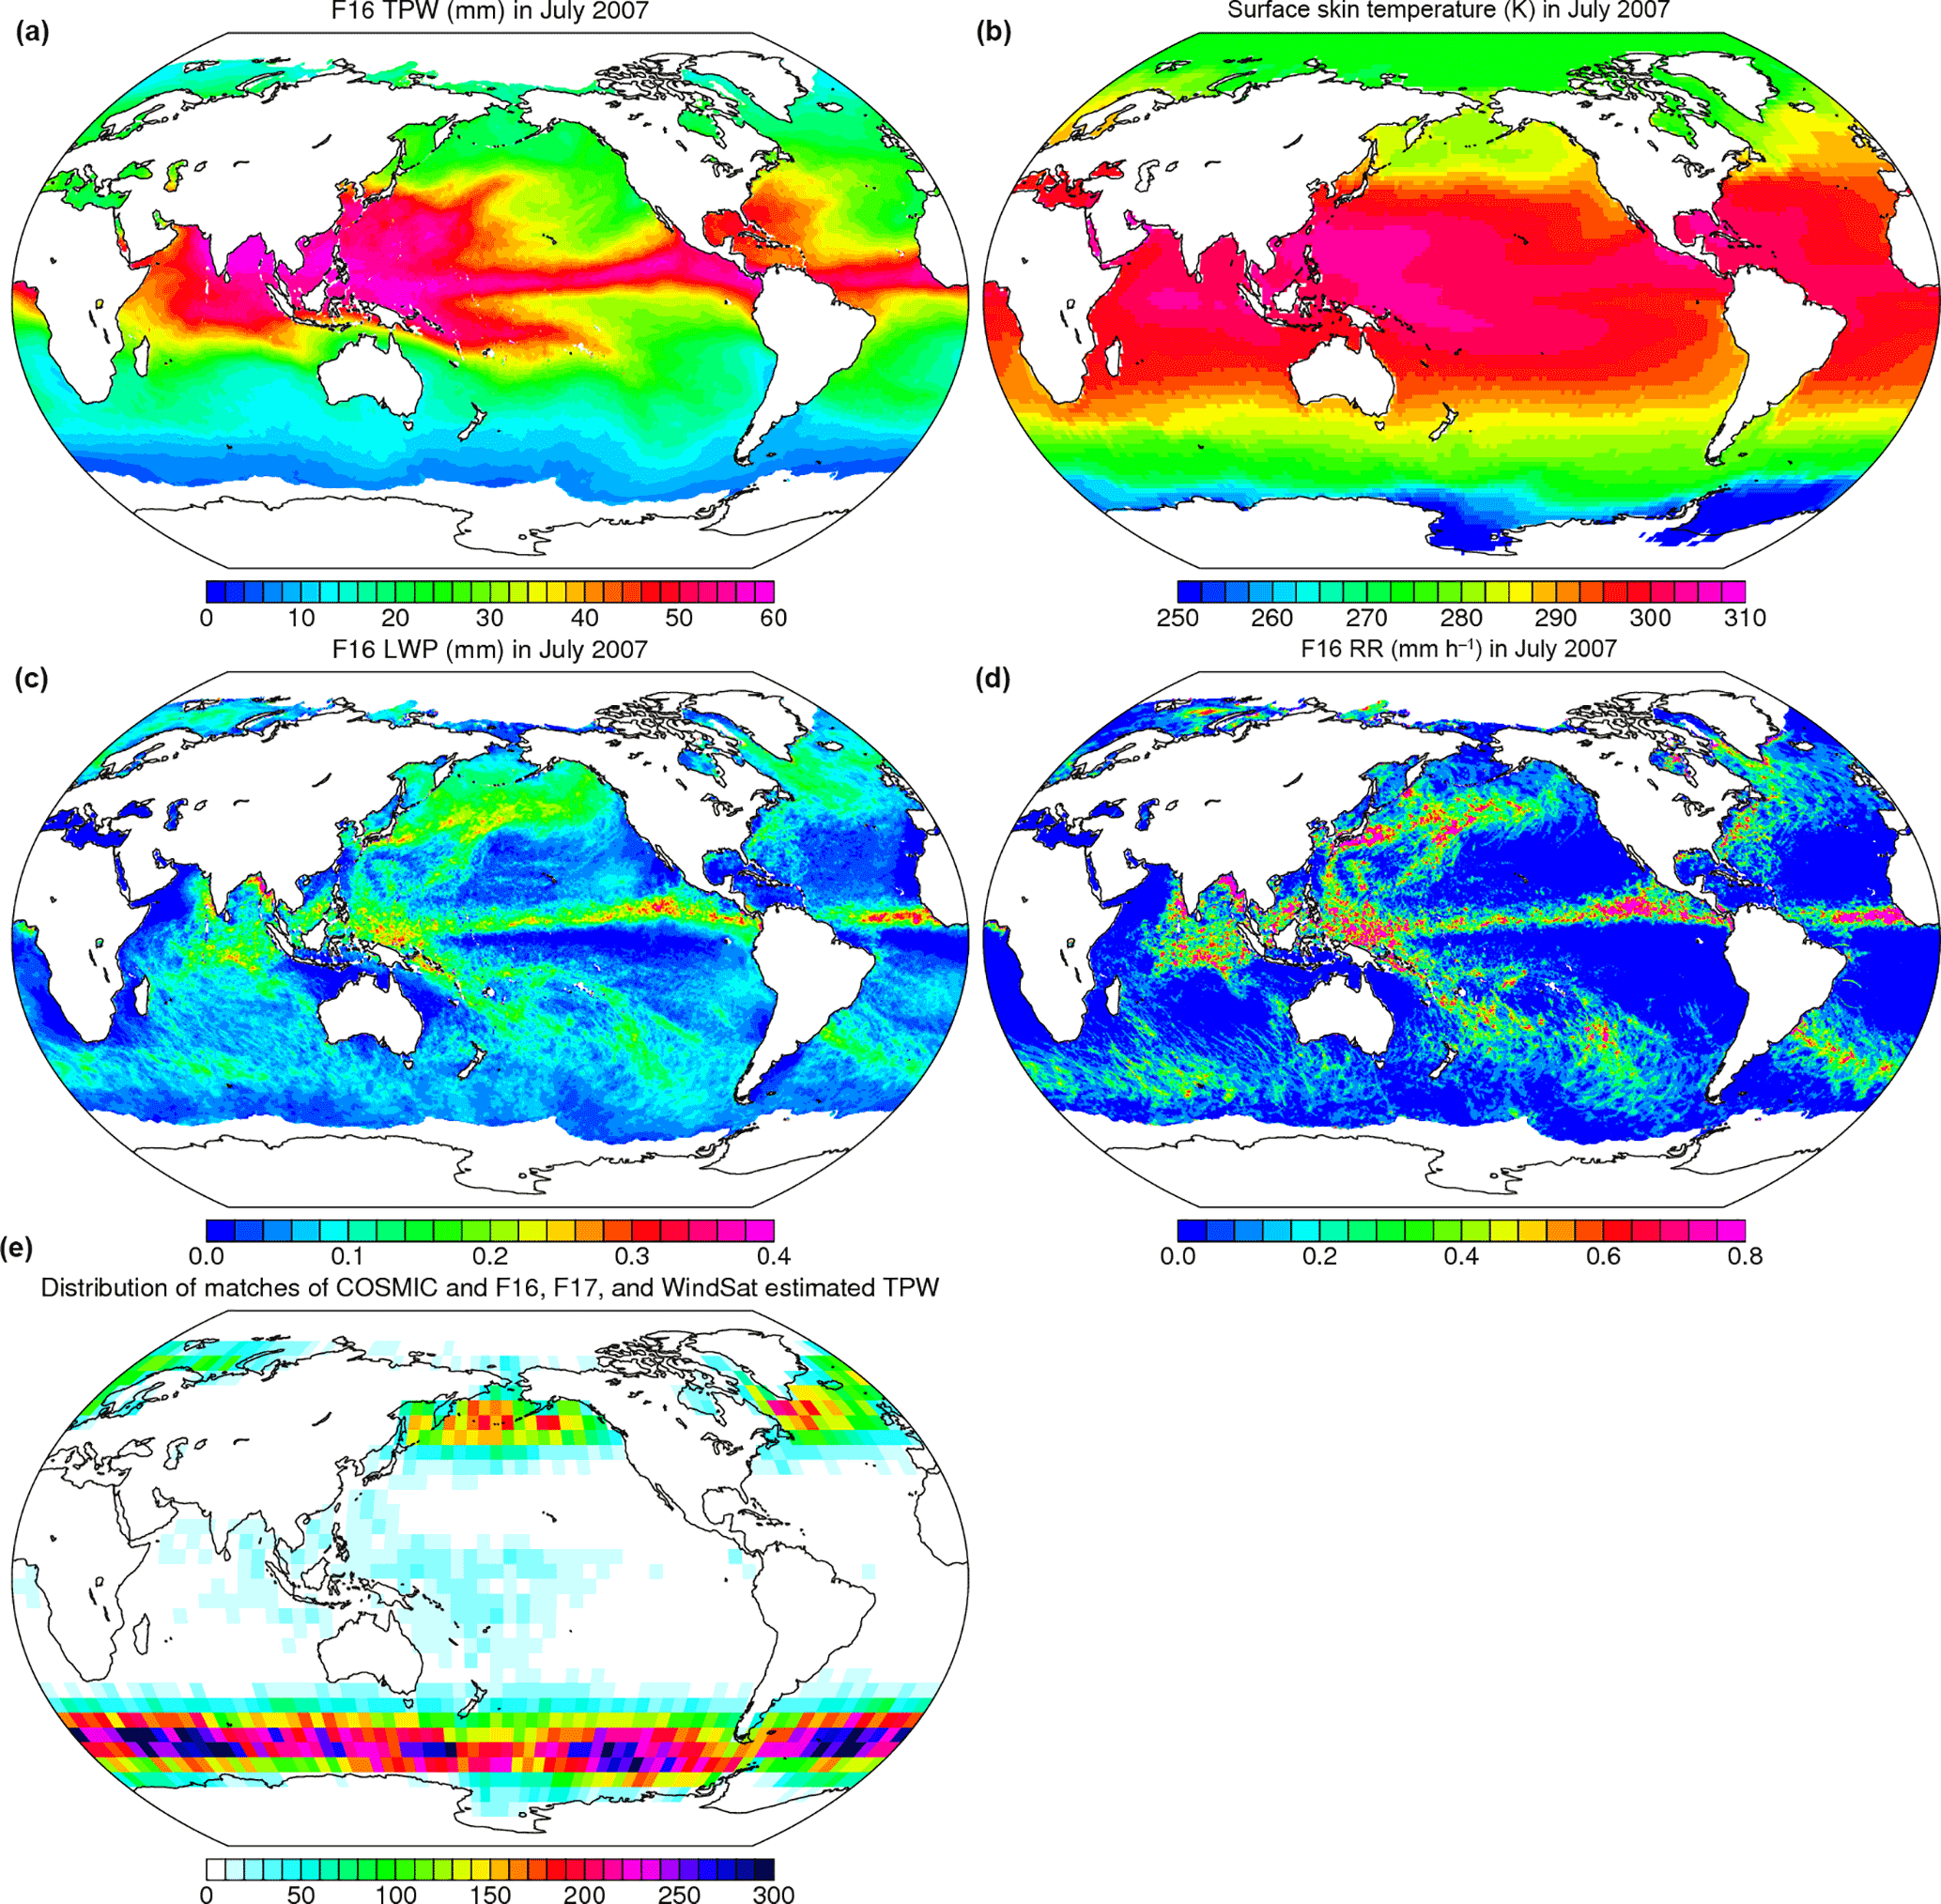
Figure 1(a–e) The RSS v7.0 monthly mean F16 SSM/I (a) TPW (mm), (b) surface skin temperature (K), (c) liquid water path (LWP, mm), and (d) rain rate (RR, mm h−1) and (e) distribution of matches of COSMIC RO and F16, F17, and WindSat estimations of TPW used in this study.
2.1 RSS version 7.0 data ocean products
The RSS version 7.0 ocean products are available for SSM/I, SSMIS, AMSR-E, WindSat, and TMI. The inversion algorithm is mainly based on Wentz and Spencer (1998), in which above a cutoff in the liquid water column (2.45 mm), water vapor is no longer retrieved. The various radiometers from the different satellites have been precisely intercalibrated at the radiance level by analyzing the measurements made by pairs of satellites operating at the same time. This was done for the explicit purpose of producing versions of the data sets that can be used to study decadal-scale changes in TPW, wind, clouds, and precipitation; thus, special attention was focused on interannual variability in instrument calibration. The calibration procedures and physical inversion algorithm used to simultaneously retrieve TPW, surface wind speed (and thereby surface wind stress and surface roughness), and the total liquid water content are summarized in Wentz (2013, 1997). This allows the algorithm to minimize the effect of wind speed, clouds, and rain on the TPW measurement.
The RSS version 7.0 daily data are available on a 0.25∘ latitude × 0.25∘ longitude grid for daytime and nighttime (i.e., 1440 × 720 × 2 per day). Figure 1a–d show the RSS v7.0 monthly mean F16 SSMIS TPW (in millimeters), surface skin temperature (in Kelvin), liquid water path (LWP, in millimeters), and rain rate (RR, in millimeters per hour), respectively, in 2007. Figure 1 shows that the variation in and distribution of TPW over oceans (Fig. 1a) is, in general, closely linked to surface skin temperature variations over the Intertropical Convergence Zone (ITCZ) (Fig. 1b), which is modulated by clouds and the hydrological cycle (Soden et al., 2002). The distribution of monthly TPW is consistent with that of cloud water, where the highest TPW values (and LWP and RR) occur in persistent cloudy and strong convective regions over the tropical western Pacific Ocean near Indonesia.
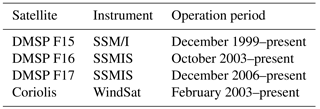
Because COSMIC reprocessed TPW data are only available from June 2006 to December 2013 (i.e., COSMIC2013), the SSM/I F15, SSMIS F16, SSMIS F17, and WindSat RSS version 7.01 ocean products covering the same time period are used in this study. Table 1 summarizes the starting date and end date for RSS SSM/I F15, SSMIS F16, SSMIS F17, and WindSat data. The all sky daily RSS ocean products for F15, F16, F17, and WindSat are downloaded from http://www.remss.com/missions/ssmi.
2.2 COSMIC TPW products
The atmospheric refractivity N is a function of pressure P, temperature T, water vapor pressure Pw, and water content W through the following relationship (Kursinski et al., 1997; Zou et al., 2012):
where P is the pressure in hectopascals, T is the temperature in Kelvin, Pw is the water vapor pressure in hectopascals, Wwater is the liquid water content in grams per cubic meter, and Wice is the ice water content in grams per cubic meter. The last two terms generally contribute less than 1 % to the refractivity and may be ignored (Zou et al., 2012). However, they can be significant for some applications under conditions of high cloud liquid or ice water content, as shown by Lin et al. (2010), Yang and Zou (2012), and Zou et al. (2012). We will neglect these terms in this study, but because we are looking at small differences between MW and RO TPW in cloudy and precipitating conditions in this paper, we estimate the possible contribution of these terms to RO TPW and the consequences of neglecting them here. Since both of these terms increase N, neglecting them in an atmosphere in which they are present will produce a small positive bias in water vapor pressure Pw and therefore total precipitable water when integrated throughout the entire depth of the atmosphere.
Typical values of cloud liquid water content range from ∼ 0.2 g m−3 in stratiform clouds to 1 g m−3 in convective clouds (Cober et al., 2001). Extreme values may reach ∼ 2 g m−3 in deep tropical convective clouds (i.e., cumulonimbus). Ice water content values are smaller, typically 0.01–0.03 g m−3. Heymsfield et al. (2002) reported high ice water content values ranging from 0.1 to 0.5 g m−3 in tropical cirrus and stratiform precipitating clouds, although values rarely reach as high as 1.5 g m−3 in deep tropical convective clouds (Leroy et al., 2017).
For extremely high values of Wwater and Wice of 2.0 and 0.5 g m−3, the contributions to N are 2.8 and 0.3, respectively. The values of N in the atmosphere decrease exponentially upward, from ∼ 300 near the surface to ∼ 150 at P = 500 hPa. Using the extreme values above at 500 hPa, Wwater may contribute from up to 1.6 % of N and Wice up to 0.2 %. Thus, we may assume that in most cases the error in N due to neglecting these terms will be less than 1 %. The effect on TPW will be even less since clouds do not generally extend through the full depth of the atmosphere. Finally, the ∼ 200 km horizontal averaging scale of the RO observation footprint makes it unlikely that such extremely high values of water and ice content will be present over this scale. We conclude that the small positive bias in RO TPW introduced by neglecting the liquid and water terms in Eq. (1) will be less than 1 %.
To resolve the ambiguity of COSMIC refractivity associated with both temperature and water vapor in the lower troposphere, a 1D-Var algorithm (http://cdaac-www.cosmic.ucar.edu/cdaac/doc/documents/1dvar.pdf) is used to derive optimal temperature and water vapor profiles while temperatures and water vapor profiles from the ERA-Interim reanalysis are used as a priori estimates (Neiman et al., 2008; Zeng et al., 2012).
Note that because RO refractivity is very sensitive to water vapor variations in the troposphere (Ho et al., 2007), and is less sensitive to temperature errors, the RO-derived water vapor product is of high accuracy (Ho et al., 2010a, b). It is estimated that 1 K of temperature error will introduce less than 0.25 g kg−1 of water vapor bias in the troposphere in the 1D-Var retrievals. Although the first-guess temperature and moisture are needed for the 1D-Var algorithm, the retrieved water vapor profiles are weakly dependent on the first-guess water vapor profiles (Neiman et al., 2008).
The horizontal footprint of a COSMIC observation is about 200 km in the lower troposphere and its vertical resolution is about 100 m near the surface and 1.5 at 40 km. The COSMIC post-processed water vapor profiles version 2010.2640 collected from the COSMIC Data Analysis and Archive Center (CDAAC) (http://www.cosmic.ucar.edu/) are used to construct the COSMIC TPW data. To further validate the accuracy of COSMIC-derived water vapor, we have compared COSMIC TPW values with those derived from ground-based GPS (i.e., International Global Navigation Satellite Systems–IGS; Wang et al., 2007), which are assumed to be independent of location. Only those COSMIC profiles whose lowest penetration heights are within 200 m of the height of ground-based GPS stations are included. Results showed that the mean global difference between IGS and COSMIC TPW is about −0.2 mm with a standard deviation of 2.7 mm (Ho et al., 2010a). Similar comparisons were found by Teng et al. (2013) and Huang et al. (2013).
2.3 Preparation of COSMIC TPW data for comparison
In this study, only those COSMIC water vapor profiles penetrating lower than 0.1 km are integrated to compute TPW. Approximately 70 to 90 % of COSMIC profiles reach to within 1 km of the surface (Anthes et al., 2008). Usually more than 30 % of COSMIC water vapor profiles reach below 0.1 km in the midlatitudes and higher latitudes and a little bit less than 10 % in the tropical regions. To compensate for the water vapor amount below the penetration height, we follow the following procedure:
- i.
We assume that the relative humidity below the penetration height is equal to 80 %. This is a good assumption, especially over oceans near the sea surface (Mears et al., 2015).
- ii.
The temperatures below the penetration height are taken from the ERA-Interim reanalysis.
- iii.
We compute the water vapor mixing ratio below the penetration heights.
- iv.
We integrate the TPW using COSMIC water vapor profiles above the penetration heights with those water vapor profiles below the penetration heights.
The COSMIC TPW estimates are not very sensitive to the assumption of 80 % relative humidity below 0.1 km (step i above). The assumption of 80 % ± 10 % (i.e., 90 and 70 %) relative humidity below 0.1 km introduces an uncertainty of about ±0.03 mm in the water vapor–COSMIC comparisons for all conditions. As shown in Sect. 4, this uncertainty is small compared to the observed differences between the RO and MW estimates.
Pairs of MW and RO TPW estimates collocated within 50 km and 1 h are collected. The location of RO observation is defined by the RO tangent point at 4–5 km altitude. Wick2008 used MW–RO pairs within 25 km and 1 h in time. To evaluate the effect of the spatial difference on the TPW difference, we also computed TPW differences for MW–RO pairs within 75, 100, 150, and 200 km. We found that the larger spatial difference increases the mean TPW biases slightly to ±0.25 mm and the standard deviations to ±1.91 mm, which is likely because of the high spatial variability in water vapor. Note that, although not shown, the mean biases and standard deviations of the mean biases are slightly larger over the tropics than over midlatitudes. This could be because of the combined effect of the larger spatial TPW variation in the tropical region than that in the midlatitudes (see Fig. 1a and Neiman et al., 2008; Teng et al., 2013; Mears et al., 2015) and the fact that the MW TPW retrieval uncertainty is also larger over stronger convection regions. More results are detailed in Sect. 4.
With a 0.25∘ × 0.25∘ grid, there are about 20 to 60 MW pixels matching one COSMIC observation. The number of pixels varies at different latitudes. A clear MW–RO pair is defined as instances when all the TCW values for the collocated MW pixels are equal to zero. A cloudy MW–RO ensemble is defined as instances when all the TCW values from the collocated MW pixels are larger than zero. Partly cloudy conditions (some of pixels zero and some nonzero) are excluded from this study. The cloudy ensembles are further divided into precipitating and non-precipitating conditions. MW–RO pairs are defined as cloudy non-precipitating when less than 20 % of MW pixels have rainfall rates larger than 0 mm h−1. Cloudy precipitating MW–RO pairs are defined when more than 20 % of the pixels have rainfall rates larger than zero. Because microwave radiances are not sensitive to ice, we treat cloudy pixels of low density like cirrus clouds as clear pixels.
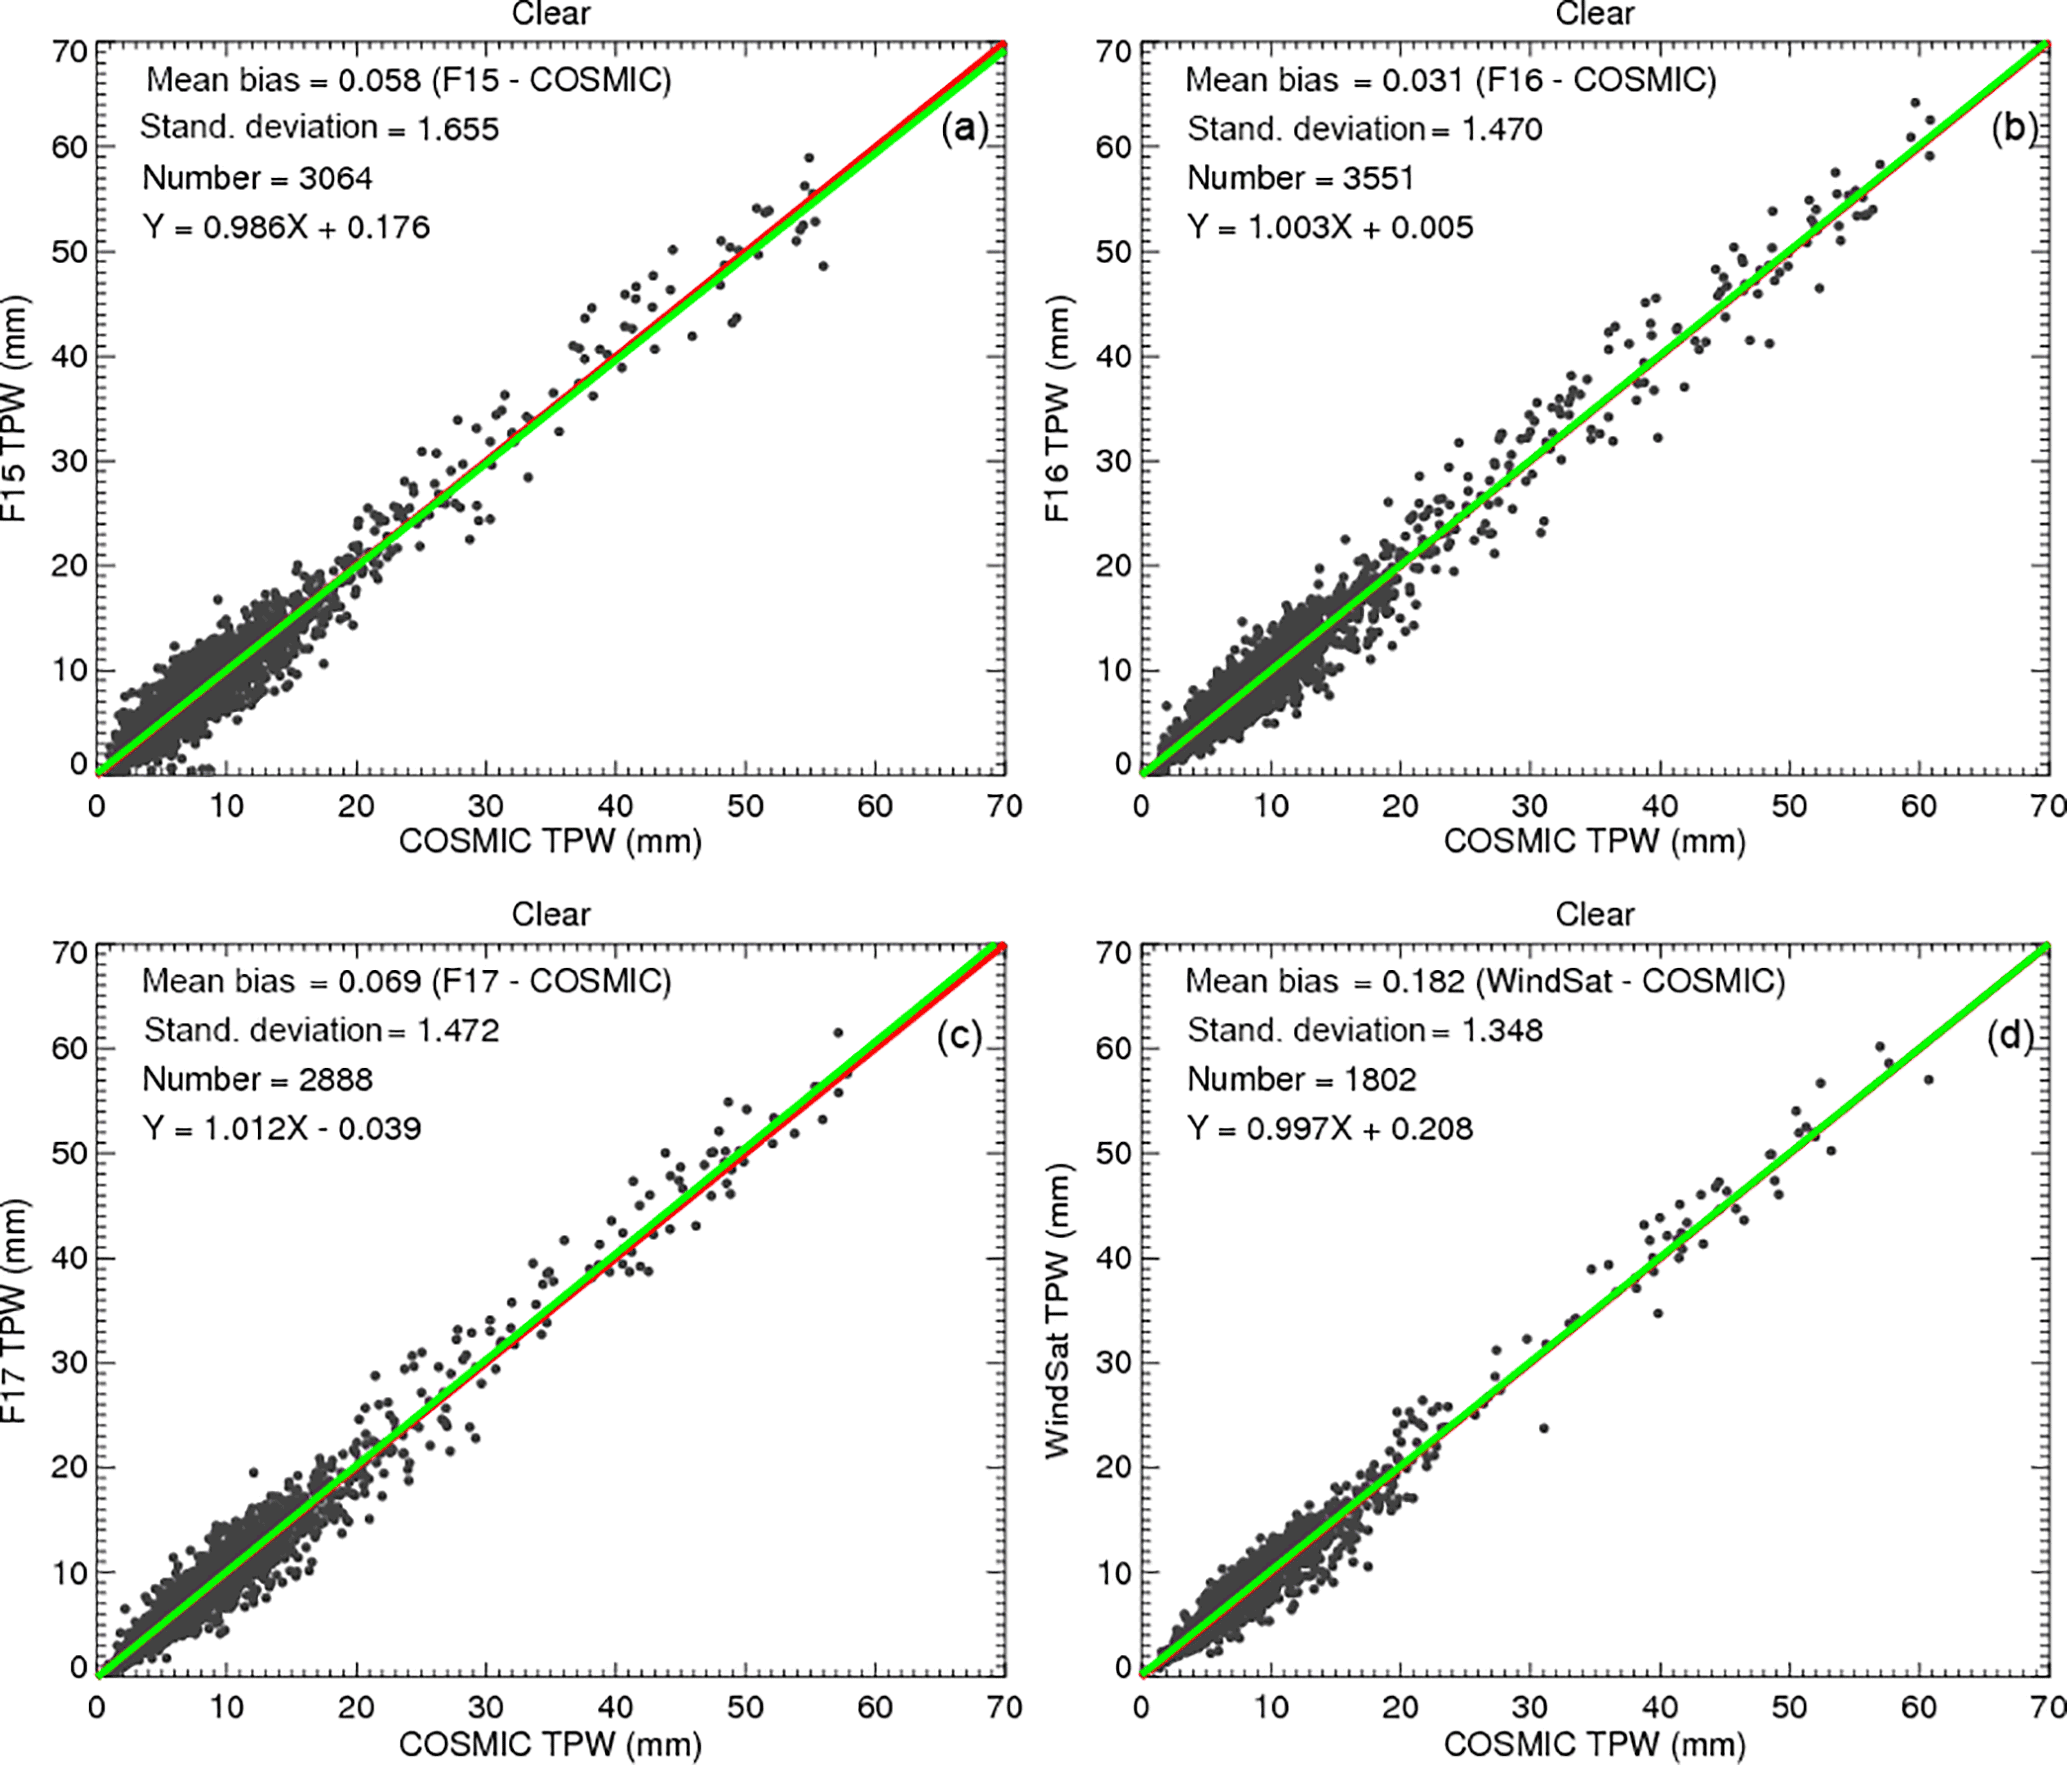
Figure 2TPW scatter plots for the COSMIC and RSS version 7.0 pairs under clear conditions for (a) F15, (b) F16, (c) F17, and (d) WindSat.
The matching pairs of RO and MW observations are not distributed uniformly over the world's oceans. In fact, they are heavily concentrated in middle latitudes, as shown in Fig. 1e. This biased distribution is caused by several factors, including the polar orbits of the satellites, which produce more observations in higher latitudes, and also the failure of many COSMIC RO soundings to penetrate to 0.1 km in the subtropics and tropics (due to super-refraction, which is often present in these regions). Thus, the results presented here, especially the trends, are not representative of global averages. However, the main purpose of this paper is to compare two independent satellite systems for obtaining TPW under varying sky conditions. If the agreement is good, one has confidence in both systems. In this case, SSM/I and WindSat estimates of TPW will be verified and can then be used with confidence globally, including where RO observations are sparse or do not exist.
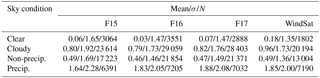
Table 2Mean and standard deviation of differences (MW minus RO) in TPW (mm) between four MW radiometers and COSMIC RO under various sky conditions. The sample numbers for each pair are shown in the third position of each column.
In total there are 26 678 F15–RO pairs, 32 610 F16–RO pairs, 31 291 F17–RO pairs, and 21 996 WindSat–RO pairs from June 2006 to December 2013. Figure 2a–d show scatter plots for F15–COSMIC TPW, F16–COSMIC TPW, F17–COSMIC TPW, and WindSat–COSMIC TPW under clear skies. Figure 2a–d show that the MW clear sky TPW values from F15, F16, F17, and WindSat are all very consistent with those from co-located COSMIC observations. As summarized in Table 2, under clear conditions where SSM/I provides high-quality TPW estimates, the mean TPW bias between F16 and COSMIC (F16–COSMIC) is equal to 0.03 mm with a standard deviation σ of 1.47 mm. The mean TPW differences are equal to 0.06 mm with a σ of 1.65 mm for F15, 0.07 mm with a σ of 1.47 mm for F17, and 0.18 mm with a σ of 1.35 mm for WindSat. The reason for a larger standard deviation for F15 may be because the F15 data after August 2006 were corrupted by the “rad-cal” beacon that was turned on at this time (Hilburn and Wentz, 2008). On 14 August 2006, a radar calibration beacon (rad-cal) was activated on F15. This radar interfered with the SSM/I, primarily the 22V channel, which is a key channel for water vapor retrievals. Although a correction method derived by Hilburn and Wentz (2008) and Hilburn (2009) was applied, the 22V channel is not fully corrected (Wentz, 2013). As a result, there are still errors in the water vapor retrievals. F16 had solar radiation intrusion into the hot load during the time period, while F17 and WindSat had no serious issues.
4.1 Comparison of MW, RO, and ground-based GPS TPW
Figure 3a–c depict the scatter plots for F16–COSMIC pairs under cloudy, cloudy non-precipitating, and precipitating conditions from June 2006 to December 2013 over oceans. While there is a very small bias (0.031 mm) for clear pixels (Fig. 2b), there is a significant positive TPW bias (0.794 mm) under cloudy conditions (Fig. 3a). This may explain the close to 0.45 mm mean TMI gb-GPS TPW biases found by Wentz (2015) in which close to 7 years of data were used. Figure 3c depicts that the large SSM/I TPW biases under cloudy skies are mainly from the pixels with precipitation (mean bias is equal to 1.825 mm) although precipitation pixels are of about less than 6 % of the total F16–COSMIC pairs. Because RO measurements are not significantly affected by clouds and precipitation, the biases mainly result from MW retrieval uncertainty under cloudy conditions. The fact that the MW–COSMIC biases for precipitating conditions (1.825 mm, Fig. 3c, and 1.64–1.88 mm in Table 2) are much larger than those for cloudy but non-precipitating conditions indicates that significant scattering and absorbing effects are present in the passive MW measurements when it rains. The correlation coefficients for F15–RO, F16–RO, F17–RO, and WindSat–RO pairs for all sky conditions are all larger than 0.96 (not shown).
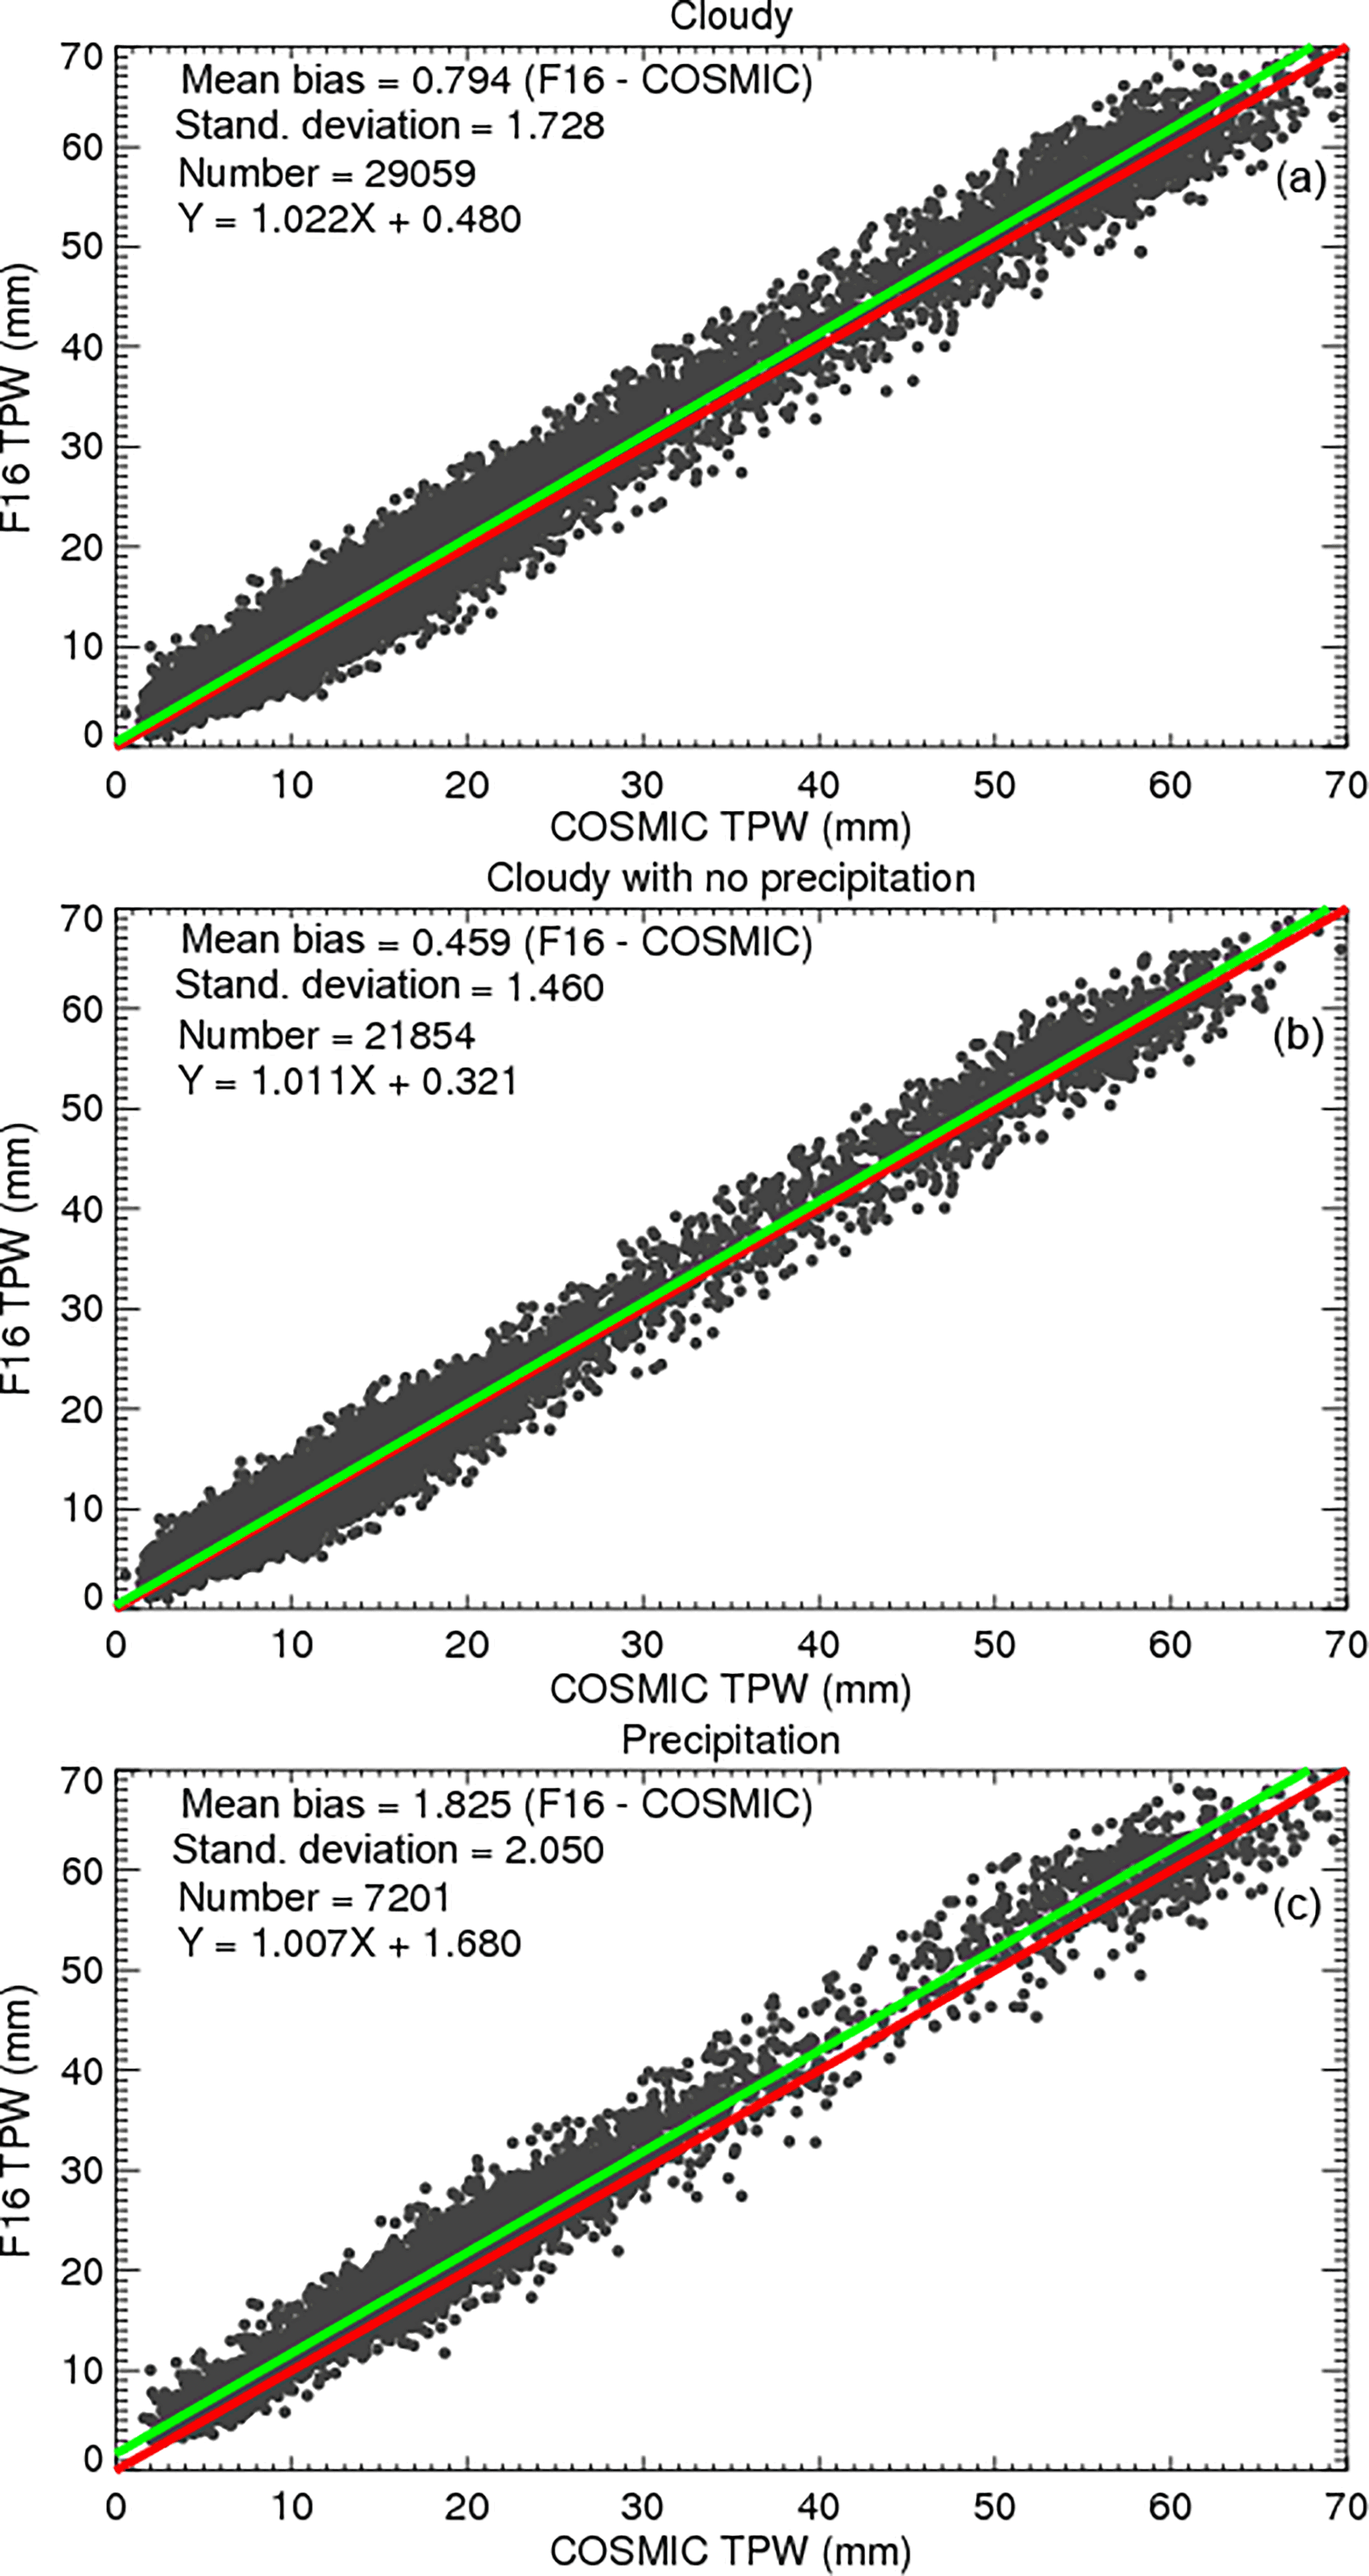
Figure 3TPW scatter plots for the COSMIC and RSS version 7.0 F16 SSM/I pairs under (a) cloudy, (b) cloudy but non-precipitating, and (c) precipitating conditions.
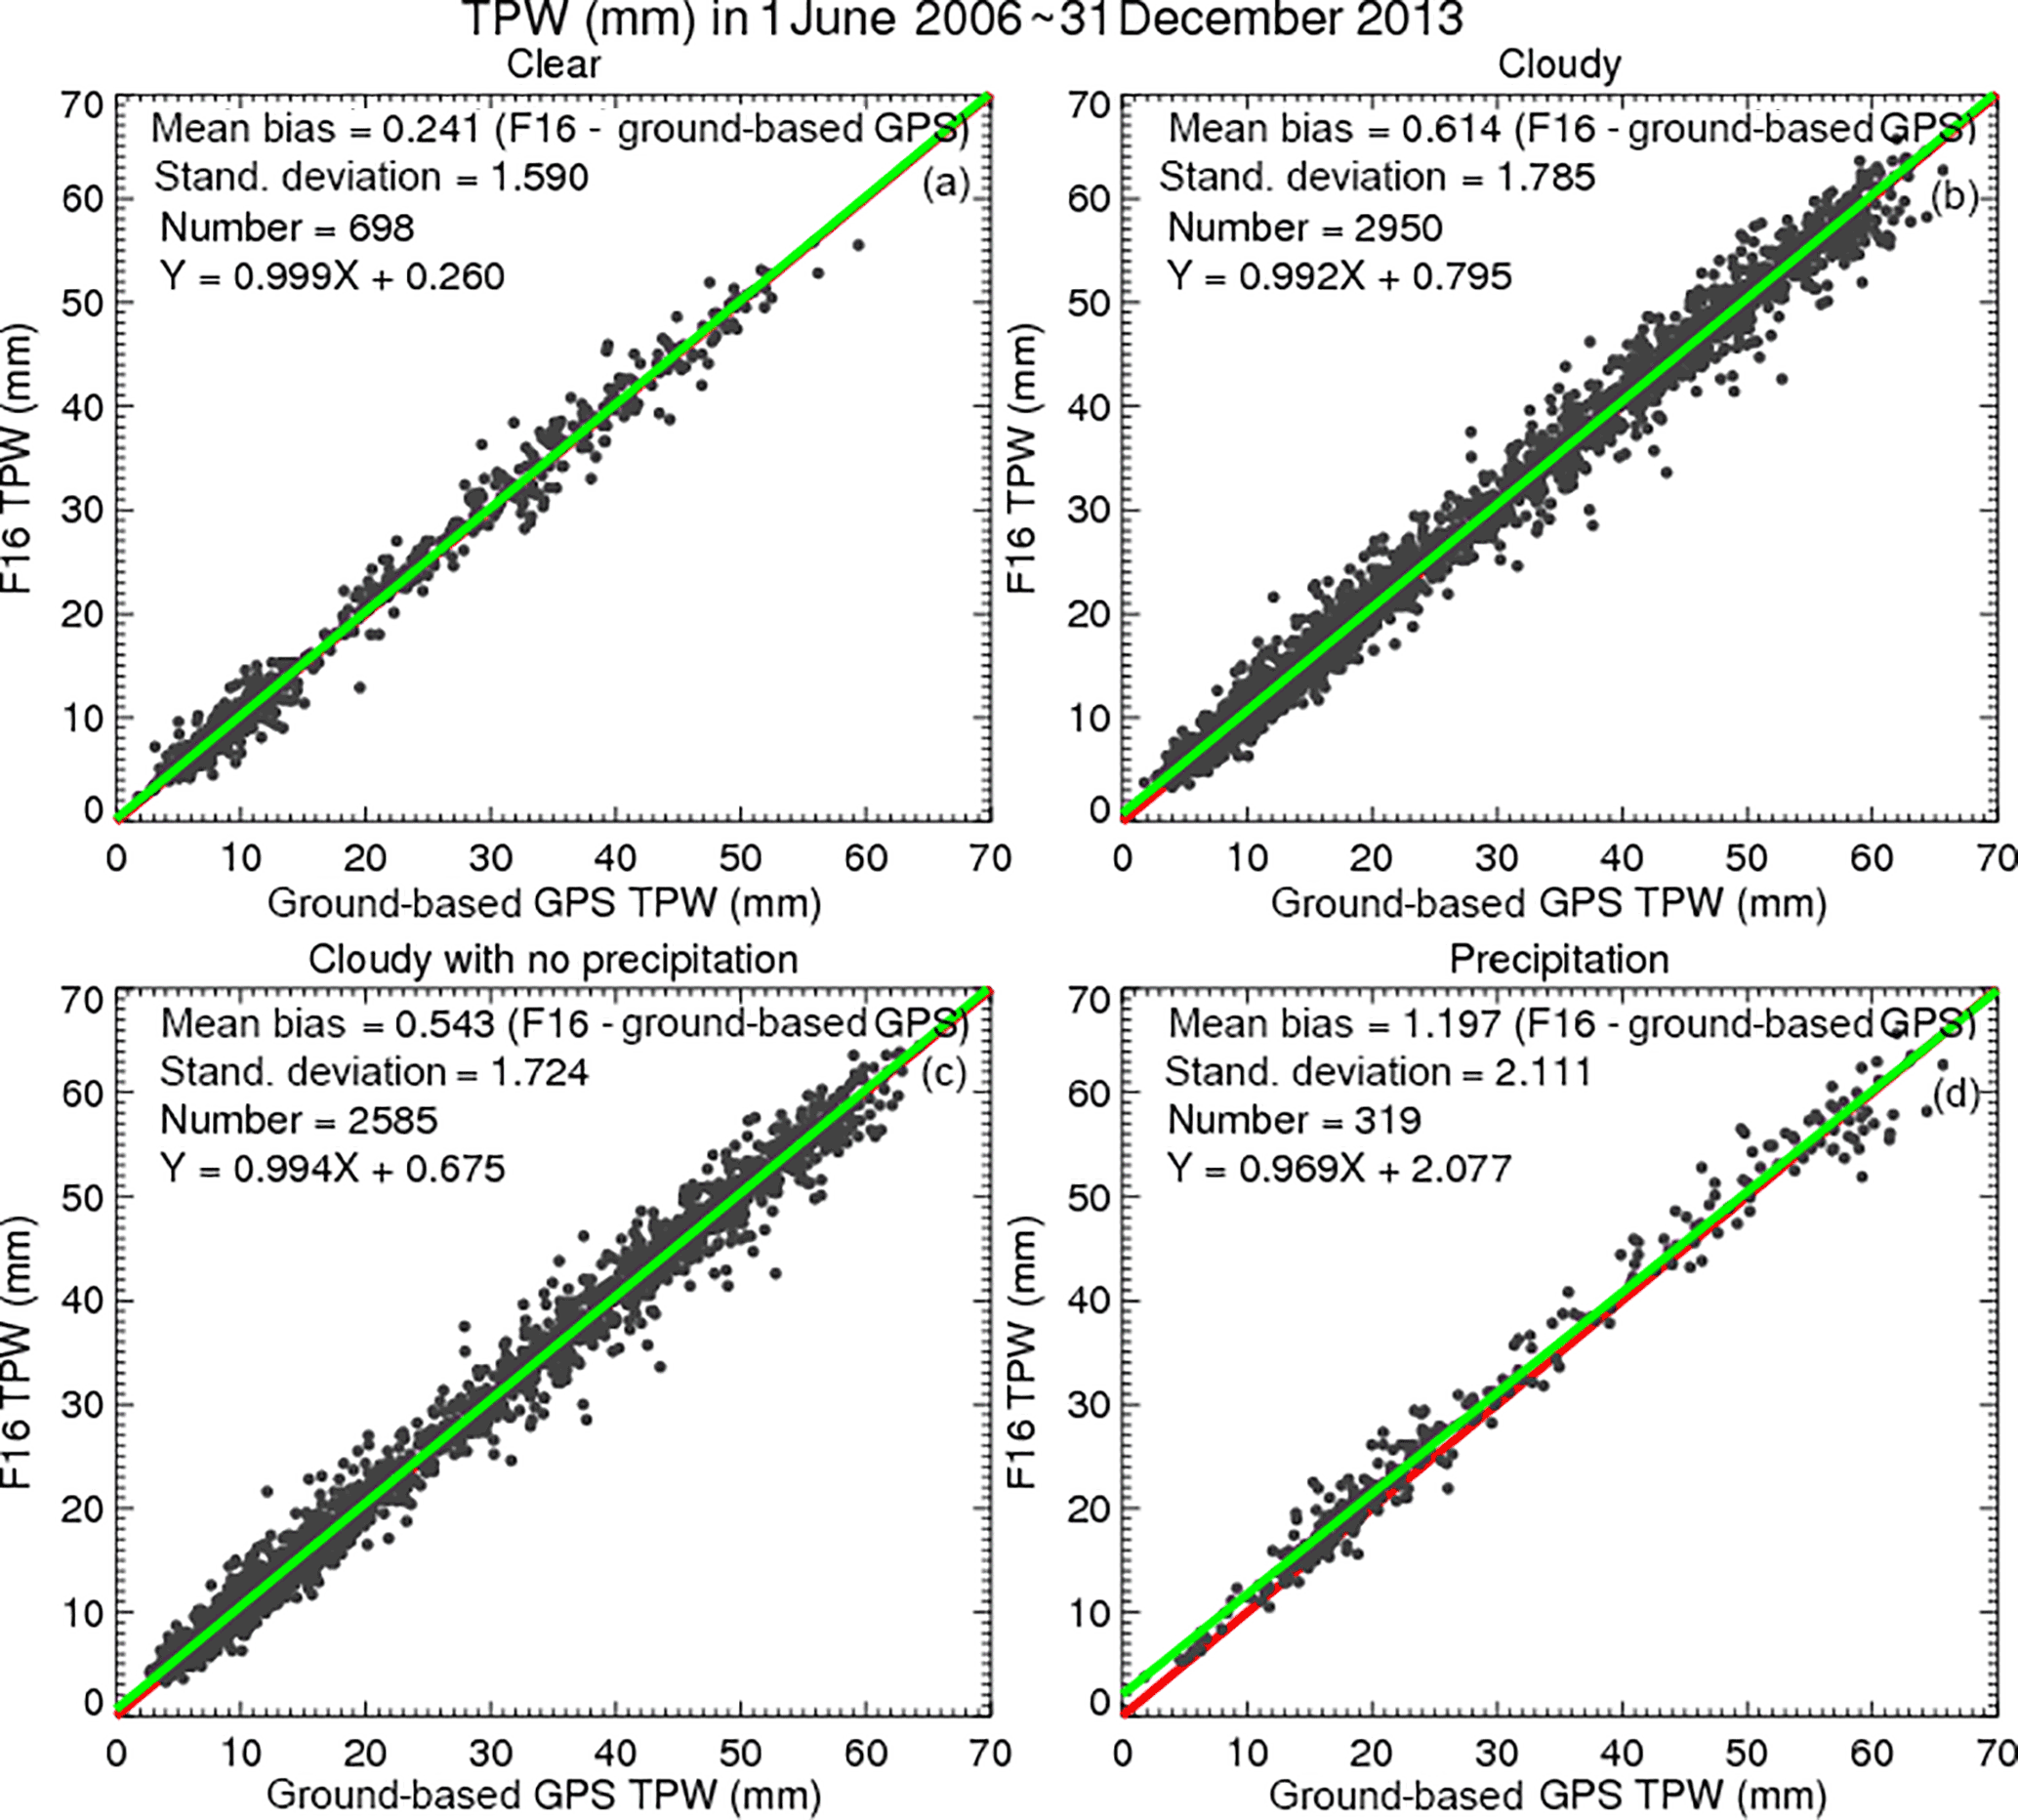
Figure 4TPW scatter plots for the gb-GPS and RSS version 7.0 F16 SSM/I pairs from June 2006 to December 2013 under (a) clear, (b) cloudy, (c) cloudy but non-precipitating, and (d) precipitating conditions.
MW and gb-GPS TPW comparisons show differences similar to the MW–RO differences under different sky conditions. We compared F16 pixels with those from gb-GPS within 50 km and 1 h over the 33 stations studied by Mears et al. (2015) from 2002 to 2013. Figure 4a–d depict the scatter plots for F16 gb-GPS TPW under clear, cloudy, cloudy non-precipitating, and cloudy precipitating conditions, respectively. The F16-gb-GPS mean biases are equal to 0.241 mm (clear skies), 0.614 mm (cloudy skies), 0.543 mm (cloudy non-precipitating), and 1.197 mm (precipitating), which are similar to those estimated from MW–RO comparisons (Table 2).
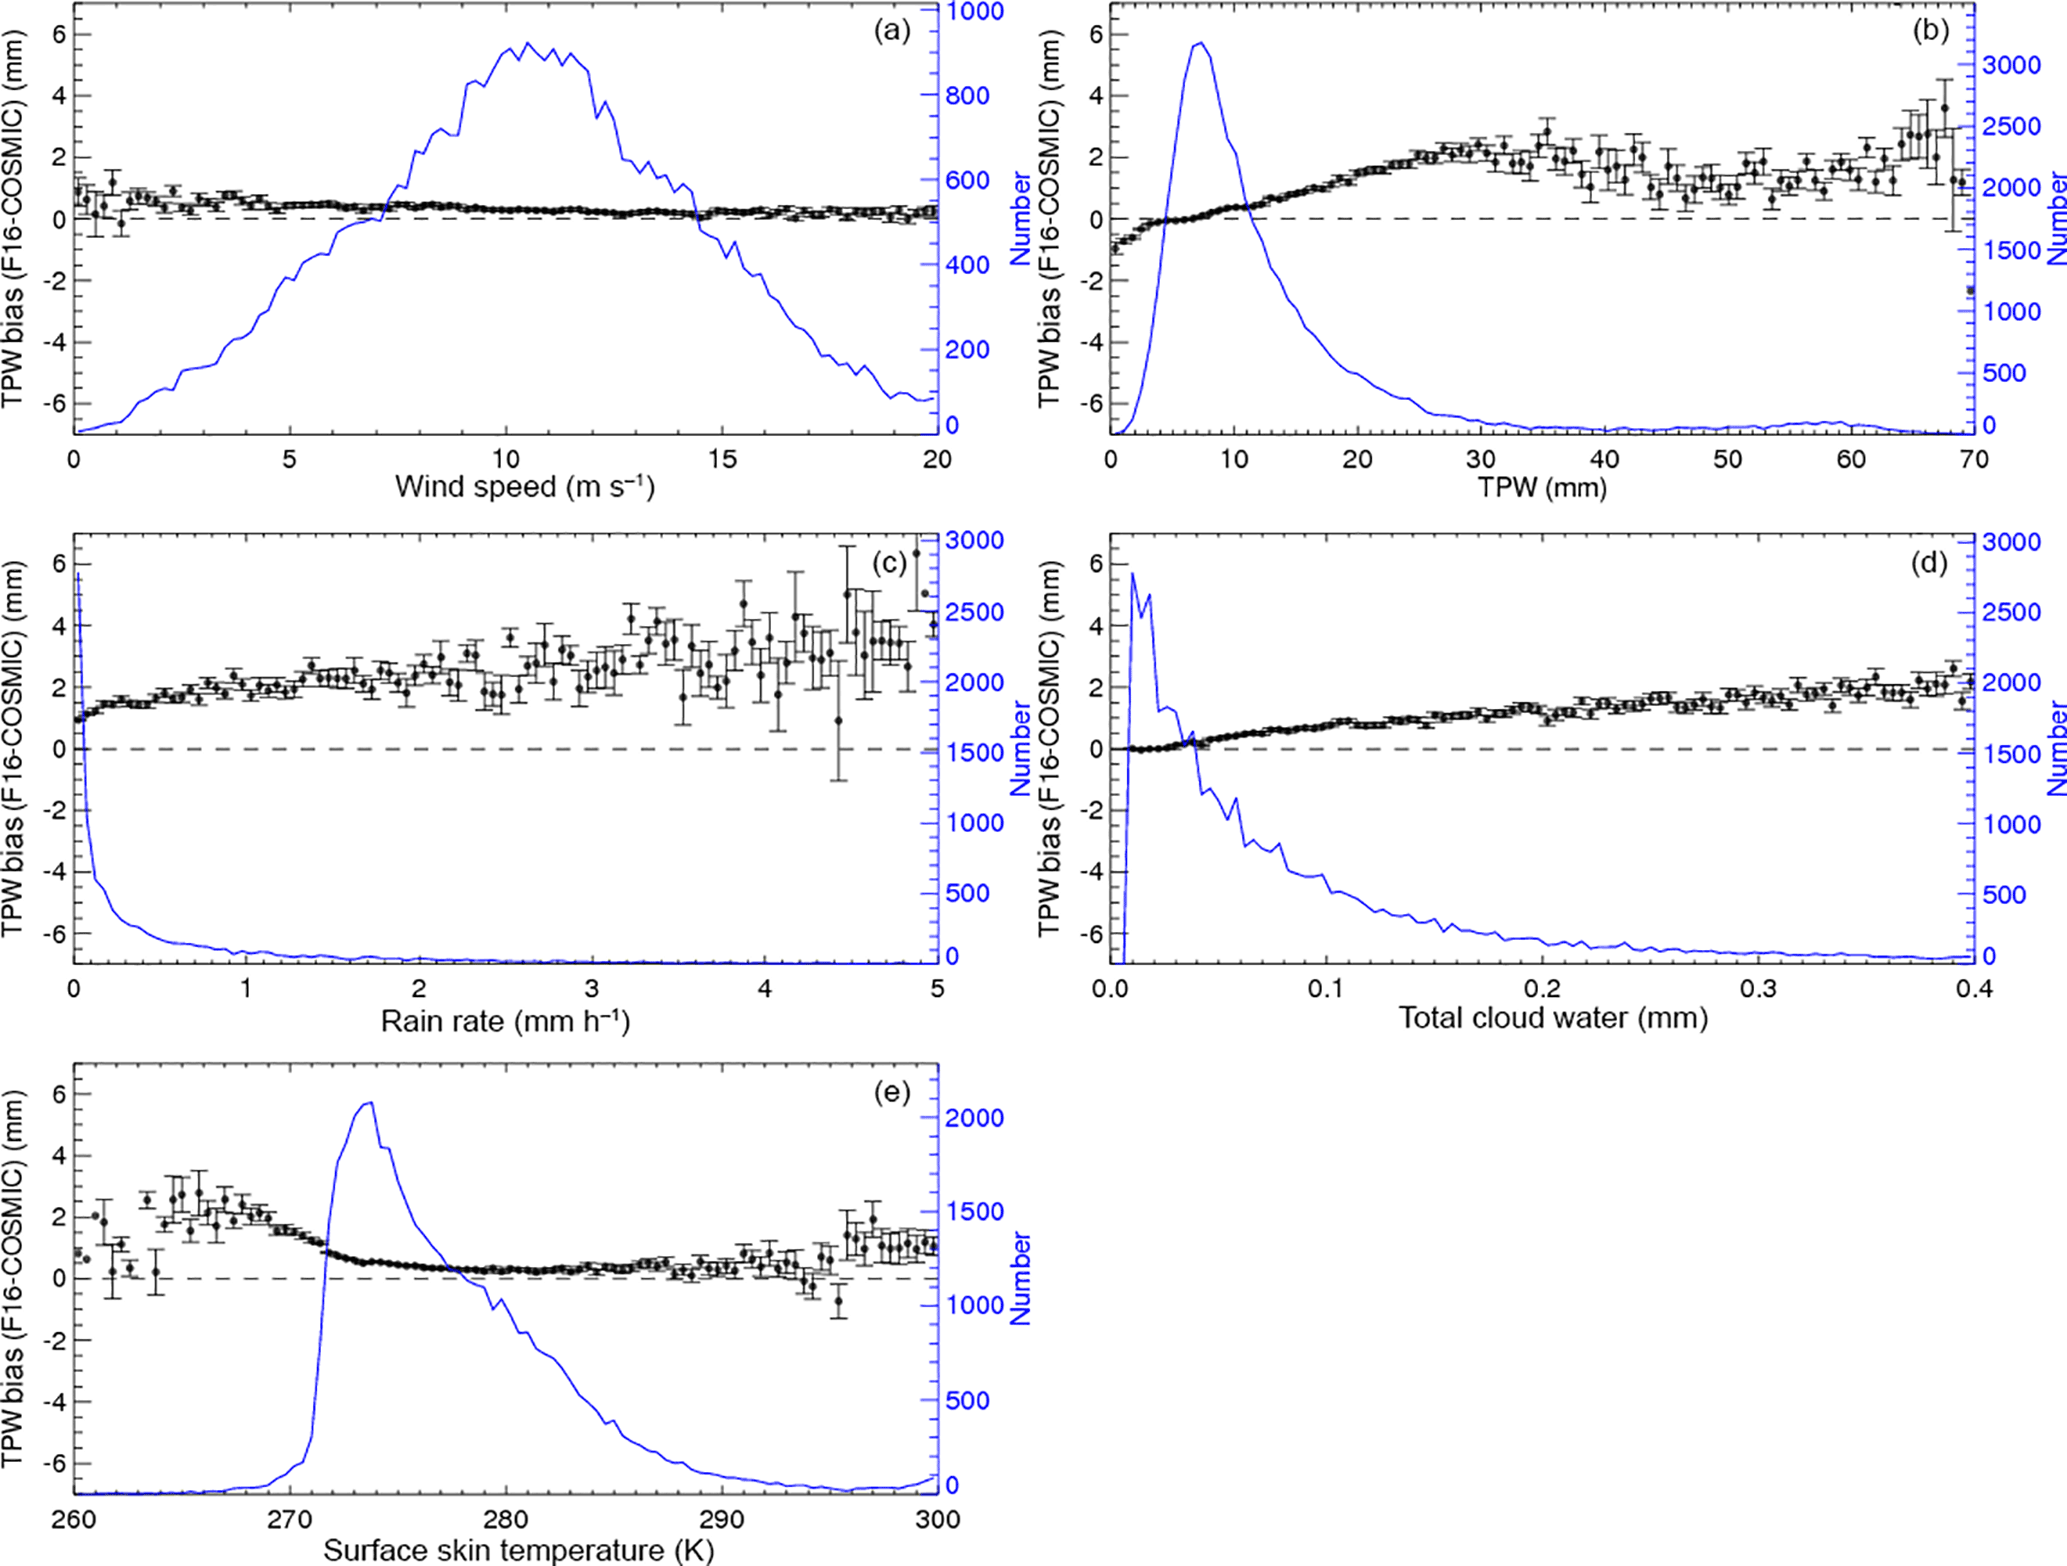
Figure 5Mean and standard of the mean for the F16–COSMIC TPW biases varying with (a) wind speed (m s−1), (b) TPW (mm), (c) rain rate (mm h−1), (d) total cloud water (mm), and (e) surface skin temperature (K). The vertical black bracket superimposed on the mean denotes the standard error of the mean. The green dashed line is the number of samples, indicated by the scale on the right.
The results above show that the MW estimates of TPW are biased positively compared to both the RO and the ground-based GPS estimates, which are independent measurements. The biases are smallest for clear skies and largest for precipitating conditions, with cloudy, non-precipitating biases in between. Overall, the results suggest that clouds and especially precipitation contaminate the MW radiometer measurements, which in turn affect the MW TPW retrievals.
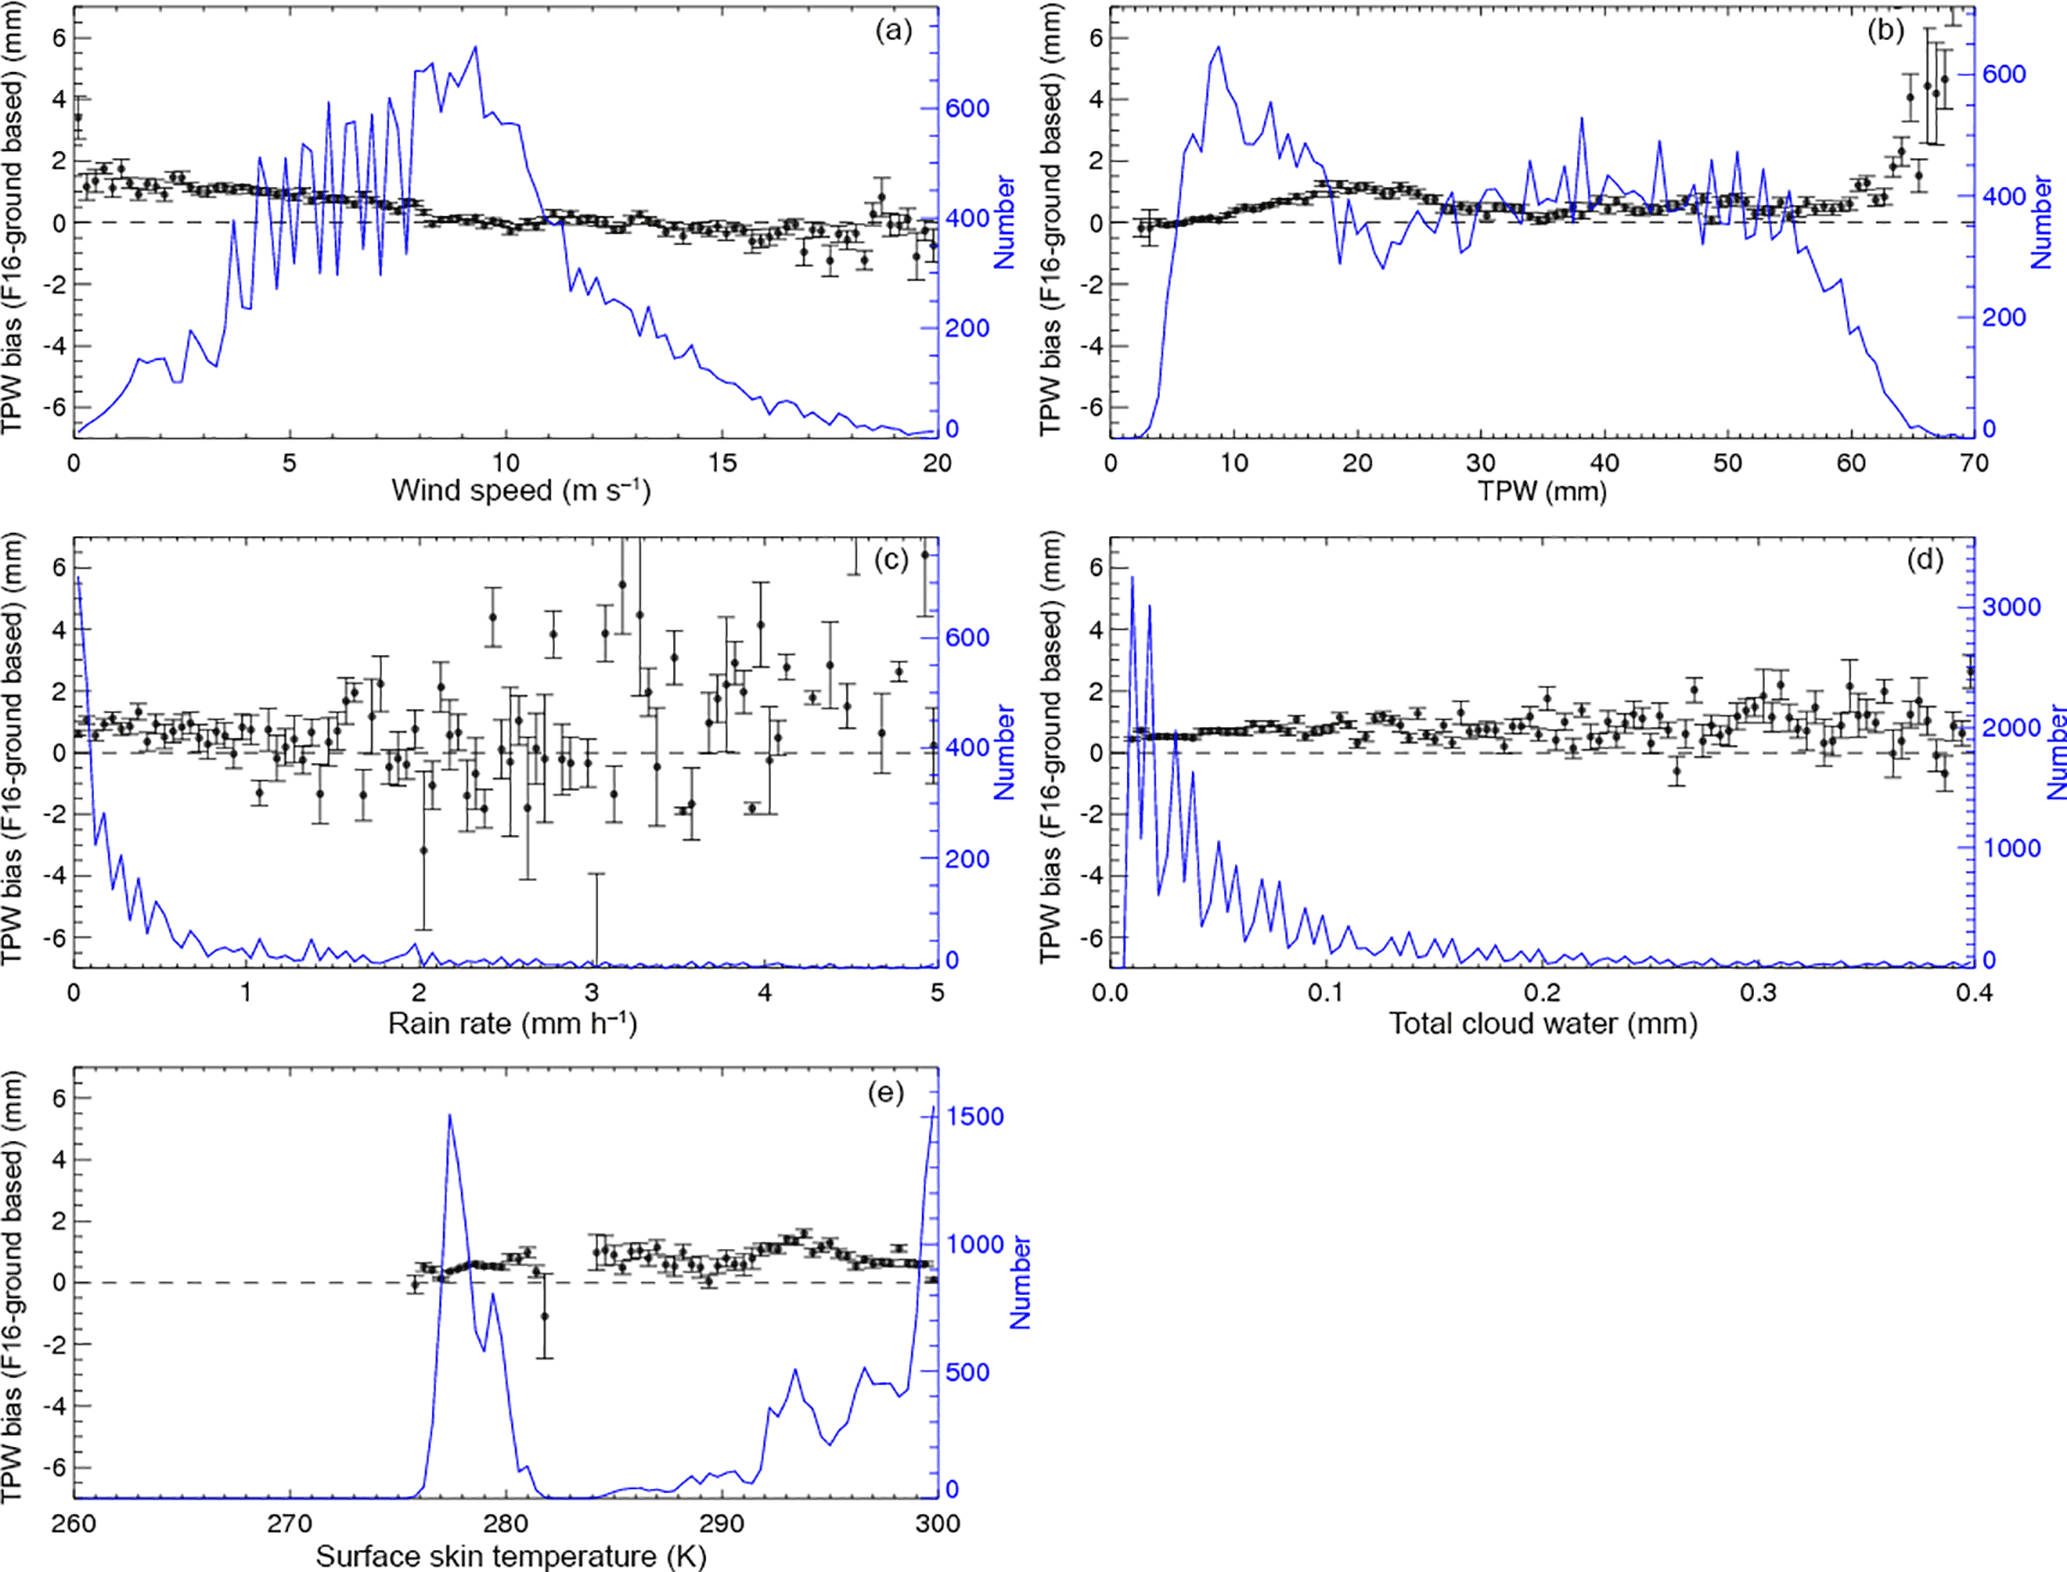
Figure 6Mean and standard of the mean for the F16 gb-GPS TPW biases varying with (a) wind speed (m s−1), (b) TPW (mm), (c) rain rate (mm h−1), (d) total cloud water (mm), and (e) surface skin temperature (K). The vertical black bracket superimposed on the mean denotes the standard error of the mean. The green dashed line is the number of samples, indicated by the scale on the right.
4.2 Time series of MW, RO, and ground-based TPW biases under various meteorological conditions
To further examine how rain and cloud droplets affect the MW TPW retrievals, we show how the F16–RO TPW biases vary under different meteorological conditions in Fig. 5. The bias dependence on wind speed (Fig. 5a) is small. Unlike the results from Mears et al. (2015), the mean TPW biases between F16 and COSMIC are within 0.5 mm with high winds (wind speed larger than 20 m s−1). Figure 5b indicates that the F16–COSMIC bias is larger, with a TPW greater than about 10 mm, which usually occurs under cloudy conditions. The F16–COSMIC biases can be as large as 2.0 mm when the rainfall rate is larger than 1 mm h−1 (Fig. 5c), which usually occurs with high total liquid cloud water conditions. The F16 TPW biases can be as large as 2 mm when total cloud water is larger than 0.3 mm (Fig. 5d). Figure 5e shows that the larger F16–COSMIC TPW biases (2–3 mm) mainly occur over regions with a surface skin temperature less than 270 K (higher latitudes; see Fig. 1b). The F15, F17, and WindSat TPW biases under different meteorological conditions are very similar to those of F16 (not shown).

Figure 7The time series of monthly mean F16 – COSMIC TPW differences under (a) clear, (b) cloudy, (c) cloudy but non-precipitating, and (d) precipitating conditions. The black line is the mean difference for microwave radiometer minus COSMIC; the vertical lines superimposed on the mean values are the standard error of the mean. The number of the monthly MW radiometer–COSMIC pairs is indicated by the green dashed line (scale on the right y axis).
Table 3Mean and standard deviation (SD) of the mean in millimeters of the monthly time series of differences of MW minus RO TPW under various sky conditions. The trend of the RO estimates of TPW (mm decade−1) and the 95 % confidence level are shown below the mean and σ values in each row.
In Fig. 6 we compare RSS v7.0 F16 MW TPW to the gb-GPS TPW over various meteorological conditions. The magnitudes of the MW gb-GPS TPW differences under high rain rate and high total cloud water conditions are somewhat smaller than those of MW–RO pairs (varying from about 0.5 to 2.0 mm), which may be because most of the MW gb-GPS samples are collected under low rain rates (less than 1 mm h−1).
5.1 Monthly mean TPW time series comparison
To further examine MW TPW long-term stability and trend uncertainty due to rain and water droplets for different instruments, we compared time series of the MW and COSMIC monthly mean TPW differences from June 2006 to December 2013. Figure 7a–d show the monthly mean F16–COSMIC TPW differences from June 2006 to December 2013 for clear, cloudy, cloudy non-precipitating, and precipitating conditions. In general, the microwave TPW biases under different atmospheric conditions are positive and stable from June 2006 to December 2013, as reflected in relatively small standard deviation values (Table 3). Except for F15, the standard deviations of the monthly mean TPW anomaly range are less than 0.38 mm (Table 3). In contrast, the F15–COSMIC monthly mean σ values range from 0.48 to 0.69 mm with different conditions.
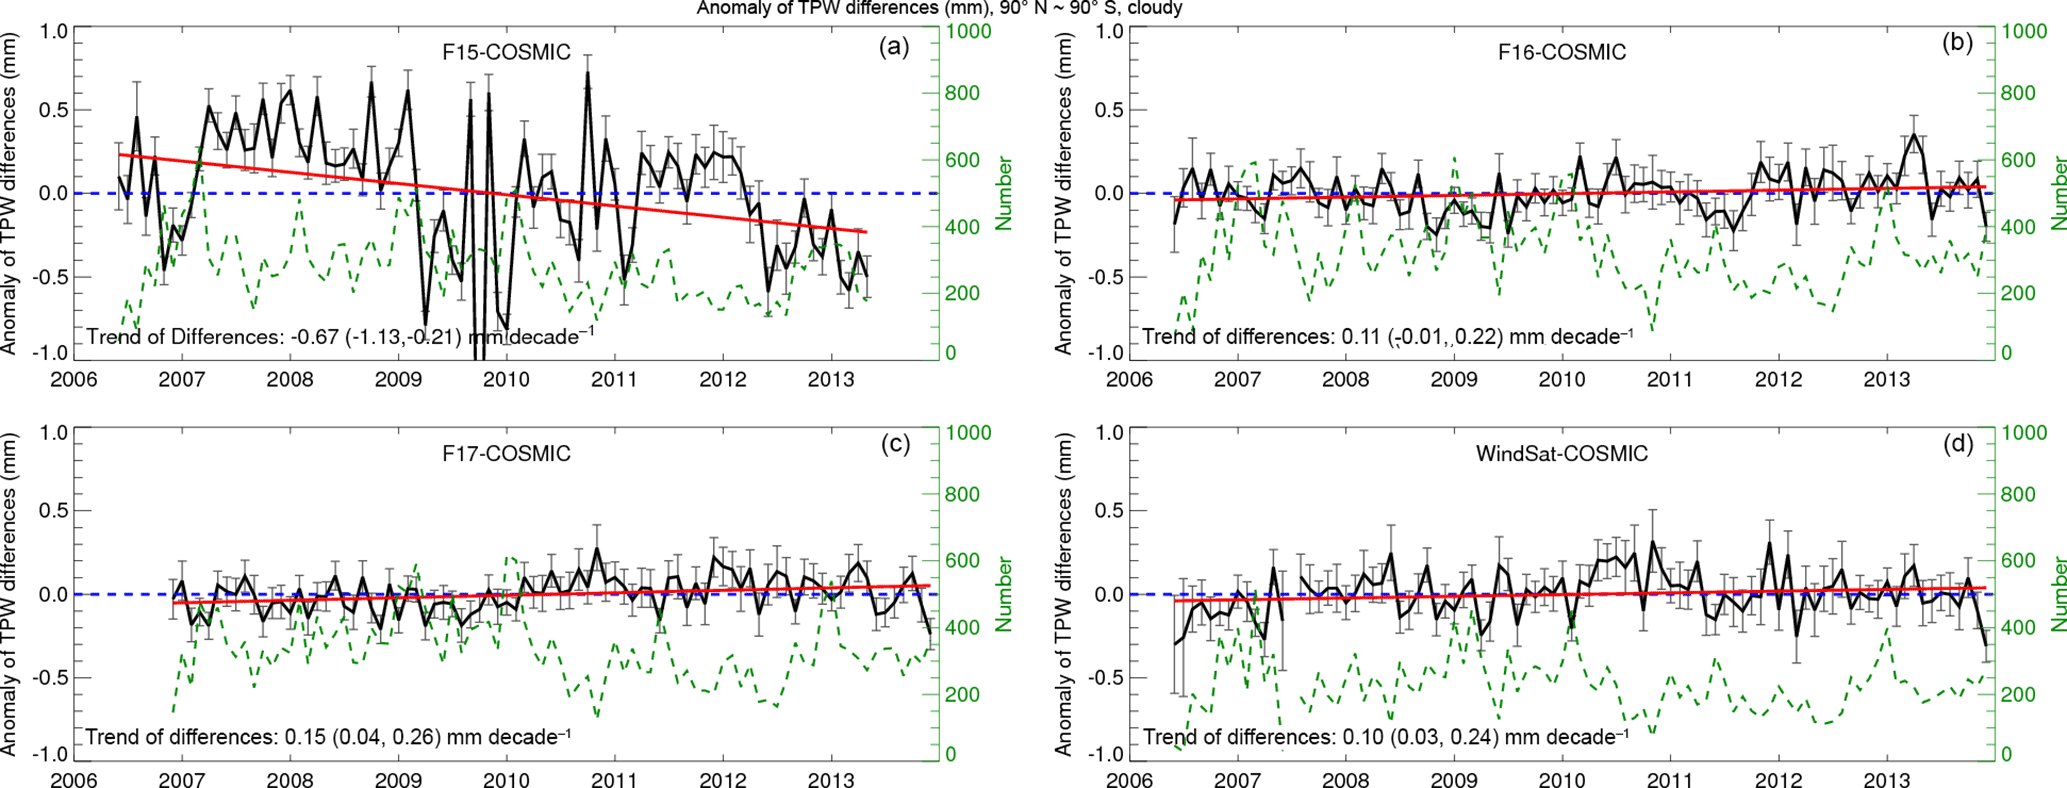
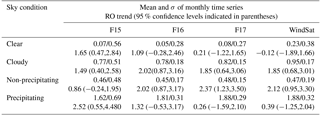
Figure 8The time series of deseasonalized TPW differences (microwave radiometer – COSMIC) under cloudy skies for (a) F15, (b) F16, (c) F17, and (d) WindSat. The black line is the mean difference for microwave radiometer minus COSMIC; the vertical lines superimposed on the mean values are the standard error of the mean. The number of the monthly MW radiometer–COSMIC pairs is indicated by the green dashed line (scale on the right y axis). The trends are shown by a solid red line. The 95 % confidence intervals for slopes are shown in the parentheses.
Table 3 also shows the trend in the RO estimates of TPW differences over the 8-year period of study. The trends range from −0.12 mm decade−1 (WindSat, clear skies) to 2.52 mm decade−1 (F15, precipitating conditions). The overall trend of TPW as estimated by RO (second line in each row of Table 3) is positive, as discussed in the next section. Table 3 shows that in general the trends are more strongly positive under cloudy and precipitating conditions compared to clear conditions.
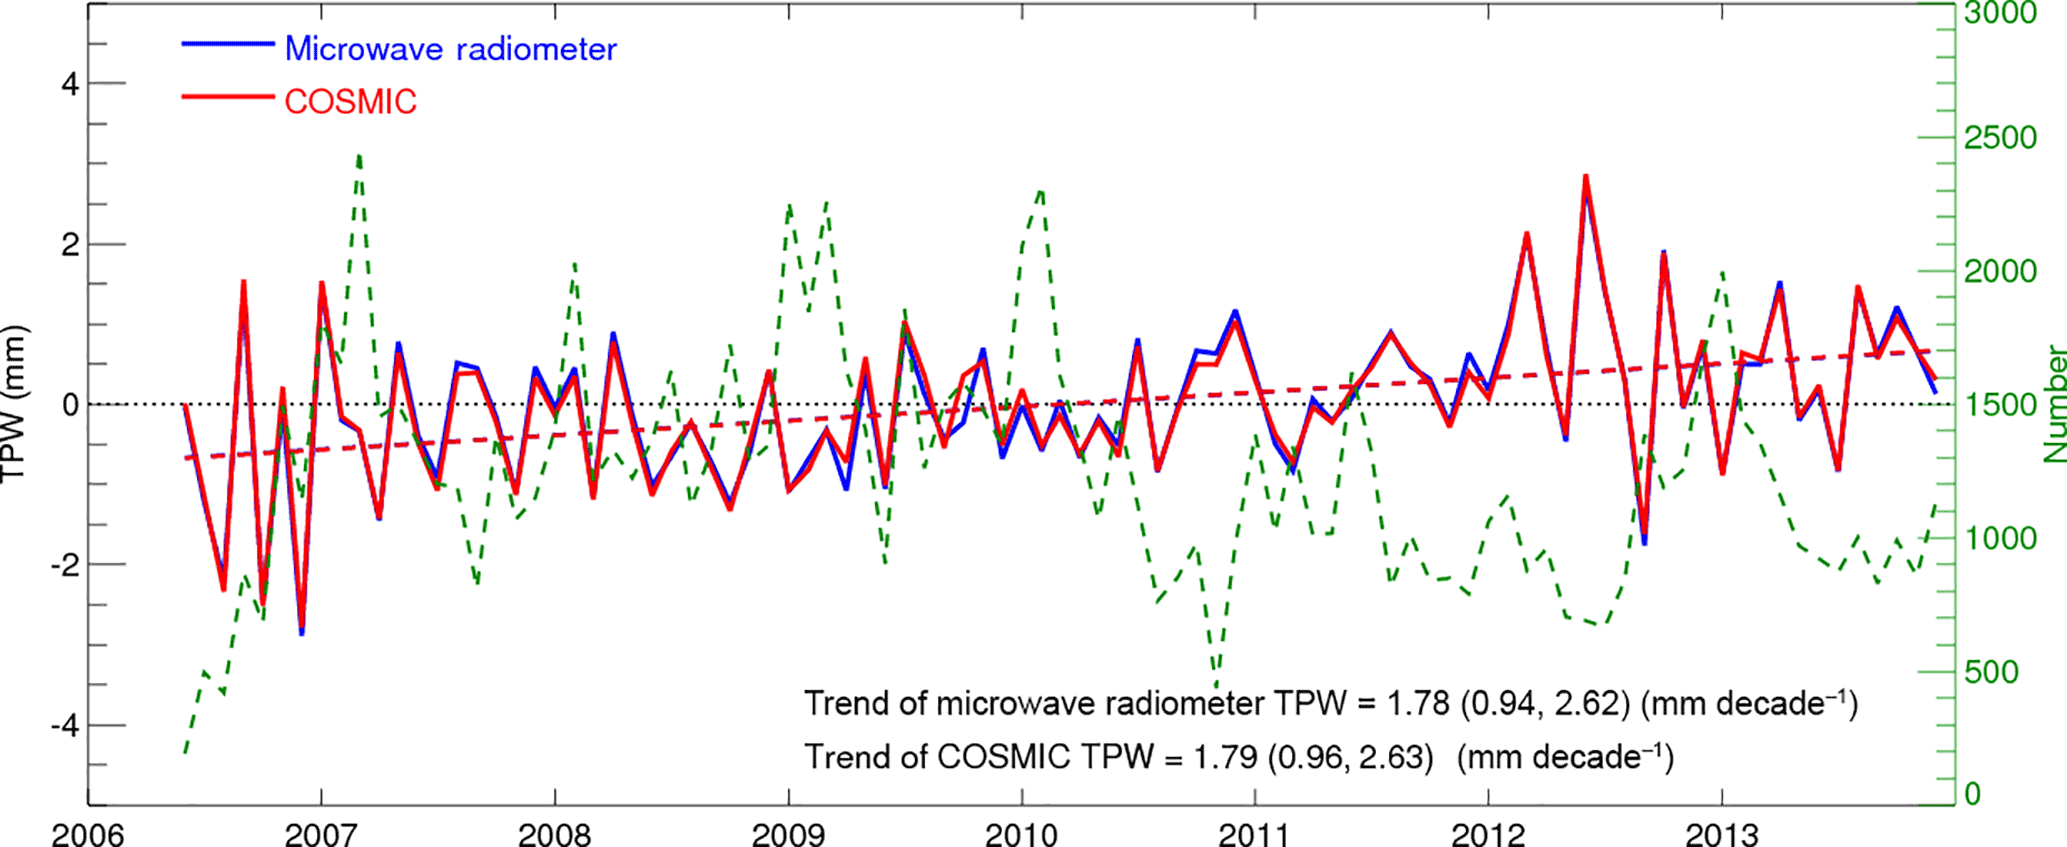
Figure 9The deseasonalized time series of monthly mean TPW for all MW and COSMIC observations under all sky conditions. The red and blue dashed lines are the best fit of deseasonalized COSMIC and MW TPW time series, respectively.
5.2 Deseasonalized trends of MW–RO TPW differences
Figure 8 depicts the deseasonalized trends of the MW–RO TPW differences for F15 (Fig. 8a), F16 (Fig. 8b), F17 (Fig. 8c), and WindSat (Fig. 8d) under cloudy skies. Except for F15, the deseasonalized trends of the MW–RO TPW differences for the MW radiometers are close to zero, indicating little change over these 8 years. The trends of the biases associated with F15, F16, F17, and WindSat under all sky conditions range from −0.09 to 0.27 mm decade−1 (details not shown).
The reason for larger standard deviations of the MW minus RO differences for F15 (Tables 2 and 3 and Fig. 8a) is very likely because the F15 data after August 2006 were corrupted by the rad-cal beacon that was turned on at this time. Adjustments were derived and applied to reduce the effects of the beacon, but the final results still show excess noise relative to uncorrupted measurements (Hilburn and Wentz, 2008). RSS does not recommend using these measurements for studies of long-term change. Thus, we consider the F15 data less reliable during the period of our study.
Figure 9 shows the deseasonalized time series of the monthly mean TPW for all MW and RO pairs under all sky conditions. The nearly 8-year trends for TPW estimated from both passive MW radiometers and active COSMIC RO sensors are positive and very similar in magnitude. The mean trend of all COSMIC RO TPW is 1.79 mm decade−1 with a 95 % confidence interval of [0.96, 2.63] mm decade−1 while the mean trend from all the MW estimates is 1.78 mm decade−1 with a 95 % confidence interval of [0.94, 2.62]. This close agreement between completely independent measurements lends credence to both estimates. The mean TPW over this period, calculated from all MW data in our data set was 26.04 mm; thus, the trend of 1.78 mm decade−1 represents a trend of approximately 6.9 % per decade for our data set.
As discussed earlier, the trend of 1.78 mm decade−1 is heavily biased toward middle latitudes (40–60∘ N and 40–65∘ S) and is not representative of a global average. In fact, it is four to six times larger than previous estimates over earlier time periods. For example, Durre et al. (2009) estimated a trend of 0.45 mm decade−1 for the Northern Hemisphere over the period 1973–2006. Trenberth et al. (2005) estimated a global trend of 0.40 ± 0.09 mm decade−1 for the period 1988 to 2001. Using SSM/I data, Wentz et al. (2007) estimated an increase of 0.354 mm decade−1 over the period 1997–2006. The 100-year trend in global climate models is variable, ranging from 0.55 to 0.72 mm decade−1 (Roman et al., 2014).
The very close agreement between RO and MW observations where they coexist gives credibility to both observing systems and allows us to use global MW data to compute global TPW trends over all oceanic regions, including where RO observations are sparse or absent. Figure 10 shows the global map of TPW trends over oceans using all F16, F17, and WindSat data from 2006 to 2013. Figure 10 shows that the positive trends in TPW occur mainly over the central and northern Pacific, south of China and west of Australia, southeast of South America, and east of America. Positive trends also exist in general over the middle latitudes (40–60∘ N and 40–65∘ S) where most of our matching RO and MW data pairs occur.
Mears et al. (2017) computed global average (60∘ S to 60∘ N) TPW using a number of data sets from 1979 to 2014. Figure 11 shows the data from the ERA-Interim reanalysis (Dee et al., 2011), RSS MW, and COSMIC. (This figure was obtained using the same data used to construct Fig. 2.16 in Mears et al., 2017). Figure 11 shows close agreement between RSS MW and COSMIC. The global mean trend from June 2006 to December 2013 from the COSMIC observations is 0.32 mm decade−1 and for RSS MW it is 0.31 mm decade−1.
Figure 10The global map of TPW trend in millimeters per decade over oceans using all F16, F17, and WindSat data from 2006 to 2013.
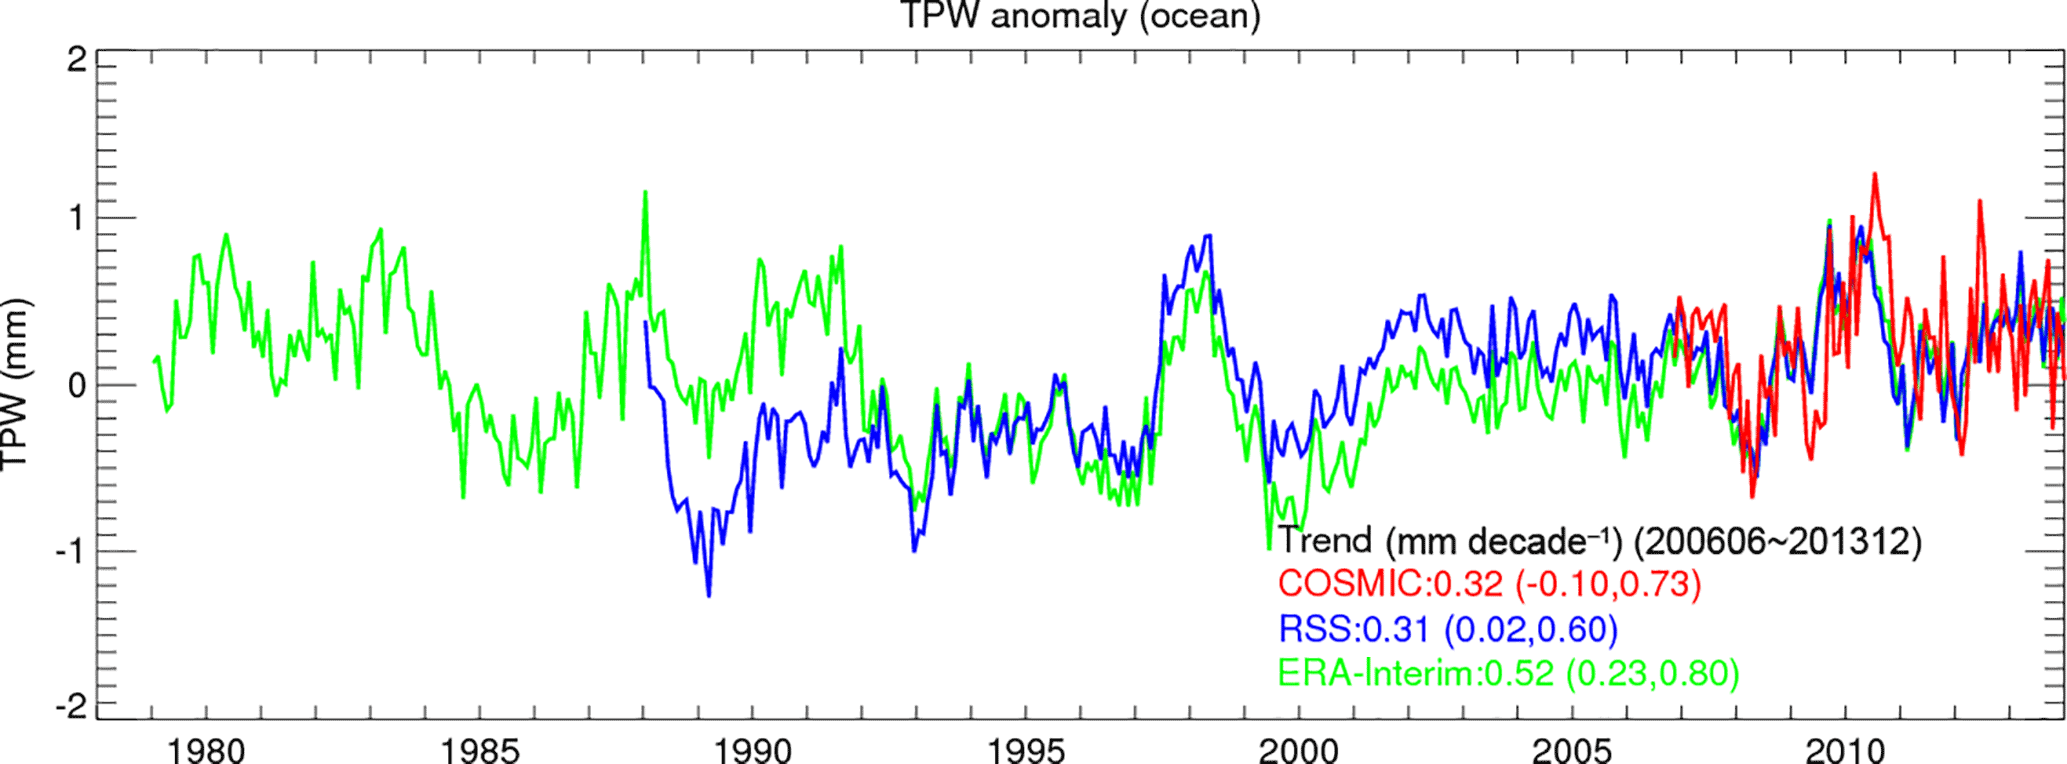
Figure 11Global mean TPW monthly anomaly (mm) relative to 1981–2010 mean for ocean regions 60∘ S–60∘ N from ERA-Interim reanalysis (green), RSS microwave (blue), and COSMIC (red). (Based on data from Mears et al., 2017).
RSS water vapor products have been widely used for climate research. The newly available RSS v7.0 data products have been processed using consistent calibration procedures (Wentz, 2013). This was done for the explicit purpose of producing versions of the data sets that can be used to study decadal-scale changes in TPW, wind, clouds, and precipitation. These water vapor products are mainly verified by comparing to reanalyses, radiosonde measurements, or other satellite data. However, because the quality of these data sets may also vary under different atmospheric conditions, the uncertainty in long-term water vapor estimates may still be large. In this study, we used TPW estimates derived from COSMIC active RO sensors to identify TPW uncertainties from four different MW radiometers under clear, cloudy, cloudy and non-precipitating, and cloudy and precipitating skies over nearly 8 years (from June 2006 to December 2013). Because RO data have low sensitivity to clouds and precipitation, RO-derived water vapor products are useful for identifying the possible TPW biases retrieved from measurements of passive microwave imagers under different sky conditions. We reach the following conclusions:
-
Clear sky biases. The collocated COSMIC RO TPW estimates under clear skies are highly consistent with the MW TPW estimates under clear sky conditions (within ±0.2 mm and with a correlation coefficient greater than 0.96). The mean TPW bias between F16 and COSMIC (F16–COSMIC) is equal to 0.03 mm with a standard deviation σ of 1.47 mm. The mean TPW differences are equal to 0.06 mm with a σ of 1.65 mm for F15, 0.07 mm with a σ of 1.47 mm for F17, and 0.18 mm with a σ of 1.35 mm for WindSat. The consistent F15–COSMIC, F16–COSMIC, F17–COSMIC, and WindSat–COSMIC TPW under clear skies show that COSMIC TPW can be used as reliable reference data to identify and correct TPW among different MW imagers for other sky conditions.
-
Biases under cloudy skies. While there are very small biases for clear pixels, there are significant positive MW TPW biases (∼ 0.80 mm) under cloudy conditions when compared to RO TPW. The large SSM/I TPW biases under cloudy skies result mainly from the pixels with precipitation. The mean bias is equal to 1.83 mm for COSMIC–F16 pairs, which is much larger than the bias for cloudy, but non-precipitating conditions. This indicates that the significant scattering and absorbing effects are present in the passive MW measurements when it rains. The F16 − gb-GPS mean biases are equal to 0.24 mm (for clear skies), 0.61 mm (for cloudy skies), 0.54 mm (for cloudy/non-precipitating skies), and 1.2 mm (for precipitating skies), which are consistent with those from F16–COSMIC comparisons.
-
Biases among different instruments. Using RO TPW estimates collocated with different MW instruments, we are able to identify possible TPW inconsistencies among MW instruments even they are not collocated. The deseasonalized trends in MW–RO TPW differences for three MW radiometers (i.e., F16, F17, and WindSat) are close to zero, indicating consistency among these radiometers. However, the F15–COSMIC differences are larger and show a significant trend over the 8 years of the study. It is likely that F15 data after August 2006 were corrupted by the rad-cal beacon that was turned on at this time.
-
Trend of TPW under all skies. The 8-year trends of TPW estimated from both passive MW radiometer and active COSMIC sensors in our data set show increasing TPW, with slightly higher trends under cloudy conditions. The mean trend of COSMIC RO TPW collocated with MW observations in our data set is 1.79 mm decade−1 with a 95 % confidence interval of [0.96, 2.63] mm decade−1. The corresponding mean trend from all the MW estimates is 1.78 mm decade−1 with a 95 % confidence interval of [0.94, 2.62]. The mean trend from all the MW estimates under cloudy conditions is 1.93 mm decade−1 with a 95 % confidence interval of [0.97, 2.89]. The mean trend from all the COSMIC RO TPW estimates under cloudy conditions is 1.82 mm decade−1 with a 95 % confidence interval of [0.88, 2.76]. These increases represent about a 6.9 % per decade increase in the mean TPW of our data set. The close agreement between completely independent measurements lends credence to both estimates.
The trends of TPW in our data set, which are heavily biased toward middle latitudes (40–60∘ N and 40–65∘ S) are higher than previous global estimates over earlier time periods by about a factor of 4 to 6. As also shown by the regional distribution of TPW trends estimated from the MW observations, the large positive trends in these latitudes, which are the main latitudes of extratropical storm tracks, are a strong confirmation of the water vapor–temperature feedback in a warming global atmosphere, particularly under cloudy conditions.
Other studies have suggested that this positive feedback results in a nearly constant global mean relative humidity (Soden and Held, 2006; Sherwood et al., 2010). However, it is difficult to directly relate our estimated TPW trends to a constant RH hypothesis of Earth's atmosphere under global warming. The global mean surface temperature has been rising at about the rate of 0.2 K decade−1 in the past 20 years. A 0.2 K increase in temperature would produce about a 1.4 % increase in saturation water vapor pressure based on the Clausius–Clapyron equation. To maintain a constant RH for this temperature increase, the actual water vapor pressure (and specific humidity) would also have to increase by 1.4 %. In this study, we observe an increase in TPW in our data set of about 1.78 mm decade−1, which is a 6.9 % increase per decade in TPW. Our data set is dominated mainly by cloudy samples over middle latitudes (40–60∘ N and 40–65∘ S). Thus, from these numbers alone we would expect an increase in mean RH under cloudy conditions by more than 6 %, which is unlikely and well outside the range of changes in relative humidity in models (e.g., Fig. 2 in Sherwood et al., 2010). However, the changes in the global mean RH are not related in such a simple fashion to changes in the global mean temperature and precipitable water. For example, Fig. 10 depicts that there are very large differences in the spatial distribution of TPW changes, which shows regional variations of ±4 mm decade−1. Thus, some regions are drying and others are moistening. The variations in global mean surface temperature are also large, but very different from those of TPW, with the polar regions and continents warming up much faster than the atmosphere over the oceans. In cold polar regions, an increase in temperature will result in a smaller increase in saturation vapor pressure than the same increase in temperature in the tropics. The global evaporation and precipitation patterns also vary greatly, as water vapor transport is important in the global water vapor balance. All of this, as discussed by Held and Soden (2000), Soden and Held (2006), and Sherwood et al. (2010) means that the relationships between global mean temperature increase, TPW changes, and the resulting change in global mean RH are not simple.
The RO data are from the COSMIC Data Analysis and Archive Center, Constellation Observing System for Meteorology, Ionosphere and Climate, University Corporation for Atmospheric Research. Atmospheric profiles are from COSMIC Occultation Data, COSMIC Data Analysis and Archive (http://cdaac-www.cosmic.ucar.edu/cdaac/products.html). The all-sky daily MW data are from Remote Sensing Systems (http://www.remss.com/missions/ssmi).
The authors declare that they have no conflict of interest.
This work is supported by the NSF CAS
AGS-1033112. We thank Eric DeWeaver (NSF) and Jack Kaye (NASA) for
sponsoring this work.
Edited by: Qiang Fu
Reviewed by: two anonymous referees
Anthes, R. A.: Exploring Earth's atmosphere with radio occultation: contributions to weather, climate and space weather, Atmos. Meas. Tech., 4, 1077–1103, https://doi.org/10.5194/amt-4-1077-2011, 2011.
Anthes, R. A., Bernhardt, P., Chen, Y., Cucurull, L., Dymond, K., Ector, D., Healy, S., Ho, S.-P., Hunt, D., Kuo, Y.-H., Liu, H., Manning, K., McCormick, C., Meehan, T., Randel, W., Rocken, C. R., Schreiner, W., Sokolovskiy, S., Syndergaard, S., Thompson, D., Trenberth, K., Wee, T.-K., and Zeng, Z.: The COSMIC/FORMOSAT-3 Mission: Early Results, B. Am. Meteorol. Soc., 89, 313–333, https://doi.org/10.1175/BAMS-89-3-313, 2008.
Biondi, R., Randel, W. J., Ho, S.-P., Neubert, T., and Syndergaard, S.: Thermal structure of intense convective clouds derived from GPS radio occultations, Atmos. Chem. Phys., 12, 5309–5318, https://doi.org/10.5194/acp-12-5309-2012, 2012.
Biondi, R., Ho, S.-P., Randel, W., Neubert, T., and Syndergaard, S.: Tropical cyclone cloud-top heights and vertical temperature structure detection using GPS radio occultation measurements, J. Geophys. Res., 118, 1–13, https://doi.org/10.1002/jgrd.50448, 2013.
Bock, O., Bosser, P., Bourcy, T., David, L., Goutail, F., Hoareau, C., Keckhut, P., Legain, D., Pazmino, A., Pelon, J., Pipis, K., Poujol, G., Sarkissian, A., Thom, C., Tournois, G., and Tzanos, D.: Accuracy assessment of water vapour measurements from in situ and remote sensing techniques during the DEMEVAP 2011 campaign at OHP, Atmos. Meas. Tech., 6, 2777–2802, https://doi.org/10.5194/amt-6-2777-2013, 2013.
Cober, S. G., Isaac, G. A., and Strapp, J. W.: Characterizations of aircraft icing environments that include supercooled large drops, J. Appl. Meteorol., 40, 1984–2002, 2001.
Dee, D. P., Uppala, S. M., Simmons, A. J., Berrisford, P., Poli, P., Kobayashi, S., Andrae, U., Balmaseda, M. A., Balsamo, G., Bauer, P., Bechtold, P., Beljaars, A. C. M., van de Berg, L., Bidlot, J., Bormann, N., Delsol, C., Dragani, R., Fuentes, M., Geer, A. J., Haimberger, L., Healy, S. B., Hersbach, H., Hólm, E. V., Isaksen, L., Kållberg, P., Köhler, M., Matricardi, M., McNally, A. P., Monge-Sanz, B. M., Morcrette, J.-J., Park, B.-K., Peubey, C., de Rosnay, P., Tavolato, C., Thepaut, J.-N., and Vitart, F.: The ERA-Interim reanalysis: configuration and performance of the data assimilation system, Q. J. Roy. Meteor. Soc., 137, 553–597, https://doi.org/10.1002/qj.828, 2011.
Durre, I., Williams Jr., C. N., Yin, X., and Vose, R. S.: Radiosonde-based trends in precipitable water over the Northern Hemisphere: An update, J. Geophys. Res., 114, D05112, https://doi.org/10.1029/2008JD010989, 2009.
Elsaesser, G. S. and Kummerow, C. D.: Towards a fully parametric retrieval of the non-raining parameters over the global ocean, J. Appl. Meteorol. Clim., 47, 1590–1598 2008.
Fetzer, E. J., Lambrigtsen, B. H., Eldering, A., Aumann, H. H., and Chahine, M. T.: Biases in total precipitable water vapor climatologies from atmospheric infrared sounder and advanced microwave scanning radiometer, J. Geophys. Res., 111, D09S16, https://doi.org/10.1029/2005JD006598, 2006.
Fetzer, E. J., Read, W. G., Waliser, D., Kahn, B. H., Tian, B., Vömel, H., Irion, F. W., Su, H., Eldering, A., Juarez, M. T., Jiang, J., and Dang, V.: Comparison of upper tropospheric water vapor observations from the Microwave Limb Sounder and Atmospheric Infrared Sounder, J. Geophys. Res., 113, D22110, https://doi.org/10.1029/2008JD010000, 2008.
Held, I. M. and Soden, B. J.: Water vapor feedback and global warming, Annu. Rev. Energ. Env., 25, 441–475, https://doi.org/10.1146/annurev.energy.25.1.441, 2000.
Heymsfield, A. J., Bansemer, A., Field, P. R., Durden, S. L., Stith, J. L., Dye, J. E., Hall, W., and Grainger, C. A.: Observations and parameterizations of particle size distributions in deep tropical cirrus and stratiform precipitating clouds: Results from in situ observations in TRMM field campaigns, J. Atmos. Sci., 59, 3457–3491, https://doi.org/10.1175/1520-0469(2002)059<3457:OAPOPS>2.0.CO;2, 2002.
Hilburn, K. A.: Including temperature effects in the F15 RADCAL Beacon correction. RSS Technical Report 051209, Remote Sensing Systems, Santa Rosa, CA, available at: http://images.remss.com/papers/rsstech/2009_051209_Hilburn_F15_RADCAL.pdf (last access: December 2012), 2009.
Hilburn, K. A. and Wentz, F. J.: Mitigating the impact of RADCAL beacon contamination on F15 SSM/I ocean retrievals, Geophys. Res. Lett., 35, L18806, https://doi.org/10.1029/2008GL034914, 2008.
Ho, S.-P., Kuo, Y.-H., and Sokolovskiy, S.: Improvement of the temperature and moisture retrievals in the lower troposphere using AIRS and GPS radio occultation measurements, J. Atmos. Ocean. Tech., 24, 1726–1739, https://doi.org/10.1175/JTECH2071.1, 2007.
Ho, S.-P., Kirchengast, G., Leroy, S., Wickert, J., Mannucci, A. J., Steiner, A. K., Hunt, D., Schreiner, W., Sokolovskiy, S., Ao, C. O., Borsche, M., von Engeln, A., Foelsche, U., Heise, S., Iijima, B., Kuo, Y.-H., Kursinski, R., Pirscher, B., Ringer, M., Rocken, C., and Schmidt, T.: Estimating the Uncertainty of using GPS Radio Occultation Data for Climate Monitoring: Inter-comparison of CHAMP Refractivity Climate Records 2002–2006 from Different Data Centers, J. Geophys. Res., 114, D23107, https://doi.org/10.1029/2009JD011969, 2009a.
Ho, S.-P., Goldberg, M., Kuo, Y.-H., Zou, C.-Z., and Schreiner, W.: Calibration of Temperature in the Lower Stratosphere from Microwave Measurements using COSMIC Radio Occultation Data: Preliminary Results, Terr. Atmos. Ocean. Sci., 20, 87–100, https://doi.org/10.3319/TAO.2007.12.06.01(F3C), 2009b.
Ho, S.-P., Kuo, Y.-H., Schreiner, W., and Zhou, X.: Using SI-traceable Global Positioning System Radio Occultation Measurements for Climate Monitoring, in: States of the Climate in 2009, B. Am. Meteorol. Sci., 91, S36–S37, 2010a.
Ho, S.-P., Zhou, X., Kuo, Y.-H., Hunt, D., and Wang, J.-H.: Global Evaluation of Radiosonde Water Vapor Systematic Biases using GPS Radio Occultation from COSMIC and ECMWF Analysis, Remote Sensing, 2, 1320–1330, 2010b.
Ho, S.-P., Hunt, D., Steiner, A. K., Mannucci, A. J., Kirchengast, G., Gleisner, H., Heise, S., von Engeln, A., Marquardt, C., Sokolovskiy, S., Schreiner, W., Scherllin-Pirscher, B., Ao, C., Wickert, J., Syndergaard, S., Lauritsen, K. B., Leroy, S., Kursinski, E. R., Kuo, Y.-H., Foelsche, U., Schmidt, T., and Gorbunov, M.: Reproducibility of GPS Radio Occultation Data for Climate Monitoring: Profile-to-Profile Inter-comparison of CHAMP Climate Records 2002 to 2008 from Six Data Centers, J. Geophys. Res., 117, D18111, https://doi.org/10.1029/2012JD017665, 2012.
Huang, C.-Y., Teng, W.-H., Ho, S.-P., and Kuo, Y.-H.: Global Variation of COSMIC Precipitable Water over Land: Comparisons with Ground-based GPS Measurements and NCEP Reanalyses, Geophys. Res. Lett., 40, 5327–5331, https://doi.org/10.1002/grl.50885, 2013.
IPCC: Climate Change 2013: The Physical Science Basis. Contribution of Working Group I to the Fifth Assessment Report of the Intergovernmental Panel on Climate Change (IPCC), edited by: Stocker, T. F., Qin, D., Plattner, G.-K., Tignor, M., Allen, S. K., Boschung, J., Nauels, A., Xia, Y., Bex, V., and Midgley, P. M., Cambridge University Press, Cambridge, UK and New York, NY, USA, 1535 pp., https://doi.org/10.1017/CBO9781107415324, 2013.
John, V. O. and Soden, B. J.: Temperature and humidity biases in global climate models and their impacts on climate feedbacks, Geophys. Res. Lett., 34, L18605, https://doi.org/10.1029/2007GL030736, 2007.
Knuteson, R., Bedka, S., Roman, J., Tobin, D., Turner, D., and Revercomb, H.: AIRS and IASI Precipitable Water Vapor (PWV) Absolute Accuracy at Tropical, Mid-Latitude, and Arctic Ground-Truth Sites. Presented at the International TOVS Study Conference, 14–10 April 2010, Monterey, CA, USA, available at: http://cimss.ssec.wisc.edu/itwg/itsc/itsc17/ (last access: November 2016), 2010.
Kursinski, E. R., Hajj, G. A., Schofield, J. T., and Linfield, R. P.: Observing Earth's atmosphere with radio occultation measurements using the Global Positioning System, J. Geophys. Res., 102, 23429–23465, 1997.
Larar, A. M., Smith, W. L., Zhou, D. K., Liu, X., Revercomb, H., Taylor, J. P., Newman, S. M., and Schlüssel, P.: IASI spectral radiance validation inter-comparisons: case study assessment from the JAIVEx field campaign, Atmos. Chem. Phys., 10, 411–430, https://doi.org/10.5194/acp-10-411-2010, 2010.
Leroy, D., Fontaine, E., Schwarzenboeck, A., Strapp, J. W., Korolev, A., McFarquhar, G., Dupuy, R., Gourbeyre, C., Lilie, L., Protat, A., Delanoë, J., Dezitter, F., and Grandin, A.: Ice crystal sizes in high ice water content clouds. Part 2: Statistics of mass diameter percentiles in tropical convection observed during the HAIC/HIWC project, J. Atmos. Ocean. Tech., 34, 117–136, https://doi.org/10.1175/JTECH-D-15-0246.1, 2017.
Lin, L., Zou, X., Anthes, R., and Kuo, Y.-H.: COSMIC GPS cloudy profiles, Mon. Weather Rev., 138, 1104–1118, 2010.
Luers, J. K. and Eskridge, R. E.: Use of radiosonde temperature data in climate studies, J. Climate, 11, 1002–1019, 1998.
Ma, Z., Kuo, Y.-H., Ralph, F. M., Neiman, P. J., Wick, G. A., Sukovich, E., and Wang, B.: Assimilation of GPS radio occultation data for an intense atmospheric river with the NCEP regional GSI system, Mon. Weather Rev., 139, 2170–2183, https://doi.org/10.1175/2011MWR3342.1, 2011.
Mears, C., Wang, J., Ho, S.-P., Zhang, L., and Zhou, X.: Global Climate Hydrological cycle, Total column water vapor, in: State of the Climate in 2011, B. Am. Meteorol. Soc., 93, S25–S26, https://doi.org/10.1175/2012BAMSStateoftheClimate.1, 2012.
Mears, C., Wang, J., Smith, D., and Wentz, F. J.: Intercomparison of total precipitable water measurements made by satellite- borne microwave radiometers and ground-based GPS instruments, J. Geophys. Res.-Atmos., 120, 2492–2504, https://doi.org/10.1002/2014JD022694, 2015.
Mears C., Ho, S.-P., Peng, L., and Wang, J.: Total Column Water Vapor, in: State of the Climate in 2016, B. Am. Meteorol. Sci., 98, S93–S98, https://doi.org/10.1175/2017BAMSStateoftheClimate.1, 2017.
Milz, M., Buehler, S. A., and John, V. O.: Comparison of AIRS and AMSU-B monthly mean estimates of upper tropopsheric humidity, Geophys. Res. Lett., 36, L10804, https://doi.org/10.1029/2008GL037068, 2009.
Neiman, P. J., Ralph, F. M., Wick, G. A., Kuo, Y.-H., Wee, T.-K., Ma, Z., Taylor, G. H., and Dettinger, M. D.: Diagnosis of an intense atmospheric river impacting the Pacific Northwest: Storm summary and offshore vertical structure observed with COSMIC satellite retrievals, Mon. Weather Rev., 136, 4398–4420, 2008.
Noël, S., Buchwitz, M., and Burrows, J. P.: First retrieval of global water vapour column amounts from SCIAMACHY measurements, Atmos. Chem. Phys., 4, 111–125, https://doi.org/10.5194/acp-4-111-2004, 2004.
Palm, M., Melsheimer, C., Noël, S., Heise, S., Notholt, J., Burrows, J., and Schrems, O.: Integrated water vapor above Ny Ålesund, Spitsbergen: a multi-sensor intercomparison, Atmos. Chem. Phys., 10, 1215–1226, https://doi.org/10.5194/acp-10-1215-2010, 2010.
Pougatchev, N., August, T., Calbet, X., Hultberg, T., Oduleye, O., Schlüssel, P., Stiller, B., Germain, K. St., and Bingham, G.: IASI temperature and water vapor retrievals – error assessment and validation, Atmos. Chem. Phys., 9, 6453–6458, https://doi.org/10.5194/acp-9-6453-2009, 2009.
Prasad, A. K. and Singh, R. P.: Validation of MODIS Terra, AIRS, NCEP/DOE AMIP-II Reanalysis-2, and AERONET Sun photometer derived integrated precipitable water vapor using ground-based GPS receivers over India, J. Geophys. Res., 114, D05107, https://doi.org/10.1029/2008JD011230, 2009.
Roman, J., Knuteson, R., and Ackerman, S.: Time-to-detect trends in precipitable water vapor with varying measurement errors, J. Climate, 27, 8259–8275, 2014.
Scherllin-Pirscher, B., Deser, C., Ho, S.-P., Chou, C., Randel, W., and Kuo, Y.-W.: The vertical and spatial structure of ENSO in the upper troposphere and lower stratosphere from GPS radio occultation measurements, Geophys. Res. Lett., 39, L20801, https://doi.org/10.1029/2012GL053071, 2012.
Schlüessel, P. and Emery, W. J.: Atmospheric water vapour over oceans from SSM/I measurements, Int. J. Remote Sens., 11, 753–766, 1990.
Sherwood, S. C., Ingram, W., Tsushima, Y., Satoh, M., Roberts, M., Vidale, P. L., and Gorman, P. A. O.: Relative humidity changes in a warmer climate, J. Geophys. Res., 115, D09104, https://doi.org/10.1029/2009JD012585, 2010.
Soden, B. J. and Held, I. M.: Assessment of climate feedbacks in coupled ocean-atmosphere models, J. Climate, 19, 3354–3360, 2006.
Soden, B. J. and Lanzante, J. R.: An assessment of satellite and radiosonde climatologies of upper-tropospheric water vapor, J. Climate, 9, 1235–1250, 1996.
Soden, B. J., Wetherald, R. T., Stenchikov, G. L., and Robock, A.: Global cooling after the eruption of Mount Pinatubo: A test of climate feedback by water vapor, Science, 296, 727–730, 2002.
Sohn, B.-J. and Bennartz, R.: Contribution of water vapor to observational estimates of longwave cloud radiative forcing, J. Geophys. Res., 113, D20107, https://doi.org/10.1029/2008JD010053, 2008.
Sohn, B. J. and Smith, E. A.: Explaining sources of discrepancy in SSM/I water vapor algorithms, J. Climate, 16, 3229–3255, https://doi.org/10.1175/1520-0442(2003)016<3229:ESODII>2.0.CO;2, 2003.
Teng, W.-H., Huang, C.-Y., Ho, S.-P., Kuo, Y.-H., and Zhou, X.-J.: Characteristics of Global Precipitable Water in ENSO Events Revealed by COSMIC Measurements, J. Geophys. Res., 118, 1–15, https://doi.org/10.1002/jgrd.50371, 2013.
Trenberth K. E. and Guillemot, C. J.: Evaluation of the atmospheric moisture and hydrological cycle in the NCEP/NCAR reanalyses, Clim. Dynam., 14, 213–231, 1998.
Trenberth, K. E., Fasullo, J., and Smith, L.: Trends and variability in column integrated atmospheric water vapor, Clim. Dynam., 24, 741–758, 2005.
Wang, J. and Zhang, L.: Systematic Errors in Global Radiosonde Precipitable Water Data from Comparisons with Ground-Based GPS Measurements, J. Climate, 21, 2218–2238, https://doi.org/10.1175/2007JCLI1944.1, 2008.
Wang, J., Zhang, L., Dai, A., Van Hove, T., and Van Baelen, J.: A near-global, 8-year, 2-hourly data set of atmospheric precipitable water from ground-based GPS measurements, J. Geophys. Res., 112, D11107, https://doi.org/10.1029/2006JD007529, 2007.
Wang, L., Wu, X., Goldberg, M., Cao, C., Li, Y., and Sohn, S.-H.: Comparison of AIRS and IASI Radiances Using GOES Imagers as Transfer Radiometers toward Climate Data Records, J. Appl. Meteorol. Clim., 49, 478–492, 2010.
Wentz, F. J.: A well-calibrated ocean algorithm for SSM/I, J. Geophys. Res., 102, 8703–8718, 1997.
Wentz, F. J.: SSM/I version-7 calibration report, Remote Sensing Systems, Tech. Rep. 011012, Santa Rosa, CA, USA, 46 pp., 2013.
Wentz, F. J.: A 17-Year climate record of environmental parameters derived from the Tropical Rainfall Measuring Mission (TRMM) microwave imager, J. Climate, 20, 6882–6902, https://doi.org/10.1175/JCLI-D-15-0155.1, 2015.
Wentz, F. J. and Schabel, M.: Precise climate monitoring using complementary satellite data sets, Nature, 403, 414–416, 2000.
Wentz, F. J. and Spencer, R. W.: SSM/I rain retrievals within a unified all-weather ocean algorithm, J. Atmos. Sci., 56, 1613–1627, 1998.
Wentz, F. J., Riccardulli, L., Hilburn, K., and Mears, C.: How much more rain will global warming bring?, Science, 317, 233–235, 2007.
Wick, G. A., Kuo, Y.-H., Ralph, F. M., Wee, T.-K., Neiman, P. J., and Ma, Z.: Intercomparison of integrated water vapor retrievals from SSM/I and COSMIC, Geophys. Res. Lett., 28, 3263–3266, 2008.
Yang, S. and Zou, X.: Assessments of cloud liquid water contributions to GPS RO refractivity using measurements from COSMIC and CloudSat, J. Geophys. Res., 117, D06219, https://doi.org/10.1029/2011JD016452, 2012.
Zeng, Z., Ho, S.-P., and Sokolovskiy, S.: The Structure and Evolution of Madden-Julian Oscillation from FORMOSAT-3/COSMIC Radio Occultation Data, J. Geophys. Res., 117, D22108, https://doi.org/10.1029/2012JD017685, 2012.
Zou, X., Yang, S., and Ray, P. S.: Impacts of ice clouds on GPS radio occultation measurements, J. Atmos. Sci., 69, 3670–3682, 2012.
- Abstract
- Introduction
- RSS version 7.0 data and COSMIC TPW data and comparison method
- Comparison of MW and RO TPW with clear skies
- Global comparisons of MW and RO TPW with cloudy skies
- An 8-year time series and trend analysis under all skies
- Conclusions and discussions
- Data availability
- Competing interests
- Acknowledgements
- References