the Creative Commons Attribution 4.0 License.
the Creative Commons Attribution 4.0 License.
A simple model for the time evolution of the condensation sink in the atmosphere for intermediate Knudsen numbers
Ekaterina Ezhova
Veli-Matti Kerminen
Kari E. J. Lehtinen
Markku Kulmala
Transformation of the mass flux towards the particle from the kinetic regime to the continuum regime is often described by the Fuchs–Sutugin coefficient. Kinetic regime can be obtained as a limiting case when only one term of the expansion of the Fuchs–Sutugin coefficient at small 1∕Kn is considered. Here we take the two first terms into account, and get a mass flux which agrees well with the full mass flux down to Kn∼0.5. This procedure allows an analytical solution of the condensation equation valid for the range of intermediate Knudsen numbers to be obtained. The expansion is further applied to analytically calculate the condensation sink. The formula for the condensation sink is tested against field observations. The relative contribution of different aerosol modes to the condensation sink is discussed. Furthermore, we present a simple model describing the coupled dynamics of the condensing vapour and the condensation sink. The model gives reasonable predictions of condensation sink dynamics during the periods of the aerosol modes' growth by condensation in the atmosphere.
- Article
(2910 KB) - Full-text XML
- BibTeX
- EndNote
The condensation sink (CS) is an important parameter for aerosol dynamics quantifying the rate of vapour condensation onto an existing aerosol population. The inverse of the CS has a clear physical meaning – being the characteristic timescale for vapours to condense onto the surface of existing aerosol. Due to the similarity between the processes of vapour condensation on aerosol particles, and coagulation of the smallest particles (monomers, dimers, and clusters) with the larger particles from Aitken and accommodation modes, the CS proves useful for the quantification of a coagulation sink (Lehtinen et al., 2007). Therefore, competition between the process of small clusters coagulating with the larger aerosol particles, represented by the CS, and the process of the clusters growth by condensation, represented by the particle growth rate, defines the probability of clusters' survival and a new particle formation event (Kulmala et al., 2017). A detailed comparative analysis of physical processes in the atmosphere based on the characteristic timescales was performed by Kerminen et al. (2004).
The average CS on new particle formation event days is generally lower than that on nonevent days (Asmi et al., 2011; Birmili et al., 2003; Hyvönen et al., 2005; Kanawade et al., 2014; Kulmala et al., 2001; Pikridas et al., 2012; Qi et al., 2015; Vana et al., 2016; Wu et al., 2007; Young et al., 2013). Indeed, a large CS means that a relatively large surface of aerosol is available for condensation and coagulation, with clusters serving as precursors of newly forming particles. However, in highly polluted places such as megacities, new particle formation events occur even for large CSs (Wu et al., 2007; Xiao et al., 2015). The dynamics of a CS is tightly connected with different atmospheric processes, including the effects of atmospheric chemistry, meteorology and solar radiation. A simple model allowing one to describe the dynamics of a condensation sink in the atmosphere could thus be helpful for understanding new particle burst and cut-off processes. Here we develop a basis for such a model.
For describing aerosol dynamics, we choose a modal approach. This approach treats the whole aerosol population as a sum of modes, and the equations for the first-order moments of the particle size distribution are obtained based on the aerosol general dynamics equation. The number concentration, geometric mean diameter and standard deviation of each mode can be calculated from the moments (Whitby and McMurry, 1997). If a particular type of particle size distribution is assumed (usually lognormal), a closed system of equations for the moments can be obtained. This method is not too computationally expensive, and is also quite accurate (Whitby and McMurry, 1997). A “pseudomodal” approach has additionally been used to develop fast and efficient aerosol microphysics modules for large-scale atmospheric modelling purposes (Aquila et al., 2011; Liu et al., 2016; Mann et al., 2010; Pringle et al., 2010; Stier et al., 2005; Vignati et al., 2004; Zhang et al., 2012).
Instead of using the full general dynamics equation in this paper, we focus on one physical process – aerosol growth by condensation – because of its importance for atmospheric aerosol. The model developed is then tested against atmospheric observations from a remote site in Hyytiälä (Finland), which represents semi-clean boreal forest in the Northern Hemisphere. Typically one can identify two or three modes with characteristic diameters less than 200 nm at this site (dal Maso et al., 2008). Both day and night aerosol population behaviour clearly demonstrate patterns typical for condensational growth. Another important physical process, coagulation, while a potentially important sink for growing clusters and nanoparticles, has little effect on particle growth rate unless the number concentration of the growing particle populations is very high (Kerminen et al., 2004).
Aerosol growth by condensation has been extensively investigated theoretically (Kulmala, 1993; Park and Lee, 2000; Vesala et al., 1997). Besides the simple formulations for the rates of growth involving different physical phenomena at different scales (Barrett and Clement, 1988), there are models describing the coupled dynamics of vapour concentration and aerosol distribution applied to the processes in the atmosphere (Clement et al., 2001) and aerosol chambers (Barrett et al., 1992; Stock, 1987; Wu and Biswas, 1998). Most of these models, however, are still quite complicated.
The novelty of the present work is that we obtain analytical formulas for the CS and its time evolution in the range of intermediate Knudsen numbers typical for atmospheric applications. Two regular approaches, which can be found in the literature, either involve extensive calculations starting with Boltzmann equations (Kosuge et al., 2010) or employ matching functions (Barrett and Clement, 1988), giving the correct expressions in the molecular and continuum limits and “something in between” in the transitional regime (unless the full Fuchs–Sutugin (FS) coefficient is applied, making further analysis possible only by numerical methods). Park and Lee (2000) showed that the latter method (harmonic mean) resulted in a mass flux quite similar to that obtained with the full FS coefficient (Fuchs and Sutugin, 1971). They obtained an analytical solution of the condensation equation valid for the whole range of diameters. However, this solution is quite complicated and can not be integrated to get an analytical expression for CS. Here we proceed using the first two terms of the expansion of the Fuchs–Sutugin coefficient in terms of 1∕Kn for small 1∕Kn. As mentioned later in this paper, this makes it possible to find analytical formulas for the evolution of the particle size distribution and CS for the intermediate range of Knudsen numbers, while remaining close to quantities calculated using the original FS coefficient. The expansion is in agreement with the full formula for particle diameters up to ∼450 nm, i.e. for Aitken mode and almost the whole range of sizes typical for the accumulation mode, not only in remote places like typical boreal forests (Hyytiälä, Finland), but also in megacities, (e.g. Beijing in China) (Liu et al., 2017).
Analysis of the timescales typical for the dynamics of CS and vapour concentration in the atmosphere, allows one to use a quasi-stationary approach for the vapour concentration. It also allows one to develop a simple model describing the coupled dynamics of the CS and the condensing vapour in the atmosphere, during the periods of aerosol growth by condensation inherent in the atmosphere.
2.1 The kinetic regime vs. the intermediate regime
The equation describing the growth of the aerosol population by condensation is
Here is the particle number distribution (N is the particle number concentration), t is time, dp is the diameter of a particle and Id is the growth rate. The growth rate can be written as follows (Seinfeld and Pandis, 2016):
where α is the mass accommodation coefficient of the condensing vapour, MA is its molar mass, vc is the mean speed of the vapour molecules, p(t)−peq is the difference between the vapour pressure far from the particle and the equilibrium vapour pressure (generally time-dependent), ρp is the particle density, R is the universal gas constant and T is temperature. The FS coefficient, β, is generally used to correct the mass flux towards a particle in the continuum regime in order to get a smooth transition of the mass flux from the continuum to the kinetic regime. For the purpose of this study, it was convenient to introduce a modified FS coefficient, β1, which corrected for the mass flux in the kinetic regime and provided a smooth transition of the mass flux in the kinetic regime to that in the continuum regime:
Here the Knudsen number is , where λ is the free mean path of condensing molecules. The solutions of the condensation equation have been extensively investigated (Clement, 1978) and the method of characteristics has proven to be a useful tool.
In the kinetic regime Kn≫1, β1=1, thus Id does not depend on the particle diameter. The solution of Eq. (1) in the kinetic regime, obtained with the method of characteristics, is
where and nd0 is the distribution of particles at initial time (t=0). If the mode is initially lognormal with geometric mean diameter of dp0, this solution prescribes the growth of the characteristic diameter of the distribution linearly in time without any change in the shape of the distribution.
In the next order in (1∕Kn), one obtains from (3)
This function is shown in Fig. 1 together with the full FS coefficient and the kinetic regime approximation, β1=1. Formula (5) shows a good correspondence with the full formula (3) down to Kn≈0.5, with the overestimation of the mass flux towards the particles no more than 8 %. As Eq. (5) is obtained from the kinetic regime formula by accounting for of the term of the next order of smallness, we refer to it further as “correction”. In this case the growth rate is not constant but depends on the particle diameter:
which means that larger particles grow slower than smaller particles. This difference leads to the narrowing of the initial distribution with time.
One can introduce a limiting diameter as , which corresponds to a zero mass flux towards the particle. Note that for the accommodation coefficient α=1 the limiting diameter is in the order of 7λ and Kn≈0.28, which is beyond the range of Kn≳0.5, where the correction can be applied. Thus, the diameters corresponding to a non-physical zero mass flux will not be considered in the framework of the present model.
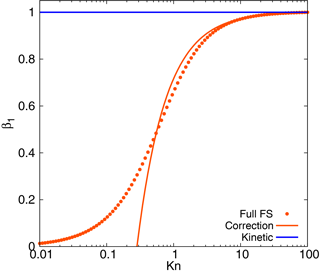
Figure 1Fuchs–Sutugin coefficient as compared to its one-term (kinetic) and two-term (correction) expansions at small 1∕Kn.
The solution of the condensation equation obtained with the method of characteristics for intermediate Knudsen numbers is
The solutions of the condensation Eqs. (4) and (7) can be simplified for the constant pressure difference. The growth rate can be written as follows:
and the solution in the kinetic regime is
while applying the correction leads to the solution
We next compare the kinetic limit solution and the “corrected” solution for the constant growth rate of the particles nm h−1, typical for a continental boundary layer during summertime (Yli-Juuti et al., 2011), taking the initial lognormal particle number distribution:
The mean free path for the molecules of sulfuric acid, which can be considered as a typical low-volatility condensing vapour, is λ≈120 nm. Taking the accommodation coefficient as α=1, the geometric mean diameter at t=0 s as dp0=20 nm, particle number concentration as N0=2000 cm−3 and σ0=1.5, we obtain the solutions in Fig. 2. As previously mentioned, the correction leads to a decrease in the growth rate compared to the kinetic regime, and the distribution shape changes in time if the correction is applied. Note that the solution obtained by numerically employing the full FS coefficient (shown with symbols in Fig. 2) is in close agreement with that given by Eq. (10).
2.2 Condensation sink
In this Subsection we apply the correction to obtain analytical formulas for the CS. The CS reflects the ability of vapours to condense on the aerosol particles, and can be calculated from the formula (Kulmala et al., 2001):
where Dv is the diffusion coefficient of the condensing vapour and .
Assuming that the dynamics of an aerosol mode are described by solution (9) and taking the initial lognormal distribution (11), in the kinetic regime the integration of Eq. (12) yields
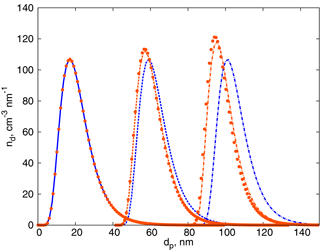
Figure 2Time evolution of the lognormal aerosol distribution: blue – solution (9), the kinetic regime; orange – solution (10), the solution for intermediate Kn. Solid curves – initial distribution; dashed curves – after 6 h; dash-dotted curves – after 12 h. Orange symbols display the numerical solution of the condensation equation employing the full FS coefficient.
It can be seen that the CS grows in time as t2, which is not surprising given that the CS is proportional to the surface area available for condensation (i.e. the total surface area of the aerosol population), and the diameter of each particle grows linearly in time.
Accounting for the correction valid for intermediate Knudsen numbers gives . Thus, taking the initial lognormal distribution (11) and integrating formula (12) in view of solution (10), we obtain the CS evolution in time:
where , . Note that one can easily obtain the formulas for the CS similar to Eqs. (13) and (14) if the vapour pressure varies in time, using the substitution .
If the parameters of the aerosol population do not depend on time, CS in the kinetic regime can be calculated as follows:
The analogous formula defining CS for the intermediate Knudsen numbers is
Note that the term in brackets is similar to the limiting diameter in the formula for the growth rate (6), but also includes the width of the distribution. Clearly, the CS should not be zero and the largest particles in the distribution, making a significant contribution to the CS, should have Knudsen numbers larger than 0.5 as not to introduce errors.
In order to demonstrate the influence of correction (5) on CS, we compare the sinks calculated using formulas (15) and (16). Here we investigate the difference between the kinetic regime and correction, while the difference between the correction and the full FS formula for CS will be addressed in the next section. The ratio of CSs, , as a function of Knudsen number (based on the geometric mean diameter of the distribution) and σ0 is displayed in Fig. 3. The difference between β0 and β1 in Fig. 1 is no more than 40 %. Given that the coefficient β appears in the integral (12), the range of parameters corresponding to should be disregarded. This range, as can be seen from Fig. 3, includes small Knudsen numbers and large σ0 (i.e. wide distributions with large geometric mean diameters. Obviously, for this range of parameters a part of the distribution is beyond the limits of the correction applicability).
Formulas (15) and (16) can be used in quasi-stationary conditions when the aerosol distribution at every time moment can be approximated by the lognormal one and parameters defining the distribution, dp0, σ0 and N0, change slowly in time (as discussed later, the typical timescale of the system relaxation to the equilibrium is expected to be no more than 20 min, hence, the timescale in the order of hours or a diurnal scale can be used to define slow change in this context). Moreover, CS for several modes can be calculated as a sum of the CSs for each of the modes. Note also that the formulas obtained in this section are valid for the majority of atmospheric conditions, unless the coagulation process is important and the coagulation term has to be added in the general dynamics equation (for example, in highly polluted areas). We use formula (16) for testing the theory against the atmospheric measurements in the next section.
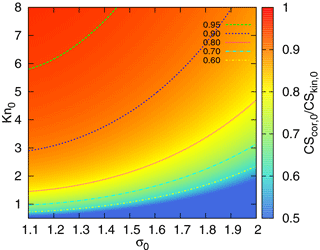
Figure 3The ratio as a function of σ0 (characterizing the width of the particle number distribution) and the Knudsen number Kn0 (corresponding to the geometric mean diameter of the mode).
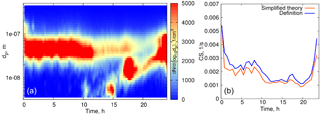
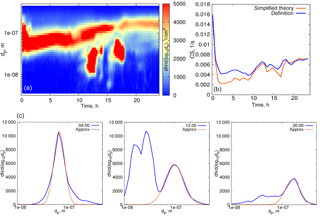
Figure 4(a) Particle number distribution on 27 March 2014, Hyytiälä. (b) Time evolution of the condensation sink below 500 nm. Blue curve: calculated from the definition, orange: calculated using formula (16).
We first evaluate formula (16) using experimental data for quasi-stationary conditions or weakly growing modes (see examples in Figs. 4, 5). The experimental data used for analysis in this section are from the University of Helsinki SMEAR II station (Hari and Kulmala, 2005). Figure 4 shows the particle size distribution in Hyytiälä on 27 March 2014. From 00:30 to 07:00, local time, the aerosol mode remains almost unchanged, with the parameters weakly fluctuating around their mean values, and we refer to these conditions as quasi-stationary. During the daytime, there were two growing modes, but we use the same formula (16) and account only for the mode with the larger characteristic diameter. As a second example, we consider the particle size distribution in Hyytiälä on 1 June 2008 (Fig. 5), again using formula (16) for one mode with larger particles.
To calculate the CS from Eq. (16), we fitted the measured particle size distribution dN∕d(log10dp) at different times by the lognormal distribution,
The parameters N0, σ0 and dp0 were obtained using the nonlinear least-squares Marquardt–Levenberg algorithm implemented in Gnuplot (Williams and Kelley, 2013).
The parameters of the particle size distributions on 27 March 2014 and 1 June 2008 are summarized in Table 1, and the examples of experimental data fitting by the function (17) are shown in the lower panel of Fig. 5.
The performance of the analytical formula (16) is demonstrated in Figs. 4b and 5b. The deviation of the theoretically calculated CS from the CS obtained from experimental data using the full FS coefficient is larger when the tails corresponding to the larger particles are not captured, while smaller particles seem to not be important. These examples illustrate the importance of the largest particles' contribution to the CS (Lehtinen et al., 2003).
We next aim to separate the errors introduced by the unsatisfactory approximation of the particle number distribution and usage of Eq. (5) instead of the full FS formula. For this we consider the fits of experimental data by the lognormal distribution and calculate the CSs: (1) using the full FS coefficient, and (2) using approximations of the FS coefficient in the kinetic and intermediate regimes. Figure 6 shows the CS for several days in Hyytiälä in spring and summer, calculated from formulas (15) and (16), versus the full CS, calculated from Eq. (12). The correction results in a 5.5 % increase in the CS, which is consistent with the increase in the mass flux from 0 to 8 % as compared to the full FS formula (Fig. 1). At the same time, the kinetic regime formula leads to overestimates of up to 20–25 % for larger values of CS. Note that the Knudsen numbers corresponding to the geometric mean diameters of the modes used for calculations are Kn≥2.5, and the largest particles taken into account (dp=500 nm) have Kn≈0.5; hence the correction should perform well, as seen in Fig. 1. Thus, we can conclude that the large difference between the theoretical and experimental CSs in Fig. 5 reflects the error due to approximating the measured particle number size distribution with a lognormal distribution.
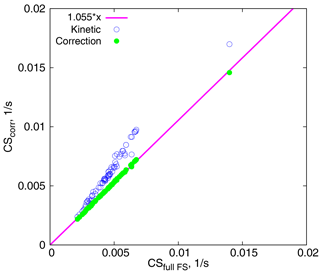
Figure 6CSs calculated using two approximations vs. CSs calculated using the full FS formula. The magenta line corresponds to .
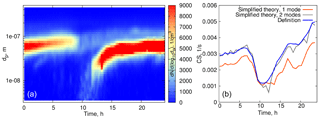
Overall, when considering the size range < 500 nm, the CS calculated using formula (16) underestimates the CS obtained directly from measurements by 10–15 % (on average), and even more when the particle number distribution corresponding to larger particles is not captured well (see Fig 4b, at 00:30–02:00 when the aerosol mode characterized by low number concentration but large particle diameters sporadically appears; in the left panel this mode is almost not visible due to the non-logarithmic scale of the particle number distribution contour map). This is to emphasize that one mode is not always good enough for a robust representation of the CS, even when the mode seems to be clearly prevailing. Figure 7 displays an example of such a day. The orange curve in Fig. 7 corresponds to the theoretical calculations with one mode having the largest number concentration, while the blue curve shows the CS calculated for the two modes (as a sum, based on the approximation of experimental data by two modes). Clearly, both modes have to be accounted for in this case.
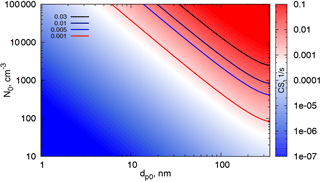
One can obtain an estimate of the contribution of different modes to the CS using the parameter map in Fig. 8. This map shows CS calculated using formula (16) as a function of dp0 and N0 for a fixed σ0=1.5. Typical Hyytiälä parameters in spring and summer give CS values between 0.001 and 0.01 s−1 (Dada et al., 2017). Modes with relatively small number concentrations (∼100 cm−3) and large characteristic diameters are likely to contribute significantly to the CS, and the discrepancy between the measured and theoretically calculated CS for one mode is usually due to not accounting for these large particles. At the same time, the concentrations of the smallest particles (∼2–3 nm) in the cluster mode can be very high in the atmosphere during nucleation events, (up to 10 000 cm−3 in Hyytiälä), yet they contribute little to the CS until they grow to sufficiently large diameters (∼20 nm). Even when the particle number concentrations in the cluster mode (2–3 nm) are as high as 105 cm−3 (Kontkanen et al., 2017), their contribution to the typical atmospheric condensation sinks is negligibly small. Note that the maximum characteristic diameter shown here is 350 nm. This is due to the fact that our formula is valid for particle diameters up to 450–500 nm. Thus, we are not able to draw conclusions about the contributions of the supermicron modes based on the present theory.
A coupled model of aerosol mode growing by condensation includes two equations.
-
Equation of condensation:
-
Equation describing the time evolution of the vapour concentration:
where C is the vapour concentration, Ceq is the equilibrium vapour concentration and Q(t) is the rate of vapour production.
The system is coupled in a sense, in that the equation for the particle number distribution includes the dependence on the vapour concentration through the growth rate as and at the same time the equation for the vapour concentration contains the term with the CS, proportional to the integral of the number particle distribution. This feature makes it difficult to solve Eqs. (18) and (19) simultaneously. However, as we have previously shown (Sect. 2), for intermediate Knudsen numbers Kn≤0.5 Eq. (18) can be integrated, and, assuming a lognormal distribution, an analytical formula for the evolution of the CS can be readily obtained, even in the case of vapour concentration changing over time.
In the following we consider, for simplicity, non-volatile vapours with Ceq=0. We proceed to show that Eq. (19) can also be significantly simplified for the typical atmospheric values of CS. The lowest values of CS in Hyytiälä in spring and summer are around 0.001 s−1 (Dada et al., 2017), corresponding to the timescale min. Generally, however, values of CS are higher and the corresponding timescales are shorter than 17 min (∼5 min for Hyytiälä). At the same time, both CS and vapour concentration typically change over timescales considerably longer than 5–17 min (Kontkanen et al., 2016; Petäjä et al., 2009). This means that the solution of Eq. (19) relaxes quickly (with a timescale 1∕CS) to the quasi-stationary regime, with
This formula is often used to get the proxies for vapour concentrations (Petäjä et al., 2009), and a similar expression, with corrections due to the time evolution of Q(t) and CS(t), was used by Clement et al. (2001) for the analysis of the particle formation processes in Hyytiälä.
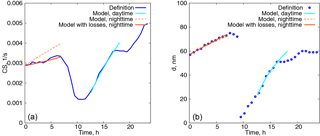
Figure 9(a) Time evolution of the condensation sink. Blue curve: calculated from the definition, orange dashed curve: modelled with the constant particle number concentration, orange solid curve: modelled with the decreasing particle number concentration, cyan curve: modelled with the constant particle number concentration, daytime. (b) Characteristic diameter of the aerosol mode with a larger number concentration as a function of time.
Thus, the system of two differential equations can be reduced to a relatively simple system of two algebraic equations:
-
Equation (14), describing the CS evolution for the intermediate Knudsen numbers (or Eq. 13 in the kinetic regime) using the substitution .
-
Equation (20) for the vapour concentration.
Self-consistent dynamics of the system can be obtained from the simple iterations of Eqs. (14) and (20). Practically, one can set up an initial growth rate, and then calculate the increase in CS using Eq. (14) during a short period of time, δt∼6–10 min. The vapour concentration can then be found using Eq. (20) for the new CS, , at the next time step. The growth rate at this time step can be found as . If the production rate of condensing vapour is a function of time, then . Then, at the next time step, the increase in the CS is calculated again from Eq. (14) with the new growth rate, and Eq. (20) is applied to calculate a new vapour concentration. This procedure repeats continuously to get the time evolution of CS and C.
This procedure can be readily extended for the two aerosol modes if the CS is taken as the sum of the CSs calculated for each of the modes. The results of the model calculations with two modes are shown in Fig. 9 for one day in Hyytiälä (24 July 2008). On this day, two periods of condensational growth can be identified in Fig. 7, one during nighttime (from 00:00 to 07:00) and another during daytime (from 12:00 to 18:00). We would like to emphasize that we consider the conditions close to ideal from the point of view of aerosol growth due to condensation for the purpose of illustrating how the coupled model works. Therefore, we deliberately chose a day when growth due to condensation occurred continuously without interruption. The measurements were conducted under a clear sky and within the same air mass.
The only free parameter in the system is the initial growth rate, taken to be 2.6 nm h−1 for the night, and 12 nm h−1 for the daytime. The time step was δ=6 min and the initial parameters for the aerosol modes were taken from the approximation of the experimental data with a lognormal distribution (nighttime: N01=3130 cm−3, dp01=57 nm, σ01=1.32, N02=165 cm−3, dp02=154 nm, σ02=1.24; daytime: N01=3365 cm−3, dp01=25 nm, σ01=1.54, N02=520 cm−3, dp02=93 nm, σ02=1.31).
Even such a simple model gives quite reasonable predictions of the time evolution of CS for the time characterized by continuous growth of aerosol due to condensation. At nighttime the predicted values of the CS are higher, but from Fig. 7 it follows that the concentration of the particles decreases, which is something that we do not capture with the model in its present form. However, the model performs well for the characteristic diameter of the growing mode with the larger number concentration. During the daytime both the evolution of CS and the diameter of the growing mode are predicted well, assuming a constant value of Q(t), but this assumption can not capture the abrupt stop of the growth of the CS in the evening.
Next, we account for the decrease in the particle number concentration during the nighttime in the simplest way, by assuming . This decay can be associated with an additional term on the right-hand side. of Eq. (18):
and the solutions (9) and (10) have the same form except that they are multiplied by the factor . It follows then, from formula (12), that the CSs are again given by the formulas (13) and (14) simply multiplied by this factor. The results of the model calculations accounting for losses are displayed in Fig. 9 by dotted curves. Here the number concentration of particles in the mode 1 (with a larger number concentration but smaller characteristic diameter) is reduced by 35 % and τloss=7 h. These estimates were obtained from experimental data by best fitting the number concentration with an exponentially decaying function. From Fig. 9, the particle diameter evolution is affected very little by losses while the CS grows significantly slower and better concurs with the measurements.
The previous example illustrates that the growth due to condensation in the atmosphere can be captured by the model. Generally, aerosol modes do not exhibit these well-pronounced continuous dynamics, with the growth process rather often being interrupted due to either the changing air mass, precipitation or some other variable, which must be well understood and parameterized before these factors can be incorporated into the model. However, within the period where the meteorological conditions are more or less stable and low-volatility organic vapours are supplied, aerosol grows due to condensation and our model can be applied.
Finally, we comment on the choice of the initial diameter of the mode 20 nm (daytime). For small particle diameters, the equation for the number particle distribution should most likely include a diffusion term to account for the widening of the distribution. Starting from the smallest diameters we would end up with a non-physical narrow distribution as a result of time evolution (Lehtinen and Kulmala, 2003). Note that in the present calculations the distribution is narrowing (Fig. 2) though in nature, it is quite the opposite. The precise form of a distribution however, does not seem to be important for the CS evolution.
We have obtained a solution for the condensation equation in the range of intermediate Knudsen numbers (for particles with diameters up to ∼500 nm). The solution is based on taking two terms of the expansion for the Fuchs–Sutugin coefficient in terms of (1∕Kn) at large Kn, and is valid both for the constant vapour pressure and (with small modifications) for the vapour pressure changing in time.
Based on this solution, we obtained the algebraic formulas describing the dynamics of the CS over time, assuming an initial lognormal particle number–size distribution. We tested the formulas against atmospheric observations for quasi-stationary conditions. For the typical parameters of aerosol modes in Hyytiälä (Finland), the correction resulted in a 5.5 % overestimation of the CS compared with the calculations using the full Fuchs–Sutugin formula. There is also an overall error due to the approximation of the data with a lognormal distribution, which varied and could be up to 50 % when the tail of the distribution corresponding to larger particles was not captured well. This error, however, did not exceed 15 % when two aerosol modes were considered.
We confirm the previous results by Lehtinen et al. (2003) that a CS is defined mostly by Aitken and accumulation modes with characteristic diameters ≥50 nm and show a diagram (Fig. 8) allowing one to estimate the contribution of different modes to the CS, depending on the characteristic diameter of the mode and particle number concentration. We conclude, that for typical atmospheric conditions the cluster mode with the characteristic diameter of approximately 2–3 nm and a large number concentration of about 10 000 cm−3 does not contribute significantly to CS until its geometric mean diameter grows to ≥20 nm.
Note that the difference between the CS in the kinetic regime and the CS in the intermediate regime can be estimated from Fig. 3. The CS in the kinetic regime is proportional to the total surface of aerosol per unit volume. This same quantity appears in the extinction coefficient quantifying aerosol optical depth (Sundström et al., 2015). Thus, one can deduce what parameters CS is suitable for, to represent aerosol impact on solar irradiance. From Fig. 3 it follows that a σ0=1.5, CS can be used as a proxy for an extinction coefficient, if an aerosol mode has a geometric mean diameter less than ∼120 nm (). Note that these parameters are typical for Hyytiälä, where a strong correlation between CS and the extinction coefficient at 550 nm has been demonstrated (Virkkula et al., 2011). This is important to keep in mind when choosing parameters for the quantification of biosphere–atmosphere feedback loops.
The differential equation for the vapour concentration was coupled with the equation for the evolution of the particle number distribution to obtain a simple self-consistent model of CS dynamics in the atmosphere. For typical atmospheric values of the CS, one can use a quasi-steady state solution for the equation for the vapour concentration, in addition to the analytical formula for CS. This model gives reasonable results for the dynamics of CSs during the periods of pronounced aerosol growth by condensation for the characteristic diameters of the mode ≥20 nm.
Note that in the framework of this model the characteristic diameter of each mode is permanently growing. In nature, in the case we considered, the diameter growth is likely to be interrupted by processes related to meteorology (e.g. morning and evening transitions in the boundary layer).
The model can be extended to investigate the dynamics of a cluster/nucleation mode with a characteristic diameter of a few nanometres in the presence of a base mode and a time-dependent vapour concentration. As we showed, these modes will only have a negligibly small effect on the coupled dynamics of the base mode and condensing vapours while the base mode will define the condensation sink for the smallest particles. The simplest way to include the cluster/nucleation mode is to add a general dynamic equation with a nucleation term and a diffusion term into the system considered here (Seinfeld and Pandis, 2016). For larger particles, the time-dependent vapour production rate and a particle–phase chemistry effect may be relevant for future investigations.
Data measured at the SMEAR II station (University of Helsinki) are available on the following website: http://avaa.tdata.fi/web/smart/ (AVAA, 2017). The data are licensed under a Creative Commons 4.0 Attribution (CC BY).
The authors declare that they have no conflict of interest.
This work was supported by the Academy of Finland Centre of Excellence
Programme (grant no. 307331) and the Academy of Finland professor grant awarded to Markku Kulmala
(no. 302958). The results obtained are part of a project (ATM-GTP/ERC), which has
received funding from the European Research Council (ERC), under the European
Union's Horizon 2020 research and innovation programme (grant agreement no. 742206).
Edited by: Chak K. Chan
Reviewed by: two anonymous referees
Aquila, V., Hendricks, J., Lauer, A., Riemer, N., Vogel, H., Baumgardner, D., Minikin, A., Petzold, A., Schwarz, J. P., Spackman, J. R., Weinzierl, B., Righi, M., and Dall'Amico, M.: MADE-in: a new aerosol microphysics submodel for global simulation of insoluble particles and their mixing state, Geosci. Model Dev., 4, 325–355, https://doi.org/10.5194/gmd-4-325-2011, 2011. a
Asmi, E., Kivekäs, N., Kerminen, V.-M., Komppula, M., Hyvärinen, A.-P., Hatakka, J., Viisanen, Y., and Lihavainen, H.: Secondary new particle formation in Northern Finland Pallas site between the years 2000 and 2010, Atmos. Chem. Phys., 11, 12959–12972, https://doi.org/10.5194/acp-11-12959-2011, 2011. a
AVAA: AVAA SmartSMEAR, available at: http://avaa.tdata.fi/web/smart/, last access: 1 March 2017. a
Barrett, J. C. and Clement, C. F.: Growth rates for liquid drops, J. Aerosol Sci., 19, 223–242, 1988. a, b
Barrett, J. C., Clement, C. F., and Ford, I. J.: The effect of redistribution on aerosol removal rates, J. Aerosol Sci., 23, 639–656, 1992. a
Birmili, W., Berresheim, H., Plass-Dülmer, C., Elste, T., Gilge, S., Wiedensohler, A., and Uhrner, U.: The Hohenpeissenberg aerosol formation experiment (HAFEX): a long-term study including size-resolved aerosol, H2SO4, OH, and monoterpenes measurements, Atmos. Chem. Phys., 3, 361–376, https://doi.org/10.5194/acp-3-361-2003, 2003. a
Clement, C. F.: Solutions of the continuity equation, P. Roy. Soc. A-Math. Phy., 364, 107–119, 1978. a
Clement, C. F., Pirjola, L., dal Maso, M., Mäkelä, J. M., and Kulmala, M.: Analysis of particle formation bursts observed in Finland, Aerosol Science, 32, 217–236, 2001. a, b
Dada, L., Paasonen, P., Nieminen, T., Buenrostro Mazon, S., Kontkanen, J., Peräkylä, O., Lehtipalo, K., Hussein, T., Petäjä, T., Kerminen, V.-M., Bäck, J., and Kulmala, M.: Long-term analysis of clear-sky new particle formation events and nonevents in Hyytiälä, Atmos. Chem. Phys., 17, 6227–6241, https://doi.org/10.5194/acp-17-6227-2017, 2017. a, b
dal Maso, M., Hyvärinen, A., Komppula, M., Tunved, P., Kerminen, V.-M., Lihavainen, H., Viisanen, Y., Hansson, H.-C., and Kulmala, M.: Annual and interannual variation in boreal forest aerosol particle number and volume concentration and their connection to particle formation, Tellus, 60, 495–508, 2008. a
Fuchs, N. A. and Sutugin, A. G.: Highly dispersed aerosol, in: Topics in current aerosol research, 1–70, Pergamon, New York, USA, 1971. a
Hari, P. and Kulmala, M.: Station for measuring ecosystem-atmosphere relations, Boreal Environ. Res., 10, 315–322, 2005. a
Hyvönen, S., Junninen, H., Laakso, L., Dal Maso, M., Grönholm, T., Bonn, B., Keronen, P., Aalto, P., Hiltunen, V., Pohja, T., Launiainen, S., Hari, P., Mannila, H., and Kulmala, M.: A look at aerosol formation using data mining techniques, Atmos. Chem. Phys., 5, 3345–3356, https://doi.org/10.5194/acp-5-3345-2005, 2005. a
Kanawade, V. P., Tripathi, S. N., Siingh, D., Gautam, A. S., Srivastava, A. K. amd Kamra, A. K., Soni, V. K., and Sethi, V.: Observations of new particle formation at two distinct Indian subcontinental urban locations, Atmos. Environ., 94, 264–273, 2014. a
Kerminen, V.-M., Lehtinen, K. E. J., Anttila, T., and Kulmala, M.: Dynamics of atmospheric nucleation mode particles: a timescale analysis, Tellus B, 56, 135–146, 2004. a, b
Kontkanen, J., Paasonen, P., Aalto, J., Bäck, J., Rantala, P., Petäjä, T., and Kulmala, M.: Simple proxies for estimating the concentrations of monoterpenes and their oxidation products at a boreal forest site, Atmos. Chem. Phys., 16, 13291–13307, https://doi.org/10.5194/acp-16-13291-2016, 2016. a
Kontkanen, J., Lehtipalo, K., Ahonen, L., Kangasluoma, J., Manninen, H. E., Hakala, J., Rose, C., Sellegri, K., Xiao, S., Wang, L., Qi, X., Nie, W., Ding, A., Yu, H., Lee, S., Kerminen, V.-M., Petäjä, T., and Kulmala, M.: Measurements of sub-3 nm particles using a particle size magnifier in different environments: from clean mountain top to polluted megacities, Atmos. Chem. Phys., 17, 2163–2187, https://doi.org/10.5194/acp-17-2163-2017, 2017. a
Kosuge, S., Aoki, K., and Hatano, M.: Slow evaporation and condensation on a spherical droplet in the presence of a noncondensable gas, Phys. Fluids, 22, 067101, https://doi.org/10.1063/1.3432130, 2010. a
Kulmala, M.: Condensational growth and evaporation in the transition regime. An analytical expression, Aerosol Sci. Technol., 19, 381–388, 1993. a
Kulmala, M., dal Maso, M., Mäkelä, J. M., Pirjola, L., Väkevä, M., Aalto, P., Miikkulainen, P., Hämeri, K., and O'Dowd, C. D.: On the formation, growth and composition of nucleation mode particles, Tellus B, 53, 479–490, 2001. a, b
Kulmala, M., Kerminen, V.-M., Petäjä, T., Ding, A. J., and Wang, L.: Atmospheric gas-to-particle conversion: why NPF events are observed in megacities?, Faraday Discuss., 200, 271–288, 2017. a
Lehtinen, K. E. J. and Kulmala, M.: A model for particle formation and growth in the atmosphere with molecular resolution in size, Atmos. Chem. Phys., 3, 251–257, https://doi.org/10.5194/acp-3-251-2003, 2003. a
Lehtinen, K. E. J., Korhonen, H., Dal Maso, M., and Kulmala, M.: On the concept of condensation sink diameter, Boreal Env. Res., 8, 405–411, 2003. a, b
Lehtinen, K. E. J., dal Maso, M., Kulmala, M., and Kerminen, V.-M.: Estimating nucleation rates from apparent particle formation rates and vice versa: Revised formulation of the Kerminen-Kulmala equation, J. Aerosol Sci., 38, 988–994, 2007. a
Liu, X., Ma, P.-L., Wang, H., Tilmes, S., Singh, B., Easter, R. C., Ghan, S. J., and Rasch, P. J.: Description and evaluation of a new four-mode version of the Modal Aerosol Module (MAM4) within version 5.3 of the Community Atmosphere Model, Geosci. Model Dev., 9, 505–522, https://doi.org/10.5194/gmd-9-505-2016, 2016. a
Liu, Z., Hu, B., Zhang, J., Xin, J., Wu, F., Gao, W., Wang, M., and Wang, Y.: Characterization of fine particles during the 2014 Asia-Pacific economic cooperation summit: Number concentration, size distribution and sources, Tellus B, 69, 1303228, https://doi.org/10.1080/16000889.2017.1303228, 2017. a
Mann, G. W., Carslaw, K. S., Spracklen, D. V., Ridley, D. A., Manktelow, P. T., Chipperfield, M. P., Pickering, S. J., and Johnson, C. E.: Description and evaluation of GLOMAP-mode: a modal global aerosol microphysics model for the UKCA composition-climate model, Geosci. Model Dev., 3, 519–551, https://doi.org/10.5194/gmd-3-519-2010, 2010. a
Park, S. H. and Lee, K. W.: Condensational growth of polydisperse aerosol for the entire particle size range, Aerosol Sci. Tech., 33, 222–227, 2000. a, b
Petäjä, T., Mauldin III, R. L., Kosciuch, E., McGrath, J., Nieminen, T., Paasonen, P., Boy, M., Adamov, A., Kotiaho, T., and Kulmala, M.: Sulfuric acid and OH concentrations in a boreal forest site, Atmos. Chem. Phys., 9, 7435–7448, https://doi.org/10.5194/acp-9-7435-2009, 2009. a, b
Pikridas, M., Riipinen, I., Hildebrandt, L., Kostenidou, E., Manninen, H., Mihalopoulos, N., Kalivitis, N., Burkhart, J. F., Stohl, A., Kulmala, M., and Pandis, S. N.: New particle formation at a remote site in the eastern Mediterranean, J. Geophys. Res., 117, D12205, https://doi.org/10.1029/2012JD017570, 2012. a
Pringle, K. J., Tost, H., Message, S., Steil, B., Giannadaki, D., Nenes, A., Fountoukis, C., Stier, P., Vignati, E., and Lelieveld, J.: Description and evaluation of GMXe: a new aerosol submodel for global simulations (v1), Geosci. Model Dev., 3, 391–412, https://doi.org/10.5194/gmd-3-391-2010, 2010. a
Qi, X. M., Ding, A. J., Nie, W., Petäjä, T., Kerminen, V.-M., Herrmann, E., Xie, Y. N., Zheng, L. F., Manninen, H., Aalto, P., Sun, J. N., Xu, Z. N., Chi, X. G., Huang, X., Boy, M., Virkkula, A., Yang, X.-Q., Fu, C. B., and Kulmala, M.: Aerosol size distribution and new particle formation in the western Yangtze River Delta of China: 2 years of measurements at the SORPES station, Atmos. Chem. Phys., 15, 12445–12464, https://doi.org/10.5194/acp-15-12445-2015, 2015. a
Seinfeld, J. H. and Pandis, S. N.: Atmospheric chemistry and physics: from air pollution to climate change, Wiley, New Jersey, USA, 2016. a, b
Stier, P., Feichter, J., Kinne, S., Kloster, S., Vignati, E., Wilson, J., Ganzeveld, L., Tegen, I., Werner, M., Balkanski, Y., Schulz, M., Boucher, O., Minikin, A., and Petzold, A.: The aerosol-climate model ECHAM5-HAM, Atmos. Chem. Phys., 5, 1125–1156, https://doi.org/10.5194/acp-5-1125-2005, 2005. a
Stock, J. D. R.: The removal time for an aerosol undergoing vapour condensation, Ann. Nucl. Energy, 14, 193–201, 1987. a
Sundström, A.-M., Nikandrova, A., Atlaskina, K., Nieminen, T., Vakkari, V., Laakso, L., Beukes, J. P., Arola, A., van Zyl, P. G., Josipovic, M., Venter, A. D., Jaars, K., Pienaar, J. J., Piketh, S., Wiedensohler, A., Chiloane, E. K., de Leeuw, G., and Kulmala, M.: Characterization of satellite-based proxies for estimating nucleation mode particles over South Africa, Atmos. Chem. Phys., 15, 4983–4996, https://doi.org/10.5194/acp-15-4983-2015, 2015. a
Vana, M., Komsaare, K., Horrak, U., Mirme, S., Nieminen, T., Kontkanen, J., Manninen, H. E., Petäjä, T., Noe, S. M., and Kulmala, M.: Characteristics of new-particle formation at three SMEAR stations, Boreal Environ. Res., 21, 345–362, 2016. a
Vesala, T., Kulmala, M., Rudolf, R., Vrtala, A., and Wagner, P. E.: Models for condensational growth and evaporation of binary aerosol particles, J. Aerosol Sci., 28, 565–598, 1997. a
Vignati, E., Wilson, J., and Stier, P.: M7: An efficient size-resolved aerosol microphysics module for large-scale aerosol transport models, J. Geophys. Res., 109, D22202, https://doi.org/10.1029/2003JD004485, 2004. a
Virkkula, A., Backman, J., Aalto, P. P., Hulkkonen, M., Riuttanen, L., Nieminen, T., dal Maso, M., Sogacheva, L., de Leeuw, G., and Kulmala, M.: Seasonal cycle, size dependencies, and source analyses of aerosol optical properties at the SMEAR II measurement station in Hyytiälä, Finland, Atmos. Chem. Phys., 11, 4445–4468, https://doi.org/10.5194/acp-11-4445-2011, 2011. a
Whitby, E. R. and McMurry, P. H.: Modal aerosol dynamics modelling, Aerosol Sci. Tech., 27, 673–688, 1997. a, b
Williams, T. and Kelley, C.: Gnuplot 4.2: an interactive plotting program, available at: http://gnuplot.sourceforge.net (last access: 15 December 2016), 2013. a
Wu, C.-Y. and Biswas, P.: Particle Growth by Condensation in a System with Limited Vapor, Aerosol Sci. Tech., 28, 1–20, 1998. a
Wu, Z., Hu, M., Liu, S., Wehner, B., Bauer, S., Massling, A., Wiedensohler, A., Petäjä, T., Dal Maso, M., and Kulmala, M.: New particle formation in Beijing, China: Statistical analysis of a 1-year data set, J. Geophys. Res., 112, D09209, https://doi.org/10.1029/2006JD007406, 2007. a, b
Xiao, S., Wang, M. Y., Yao, L., Kulmala, M., Zhou, B., Yang, X., Chen, J. M., Wang, D. F., Fu, Q. Y., Worsnop, D. R., and Wang, L.: Strong atmospheric new particle formation in winter in urban Shanghai, China, Atmos. Chem. Phys., 15, 1769–1781, https://doi.org/10.5194/acp-15-1769-2015, 2015. a
Yli-Juuti, T., Nieminen, T., Hirsikko, A., Aalto, P. P., Asmi, E., Hõrrak, U., Manninen, H. E., Patokoski, J., Dal Maso, M., Petäjä, T., Rinne, J., Kulmala, M., and Riipinen, I.: Growth rates of nucleation mode particles in Hyytiälä during 2003–2009: variation with particle size, season, data analysis method and ambient conditions, Atmos. Chem. Phys., 11, 12865–12886, https://doi.org/10.5194/acp-11-12865-2011, 2011. a
Young, L.-H., Lee, S.-H., Kanawade, V. P., Hsiao, T.-C., Lee, Y. L., Hwang, B.-F., Liou, Y.-J., Hsu, H.-T., and Tsai, P.-J.: New particle growth and shrinkage observed in subtropical environments, Atmos. Chem. Phys., 13, 547–564, https://doi.org/10.5194/acp-13-547-2013, 2013. a
Zhang, K., O'Donnell, D., Kazil, J., Stier, P., Kinne, S., Lohmann, U., Ferrachat, S., Croft, B., Quaas, J., Wan, H., Rast, S., and Feichter, J.: The global aerosol-climate model ECHAM-HAM, version 2: sensitivity to improvements in process representations, Atmos. Chem. Phys., 12, 8911–8949, https://doi.org/10.5194/acp-12-8911-2012, 2012. a


