the Creative Commons Attribution 4.0 License.
the Creative Commons Attribution 4.0 License.
 | 17 Dec 2018
Refined classification and characterization of atmospheric new-particle formation events using air ions
Robert Chellapermal
Stephany Buenrostro Mazon
Pauli Paasonen
Janne Lampilahti
Hanna E. Manninen
Heikki Junninen
Tuukka Petäjä
Veli-Matti Kerminen
Markku Kulmala
Atmospheric new-particle formation (NPF) is a worldwide-observed phenomenon that affects the human health and the global climate. With a growing network of global atmospheric measurement stations, efforts towards investigating NPF have increased. In this study, we present an automated method to classify days into four categories including NPF events, non-events and two classes in between, which then ensures reproducibility and minimizes the hours spent on manual classification. We applied our automated method to 10 years of data collected at the SMEAR II measurement station in Hyytiälä, southern Finland using a Neutral cluster and Air Ion Spectrometer (NAIS). In contrast to the traditionally applied classification methods, which categorize days into events and non-events and ambiguous days as undefined days, our method is able to classify the undefined days as it accesses the initial steps of NPF at sub-3 nm sizes. Our results show that, on ∼24 % of the days in Hyytiälä, a regional NPF event occurred and was characterized by nice weather and favourable conditions such as a clear sky and low condensation sink. Another class found in Hyytiälä is the transported event class, which seems to be NPF carried horizontally or vertically to our measurement location and it occurred on 17 % of the total studied days. Additionally, we found that an ion burst, wherein the ions apparently fail to grow to larger sizes, occurred on 18 % of the days in Hyytiälä. The transported events and ion bursts were characterized by less favourable ambient conditions than regional NPF events and thus experienced interrupted particle formation or growth. Non-events occurred on 41 % of the days and were characterized by complete cloud cover and high relative humidity. Moreover, for regional NPF events occurring at the measurement site, the method identifies the start time, peak time and end time, which helps us focus on variables within an exact time window to better understand NPF at a process level. Our automated method can be modified to work in other measurement locations where NPF is observed.
- Article
(572 KB) - Full-text XML
- BibTeX
- EndNote


New-particle formation (NPF) is an atmospheric phenomenon that results in a big addition to aerosol load in the global troposphere (Spracklen et al., 2010; Kerminen et al., 2018). NPF is observed frequently in different environments around the globe, ranging from pristine locations (Siberia – Kulmala et al., 2011; Asmi et al., 2016) to boreal forests (Hyytiälä – Kulmala et al., 2013; Nieminen et al., 2014), tropical forests (Amazon – Artaxo et al., 2013; Wimmer et al., 2018), mountaintops (Jungfraujoch – Bianchi et al., 2016), semi-polluted cities (European cities – Manninen et al., 2010) and even heavily polluted megacities (China – Kulmala et al., 2016, 2017; Wang et al., 2017). The freshly formed particles that grow to larger sizes contribute largely to the cloud condensation nuclei load in the atmosphere (Merikanto et al., 2009; Kerminen et al., 2012; Salma et al., 2016) and thus indirectly affect the climate (IPCC, 2013).
In order to comprehend the phenomenon of NPF in a specific location, we first need to understand its frequency and characteristics as well as the particle formation and growth rates associated with it. With a growing number of global stations (Kulmala, 2018), an automatic method is needed to classify the days into events and non-events. In addition to minimizing the effort of manual event classification, an automated method tends to also reduce any human error. In this study, we present an automated method which classifies days into four classes according to the observed characteristics of 2–4 nm sized air ions and 7–25 nm sized particles. The original classification method of days as events, non-events and undefined days was proposed by Dal Maso et al. (2005), later modified by Kulmala et al. (2012) and is based on particle measurements starting from about 3 nm in particle mobility diameter, thus missing the initial steps of NPF. With the increased development of instrumentation, we are able to access sub-3 nm clusters and refine our classification method to account for the very initial steps of NPF. The classification proposed here divides days into regional events, transported events, ion bursts and non-events, thus excluding any undefined days, which minimizes the number of days usually excluded from further data analysis. Furthermore, our automated method identifies the start, peak and end times of daytime regional events or ion bursts. By identifying the start and end times, we are able to concentrate on the conditions present during the actual NPF time window.
Our study focuses on the NPF occurring in Hyytiälä, a boreal forest site in southern Finland where the SMEAR II (Station for Measuring Forest Ecosystem-Atmosphere Relations) measurement station is located (Hari and Kulmala, 2005). The data set collected at the station sums up more than 22 years of particle, meteorological and gas data, making extensive analyses of NPF and related parameters possible. Besides studying NPF occurrence in Hyytiälä, our method can be applied to other locations where NPF is observed, enabling scientists studying particle formation to focus on specific time windows by which active NPF occurs. Our specific aims in this study are (i) to automatically classify days in Hyytiälä according to their initial NPF steps, (ii) to minimize the number of undefined days by refining the classification, (iii) to investigate different characteristics of classified days, (iv) to identify the start, peak and end times of regional events and, thereby, (v) to create a time series which allows us to focus on the exact time period during which a regional new-particle formation event has occurred.
2.1 Measurement location
The main results of our study are based on the measurements collected at the SMEAR II station located in the boreal forest site in Hyytiälä, southern Finland (61∘51′ N, 24∘17′ E, 181 m a.s.l.). The station has accumulated 22 years of comprehensive measurements including particle, radiation, gas, meteorological and complementary data. This study analyses 10 years of data collected between 2006 and 2016. The location is considered a semi-clean boreal forest environment as it is far from anthropogenic pollutants (Asmi et al., 2011) and thus represents the Northern Hemisphere boreal forests. A more detailed description of the site and the ongoing measurements can be found in Hari and Kulmala (2005) and Nieminen et al. (2014).
2.2 Instrumentation
The traditional classification of days as NPF events and non-events follows the method proposed by Dal Maso et al. (2005) and Kulmala et al. (2012). For this classification method, the particle number-size distributions measured with a twin DMPS (Differential Mobility Particle Sizer) system (Aalto et al., 2001) were used. The twin DMPS system measured the aerosol number-size distribution over the size range 3–500 nm until 2004 and over the size range 3–1000 nm from 2005 onwards. The DMPS measurements are also used to calculate the condensation sink (CS), which is the rate at which non-volatile vapours condense onto pre-existing particles (Kulmala et al., 2012).
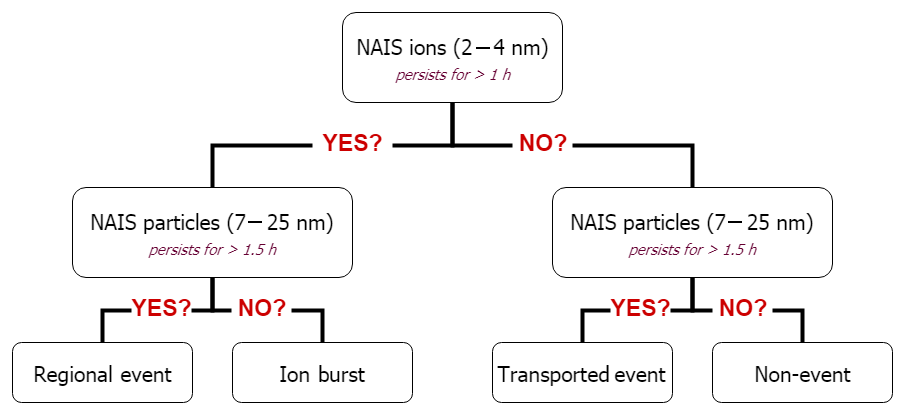
Figure 1A flow chart for the decision path during event classification in Hyytiälä using the new classification method.
For our proposed automated classification method, the mobility distributions of neutral and charged aerosol particles and clusters in the size ranges of 2–42 nm and 0.8–47 nm, respectively, were measured with a Neutral cluster and Air Ion Spectrometer (NAIS, Airel Ltd., Estonia, Manninen et al., 2009, 2016; Mirme and Mirme, 2013) between 2006 and 2016. No measurements using the NAIS were made during 2008 when the instrument was used for an intensive campaign. Particle and air ion data are available in 2 min time steps.
The air temperature and the relative humidity are measured with 4-wired PT-100 sensors and relative humidity sensors (Rotronic Hygromet MP102H with Hygroclip HC2-S3, Rotronic AG, Bassersdorf, Switzerland) on a mast at a height level of 16.8 m. The temperature and relative humidity data are provided as 30 min averages. Solar radiation in the wavelengths of global radiation (0.30–4.8 µm) is monitored using pyranometers (SL 501A UVB, Solar Light, Philadelphia, PA, USA; Reeman TP 3, Astrodata, Tõravere, Tartumaa, Estonia until June 2008, and Middleton Solar SK08, Middleton Solar, Yarraville, Australia since June 2008) above the forest at 18 m. We used global radiation data for calculating the cloudiness parameter (P), which is the ratio of global radiation to theoretical maximum radiation arriving at Hyytiälä, by following the method proposed by Dada et al. (2017). Values of P≤0.3 represent a complete cloud cover, while values of P≥0.8 can be considered to represent clear-sky conditions.
2.3 Event classification decision tree
Based on the concentrations of 2–4 nm ions, we are able to detect the initial steps of cluster formation (see Leino et al., 2016), which would not be possible using the DMPS system alone and the traditional classification. This small size window available from the NAIS operating in ion mode gives an additional opportunity to investigate sub-3 nm clusters. Accordingly, we are able to estimate whether a regional NPF event occurred within the air mass in which the observations were made or if it occurred elsewhere and was then carried to our measurement location. Similarly, undefined days are identified based on their sub-3 nm characteristics. In Fig. 1 we present our refined classification decision tree and apply it to Hyytiälä data in this study. In order to attain this classification, we rely on the initial steps of cluster formation and their further growth, which we monitor using an automatic method. Since in our study we are interested in daytime NPF, we chose a time window between 06:00 and 19:00 LT (local time) when monitoring aerosol number concentrations. However, the automated method can be tweaked to include evening or night-time event classification in places where these event types are present.
Our decision tree (Fig. 1) first examines 2–4 nm ion concentrations representing the initial step of new-particle formation. A notable increase in their concentration is interpreted as ion clustering on site. To be counted as an increase, the number concentration of ions after 06:00 LT must increase above a relative threshold and persist for more than 1 h. This threshold is calculated from ion concentration averaged over the time period 00:00–04:00 LT multiplied by a scaling factor (Fig. 2a); we chose this time window as the background as it is outside the time window in which night-time ion clusters are observed (Buenrostro Mazon et al., 2016; Rose et al., 2018). To be counted as a notable increase past the threshold value, a concentration of 20 ions cm−3 should be reached and should last for at least 1 h. We chose the aforementioned value as it has been found to be an indicator for NPF in Hyytiälä (Leino et al., 2016). If this criterion is met, these ions are expected to either grow to bigger sizes and lead to regional NPF events (REs) or fail to grow further. In this case the events are identified as ion bursts (IBs) that do not form new particles.
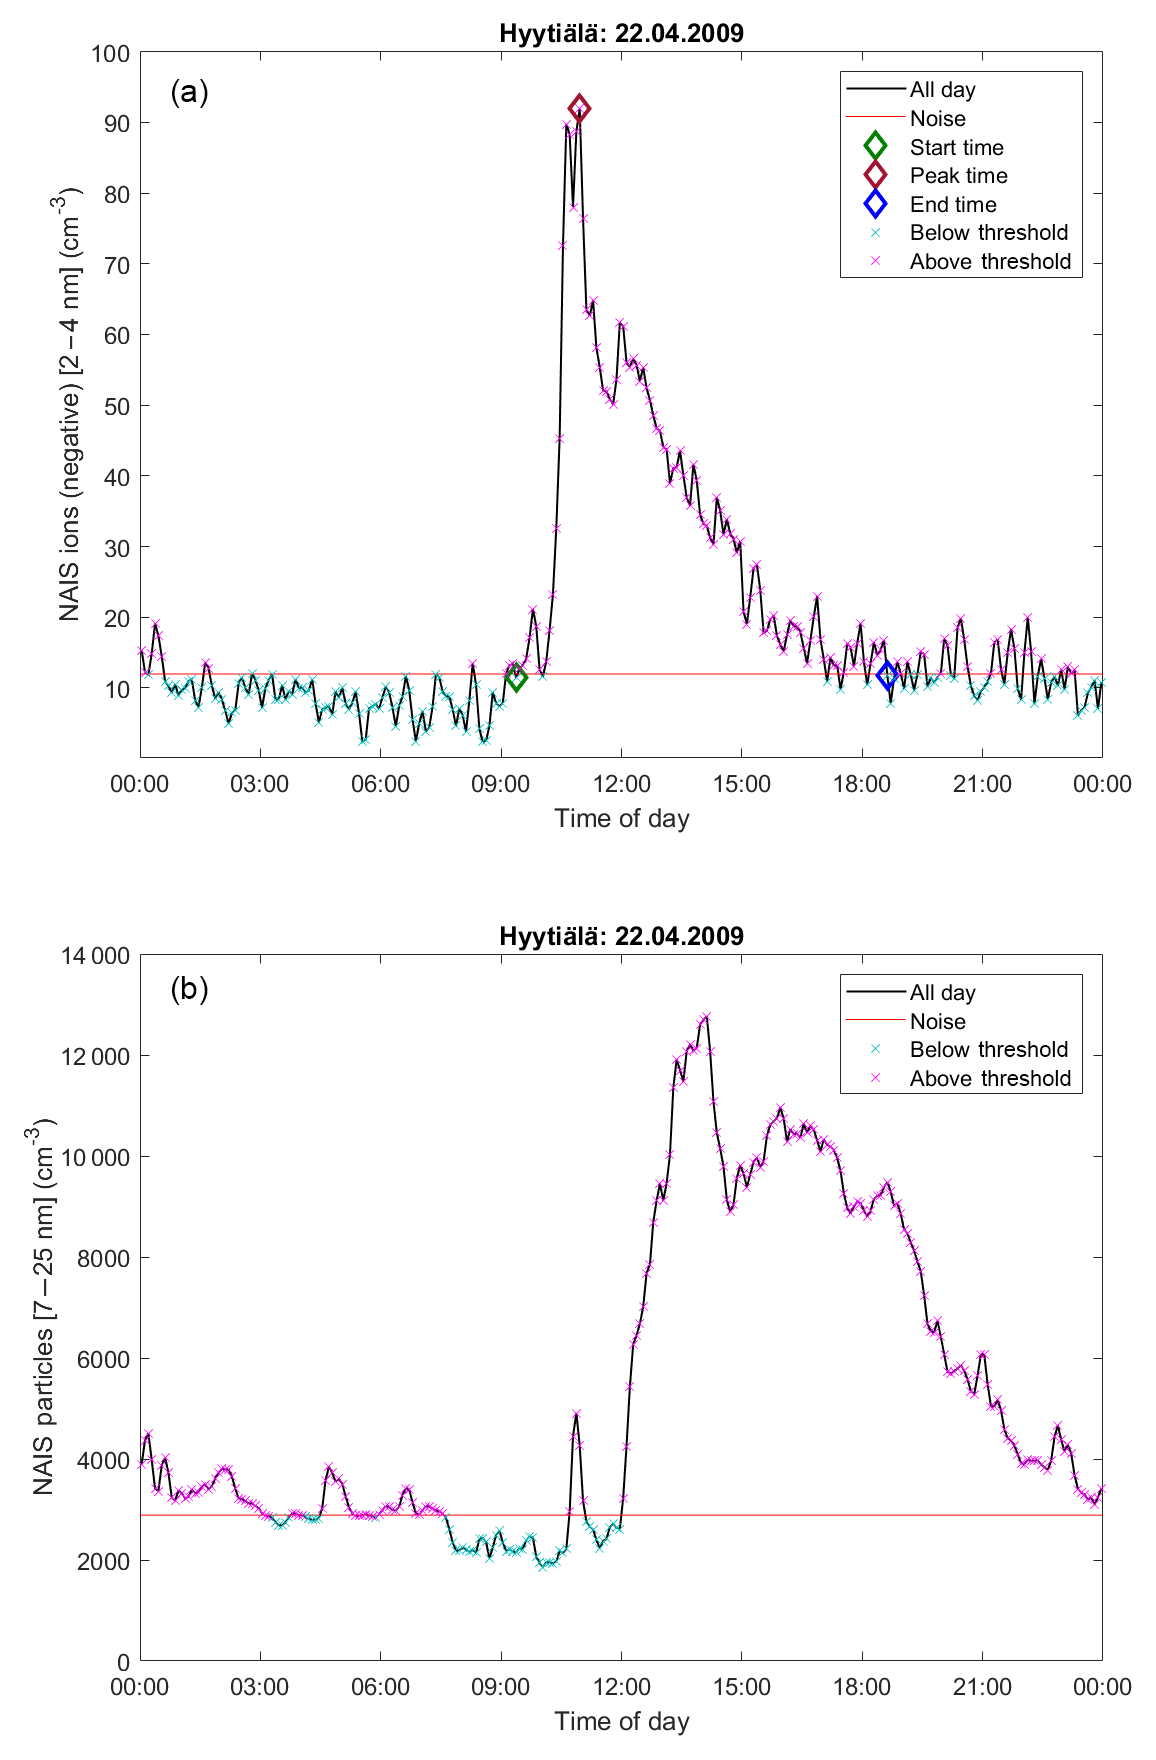
Figure 2Example of an automatic method applied to (a) 2–4 nm ions (negative); ion concentration passed threshold and persisted for more than 1 h. (b) Example of 7–25 nm particles; particle concentration passed threshold and persisted for more than 1.5 h.
To decide whether the particle growth is observed, particle concentrations in the size range of 7–25 nm are examined. These particles represent the growth phase of freshly formed clusters. Since in Hyytiälä growth rates of 4–7 nm particles are reported to lie between 0.8 and 17 nm h−1 (average of 3.8 nm h−1 ) (Yli-Juuti et al., 2011), we considered a time delay of 1 to 8 h between the initial increase of ion (2–4 nm) concentrations and particle (7–25 nm) concentrations. To be considered as an increase, the particle number concentration should exceed a relative threshold, which in this case is the number concentration averaged over the time period of 03:00–05:00 (Fig. 2b). We determined the background time window by comparing the automatic method to a manual classification that we performed for the years 2013–2014 from our data set. The increase in concentration should last for ∼1.5 h (100 min) and reach a peak of at least 3000 particles cm−3. On one hand, if both 2–4 nm ions and 7–25 nm particles are present, the time period is considered to be an RE. On the other hand, if the 2–4 nm ions are present but they do not grow to form 7–25 nm particles, the time period is classified as an ion burst (IB). Moreover, if 2–4 nm ions are not present, but we observe an increase in the particles, this leads to the assumption that the NPF event did not occur at the measurement location but was carried horizontally or vertically to our site (Leino et al., 2018). The latter has been previously described as a tail event (Buenrostro Mazon et al., 2009) or a TE. However, if neither criterion is met, which means that neither 2–4 nm ions nor 7–25 nm particles are present in sufficient concentrations, the time period is then classified as an NE.
2.4 Description of the automated method
Our automatic method selects the start time, peak time and end time of negative NAIS ions in the size range 2–4 nm. The growth to an event is confirmed by an accompanying peak in the 7–25 nm particles measured by the NAIS. The outcome of the automatic method is the classification of days into the four classes, as well as a time series that identifies the time period of regional events and ion bursts in Hyytiälä (pathways of REs and IBs in Fig. 1). Once the ion and particle data are smoothed and the precipitation time stamps are eliminated using the new automated method, the classified time series is generated within a couple of minutes with a click of a button. This is in contrast to the manual method, which could use several hours and at least two people in order to classify 1 year of data.
First, to investigate the appearance of 2–4 nm ions, the precipitation time stamps are excluded from our analysis as they interfere with the ion data (Leino et al., 2016), resulting in misinterpretations. After that, the ion concentrations are smoothed using a Savitzky–Golay filter (Orfanidis, 1995). We then search for an increase in the ion concentration that lasts for 12 consecutive points (5 min each) above a threshold value and reaches values greater than 20 cm−3 (Leino et al., 2016). A maximum of three drops below the threshold value is allowed (Fig. 2a). Finally, the method looks for a peak in the 7–25 nm particle concentration to identify the appearance of a growth phase (Fig. 2b). The peak requires 15 consecutive points (5 min each) with concentrations larger than the threshold value and that reach a value larger than 3000 cm−3. Also, a maximum of 3 drops below the threshold value are allowed. Accordingly, each time stamp is classified.
2.5 Start time, peak time and end time determination
The start time, peak times and end times for regional events and ion bursts are defined based on the 2–4 nm ion concentration as follows: (i) the start time is the first crossing of the threshold line which lasts for more than 12 consecutive points, (ii) the peak time is when the concentration reaches the maximum and (iii) the end time is the first trough after crossing the threshold line into lower concentrations which remains below the threshold for more than three consecutive points. An example day is demonstrated in Fig. 2a. The threshold is taken as the 2–4 nm ion concentration averaged over the time period 00:00–04:00 multiplied by a scaling factor of 7. Our scaling factor was determined after a comparison with the manual classification of the data for the years 2013–2014.

Figure 3Frequency and fraction of events, ion burst and non-events in Hyytiälä using the new classification method.
3.1 Event classification
Our classification puts the days in Hyytiälä into four different categories following the pathway chart in Fig. 1. REs, or regional NPF events, are those which are initiated over a large area, including the measurement location, and the particles continue to grow to bigger sizes. The type TE, or transported events (also known as tail events by Buenrostro Mazon et al., 2009), are events with an undetected beginning as it does not occur at the immediate vicinity of our measurement site. Such events could have been initiated outside our measurement site and transported to Hyytiälä (Leino et al., 2018). The aforementioned hypotheses could explain the observation that TE typically occur at around midday or later in the afternoon, while REs tend to occur concurrent with sunrise. The type IB, or ion bursts, is an attempt at NPF, during which clusters form in Hyytiälä; however, they do not grow beyond a few nanometres in diameter. Changes in atmospheric conditions that could cause the limited, or interrupted, growth of the clusters are assessed in more detail in Sect. 3.3. Finally, non-events (NEs) are days on which we do not observe a forming mode of 2–4 nm ions nor a growing mode of 7–25 particles.
3.2 Frequency of events
For 10 years of data (2006–2016), excluding the days with missing NAIS data when the instrument was under maintenance or on campaigns, we classified a total of 2134 days. Using our refined classification method, we were able to classify the days into four categories as follows (Fig. 3): 551 REs (24 %), 410 TEs (18 %), 415 IBs (18 %) and 938 NEs (40 %). This refined classification is able to place all days into categories and thus eliminate the undefined days that usually constitute around 40 % of all the days in our location (Dal Maso et al., 2005; Buenrostro Mazon et al., 2009).
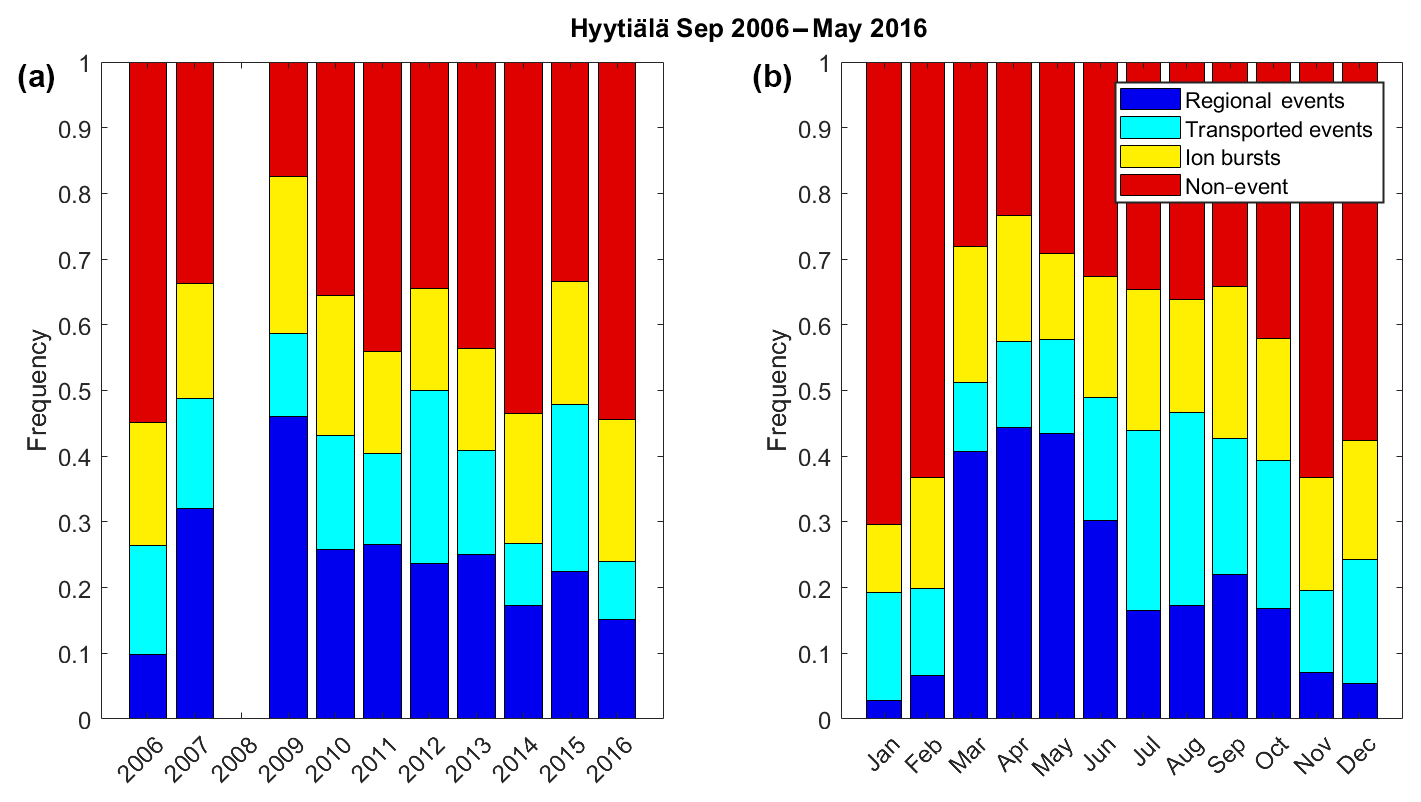
Figure 4(a) Yearly and (b) monthly fraction of days classified as regional events (REs), transported events (TEs), ion bursts (IBs) and non-events (NEs) using the new classification method. The data from 2009 are biased towards spring months, which could explain the much higher number of events. No data were available during 2008.
Moreover, we studied the interannual variation of each of the classes (Fig. 4a). In general, REs constitute 20 %–30 % of the total classified days. In 2006, the measurement started in September, which explains a lower fraction of REs. The gap in the analysis in 2008 is explained by a campaign during which the NAIS data is not available (Manninen et al., 2010). The data in 2009 includes data from spring only, which explains the high frequency of REs in 2009. While we can observe changes in the frequency of REs over the years, no clear trend exists. The annual variation of TEs follows that of REs, also having no specific trend over the years. The type IB appears to have an almost constant fraction over the years. Finally, NEs constitute between 40 % and 50 % of the days, except in 2009, which has a spring bias, favouring REs.
The monthly variation of REs follows the typical yearly cycle of NPF, with a peak in spring, followed by a smaller peak in autumn (Dal Maso et al., 2005; Nieminen et al., 2014; Dada et al., 2017). Interestingly, the refined classification shows that the events occurring in spring are mostly REs, while those in autumn are dominated by TEs. Additionally, REs rarely occur in winter, appearing on less than 5 % of the days. IBs have a steady 10 %–20 % occurrence during the year. Finally, NEs occur on 60 % to 70 % of winter days and less than 30 % during spring. Interestingly, while previously it was understood that summer is dominated by NEs (Nieminen et al., 2014; Dada et al., 2017), the refined classification shows that both TEs and IBs are frequent during summer, complementing observations by Buenrostro Mazon et al. (2009), who reported “failed events” during summer.
3.3 Characteristics of REs, TEs, IBs and NEs
For a regional event to take place, favourable conditions need to be present. These include a low condensation sink, low relative humidity, moderate temperature and plenty of radiation available during a clear sky (Dada et al., 2017; Hyvönen et al., 2005; Nieminen et al., 2014; Nieminen et al., 2015). In Fig. 5, we present the characteristics of each type of event classified in terms of condensation sink (CS), relative humidity (RH), temperature (T) and cloudiness (P). The data in the plots represent half-hour averages of each variable between 07:00 and 12:00 during spring (March–May). We chose this season in order to capture the maximum NPF events and this time window in order to be consistent for all four studied classes. As expected, the median CS observed in REs was s−1, which is a factor of 2 lower than CS observed on TE days or on NE days ( s−1). To our understanding, high CS inhibits NPF, so that its higher values during the days classified as TEs forbid the initial formation of particles at the measurement site. IBs, on the other hand, are potential regional events with interrupted growth. Since the median CS during IBs was not high ( s−1), it does not explain the discontinuous growth of the clusters during these events. We proceed to study the effect of T on the occurrence of each class of events. Since the data in Fig. 5 are measurements during spring, the median value of temperature (2–7 ∘C) was rather similar on all days and no specific trend or exception could be found.
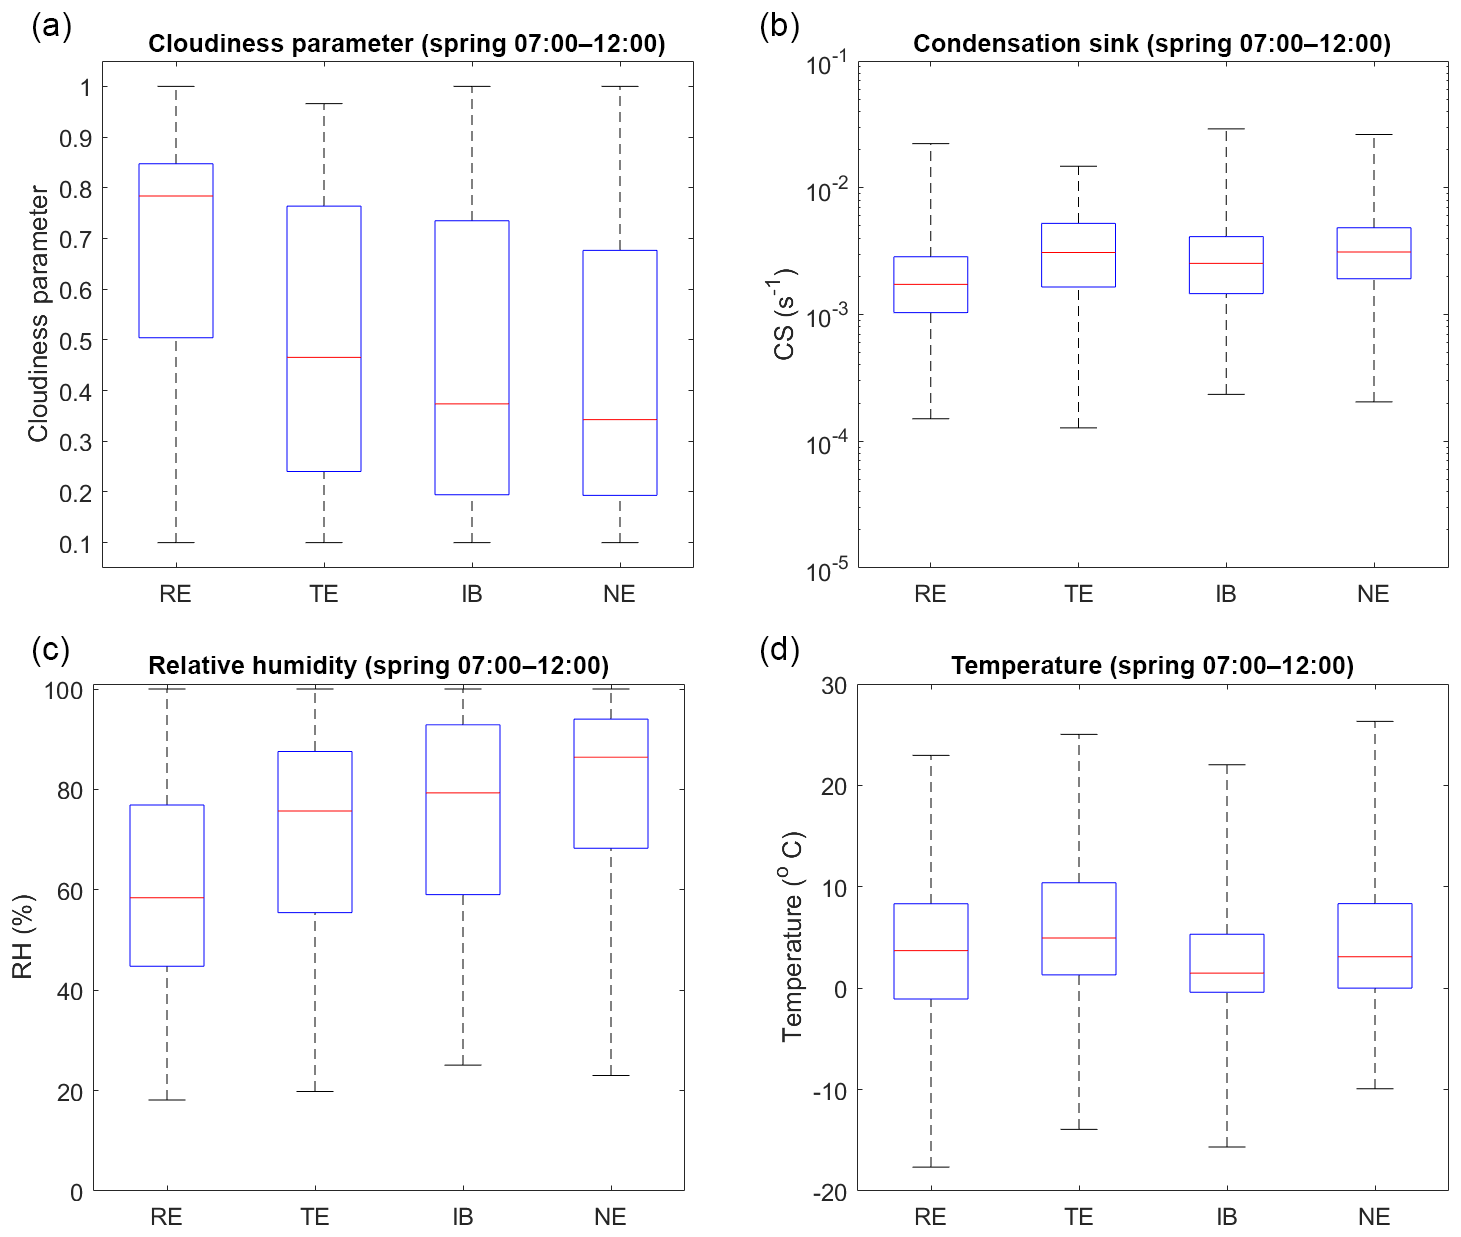
Figure 5(a) Cloudiness parameter, (b) condensation sink, (c) relative humidity and (d) temperature on different days classified with the new classification method for spring (March–May) of 2006–2016 during the maximum NPF window (07:00–12:00). The acronyms RE, TE, IB and NE stand for regional event, transported event, ion burst and non-event. The red line represents the median of the data and the lower and upper edges of the box represent the 25th and 75th percentiles of the data. The lines extending from the central box represent the minimum and the maximum of the data.
In addition to CS and T, RH and cloudiness (P) play an important role in the occurrence of NPFs (Hamed et al., 2011; Dada et al., 2017). A regional NPF event is more likely to occur on a clear-sky day rather than on a cloudy day. This conclusion is demonstrated nicely in Fig. 5, which shows that the median value of P was close to 0.8 on the RE days and closer to 0.3 on NE days. TE usually took place when the conditions within the boundary layer were not favourable for a regional NPF to occur. However, the particle growth was much less sensitive to environmental conditions: a particle growth was often observed during all times of the day and in every season, but also on days (and nights) on which NPF did not take place (Paasonen et al., 2018). Combined with a higher CS, the value of P was much lower on TE days than on RE days, describing a semi-cloudy day as one that is unfavourable for NPF to occur within the boundary layer, which could result in the occurrence of a TE in locations where the conditions are conducive enough to NPF. It is, however, important to mention that it is possible to have a regional NPF episode taking place simultaneously with a transported one, and when the latter is transported it gets mixed with the regional NPF so that this situation will be classified as an RE. Finally, since ion bursts are the attempt of an event but do not grow, an interrupted clear sky could explain this phenomenon: for instance a sudden appearance of a cloud would result in the interruption of NPF (Baranizadeh et al., 2014), which then remains as an ion burst only. Finally, the RH, which in general correlates with cloudiness, showed a nice pattern between the event classes: RH was lowest for REs and highest for NEs, and it reflects cloudiness fairly well.
3.4 Start times, peak time and end time of RE
Our method makes it possible to detect the start, peak and end times of every regional event classified during our study period. Although several previous studies state that the occurrence of NPF starts with sunrise and peaks around midday, very few investigations have considered occurrence times accurately. We derived the start, peak and end times from 2–4 nm ions automatically, as mentioned in Sect. 2.4 and 2.5. During spring, when most of the NPF events occur, our results (Fig. 6) show that indeed REs occur after sunrise and prior to noon, with the maximum number of days occurring between the sunrise and 5 h past sunrise. The peak times of the events had the most frequent occurrence at 5 to 6 h after sunrise, which is between 10:30 and 11:30 LT (local time), complementing our previous assumption that NPF peaks before noon. Finally, the ending times of the events had the most frequent occurrence at 9 to 11 h after sunrise. During summer the events tend to start, peak and end later than in spring, and they show lower variability in comparison to spring. This observation could be attributed to longer daylight hours and fewer clouds. Whereas in autumn, the events start, peak and end earlier than in spring. Exceptionally, during winter, ion concentrations might be affected by the accumulation of snow on or around the inlets. Overall, the variability of the event start, peak and end times can be affected by the solar cycle, degree of cloudiness and seasonality. The importance of the identification of the exact start and end times of the process helps to increase our understanding of the processes governing the NPF phenomenon. More specifically, they allow us to form a time series in which NPF is separated from non-event times, making it possible to compare the parameters responsible for the NPF process within appropriate time frames.
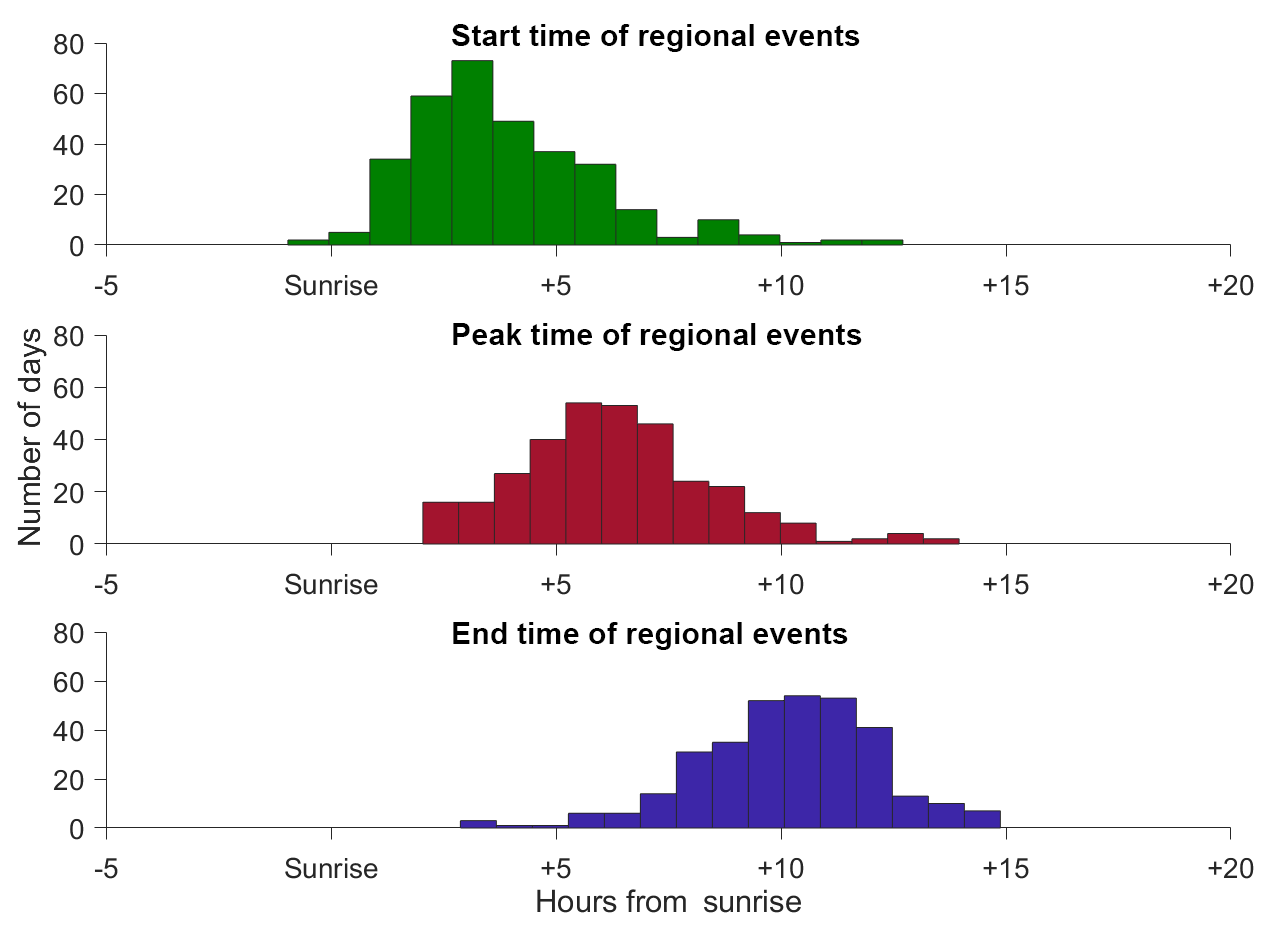
Figure 6Frequency of days during spring at which regional events start, peak and end past sunrise. For example, most events start within 3 h from sunrise.
3.5 Comparison to previous classification
In order to estimate the goodness of our automatic method, it is crucial to compare our results with the previous classifications (Dal Maso et al., 2005; Kulmala et al., 2012). Although such a comparison is not straightforward, we show one version of it in Fig. 7. On the x axis, the original classified days are shown, and the refined classes are shown on the y axis as a fraction of each original class. For example, 65 % of the originally classified event days (event days make 25 % of the total days in Hyytiälä according to the original classification) were found to be REs, 10 % were TEs and 14 % were IBs. The remaining 11 % were considered as misclassified or bad data (by manual classification) and were excluded from the plot. In total, our automatic method was able to classify 89 % of the original NPF events into some of the new event classes (RE, TE or IB). The original non-events (which made 40 % of the total days) were split between the TEs (20 %), IBs (19 %) and NEs (53 %). The remaining 8 % were bad data according to the manual classification and were excluded from the plot.
Finally, undefined days, which according to the traditional classification were 35 % of the total days, were split between all the classes. Our results show that 17 % of those were REs, 21 % were TEs, 19 % were IBs and 42 % were non-events. Those days were usually excluded from further analysis because they did not belong to a defined class according to the original classification method. Previous extensive studies of undefined days in Hyytiälä by Buenrostro Mazon et al. (2009) showed that a fraction of undefined days resemble interrupted events which, in our case, were 83 % of the days (TEs, IBs or NEs), and which all in all were related to unfavourable conditions for regional NPF. The interruption mechanisms may include the appearance of clouds (Baranizadeh et al., 2014; Dada et al., 2017), resulting in decreased radiation essential for particle formation and growth (Jokinen et al., 2017), or a change in the origin of arriving air masses from a clean to a rather polluted sector (Sogacheva et al., 2005). Our automated method fails sometimes as the result of the simultaneous appearance of an ion burst and a pollution plume. While the misjudgment of these days as regional events is largely minimized by correcting for the background concentrations of 7–25 nm particles, erroneous classification is still possible in some cases.
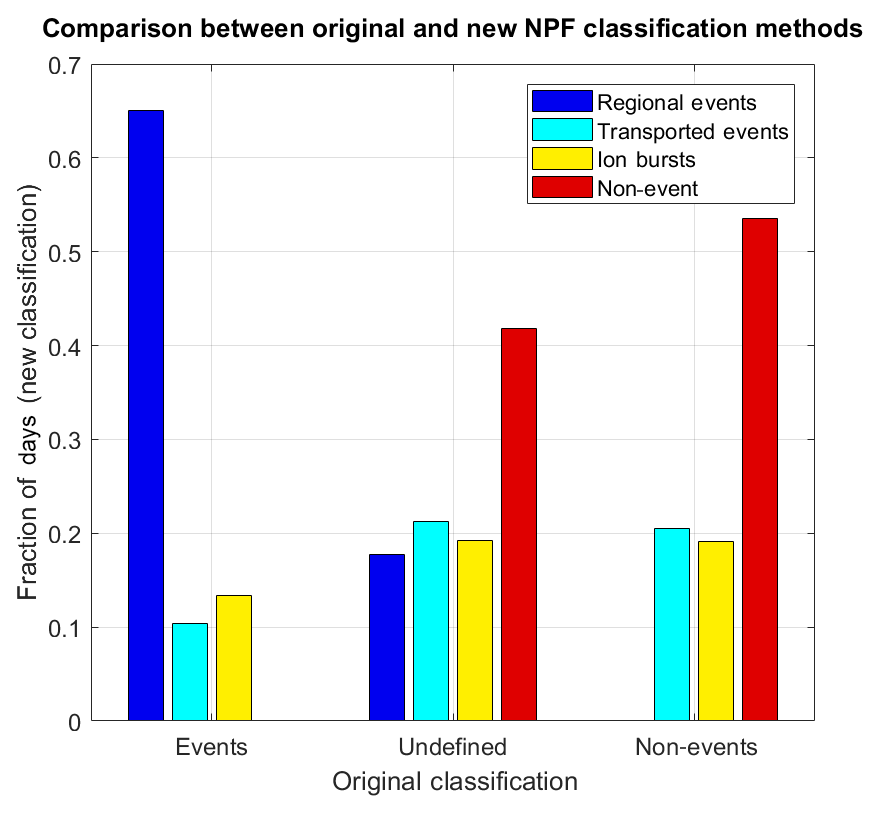
Figure 7Comparison between original and new NPF classification methods. The refined classification matches 94 % with original event and non-event classification.
Using 10 years of measurements using the NAIS at the SMEAR II station, we were able to create an automated method to classify days into four classes based on their ion (2–4 nm) and particle (7–25 nm) number concentrations, including regional events, transported events, ion bursts and non-events. Our method minimizes the efforts used in manual day-by-day classification as well as the errors due to human bias. In addition, our method allows for the complete classification (sub-3 nm) of all days, i.e. reduces the number of previously known “undefined days”, which have always been excluded from previous analyses.
Our results show that on ∼40 % of the days during spring in Hyytiälä, a regional NPF event occurs and is characterized by a set of favourable conditions, such as a clear sky, low condensation sink, medium temperature and low relative humidity. On the contrary, NEs were ∼25 % of the days and were characterized by a complete cloud cover, high RH and high CS. Interestingly, TEs and IBs fall into the category between REs and NEs in this respect. While IBs are interrupted growth of REs that were initially started due to a probable change in polluted air mass or the appearance of a cloud, TEs occurred on days when there was little chance for the cluster to form within our measurement location but they still had a chance to grow if they reached our site. Both IBs and TEs were characterized by intermediate values of CS, RH and P compared with REs and NEs. Moreover, using the new method we are able to identify the start time, peak time and end time of events occurring in Hyytiälä. Our results show that most REs started within 5 h from the sunrise, peaked before noon and ended 10 h after sunrise. Finally, with small changes the classification method can be applied to other places around the globe where NPF takes place, providing a deeper understanding yet less effort for atmospheric scientists.
Data measured at the SMEAR II station are available on the web page: https://avaa.tdata.fi/web/smart/ (Junninen et al., 2009). The classification, start times, peak times and end times are available from Lubna Dada (lubna.dada@helsinki.fi) upon request.
LD and VMK: manuscript writing. LD: data analysis. SBM, HEM and JL: NAIS data collection and interpretation. LD, RC and HJ: development of the method. LD, PP, HEM, JL, TP, VMK and MK: scientific discussions and conclusions.
The authors declare that they have no conflict of interest.
This article is part of the special issue “Pan-Eurasian Experiment (PEEX)”. It is not associated with a conference.
Lubna Dada acknowledges the doctoral programme in Atmospheric Sciences
(ATM-DP, University of Helsinki) for financial support. This project has
received funding from the European Union's Horizon 2020 research (ERA-PLANET 689443)
and innovation programme under grant agreement no. 654109. This work
was supported by the European Commission via projects ACTRIS2, European
Research Council via ATM-GTP (742206), and Academy of Finland Centre of
Excellence in Atmospheric Sciences (grant number: 272041).
Edited by: Imre Salma
Reviewed by: two
anonymous referees
Aalto, P., Hämeri, K., Becker, E., Weber, R., Salm, J., Mäkelä, J. M., Hoell, C., O'dowd, C. D., Hansson, H.-C., Väkevä, M., Koponen, I. K., Buzorius, G., and Kulmala, M.: Physical characterization of aerosol particles during nucleation events, Tellus B, 53, 344–358, https://doi.org/10.1034/j.1600-0889.2001.530403.x, 2001.
Artaxo, P., Rizzo, L. V., Brito, J. F., Barbosa, H. M., Arana, A., Sena, E. T., Cirino, G. G., Bastos, W., Martin, S. T., and Andreae, M. O.: Atmospheric aerosols in Amazonia and land use change: from natural biogenic to biomass burning conditions, Faraday Discuss., 165, 203–235, 2013.
Asmi, A., Wiedensohler, A., Laj, P., Fjaeraa, A.-M., Sellegri, K., Birmili, W., Weingartner, E., Baltensperger, U., Zdimal, V., Zikova, N., Putaud, J.-P., Marinoni, A., Tunved, P., Hansson, H.-C., Fiebig, M., Kivekäs, N., Lihavainen, H., Asmi, E., Ulevicius, V., Aalto, P. P., Swietlicki, E., Kristensson, A., Mihalopoulos, N., Kalivitis, N., Kalapov, I., Kiss, G., de Leeuw, G., Henzing, B., Harrison, R. M., Beddows, D., O'Dowd, C., Jennings, S. G., Flentje, H., Weinhold, K., Meinhardt, F., Ries, L., and Kulmala, M.: Number size distributions and seasonality of submicron particles in Europe 2008–2009, Atmos. Chem. Phys., 11, 5505–5538, https://doi.org/10.5194/acp-11-5505-2011, 2011.
Asmi, E., Kondratyev, V., Brus, D., Laurila, T., Lihavainen, H., Backman, J., Vakkari, V., Aurela, M., Hatakka, J., Viisanen, Y., Uttal, T., Ivakhov, V., and Makshtas, A.: Aerosol size distribution seasonal characteristics measured in Tiksi, Russian Arctic, Atmos. Chem. Phys., 16, 1271–1287, https://doi.org/10.5194/acp-16-1271-2016, 2016.
Baranizadeh, E., Arola, A., Hamed, A., Nieminen, T., Mikkonen, S., Virtanen, A., Kulmala, M., Lehtinen, K., and Laaksonen, A.: The effect of cloudiness on new-particle formation: investigation of radiation levels, Boreal Env. Res., 19, 343–354, 2014.
Bianchi, F., Tröstl, J., Junninen, H., Frege, C., Henne, S., Hoyle, C., Molteni, U., Herrmann, E., Adamov, A., Bukowiecki, N., Chen, X., Duplissy, J., Gysel, M., Hutterli, M., Kangasluoma, J., Kontkanen, J., Kürten, A., Manninen, H. E., Münch, S., Peräkylä, O., Petäjä, T., Rondo, L., Williamson, C., Weingartner, E., Curtius, J., Worsnop, D. R., Kulmala, M., Dommen, J., and Baltensperger, U.: New particle formation in the free troposphere: A question of chemistry and timing, Science, 352, 1109–1112, https://doi.org/10.1126/science.aad5456, 2016.
Buenrostro Mazon, S., Riipinen, I., Schultz, D. M., Valtanen, M., Dal Maso, M., Sogacheva, L., Junninen, H., Nieminen, T., Kerminen, V.-M., and Kulmala, M.: Classifying previously undefined days from eleven years of aerosol-particle-size distribution data from the SMEAR II station, Hyytiälä, Finland, Atmos. Chem. Phys., 9, 667–676, https://doi.org/10.5194/acp-9-667-2009, 2009.
Buenrostro Mazon, S., Kontkanen, J., Manninen, H. E., Nieminen, T., Kerminen, V.-M., and Kulmala, M.: A long-term comparison of nighttime cluster events and daytime ion formation in a boreal forest, Boreal Env. Res., 21, 242–261, 2016.
Dada, L., Paasonen, P., Nieminen, T., Buenrostro Mazon, S., Kontkanen, J., Peräkylä, O., Lehtipalo, K., Hussein, T., Petäjä, T., Kerminen, V.-M., Bäck, J., and Kulmala, M.: Long-term analysis of clear-sky new particle formation events and nonevents in Hyytiälä, Atmos. Chem. Phys., 17, 6227–6241, https://doi.org/10.5194/acp-17-6227-2017, 2017.
Dal Maso, M., Kulmala, M., Riipinen, I., Wagner, R., Hussein, T., Aalto, P. P., and Lehtinen, K. E.: Formation and growth of fresh atmospheric aerosols: eight years of aerosol size distribution data from SMEAR II, Hyytiala, Finland, Boreal Env. Res., 10, 323–336, 2005.
Hamed, A., Korhonen, H., Sihto, S. L., Joutsensaari, J., Järvinen, H., Petäjä, T., Arnold, F., Nieminen, T., Kulmala, M., and Smith, J. N.: The role of relative humidity in continental new particle formation, J. Geophys. Res.-Atmos., 116, D03202, https://doi.org/10.1029/2010JD014186, 2011.
Hari, P. and Kulmala, M.: Station for measuring ecosystem-atmosphere relations, Boreal Env. Res., 10, 315–322, 2005.
Hyvönen, S., Junninen, H., Laakso, L., Dal Maso, M., Grönholm, T., Bonn, B., Keronen, P., Aalto, P., Hiltunen, V., Pohja, T., Launiainen, S., Hari, P., Mannila, H., and Kulmala, M.: A look at aerosol formation using data mining techniques, Atmos. Chem. Phys., 5, 3345–3356, https://doi.org/10.5194/acp-5-3345-2005, 2005.
IPCC: Climate Change 2013: The Physical Science Basis, Contribution of Working Group I to the Fifth Assessment Report of the Intergovernmental Panel on Climate Change, Cambridge University Press, Cambridge, UK and New York, USA, 1535 pp., 2013.
Jokinen, T., Kontkanen, J., Lehtipalo, K., Manninen, H. E., Aalto, J., Porcar-Castell, A., Garmash, O., Nieminen, T., Ehn, M., Kangasluoma, J., Junninen, H., Levula, J., Duplissy, J., Ahonen, L. R., Rantala, P., Heikkinen, L., Yan, C., Sipilä, M., Worsnop, D. R., Bäck, J., Petäjä, T., Kerminen, V.-M., and Kulmala, M.: Solar eclipse demonstrating the importance of photochemistry in new particle formation, Sci. Rep.-UK, 7, 45707, https://doi.org/10.1038/srep45707, 2017.
Junninen, H., Lauri, A., Keronen, P., Aalto, P., Hiltunen, V., Hari, P., and Kulmala, M.: Smart-SMEAR: on-line data exploration and visualization tool for SMEAR stations, Boreal Environ. Res., 14, 447–457, 2009 (data available at: https://avaa.tdata.fi/web/smart/, last access: 1 June 2018).
Kerminen, V.-M., Paramonov, M., Anttila, T., Riipinen, I., Fountoukis, C., Korhonen, H., Asmi, E., Laakso, L., Lihavainen, H., Swietlicki, E., Svenningsson, B., Asmi, A., Pandis, S. N., Kulmala, M., and Petäjä, T.: Cloud condensation nuclei production associated with atmospheric nucleation: a synthesis based on existing literature and new results, Atmos. Chem. Phys., 12, 12037–12059, https://doi.org/10.5194/acp-12-12037-2012, 2012.
Kerminen, V.-M., Chen, X., Vakkari, V., Petäjä, T., Kulmala, M., and Bianchi, F.: Atmospheric new particle formation and growth: review of field observations, 13, 103003, https://doi.org/10.1088/1748-9326/aadf3c, 2018.
Kulmala, M.: Build a global Earth observatory, Nature, 553, 21–23, 2018.
Kulmala, M., Alekseychik, P., Paramonov, M., Laurila, T., Asmi, E., Arneth, A., Zilitinkevich, S., and Kerminen, V.-M.: On measurements of aerosol particles and greenhouse gases in Siberia and future research needs, Boreal Environ. Res., 16, 337–362, 2011.
Kulmala, M., Petäjä, T., Nieminen, T., Sipilä, M., Manninen, H. E., Lehtipalo, K., Dal Maso, M., Aalto, P. P., Junninen, H., and Paasonen, P.: Measurement of the nucleation of atmospheric aerosol particles, Nat. Protoc., 7, 1651–1667, https://doi.org/10.1038/nprot.2012.091, 2012.
Kulmala, M., Kontkanen, J., Junninen, H., Lehtipalo, K., Manninen, H. E., Nieminen, T., Petäjä, T., Sipilä, M., Schobesberger, S., Rantala, P., Franchin, A., Jokinen, T., Järvinen, E., Äijälä, M., Kangasluoma, J., Hakala, J., Aalto, P., Paasonen, P., Mikkilä, J., Vanhanen, J., Aalto, J., Hakola, H., Makkonen, U., Ruuskanen, T., Mauldin, R. r., Duplissy, J., Vehkamäki, H., Bäck, J., Kortelainen, A., Riipinen, I., Kurtén, T., Johnston, M., Smith, J., Ehn, M., Mentel, T., Lehtinen, K., Laaksonen, A., Kerminen, V., and Worsnop, D.: Direct observations of atmospheric aerosol nucleation, Science, 339, 943–946, https://doi.org/10.1126/science.1227385, 2013.
Kulmala, M., Petäjä, T., Kerminen, V.-M., Kujansuu, J., Ruuskanen, T., Ding, A., Nie, W., Hu, M., Wang, Z., Wu, Z., Wang, L., and Worsnop, D. R.: On secondary new particle formation in China, Front. Env. Sci. Eng., 10, 8, https://doi.org/10.1007/s11783-016-0850-1, 2016.
Kulmala, M., Kerminen, V.-M., Petäjä, T., Ding, A., and Wang, L.: Atmospheric gas-to-particle conversion: why NPF events are observed in megacities?, Faraday Discuss., 200, 271–288, 2017.
Leino, K., Nieminen, T., Manninen, H. E., Petäjä, T., Kerminen, V.-M., and Kulmala, M.: Intermediate ions as a strong indicator of new particle formation bursts in a boreal forest, Boreal Environ. Res., 21, 274–286, 2016.
Leino, K., Lampilahti, J., Poutanen, P., Väänänen, R., Manninen, A., Buenrostro Mazon, S., Dada, L., Nikandrova, A., Wimmer, D., Aalto, P. P., Ahonen, L. R., Enroth, J., Kangasluoma, J., Keronen, P., Korhonen, F., Laakso, H., Matilainen, T., Siivola, E., Manninen, H. E., Lehtipalo, K., Kerminen, V.-M., Petäjä, T., and Kulmala, M.: Vertical profiles of sub-3 nm particles over the boreal forest, Atmos. Chem. Phys. Discuss., https://doi.org/10.5194/acp-2018-605, in review, 2018.
Manninen, H. E., Petäjä, T., Asmi, E., Riipinen, I., Nieminen, T., Mikkilä, J., Hõrrak, U., Mirme, A., Mirme, S., Laakso, L., Kerminen, V.-M., and Kulmala, M.: Long-term field measurements of charged and neutral clusters using Neutral cluster and Air Ion Spectrometer (NAIS), Boreal Environ. Res, 14, 591–605, 2009.
Manninen, H. E., Nieminen, T., Asmi, E., Gagné, S., Häkkinen, S., Lehtipalo, K., Aalto, P., Vana, M., Mirme, A., Mirme, S., Hõrrak, U., Plass-Dülmer, C., Stange, G., Kiss, G., Hoffer, A., Töro, N., Moerman, M., Henzing, B., de Leeuw, G., Brinkenberg, M., Kouvarakis, G. N., Bougiatioti, A., Mihalopoulos, N., O'Dowd, C., Ceburnis, D., Arneth, A., Svenningsson, B., Swietlicki, E., Tarozzi, L., Decesari, S., Facchini, M. C., Birmili, W., Sonntag, A., Wiedensohler, A., Boulon, J., Sellegri, K., Laj, P., Gysel, M., Bukowiecki, N., Weingartner, E., Wehrle, G., Laaksonen, A., Hamed, A., Joutsensaari, J., Petäjä, T., Kerminen, V.-M., and Kulmala, M.: EUCAARI ion spectrometer measurements at 12 European sites – analysis of new particle formation events, Atmos. Chem. Phys., 10, 7907–7927, https://doi.org/10.5194/acp-10-7907-2010, 2010.
Manninen, H. E., Mirme, S., Mirme, A., Petäjä, T., and Kulmala, M.: How to reliably detect molecular clusters and nucleation mode particles with Neutral cluster and Air Ion Spectrometer (NAIS), Atmospheric Measurement Techniques, 9, 3577–3605, https://doi.org/10.5194/amt-9-3577-2016, 2016.
Merikanto, J., Spracklen, D. V., Mann, G. W., Pickering, S. J., and Carslaw, K. S.: Impact of nucleation on global CCN, Atmos. Chem. Phys., 9, 8601–8616, https://doi.org/10.5194/acp-9-8601-2009, 2009.
Mirme, S. and Mirme, A.: The mathematical principles and design of the NAIS – a spectrometer for the measurement of cluster ion and nanometer aerosol size distributions, Atmos. Meas. Tech., 6, 1061–1071, https://doi.org/10.5194/amt-6-1061-2013, 2013.
Nieminen, T., Asmi, A., Dal Maso, M., Aalto, P. P., Keronen, P., Petäjä, T., Kulmala, M., and Kerminen, V.-M.: Trends in atmospheric new-particle formation: 16 years of observations in a boreal-forest environment, Boreal Env. Res., 19, 191–214, 2014.
Nieminen, T., Yli-Juuti, T., Manninen, H. E., Petäjä, T., Kerminen, V.-M., and Kulmala, M.: Technical note: New particle formation event forecasts during PEGASOS–Zeppelin Northern mission 2013 in Hyytiälä, Finland, Atmos. Chem. Phys., 15, 12385–12396, https://doi.org/10.5194/acp-15-12385-2015, 2015.
Orfanidis, S. J.: Introduction to signal processing, Prentice-Hall, Inc., 1995.
Paasonen, P., Peltola, M., Kontkanen, J., Junninen, H., Kerminen, V.-M., and Kulmala, M.: Comprehensive analysis of particle growth rates from nucleation mode to cloud condensation nuclei in boreal forest, Atmos. Chem. Phys., 18, 12085–12103, https://doi.org/10.5194/acp-18-12085-2018, 2018.
Rose, C., Zha, Q., Dada, L., Yan, C., Lehtipalo, K., Junninen, H., Mazon, S. B., Jokinen, T., Sarnela, N., Sipilä, M., Petäjä, T., Kerminen, V.-M., Bianchi, F., and Kulmala, M.: Observations of biogenic ion-induced cluster formation in the atmosphere, Science Advances, 4, eaar5218, https://doi.org/10.1126/sciadv.aar5218, 2018.
Salma, I., Németh, Z., Kerminen, V.-M., Aalto, P., Nieminen, T., Weidinger, T., Molnár, Á., Imre, K., and Kulmala, M.: Regional effect on urban atmospheric nucleation, Atmos. Chem. Phys., 16, 8715–8728, https://doi.org/10.5194/acp-16-8715-2016, 2016.
Sogacheva, L., Dal Maso, M., Kerminen, V.-M., and Kulmala, M.: Probability of nucleation events and aerosol particle concentration in different air mass types arriving at Hyytiälä, southern Finland, based on back trajectories analysis, Boreal Env. Res., 10, 479–491, 2005.
Spracklen, D. V., Carslaw, K. S., Merikanto, J., Mann, G. W., Reddington, C. L., Pickering, S., Ogren, J. A., Andrews, E., Baltensperger, U., Weingartner, E., Boy, M., Kulmala, M., Laakso, L., Lihavainen, H., Kivekäs, N., Komppula, M., Mihalopoulos, N., Kouvarakis, G., Jennings, S. G., O'Dowd, C., Birmili, W., Wiedensohler, A., Weller, R., Gras, J., Laj, P., Sellegri, K., Bonn, B., Krejci, R., Laaksonen, A., Hamed, A., Minikin, A., Harrison, R. M., Talbot, R., and Sun, J.: Explaining global surface aerosol number concentrations in terms of primary emissions and particle formation, Atmos. Chem. Phys., 10, 4775–4793, https://doi.org/10.5194/acp-10-4775-2010, 2010.
Wang, Z., Wu, Z., Yue, D., Shang, D., Guo, S., Sun, J., Ding, A., Wang, L., Jiang, J., and Guo, H.: New particle formation in China: Current knowledge and further directions, Sci. Total Environ., 577, 258–266, 2017.
Wimmer, D., Buenrostro Mazon, S., Manninen, H. E., Kangasluoma, J., Franchin, A., Nieminen, T., Backman, J., Wang, J., Kuang, C., Krejci, R., Brito, J., Goncalves Morais, F., Martin, S. T., Artaxo, P., Kulmala, M., Kerminen, V.-M., and Petäjä, T.: Ground-based observation of clusters and nucleation-mode particles in the Amazon, Atmos. Chem. Phys., 18, 13245–13264, https://doi.org/10.5194/acp-18-13245-2018, 2018.
Yli-Juuti, T., Nieminen, T., Hirsikko, A., Aalto, P. P., Asmi, E., Hõrrak, U., Manninen, H. E., Patokoski, J., Dal Maso, M., Petäjä, T., Rinne, J., Kulmala, M., and Riipinen, I.: Growth rates of nucleation mode particles in Hyytiälä during 2003–2009: variation with particle size, season, data analysis method and ambient conditions, Atmos. Chem. Phys., 11, 12865–12886, https://doi.org/10.5194/acp-11-12865-2011, 2011.