the Creative Commons Attribution 4.0 License.
the Creative Commons Attribution 4.0 License.
 | 14 Dec 2018
Production of particulate brown carbon during atmospheric aging of residential wood-burning emissions
Nivedita K. Kumar
Joel C. Corbin
Emily A. Bruns
Dario Massabó
Jay G. Slowik
Luka Drinovec
Griša Močnik
Paolo Prati
Athanasia Vlachou
Urs Baltensperger
Martin Gysel
André S. H. Prévôt
We investigate the optical properties of light-absorbing organic carbon (brown carbon) from domestic wood combustion as a function of simulated atmospheric aging. At shorter wavelengths (370–470 nm), light absorption by brown carbon from primary organic aerosol (POA) and secondary organic aerosol (SOA) formed during aging was around 10 % and 20 %, respectively, of the total aerosol absorption (brown carbon plus black carbon). The mass absorption cross section (MAC) determined for black carbon (BC, 13.7 m2 g−1 at 370 nm, with geometric standard deviation GSD =1.1) was consistent with that recommended by Bond et al. (2006). The corresponding MAC of POA (5.5 m2 g−1; GSD =1.2) was higher than that of SOA (2.4 m2 g−1; GSD =1.3) at 370 nm. However, SOA presents a substantial mass fraction, with a measured average SOA ∕ POA mass ratio after aging of ∼5 and therefore contributes significantly to the overall light absorption, highlighting the importance of wood-combustion SOA as a source of atmospheric brown carbon. The wavelength dependence of POA and SOA light absorption between 370 and 660 nm is well described with absorption Ångström exponents of 4.6 and 5.6, respectively. UV-visible absorbance measurements of water and methanol-extracted OA were also performed, showing that the majority of the light-absorbing OA is water insoluble even after aging.
- Article
(1691 KB) - Full-text XML
-
Supplement
(1379 KB) - BibTeX
- EndNote


Atmospheric aerosols contribute to radiative forcing either directly by absorbing and scattering light or indirectly by acting as cloud condensation and ice nuclei. While black carbon (BC) from combustion processes is the most efficient light-absorbing aerosol component, organic aerosol (OA) may also absorb solar radiation (Alexander et al., 2008; Chen and Bond, 2010; Kirchstetter et al., 2004). This light-absorbing OA, denoted as brown carbon (BrC), absorbs most strongly at shorter UV-visible wavelengths (Hoffer et al., 2006; Andreae and Gelencsér, 2006). Global chemical-transport model estimates indicate that the BrC contribution to the positive radiative forcing of climate by anthropogenic aerosols may not be negligible (Feng et al., 2013; Lin et al., 2014; Wang et al., 2014; Jo et al., 2016).
Unlike BC, whose light absorption properties are relatively constant across sources (Bond et al., 2013), BrC is composed of a wide range of largely unknown compounds, which exhibit highly variable spectral dependence and absorption efficiencies. For example, reported imaginary indices of refraction for different organic species, which describe the absorption of these compounds, span 2 orders of magnitude (Lu et al., 2015). Because it is impractical to experimentally separate BrC from nonabsorbing OA, optical properties are typically determined for the bulk OA of a given source. The large variability of BrC fraction in combustion aerosol may contribute to the wide variation in reported properties of BrC containing OA.
Biomass burning OA, which contributes two-thirds of the global budget of directly emitted primary OA (POA), is expected to be a considerable source of BrC (Chakrabarty et al., 2010; Hecobian et al., 2010; Lack and Langridge, 2013; Liu et al., 2014). The variability in reported light absorption properties of biomass burning OA with fuel type and burn conditions remains a major obstacle complicating its treatment in climate models (Saleh et al., 2013; Lu et al., 2015). Residential biomass burning is typically characterized by a more efficient combustion, than open burning. Residential wood burning represents a substantial contribution to anthropogenic combustion emissions (Bond et al., 2013), especially in urban atmospheres, and is considered the largest source of OA in Europe during winter (Denier Van Der Gon et al., 2015).
Upon photo-oxidation, biomass-burning emissions produce secondary organic aerosol (SOA) at concentrations similar to or exceeding the POA (Grieshop et al., 2009; Bruns et al., 2015, 2016; Corbin et al., 2015a; Bertrand et al., 2017). There is a growing body of evidence that light absorption by OA changes with OH exposure (aging) owing to the production of secondary BrC or to the transformation of primary BrC (Heringa et al., 2011; Lee et al., 2014; Forrister et al., 2015; Zhao et al., 2015). However, these effects have not yet been systematically investigated and must be quantified to assess the climate effects of primary and aged biomass burning OA.
Here, we show that both POA and SOA from residential biomass burning emissions aged in controlled smog chamber experiments contain BrC. Wavelength-dependent, mass-normalized absorption cross sections (MACs) of POA and SOA are presented from online aerosol measurements as a function of aging for the first time. Complementary measurements of filter-extract absorbance (conducted in different solvents) are used to obtain the imaginary refractive index and to investigate the solubility of BrC in fresh and aged OA. While results presented here are related to flaming residential wood combustion emissions and cannot therefore be generalized, the approach used can be extrapolated for the characterization and quantification of the contribution of BrC in other primary and aged emissions.
2.1 Smog chamber experiments
Laboratory measurements were conducted in an 8 m3 Teflon smog chamber (Platt et al., 2013; Bruns et al., 2015) installed within a temperature-controlled housing. Conditions in the chamber were maintained to represent winter time in Europe, i.e., relative humidity ranging between 50 % and 90 %, at 263 K (Bruns et al., 2015, 2016). Beech wood was combusted in a residential wood stove. Primary emissions were sampled through heated lines at 413 K, diluted by a factor of ∼14 using an ejector diluter (DI-1000, Dekati Ltd.), then sampled into the chamber, which provided an additional 10-fold dilution. The overall dilution was a factor of 100 to 200. As we aimed to sample only flaming-phase emissions into the chamber, samples were taken when the modified combustion efficiency (ratio of CO2 to the sum of CO and CO2) was > 0.90. Despite maintaining the same combustion conditions, the resulting organic fraction to the total carbonaceous aerosols in the different samples was highly variable, indicating that these samples are representative of a mixture of preignition and flaming emissions (with varying contributions of each combustion stage). Finally, the resulting NOx ∕ NMOG ratios, which dramatically influence SOA formation through influencing the fate of peroxy radicals, RO2, were estimated to be between 0.035 and 0.35 ppm (ppm C)−1 (Bruns et al., 2016). These conditions can be considered as high NOx representative of urban or sub-urban conditions, where most of the RO2 radicals react with NO, rather than RO2 ∕ HO2.
After injection of the primary emissions and stabilization of the concentrations, nitrous acid (HONO) was continuously added, which dissociates upon irradiation (λ < 400 nm) and forms the hydroxyl radical (OH). Then, a 9-times deuterated butanol sample (butanol- D9, 98 %, Cambridge Isotope Laboratories) was subsequently injected into the chamber. The decay of butanol-D9 was used to infer the time-resolved OH exposure of the sampled aerosol (Barmet et al., 2012). The chamber was exposed to UV lights for ∼3.5 h.
Particles were collected onto filters (47 mm Tissuquartz, Pall Corporation, 26 L min−1 for 30–32 min) for offline optical measurements and the determination of elemental carbon (EC) mass. Three filters were collected during each experiment, namely (i) a primary aerosol filter sample (“primary”); (ii) a slightly aged aerosol (“Aged1”, OH exposure molecules cm−3 h), collected 30 min after the UV lights were switched on; and (iii) an aged aerosol (“Aged2”, OH exposure molecules cm−3 h), collected at the end of the experiment (see Fig. S1 in the Supplement for the sampling periods). A charcoal denuder was installed upstream of the filter sampler to remove organic gases. Filters were stored at 253 K until analysis.
In addition to the characterization of the particle optical properties detailed in the next section, a set of online and offline techniques were used for the characterization of the gaseous and particulate emissions before and after aging. The nonrefractory particle size-segregated chemical composition was measured with a high-resolution (HR) time-of-flight aerosol mass spectrometer (AMS) (DeCarlo et al., 2006). Uncertainties related to particle collection efficiency in the AMS are considered negligible for the relatively large particles sampled here, which in terms of volume are within the size range transmitted efficiently by the AMS aerodynamic lens (Liu et al., 2007). The collection efficiency of wood-combustion OA is expected to be unity (Corbin et al., 2015b). Details related to the AMS data analysis and calibration can be found elsewhere (Bruns et al., 2015, 2016). A scanning mobility particle sizer was used to measure the size distribution of the evolving aerosol. Organic gases were monitored by a proton transfer reaction time-of-flight mass spectrometer (PTR-MS, [H3O+] reagent ion, Ionicon Analytik GmbH) (Bruns et al., 2017), following the same procedure as in Klein et al. (2016). Additionally, elemental carbon (EC) mass concentration was measured offline using a sunset thermo-optical analyzer, following the EUSAAR2 protocol (Cavalli et al., 2010).
2.2 Optical measurements
2.2.1 Aethalometer
A dual-spot Aethalometer (Magee Scientific Aethalometer AE33, Aerosol d.o.o.) was used for real-time aerosol light attenuation measurements at seven wavelengths (λ=370, 470, 520, 590, 660, 880 and 950 nm) (Drinovec et al., 2015). The instrument measures the attenuation coefficient (bATN) of a light beam transmitted through a filter tape loaded with aerosol samples. The use of the sampling flow (here, 2 L min−1), integration time for the measurement (here, 1 min) and automated dual-spot loading compensation to obtain bATN has been described by Drinovec et al. (2015).
The loading-compensated bATN was used to infer the aerosol absorption coefficient, babs, using a constant wavelength-independent correction factor C, which accounts for multiple scattering within the filter matrix (Weingartner et al., 2003):
As discussed in detail by Corbin et al. (2018), the wavelength dependence of C can be expected to be negligible. The loading-compensated bATN at 880 nm from the AE33 is further used to infer the equivalent-BC mass concentration, MeBC:
where σATN is the mass attenuation cross section of BC deposited on the filter of the AE33. MeBC inferred from Eq. (2) only equals the true BC mass concentration, MBC, if the applied σATN is identical to the true attenuation cross section of BC, σATN,BC, and if light attenuation at 880 nm is exclusively due to BC. σATN,BC(880 nm) can be inferred from the true MAC of BC, MACBC and the true C value,
with MACBC being defined as follows:
where babs,BC is the absorption coefficient due to BC.
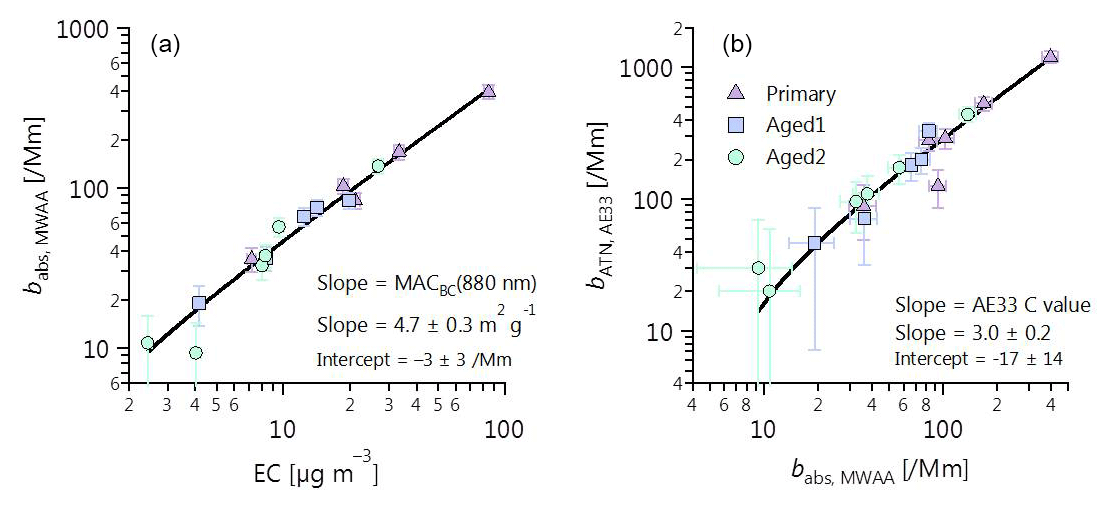
Figure 1Determination of (a) MACBC(880 nm) and (b) Aethalometer C value using MWAA absorption measurements, thermal–optical EC (EUSAAR2 protocol), and Aethalometer attenuation measurements. MWAA absorption measurements at 880 nm are determined by extrapolating the absorption coefficients at 850 nm using an α determined from the ratio between the absorption coefficients at 850 and 635nm. The aerosols were either primary (no OH exposure), Aged 1 ( molec OH cm−3 h) or Aged 2 ( molec OH cm−3 h). No difference in MAC or C value was discernable with aging (see also Fig. S2). The C value derived from σATN recommended by Drinovec et al. (2015) =2.6 compares well with the value derived in Fig. 1b.
The manufacturer default values are 1.57 for C (TFE-coated glass fiber filters) and 12.2 m2 g−1 for σATN at 880 nm, which corresponds to a MACBC(880 nm) of 7.77 m2 g−1 (Gundel et al., 1984; Drinovec et al., 2015). However, these three parameters depend on aerosol properties. Here, we have determined the C value by applying Eq. (1) to bATN measured by the Aethalometer and the absorption coefficient, , measured by a multiwavelength absorbance analyzer (MWAA; Massabò et al., 2013, 2015). The MACBC(880 nm) was determined using Eq. (4) to compare from the MWAA measurements with EC mass from the Sunset thermo-optical analyzer (see Fig. 1a, b and Sect. 4.1 for detailed discussion). Following this procedure, the MWAA and Sunset analyzer will be defined as reference methods for absorption coefficient and EC mass concentration, respectively. Note that data from these reference methods were only available with low time resolution and for a subset of all samples. Thus, the Aethalometer anchored against these reference methods was used to obtain the wavelength-dependent absorption coefficients and the eBC mass concentrations with high time resolution using Eqs. (1) and (2), respectively. Processing the loading-compensated AE33 attenuation coefficients with C value and MACBC, determined with independent MWAA and Sunset analyzer measurements, ensures that the inferred babs(λ) (Eq. 1) and MeBC (Eq. 2) have minimal bias compared to respective true values.
2.2.2 MWAA measurements
The MWAA (Massabò et al., 2013, 2015) was used as reference method for the aerosol absorption coefficient. It measures the absorption coefficient of particles deposited on standard filter samples. It is composed of five light sources (laser diodes with λ=375, 407, 532, 635 and 850 nm) placed above the filter, an automated sample changer, and three low-noise UV-enhanced photodiodes. The first photodiode is placed behind the filter for transmittance measurements (0∘ relative to the incident light, 1.5 cm from the sample), while the other two photodiodes are positioned at 125 and 165 ∘ (11 cm from the sample) to collect the back-scattered light. These transmittance and reflectance measurements are used together with a radiative transfer model (Hänel et al., 1987), which takes into account multiple scattering within the particle and/or filter layer, to retrieve both the total optical thickness and the particle-filter-layer single scattering albedo, providing the absorption coefficient values. These calculations largely follow the approach implemented in the multi-angle absorption photometer (MAAP, Petzold and Schönlinner, 2004).
2.2.3 UV-visible absorbance measurements of extracted aerosols
Filter samples were extracted for UV-visible absorbance measurements in 10 mL ultrapure water or methanol in an ultrasonic bath for 20 min at 30 ∘C. Samples were subsequently briefly vortexed (1 min) and filtered with 0.45 µm nylon membrane syringe filters following the procedure described in Daellenbach et al. (2016). Absorption spectra were measured from 280 to 500 nm using a UV-visible spectrophotometer (Ocean Optics) coupled to a 50 cm long-path detection cell (Krapf et al., 2016). Light attenuation by the OA in solution, ATNOA−sol, at a given wavelength was recorded as the logarithm of the ratio of signal intensities of the reference (solvent) (I0) and the sample (I), both corrected for background signals with the light source off. From ATNOA−sol, the absorption coefficient of OA in solution, , can be quantified as follows:
where l is the optical path length.
The absorbance measurements are aimed at inferring the imaginary part of the refractive index. For this, is transformed to the absorption coefficient of the bulk OA in the pure form, (Sun et al., 2007):
where ρOA is the bulk density of OA (assumed to be 1.5 g cm−3, typical of wood-burning OA; Sun et al., 2007; Moosmüller et al., 2009; Corbin et al., 2015a), mOA is the extracted OA mass, and Vsolvent is the solvent volume. The bulk absorption coefficient directly leads to the imaginary part of the OA refractive index, kOA, in pure form (Moosmüller et al., 2009):
Inserting Eq. (6) into Eq. (7) eventually provides the following (P. F. Liu et al., 2015):
The mass of organics dissolved in the solution could not be quantified. Therefore, we use an upper limit value for mOA, approximated as the integral of AMS-measured OA mass concentration times sample flow rate over the filter-sampling period. Accordingly, the resulting kOA values represent lower limits for the true values, as the OA extraction efficiency was not accounted for. If the OA extraction efficiency was less than unity, then the absorption (or MAC) predicted from our solvent-extraction measurements would be less than that measured (or calculated) using our real-time measurements (MWAA-calibrated Aethalometer).
2.3 Uncertainty analysis
It is important to draw a clear distinction between uncertainties related to measurement precision and accuracy and those related with experimental variability. In this section we discuss the quantifiable and unquantifiable uncertainties related with the different measurements. In the result section, we will present our confidence levels on the average parameters determined based on the experimental variability, which we judge to be the main source of variance in the data.
2.3.1 Quantifiable uncertainties
The estimated uncertainty in the AMS-derived OA mass concentrations is ∼25 %, which includes both potential biases and precision. This estimate is based on the variation in the AMS calibration factors and estimated uncertainties in the SMPS (scanning mobility particle sizer) used for the AMS calibration (Bruns et al., 2015, 2016). Uncertainties related to particle transmission efficiency in the AMS are considered negligible for the particles sampled here (Liu et al., 2007), whose volume size distribution falls within the range transmitted efficiently by the AMS aerodynamic lens (see Fig. S4). The bounce-related collection efficiency (CE) of the AMS was concluded to be unity for wood-burning OA in the literature reviewed by Corbin et al. (2015b; in their Sect. S1.2). For the present data, the comparison between the SMPS mass (predicted from fitted volume distributions using a density of 1.5 g cm−3) and the total PM predicted as AMS-OA+eBC suggests a CE value between 0.7 and 1.0 (19 % relative uncertainty), consistent with average literature values and the uncertainty estimates. The uncertainty in EC mass concentration, estimated from measurement repeats based on the EUSAAR2 protocol only, is within 7 % in our case. The precision uncertainty in the Aethalometer attenuation measurements was estimated as 15 Mm−1 based on the standard deviation of its signals prior to aerosol being injected into the smog chamber. The MWAA data have an estimated noise level and precision of 12 Mm−1 and 10 % respectively, and these uncertainties have been added in quadrature to provide the overall uncertainties shown, for example, as error bars in Fig. 1 below. To compare the MWAA and Aethalometer measurements, we determined by extrapolating the absorption coefficients measured at 850 to 880 nm using an α value determined from the ratio between the absorption coefficients at 850 and 635nm. The uncertainty associated with this extrapolation is considered negligible relative to the overall MWAA uncertainty.
2.3.2 Possible unquantified uncertainties
There are significant uncertainties in the measurement of aerosol absorption using filter-based techniques (e.g., Collaud Coen et al., 2010). Here, we have used MWAA measurements as a reference to scale the Aethalometer data, using a single C value. The correction factor C, which accounts for scattering effects within the filter matrix (Drinovec et al., 2015), may depend on the aerosol sample (Collaud Coen et al., 2010). In this study, we evaluated the variability in this factor for our primary and aged samples, by directly comparing the Aethalometer to MWAA measurements, as discussed below. The MWAA has been previously validated against a polar nephelometer and a MAAP (Massabo et al., 2013), which, in turn, has been validated against numerous in situ methods (e.g., Slowik et al., 2007). The excellent correlation between MWAA and EC in our study (discussed below) supports the high confidence in the MWAA filter-based absorption measurements conducted here. Another significant source of uncertainty in filter-based absorption measurements is the possible sorption (or evaporation) of volatile organics on (or from) the filter material. This may lead to an overestimation (or underestimation) of OA absorption. However, we have minimized sorption artefacts by utilizing a charcoal denuder. We have obtained an excellent correlation between OA absorption measurements derived from the MWAA-calibrated Aethalometer and from quartz filter samples (see discussion below, Fig. 6 in the main text and Fig. S13 in the Supplement). Although both of these techniques involved filter sampling, their sampling timescale is an order of magnitude different, and a difference is therefore expected if sorption (or evaporation) caused a substantial bias in our results. We therefore conclude that it is unlikely that artifacts associated with filter sampling have biased the absorption measurements. Finally, uncertainties related to pyrolysis during thermo-optical analysis may bias EC measurements. Such uncertainties arise from unstable organic compounds, and can be significant for biomass-burning samples, leading to biases on the order of 20 % for EC (e.g., Schauer et al., 2003; Yang and Yu, 2002). To minimize these biases we applied the EUSAAR2 protocol. The optical properties of such organics are generally different from BC; therefore, the excellent correlation between MWAA and EC data in Fig. 1a suggests that pyrolysis effects were not a major source of uncertainty in our data set.
3.1 Determination of absorption Ångström exponents and mass absorption cross sections
In this section we describe the methodology adapted for the determination of the MACs for the different aerosol material from the Sunset, MWAA and Aethalometer measurements. The assumptions and limitations underlying these calculations are clearly stated. We also explain the relationship between the MACs and the wavelength dependence of the overall absorption.
3.1.1 Definition of the absorption Ångström exponent
The wavelength dependence of the overall absorption due to both BC and BrC has often been described assuming a power law:
where α is the Ångström absorption exponent, often determined by fitting the absorption coefficient measurements across the entire wavelength range. Equation. (9) is an empirical simplification, which breaks down when different components with different spectral dependences contribute to the absorption, e.g., a mix of BrC and black carbon (e.g., Moosmüller et al., 2011). In practice, different values of α would be obtained for different choices of λ ranges, and therefore we alternatively calculated two-wavelength absorption exponents according to
where λ is a wavelength of interest (in nm) and λref is the reference wavelength, here 880 nm. This reference wavelength was chosen because BC is expected to fully dominate light absorption in this range (Laskin et al., 2015).
Black carbon is known to have an α between 0.9 and 1.1 (Kirchstetter et al., 2004; Bond et al., 2013; S. Liu et al., 2015), whereas BrC, which preferentially absorbs at shorter wavelengths, has a higher α (Saleh et al., 2013; Laskin et al., 2015). Thus, we interpret an increase in α(λ,λref) of the total aerosol as being due to an increased contribution of BrC to the total absorption. Values of α(λ,λref) can potentially change due to other effects such as a wavelength-dependent lensing effect on absorption by BC (e.g., Lack and Langridge, 2013) or the restructuring of BC aggregates during aging. The former effect was negligible under our conditions, as elaborated on below. The latter, if it occurs during aging, would be attributed to SOA absorption in our approach. However, this is not an issue if our values are accordingly applied in, for example, model simulations, following the same assumption as in our approach. This means that the potential restructuring effects must implicitly be considered within the MAC(λ) of SOA, while the MAC(λ) of BC must be kept fixed.
3.2 Determination of MACBC and MACPOA using the absorption Ångström exponent
In a mixture of n absorbing species, the total absorption at any wavelength may be written as the sum of the absorbance of each of the species. Accordingly, Eq. (10) can be expressed for a multicomponent system
where the right-hand side follows the general definition of MAC along the lines of Eq. (4). Mi and MACi are the mass concentration and MAC, respectively, of the ith species, with n absorbing species in total. By considering that the light absorption at λref=880 nm is exclusively due to BC, and by defining BC to be the nth species, Eq. (11) can be written as
In Eq. (12), the summation now only goes over the n−1 organic species, which contribute to light absorption.
The fresh combustion aerosol exclusively contains BC and POA as absorbing species. For the data at time t0 before the start of photo-oxidative aging, Eq. (12) simplifies to
In Eq. (13), MOA(t0) is the mass concentration of primary organic aerosol measured by the AMS at t0. MACBC(t0, 880 nm) was inferred from the MWAA and Sunset thermo-optical analysis and shown to be independent of the experimental conditions (Sect. 4.1; Fig. 1a). Absorption coefficients babs(t0λ) are obtained from the high time resolution attenuation measurements by the Aethalometer referenced to the MWAA absorption measurements as described above. α(t0λ, 880 nm) is derived from babs(t0,λ) and babs(t0, 880 nm) using Eq. (10). We have intentionally formulated Eq. (13) to highlight that the retrieved MACOA(t,λ) depends mainly on the input MOA. Correspondingly, the retrieved MACOA(t,λ) is mainly sensitive to potential AMS calibration biases. This leaves only two free parameters in Eq. (13), MACBC(t0, λ) and MACPOA(t0, λ). These were determined by fitting Eq. (13) to α(t0λ, 880 nm), MOA(t0), MACBC(t0, 880 nm) and babs(t0, 880 nm) data measured in all experiments for fresh emissions at t0. This approach contains the implicit assumption that the two MAC values are also independent of experimental conditions, and therefore these MACs should be considered as average values. The accuracy of these MAC values obviously depends on the accuracy of the absorption and mass measurements. First, a systematic bias in the C value potentially caused by a systematic bias in the MWAA measurements propagates to an identical bias in both MACBC(t0, λ) and MACPOA(t0, λ). Second, a systematic bias in the Sunset EC mass measurements yields a corresponding inverse bias in MACBC(t0, λ), while MACPOA(t0, λ) remains unaffected. Third, a systematic bias in the AMS POA mass yields a corresponding inverse bias in MACPOA(t0, λ), while MACBC(t0, λ) remains unaffected. Eq. (13) shows that α of the primary aerosol at a certain wavelength is largely driven by MACPOA(t0,λ), i.e., the optical properties of POA, and by the ratio , which reflects the relative contributions of POA and BC to total primary aerosol mass.
3.3 Determination of MACSOA
The MAC of SOA, MACSOA, can be generally defined as follows:
where babs,SOA and MSOA are the absorption coefficient and mass concentration of SOA, respectively. In the aged aerosol, which contains the absorbing species BC, POA and SOA, babs,SOA is the difference of the total absorption minus the absorption by POA and BC:
The absorption by POA and BC in the aged aerosol is a priori unknown, but can be calculated under certain assumptions. The first assumption is that SOA does not contribute to absorption at 880 nm: . The second assumption is that the α values defined by Eq. (12) for primary emissions do not change during aging, such that . The latter approximation is based on the underlying assumptions that the MAC of POA is not altered by aging and that the proportions of POA and BC mass lost to the wall are identical. Under these assumptions becomes
Note that inferring from babs(t, 880 nm) implicitly accounts for the decrease in the BC and POA absorption due to wall losses.
MSOA was obtained as total organic minus POA mass concentration:
The POA mass concentration in the aged aerosol can be inferred from the initial OA mass concentration in the fresh emissions by accounting for the wall losses using Eq. (S1) in the Supplement and the wall loss time constant τ (see Sect. S1 in the Supplement):
Inserting Eqs. (15)–(18) into Eq. (14) provides the final equation for inferring MACSOA.
MACSOA can be calculated for every data point in time and for all Aethalometer wavelengths from 370 to 660 nm (MACSOA defined to be zero at λ≥ 880 nm), as all quantities on the right-hand side of Eq. (19) are available from either the Aethalometer or AMS measurements or are otherwise known. It can be seen from Eq. (19) that the mass concentrations used to calculate MACSOA solely originate from AMS data, thus being consistent with the calculation of MACPOA (see above). Eq. (19) is based on the assumption that POA is “chemically inert”, i.e., no chemically induced changes of MPOA and MACPOA occur. Such chemically induced changes of absorption coefficient by POA, through a change of MPOA or MACPOA, if they occur, are assigned to the absorption by SOA, thus resulting in a corresponding adjustment of the inferred MACSOA.
3.4 Mie calculation to relate kOA with MACOA
The imaginary part of the refractive index of an aerosol component is an intensive material property. However, the MAC of such an aerosol component additionally depends on the size and morphology of the aerosol (except for the Rayleigh regime). The online aerosol absorption measurements provide estimates for MAC values, while the UV-visible absorbance measurements of filter extracts provide the imaginary part of the refractive index. We used Mie calculations in order to compare the two quantities. The kOA(λ) obtained from the filter extracts is converted to a MACOA,bulk by assuming that all OA is present in homogeneous spherical particles with a diameter distribution identical to the mobility diameter distribution measured by the SMPS. In this manner, MACOA,bulk becomes equal to the mass-weighted average (= volume-weighted average) of the diameter-dependent MAC:
Here, Ni and di are the number of particles and particle diameter, respectively, in the ith size bin, and nOA is the real part of the refractive index of the OA (which is assumed to be nOA =1.5 typical for organic material; Lu et al., 2015). The MAC of particles with diameter di, MAC, was calculated using the Mie code by Peña and Pal (2009) (incorporated into Igor Pro 6.3, WaveMetrics, OR, USA, by Taylor et al., 2015). MAC also depends on the density of OA, for which we assume a value of ρOA=1.5 g cm−3 (see Sect. 2.2), as the volume-specific absorption cross section obtained from Mie theory needs to be converted to a mass-specific absorption cross section. We note that as we have used the same value of ρOA in the calculation of both MAC and kOA(λ), MACOA,bulk becomes independent of the assumed ρOA value.
Assuming spherical particles and neglecting the presence of BC in these particles may seem inappropriate. However, calculations considering BC and assuming core-shell morphology revealed (1) limited sensitivity of the resulting MACOA to this assumption and (2) a higher than measured lensing effect. Therefore, a substantial fraction of the OA seems to be externally mixed and to dominate the measured size distribution (see also Sect. 4.1).
4.1 Verification of MACBC and C value
We have independently determined the MACBC(880 nm) and the Aethalometer C values under our conditions, as follows. We determined MACBC(880 nm) from the regression between the absorption coefficients at 880 nm obtained from the MWAA and the EC mass measured by the Sunset analyzer (Fig. 1a). The slope of this regression may be used to estimate the MACBC(880 nm), which we retrieved as 4.7±0.3 m2 g−1 by an uncertainty-weighted linear least-squares fit. The corresponding intercept was not significantly different from zero ( Mm−1). Our MACBC(880 nm) is not statistically significantly different from the value recommended by Bond et al. (2006) for externally mixed BC (extrapolating their MACBC(550 nm) to 880 nm by assuming α=1 provides MACBC(880 nm) m2 g−1). The strong correlation between and EC in Fig. 1a shows that MACBC(880 nm) did not vary with aging during our study (see also Fig. S2a). It also indicates that measurement artefacts for both instruments were negligible, as the fundamental differences between the two techniques mean that any artefacts are unlikely to be similar between them (charring for EC vs. adsorption artefacts for MWAA). Our absorption coefficient measurements also provide insights into particle mixing state in this study. Since a single MAC adequately described our samples at all levels of aging (Figs. 1a and S2a), in spite of a factor of 3.3 average increase in the aerosol mass, our samples cannot be adequately described by a core-shell Mie model. Such a core-shell model would predict an absorption enhancement by a factor of ∼1.8 (Bond et al., 2006) for the observed OA mass increase with aging, which was not observed in our case. This observation is also supported by the time-resolved attenuation measurements at 880 nm using the Aethalometer (Fig. S3), suggesting little (< 10 %) to no increase in the attenuation coefficients upon SOA formation. We emphasize that this conclusion does not indicate that no internal mixing occurred, but rather that the simplified concept of negligible mixing better describes our data than the equally simplified concept of a core-shell description of coatings that completely envelop the central BC core. This may be due to the complex morphology of internally mixed BC, which has been previously observed for wood burning particles (e.g., China et al., 2013; S. Liu et al., 2015; Liu et al., 2017). It may also be related to the fact that OA and BC are emitted during separate phases of combustion. OA-rich particles are emitted during the pre-flaming pyrolysis stage of combustion, whereas most BC is emitted during flaming combustion (Heringa et al., 2011; Corbin et al., 2015a, b; Haslett et al., 2018). These two stages of combustion may coexist in different regions of the stove, particularly during simulated real-world usage. As lensing effect was negligible in our case; we have assumed that the aerosol optically behaves as an external mix between BC and BrC during Mie calculation (see Sect. 3.4). We note that while this assumption is important for estimating the BC absorption, the conclusions drawn about the BrC absorption are not very sensitive to the assumed morphology.
We determined time-resolved wavelength-dependent absorption coefficients as follows. We used the Aethalometer to obtain filter attenuation coefficients with high time resolution, which were then calibrated to obtain absorption coefficients by deriving the factor C (Eq. 1) using the MWAA measurements of filter samples. C was obtained from an uncertainty-weighted linear least-squares fit as 3.0±0.2 (Fig. 1b); the intercept of the fit was not significantly different from zero, within 2 standard deviations (). A very strong correlation could be observed between MWAA and Aethalometer (Fig. 1b), implying that C is independent of the type of the aerosol sampled (see also Fig. S2b). Therefore, we used a single C value to obtain time-resolved wavelength-dependent absorption coefficients from the Aethalometer attenuation measurements at the different wavelengths for primary and aged aerosols.
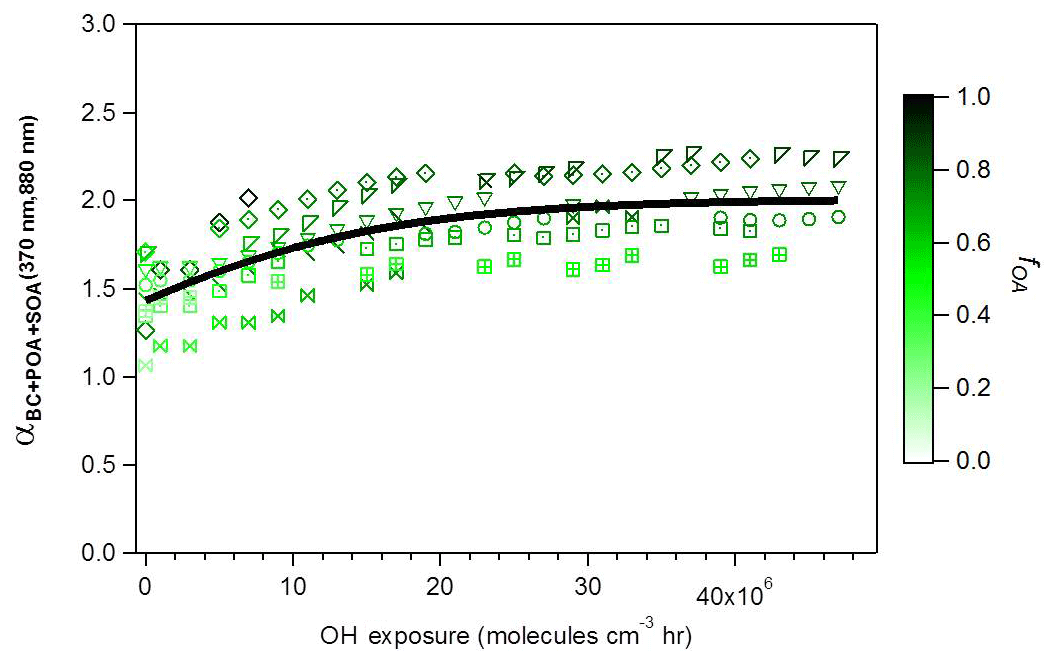
Figure 2Evolution during photochemical aging of (370 nm, 880 nm) (two-wavelength Ångström exponent calculated using total absorption data at 370 and 880 nm), where the different symbols denote individual experiments. Data are colored by the OA mass fraction . The black line is a fit to guide the eye.
Note that the manufacturer's default values, which were not applied in our case, are 1.57 for C (using TFE-coated glass fiber filters) and 12.2 m2 g−1 for σATN at 880 nm (Gundel et al., 1984; Drinovec et al., 2015). The C value determined here is larger than the manufacturer-default value for the AE33, resulting in smaller absorption coefficients. However, the calculated σATN at 880 nm (13.8 m2 g−1), which can be retrieved as the product of the C value and MACBC(880 nm) (Eq. 3), is similar to the factory-default σATN. Therefore, our calibrated MeBC, calculated from the attenuation coefficients using σATN (Eq. 2), are similar to the factory-default MeBC. We note that MeBC has not been used for MACOA calculations, and is only used for the calculation of the mass fractions of BC and OA for display purposes (Figs. 2, 3, 7 and 8).
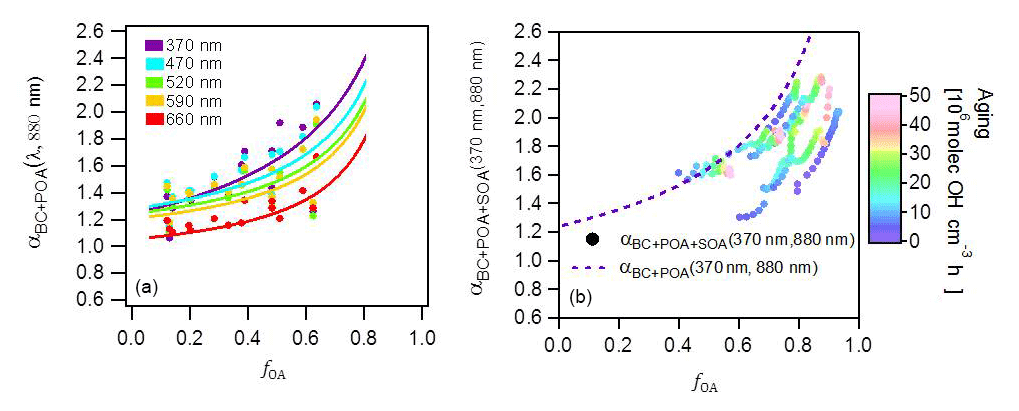
Figure 3(a) Relationship of αBC+POA (λ, 880 nm) to fOA for seven wavelengths for primary emissions. Data are colored by the wavelength. Curves are fits of Eq. (13) to the data. Each point represents the average of one experiment and therefore the variability in fOA is related to the variability in the emission composition between experiments. (b) Relationship of (370, 880 nm) to fOA for several experiments for aged aerosols. Data are color coded by the OH exposure. The variability in fOA is due to SOA formation with aging; data from several experiments are shown, which explains the wide range of fOA at low OH exposures. Note that more data are included in (a) than (b), as primary emissions for some experiments were not aged.
4.2 Optical properties of BC, POA and SOA
In this section we derive the wavelength-dependent mass absorption cross sections for BC, POA and SOA. In Fig. 2, we display the evolution of α (370, 880 nm) as a function of OH exposure. Figure 3 shows the relationship between α(λ, 880 nm) and fOA for primary and aged aerosols.
4.2.1 The α values of primary emissions
The α (370, 880 nm) values computed for the primary aerosol (OH exposure =0 molecules cm−3 h) ranged between 1.3 and 1.7 (Fig. S5), which is within the range reported previously for biomass-burning emissions (Kirchstetter et al., 2004; Lewis et al., 2008; Zotter et al., 2017). The α(λ, 880 nm) is slightly higher than that of pure BC (∼1.2; Bond et al., 2013; Zotter et al., 2017) for small fPOA, while increasing fPOA corresponded to a distinct increase in α(λ, 880 nm). This increase provides clear evidence for the contribution of primary BrC to the absorption at lower wavelengths (shown explicitly in Eq. (13). The fPOA ranges from 0.12 to 0.63, which is lower than fPOA reported for open burning emissions (e.g., fPOA∼0.75, Ulevicius et al., 2016), because our wood-stove emissions feature a more efficient combustion. As illustrated in Fig. S5, the observed absorption spectra have steeper gradients with decreasing wavelength compared to the lines of constant α. Such a systematic increase in α(λ, 880 nm) with decreasing λ reflects the more-efficient light absorption by BrC at shorter wavelengths (Moosmüller et al., 2011) and shows that the power law wavelength dependence is an inaccurate oversimplification for this mixed aerosol.
4.2.2 Evolution of α with aging
Figure 3b shows that upon aging, the OA fraction rapidly increased (a typical time series of raw data is shown in Fig. S1), reaching an average value of 0.81 (full range for aged OA: 0.74 < fOA < 0.89) at high OH exposures (> 2×10⁷ molecules cm−3 h) and resulting in a corresponding increase in (370, 880 nm). The increases in (370, 880 nm) and fOA were always correlated and plateaued at OH exposures beyond molecules cm−3 h, as seen in Fig 2. Also, note in Fig. 2 that at the highest OH exposures, the highest values of (370, 880 nm) were reached, on average 1.8, during experiments where the fOA was highest. Such strong correlation between SOA formation and (370, 880 nm) suggests the production of substantial amounts of brown SOA. A similar relationship is observed between , 880 nm) and fOA for higher wavelengths, as shown in Fig. S6. Similar to the case of POA, a systematic decrease in α(λ, 880 nm) with increasing λ is observed, reflecting the preferential absorption of BrC SOA at shorter wavelengths. We note that (370, 880 nm) as a function of fOA for all experiments lies below the overall trend for the primary aerosol (dashed line in Fig. 3b), implying that MACSOA(370 nm) was smaller than MACPOA(370 nm).
4.2.3 Determination of MACBC and MACPOA
We determined best-fit values for MACBC(λ) and MACPOA(λ) from the data shown in Fig. 3a. Figure 3a includes least-squares fits of Eq. (13) to the data, with MACBC(λ) and MACPOA(λ) as fit parameters. The fit results are shown in Table 1. The obtained fit value of MACBC(370 nm) was 13.7 m2 g−1 (GSD 1.1, 1σ uncertainty 12.4–15.1 m2 g−1), higher but not statistically significantly different from the range estimated based on Bond et al. (2013), considering the uncertainties of both the αBC values and the MACBC(520 nm). Meanwhile, the mean MACPOA(370 nm) value, equal to 5.5 m2 g−1, obtained under our conditions for domestic wood burning is ∼2.4 times higher than that obtained by Saleh et al. (2014) for open biomass burning primary emissions, suggesting the presence of more-strongly absorbing organic material under our conditions (this comparison is continued in Sect. 4.3).
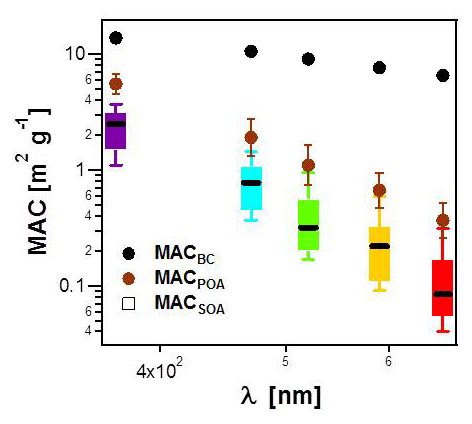
Figure 4MACSOA(λ) calculated from several smog chamber experiments plotted as boxes and whiskers as a function of wavelength (also shown by the color of the bars). The thick black lines, the boxes and the whiskers mark the medians, the quartiles and the 10th and the 90th percentiles, respectively. Also shown are the MACBC(λ) and MACPOA(λ) reported in Table 1. Note that MACSOA(880 nm) and MACPOA(880 nm) are zero by definition.
4.2.4 Determination of MACSOA
The MACSOA(λ) values, determined using Eq. (19), are shown in Fig. 4 and Table 1. MACSOA(370 nm) was 2.2 m2 g−1 (GSD 1.39), a factor of 2.5 smaller than MACPOA(370 nm), but approximately an order of magnitude higher than values reported for ambient oxygenated aerosols or laboratory SOA from biogenic and traditional anthropogenic precursors such as terpenes and methyl-benzenes (Clarke et al., 2007; Lambe et al., 2013; Romonosky et al., 2015; Liu et al., 2016). The predominant SOA precursors identified in wood smoke comprise (methyl)naphthalene(s) and phenol derivatives from lignin pyrolysis (Bruns et al., 2016; Ciarelli et al., 2017), the oxidation products of which are expected to be highly light-absorbing due to the presence of aromatic moieties in the SOA (Laskin et al., 2015; Bruns et al., 2016). In this regard, it is not surprising that the MACSOA(370 nm) values obtained here are similarly high to those obtained from methanol-extracted SOA from guaiacol and naphthalene oxidation (0.5–3.0 m2 g−1, Romonosky et al., 2015).
Table 1Geometric mean and standard deviations of the determined MACs of BC, POA and SOA at different wavelengths. Uncertainties were obtained from fits of Eq. (13) for MACBC and MACPOA, while for MACSOA uncertainties GSD values are geometric standard deviation values on the MACSOA average values from all experiments. These uncertainties do not include uncertainties related to the determination of MACBC(880 nm). By definition, BrC absorbance at 880 nm is zero.
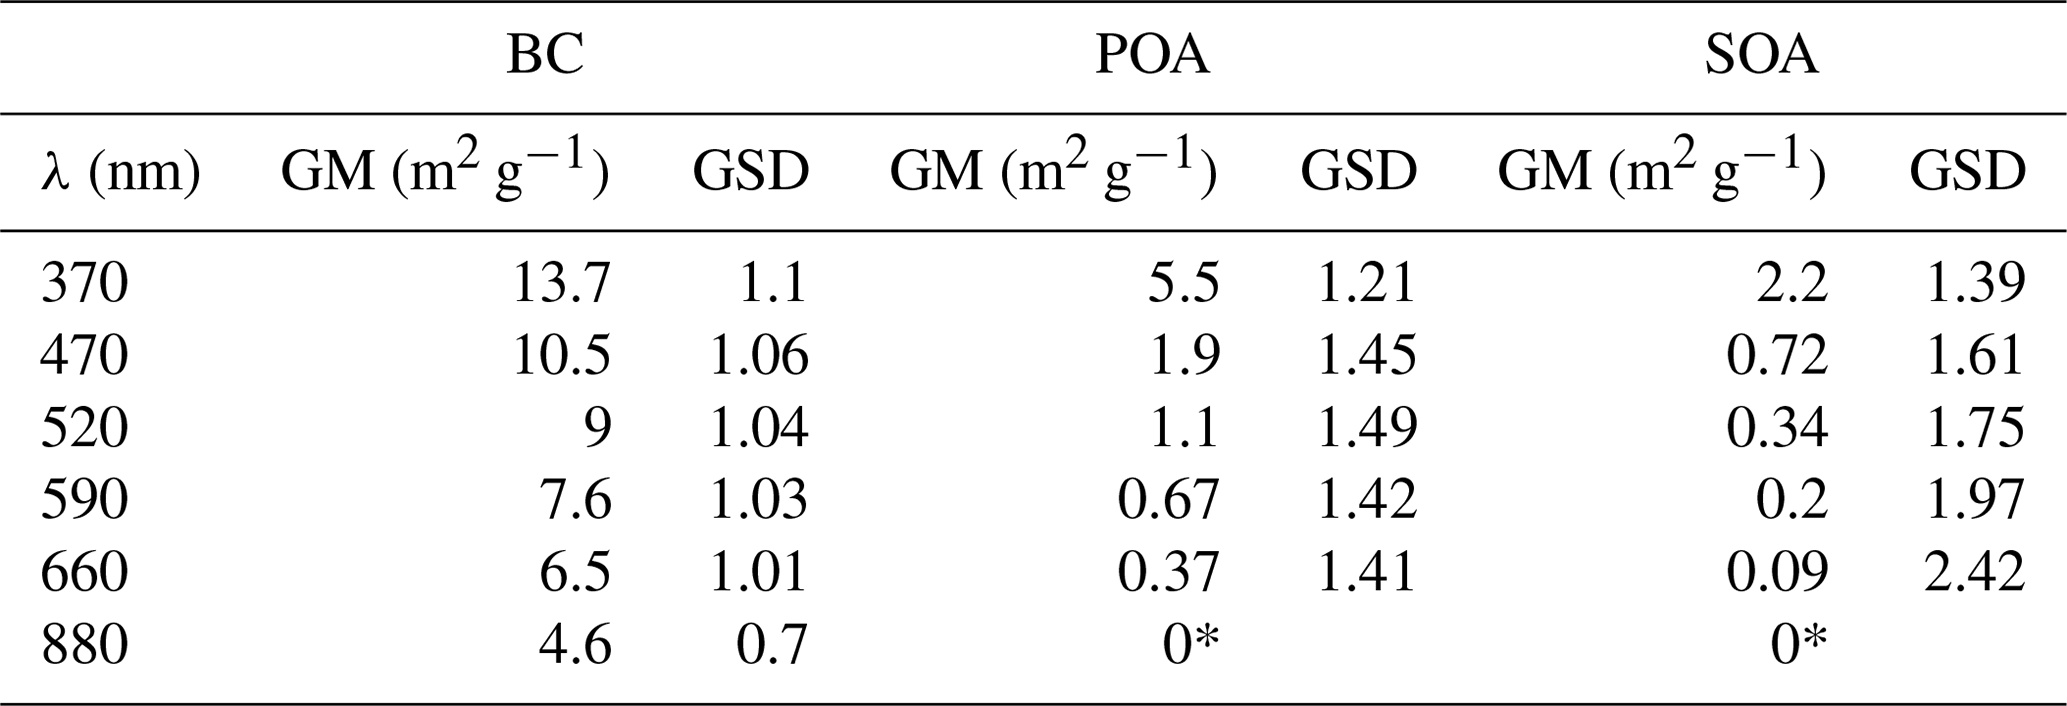
* By definition.
4.2.5 Uncertainties and variability in MACBC, MACPOA and MACSOA
Table 1 shows the fitting errors related with MACBC(λ), MACPOA(λ) and MACSOA(λ), arising from our measurement precision and experimental variability. These fitting errors are greater than our estimated uncertainties in the absorption coefficients measured by MWAA (10 %), and comparable to our estimated uncertainty in OA mass measured by AMS (30 %). The residuals in the fitted MACBC(λ) are relatively low (< 10%), increasing with decreasing λ. By contrast, the uncertainties in the fitted MACPOA(λ) are much higher (GSD = 1.2–1.5) and increase with increasing λ. The relative residuals between the measured and fitted α(λ, 880 nm) for primary emissions showed a mean bias and RMSE of 0.07 and 0.13, respectively (Fig. S7), indicating that our fitted MAC results provide a good description of the data set. MACSOA(λ) values determined were highly variable between experiments with a GSD =1.39 and 2.42 for λ=370 and 660 nm, respectively. In Fig. S10, we show the distribution of MACSOA(λ) values as boxes and whiskers against OH exposure, showing no particular dependence of these values on aging, as will be discussed below. Therefore, we expect the fitting errors in MACSOA and of MACPOA to be mainly related to true changes in the organic aerosol chemical composition between different burns, since the variability of MACBC(λ) was relatively small. In Sect. 4.3, we discuss this variability further using the results of an additional and independent analysis.
4.2.6 MACBC, MACPOA and MACSOA wavelength dependence
The relationships between the MACSOA(λ), MACPOA(λ) and MACBC(λ) and wavelength appear to fall on three unique lines in the range 660 to 370 nm when plotted in log–log space, as shown in Fig. 4 (Fig. S8 shows the same data plotted on a linear scale). This indicates that a power-law approximation provides a good description of the behavior of individual components within this wavelength range from 370 to 660 nm. Accordingly we fitted the power law coefficients to the data shown in Fig. 4 (, with i= BC, POA or SOA) and fitting parameters are shown as multivariate probability density functions in Fig. S9. This yielded αBC=1.2, αPOA=4.6 and αSOA=5.6, with corresponding uncertainties of approximately 20 % (complete details of the uncertainties are provided in Table S1 in the Supplement). Note that αBC in the range 660 to 370 nm obtained from this fit is very similar to αBC values that can be inferred by extrapolating the data shown in Fig. 3a to fOA=0. The high α values obtained for the organic fractions are consistent with previous measurements for BrC-containing POA (e.g., Chakrabarty et al., 2010, 2013).
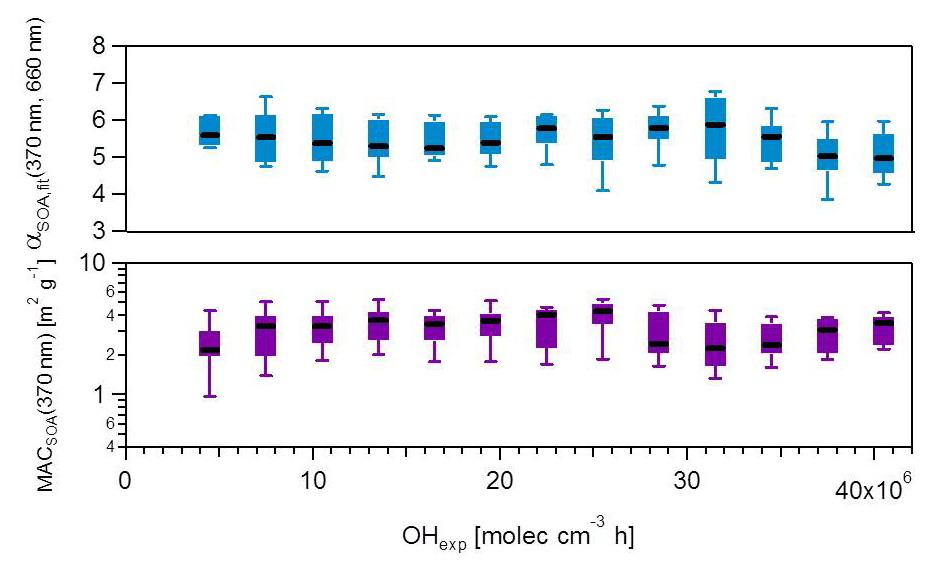
Figure 5MACSOA(370 nm) and αSOA,fit(370, 660 nm) calculated from several smog chamber experiments plotted as a function of OH exposure. The boxes mark the 25th and 75th percentiles, while the whiskers mark the 10th and the 90th percentiles. MACSOA(370 nm) was obtained using Eq. (19). αSOA,fit(370, 660 nm) was obtained from fitting the MACSOA values in the range 370–660 nm for the different experiments against the wavelength. αSOA,fit(370, 660 nm) is the slope of the linear fit applied after log transforming the data. MACSOA(λ) for higher wavelengths are shown in Fig. S10.
4.2.7 Evolution of MACOA with aging
In Fig. 5, we examine whether the absorption profile of SOA evolved with aging. A change in MACSOA(370 nm) or αSOA with increasing OH exposure may indicate either a change in the mass-specific absorption of the condensing SOA species with time, or a change (e.g., “bleaching”) in the MAC of pre-existing POA. Figure 5 indicates that neither of these scenarios was the case. Both MACSOA(370 nm) and αSOA were statistically independent of the OH exposure, for exposures up to 40 molec. OH cm−3 h. This signifies that under our conditions and within our measurement uncertainties the optical properties of the additional organic mass formed was constant with aging, under the assumption that the light-absorption properties of POA were negligibly influenced by aging. Most of the variability in MACSOA(λ) discussed above is therefore related to experiment-to-experiment differences rather than to the extent of OH exposure, as is also shown below.
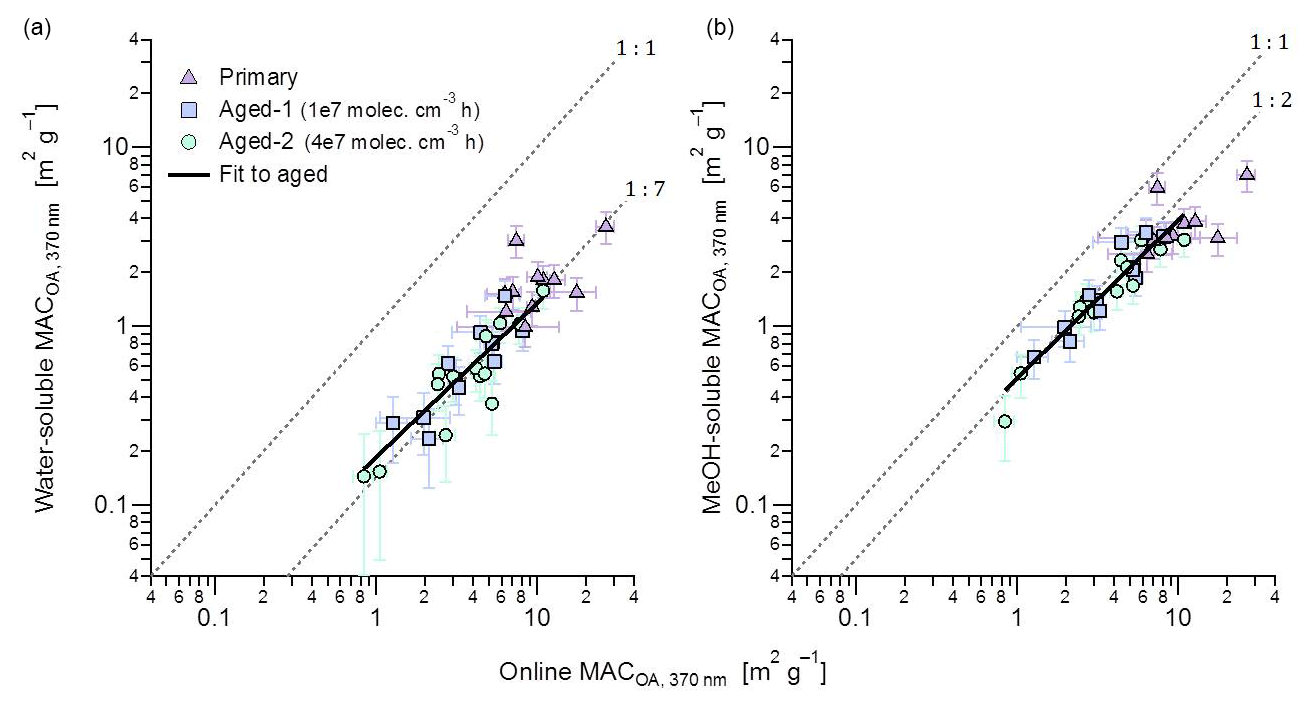
Figure 6Comparison of the MACOA(370 nm) of aged aerosols determined from online and offline absorption measurements. The offline filter-extraction method directly quantified properties of total OA (ordinate), while the average of MACSOA and MACPOA weighted with respective mass concentrations is shown on the abscissa. The panels show offline measurements of (a) water-soluble OA and (b) methanol-soluble OA. Fits are to aged data only due to the significantly smaller scatter of those data, although primary data on average follow similar trends. The fitted slopes and intercepts are, respectively, (a) 0.13±0.02 and 0.05±0.06 m2 g−1 and (b) 0.12±0.1 and 0.38±0.03 m2 g−1.
4.3 Solubility of BrC in methanol and water
Figure 6 shows the MACOA(370 nm) determined from the water and methanol extracts against the MACOA(370 nm) determined from the online measurements. The MACOA(370 nm) from online measurements was estimated by subtracting the contribution of BC, assuming a constant MACBC(370 nm) =13.7 m2 g−1 as obtained in this work (Table 1). We performed all the calculations and comparisons at λ=370 nm, as the signal-to-noise ratio of the absorption coefficients measured by UV-visible spectroscopy and the contribution of BrC to the total carbonaceous absorption is highest at this wavelength. The MAC of the extracts was computed from the kOA through Mie calculations. Repetition of both water and methanol extracts yielded results that were consistent within 10 % (Fig. S11). Average raw absorption spectra are shown in Fig. S12.
Figure 6b shows excellent correlation between the MACOA(370 nm) values obtained from the kOA of the solvent-extracted OA with the in situ method described above. The Pearson correlation coefficient was 0.8, for both solvents. This correlation suggests that none of the assumptions employed in either method led to substantial errors in precision, providing direct support for our results. A similar relationship was observed between kOA and the MACOA(370 nm) determined from the online measurements (Fig. S13), showing that this relationship is not sensitive to assumptions underlying the Mie calculations. It further suggests that the wide variability observed in the MACOA values of different burns, as seen Fig. 6, most likely reflects real variability in the optical properties of POA and SOA rather than random noise or experimental errors in the retrieved quantities. MACOA retrieved based on the kOA of the water-soluble OA show substantially more scatter than observed in Fig. 6b (for both primary and aged data), suggesting a variable extraction efficiency in the case of water, which we also attribute to variability in the OA composition.
The data in Fig. 6b show that the methanol extracts correspond to a MAC about 50 % smaller than that of the online data. The scatter in the data is significantly reduced for the aged data (note that, in this analysis, aged OA refers to the sum of POA and SOA, since the reported values represent all OA after aging). This reduced scatter is expected, considering that aging is likely to result in more-spherical particles. We have assumed particle sphericity when interpreting the SMPS data and performing the Mie analysis. While the propagation of quantifiable uncertainties leads to an error estimate of ∼25 %, considering the simplifications that were necessary for the Mie analysis, we consider a 50 % closure to be an adequate agreement. Despite this, we cannot exclude additional methanol-insoluble brown carbon. Conversely, the fit in Fig. 6a indicates that the apparent MAC of water-soluble species was one-quarter of the respective methanol MAC, according to the slope of only 12±3 %. Only the aged data have been fit to illustrate this point. This strong disagreement shows that the BrC in our samples was hardly water soluble, even for the most aged samples. As we expect that the majority of OA in our samples formed by wood pyrolysis (Shafizadeh, 1984; Di Blasi, 2008; Corbin et al., 2015b), we can compare our results directly to those of Chen and Bond (2010), who also found that primary wood-pyrolysis BrC was water insoluble. Moreover, the poor water solubility of the light-absorbing components of SOA (Zhang et al., 2011) is in line with the results by Bruns et al. (2016), who showed that SOA precursors during these experiments were predominantly aromatic compounds.
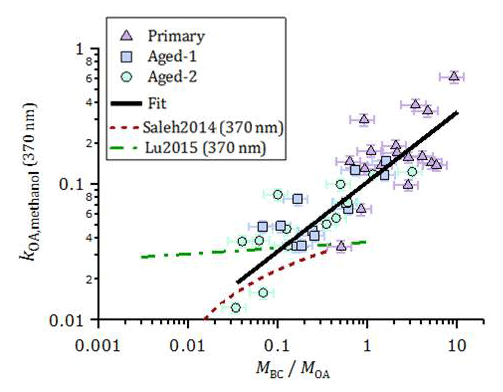
Figure 7Imaginary part of the OA refractive index at 370 nm, obtained from offline UV-visible spectroscopy of methanol OA extracts, plotted as a function of fOA. The data could be empirically represented by a linear function in the log–log space, in the measurement range. The ordinary least-squares fit is ( log(. Also shown are parameterizations of kOA(370 nm) for open burning against MBC∕MOA estimated based on the online kOA (550 nm) measurements in Saleh et al. (2014) and Lu et al. (2015), using the kOA wavelength dependence reported by the respective authors.
4.4 Comparison of kOA with the literature
The results above highlight the variability in the OA absorption properties. In this section, we discuss potential reasons for this variability and compare our results to the literature. Figure 7 shows the imaginary refractive index of methanol-extracted OA at 370 nm, kOA,methanol(370 nm) (Eq. 8), as a function of MBC ∕ MOA and aging. The data are plotted against MBC ∕ MOA instead of fOA to allow for a direct comparison with the literature (see Fig. S14 for a plot against fOA). An approximately linear trend of kOA,methanol(370 nm) with MBC ∕ MOA is seen in log space. This aging-independent relationship may be useful in, for example, atmospheric scenarios where wood-burning OA is a dominant aerosol component but its exact degree of aging is unknown. The decrease in MBC ∕ MOA caused by formation of SOA during aging results in a concurrent decrease in kOA,methanol(370 nm), implying that kSOA < kPOA . This result is consistent with the smaller MAC of SOA compared to POA obtained from online measurements (Table 1) and with recent results reported by Sumlin et al. (2017). We emphasize that the derived quantity here is the imaginary refractive index k of the total aged OA, not the SOA.
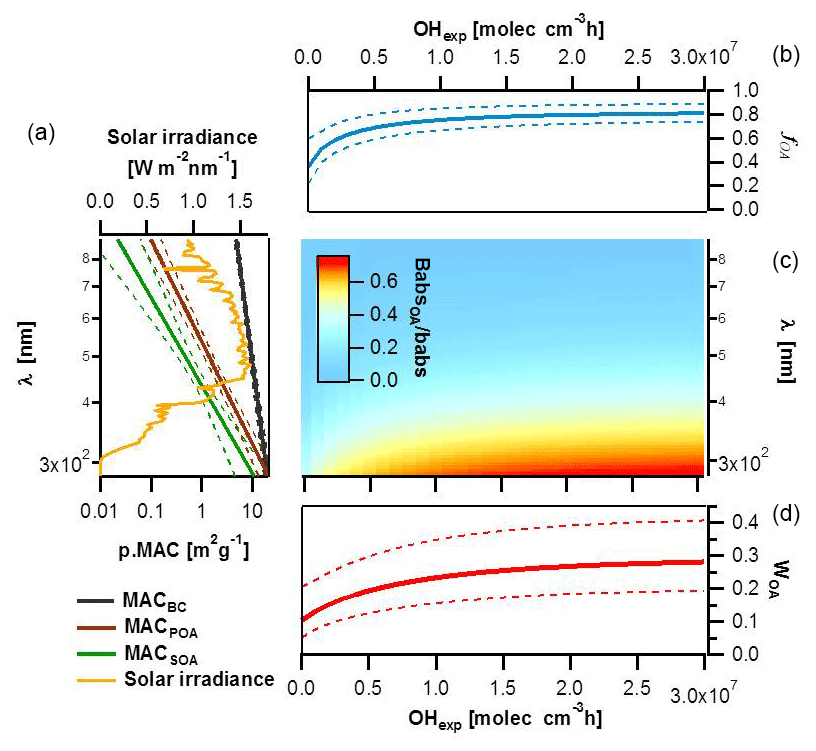
Figure 8Impact of BrC absorption on total primary and secondary wood-burning-aerosol absorption. (a) MACs of different particle components (BC, POA and SOA) along with their corresponding standard deviations plotted as a function of wavelength based on smog chamber data and compared to the solar irradiance spectrum. (b) Species average relative abundance in the smog chamber (fOA) plotted as a function of the OH exposure. (c) Image plot showing the OA absorption coefficient relative to the total aerosol absorption as a function of wavelength and OH exposure. (d) Rate of energy transfer due to BrC light absorption relative to the total carbonaceous aerosol absorption (WOA) estimated as a function of aging using the solar flux, the fractions of the different components and their MACs.
The increase in kOA,methanol(370 nm) with increasing MBC ∕ MOA indicates that the OA compounds present at higher MBC ∕ MOA absorbed more efficiently than at low MBC ∕ MOA. If the variability in MBC ∕ MOA was driven partly by OA partitioning, then this implies that lower-volatility compounds were more absorbing than high-volatility compounds, consistent with the results by Saleh et al. (2014), who investigated the relation between OA absorption and volatility using thermodesorber measurements. A correlation between kOA and MBC ∕ MOA has also been reported by Lu et al. (2015). The parameterizations reported by these authors are included in Fig. 7, where the wavelength dependence reported by those authors has been used to adjust their parameterizations to 370 nm. Despite these differences, our results confirm the generality of the correlation proposed by Saleh et al. (2014), but using a method that is independent of potential biases related to internal mixing effects, filter-based absorption measurements or Mie calculations. Indeed, we emphasize that the kOA obtained here is a lower limit: as our approach does not account for the OA extraction efficiency; kOA,methanol(370 nm) may be underestimated by up to a factor of ∼2, based on Fig. 6b.
In this section, we seek to estimate the relative importance of OA absorption at different wavelengths relative to that of the total carbonaceous aerosol as a function of aging. For these calculations, the MAC(λ) values for the different components and their relative mass abundance are required. We used the power law parameters reported above to generate continuous MACBC(λ), MACPOA(λ) and MACSOA(λ) functions together with their associated uncertainties (Fig. 8a), which allow the extrapolation of these parameters in the range [280; 880 nm].
The contributions of the different components as a function of OH exposure were calculated by assuming that SOA production follows the first-order decay of its precursors, i.e., the reaction with OH. Under this assumption, the time-dependent mass concentration of SOA compared to POA can be expressed as
In this equation, MSOA,WLC(t), MPOA,WLC(t) and MSOAP,WLC are the wall-loss-corrected mass concentrations of SOA, POA and the SOA potential (the maximum SOA formed upon the consumption of all precursors). kOH represents an estimation of the reaction rate of SOA precursors towards OH based on SOA production rates. By fitting the observed against the OH exposure, kOH and can be estimated. For these calculations, we have estimated the wall losses using two approaches, as described in the Supplement.
The was on average equal to 7.8 (GSD =1.4) and kOH was estimated as molecule−1 cm3 (GSD =1.4), consistent with chemical nature of the SOA precursors as measured (e.g., PAH and phenol derivatives) by a PTR-MS (Bruns et al., 2016, 2017). These high rates and enhancement ratios indicate the rapid production of SOA.
Based on the bulk gas phase measurements of SOA precursors (Bruns et al., 2016), the obtained enhancements are consistent with high bulk SOA yields of ∼50 %. These high values are not surprising, considering the nature of these gases (e.g., PAH and phenol derivatives), the low temperatures (263 K) and the relatively high concentrations (aged OA ∼100 µg m−3) at which the experiments have been conducted (Bruns et al., 2016).
Combining these calculated enhancements with the average contributions of POA in primary emissions, the evolution of fOA with aging was determined and is shown in Fig. 8b. The uncertainties in Fig. 8b (dotted lines) represent 1 standard deviation on fOA obtained by a Monte Carlo propagation of uncertainties due to experiment-to-experiment variability, fitting errors and wall loss correction errors (see Supplement). While this calculation represents a simplification of the SOA production mechanisms (the dependence of SOA yields on OH exposures and/or multigeneration chemistry and OA mass concentrations was neglected), it results in residuals much smaller than the experiment-to-experiment variability. We therefore used these calculations to assess the relative contribution of OA to the total carbonaceous absorption. We show in Fig. 8c that below 400 nm and upon aging, the absorption coefficient of the total organics was at least as high as the one of BC.
Using the MAC values of the different components (in m2 g−1), their abundance (in g m−3) and the solar irradiance data (S, in W m−2 nm−1) (Gueymard et al., 2002) calculated at sea level for a cloudless day, the fractional energy transfer due to the BrC light absorption relative to that due to the total carbonaceous aerosol absorption, WOA(OHexp), in air masses dominated by residential burning emissions can be determined as
Here, RETOA(OHexp) and RETtot(OHexp) denote the rate of energy transfer per volume (in W m−3) to the air mass in question due to light absorption by OA and the total carbonaceous aerosol, respectively. We note that while RETOA(OHexp) and RETtot(OHexp) are extensive properties, WOA(OHexp) does not depend on the loading, scattering and/or lensing, provided that scattering/lensing similarly affects BC and OA present in the same air mass (e.g., BC and OA have a similar size distribution).
We also note that WOA(OHexp) depends on the photon flux, S(λ), but we consider this dependence to be trivial compared to the variability in the aerosol emissions and their light-absorbing properties (error bars considering these variabilities are shown in Fig. 8d). Errors in WOA were propagated by Monte Carlo simulations using the uncertainties from the estimated MAC values of BC and OA fractions and the variability in fOA. Our sensitivity analysis suggests that the major part of the variance in predicting WOA for primary emissions stems from the variability in the POA mass fraction. In contrast, the SOA mass absorption cross sections at lower wavelengths are the most critical factor for assessing the relative importance of BrC absorptivity in aged emissions.
Figure 8d shows that the fractional energy transfer to the air mass, WOA, due to the absorption by the primary organic aerosol was around 10 % of that of the total carbonaceous aerosol for our samples. This percentage is comparable to that observed by Fu et al. (2012), in spite of fOA in their samples being much higher, because of the high OA MACs in our samples (Table 1). Moreover, with aging, the fraction of OA is enhanced, resulting in a sizeable increase in WOA, from ∼0.1 to ∼0.3 (Fig. 8d), highlighting that SOA formation in biomass burning plumes is an atmospherically relevant source of BrC. We note that our data are more representative of flaming conditions. More data are needed on the chemical nature of primary particulate emissions and of the contributing SOA precursors as well as the absorptivity of these primary and secondary products, for better constraining the influence of biomass-burning-related BrC on the Earth's climate.
We determined wavelength-dependent MAC values of BC, POA and SOA, as well as kOAfor methanol and water extracts of fresh and aged OA, for wood-burning emissions through smog-chamber experiments. To our knowledge, this is the first determination of these properties for wood-burning OA. We showed that the MACOA(370 nm) values calculated based on kOA through Mie analysis correlated well with those estimated from online filter-based measurements. This correlation between independent MAC measurements supports the quality of both methods. While MACOA(370 nm) values computed based on kOA,methanol were two times lower than those estimated from online filter-based measurements, calculations based on kOA,water could only explain 12 % of the measured absorption, suggesting that BrC species in POA and SOA are mostly water insoluble. The MACOA was found to vary by more than 1 order of magnitude. Similar to previous reports, this variability could be related to the variability in the ratio of the mass concentrations of BC and OA (MBC ∕ MOA) due to very different mechanisms of oxidative aging and burn-to-burn variability.
The MACPOA and MACSOA determined for wavelengths between 370 and 660 nm followed a power-law dependence on λ with an absorption Ångström exponent of 4.6 and 5.6 for POA and SOA, respectively. In addition to following this power law, the MACs of POA and SOA appeared to be constant for OH exposures up to 40×106 molecules cm−3 h.
The mean MACPOA(370 nm) obtained under our conditions was 5.5 m2 g−1, considerably higher than previously reported values for open biomass burning. The mean MACSOA(370 nm) was 2.2 m2 g−1 (1σ variability: 1.6–3.1 m2 g−1 according to a GSD =1.39) under our experimental conditions, 2.3 times lower than the mean MACPOA(370 nm) but approximately an order of magnitude higher than MAC values estimated for ambient oxygenated aerosols or reported for SOA from biogenic and traditional anthropogenic precursors. We propose that the important role of oxidized phenols and aromatics in forming wood-burning SOA (Bruns et al., 2016) is the cause of this observation. This hypothesis is supported by our observed reaction rates with OH, and by the water-insolubility of the BrC in aged OA.
Overall, the absorption by organic aerosols was estimated to contribute 10 %–30 % of the total solar absorption of wood-combustion aerosols, where 10 % represents the primary OA and 30 % the aged OA. SOA formation in biomass burning plumes is therefore an atmospherically relevant source of BrC.
Data are available at https://doi.org/10.5281/zenodo.2164456 (Kumar et al., 2018).
The supplement related to this article is available online at: https://doi.org/10.5194/acp-18-17843-2018-supplement.
IEH, ASHP, MG and JCC conceptualized the study. NKK, EAB, IEH, JGS and AV performed the experiments. Formal analysis was carried out by NKK, JCC, IEH, DM, LD and GM. IEH, ASHP, UB, MG, JGS and PP supervised the study. NKK, JCC, IEH and MG wrote the paper.
Luka Drinovec and Griša Močnik were employed by Aerosol d.o.o when the experiments were conducted.
The research leading to these results has received funding from the European
Research Council grant (ERC-CoG 615922-BLACARAT) and by the Competence
Centre Energy and Mobility (CCEM) project 807.
Edited by: Yafang Cheng
Reviewed by: two anonymous referees
Alexander, D. T. L., Crozier, P. A., and Anderson, J. R.: Brown carbon spheres in East Asian outflow and their optical properties., Science, 321, 833–8336, https://doi.org/10.1126/science.1155296, 2008.
Andreae, M. O. and Gelencsér, A.: Black carbon or brown carbon? The nature of light-absorbing carbonaceous aerosols, Atmos. Chem. Phys., 6, 3131–3148, https://doi.org/10.5194/acp-6-3131-2006, 2006.
Barmet, P., Dommen, J., DeCarlo, P. F., Tritscher, T., Praplan, A. P., Platt, S. M., Prévôt, A. S. H., Donahue, N. M., and Baltensperger, U.: OH clock determination by proton transfer reaction mass spectrometry at an environmental chamber, Atmos. Meas. Tech., 5, 647–656, https://doi.org/10.5194/amt-5-647-2012, 2012.
Bertrand, A., Stefenelli, G., Bruns, E. A., Pieber, S. M., Prévôt, A. S. H., Wortham, H., Temime-roussel, B., Slowik, J. G., EL Haddad, I., and Marchand, N.: Primary emissions and secondary aerosol production potential from woodstoves for residential heating?: influence of the stove technology and combustion efficiency, Atmos. Environ., 169, 65–79, https://doi.org/10.1016/j.atmosenv.2017.09.005, 2017.
Bond, T. C., Habib, G., and Bergstrom, R. W.: Limitations in the enhancement of visible light absorption due to mixing state, J. Geophys. Res.-Atmos., 111, 1–13, https://doi.org/10.1029/2006JD007315, 2006.
Bond, T. C., Doherty, S. J., Fahey, D. W., Forster, P. M., Berntsen, T., Deangelo, B. J., Flanner, M. G., Ghan, S., Kärcher, B., Koch, D., Kinne, S., Kondo, Y., Quinn, P. K., Sarofim, M. C., Schultz, M. G., Schulz, M., Venkataraman, C., Zhang, H., Zhang, S., Bellouin, N., Guttikunda, S. K., Hopke, P. K., Jacobson, M. Z., Kaiser, J. W., Klimont, Z., Lohmann, U., Schwarz, J. P., Shindell, D., Storelvmo, T., Warren, S. G., and Zender, C. S.: Bounding the role of black carbon in the climate system: a scientific assessment, J. Geophys. Res.-Atmos., 118, 5380–5552, https://doi.org/10.1002/jgrd.50171, 2013.
Bruns, E. A., Krapf, M., Orasche, J., Huang, Y., Zimmermann, R., Drinovec, L., Mocnik, G., El-Haddad, I., Slowik, J. G., Dommen, J., Baltensperger, U., and Prévôt, A. S. H.: Characterization of primary and secondary wood combustion products generated under different burner loads, Atmos. Chem. Phys., 15, 2825–2841, https://doi.org/10.5194/acp-15-2825-2015, 2015.
Bruns, E. A., El Haddad, I., Slowik, J. G., Kilic, D., Klein, F., Baltensperger, U., and Prévôt, A. S. H.: Identification of significant precursor gases of secondary organic aerosols from residential wood combustion., Sci. Rep., 6, 27881, https://doi.org/10.1038/srep27881, 2016.
Bruns, E. A., Slowik, J. G., El Haddad, I., Kilic, D., Klein, F., Dommen, J., Temime-Roussel, B., Marchand, N., Baltensperger, U., and Prévôt, A. S. H.: Characterization of gas-phase organics using proton transfer reaction time-of-flight mass spectrometry: fresh and aged residential wood combustion emissions, Atmos. Chem. Phys., 17, 705–720, https://doi.org/10.5194/acp-17-705-2017, 2017.
Cavalli, F., Viana, M., Yttri, K. E., Genberg, J., and Putaud, J.-P.: Toward a standardised thermal-optical protocol for measuring atmospheric organic and elemental carbon: the EUSAAR protocol, Atmos. Meas. Tech., 3, 79–89, https://doi.org/10.5194/amt-3-79-2010, 2010.
Chakrabarty, R. K., Moosmüller, H., Chen, L.-W. A., Lewis, K., Arnott, W. P., Mazzoleni, C., Dubey, M. K., Wold, C. E., Hao, W. M., and Kreidenweis, S. M.: Brown carbon in tar balls from smoldering biomass combustion, Atmos. Chem. Phys., 10, 6363–6370, https://doi.org/10.5194/acp-10-6363-2010, 2010.
Chakrabarty, R. K., Arnold, I. J., Francisco, D. M., Hatchett, B., Hosseinpour, F., Loria, M., Pokharel, A., and Woody, B. M.: Black and brown carbon fractal aggregates from combustion of two fuels widely used in asian rituals, J. Quant. Spectrosc. Ra., 122, 25–30, https://doi.org/10.1016/j.jqsrt.2012.12.011, 2013.
Chen, Y. and Bond, T. C.: Light absorption by organic carbon from wood combustion, Atmos. Chem. Phys., 10, 1773–1787, https://doi.org/10.5194/acp-10-1773-2010, 2010.
China, S., Mazzoleni, C., Gorkowski, K., Aiken, A. C., and Dubey, M. K.: Morphology and mixing state of individual freshly emitted wildfire carbonaceous particles, Nat. Commun., 4, 2122, https://doi.org/10.1038/ncomms3122, 2013.
Ciarelli, G., El Haddad, I., Bruns, E., Aksoyoglu, S., Möhler, O., Baltensperger, U., and Prévôt, A. S. H.: Constraining a hybrid volatility basis-set model for aging of wood-burning emissions using smog chamber experiments: a box-model study based on the VBS scheme of the CAMx model (v5.40), Geosci. Model Dev., 10, 2303–2320, https://doi.org/10.5194/gmd-10-2303-2017, 2017.
Clarke, A., McNaughton, C., Kapustin, V., Shinozuka, Y., Howell, S., Dibb, J., Zhou, J., Anderson, B. E., Brekhovskikh, V., Turner, H., and Pinkerton, M.: Biomass burning and pollution aerosol over North America: organic components and their influence on spectral optical properties and humidification response, J. Geophys. Res.-Atmos., 112, 1–13, https://doi.org/10.1029/2006JD007777, 2007.
Collaud Coen, M., Weingartner, E., Apituley, A., Ceburnis, D., Fierz-Schmidhauser, R., Flentje, H., Henzing, J. S., Jennings, S. G., Moerman, M., Petzold, A., Schmid, O., and Baltensperger, U.: Minimizing light absorption measurement artifacts of the Aethalometer: evaluation of five correction algorithms, Atmos. Meas. Tech., 3, 457–474, https://doi.org/10.5194/amt-3-457-2010, 2010.
Corbin, J. C., Lohmann, U., Sierau, B., Keller, A., Burtscher, H., and Mensah, A. A.: Black carbon surface oxidation and organic composition of beech-wood soot aerosols, Atmos. Chem. Phys., 15, 11885–11907, https://doi.org/10.5194/acp-15-11885-2015, 2015a.
Corbin, J. C., Keller, A., Lohmann, U., Burtscher, H., Sierau, B., and Mensah, A. A.: Organic emissions from a wood stove and a pellet stove before and after simulated atmospheric aging, Aerosol Sci. Technol., 49, 1037–1050, https://doi.org/10.1080/02786826.2015.1079586, 2015b.
Corbin, J. C.; Pieber, S. M.; Czech, H.; Zanatta, M.; Jakobi, G.; Massabò, D.; Orasche, J.; El Haddad, I.; Mensah, A. A.; Stengel, B.; Drinovec, L.; Mocnik, G.; Zimmermann, R.; Prévôt, A. S. H., and Gysel, M.: Brown and black carbon emitted by a marine engine operated on heavy fuel oil and distillate fuels: optical properties, size distributions and emission factors, J. Geophys. Res.-Atmos., 123, 6175–6195, https://doi.org/10.1029/2017JD027818, 2018.
DeCarlo, P. F., Kimmel, J. R., Trimborn, A., Northway, M. J., Jayne, J. T., Aiken, A. C., Gonin, M., Fuhrer, K., Horvath, T., Docherty, K. S., Worsnop, D. R., and Jimenez, J. L.: Field deployable, high resolution, time-of-flight aerosol mass spectrometer, Anal. Chem., 78, 8281–8289, doi:8410.1029/2001JD001213, 2006.
Denier van der Gon, H. A. C., Bergström, R., Fountoukis, C., Johansson, C., Pandis, S. N., Simpson, D., and Visschedijk, A. J. H.: Particulate emissions from residential wood combustion in Europe – revised estimates and an evaluation, Atmos. Chem. Phys., 15, 6503–6519, https://doi.org/10.5194/acp-15-6503-2015, 2015.
Di Blasi, C.: Modeling chemical and physical processes of wood and biomass pyrolysis, Prog. Energ. Combust., 34, 47–90, https://doi.org/10.1016/j.pecs.2006.12.001, 2008.
Drinovec, L., Mocnik, G., Zotter, P., Prévôt, A. S. H., Ruckstuhl, C., Coz, E., Rupakheti, M., Sciare, J., Müller, T., Wiedensohler, A., and Hansen, A. D. A.: The “dual-spot” Aethalometer: an improved measurement of aerosol black carbon with real-time loading compensation, Atmos. Meas. Tech., 8, 1965–1979, https://doi.org/10.5194/amt-8-1965-2015, 2015.
Feng, Y., Ramanathan, V., and Kotamarthi, V. R.: Brown carbon: a significant atmospheric absorber of solar radiation?, Atmos. Chem. Phys., 13, 8607–8621, https://doi.org/10.5194/acp-13-8607-2013, 2013.
Forrister, H., Liu, J., Scheuer, E., Dibb, J., Ziemba, L., Thornhill, L. K., Anderson, B., Diskin, G., Perring, A. E., Schwarz, J. P., Campuzan-Jost, P., Day, D. A., Palm, B. B., Jimenez, J. L., Nenes, A., and Weber, R. J.: Evolution of brown carbon in wildfire plumes, Gephys. Res. Lett., 42, 4623–4630, https://doi.org/10.1002/2015GL063897, 2015.
Fu, J. S., Hsu, N. C., Gao, Y., Huang, K., Li, C., Lin, N.-H., and Tsay, S.-C.: Evaluating the influences of biomass burning during 2006 BASE-ASIA: a regional chemical transport modeling, Atmos. Chem. Phys., 12, 3837–3855, https://doi.org/10.5194/acp-12-3837-2012, 2012.
Grieshop, A. P., Donahue, N. M., and Robinson, A. L.: Laboratory investigation of photochemical oxidation of organic aerosol from wood fires 2: analysis of aerosol mass spectrometer data, Atmos. Chem. Phys., 9, 2227–2240, https://doi.org/10.5194/acp-9-2227-2009, 2009.
Gueymard, C., Myers, D., and Emery, K.: Proposed Reference Irradiance Spectra for Solar Energy Systems Testing, Sol. Energy, 73, 6, 443–467, 2002.
Gundel, L. A., Dod, R. L., Rosen, H., and Novakov.: The relationship between optical attenuation and black carbon concentration for ambient and source particles, Sci. Total Environ., 36, 197–202, 1984.
Haslett, S. L., Thomas, J. C., Morgan, W. T., Hadden, R., Liu, D., Allan, J. D., Williams, P. I., Keita, S., Liousse, C., and Coe, H.: Highly controlled, reproducible measurements of aerosol emissions from combustion of a common African biofuel source, Atmos. Chem. Phys., 18, 385–403, https://doi.org/10.5194/acp-18-385-2018, 2018.
Hecobian, A., Zhang, X., Zheng, M., Frank, N., Edgerton, E. S., and Weber, R. J.: Water-Soluble Organic Aerosol material and the light-absorption characteristics of aqueous extracts measured over the Southeastern United States, Atmos. Chem. Phys., 10, 5965–5977, https://doi.org/10.5194/acp-10-5965-2010, 2010.
Heringa, M. F., DeCarlo, P. F., Chirico, R., Tritscher, T., Dommen, J., Weingartner, E., Richter, R., Wehrle, G., Prévôt, A. S. H., and Baltensperger, U.: Investigations of primary and secondary particulate matter of different wood combustion appliances with a high-resolution time-of-flight aerosol mass spectrometer, Atmos. Chem. Phys., 11, 5945–5957, https://doi.org/10.5194/acp-11-5945-2011, 2011.
Hoffer, A., Gelencsér, A., Guyon, P., Kiss, G., Schmid, O., Frank, G. P., Artaxo, P., and Andreae, M. O.: Optical properties of humic-like substances (HULIS) in biomass-burning aerosols, Atmos. Chem. Phys., 6, 3563–3570, https://doi.org/10.5194/acp-6-3563-2006, 2006.
Jo, D. S., Park, R. J., Lee, S., Kim, S.-W., and Zhang, X.: A global simulation of brown carbon: implications for photochemistry and direct radiative effect, Atmos. Chem. Phys., 16, 3413–3432, https://doi.org/10.5194/acp-16-3413-2016, 2016.
Kirchstetter, T. W., Novakov, T., and Hobbs, P. V.: Evidence that the spectral dependence of light absorption by aerosols is affected by organic carbon, J. Geophys. Res.-Atmos., 109, 1–12, https://doi.org/10.1029/2004JD004999, 2004.
Krapf, M., Haddad, I. El, Bruns, E. A., Haddad, I. El, Molteni, U., Daellenbach, K. R., Prévôt, A. S. H., Baltensperger, U., and Dommen, J.: Labile peroxides in secondary organic aerosol labile peroxides in secondary organic aerosol, Chem 1, 603–616, https://doi.org/10.1016/j.chempr.2016.09.007, 2016.
Kumar, N. K., Corbin, J. C., Bruns, E. A., Massabó, D., Slowik, J. G., Drinovec, L., Mocnik, G., Prati, P., Vlachou, A., Baltensperger, U., Gysel, M., El-Haddad, I., and Prévôt, A. S. H.: Production of particulate brown carbon during atmospheric aging of residential wood-burning emissions, https://doi.org/10.5281/zenodo.2164456, 2018.
Lack, D. A. and Langridge, J. M.: On the attribution of black and brown carbon light absorption using the Ångström exponent, Atmos. Chem. Phys., 13, 10535–10543, https://doi.org/10.5194/acp-13-10535-2013, 2013.
Lambe, A. T., Cappa, C. D., Massoli, P., Onasch, T. B., Forestieri, S. D., Martin, A. T., Cummings, M. J., Croasdale, D. R., Brune, W. H., Worsnop, D. R., and Davidovits, P.: Relationship between oxidation level and optical properties of secondary organic aerosol, Environ. Sci. Technol., 47, 6349–6357, https://doi.org/10.1021/es401043j, 2013.
Laskin, A., Laskin, J., and Nizkorodov, S. A.: Chemistry of atmospheric brown carbon, Chem. Rev., 115, 4335–4382, https://doi.org/10.1021/cr5006167, 2015.
Lee, H. J., Aiona, P. K., Laskin, A., Laskin, J., and Nizkorodov, S. A.: Effect of solar radiation on the optical properties and molecular composition of laboratory proxies of atmospheric brown carbon, Environ. Sci. Technol., 48, 10217–10226, https://doi.org/10.1021/es502515r, 2014.
Lewis, K., Arnott, W. P., Moosmüller, H., and Wold, C. E.: Strong spectral variation of biomass smoke light absorption and single scattering albedo observed with a novel dual-wavelength photoacoustic instrument, J. Geophys. Res.-Atmos., 113, 1–14, https://doi.org/10.1029/2007JD009699, 2008.
Lin, G., Penner, J. E., Flanner, M. G., Sillman, S., Xu, L., and Zhou, C.: Radiative forcing of organic aerosol in the atmosphere and on snow: effect of SOA and brown carbon, J. Geophys. Res.-Atmos., 119, 7453–7476, https://doi.org/10.1002/2013JD021186, 2014.
Liu, J., Scheuer, E., Dibb, J., Ziemba, L. D., Thornhill, K. L., Anderson, B. E., Wisthaler, A., Mikoviny, T., Devi, J. J., Bergin, M., and Weber, R. J.: Brown carbon in the continental troposphere, Geophys. Res. Lett., 41, 2191–2195, https://doi.org/10.1002/2013GL058976, 2014.
Liu, D. T., Whitehead, J., Alfarra, M. R., Reyes-Villegas, E., Spracklen, D. V., Reddington, C. L., Kong, S. F., Williams, P. I., Ting, Y. C., Haslett, S., Taylor, J. W., Flynn, M. J., Morgan, W. T., McFiggans, G., Coe, H., and Allan, J. D.: Black-carbon absorption enhancement in the atmosphere determined by particle mixing state, Nat. Geosci., 10, 184–188, https://doi.org/10.1038/ngeo2901, 2017.
Liu, J., Lin, P., Laskin, A., Laskin, J., Kathmann, S. M., Wise, M., Caylor, R., Imholt, F., Selimovic, V., and Shilling, J. E.: Optical properties and aging of light-absorbing secondary organic aerosol, Atmos. Chem. Phys., 16, 12815–12827, https://doi.org/10.5194/acp-16-12815-2016, 2016.
Liu, P. F., Abdelmalki, N., Hung, H.-M., Wang, Y., Brune, W. H., and Martin, S. T.: Ultraviolet and visible complex refractive indices of secondary organic material produced by photooxidation of the aromatic compounds toluene and m-xylene, Atmos. Chem. Phys., 15, 1435–1446, https://doi.org/10.5194/acp-15-1435-2015, 2015.
Liu, P. S. K., Deng, R., Smith, K. A., Jayne, J. T., Williams, L. R., Canagaratna, M. R., Moore, K., Onasch, T. B., Worsnop, D. R., and Deshler, T.: Transmission efficiency of an aerodynamic focusing lens system: comparison of model calculations and laboratory measurements for the aerodyne aerosol mass spectrometer, Aerosol Sci. Tech., 41, 721–733, 2007.
Liu, S., Aiken, A. C., Gorkowski, K., Dubey, M. K., Cappa, C. D., Williams, L. R., Herndon, S. C., Massoli, P., Fortner, E. C., Chhabra, P. S., Brooks, W. A., Onasch, T. B., Jayne, J. T., Worsnop, D. R., China, S., Sharma, N., Mazzoleni, C., Xu, L., Ng, N. L., Liu, D., Allan, J. D., Lee, J. D., Fleming, Z. L., Mohr, C., Zotter, P., Szidat, S., and Prévôt, A. S. H.: Enhanced light absorption by mixed source black and brown carbon particles in UK winter, Nat. Commun., 6, 8435, https://doi.org/10.1038/ncomms9435, 2015.
Lu, Z., Streets, D. G., Winijkul, E., Yan, F., Chen, Y., Bond, T. C., Feng, Y., Dubey, M. K., Liu, S., Pinto, J. P., and Carmichael, G. R.: Light absorption properties and radiative effects of primary organic aerosol emissions, Environ. Sci. Technol., 49, 4868–4877, https://doi.org/10.1021/acs.est.5b00211, 2015.
Massabò, D., Bernardoni, V., Bove, M. C., Brunengo, A., Cuccia, E., Piazzalunga, A., Prati, P., Valli, G., and Vecchi, R.: A multi-wavelength optical set-up for the characterization of carbonaceous particulate matter, J. Aerosol Sci., 60, 34–46, https://doi.org/10.1016/j.jaerosci.2013.02.006, 2013.
Massabò, D., Caponi, L., Bernardoni, V., Bove, M. C., Brotto, P., Calzolai, G., Cassola, F., Chiari, M., Fedi, M. E., Fermo, P., Giannoni, M., Lucarelli, F., Nava, S., Piazzalunga, A., Valli, G., Vecchi, R., and Prati, P.: Multi-wavelength optical determination of black and brown carbon in atmospheric aerosols, Atmos. Environ., 108, 1–12, https://doi.org/10.1016/j.atmosenv.2015.02.058, 2015.
Moosmüller, H., Chakrabarty, R. K., and Arnott, W. P.: Aerosol light absorption and its measurement: A review, J. Quant. Spectrosc. Ra., 110, 844–878, https://doi.org/10.1016/j.jqsrt.2009.02.035, 2009.
Moosmüller, H., Chakrabarty, R. K., Ehlers, K. M., and Arnott, W. P.: Absorption Ångström coefficient, brown carbon, and aerosols: basic concepts, bulk matter, and spherical particles, Atmos. Chem. Phys., 11, 1217–1225, https://doi.org/10.5194/acp-11-1217-2011, 2011.
Petzold, A. and Schönlinner, M.: Multi-angle absorption photometr – A new method for the measurement of aerosol light absorption and atmospheric black carbon, J. Aerosol Sci., 35, 421–441, https://doi.org/10.1016/j.jaerosci.2003.09.005, 2004.
Platt, S. M., El Haddad, I., Zardini, A. A., Clairotte, M., Astorga, C., Wolf, R., Slowik, J. G., Temime-Roussel, B., Marchand, N., Ježek, I., Drinovec, L., Močnik, G., Möhler, O., Richter, R., Barmet, P., Bianchi, F., Baltensperger, U., and Prévôt, A. S. H.: Secondary organic aerosol formation from gasoline vehicle emissions in a new mobile environmental reaction chamber, Atmos. Chem. Phys., 13, 9141–9158, https://doi.org/10.5194/acp-13-9141-2013, 2013.
Romonosky, D. E., Laskin, A., Laskin, J., and Nizkorodov, S. A.: High-resolution mass spectrometry and molecular characterization of aqueous photochemistry products of common types of secondary organic aerosols, J. Phys. Chem. A, 119, 2594–2606, https://doi.org/10.1021/jp509476r, 2015.
Saleh, R., Hennigan, C. J., McMeeking, G. R., Chuang, W. K., Robinson, E. S., Coe, H., Donahue, N. M., and Robinson, A. L.: Absorptivity of brown carbon in fresh and photo-chemically aged biomass-burning emissions, Atmos. Chem. Phys., 13, 7683–7693, https://doi.org/10.5194/acp-13-7683-2013, 2013.
Saleh, R., Robinson, E. S., Tkacik, D. S., Ahern, A. T., Liu,S., Aiken, A. C., Sullivan, R. C., Presto, A. A., Dubey, M. K., Yokelson, R. J., Donahue, N. M., and Robinson, A. L.: Brownness of organics in aerosols from biomass burning linked to their black carbon content, Nat. Geosci., 7, 2–5, https://doi.org/10.1038/ngeo2220, 2014.
Schauer, J. J., Mader, B. T., Deminter, J. T., Heidemann, G., Bae, M. S., Seinfeld, J. H., Flagan, R. C., Cary, R. A., Smith, D., Huebert, B. J., Bertram, T., Howell, S., Kline, J. T., Quinn, P., Bates, T., Turpin, B., Lim, H. J., Yu, J. Z., Yang, H., and Keywood, M. D.: ACE-Asia intercomparison of a thermaloptical method for the determination of particle-phase organic and elemental carbon, Environ. Sci. Technol., 37, 993–1001, 2003.
Shafizadeh, F.: The chemistry of pyrolysis and combustion. The chemistry of solid Wood, ACS Symp. Ser., 207, 489–529, https://doi.org/10.1021/ba-1984-0207, 1984.
Slowik, J. G., Cross, E. S., Han, J.-H., Davidovits, P., Onasch, T. B., Jayne, J. T., Williams, L. R., Canagaratna, M. R., Worsnop, D. R., Chakrabarty, R. K., Moosmüller, H., Arnott, W. P., Schwarz, J. P., Gao, R. S., Fahey, D. W., Kok, G. L., and Petzold, A.: An inter-comparison of instruments measuring black carbon content of soot particles, Aerosol Sci. Technol., 41, 295–314, 2007.
Sumlin, B. J., Pandey, A., Walker, M. J., Pattison, R. S., Williams, B. J., and Chakrabarty, R. K.: Atmospheric photooxidation diminishes light absorption by primary brown carbon aerosol from biomass burning, Environ. Sci. Tech. Lett., 4, 540–545, https://doi.org/10.1021/acs.estlett.7b00393, 2017.
Sun, H., Biedermann, L., and Bond, T. C.: Color of brown carbon: A model for ultraviolet and visible light absorption by organic carbon aerosol, Geophys. Res. Lett., 34, 1–5, https://doi.org/10.1029/2007GL029797, 2007.
Ulevicius, V., Byčenkien, S., Bozzetti, C., Vlachou, A., Plauškait, K., Mordas, G., Dudoitis, V., Abbaszade, G., Remeikis, V., Garbaras, A., Masalaite, A., Blees, J., Fröhlich, R., Dällenbach, K. R., Canonaco, F., Slowik, J. G., Dommen, J., Zimmermann, R., Schnelle-Kreis, J., Salazar, G. A., Agrios, K., Szidat, S., El Haddad, I., and Prévôt, A. S. H.: Fossil and non-fossil source contributions to atmospheric carbonaceous aerosols during extreme spring grassland fires in Eastern Europe, Atmos. Chem. Phys., 16, 5513–5529, https://doi.org/10.5194/acp-16-5513-2016, 2016.
Wang, X., Heald, C. L., Ridley, D. A., Schwarz, J. P., Spackman, J. R., Perring, A. E., Coe, H., Liu, D., and Clarke, A. D.: Exploiting simultaneous observational constraints on mass and absorption to estimate the global direct radiative forcing of black carbon and brown carbon, Atmos. Chem. Phys., 14, 10989–11010, https://doi.org/10.5194/acp-14-10989-2014, 2014.
Weingartner, E., Saathoff, H., Schnaiter, M., Streit, N., Bitnar, B., and Baltensperger, U.: Absorption of light by soot particles: determination of the absorption coefficient by means of aethalometers, J. Aerosol Sci., 34, 1445–1463, https://doi.org/10.1016/S0021-8502(03)00359-8, 2003.
Yang, H. and Yu, J. Z.: Uncertainties in charring correction in the analysis of elemental and organic carbon in atmospheric particles by thermal/optical methods, Environ. Sci. Technol., 36, 5199–5204, 2002.
Zhang, X., Lin, Y.-H., Surratt, J. D., Zotter, P., and Prévôt, A. S. H.: Light-absorbing soluble organic aerosol in Los-Angeles and Atlanta: A contrast in secondary organic aerosol, Geophys. Res. Lett, 38, L21810, https://doi.org/10.1029/2011GL049385, 2011.
Zhao, R., Lee, A. K. Y., Huang, L., Li, X., Yang, F., and Abbatt, J. P. D.: Photochemical processing of aqueous atmospheric brown carbon, Atmos. Chem. Phys., 15, 6087–6100, https://doi.org/10.5194/acp-15-6087-2015, 2015.
Zotter, P., Herich, H., Gysel, M., El-Haddad, I., Zhang, Y., Močnik, G., Hüglin, C., Baltensperger, U., Szidat, S., and Prévôt, A. S. H.: Evaluation of the absorption Ångström exponents for traffic and wood burning in the Aethalometer-based source apportionment using radiocarbon measurements of ambient aerosol, Atmos. Chem. Phys., 17, 4229–4249, https://doi.org/10.5194/acp-17-4229-2017, 2017.