the Creative Commons Attribution 4.0 License.
the Creative Commons Attribution 4.0 License.
 | 13 Dec 2018
Contributions to the explosive growth of PM2.5 mass due to aerosol–radiation feedback and decrease in turbulent diffusion during a red alert heavy haze in Beijing–Tianjin–Hebei, China
Yue Peng
Xiaoye Zhang
Hongli Liu
Meng Zhang
Huizheng Che
Yanli Cheng
Yu Zheng
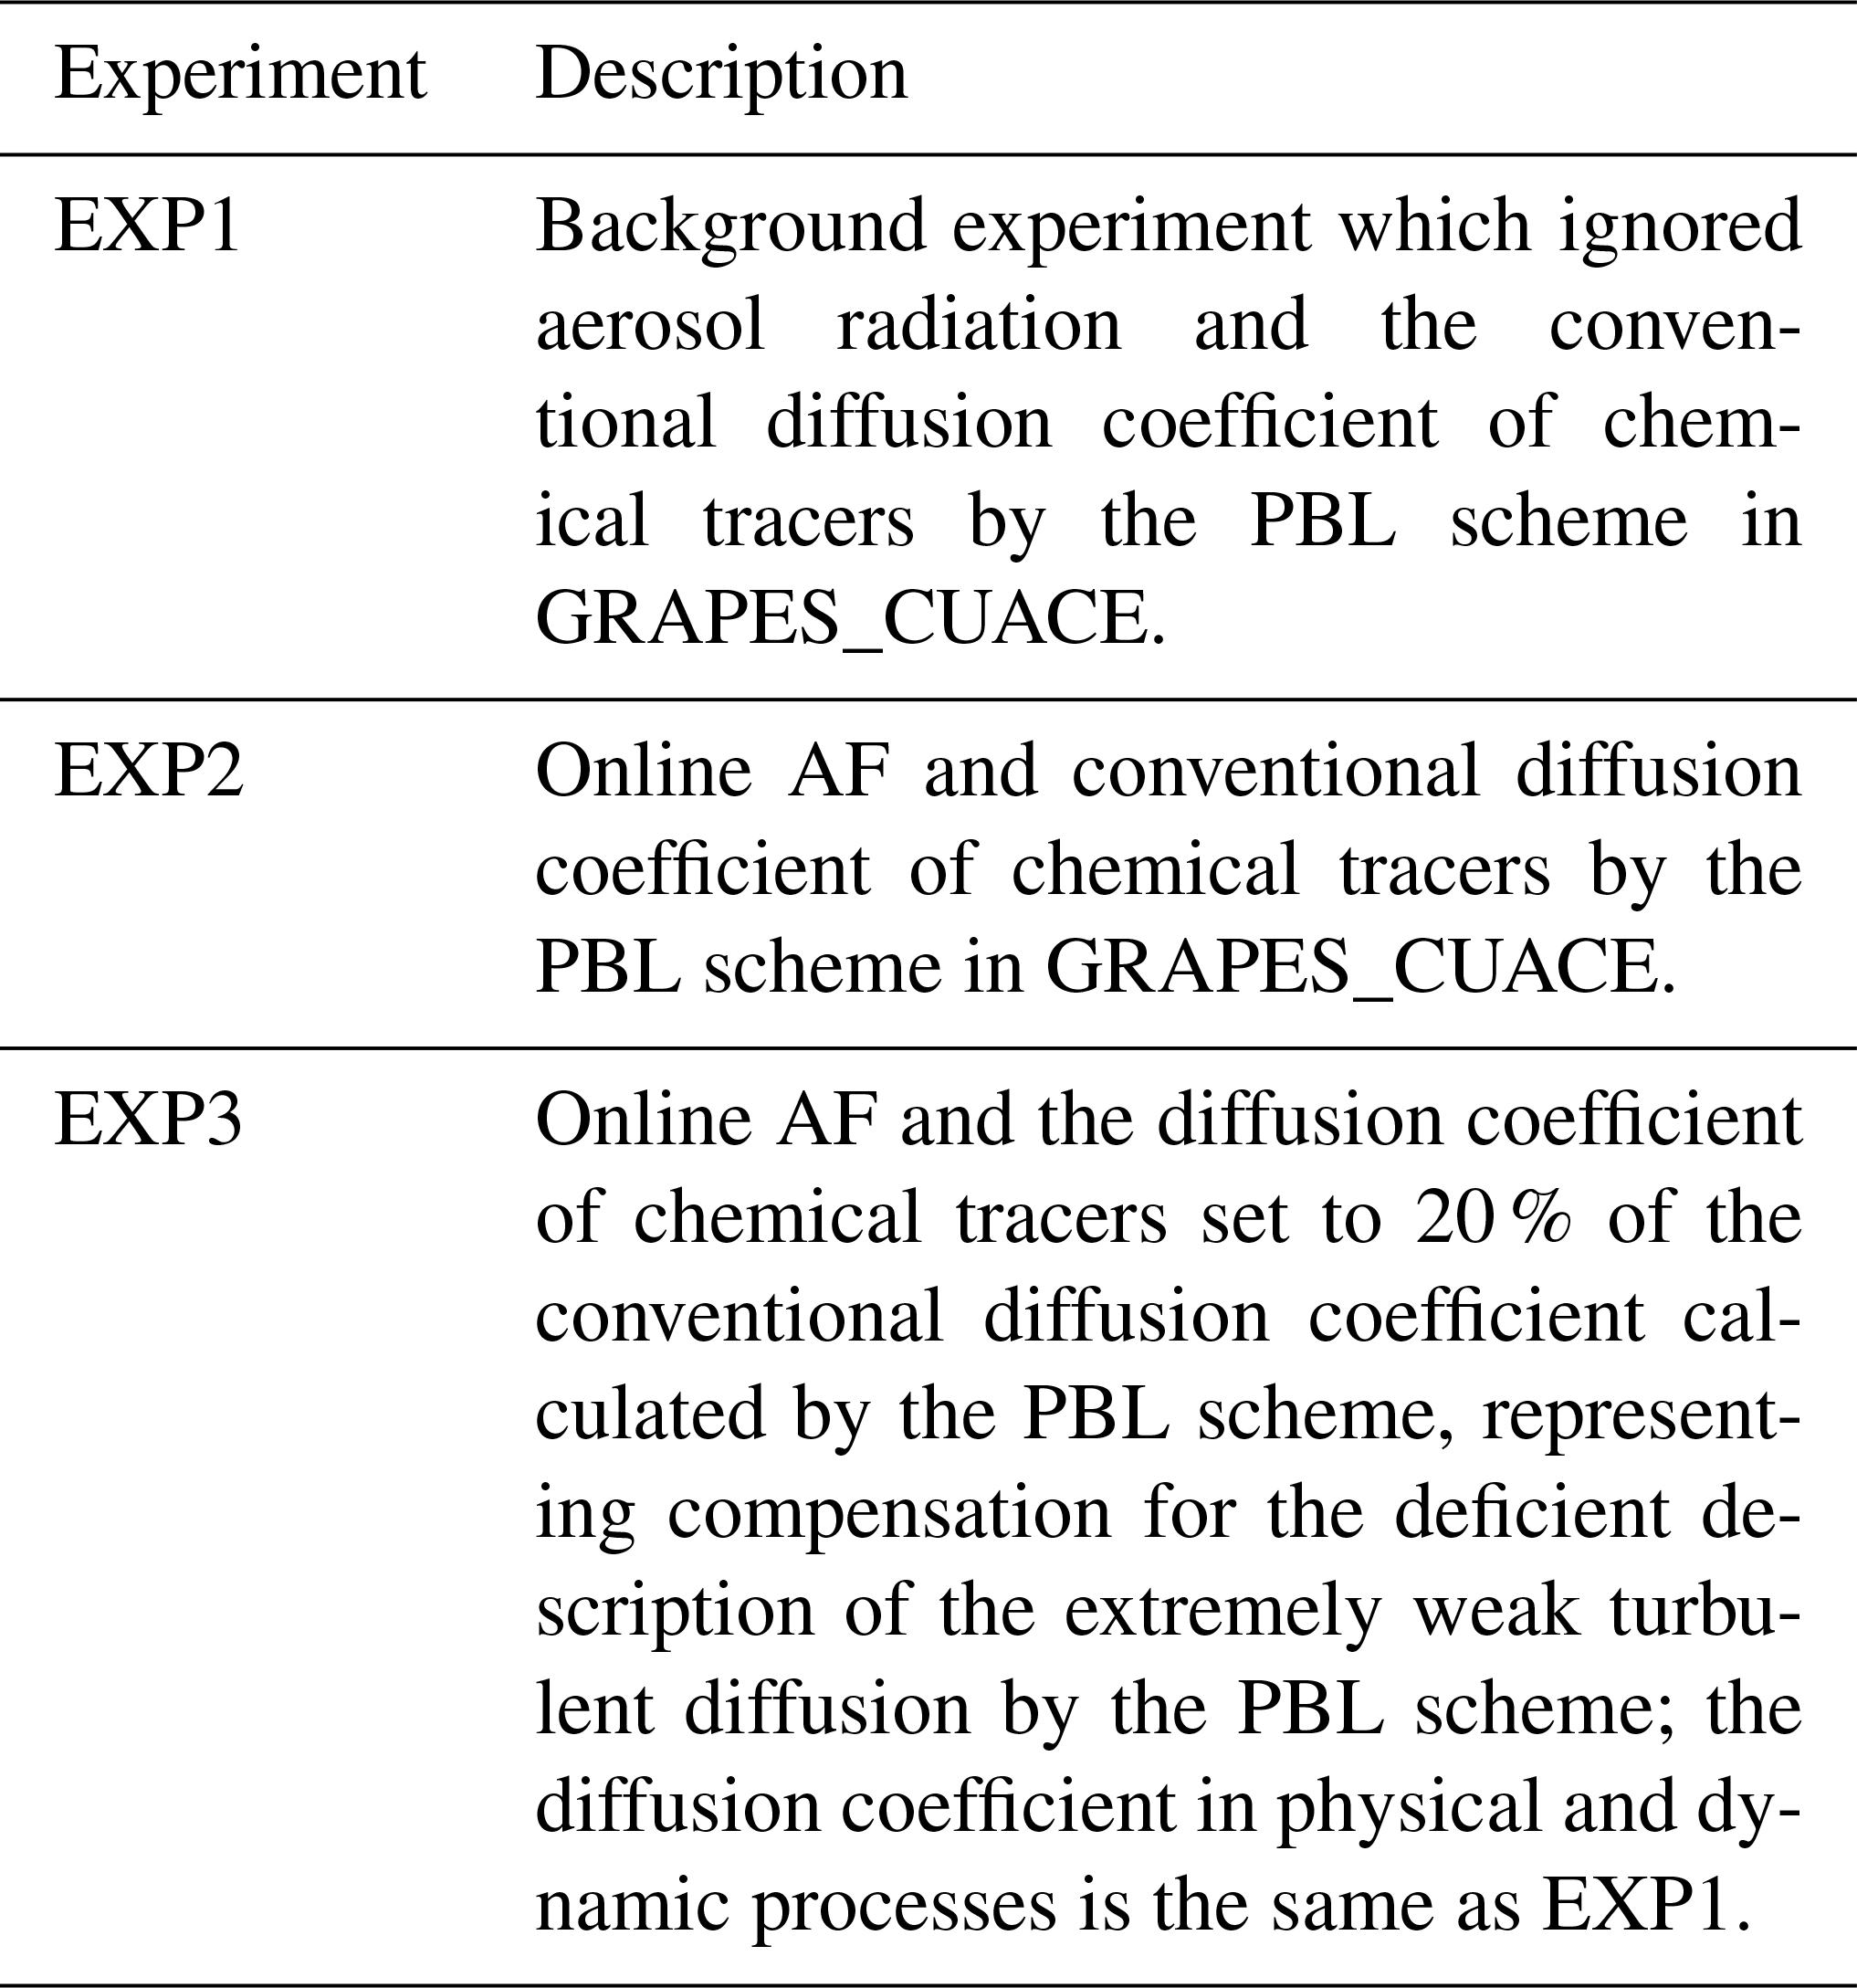
The explosive growth of PM2.5 mass usually results in extreme PM2.5 levels and severe haze pollution in eastern China, and is generally underestimated by current atmospheric chemistry models. Based on one such model, GRAPES_CUACE, three sensitivity experiments – a “background” experiment (EXP1), an “online aerosol feedback” experiment (EXP2), and an “80 % decrease in the turbulent diffusion coefficient of chemical tracers” experiment, based on EXP2 (EXP3) – were designed to study the contributions of the aerosol–radiation feedback (AF) and the decrease in the turbulent diffusion coefficient to the explosive growth of PM2.5 during a “red alert” heavy haze event in China's Jing–Jin–Ji (Beijing–Tianjin–Hebei) region. The results showed that the turbulent diffusion coefficient calculated by EXP1 was about 60–70 m−2 s−1 on a clear day and 30–35 m−2 s−1 on a haze day. This difference in the diffusion coefficient was not enough to distinguish between the unstable atmosphere on the clear day and the extremely stable atmosphere during the PM2.5 explosive growth stage. Furthermore, the inversion calculated by EXP1 was obviously weaker than the actual inversion from sounding observations on the haze day. This led to a 40 %–51 % underestimation of PM2.5 by EXP1; the AF decreased the diffusion coefficient by about 43 %–57 % during the PM2.5 explosive growth stage, which obviously strengthened the local inversion. In addition, the local inversion indicated by EXP2 was much closer to the sounding observations than that indicated by EXP1. This resulted in a 20 %–25 % reduction of PM2.5 negative errors in the model, with errors as low as −16 % to −11 % in EXP2. However, the inversion produced by EXP2 was still weaker than the actual observations, and the AF alone could not completely explain the PM2.5 underestimation. Based on EXP2, the 80 % decrease in the turbulent diffusion coefficient of chemical tracers in EXP3 resulted in near-zero turbulent diffusion, referred to as a “turbulent intermittence” atmospheric state, which subsequently resulted in a further 14 %–20 % reduction of the PM2.5 underestimation; moreover, the negative PM2.5 errors were reduced to −11 % to 2 %. The combined effects of the AF and the decrease in the turbulent diffusion coefficient explained over 79 % of the underestimation of the explosive growth of PM2.5 in this study. The results show that online calculation of the AF is essential for the prediction of PM2.5 explosive growth and peaks during severe haze in China's Jing–Jin–Ji region. Furthermore, an improvement in the planetary boundary layer scheme with respect to extremely stable atmospheric stratification is essential for a reasonable description of local “turbulent intermittence” and a more accurate prediction of PM2.5 explosive growth during severe haze in this region of China.
- Article
(13104 KB) - Full-text XML
- BibTeX
- EndNote


Since 2013, eastern China has been experiencing unprecedented intrusions of severe haze accompanied by high levels of particulate matter (PM) with an aerodynamic diameter of less than 2.5 microns (PM2.5), which has caused wide public concern (Ding et al., 2013; Wang et al., 2013; Wang et al., 2014a, b; Huang et al., 2014; Sun et al., 2014; Hua et al., 2016; Yang et al., 2015; Zhong et al., 2017, 2018a, b). The instantaneous PM2.5 concentration is usually in the hundreds of µg m−3 during severe haze episodes, occasionally exceeding 1000 µg m−3, in the metropolitan region of Beijing–Tianjin–Hebei (referred to here as Jing–Jin–Ji) and its surroundings of eastern Shanxi Province, western Shandong Province, and northern Henan Province in eastern China (Wang et al., 2014; Quan et al., 2014; Sun et al., 2014; Yang et al., 2015; Zheng et al., 2016). However, studies have shown that models generally underestimate the explosive growth and peak values of PM2.5 during severe hazes, especially in Jing–Jin–Ji (Wang et al., 2013; Wang et al., 2014; T. Li et al., 2016).

The causes of PM2.5 explosive growth and its underestimation by atmospheric chemistry models are complex and uncertain at present, but it possibly involves local emissions, reginal transportation, aerosol physicochemical processes, gas–particle conversion, meteorological conditions, and so on. However, the actual atmospheric stability and how accurately it is described by atmospheric models is one fundamental problem that cannot be ignored. Local or regional meteorological conditions dictate whether haze occurs and what the PM2.5 level may be (Zhang et al., 2014; Zheng et al., 2015; Gao et al., 2016) when source emissions are unchanged for a short period of time. The meteorological conditions of the planetary boundary layer (PBL) are a key factor in, and a direct trigger for, the emergence of a haze event (Wang et al., 2014; Li et al., 2016; Zhong et al., 2017). Turbulent diffusion is an important factor used to characterise PBL meteorology when the atmosphere is stable. Moreover, it is a major pathway for particle and gaseous pollutant exchange from the surface to the upper atmosphere: when haze occurs, pollutant dispersal via the upper-level winds can take place when haze is accompanied by calm surface winds and weak vertical motion of air in surface layers and the PBL. The intensity of turbulent diffusion largely determines the severity of haze pollution. Thus, a reasonable description of turbulent diffusion by PBL schemes in atmospheric chemistry models is vital for the prediction of severe pollution (Hong et al., 2006; Wang et al., 2015a; Hu et al., 2012, 2013a, b; Li et al., 2016). The latest studies in this field of research show (Wang et al., 2015b; Li et al., 2016) that current PBL schemes may be insufficient for describing the extremely weak turbulent diffusion conditions during particularly severe haze events in Jing–Jin–Ji, which may be one important reason why PM2.5 peaks are underestimated by atmospheric chemistry models. More specifically, there may be two independent reasons why the description of extremely weak turbulent diffusion in atmospheric models is deficient. One reason is that the aerosol–radiation feedback (AF) is not calculated online in the model run. The AF may restrain turbulence by cooling the surface and the PBL while heating the atmosphere above it when aerosols with certain absorption characteristics are concentrated in the PBL (Wang et al., 2010, 2015; Forkel et al., 2012; Gao et al., 2014, 2015; Ding et al., 2016; Li et al., 2016; Miao et al., 2016; Petäjä et al., 2016; Gao et al., 2017; Qiu et al., 2017; Zhong et al., 2018a, b). Ignoring the AF is likely to lead to an obvious overestimation of turbulent diffusion when the PM2.5 concentration exceeds a certain value, which is worthy of further study. The other possible reason is that the extremely weak turbulence resulting in extremely severe haze is not fully described by the atmospheric chemistry model (Li et al., 2016).
In the present work, a “red alert” heavy haze event (issued by China's Ministry of Environmental Protection when the air pollution index is forecast to exceed 300 over the following 3 days) that occurred from 15 to 23 December 2016 in China's Jing–Jin–Ji region was selected to study the contributing factors to PM2.5 explosive growth and peaks, and the possible deficiency of atmospheric models in describing extremely weak turbulent diffusion.
2.1 Model
Focusing on dust and haze pollution in China and East Asia, the Chinese Unified Atmospheric Chemistry Environment (CUACE) (Gong and Zhang, 2008) was online-integrated into the mesoscale version of the Global/Regional Assimilation and PrEdiction System (GRAPES_Meso), developed by the Chinese Academy of Meteorological Sciences (Chen et al., 2008; Zhang and Shen, 2008), to build an online chemical weather forecasting model, GRAPES_CUACE (Wang et al., 2009, 2010, 2015a; Zhou et al., 2012). The main components of GRAPES_CUACE include the following: a model dynamic core; a modularised physics package (Xu et al., 2008); an atmospheric chemistry module, CUACE, with online coupling of direct and indirect aerosol feedback; and an emissions inventory. The dynamic framework of GRAPES_CUACE is semi-implicit, semi-Lagrangian, fully compressible, and non-hydrostatic (Yang et al., 2007, 2008; Chen et al., 2008). A height-based terrain-following coordinate system is used, and there are 33 vertical layers form the surface to 30 km. A longitude–latitude grid is adopted in the spatial discretization of the model and the horizontal resolution may vary upon request. The physics package can also be tailored by the user (Xu et al., 2008), and Table 1 lists the specific physics and chemistry schemes used in this study. The gas-phase chemistry of RAD II (Stockwell et al., 1990), with 63 gaseous species through 21 photochemical reactions and 121 gas-phase reactions, is used in this study. The aerosols include sea salt (SS), sand/dust (SD), black carbon (BC), organic carbon (OC), sulfates (SFs), nitrates (NI) and ammonium salts (AM), and aerosol processes involving hygroscopic growth, coagulation, nucleation, condensation, dry and wet deposition, scavenging, aerosol activation, and so on. The formation of SF aerosols and secondary organic aerosols from gases, NI and ammonium formed through gaseous oxidation, and the thermodynamic equilibrium between NI and ammonium and their gas precursors calculated using ISORROPIA (Fountoukis et al., 2007), are considered in CUACE, which has been evaluated and introduced in previous studies (Gong and Zhang et al., 2008; Zhou et al., 2008, 2012).
Based on the modelled aerosol concentrations, vertical profiles of temperature change, including direct aerosol impacts, are calculated by the radiation model and fed back online to the model dynamic core at each grid point and every time step, which reforms the model temperature field, dynamic process, regional circulation, and meteorological conditions; this in turn ultimately impacts the aerosol concentration. The external mixing of aerosols species (SS, SD, BC, OC, SF, NI, and AM) and particle size bins are used in the calculation of the AF, as introduced and evaluated in detail in previous studies (Wang et al., 2009, 2010, 2015a, b). With this two-way GRAPES_CUACE model, aerosol–radiation–PBL–meteorological interactions, as well as aerosol–cloud–precipitation interactions and regional pollution and transportation of PM2.5 etc., have been successfully studied (Wang et al., 2010, 2015a, b; Zhou et al., 2012, 2016; Jiang et al., 2015; Zhang et al., 2018).
The turbulent diffusion coefficient is calculated using the Yonsei University PBL scheme (Hong et al., 2006), which is a revised vertical diffusion package based on the non-local boundary layer vertical diffusion scheme in a medium-range forecast (MRF) model (Hong et al., 1996). The major ingredient of the revision is the inclusion of an explicit treatment of entrainment processes at the top of the PBL, compared with the MRF PBL scheme. The specific calculation method of the diffusion coefficient is shown in Hong et al. (1996), and has been selected as a standard option in MRF models (Caplan et al., 1997; Farfán and Zehnder, 2001; Basu et al., 2002; Bright and Mullen, 2002; Mass et al., 2002) and the Weather Research and Forecasting model (Hong et al., 2006) of the National Centers for Environmental Prediction (NCEP) since its establishment.
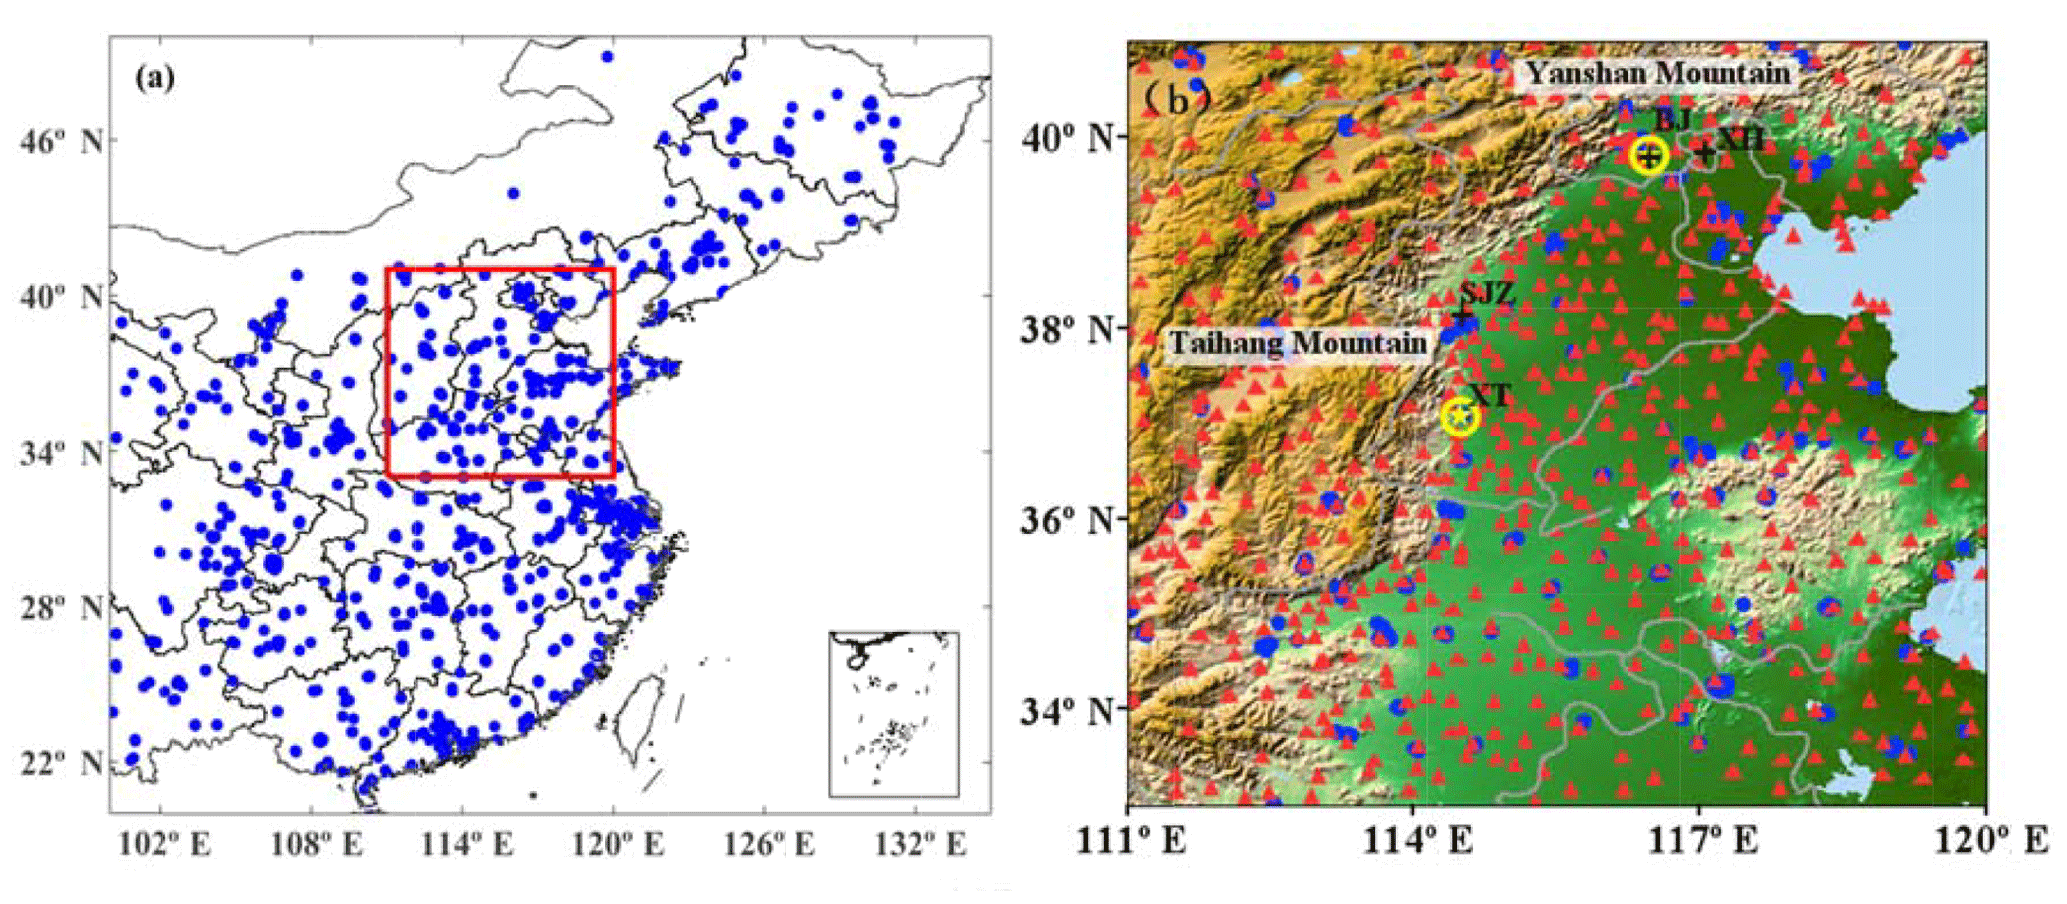
Figure 1(a) Model domain and location of the Jing–Jin–Ji region. (b) Geographic location and topography of Jing–Jin–Ji. Blue dots are the locations of PM2.5 observations, red triangles are the locations of automatic weather stations, yellow stars are the two sounding stations, and black crosses are the CARSNET and AEROSNET stations.
The horizontal resolution of the model adopted here was , to match the resolution of the emission source. Considering the impacts of the interregional transport of pollutants, eastern China (20∘–60∘ N, 100∘–140∘ E; Fig. 1a) was set as the model domain, although our discussion mainly focuses on the most polluted area, Jing–Jin–Ji (red frame in Fig. 1a), for which Fig. 1b illustrates the geographical and topographical features. There are two balloon sounding stations, Xingtai and Beijing (yellow stars in Fig. 1b) in our study area. Xingtai, located in southern Hebei Province at the eastern foot of the Taihang Mountains, is influenced by descending airflow from the mountains in winter, and in recent years has frequently been ranked the most polluted city in China. The topography of Xingtai and the serious haze pollution it experiences are closely related to its situation on the southern plain of the Jing–Jin–Ji region. Beijing, located next to Tianjin and surrounded by Hebei, lies in the transitional zone from the Yan Mountains to its southern plain, and represents the most polluted areas in the central part of Jing–Jin–Ji.
2.2 Emissions inventory
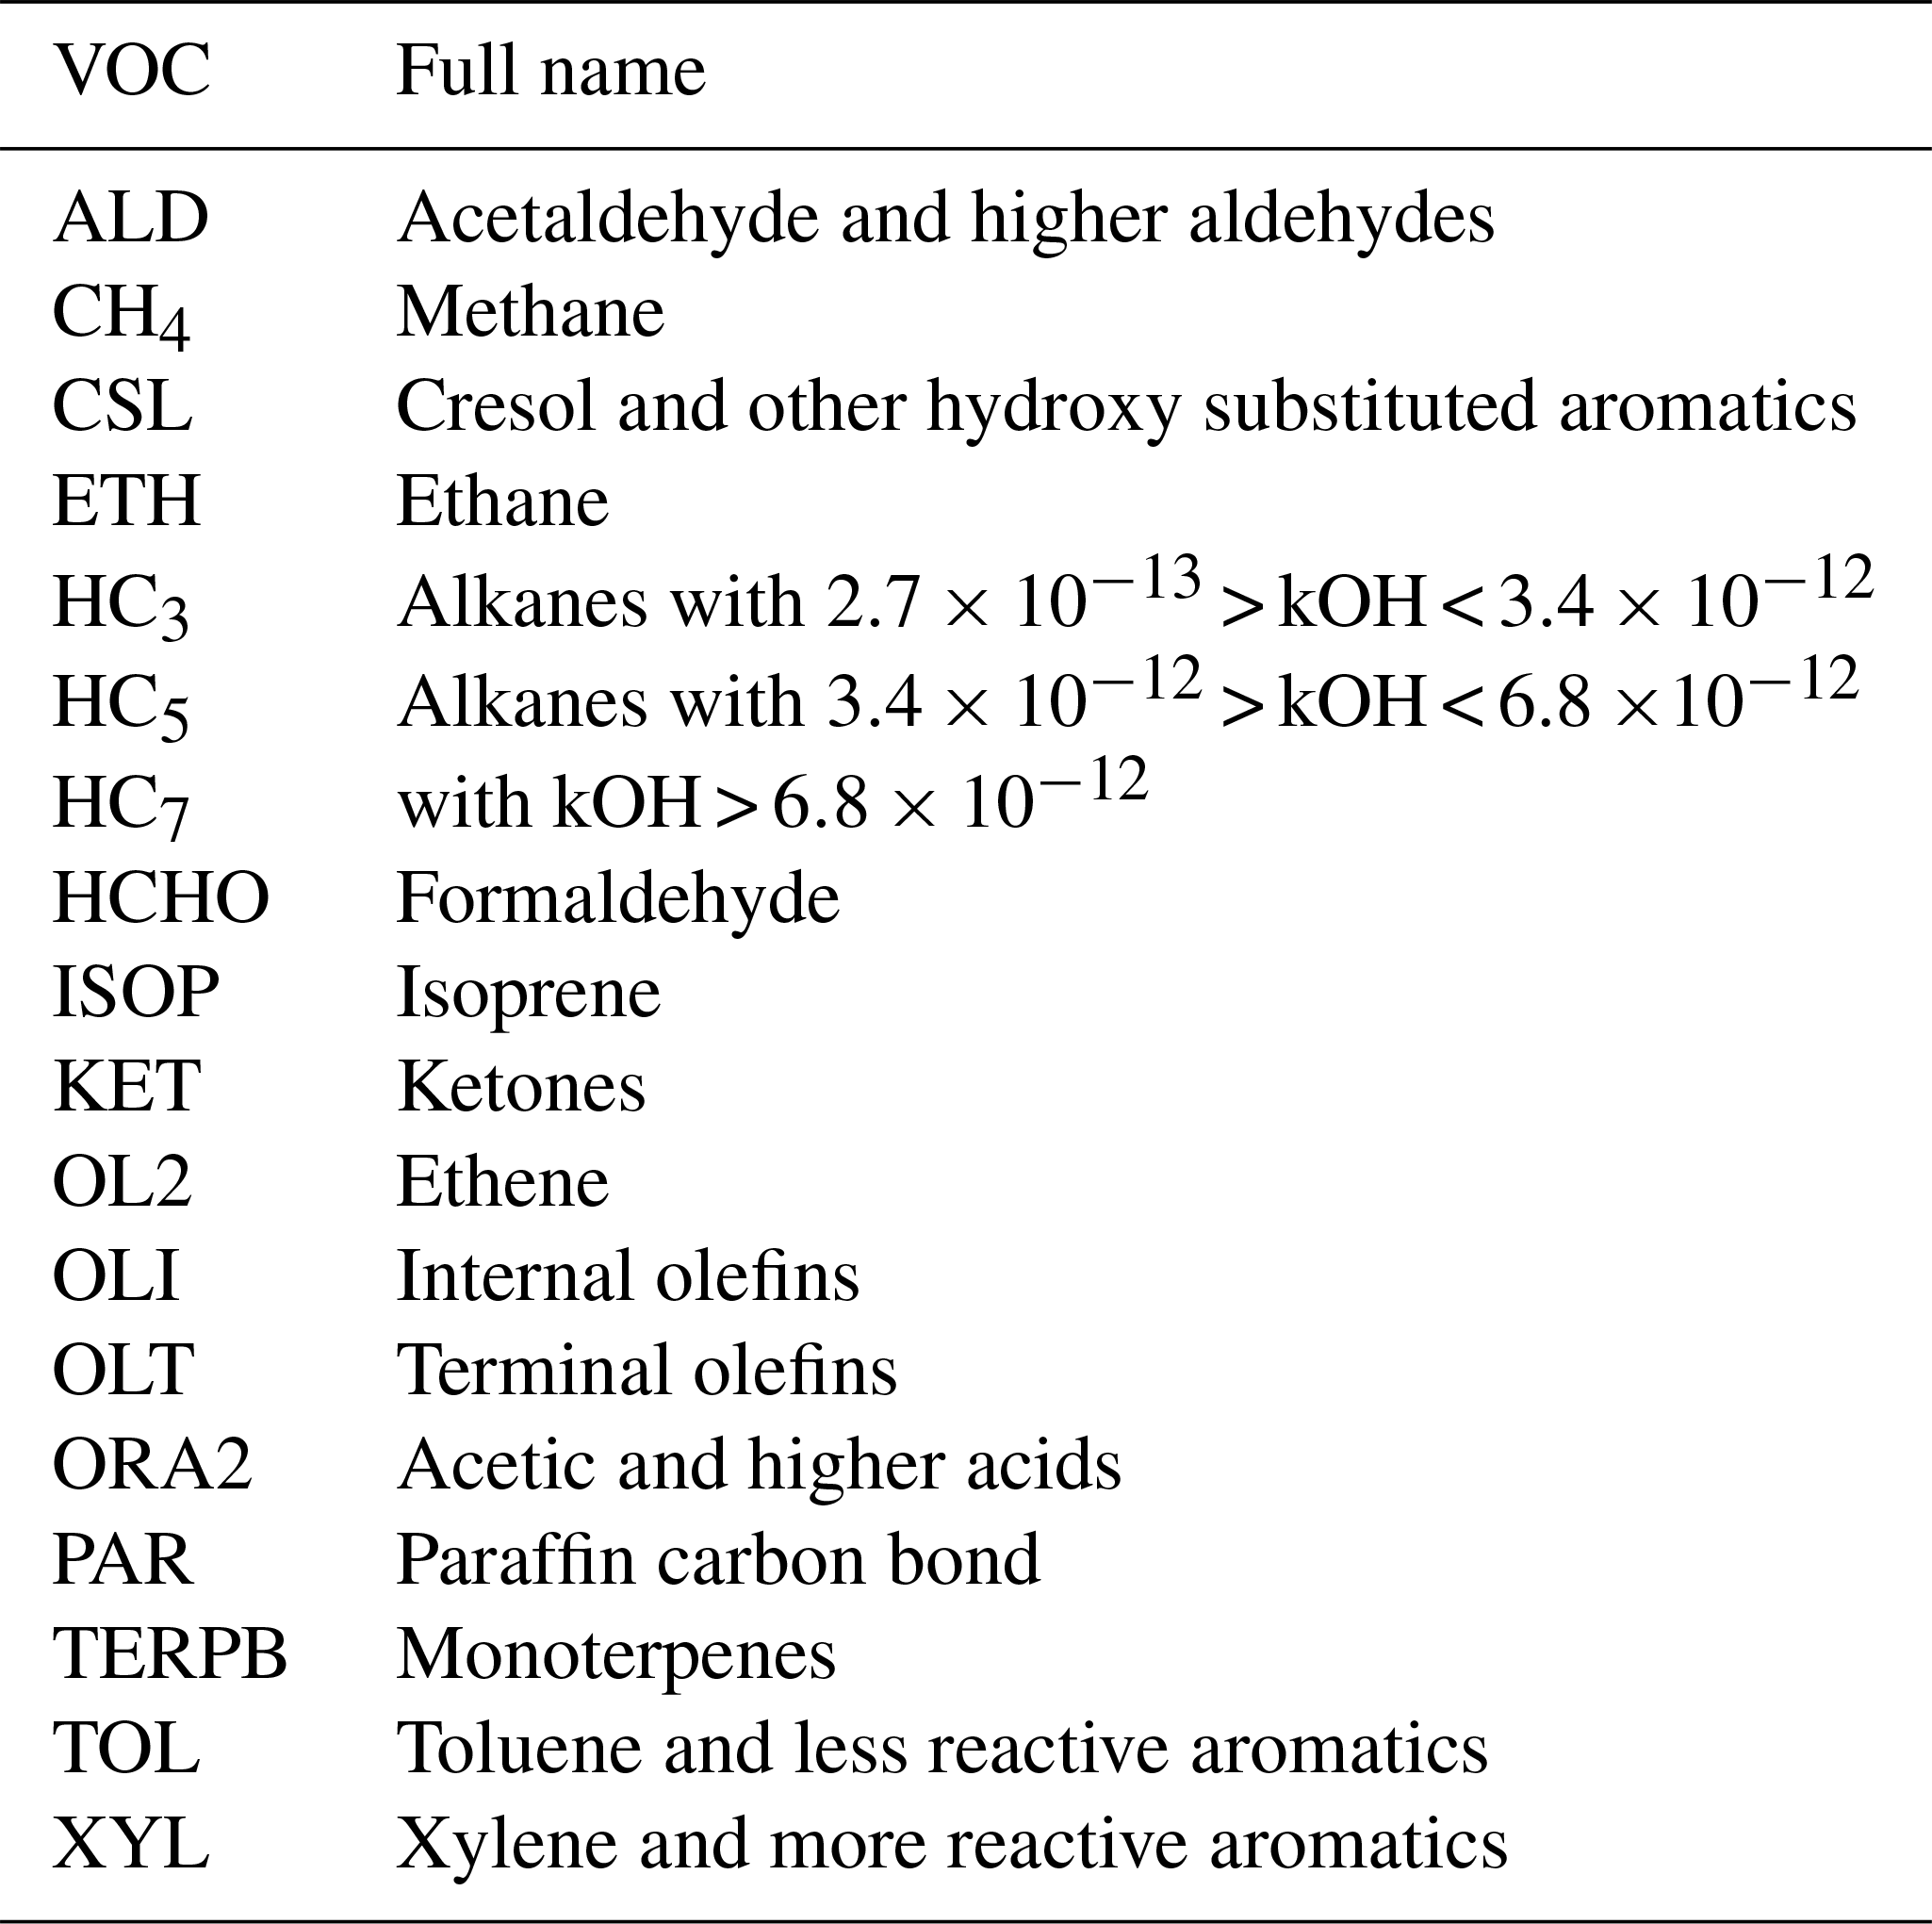
Based on the Multi-resolution Emissions Inventory for China in 2012 (He et al., 2012), the changes of five kinds of emission sources in eastern China – industrial, domestic, agricultural, natural, and traffic – were obtained from national statistical data with respect to industry, energy consumption, road networks, and motor vehicles, and were updated to 2015 and 2016. Five reactive gases (SO2, NO, NO2, CO, and NH3), 20 volatile organic compounds (VOCs) (ALD, CH4, CSL, ETH, HC3, HC5, HC8, HCHO, ISOP, KET, NR, OL2, OLE, OLI, OLT, ORA2, PAR, TERPB, TOL, and XYL – listed in Table 2), and five aerosol species (BC, OC, SF, NI, and fugitive dust), were obtained via the above emissions data according to the input requirement of the CUACE model. The horizontal grid resolution was and there was one emissions data set for each month at hourly intervals.
2.3 Data
Hourly observational PM2.5 concentration data for more than 1440 surface observational stations (blue dots in Fig. 1) from the China National Environmental Monitoring Centre (http://www.cnemc.cn/, last access: 30 April 2017) during the 15–23 December 2016 period were used to evaluate the model results. The hourly observational meteorological data, including wind speed and temperature, from 500 surface automatic observation stations of the China Meteorological Administration (CMA) in the Jing–Jin–Ji region (red triangle in Fig. 1b), were used for model validation. Meteorological balloon sounding data from the CMA at 00:00 UTC (early morning) and 12:00 UTC (dusk, local time) in Beijing and Xingtai (yellow star in Fig. 1b) during the same period were also used to compare with the modelled results. There is one AERONET station (Holben et al., 1998), Xianghe, and two CARSNET stations (Che et al., 2009, 2014, 2015), Beijing and Shijiazhuang, in the Jing–Jin–Ji region (black crosses in Fig. 1b). Observed aerosol optical depth (AOD) and single scattering albedo (SSA) data from these three stations during the same period were also used for model evaluation. NCEP global analysis gridded data (https://rda.ucar.edu/datasets/ds083.3, last access: 13 January 2018) were used as the model's initial and six-hourly lateral boundary meteorological input fields. The initial values of chemical tracers were obtained according to their 5-year mean climatic values. The results of the first 120 h of the model were discarded to eliminate the effects of the chemical initial fields.
2.4 Experimental design
Both dynamic processes of the regional atmosphere and solar radiation have important impacts on turbulent diffusion and PBL processes. When severe haze occurs, it has been shown from observation study (Zhong et al., 2018) that surface-level daily direct radiative exposure is reduced by around 89 % compared with clean days, suggesting the possibility of a huge difference in turbulent diffusion between severe haze and clean days. However, it is difficult to distinguish between the two reasons for the extremely weak turbulent diffusion in the true atmosphere, due to the complicated relationship between atmospheric dynamics and solar radiation. Nevertheless, meaningful results might be possible from sensitivity experiments using an atmospheric chemistry model. Here, three such experiments (EXP1, EXP2, and EXP3 – see Table 3 for descriptions) were designed to discuss the contributing factors to extremely weak turbulence and the corresponding PM2.5 explosive growth, along with the insufficient description of the extremely weak turbulent diffusion by PBL schemes in atmospheric chemistry models. All other model dynamic processes, physical options, and initial input data of the meteorology and chemical tracers were same for the three experiments, i.e. except the differences shown in Table 3. In EXP3, a further decrease in the turbulent diffusion coefficient based on EXP2 was only applied to the diffusion coefficient of chemical tracers in CUACE mode; the diffusion coefficient in other physical packages and the dynamic framework of GRAPES_Meso was the same as in EXP1 and EXP2.
The haze episode studied began on 15 December 2016. PM2.5 began to gather and climb slowly at this time, but was below 150 µg m−3 in most of the Jing–Jin–Ji region from 00:00 UTC on 15 December to 00:00 UTC on 17 December – a period we refer to as the “climbing stage” of PM2.5. From 00:00 UTC on 17 December to 00:00 UTC on 21 December, PM2.5 increased rapidly, reaching a peak of 400–600 µg m−3 in most of the study area. We refer to this period as the “explosive growth stage” of PM2.5. In this section, we mainly focus on the contributions of the AF and the decrease in the turbulent diffusion coefficient to the PM2.5 during this stage.
3.1 Synoptic background
The circulation in the upper atmosphere and the surface-level synoptic system controlling Jing–Jin–Ji remained relatively stable during the maintenance of this haze episode. Figure 2 displays the geopotential height, temperature, and winds in the upper (500 hPa), middle (700 hPa), and lower (850 hPa) atmosphere, as well as the PBL levels (900, 950, and 1000 hPa), at 00:00 UTC on 19 December 2016, to show the meteorological background. It can be seen that the geopotential height in the upper atmosphere (500 hPa) showed zonal circulation in East Asia. There was a horizontal trough north of the Jing–Jin–Ji region (black frame) in the upper and middle atmosphere (500 and 700 hPa), and the region was controlled by moderate northwesterly or westerly air flow at the bottom of the trough. The temperature and wind fields at 500 and 700 hPa both showed that cold air in the upper and middle atmosphere was weak. The 850 hPa geopotential height showed that the subtropical high in the East China Sea was strong; furthermore, Jing–Jin–Ji was in the pressure equalisation field on the northwest periphery of the subtropical high, and the wind was very weak at this level due to the blocking of the subtropical high. The 900, 950, and 100 hPa geopotential heights all showed that Jing–Jin–Ji was located in the pressure equalisation field between the “northwest land high” and southeast subtropical high within the whole PBL, and that the land high was weaker than the subtropical high. This resulted in a small pressure gradient, weak and thin wind fields, and a stable atmospheric situation within the PBL, which was conducive to the maintenance of the haze episode.
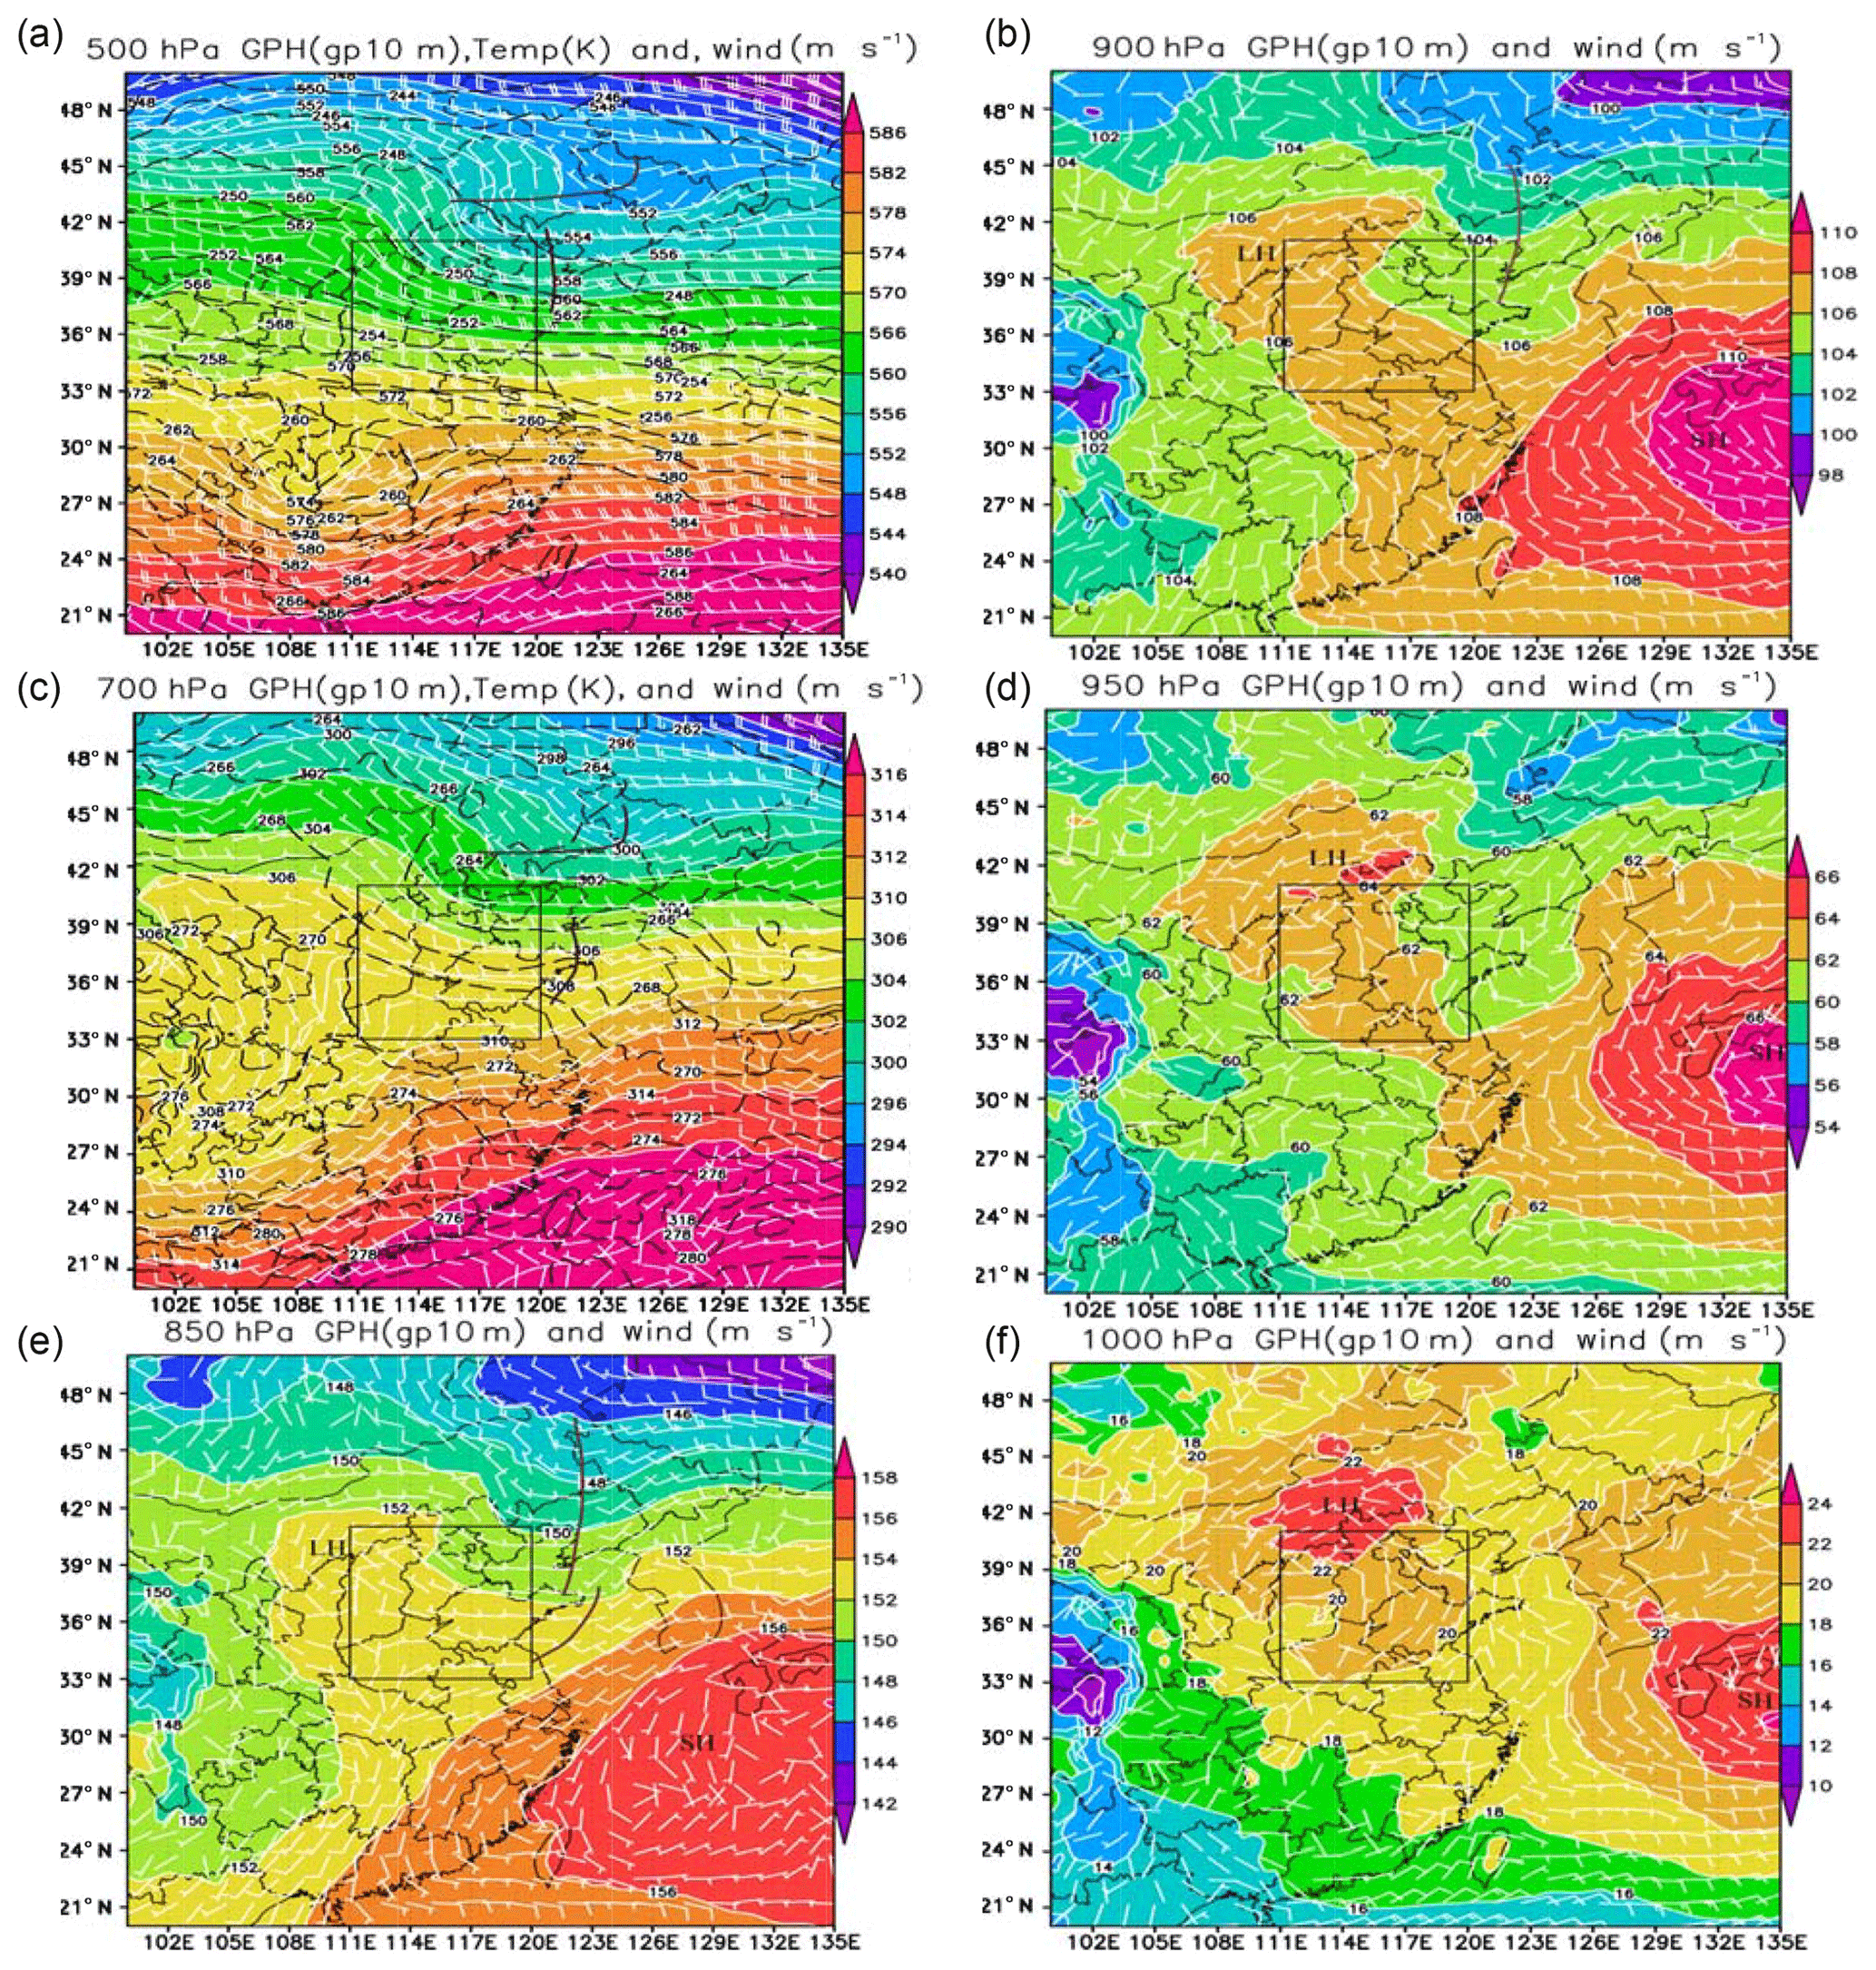
Figure 2Geopotential height (GPH; coloured shading; gp 10 m), temperature (dashed black contours; K), and wind (wind bars; m s−1) in the (a) upper (500 hPa) and (c) middle (700 hPa) atmosphere, and geopotential height and wind in the (e) lower atmosphere (850 hPa) and (b, d, f) the PBL (900, 950, 1000 hPa), at 00:00 UTC on 19 December 2016.
3.2 Observation–model comparison
Meteorological factors not only at the surface but also in the PBL are key aspects affecting haze processes and PM2.5 concentrations (H. Wang et al., 2014a, b). Unfortunately, however, most numerical models struggle to simulate these factors, which is a key point determining the performance of atmospheric chemistry models (Hu et al., 2013a, b; Li et al., 2016).
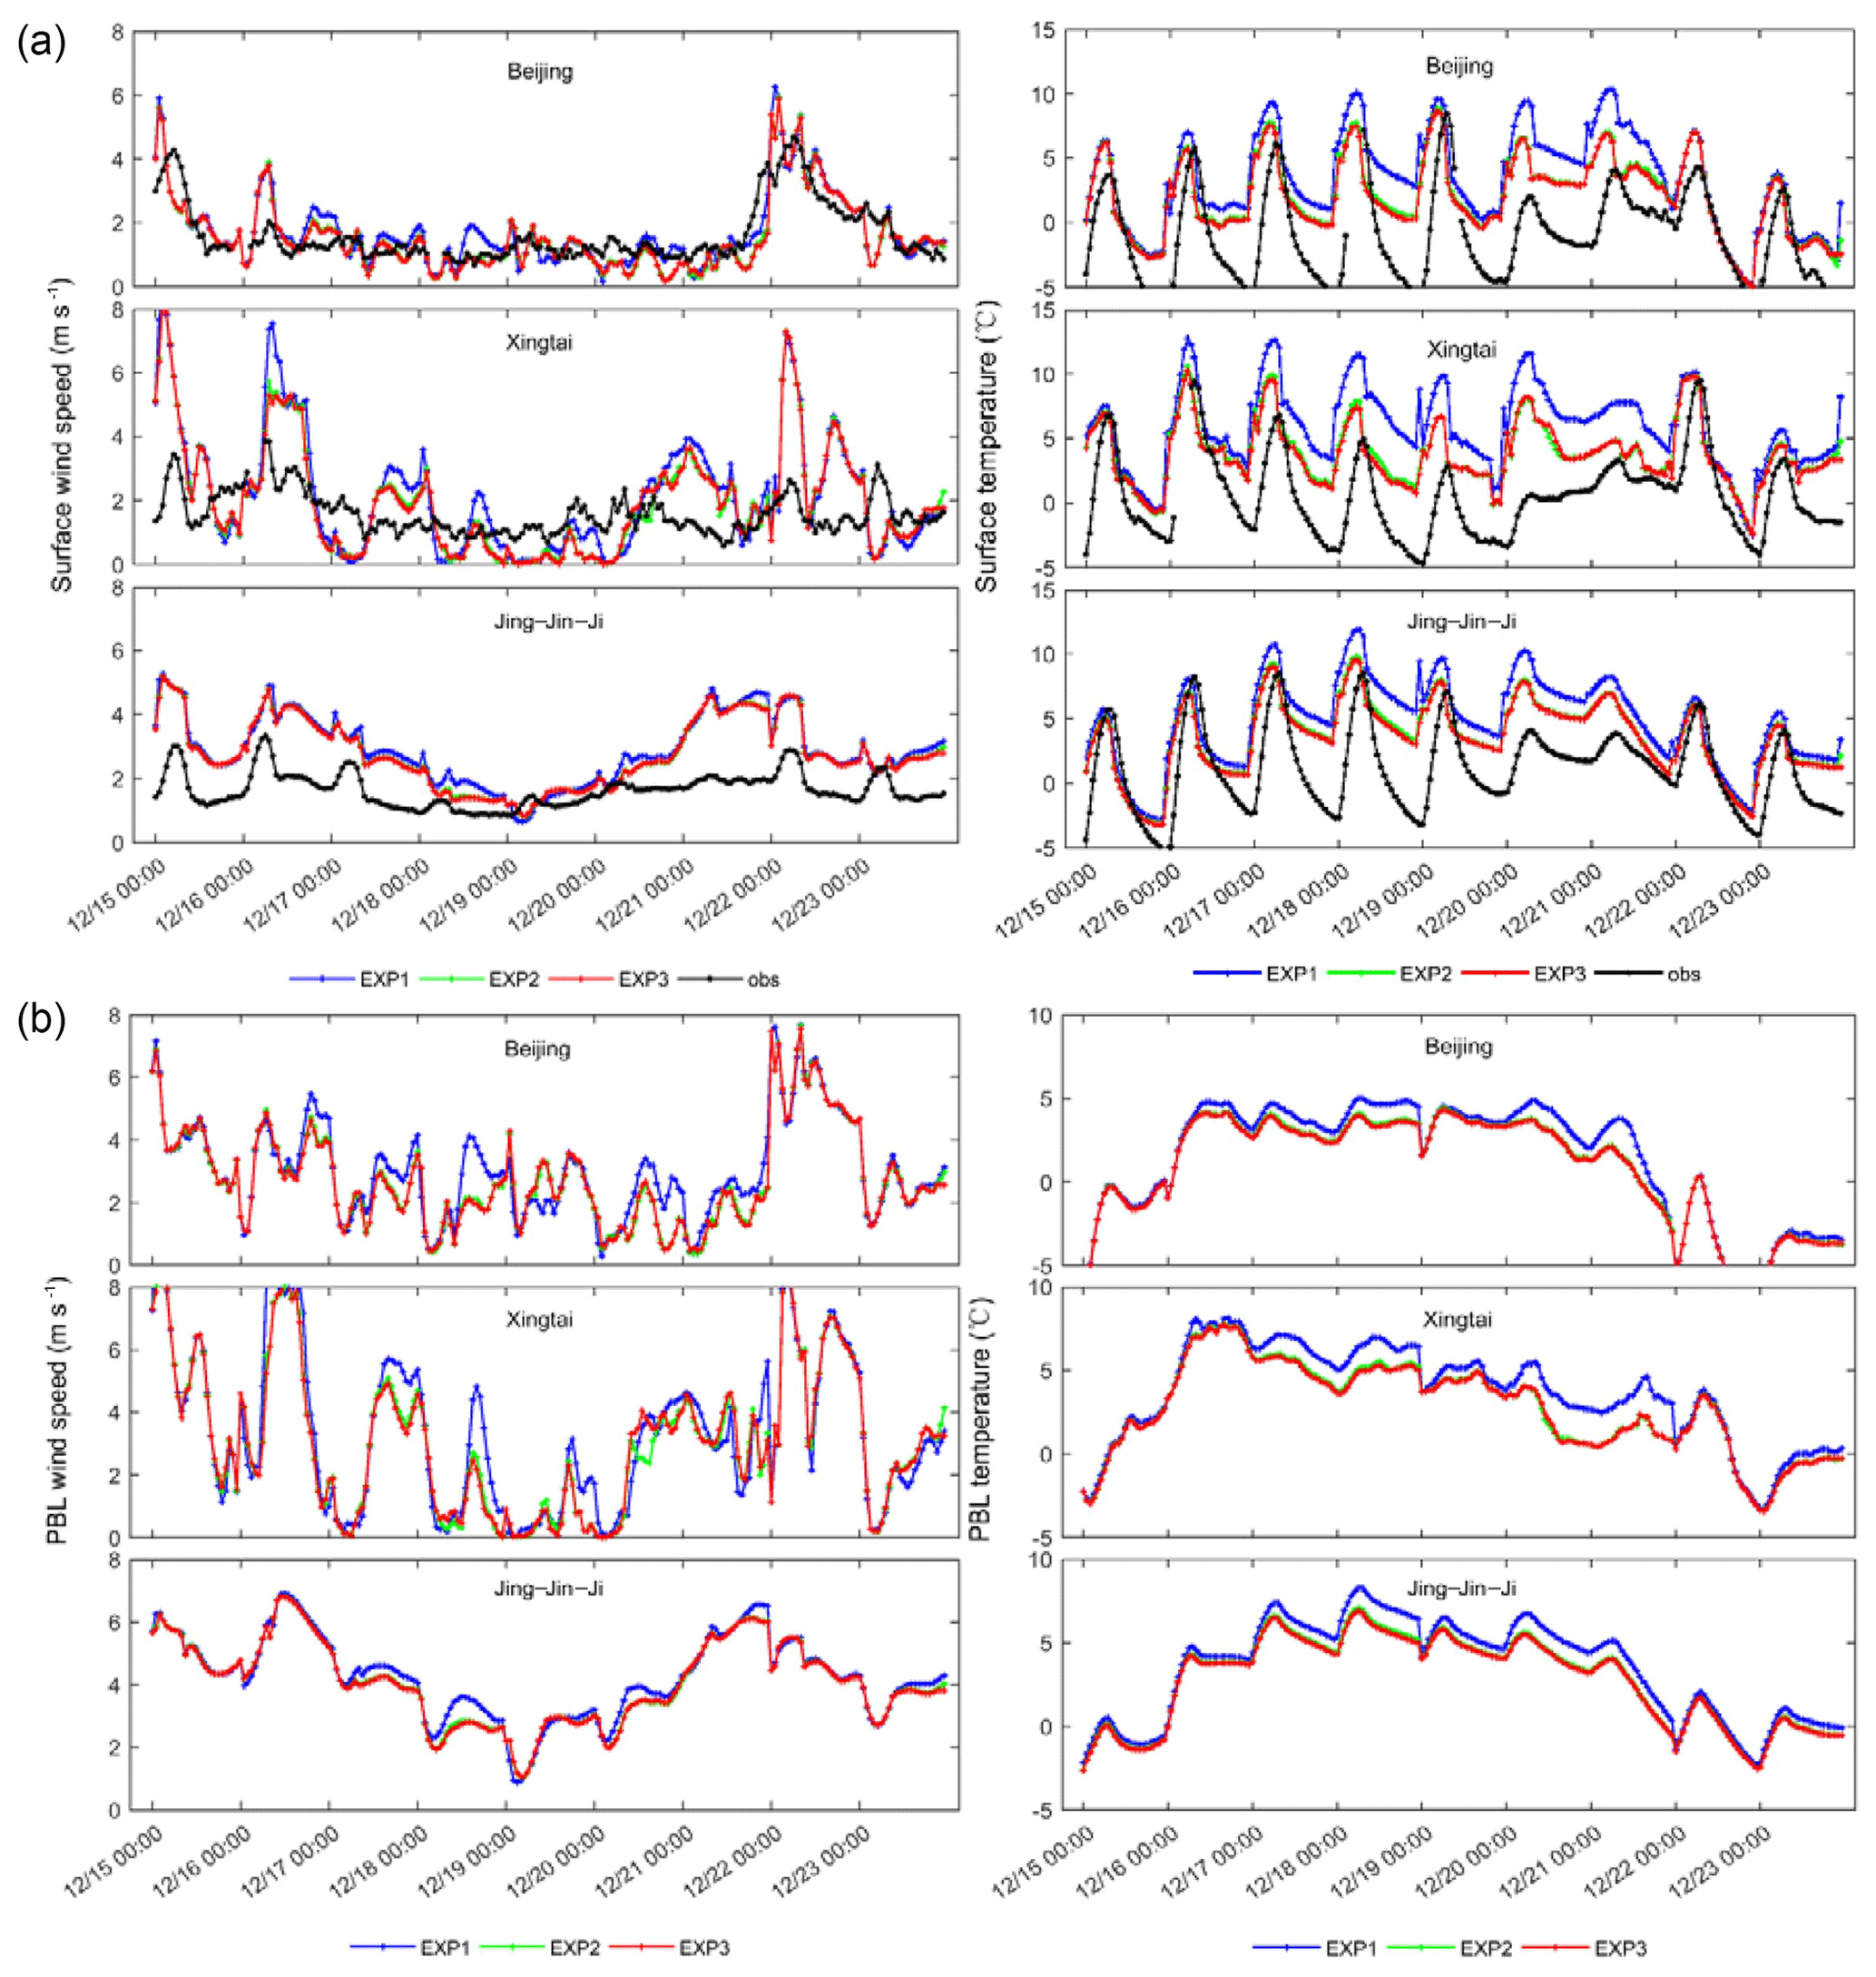
Figure 3Observed and modelled wind speed and temperature at the surface (a), and the PBL-mean wind speed and temperature (b), from the results of EXP1, EXP2, and EXP3 for Beijing, Xingtai, and the average for the Jing–Jin–Ji region as a whole, from 15 to 24 December 2016.
Using hourly meteorological data from surface automatic observation stations of the CMA, the surface wind speed and temperature at Beijing and Xingtai, and the average for the Jing–Jin–Ji region, according to the results of the EXP1, EXP2, and EXP3 experiments, were evaluated for the period from 15 to 24 December 2016 (Fig. 3). It can be seen that, in Beijing, the modelled surface wind speed in the three experiments was in good agreement with observations, in terms of the overall trend as well as the minimum and maximum values. The observed and modelled wind speed was generally below 2 m s−1 from 17 to 21 December (i.e. the explosive growth stage of PM2.5). The modelled wind speed at Xingtai was slightly worse than that at Beijing, but the overall trend of change was generally consistent with the observations; the wind speed was also below 2 m s−1 during the explosive growth stage. The modelled wind speed was higher, to an extent, than observed values at the beginning and end of the study period in Xingtai. The trend of change in the modelled average wind speed for the Jing–Jin–Ji region showed reasonable agreement with observations and was closest to the observed situation in the explosive growth stage. In general, the modelled regional wind was higher than the observed values. A comparison of the wind speed among the three experiments showed that the wind speeds in EXP2 and EXP3 were basically the same, but both were smaller than in EXP1 at Beijing and Xingtai to a varying degree, as well as for the Jing–Jin–Ji region as a whole, during the explosive growth stage, showing that the AF decreased the surface wind speed. The trend of temperature change according to the three experiments was also consistent with observations, at Beijing, Xingtai, and in the Jing–Jin–Ji region as a whole. However, it was found that the modelled temperature was obviously higher than the observed values, especially during the explosive growth stage. The temperature in EXP2 and EXP3 was basically same, but lower than in EXP1, which was much closer to the observations, indicating that the AF reduced the overestimation of the surface temperature in Beijing, Xingtai, and in the Jing–Jin–Ji region as a whole. However, the temperature in EXP2 and EXP3 was also higher than observed values during the explosive growth stage, suggesting that other uncertainties in the PBL scheme besides AF played a role. This is deserving of more detailed study in the future. Also shown in Fig. 3 are the PBL-mean winds of the three experiments for Beijing, Xingtai, and Jing–Jin–Ji as a whole. Unfortunately, no observational data were available to evaluate them. However, comparison of the PBL's wind and temperature according to the three experiments showed that the PBL-mean wind was generally below 4 m s−1, while the temperature was high in the explosive stage at Beijing, Xingtai, and in the Jing–Jin–Ji region as a whole. Similar to the surface-level results, the PBL-mean wind speed and temperature in EXP2 and EXP3 were generally the same, but the wind speeds in these two experiments were obviously lower than that in EXP1. This indicated that the reduction in wind speed due to the AF was more obvious in the PBL than at ground level. Meanwhile, comparison of the surface-level and the PBL temperature of the three experiments showed that the cooling effect of the AF was much stronger at the surface than in the PBL.
Table 4Observed and modelled daily AOD (* represents a shortage of observations). Dates refer to December 2016.
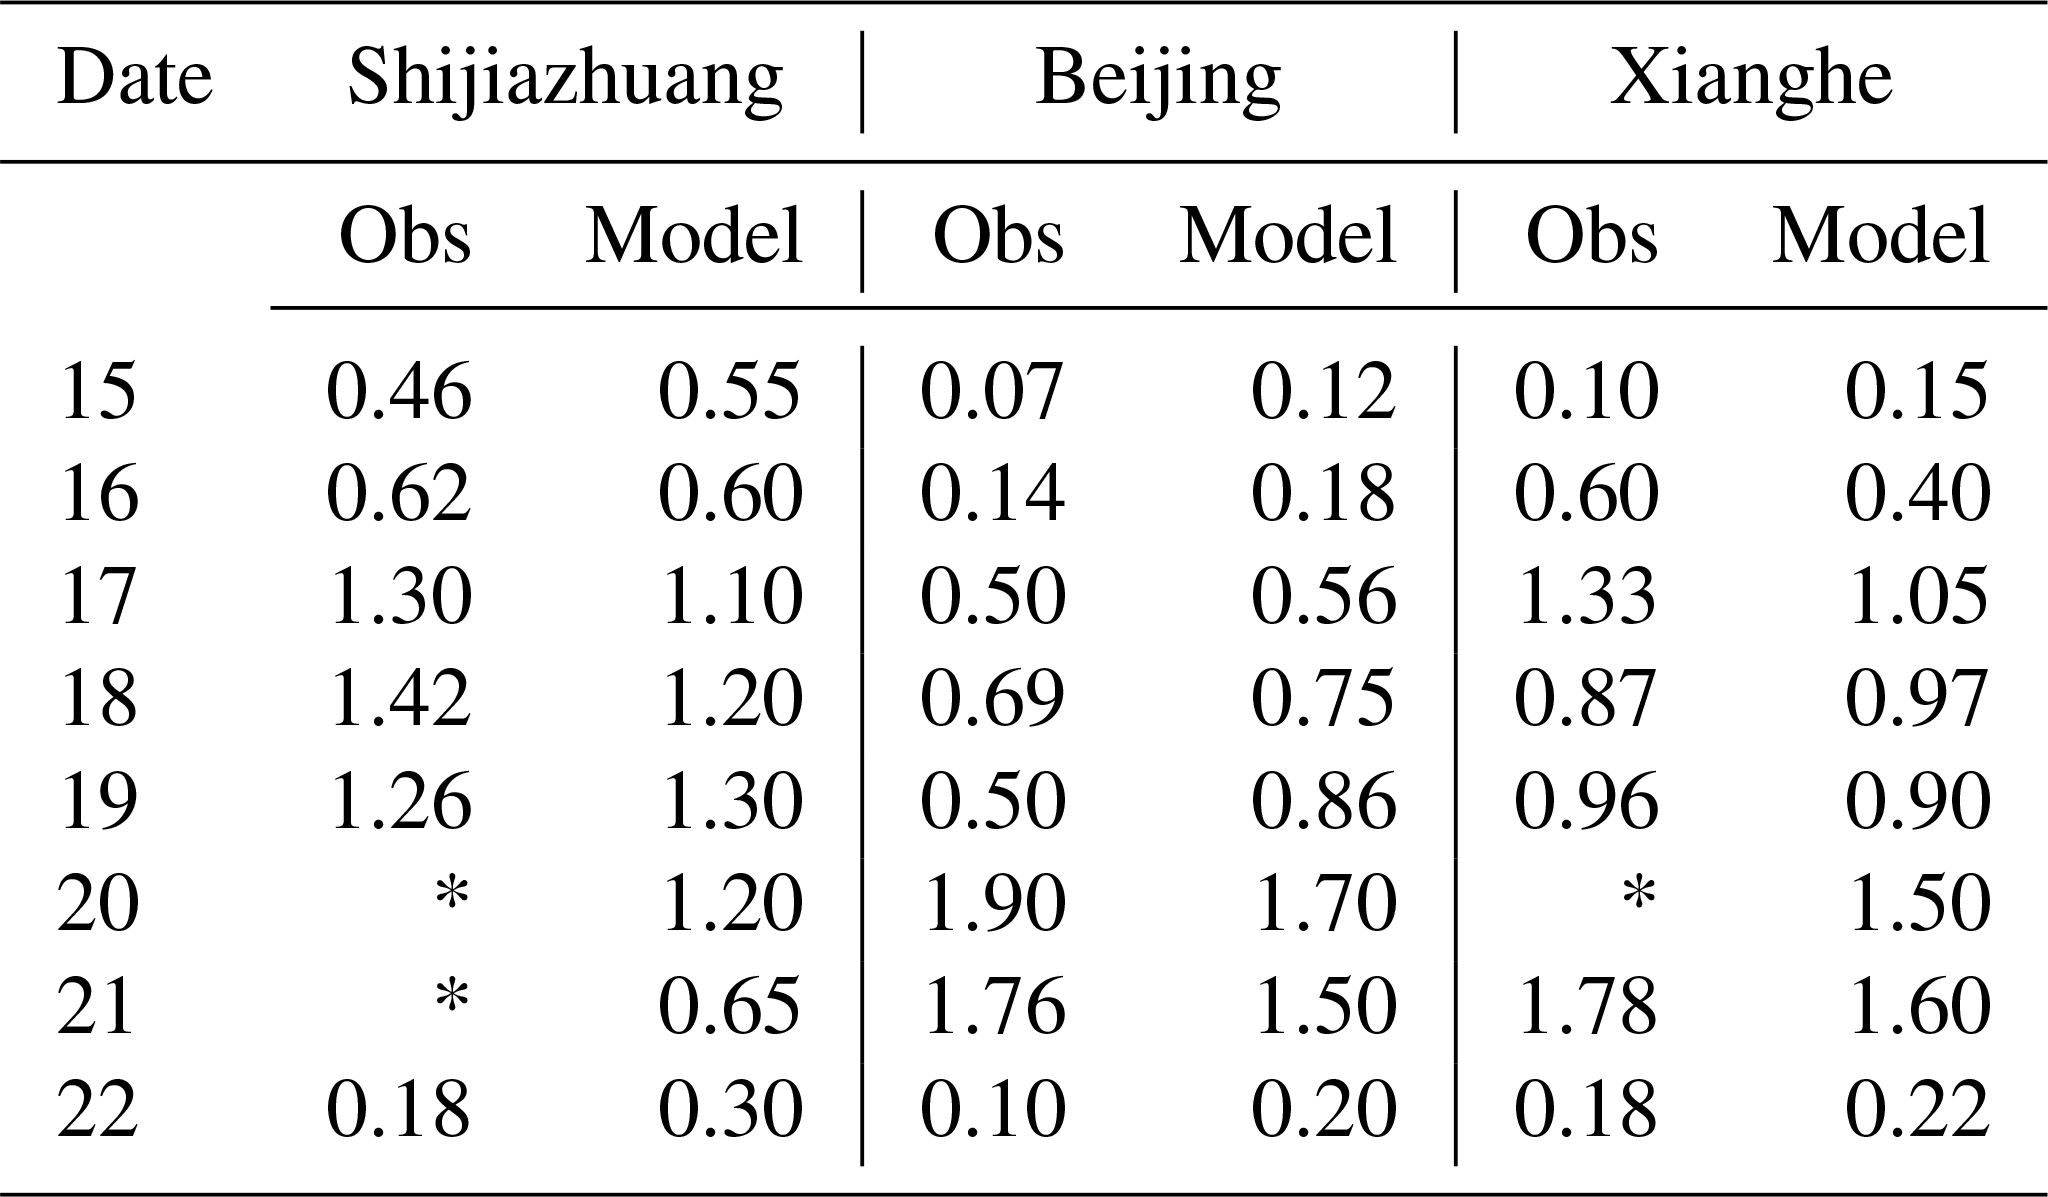
Table 5Observed and modelled daily SSA (* represents a shortage of observations). Dates refer to December 2016.
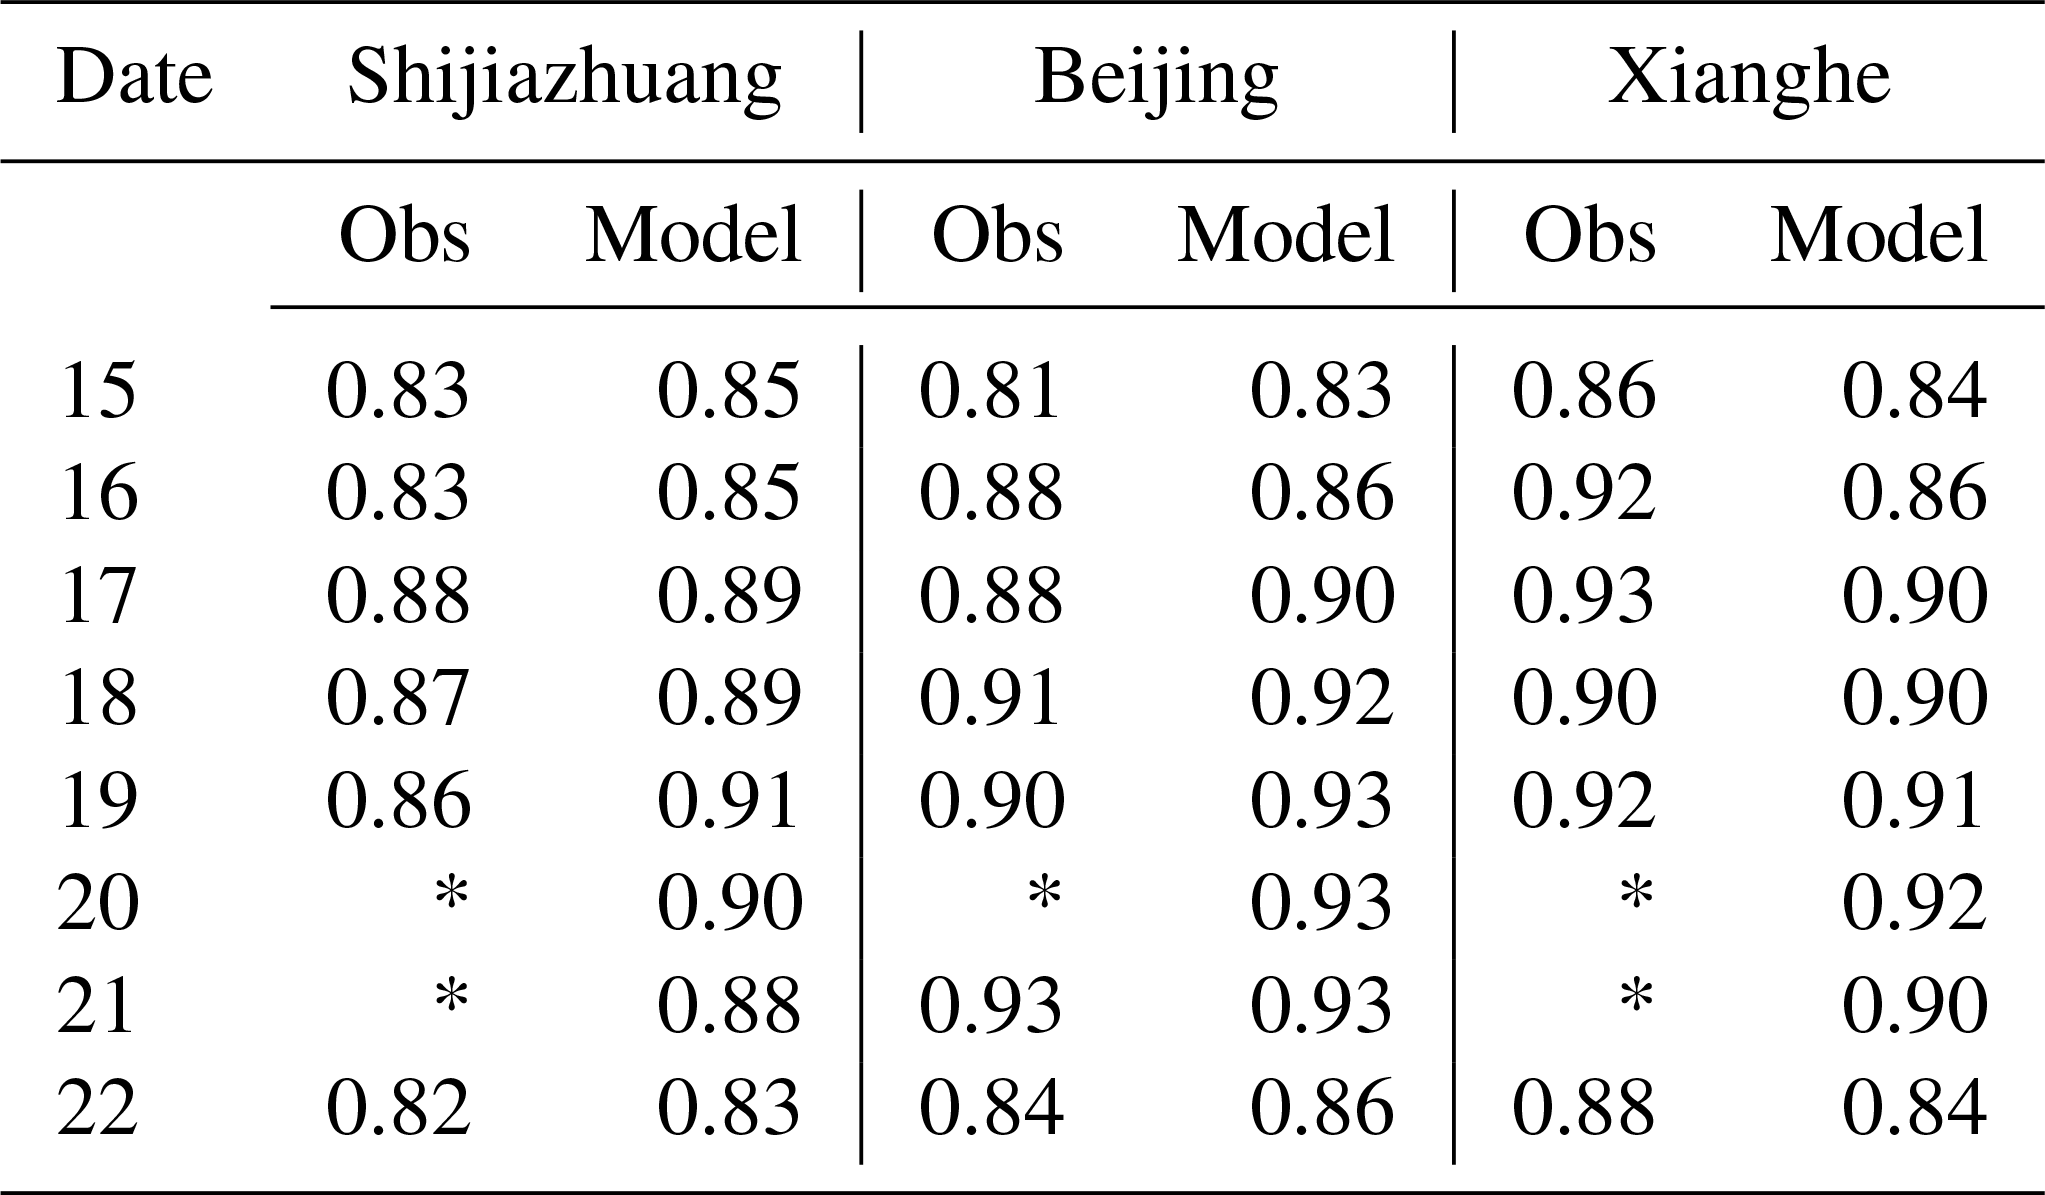
Aerosol optical properties, including AOD, SSA, and the asymmetry factor, largely determine the direct radiative effects of aerosols. The observed AOD (Table 4) and SSA (Table 5) at Shijiazhuang, Beijing, and Xianghe were used to evaluate the modelled results for the period from 15 to 22 December. Because the differences in the modelled AOD and SSA results of EXP1, EXP2, and EXP3 were small, only those of EXP1 are referred to here. The values of modelled AOD and SSA and their temporal trends of change during the 15–22 December period were basically consistent with observation at Beijing, Shijiazhuang, and Xianghe; thus, they demonstrated good model performance in terms of their description of aerosol optical properties. Both the observed and modelled SSA at Shijiazhuang, Beijing, and Xianghe (Table 5) showed that the SSA was obviously higher during the explosive growth stage compared with that at the beginning or end of the haze on 15–16 and 22 December. This illustrated that the scattering characteristics of composite aerosols clearly increase when high AOD and PM2.5 occur on severe haze days in the Jing–Jin–Ji region. The accurate description of AOD and SSA, especially with respect to the change in SSA from clean to haze days, is the basis of the following discussion on the effects of aerosols on PM2.5.
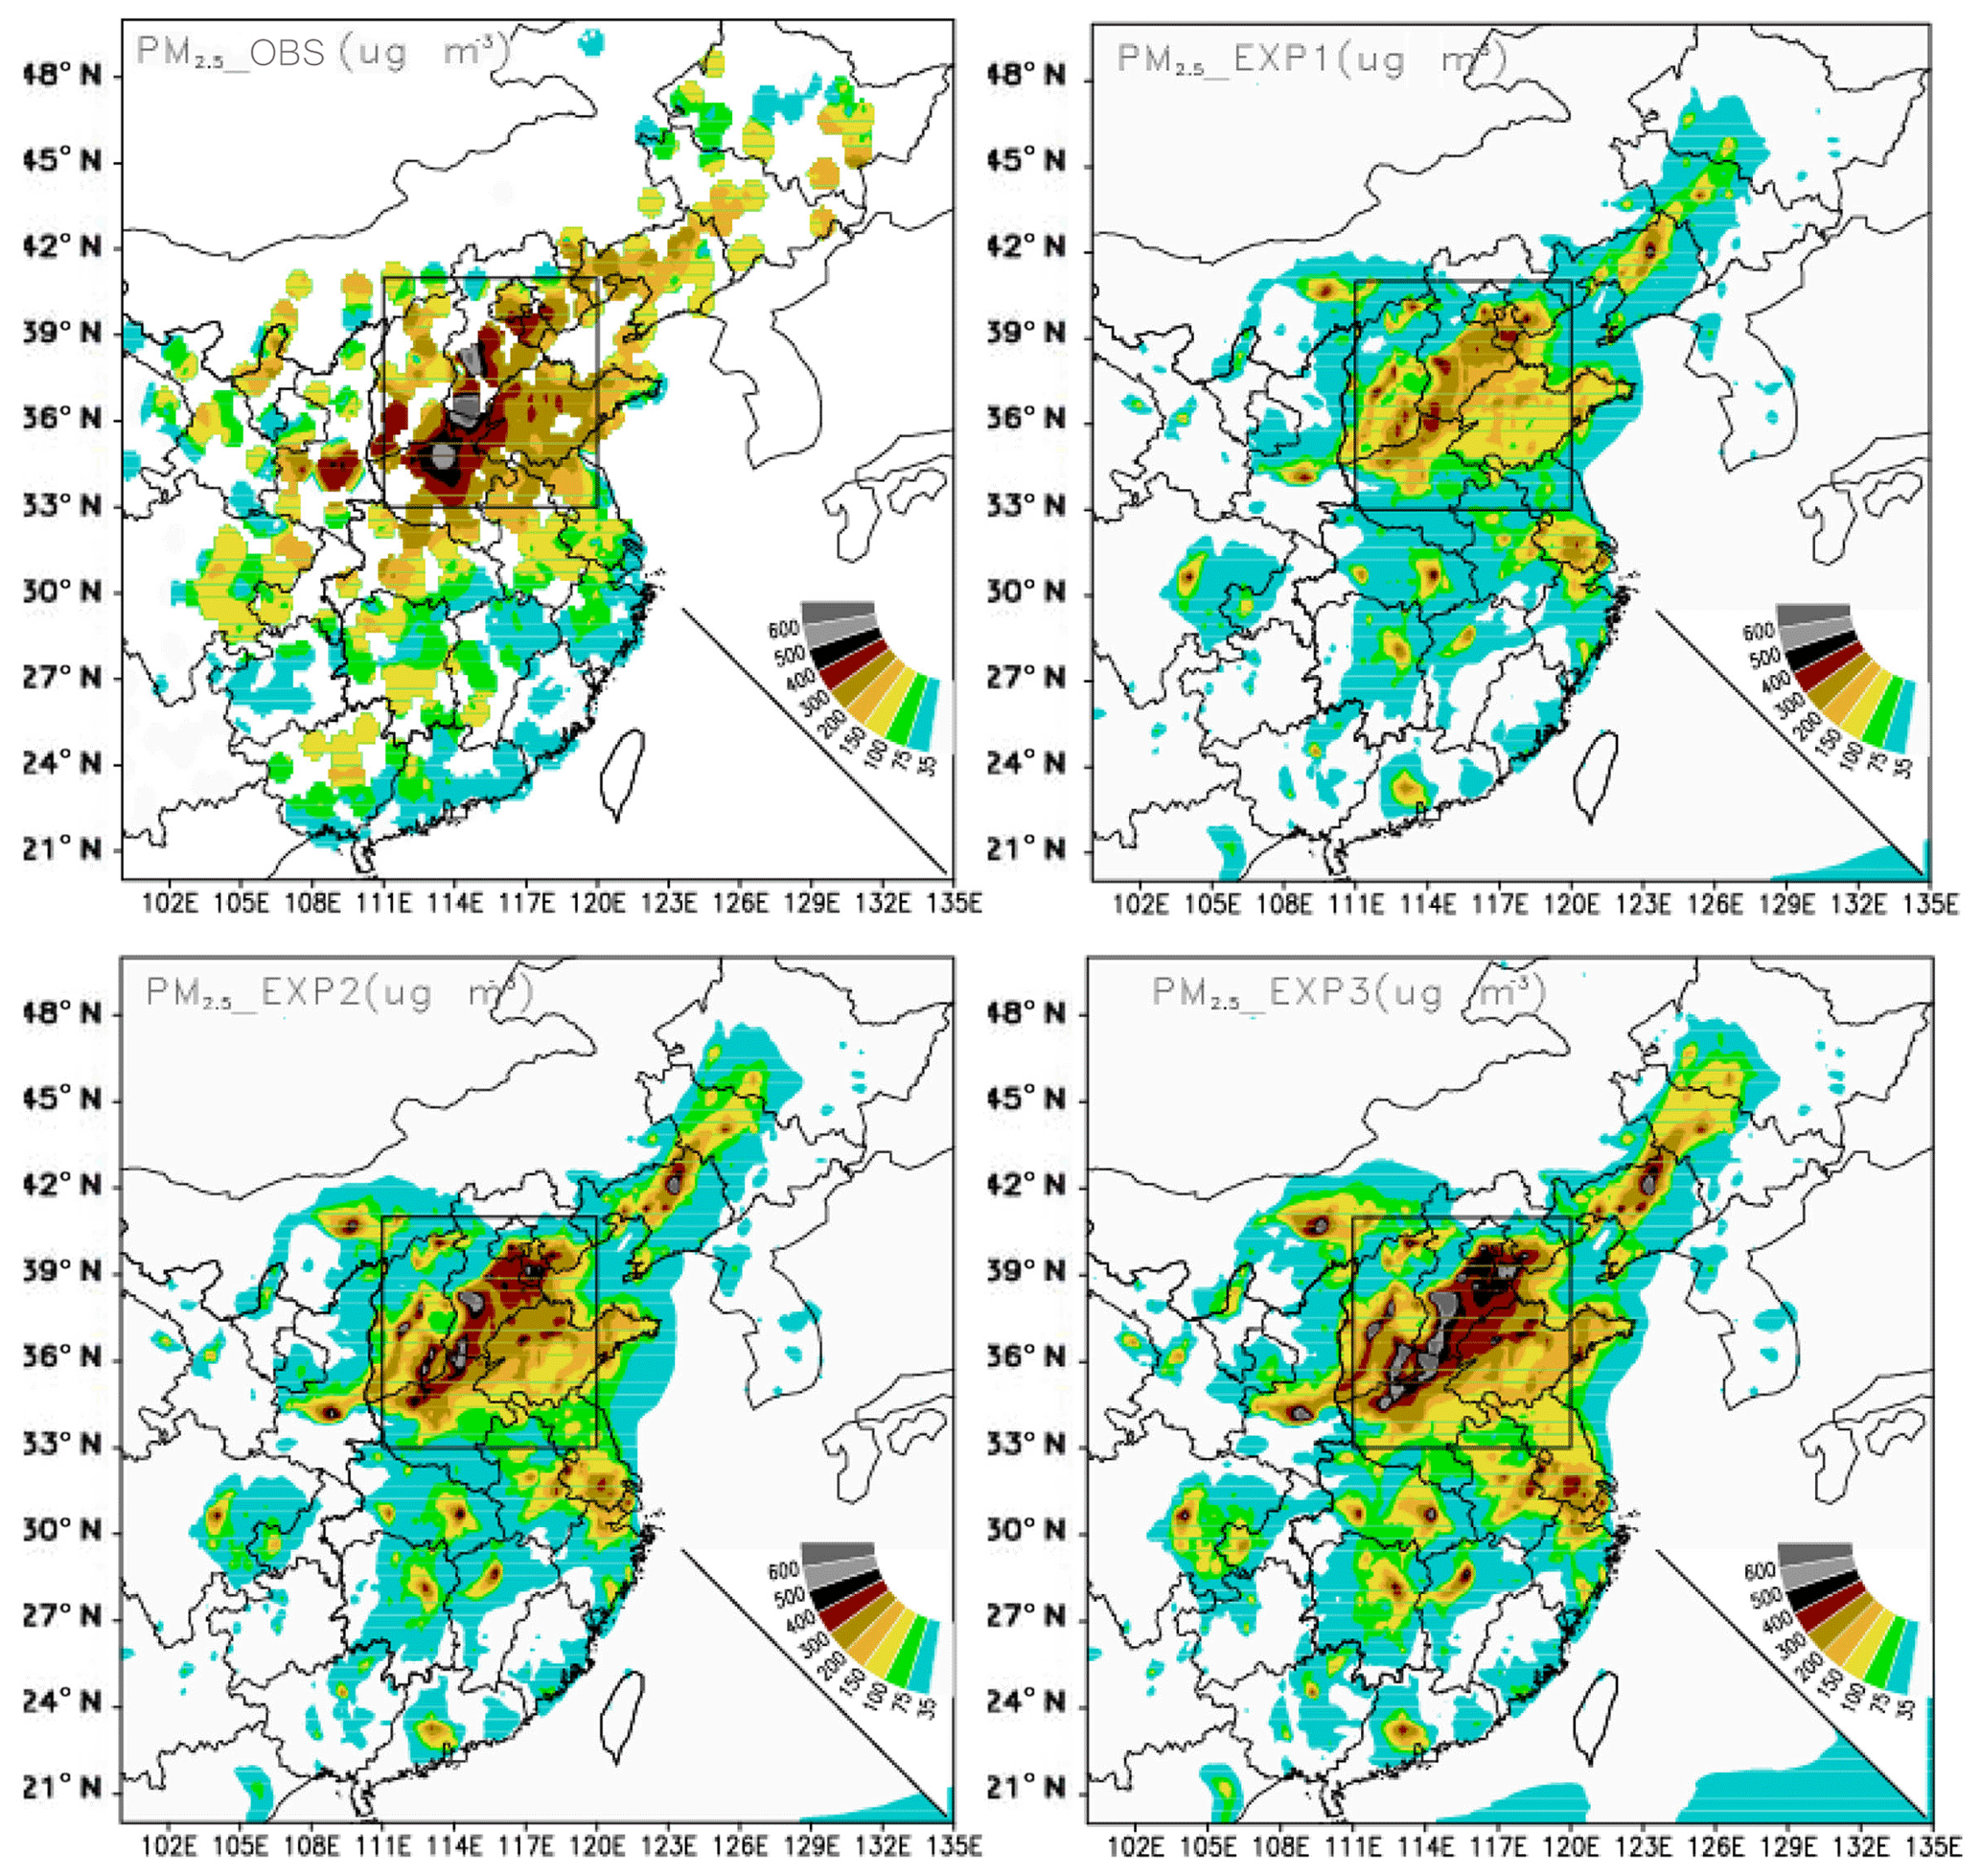
Figure 4Mean observed (PM2.5_OBS) and modelled PM2.5 concentration (µg−1 m−3) of the PM2.5 explosive growth stage, from the results of EXP1, EXP2, and EXP3 (PM2.5_EXP1, PM2.5_EXP2, and PM2.5_EXP3, respectively).
Figure 4 displays the averaged observed PM2.5 (PM2.5_OBS) and simulated PM2.5 of EXP1 (PM2.5_EXP1), EXP2 (PM2.5_EXP2), and EXP3 (PM2.5_EXP3) during the explosive growth stage. It can be seen from PM2.5_OBS results that the averaged PM2.5 values generally exceeded 100 µg m−3 in eastern China, and the Jing–Jin–Ji region comprised the most polluted areas with PM2.5 reaching 300–400 µg m−3 in parts of Beijing, Tianjin, central-south Hebei, western Shandong, and northern Henan. The most polluted area with PM2.5 values of 500–700 µg m−3 appeared in the southern Hebei and northern Henan provinces and the maximum value of PM2.5 even exceeded 700 µg m−3 in part of southern Hebei. Comparison of PM2.5_EXP1 and PM2.5_OBS shows that PM2.5_EXP1 was obviously lower than PM2.5_OBS on the whole. Notably, EXP1 failed to simulate the PM2.5 > 300 µg m−3. PM2.5_OBS was approximately 200–300 µg m−3 over most of Shandong, while PM2.5_EXP1 was only 100–200 µg m−3 in this region. Compared with PM2.5_EXP1, the PM2.5_EXP2 values were significantly improved by the AF, and were much closer to PM2.5_OBS. The high PM2.5_OBS centres of 300–400, 400–500, and 500–600 µg m−3 were almost simulated by EXP2, indicating the importance of the AF in simulating such high values of PM2.5. However, the simulated areas of these centres were smaller than those of PM2.5_OBS. EXP2 also failed to simulate the maximum PM2.5 values over 600 µg m−3 observed in southern Hebei. PM2.5_EXP3 just about made up for this shortcoming; compared with PM2.5_EXP1 and PM2.5_EXP2, PM2.5_EXP3 was undoubtedly the closest to PM2.5_OBS both in terms of PM2.5 extremes and the area of influence. These findings illustrate that both the AF and the decrease in the turbulent diffusion coefficient in atmospheric chemistry models are required for the effective prediction of PM2.5 explosive growth during severe haze in China's Jing–Jin–Ji region.
3.3 Change in downward solar radiation flux by aerosols and decrease in turbulent diffusion coefficient
PM in the atmosphere will inevitably lead to changes in the surface and atmospheric solar radiation flux. When severe haze occurs, most PM is concentrated in the atmosphere near the surface and within the PBL; solar radiative flux reaching the ground is greatly reduced, which is a direct trigger for the subsequent changes in thermodynamics, dynamics, and atmospheric stratification. Any factor leading to a change in the atmospheric PM loading might result in a change in the surface downward solar radiation flux (SDSRF). We calculated the percentage changes in the SDSRF (W m−2) between EXP2 and EXP1 [(SDSRF], and EXP3 and EXP1 [(SDSRF)], to study the impacts on the SDSRF of aerosols and the decrease in the turbulent diffusion coefficient. Figure 5 shows the mean percentage change in the SDSRF (W m−2) owing to aerosols and that due to aerosols plus the decrease the in turbulent diffusion coefficient, during the explosive growth stage. It can be seen that the SDSRF was reduced by more than 50 % by aerosols over most of the study region (60 %–65 % in Beijing, Tianjin, most of Hebei , and northern Shandong, and even 65 %–70 % in Beijing, Tianjin, and part of Hebei ), indicating the important influence of aerosols on the SDSRF. Comparison of Fig. 5a and Fig. 5b shows that this reduction in the SDSRF owing to aerosols (Fig. 5a) in EXP2 was further strengthened by the decrease in the turbulent diffusion coefficient of chemical tracers in EXP3 (Fig. 5b) in certain regions; this was because the decrease in the turbulent diffusion coefficient led to the accumulation of more PM2.5 near the surface (Fig. 3), less transport and, subsequently, an increase in total PM2.5 loading. It can also be seen that the difference between Fig. 5a and b is negligible. This is because the major impact of the decrease in the turbulent diffusion coefficient was to reform the vertical distribution of the atmospheric loading of PM2.5, and its impact on the total-column PM2.5 was minor. Conversely, the reduction in the SDSRF owing to aerosol radiation was already considerable, and so the change in the SDSRF owing to the increased total-column PM2.5 via the decrease in the turbulent diffusion coefficient would be secondary. This value of the SDSRF reduction owing to aerosols and the decrease in the turbulent diffusion coefficient is basically consistent with the 56 %–89 % difference of observational radiative exposure between clear and haze days during the same period (Zhong et al., 2018).
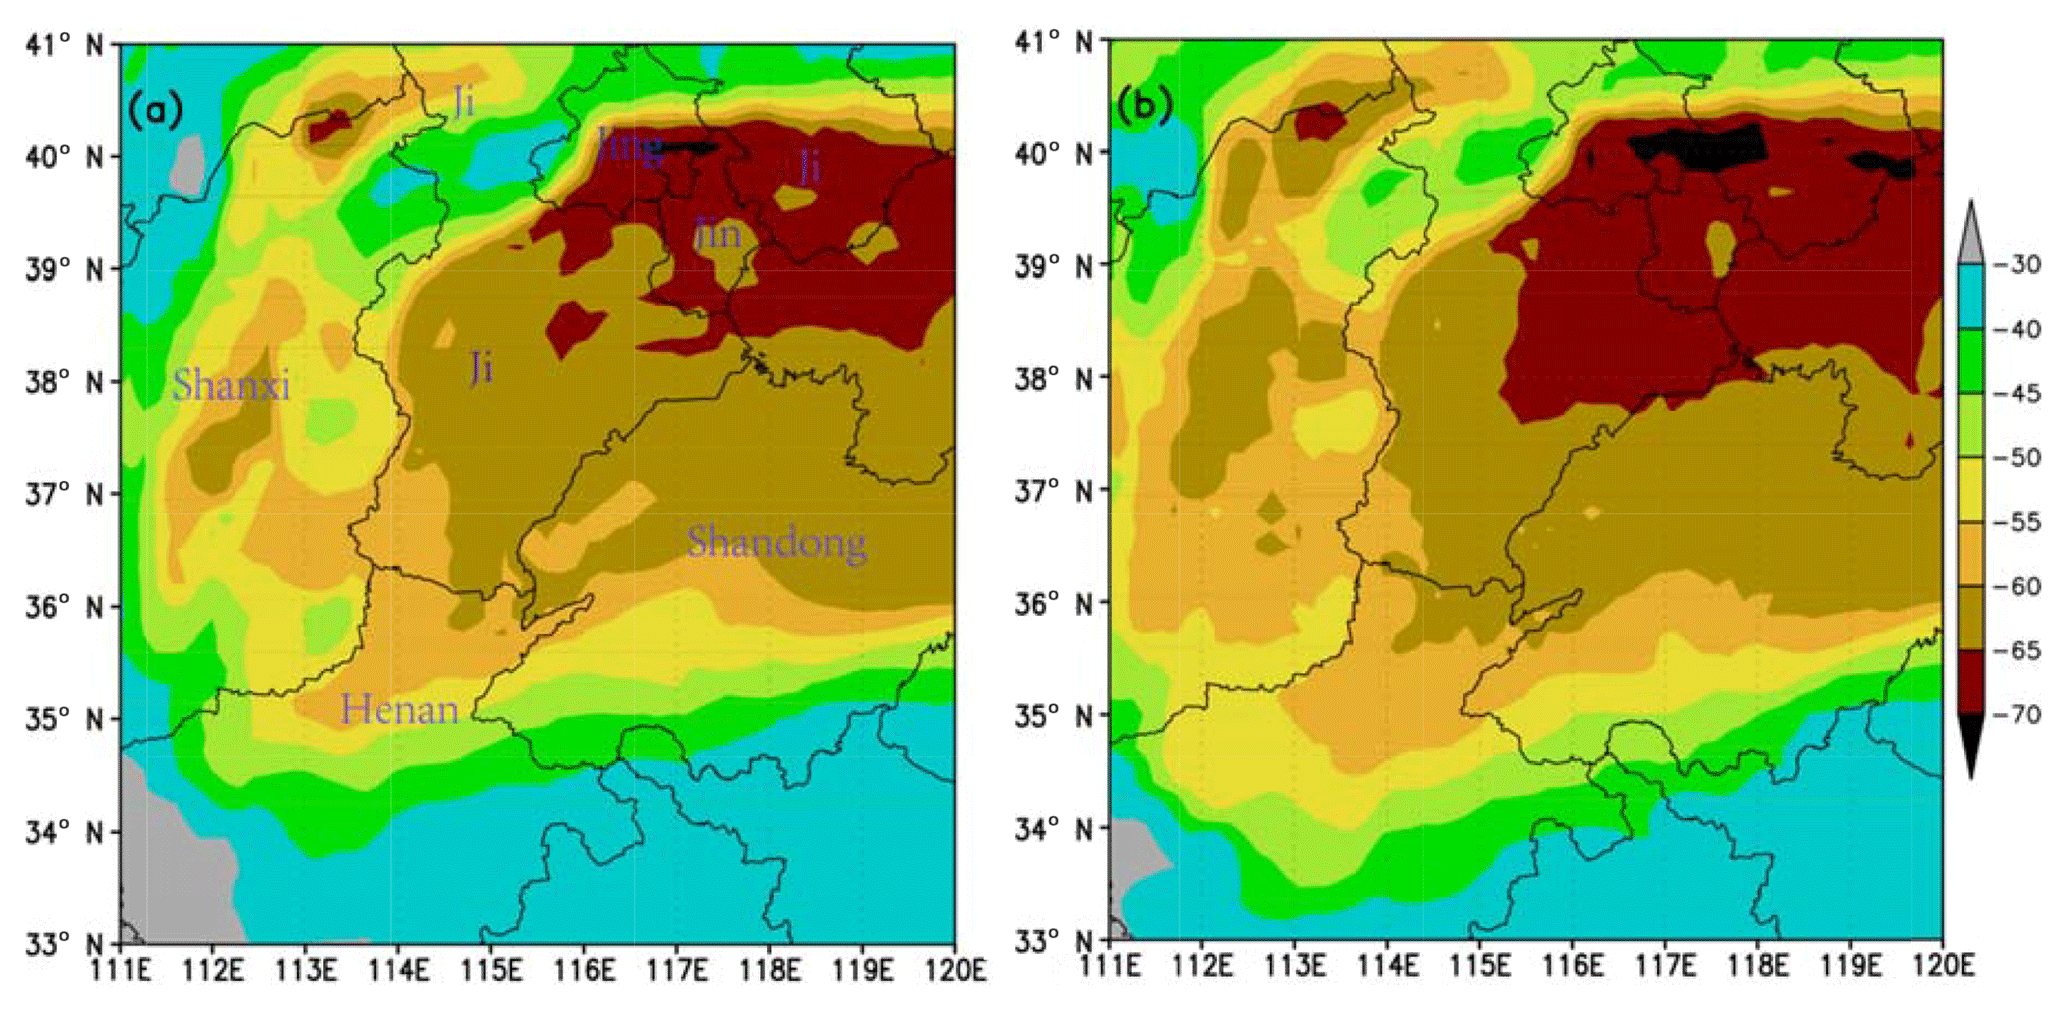
Figure 5Mean percentage change in the SDSRF (W−1 m−2) owing to (a) aerosols and (b) aerosols+ the decrease in the turbulent diffusion coefficient during the explosive growth stage.
3.4 Influence of aerosols on the reforming of the local atmospheric temperature profile
Offline and online studies indicate a reforming of the atmospheric temperature profile owing to the direct effect of aerosol radiation (Wang et al., 2010, 2015b; Wang et al., 2014; Forkel et al., 2012; Y. Gao et al., 2014, 2015; M. Gao et al., 2017; Ding et al., 2016). In our previous work (Wang et al., 2015a, b), composite aerosol mixing of BC, OC, SF, NI, dust, ammonium, and sea salt aerosols was online coupled into the GRAPES_CUACE model. On this basis, in the present study, the changes in the mean temperature profile of Jing–Jin–Ji during daytime owing to aerosol radiation were calculated for the 15–20 December 2016 period. It can be seen from Fig. 6 that aerosols cooled the atmosphere below 750–800 hPa, but warmed it above this height. Considering the PBL height may be as low as several hundreds to 1 thousand metres when severe haze occurs in Jing–Jin–Ji (Wang et al., 2015a; Zhong et al., 2017), it may be concluded that the whole PBL and its near upper atmosphere were cooled by aerosols to a varying extent during the different stages of this haze process. The warming effects of aerosols above 750–850 hPa were very weak, and the temperature differences among different days were also small. However, the cooling effects of aerosols varied the most between different days from the surface to 975 hPa. For instance, surface daytime cooling was about 2.2 K on 19 December, 1.5 K on 18 and 20 December, 1 K on 17 December, and 0.5–0.6 K on 15–16 December. This cooling effect of aerosols decreased rapidly with height. The difference in the cooling rate between the surface and 850 hPa was 1.8 K on 19 December, 1.3 K on 18 and 20 December, 1 K on 17 December, and 0.3–0.4 K on 15 and 16 December. The difference in the cooling rate owing to aerosols between the surface and the upper PBL was much larger during the explosive growth stage than the climbing stage. This may have resulted in the further intensification of the temperature inversion layer that already existed during the haze event, which will be discussed in the following section.
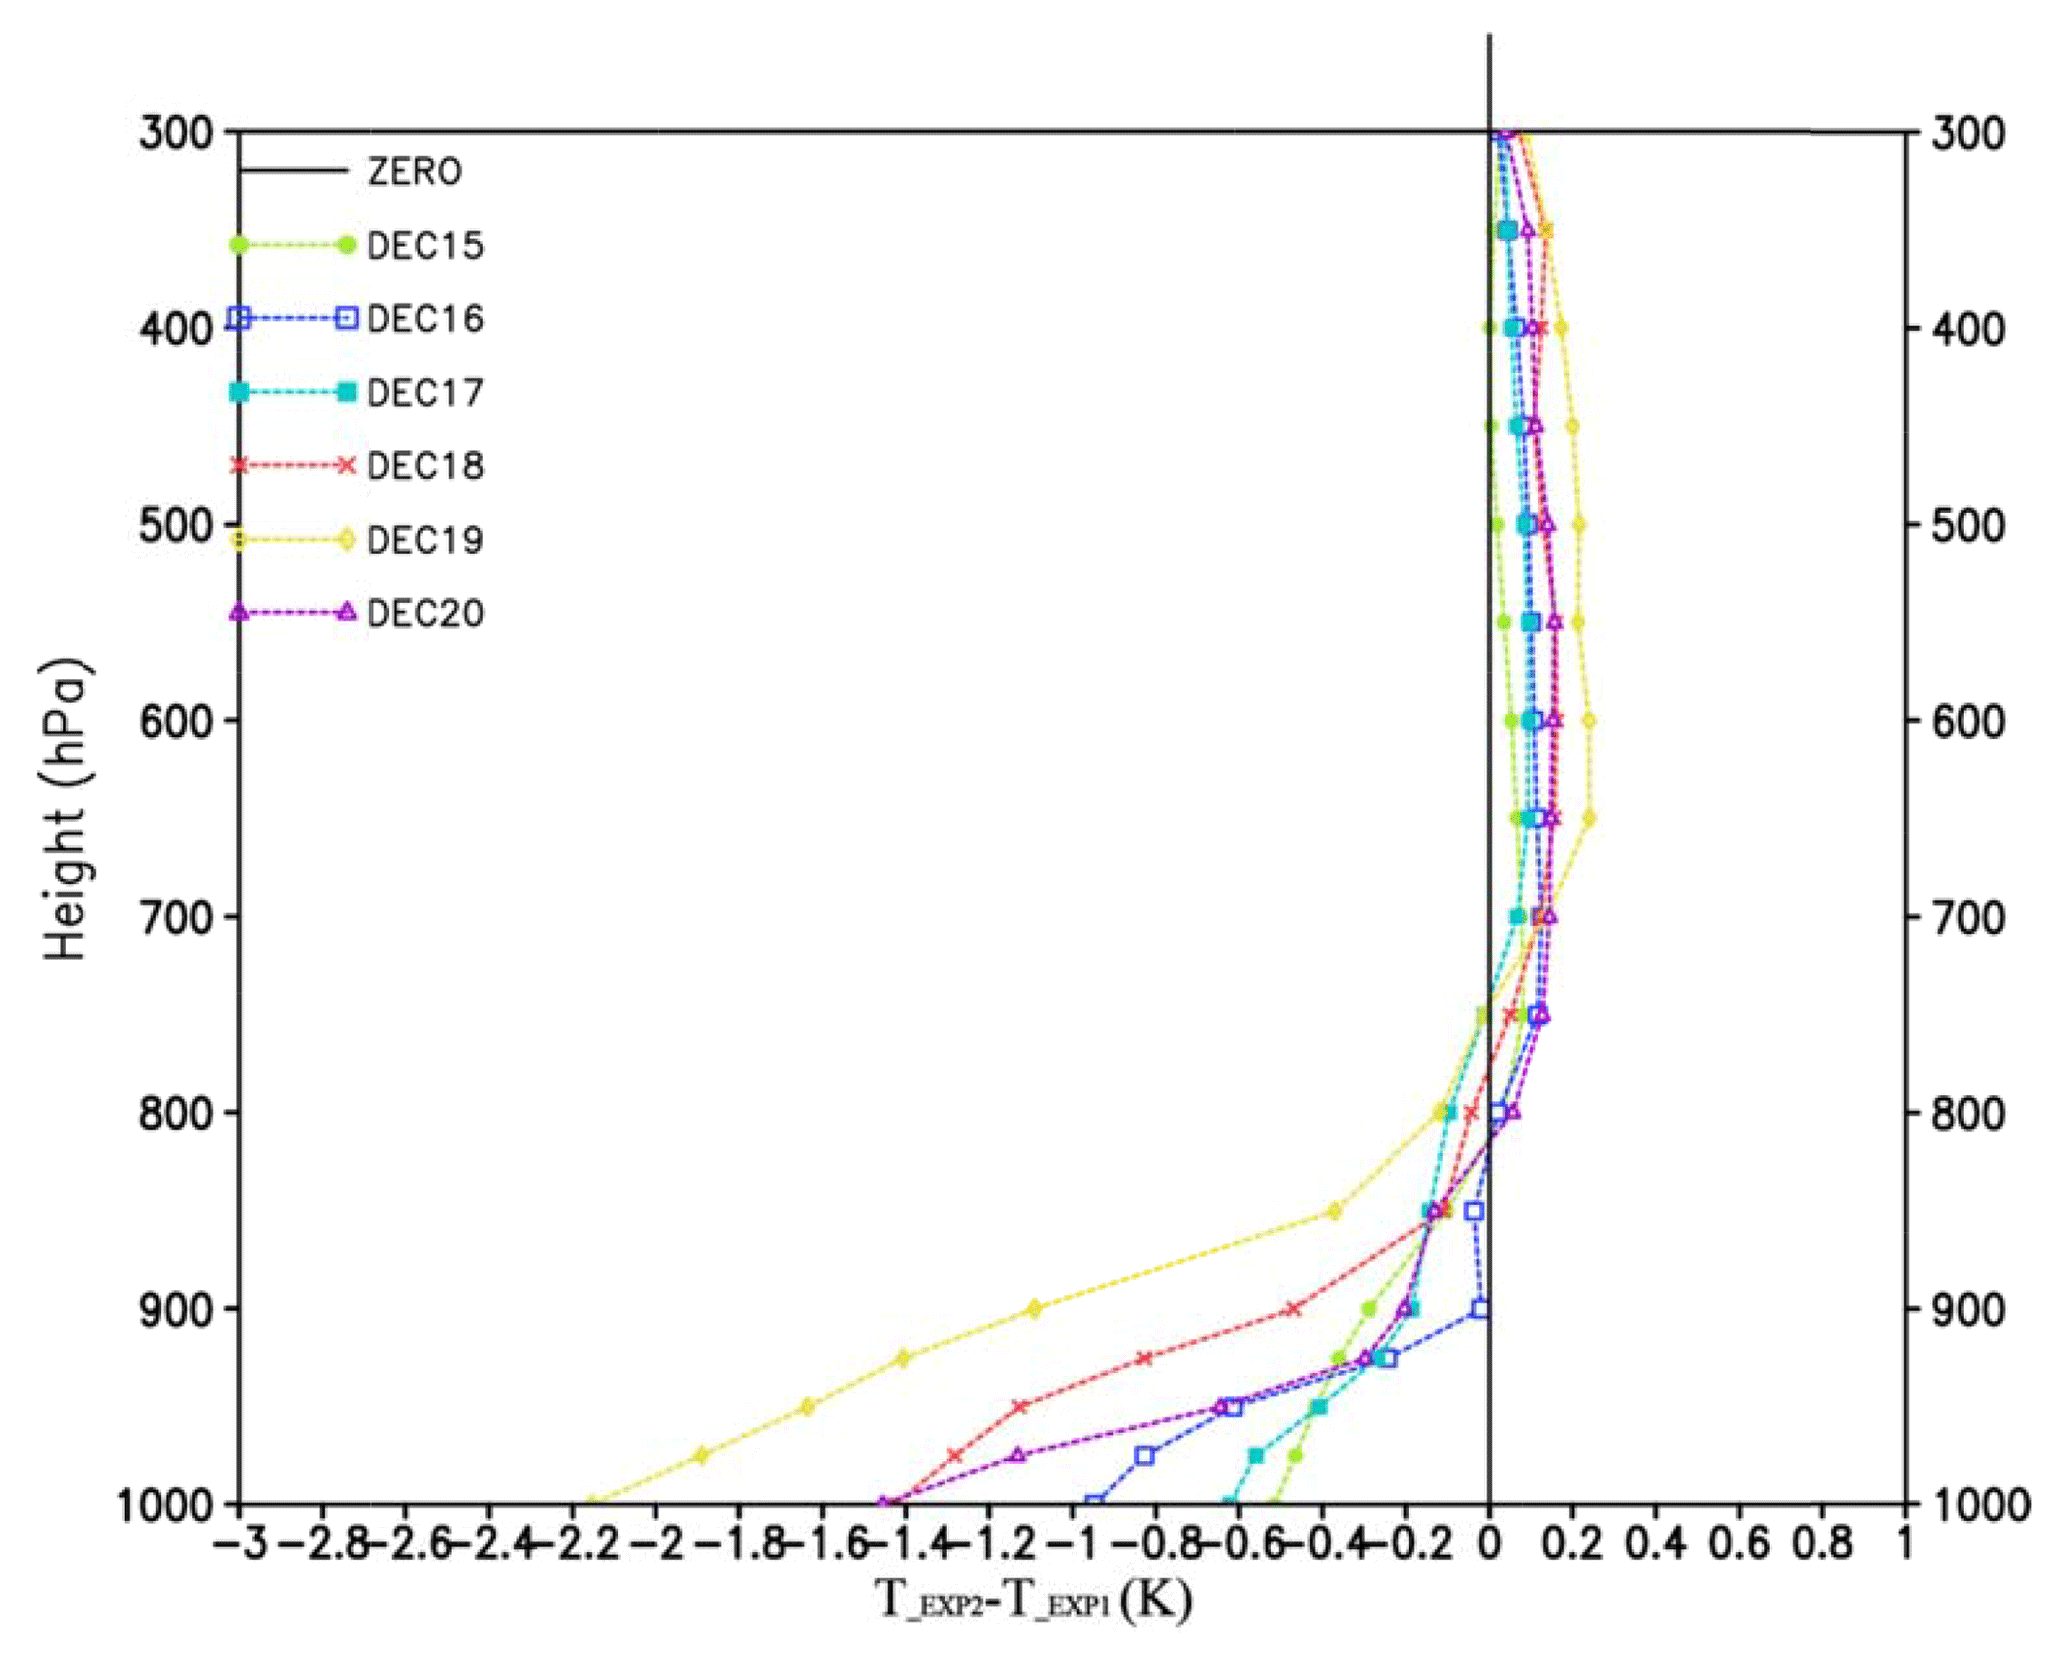
Figure 6Profiles of average temperature change in Jing–Jin–Ji owing to the AF (K) during the 15–20 December 2016 period.
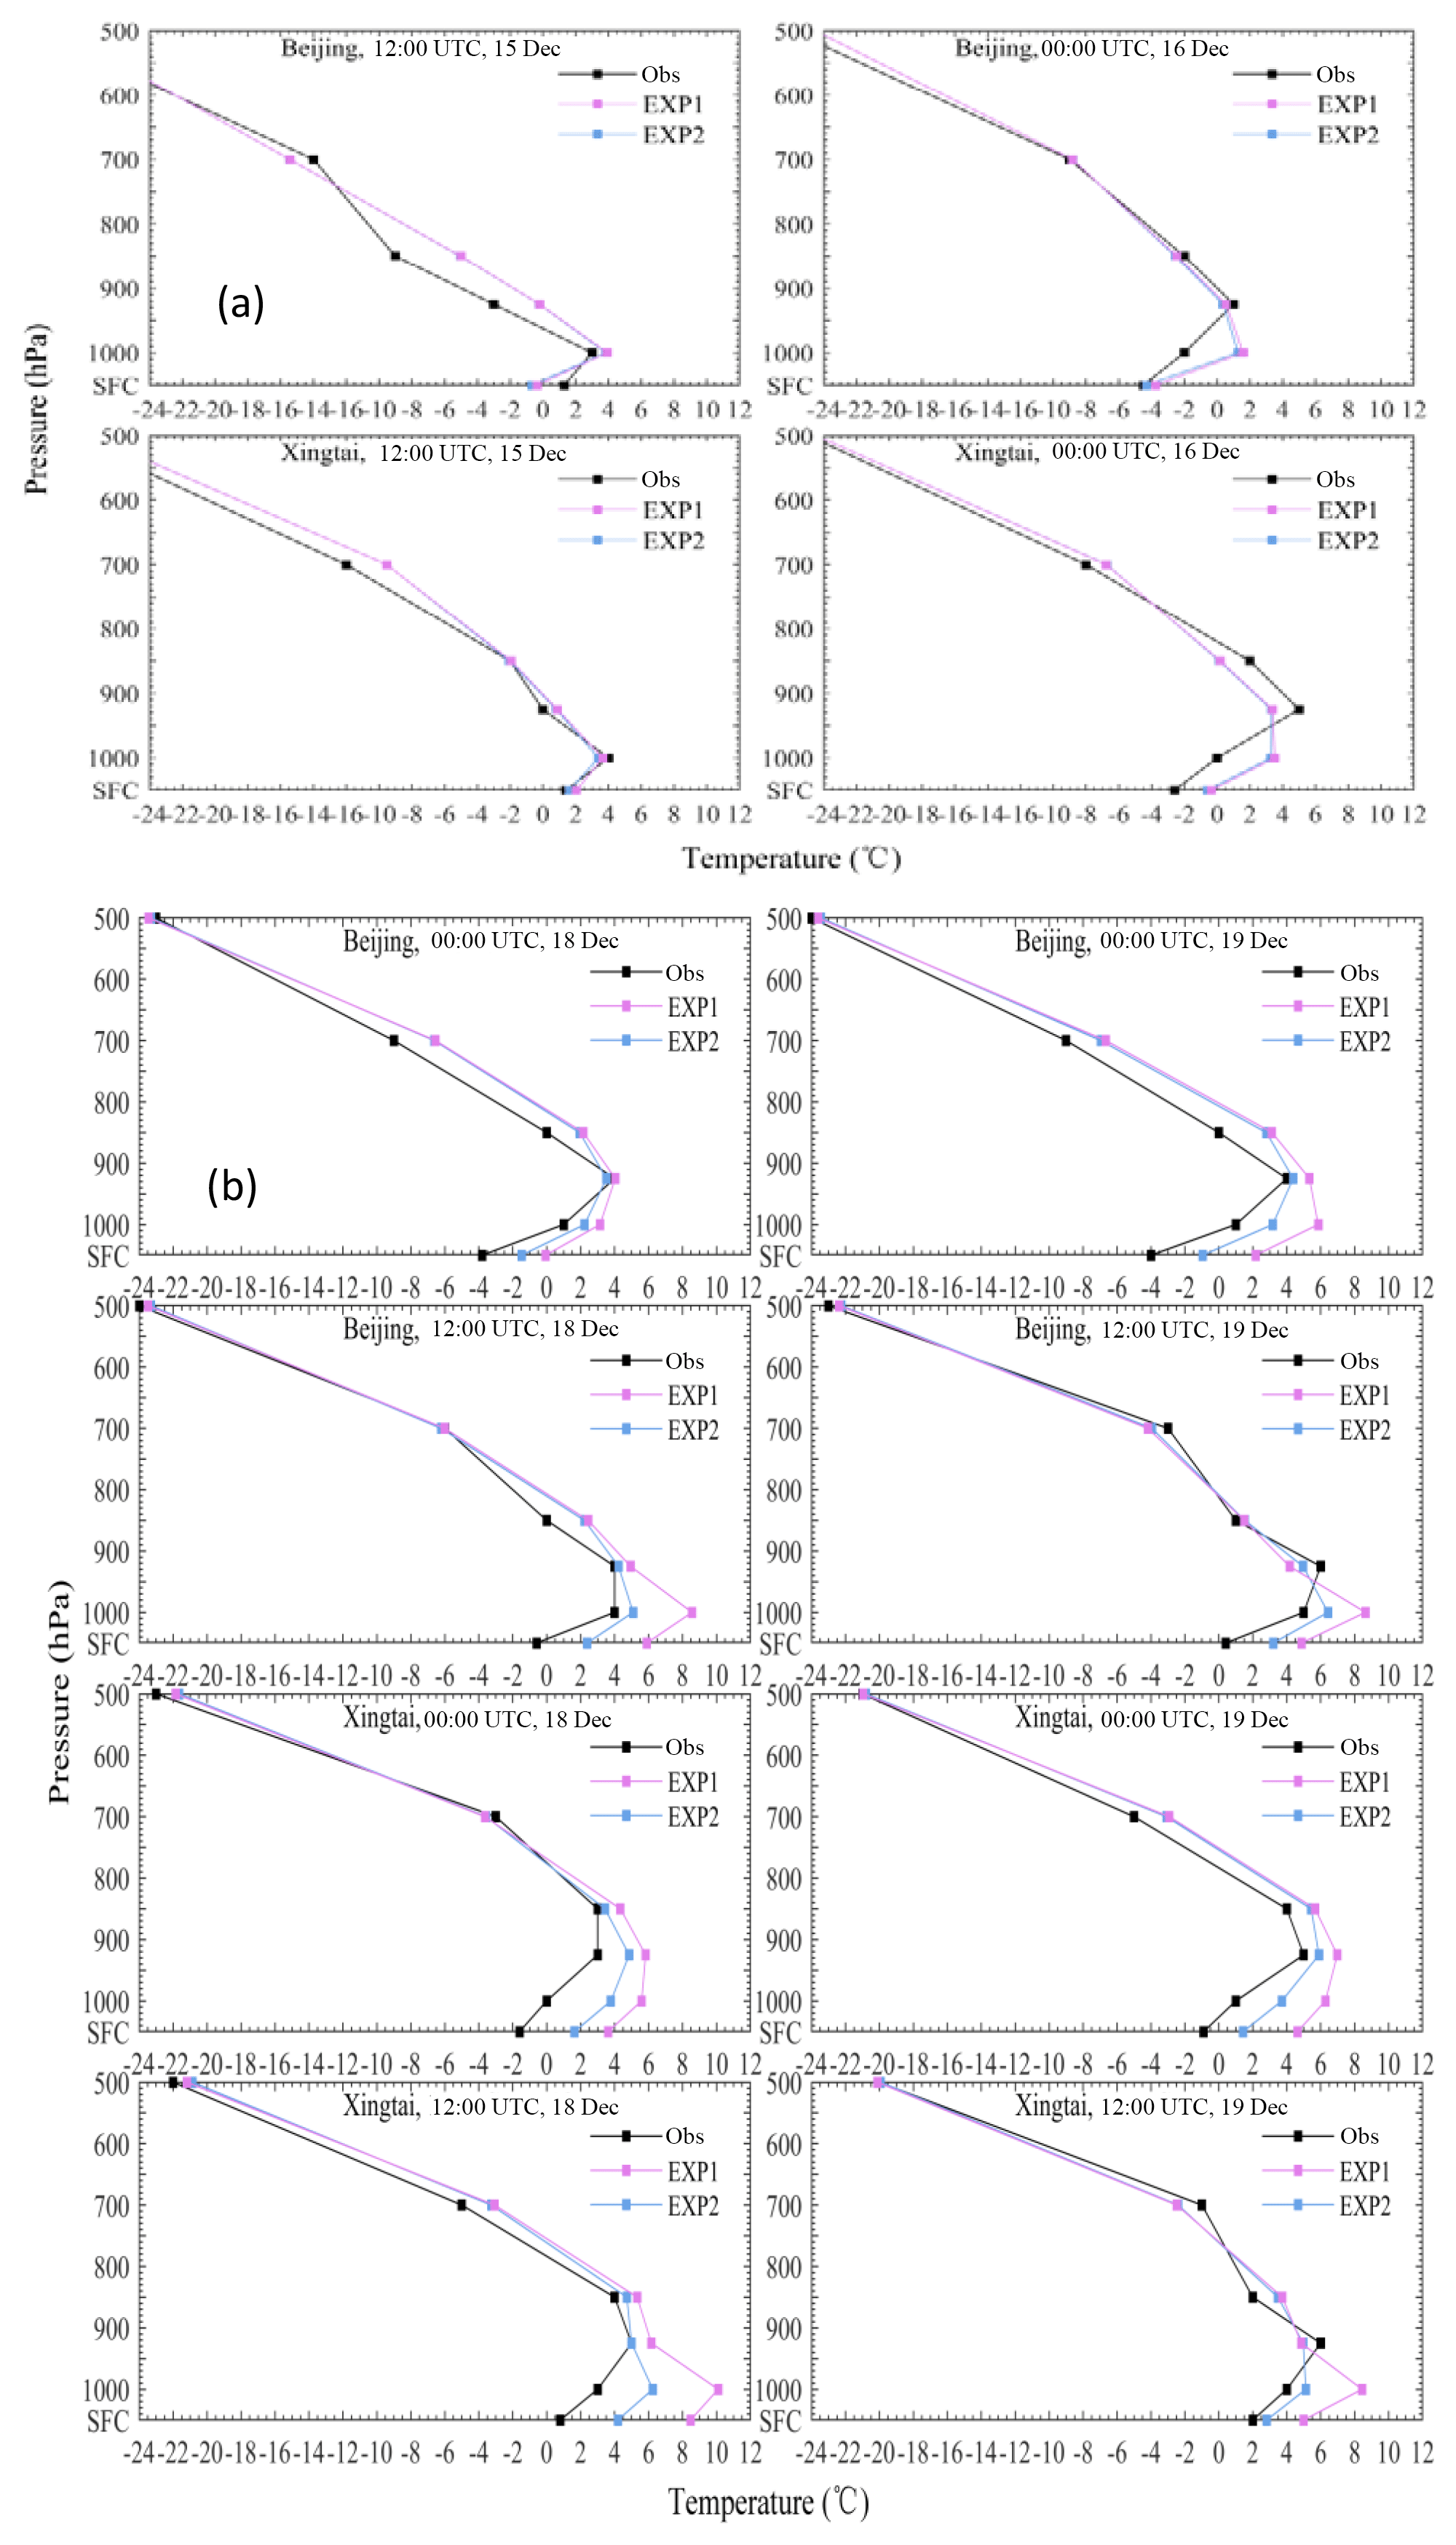
Figure 7Sounding-observed and modelled temperature profiles in EXP1 and EXP2 during the (a) climbing stage and (b) explosive growth stage in Beijing and Xingtai.
The meteorological data from the vertical soundings taken at Beijing and Xingtai were used to verify this change in the temperature profile owing to aerosols. Figure 7 shows the vertical temperature profiles of the sounding observations and the modelled temperature profiles of EXP1 and EXP2 during the climbing stage (Fig. 7a) and the explosive growth stage (Fig. 7b) at the two stations. The temperature profiles (Fig. 7a) show that the model results of EXP1 and EXP2 both, in part, simulated the observed temperature inversion at Beijing and Xingtai from 15 to 16 December. The negligible difference between the temperature profiles of EXP1 and EXP2 indicates that aerosol radiation had very little impact on the temperature profiles and local inversion during the climbing stage. Nevertheless, Fig. 7b shows that the observed temperature inversions were obviously stronger and thicker from 18 to 19 December (explosive growth stage) than those from 15 to 16 December (climbing stage), both in Xingtai and Beijing. The temperate profiles of EXP2 were much closer to the observational results than those of EXP1; specifically, the temperature inversions were much stronger and also closer to observation than those of EXP1. This result proves that the correction of local inversions by aerosols during the PM2.5 explosive growth stage was effective.
However, it can also be seen that the inversions of EXP2, which included online AF, were still weaker than the observed values at the two stations. This suggests that there must be other reasons, besides the online calculation of the AF, for the underestimation of the observed extremely strong inversion by the model, which is worthy of further study.
3.5 Contributions of the AF and the decrease in the turbulent diffusion coefficient to PM2.5 explosive growth
Turbulent diffusion is the main process of gas and particle exchange from the surface to the upper atmosphere, and removal by high-altitude transport; one of the key tasks of atmospheric chemistry models is to capture this process. Firstly, the inversion and weak turbulent diffusion, which generates from atmospheric dynamic processes, leads to atmospheric stabilisation and determines the occurrence of haze and its strength (Zheng et al., 2016). Once the haze occurs, aerosol radiation may in turn reinforce the inversion when aerosols exceed a certain critical value, leading to more PM2.5 gathering near the ground. The relative importance of these two aspects on PM2.5 explosive growth may vary with PM2.5 concentrations and meteorological conditions, but they are vital for a reasonable prediction and simulation of PM2.5 explosive growth and peaks in atmospheric models.
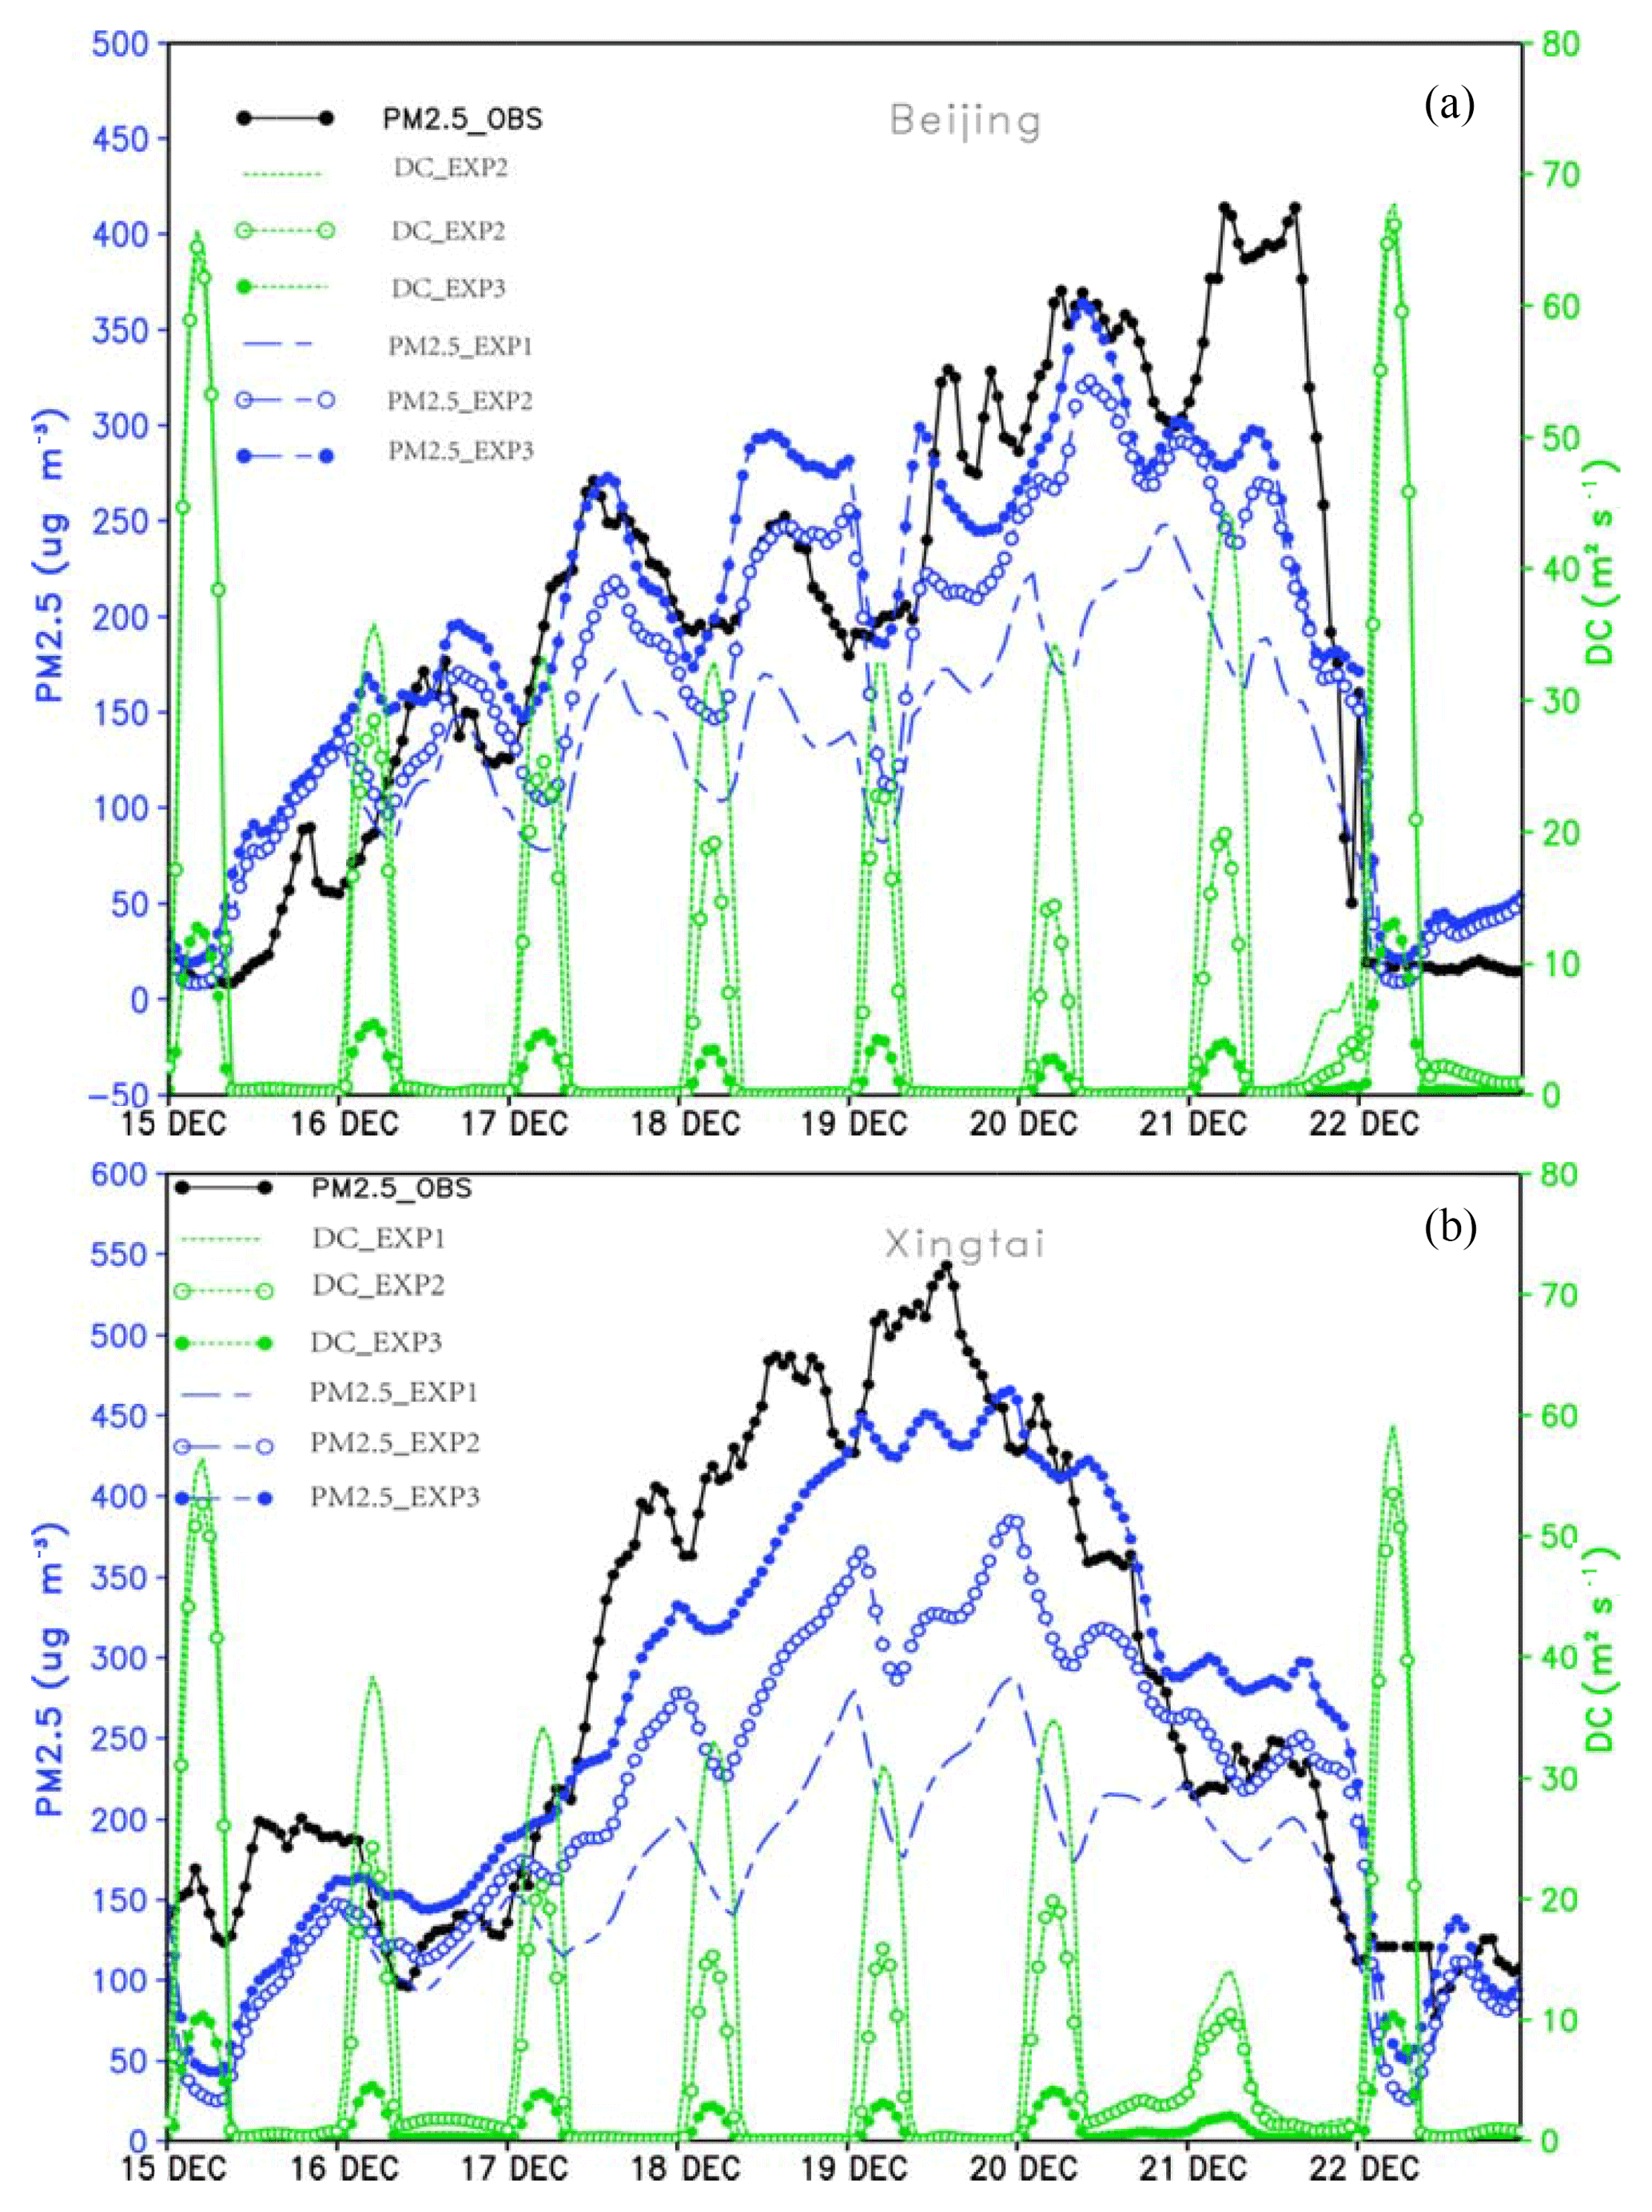
Figure 8Hourly change of PM2.5_OBS, PM2.5_EXP1, PM2.5_EXP2, and PM2.5_EXP3 (µg m−3), in addition to the diffusion coefficient (DC) at 950 hPa of the three experiments (DC_EXP1, DC_EXP2, and DC_EXP3) during the 15–22 December 2016 period in (a) Beijing and (b) Xingtai.
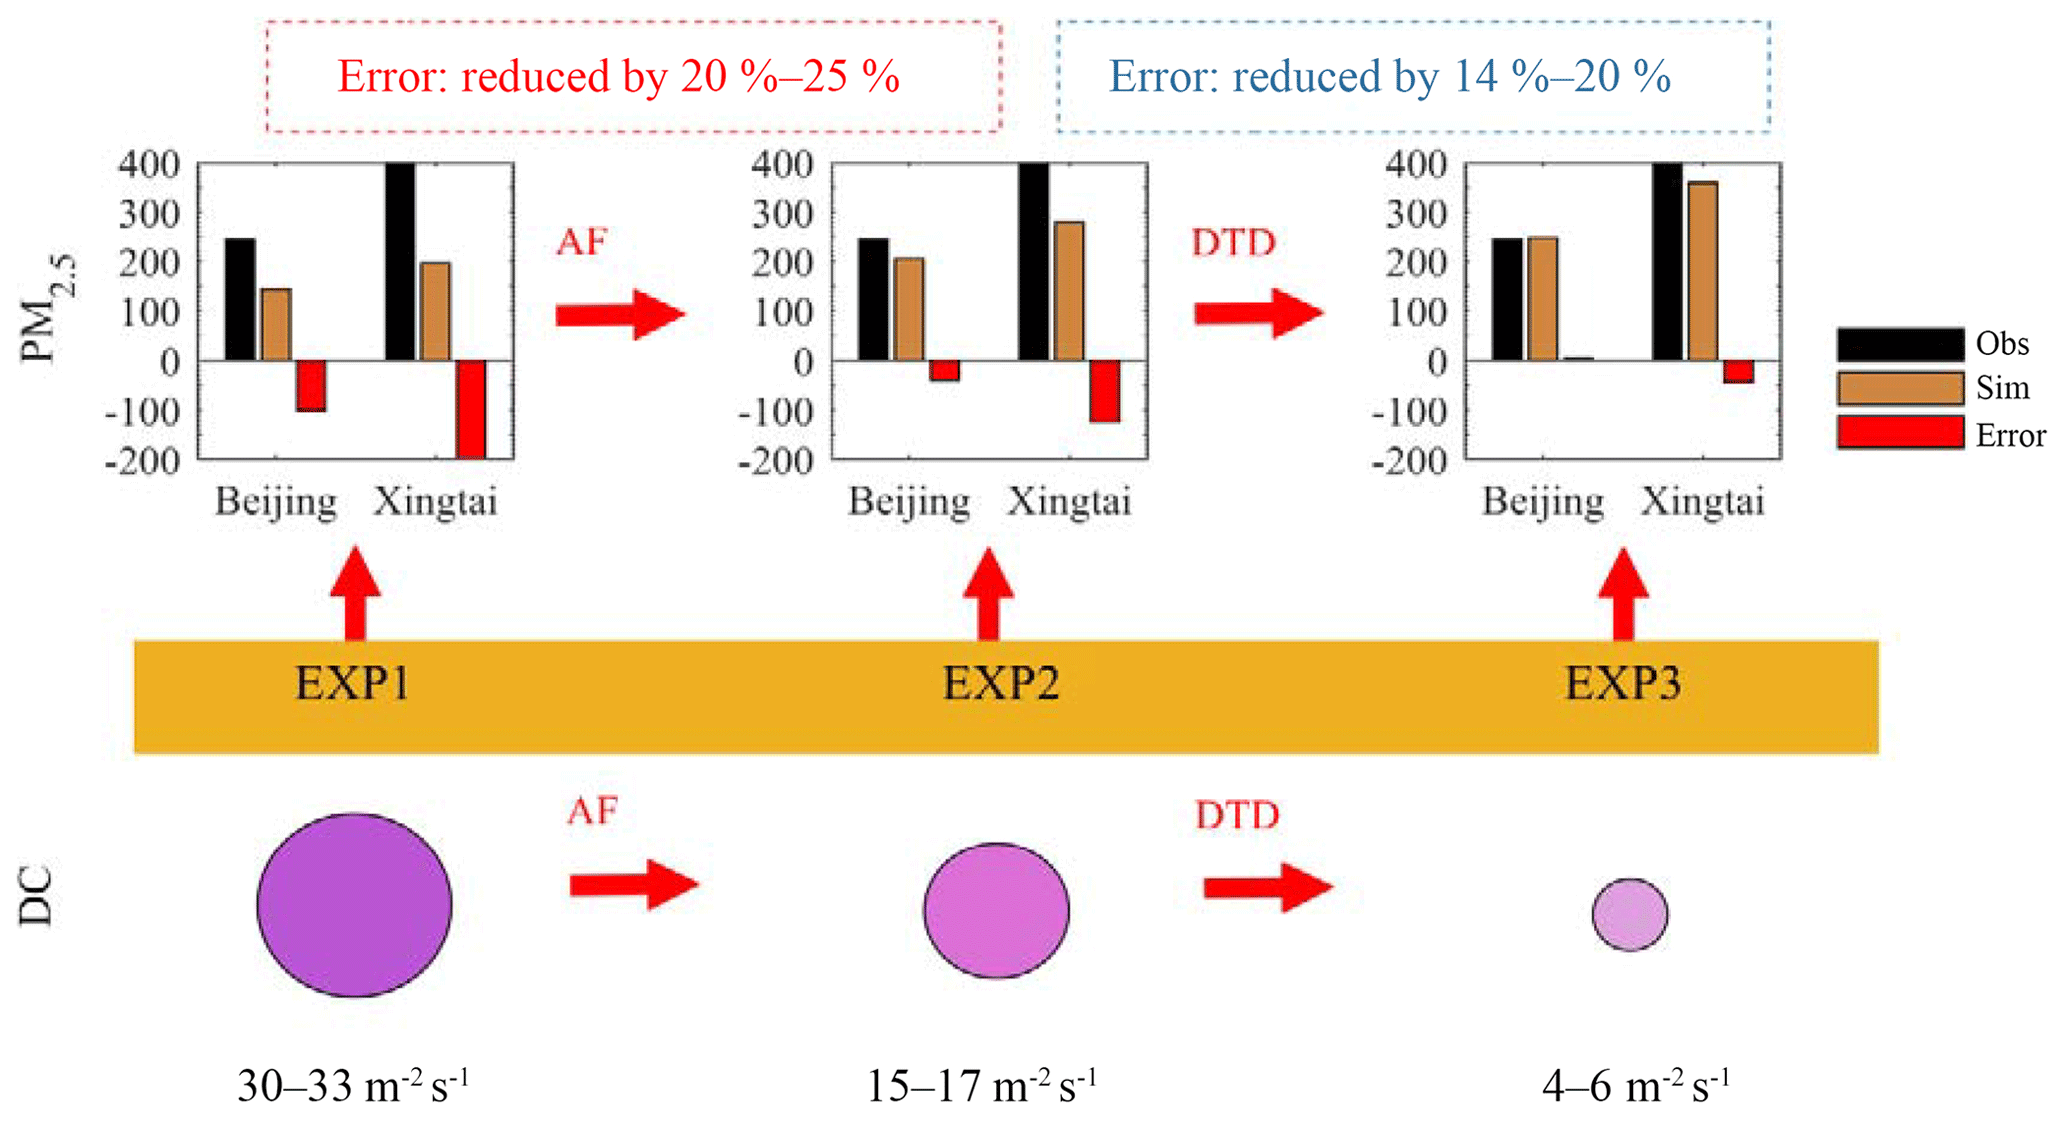
Figure 9Diagrammatic sketch of the contributions of the AF and the decrease in the turbulent diffusion coefficient (DTD) to the PM2.5 explosive growth.
Figure 8 displays the hourly change in observed PM2.5 (PM2.5_OBS) and the modelled PM2.5 of EXP1, EXP2, and EXP3, along with the modelled turbulent diffusion coefficient (DC) of the three experiments (DC_EXP1, DC_EXP2, and DC_EXP3), in Beijing (Fig. 8a) and Xingtai (Fig. 8b), for the period from 15 to 23 December. Comparison of the PM2.5 modelled by EXP1, EXP2, and EXP3 with observations in Beijing (Fig. 8a) shows that the PM2.5 modelled by EXP3 was the closest to the observations during the whole haze episode, which agreed with the results of the regional distribution of the explosive growth stage illustrated in Fig. 4. EXP1 notably underestimated the PM2.5 during the 17–22 December period, and this underestimation was even more obvious with increasing PM2.5. This difference between the modelled and observed PM2.5 was largest during the explosive growth stage. The AF reduced this difference to a considerable extent, and the PM2.5 of EXP2 was much closer to observations than the PM2.5 of EXP1 during the explosive growth stage. However, there were certain differences between the observed PM2.5 and that modelled by EXP2, illustrating that the AF cannot completely fill the sizeable gap between observed and modelled PM2.5 values. The PM2.5 of EXP3 reduced this gap further, showing the best agreement with observations, especially during the PM2.5 explosive growth stage.
It can also be seen from Fig. 8a that the diffusion coefficient of EXP1 was about 30–40 m−2 s−1 during the explosive growth stage, which was about 50 % of the 60–70 m−2 s−1 on clear days (15 or 22 December). Obviously, this 50 % diffusion coefficient difference between clear and severe haze days may be insufficient to separate the difference in turbulent diffusion intensity between the extremely stable atmosphere on haze days and the unstable atmosphere on clear days, which is an important reason for the underestimated PM2.5 explosive growth in EXP1. Compared with EXP1, the AF in EXP2 led to a notable enhancement of the temperature inversion (Fig. 7b), a significant decrease in the turbulent diffusion of PM2.5 during the explosive growth stage, and a low maximum diffusion coefficient at noon (as low as 14 m−2 s−1 on 20 December – a reduction of 50 % compared with EXP1). The maximum diffusion coefficient at noon on haze days in EXP2 was only about 20 % of that on clear days. The maximum diffusion coefficient at noon in EXP3 was lower than 5 m−2 s−1 on 20 December and, at the same time, the PM2.5 modelled by EXP3 was further increased and was also much closer to the observed PM2.5 than the PM2.5 of EXP2.
Through comparison of the temporal change of the diffusion coefficient and PM2.5 in EXP1, EXP2, and EXP3 in Beijing, it is clear that an overestimation of the turbulent diffusion coefficient owing to the absence of online-calculated AF, as well as a deficient description of extremely stable stratification in the PBL scheme of the atmospheric model, can lead to a distinct underestimation of PM2.5 explosive growth and peaks when severe haze occurs in China's Jing–Jin–Ji region.
The trends of change in the diffusion coefficient and PM2.5 at Xingtai in the three experiments (Fig. 8b) are similar to those at Beijing. The PM2.5 of EXP3 was also the closest to observations, followed by EXP2, whilst EXP1 was the worst, during the whole haze episode. However, during the explosive growth stage, the relative contributions of the AF and the decrease in the turbulent diffusion coefficient to the PM2.5 peak values showed some differences to those at Beijing. The contributions of the decrease in turbulent diffusion coefficient to PM2.5 peaks were more important than those of the AF at Xingtai. Located in the eastern foothills of the Taihang Mountains, Xingtai is usually affected by downhill airflow. Temperature inversions in this area form and strengthen easily, leading to stronger inversion, weaker turbulent diffusion, and more stable atmospheric stratification. However, this kind of inversion and weak turbulent diffusion, derived from the local terrain, is harder for PBL schemes in atmospheric chemistry models to describe, and is likely underestimated.
Figure 9 is a diagrammatic sketch of the contributions of AF and the decrease in the turbulent diffusion coefficient to the PM2.5 of the explosive growth stage according to the results at Beijing and Xingtai. It can be seen that the diffusion coefficient of EXP1 was 30–33 m−2 s−1, while that of EXP2 was 15–17 m−2 s−1; this meant that the AF reduced the diffusion coefficient by about 43 %–57 %, which led to the rise in simulated PM2.5 from 144 µg m−3 in EXP1 to 205 µg m−3 in EXP2 at Beijing, and from 280 µg m−3 in EXP1 to 360 µg m−3 in EXP2 at Xingtai. Therefore, AF reduced the underestimation of PM2.5 at Beijing and Xingtai by 20 % and 25 %, respectively. The diffusion coefficient of EXP3 was as low as 4–6 m−2 s−1 during the explosive growth stage, demonstrating that the joint effects of AF and the decrease in the turbulent diffusion coefficient reduced the diffusion coefficient to less than 4–6 m−2 s−1, near-zero, which we refer to as “turbulent intermittence”. The direct result of this “turbulent intermittence” was a further increase in the simulated surface PM2.5, Based on EXP2, the further decrease in turbulent diffusion coefficient reduced the underestimation of simulated PM2.5 by 14 % to 20 %, and the PM2.5 errors in EXP3 were reduced to as low as −11 % to 2 %.
Using an atmospheric chemistry model, GRAPES_CUACE, three experiments (EXP1, EXP2, and EXP3) were designed to study the reason for the explosive growth of PM2.5 mass during a “red alert” heavy haze event that occurred from 15 to 23 December 2016 in China's Jing–Jin–Ji region. The contributions of AF and the decrease in the turbulent diffusion coefficient to the PM2.5, representing a compensation for the deficient description of extremely weak turbulent diffusion in the PBL scheme of the atmospheric model, were studied by analysing the changes in PM2.5, the SDSRF, the wind speed and temperature, the diffusion coefficient, and the relationships among them, in the three experiments.
Results show that the diffusion coefficient in EXP1 was about 60–70 m−2 s−1 on clear days and 30–33 m−2 s−1 on haze days. The 50 % difference between the two was considered insufficient to separate the unstable atmosphere on clear days and the extremely stable atmosphere on severe haze days, compared with the differences in the direct downward solar radiation between clear and haze days, which was also proven indirectly by the weaker inversion of EXP1 than that from sounding observations. This led to a 40 %–51 % underestimation of the PM2.5 peaks in EXP1 during the PM2.5 explosive growth stage. Online calculation of the AF reduced the surface and the PBL wind speed and cooled the surface and the PBL atmosphere. The surface daytime cooling due to aerosol radiation was 1.5–2.2 K during the explosive growth stage and 0.5–0.6 K during the climbing stage. The cooling effect of aerosols decreased rapidly with height, and this was a major reason for the strengthening of the temperature inversion during the explosive growth stage. The reduced diffusion coefficient owing to the AF reached 43 %–57 % during the PM2.5 explosive growth stage. The local inversion simulated in EXP2 was strengthened and was closer to the actual sounding observation than that of EXP1. This resulted in a 20 %–25 % reduction in the underestimation of PM2.5, with PM2.5 errors in EXP2 being as low as −16 % to −11 % during the explosive growth stage. The impact on PM2.5 owing to AF in the model run was distinct during the explosive growth stage, but minor during the climbing stage; this indicated a critical value of 150 µg m−3 of PM2.5 leading to an effective AF in online atmospheric chemistry models. However, the local inversion simulated by EXP2 was still weaker than the observed inversion, and the PM2.5 of EXP2 was still smaller than observed values, illustrating that the AF could not solve all of the PM2.5 underestimation problems. In EXP3, the decrease in the turbulent diffusion coefficient of particles and gas based on EXP2 resulted in a 14 %–20 % decrease of the PM2.5 underestimation based on EXP2, and the PM2.5 errors of EXP3 were reduced to −11 % to 2 %.
The present study illustrates that the PBL schemes in current atmospheric chemistry models are probably insufficient for describing the extremely stable atmosphere that results in the explosive growth of PM2.5 and severe haze in China's Jing–Jin–Ji region. This may involve two important reasons: the absence of an online calculation of AF, and/or a deficient description of extremely weak turbulent diffusion by the PBL scheme in the atmospheric chemistry model. Our study suggests that an online calculation of AF and an improvement in the representation of turbulent diffusion in PBL schemes, with a focus on extremely stable atmospheric stratification, in atmospheric chemistry models, are indispensable for a reasonable description of local “turbulent intermittence” and an accurate prediction of the explosive growth and peaks of PM2.5 of severe haze in China's Jing–Jin–Ji region.
Please contact wangh@cma.gov.cn regarding data availability.
HW and XZ designed the idea and experiments, and HW and YP carried them out. HL prepared the emissions data and introduction, MZ performed some of the model runs, HC and YZ processed the AOD and SSA observational data, and YC completed Table 3 and the related introduction.
The authors declare that they have no conflict of interest.
This study was supported by the National Key Project
(grant no. 2016YFC0203306), the National Natural Science Foundation of
China (grant no. 41590874), and the National (Key) Basic Research and Development (973)
Program of China (grant no. 2014CB441201).
Edited by:
Veli-Matti Kerminen
Reviewed by: three anonymous referees
Basu, S., Iyengar, G. R., and Mitra, A. K.: Impact of a nonlocal closure scheme in a simulation of a monsoon system over India, Mon. Weather Rev., 130, 161–170, 2002.
Bright, D. R. and Mullen, S. L.: The sensitivity of the numerical simulation of the southwest monsoon boundary layer to the choice of PBL turbulence parameterization in MM5, Weather Forecast., 17, 99–114, 2002.
Caplan, P., Derber, J., Gemmill, W., Hong, S.-Y., Pan, H.-L., and Parrish, D.: Changes to the 1995 NCEP operational medium-range forecast model analysis-forecast system, Weather Forecast., 12, 581–594, 1997.
Che, H., Zhang, X., Chen, H., Damiri, B., Goloub, P., Li, Z., Zhang, X., Wei, Y., Zhou, H., Dong, F., Li, D., and Zhou, T.: Instrument calibration and aerosol optical depth validation of the China Aerosol Remote Sensing Network, J. Geophys. Res.-Atmos., 114, D03206, https://doi.org/10.1029/2008JD011030, 2009.
Che, H., Xia, X., Zhu, J., Li, Z., Dubovik, O., Holben, B., Goloub, P., Chen, H., Estelles, V., Cuevas-Agulló, E., Blarel, L., Wang, H., Zhao, H., Zhang, X., Wang, Y., Sun, J., Tao, R., Zhang, X., and Shi, G.: Column aerosol optical properties and aerosol radiative forcing during a serious haze-fog month over North China Plain in 2013 based on ground-based sunphotometer measurements, Atmos. Chem. Phys., 14, 2125–2138, https://doi.org/10.5194/acp-14-2125-2014, 2014.
Che, H., Zhang, X.-Y., Xia, X., Goloub, P., Holben, B., Zhao, H., Wang, Y., Zhang, X.-C., Wang, H., Blarel, L., Damiri, B., Zhang, R., Deng, X., Ma, Y., Wang, T., Geng, F., Qi, B., Zhu, J., Yu, J., Chen, Q., and Shi, G.: Ground-based aerosol climatology of China: aerosol optical depths from the China Aerosol Remote Sensing Network (CARSNET) 2002–2013, Atmos. Chem. Phys., 15, 7619–7652, https://doi.org/10.5194/acp-15-7619-2015, 2015.
Chen, D., Xue, J., Yang, X., Zhang, H., Shen, X., Hu, J., Wang, Y., Ji, L., and Chen, J.: New generation of multi-scale NWP system (GRAPES): general scientific design, Chinese Sci. Bull., 53, 3433–3445, https://doi.org/10.1007/s11434-008-0494-z, 2008.
Chou, M. D., Suarez, M. J., Ho, C. H., Yan, M. M. H., and Lee, K. T.: Parameterizations for Cloud Overlapping and Shortwave Single-Scattering Properties for Use in General Circulation and Cloud Ensemble Models, J. Climate, 11, 202–214, 1998.
Chou, M. D., Suarez, M. J., Liang, X. Z., and Michael M.-H. Y.: A Thermal Infrared Radiation Parameterization for Atmospheric Studies, Technical Report Series on Global Modeling and Data Assimilation, NASA/TM-2001-104606, 19, America, Goddard Space Flight Center, Greenbelt, Maryland, 55, 2001.
Ding, A. J., Fu, C. B., Yang, X. Q., Sun, J. N., Petäjä, T., Kerminen, V.-M., Wang, T., Xie, Y., Herrmann, E., Zheng, L. F., Nie, W., Liu, Q., Wei, X. L., and Kulmala, M.: Intense atmospheric pollution modifies weather: a case of mixed biomass burning with fossil fuel combustion pollution in eastern China, Atmos. Chem. Phys., 13, 10545–10554, https://doi.org/10.5194/acp-13-10545-2013, 2013.
Ding, A. J., Huang, X., Nie, W., Sun, J. N., Kerminen, V. M., Petäjä, T., Su, H., Cheng, Y. F., Yang, X. Q., Wang, M. H., Chi, X. G., Wang, J. P., Virkkula, A., Guo, W. D., Yuan, J., Wang, S. Y., Zhang, R. J., Wu, Y. F., Song, Y., Zhu, T., Zilitinkevich, S., Kulmala, M., and Fu, C. B.: Enhanced haze pollution by black carbon in megacities in China, Geophys. Res. Lett., 43, 2873–2879, 2016.
Farfán, L. M. and Zehnder, J. A.: An analysis of the landfall of Hurricane Nora (1997), Mon. Weather Rev., 129, 2073–2088, 2001.
Forkel, R., Werhahn, J., Hansen, A. B., McKeen, S., Peckham, S., Grell, G., and Suppan, P.: Effect of aerosol-radiation feedback on regional air quality – A case study with WRF/Chem, Atmos. Environ., 53, 202–211, 2012.
Fountoukis, C. and Nenes, A.: ISORROPIA II: a computationally efficient thermodynamic equilibrium model for K+-Ca2+-Mg2+--Na+---Cl−-H2O aerosols, Atmos. Chem. Phys., 7, 4639–4659, https://doi.org/10.5194/acp-7-4639-2007, 2007.
Gao, M., Carmichael, G. R., Saide, P. E., Lu, Z., Yu, M., Streets, D. G., and Wang, Z.: Response of winter fine particulate matter concentrations to emission and meteorology changes in North China, Atmos. Chem. Phys., 16, 11837–11851, https://doi.org/10.5194/acp-16-11837-2016, 2016.
Gao, M., Saide, P. E., Xin, J., Wang, Y., Liu, Z., Wang, Y., Wang, Z., Pagowski, M., Guttikunda, S. K., and Carmichael, G. R.: Estimates of Health Impacts and Radiative Forcing in Winter Haze in Eastern China through Constraints of Surface PM2.5 Predictions, Environ. Sci. Technol., 51, 2178–2185, 2017.
Gao, Y., Zhao, C., Liu, X., Zhang, M., and Leung, L. R.: WRF-Chem simulations of aerosols and anthropogenic aerosol radiative forcing in East Asia, Atmos. Environ., 92, 250–266, 2014.
Gao, Y., Zhang, M., Liu, Z., Wang, L., Wang, P., Xia, X., Tao, M., and Zhu, L.: Modeling the feedback between aerosol and meteorological variables in the atmospheric boundary layer during a severe fog-haze event over the North China Plain, Atmos. Chem. Phys., 15, 4279–4295, https://doi.org/10.5194/acp-15-4279-2015, 2015.
Gong, S. and Zhang, X.: CUACE/Dust-an integrated system for operational dust forecasting in Asia, Comput. Appl. Chem., 25, 1061–1067, 2008.
He, K.: Multi-resolution Emission Inventory for China (MEIC): model framework and 1990–2010 anthropogenic emissions, AGU Fall Meeting, AGU Fall Meeting Abstracts, 2012.
Holben, B. N., Eck. T. F., Slutsker, I., Tanré, D., Buis, J. P., and Setzer, A: AERONET-A Federated Instrument Network and Data Archive for Aerosol Characterization, Remote Sens. Environ., 66, 1–16, 1998.
Hong, S. Y. and Pan, H. L.: Nonlocal boundary layer vertical diffusion in a Medium-Range Forecast model, Mon. Weather Rev., 124, 2322–2339, 1996.
Hong, S. Y., Noh, Y., and Dudhia, J.: A New Vertical Diffusion Package with an Explicit Treatment of Entrainment Processes, Mon. Weather Rev., 134, 2318–2341, 2006.
Hu, X. M., Doughty, D. C., Sanchez, K. J., Joseph, E., and Fuentes, J. D.: Ozone variability in the atmospheric boundary layer in Maryland and its implications for vertical transport model, Atmos. Environ., 46, 354–364, 2012.
Hu, X. M., Klein, P. M., and Xue, M.: Evaluation of the updated YSU planetary boundary layer scheme within WRF for wind resource and air quality assessments, J. Geophys. Res.-Atmos., 118, 10490–10505, 2013a.
Hu, X. M., Klein, P. M., Xue, M., Zhang, F., Doughty, D. C., Forkel, R., Joseph, E., and Fuentes, J. D.: Impact of the vertical mixing induced by low-level jets on boundary layer ozone concentration, Atmos. Environ., 70, 123–130, 2013b.
Hua, Y., Wang, S., Wang, J., Jiang, J., Zhang, T., Song, Y., Kang, L., Zhou, W., Cai, R., Wu, D., Fan, S., Wang, T., Tang, X., Wei, Q., Sun, F., and Xiao, Z.: Investigating the impact of regional transport on PM2.5 formation using vertical observation during APEC 2014 Summit in Beijing, Atmos. Chem. Phys., 16, 15451–15460, https://doi.org/10.5194/acp-16-15451-2016, 2016.
Huang, R. J., Zhang, Y., Bozzetti, C., Ho, K. F., Cao, J. J., Han, Y., Daellenbach, K. R., Slowik, J. G., Platt, S. M., Canonaco, F., Zotter, P., Wolf, R., Pieber, S. M., Bruns, E. A., Crippa, M., Ciarelli, G., Piazzalunga, A., Schwikowski, M., Abbaszade, G., Schnelle-Kreis, J., Zimmermann, R., An, Z., Szidat, S., Baltensperger, U., El Haddad, I., and Prevot, A. S.: High secondary aerosol contribution to particulate pollution during haze events in China, Nature, 514, 218–222, 2014.
Jiang, C., Wang, H., Zhao, T., Li, T., and Che, H.: Modeling study of PM2.5 pollutant transport across cities in China's Jing–Jin–Ji region during a severe haze episode in December 2013, Atmos. Chem. Phys., 15, 5803–5814, https://doi.org/10.5194/acp-15-5803-2015, 2015.
Kain, J. S. and Fritsch, J. M.: Convection parameterization for mesoscale models: the Kain-Fritsch scheme, Meteor. Mon., 24, 165–170, 1993.
Kusaka, H., Kondo, H., Kikegawa, Y., and Kimura, F.: A simple single-layer urban canopy model for atmospheric models: Comparison with multi-layer and slab models, Bound.-Layer Meteor., 101, 329–358, 2001.
Li, K., Liao, H., Zhu, J., and Moch, J. M.: Implications of RCP emissions on future PM2.5 air quality and direct radiative forcing over China, J. Geophys. Res.-Atmos., 121, 12985–13008, 2016.
Li, T., Wang, H., Zhao, T., Xue, M., Wang, Y., Che, H., and Jiang, C.: The Impacts of Different PBL Schemes on the Simulation of PM2.5 during Severe Haze Episodes in the Jing–Jin–Ji Region and Its Surroundings in China, Adv. Meteorol., 10, 1–15, 2016.
Lim, K. S. S. and Hong, S. Y.: Development of an effective double-moment cloud microphysics scheme with prognostic cloud condensation nuclei (CCN) for weather and climate models, Mon. Weather Rev., 138, 1587–1612, 2010.
Mass, C. F., Ovens, D., Westrick, K., and Colle, B. A.: Does increasing horizontal resolution proxduce more skilful forecasts?, B. Am. Meteorol. Soc., 83, 407–430, 2002.
Miao, Y., Liu, S., Zheng, Y., and Wang, S.: Modeling the feedback between aerosol and boundary layer processes: a case study in Beijing, China, Environ. Sci. Pollut R., 23, 3342–3357, 2016.
Petäjä, T., Järvi, L., Kerminen, V. M., Ding, A. J., Sun, J. N., Nie, W., Kujansuu, J., Virkkula, A., Yang, X. Q., Fu, C. B., Zilitinkevich, S., and Kulmala, M.: Enhanced air pollution via aerosol-boundary layer feedback in China, Sci. Rep., 6, 18998, https://doi.org/10.1038/srep18998, 2016.
Pleim, J.: A combined local and non-local closure model for the atmospheric boundary layer, Part II: Application and evaluation in a mesoscale meteorological model, J. Appl. Meteorol. Climatol., 46, 1396–1409, 2007.
Qiu, Y., Liao, H., Zhang, R., and Hu, J.: Simulated impacts of direct radiative effects of scattering and absorbing aerosols on surface layer aerosol concentrations in China during a heavily polluted event in February 2014, J. Geophys. Res.-Atmos., 122, 5955–5975, 2017.
Quan, J., Tie, X., Zhang, Q., Liu, Q., Li, X., Gao, Y., and Zhao, D.: Characteristics of heavy aerosol pollution during the 2012–2013 winter in Beijing, China, Atmos. Environ., 88, 83–89, 2014.
Stockwell, W. R., Middleton, P., Chang, J. S., and Tang, X.: The Second Generation Regional Acid Deposition Model Chemical Mechanism for Regional Air Quality Modeling, J. Geophys. Res., 95, 16343–16376, 1990.
Sun, Y., Jiang, Q., Wang, Z., Fu, P., Li, J., Yang, T., and Yin, Y.: Investigation of the sources and evolution processes of severe haze pollution in Beijing in January 2013, J. Geophys. Res.-Atmos., 119, 4380–4398, 2014.
Wang, H., Gong, S., Zhang, H., Chen, Y., Shen, X., Chen, D., Xue, J., Shen, Y., Wu, X., and Jin, Z.: A new-generation sand and dust storm forecasting system GRAPES_CUACE/Dust: Model development, verification and numerical simulation, Chinese Sci. Bull., 55, 635–649, 2009.
Wang, H., Zhang, X., Gong, S., Chen, Y., Shi, G., and Li, W.: Radiative feedback of dust aerosols on the East Asian dust storms, J. Geophys. Res., 115 , D23214, https://doi.org/10.1029/2009JD013430, 2010.
Wang, H., Tan, S. C., Wang, Y., Jiang, C., Shi, G. Y., Zhang, M. X., and Che, H. Z.: A multi sources observation study of the severe prolonged regional haze episode over eastern China in January 2013, Atmos. Environ., 89, 807–815, 2014a.
Wang, H., Xu, J., Zhang, M., Yang, Y., Shen, X., Wang, Y., Chen, D., and Guo, J.: A study of the meteorological causes of a prolonged and severe haze episode in January 2013 over central-eastern China, Atmos. Environ., 98, 146–157, 2014b.
Wang, H., Xue, M., Zhang, X. Y., Liu, H. L., Zhou, C. H., Tan, S. C., Che, H. Z., Chen, B., and Li, T.: Mesoscale modeling study of the interactions between aerosols and PBL meteorology during a haze episode in Jing–Jin–Ji (China) and its nearby surrounding region – Part 1: Aerosol distributions and meteorological features, Atmos. Chem. Phys., 15, 3257–3275, https://doi.org/10.5194/acp-15-3257-2015, 2015a.
Wang, H., Shi, G. Y., Zhang, X. Y., Gong, S. L., Tan, S. C., Chen, B., Che, H. Z., and Li, T.: Mesoscale modelling study of the interactions between aerosols and PBL meteorology during a haze episode in China Jing–Jin–Ji and its near surrounding region – Part 2: Aerosols' radiative feedback effects, Atmos. Chem. Phys., 15, 3277–3287, https://doi.org/10.5194/acp-15-3277-2015, 2015b.
Wang, J., Wang, S., Jiang, J., Ding, A., Zheng, M., Zhao, B., Wong, D. C., Zhou, W., Zheng, G., Wang, L., Pleim, J. E., and Hao, J.: Impact of aerosol–meteorology interactions on fine particle pollution during China's severe haze episode in January 2013, Environ. Res. Lett., 9, 094002, https://doi.org/10.1088/1748-9326/9/9/094002, 2014.
Wang, Y., Zhang, Q. Q., He, K., Zhang, Q., and Chai, L.: Sulfate-nitrate-ammonium aerosols over China: response to 2000–2015 emission changes of sulfur dioxide, nitrogen oxides, and ammonia, Atmos. Chem. Phys., 13, 2635–2652, https://doi.org/10.5194/acp-13-2635-2013, 2013.
Wang, Z., Li, J., Wang, Z., Yang, W., Tang, X., Ge, B., Yan, P., Zhu, L., Chen, X., Chen, H., Wand, W., Li, J., Liu, B., Wang, X., Wand, W., Zhao, Y., Lu, N., and Su, D.: Modeling study of regional severe hazes over mid-eastern China in January 2013 and its implications on pollution prevention and control, Sci. China Earth Sci., 57, 3–13, 2014.
Xu, G., Chen, D., Xue, J., Sun, J., Shen, X., Shen, Y., Huang, L., Wu, X., Zhang, H., and Wang, S.: The program structure designing and optimizing tests of GRAPES physics, Chinese Sci. Bull., 53, 3470–3476, https://doi.org/10.1007/s11434-008-0418-y, 2008.
Yang, X., Hu, J., Chen, D., Zhang, H., Shen, X., Chen, J., and Ji, L.: Verification of GRAPES uni?ed global and regional numerical weather prediction model dynamic core, Chinese Sci. Bull., 53, 3458–3464, https://doi.org/10.1007/s11434-008-0417-z, 2008.
Yang, X. S., Chen, J. B., and Hu, J. L.: A semi-implicit semi-Lagran global nonhydrostatic model and the polar discretization scheme, Sci. China Ser. D-Earth Sci., 50, 1885–1891, 2007.
Yang, Y. R., Liu, X. G., Qu, Y., An, J. L., Jiang, R., Zhang, Y. H., Sun, Y. L., Wu, Z. J., Zhang, F., Xu, W. Q., and Ma, Q. X.: Characteristics and formation mechanism of continuous hazes in China: a case study during the autumn of 2014 in the North China Plain, Atmos. Chem. Phys., 15, 8165–8178, https://doi.org/10.5194/acp-15-8165-2015, 2015.
Zhang, M., Wang, H., Zhang, X., Peng, Y., and Che, H.: Applying the WRF double-moment six-class microphysics scheme in the GRAPES_Meso model: A case study, J. Meteor. Res., 32, 246–264, https://doi.org/10.1007/s13351018-7066-1, 2018.
Zhang, R. and Shen, X.: On the development of the GRAPES – a new generation of the national operational NWP system in China, Chinese Sci. Bull., 53, 3429–3432, 2008.
Zhang, R. H., Li, Q., and Zhang, R. N.: Meteorological conditions for the persistent severe fog and haze event over eastern China in January 2013, Sci. China Earth Sci., 57, 26–35, 2014.
Zheng, G. J., Duan, F. K., Su, H., Ma, Y. L., Cheng, Y., Zheng, B., Zhang, Q., Huang, T., Kimoto, T., Chang, D., Pöschl, U., Cheng, Y. F., and He, K. B.: Exploring the severe winter haze in Beijing: the impact of synoptic weather, regional transport and heterogeneous reactions, Atmos. Chem. Phys., 15, 2969–2983, https://doi.org/10.5194/acp-15-2969-2015, 2015.
Zheng, G. J.,Duan, F. K., Ma, Y. L., Zhang, Q., Huang, T., Kimoto, T. K., Cheng, Y. F., Su, H., and He, K. B.: Episode-based evolution pattern analysis of haze pollution: method development and results from Beijing, China, Environ. Sci. Technol., 50, 4632–4641, 2016.
Zhong, J., Zhang, X., Wang, Y., Sun, J., Zhang, Y., Wang, J., Tan, K., Shen, X., Che, H., and Zhang, L.: Relative contributions of boundary-layer meteorological factors to the explosive growth of PM2.5 during the red-alert heavy pollution episodes in Beijing in December 2016, J. Meteorol. Res., 31, 809–819, 2017.
Zhong, J., Zhang, X., Dong, Y., Wang, Y., Liu, C., Wang, J., Zhang, Y., and Che, H.: Feedback effects of boundary-layer meteorological factors on cumulative explosive growth of PM2.5 during winter heavy pollution episodes in Beijing from 2013 to 2016, Atmos. Chem. Phys., 18, 247–258, https://doi.org/10.5194/acp-18-247-2018, 2018a.
Zhong, J., Zhang, X., Wang, Y., Liu, C., and Dong, Y.: Heavy aerosol pollution episodes in winter Beijing enhanced by radiative cooling effects of aerosols, Atmos. Res., 209, 59–64, 2018b.
Zhou, C., Gong, S., Zhang, X., Liu, H., Xue, M., Cao, G., An, X., Che, H., Zhang, Y., and Niu, T.: Towards the improvements of simulating the chemical and optical properties of Chinese aerosols using an online coupled model CUACE/Aero, Tellus B, 64, 18965, https://doi.org/10.3402/tellusb.v64i0.18965, 2012.
Zhou, C., Zhang, X., Gong, S., Wang, Y., and Xue, M.: Improving aerosol interaction with clouds and precipitation in a regional chemical weather modeling system, Atmos. Chem. Phys., 16, 145-160, https://doi.org/10.5194/acp-16-145-2016, 2016.
turbulence intermittent. The aerosol–radiation feedback (AF) and decrease in turbulence diffusion (DTD) may reduce the underestimation of PM2.5 EG by 20–25% and 14–20%, respectively. The modeled EG stage PM2.5 error was decreased from −40 to −51% to −11 to 2% by the combined effects of AF and DTD in Jing–Jin–Ji.