the Creative Commons Attribution 4.0 License.
the Creative Commons Attribution 4.0 License.
 | 13 Dec 2018
Combined effects of boundary layer dynamics and atmospheric chemistry on aerosol composition during new particle formation periods
Liqing Hao
Olga Garmash
Mikael Ehn
Pasi Miettinen
Paola Massoli
Santtu Mikkonen
Tuija Jokinen
Pontus Roldin
Pasi Aalto
Taina Yli-Juuti
Jorma Joutsensaari
Tuukka Petäjä
Markku Kulmala
Kari E. J. Lehtinen
Douglas R. Worsnop
Annele Virtanen
Characterizing aerosol chemical composition in response to meteorological changes and atmospheric chemistry is important to gain insights into new particle formation mechanisms. A BAECC (Biogenic Aerosols – Effects on Clouds and Climate) campaign was conducted during the spring 2014 at the SMEAR II station (Station for Measuring Forest Ecosystem–Aerosol Relations) in Finland. The particles were characterized by a high-resolution time-of-flight aerosol mass spectrometer (HR-ToF-AMS). A PBL (planetary boundary layer) dilution model was developed to assist interpreting the measurement results. Right before nucleation events, the mass concentrations of organic and sulfate aerosol species were both decreased rapidly along with the growth of PBL heights. However, the mass fraction of sulfate aerosol of the total aerosol mass was increased, in contrast to a decrease for the organic mass fraction. Meanwhile, an increase in LVOOA (low-volatility oxygenated organic aerosol) mass fraction of the total organic mass was observed, in distinct comparison to a reduction of SVOOA (semi-volatile OOA) mass fraction. Our results demonstrate that, at the beginning of nucleation events, the observed sulfate aerosol mass was mainly driven by vertical turbulent mixing of sulfate-rich aerosols between the residual layer and the newly formed boundary layer, while the condensation of sulfuric acid (SA) played a minor role in interpreting the measured sulfate mass concentration. For the measured organic aerosols, their temporal profiles were mainly driven by dilution from PBL development, organic aerosol mixing in different boundary layers and/or partitioning of organic vapors, but accurate measurements of organic vapor concentrations and characterization on the spatial aerosol chemical composition are required. In general, the observed aerosol particles by AMS are subjected to joint effects of PBL dilution, atmospheric chemistry and aerosol mixing in different boundary layers. During aerosol growth periods in the nighttime, the mass concentrations of organic aerosols and organic nitrate aerosols were both increased. The increase in SVOOA mass correlated well with the calculated increase in condensed HOMs' (highly oxygenated organic molecules) mass. To our knowledge, our results are the first atmospheric observations showing a connection between increase in SVOOA and condensed HOMs during the nighttime.
- Article
(1236 KB) - Full-text XML
-
Supplement
(4725 KB) - BibTeX
- EndNote


Atmospheric aerosols have significant impacts on global climate change via direct and indirect forcing, air quality and human health (IPCC, 2013). Accurate quantification of their sources and atmospheric evolution is necessary to reduce the uncertainties of global climate predictions.
New particle formation has been recognized as a significant aerosol source in the atmosphere (e.g., Nieminen et al., 2018; Gordon et al., 2016). Their subsequent growth is an important source of cloud condensation nuclei (CCN) relevant to climate change (Kerminen et al., 2012). Numerous measurements have shown that new particle formation takes place in the planetary boundary layer (PBL) on a global scale (Zhang et al., 2012; Kulmala and Kerminen, 2008; Kulmala et al., 2004). The PBL is the lowest layer of the troposphere, which is characterized by strong turbulent motions. The PBL is affected by the strength of the solar radiation (Stull, 2012). During the daytime, solar radiation heats the planet surface and induces convective turbulent motions and a well-mixed PBL develops. During the nighttime, several sub-layers are present when the planet surface cools down: the uppermost part is defined as a residual layer where emissions and background aerosol from the previous day are accumulated, and the part close to the ground develops to be a stable nocturnal boundary layer because solar heating ceases and the ground cools by emissions of infrared radiation, leading to increasing atmospheric temperature with height. This layer suppresses turbulence and vertical mixing. The height of the PBL is an important variable in atmospheric science as it controls the vertical profiles of mixing ratios of gases and particles in the atmosphere. Formation of new aerosol particles depends greatly on concentrations of certain gas-phase species and their subsequent transformation (e. g. Tröstl et al., 2016; Ehn et al., 2014; Kulmala et al., 2000). These gas species can oxidize or undergo atmospheric reactions and transform to vapors with vapor pressures low enough to nucleate or condense. When the gas species are emitted into the planetary boundary layer, the dynamics of the PBL affect the spatial distributions of the aerosol precursor species and thus their reaction products. Consequently, an influence of PBL dynamics on the new particle formation potential could be possible (Schobesberger et al., 2013; Wehner et al., 2010; O'Dowd et al., 2009; Laakso et al., 2007; Nilsson et al., 2001). For example, O'Dowd et al. (2009) found that the most intensive nucleation occurred just above the canopy. In contrast, nucleation rates were also enhanced in the upper PBL (Schobesberger et al., 2013; Wehner et al., 2010; Nilsson et al., 2001). The different nucleation studies above implied the effects of boundary layer developments on the nucleation events and/or different nucleation mechanisms taking place at different altitudes of boundary layer. To better understand the new particle formation mechanisms inside the boundary layer, the characterization of aerosol chemical composition and concentrations along with PBL development is needed.
This work presents the results of characterization of the atmospheric aerosols in accordance with the PBL development using a high-resolution time-of-flight aerosol mass spectrometer (HR-ToF-AMS) in a boreal forest environment in Finland. We explored the impacts of PBL dynamics and atmospheric chemistry on the observed aerosol chemical composition and mass concentrations before and during the nucleation events. Even though the minimum size cutoff for AMS is 35 nm in a vacuum aerodynamic diameter (Zhang et al., 2004), the aerosol particles measured by AMS are dominated by the size range of Aitken and accumulation modes; we have observed distinct variations of aerosol chemical composition during new particle formation periods. Hence, this study provides useful information to advance the understanding of new particle formation mechanisms.
2.1 Measurement site
During the BAECC (Biogenic Aerosols – Effects on Clouds and Climate) campaign (Petäjä et al., 2016), an aerosol mass spectrometer was deployed to measure the particle mass concentration, chemical composition and size distribution at the SMEAR II ground station (Station for Measuring Forest Ecosystem–Aerosol Relations) in Hyytiälä forestlands in southern Finland (61∘51′ N, 24∘17′ E) during 8 April–20 June 2014 (Hari and Kulmala, 2005). The site is located on a hill (180 m a.s.l.) surrounded by boreal forest, mainly consisting of Scots pine, Norway spruce, birch and aspen. The populated city of Tampere lies approximately 50 km southwest of the site.
2.2 AMS operation and data processing
During the campaign, the real-time measurements of aerosol particles were performed using an Aerodyne soot particle aerosol mass spectrometer (SP-AMS) (Onasch et al., 2012). The SP-AMS is a standard Aerodyne high-resolution time-of-flight AMS equipped with an intracavity laser vaporizer (1064 nm), in addition to the tungsten vaporizer used in a standard AMS (Canagaratna et al., 2007; DeCarlo et al., 2006). During the campaign, the SP-AMS was operated at 5 min saving cycles alternatively switching between EI (electron ionization) mode and SP mode. In EI mode, only the tungsten vaporizer was used to measure non-refractory chemical species such as organics, sulfate, nitrate, ammonium and chloride. In SP mode, AMS was operated with both the intracavity laser vaporizer and the standard tungsten vaporizer to produce mass spectra of laser-light-absorbing particles such as refractory black carbon (BC) and non-refractory species. Standard mass-based calibrations were performed for the ionization efficiency (IE) by using monodispersed pure ammonium nitrate particles (Jayne et al., 2000). Regal black (REGAL 400R pigment black, Cabot Corp.) was used to determine the IE of BC, in a similar operation procedure as nitrate calibration.
The AMS data were processed using the ToF-AMS data analysis toolkit SQUIRREL version 1.57H and PIKA version 1.16H in Igor Pro software (version 6.22A, WaveMetrics Inc.). In addition, an improved-ambient elemental analysis was processed by using APES V1.06 (Canagaratna et al., 2015). For mass concentration calculations, the dataset from EI mode was analyzed for reporting the non-refractory aerosol species and positive matrix factorization (PMF) simulations and the data in SP mode for the reported black carbon. Default relative ionization efficiency (RIE) values of 1.1, 1.2, 1.3 and 1.4 were applied for nitrate, sulfate, chloride and organics, respectively. The RIE for BC and ammonium were 0.11 and 2.65, respectively, as determined from the mass-based ionization efficiency calibration. After a comparison to the volume concentration from differential mobility particle sizer (DMPS) measurement, a particle collection efficiency factor of 0.85 was applied to account for the particle losses in the aerodynamic transmission lens and vaporizer.
Further analysis was performed by applying the positive matrix factorization technique on the high-resolution mass spectra (Paatero and Tapper, 1994; Ulbrich et al., 2009). For the current study, the organic and error matrices in the m∕z range 12–129 amu of high-resolution mass spectra were generated in PIKA in EI mode. The time series and errors of NO+ and ions were integrated into the organic and error matrices for PMF analysis. The combined organic and inorganic matrices were then fitted using the PMF evaluation tool. The PMF technique on the combined organic and inorganic matrix has been elaborately introduced in Sun et al. (2012) and Hao et al. (2014). The technique is capable of separating organic factors from inorganic ones and has been widely applied to quantify the particulate organic nitrate aerosols in recent studies (Xu et al., 2015, 2018; Zhang et al., 2016; Kortelainen et al., 2017; Hao et al., 2014, 2013). In this study, the PMF was evaluated with 1 to 10 factors and Fpeak from −1.0 to 1.0.
2.3 Gaseous compound concentrations
Highly oxygenated organic molecules (HOMs) were measured by a chemical-ionization atmospheric-pressure-interface time-of-flight mass spectrometer (CI-APi-ToF-MS) (Jokinen et al., 2012). The CI-APi-ToF was run in negative ion mode with acting as the reagent ion. In the campaign, water clusters severely interfered with CI-APi-ToF measurements in the daytime. Hence, only a limited amount of data in the nighttime measurement were used and more details are provided in Sect. 3.4.
The molecular concentrations of sulfuric acid (SA, H2SO4) were estimated by a proxy approach (Mikkonen et al., 2011). The SA proxy was approximated by photo-oxidation reactions of sulfur dioxide (SO2) under global radiation. The estimated SA concentrations are at an order of 106 molecules m−3 (Fig. S1, Supplement), which is in the same magnitude as those observed in the Hyytiälä region (Petäjä et al., 2009).
2.4 Planetary boundary layer
The height of the planetary boundary layer (PBL) was provided by the GDAS simulation (Global Data Assimilation System) at the campaign site and the PBL data were validated against radiosonde measurements. The GDAS data are comparable to the measurement (Fig. S2) and thus were used to interpret the data.
2.5 Condensation sink (CS)
The CS for sulfuric acid was estimated by the approach developed by Pirjola et al. (1999) and was briefly expressed as the following equation (Lehtinen et al., 2003; Dal Maso et al., 2005):
where Dp,i is the diameter of a particle and Ni is the particle number concentration in a size bin i, D represents the diffusion coefficient and βm is the transitional correction factor. The estimation of CS was conducted from the size distribution measured by a differential mobility particle sizer. Since DMPS measured the distribution of dry particles, the effect of ambient relative humidity on the hygroscopic growth of particles was also taken into account based on the parameterization of growth factors derived in the Hyytiälä area (Laakso et al., 2004).
A similar approach was also employed for HOMs' CS. Since there exists a large amount of different HOMs, to simplify data processing, we virtually reconstructed a model molecule C13H21O9 based on the α-pinene SOA chamber studies of Ehn et al. (2014) and used it to estimate the condensation sink of HOMs in this study. The molecule represents an average structure for HOMs with a molar weight of 321 g mol−1, close to 325 g mol−1 for the average molar mass of the HOMs produced from α-pinene photochemistry. In the calculation, a total diffusion volume for HOMs of 310.2 was applied from the estimation of the atomic diffusion volumes of 15.9 for C, 6.11 for O and 2.31 for H (Reid et al., 1987). The final CS for HOMs is approximately half of that for SA (Fig. S3).
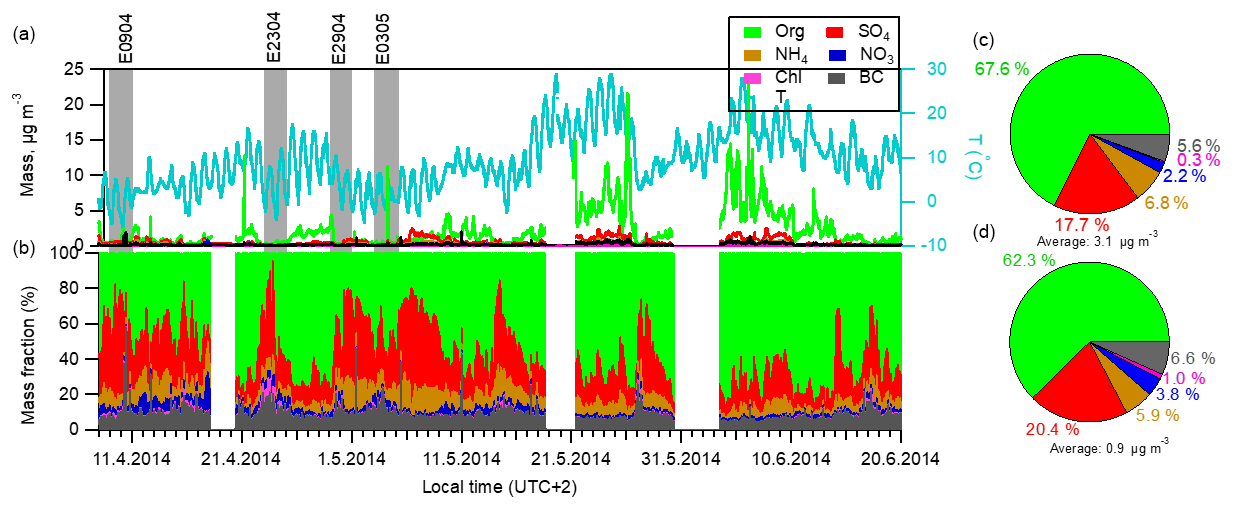
Figure 1Time series and chemical composition of aerosol species determined by AMS in the campaign. The gray bars mark the four new particle formation events that this study focuses on. (a) Ambient temperature (T) and time series of aerosol mass concentrations. (b) Mass fractions of each aerosol component to the total aerosol mass concentrations. (c) Right pie charts show the average chemical composition for the campaign periods and (d) for the four new particle formation periods.
2.6 Supporting measurements
The aerosol number concentration and size distribution in a size range of 3–1000 nm were measured by a DMPS. Other supporting measurements included O3 (ozone), SO2, CO (carbon monoxide), NOx (nitrogen oxides) and meteorological parameters (wind speed, wind direction, precipitation, temperature, solar radiation and relative humidity) that are recorded continuously at the site throughout the year. The data are available by downloading in SmartSMEAR (https://avaa.tdata.fi/web/smart/, last access: 8 August 2018, Junninen et al., 2009).
3.1 Concentration and chemical composition of aerosols during nucleation events
The mass concentration of individual chemical species and chemical composition of PM1 (particulate matter with aerodynamic diameter < 1 µm) particles varied greatly during the campaign period (Fig. 1). Generally, the total aerosol volume concentration derived from non-refractory species together with refractory BC measured by AMS correlated well with the collocated measurement by DMPS (r2=0.93 and slope =1.07), assuming a density of 1.75 g cm−3 for ammonium nitrate, ammonium sulfate and ammonium bisulfate; 1.52 g cm−3 for ammonium chloride; 1.3 g cm−3 for organics; and 1.77 g cm−3 for BC (Salcedo et al., 2006) (Fig. S4). The total PM1 mass concentrations varied between 0.14 and 26.3 µg m−3, with an average mass concentration of 3.1±3.2 µg m−3 (mean ± standard deviation). Individual species mass concentrations also varied considerably, especially the organic component, showing a dependence on temperature. A similar observation of increased organic aerosol concentrations with rising ambient temperature has also been reported at the same site (Corrigan et al., 2013). Averaged over the campaign (Fig. 1c), organic component accounted for 67.6 %, sulfate for 17.7 %, ammonium for 6.8 %, nitrate for 2.2 %, black carbon for 5.6 % and chloride for < 1 % of the total PM1 mass.

Figure 2Observation of new particle formation events starting on 29 April 2014 (E2904) and 23 April 2014 (E2304). The orange bars were marked for the analysis before and right after nucleation and the gray bars were for aerosol growth periods. Panels: (a) aerosol number size distributions from DMPS; (b) volume size distributions from DMPS; (c) mass concentrations of organic (green) and sulfate (red) species by AMS; (d) mass fractions of organic and sulfate to total aerosol mass concentrations; (e) mass fractions of LVOOA (pink) and SVOOA (light pink) to total organic aerosol mass concentrations; (f) mass concentrations of LVOOA and SVOOA species determined by PMF; (g) the time series of organic nitrate aerosol; (h) O:C ratio of organic species by AMS; (i) wind speed (WS) and direction (WD).
In this campaign several new particle formation episodes were observed. We focused on four events that were not perturbed by significant air mass changes, characterized by low variation of wind direction (±30∘) and low wind speed (below 2 m s−1). To demonstrate an overall picture of the evolution of the total aerosol chemical composition during the different phases of new particle formation events, we have divided each event into two stages, which we call “before” and “during” the nucleation and growth. The time period “before” here is related to the “nominal” nucleation starting time that was defined as the point when the DMPS started to see the nucleated aerosols up to a size of 3 nm in diameter (refer to Fig. S5). As can be seen in Fig. 2, the particle number and mass concentrations decrease during the morning hours before the nucleation starts. At the same time the mass fraction of sulfate increases and organics decrease. The decrease in number and mass concentration is due to the increasing PBL height associated with sunrise. On average, the aerosol mass concentration was 0.9 µg m−3 during the four events, which was approximated as one-third of the average campaign value. Concerning the chemical composition, the aerosol mass was comprised of 62.3 % organic, 20.4 % sulfate and 5.9 % ammonium during events (Fig. 1d), in contrast to the values of 67.6 %, 17.7 % and 6.8 % for campaign average (Fig. 1c), respectively. The difference in aerosol composition between the nucleation and other times was caused by combined effects of PBL development and atmospheric chemistry and more discussion will be provided next.
3.2 Aerosol components by positive matrix factorization
To gain insight into the relative variation of individual components, a PMF analysis of the high-resolution organic mass spectra together with NO+ and ions was conducted. After a detailed evaluation of mass spectral profiles, time series, and comparison to the results of formerly reported mass spectra and supporting measurement data from other instruments, a five-factor solution at Fpeak=0 separated four organic factors and one inorganic factor and thus was chosen. A four-factor solution did not extract out the inorganic nitrate factor and thus missed one meaning factor compared to a five-factor solution. A six-factor solution split the factor 2 of the five-factor solution to two subfactors and did not produce more meaningful factors and thus was abandoned. More diagnostics plots are provided in Sect. S1 in the Supplement.
The mass spectra profiles and time series of the five factors are shown in Fig. S10. The organic component was resolved into one LVOOA (low-volatility oxygenated organic aerosol) factor and three SVOOA (semi-volatile OOA) factors. The factors SVOOA1, SVOOA2 and SVOOA3 were merged to generate a new factor by means of a mass-weighted combination, representing a combined less oxygenated organic factor. As a result, an improved three-factor solution is reported in this paper (refer to Fig. S12). A detailed description of the PMF results is elucidated in Sect. S3. Generally, the average mass concentrations of LVOOA and SVOOA were 0.52±0.51 and 1.48±2.22 µg m−3, accounting for 15.3 % and 43.6 % of the total aerosol mass, respectively.
The determination of particulate organic nitrate by PMF is presented in Sect. S4. The average mass concentration of organic nitrates was 0.01±0.02 µg m−3. The organic nitrate aerosols play a role in the growth stage of newly formed particles and more discussion is provided in Sect. 3.4.
3.3 Observations of new particle formation events
The aerosol size distributions, time series of aerosol components and meteorological parameters during the four new particle formation events are depicted in Figs. 2 and S14. Around the onset of nucleation, we have systematically observed several features concerning the aerosol composition (in the orange shaded area): (1) the mass concentrations of organics and sulfate both decreased (panel c); (2) the mass fractions of sulfate aerosol to the total aerosol mass increased, in distinct contrast to the decrease in organic mass fractions (panel d); (3) the mass concentrations of both LVOOA and SVOOA decreased (panel f), but the mass fractions of LVOOA to the total organic concentration increased while SVOOA decreased (panel e).
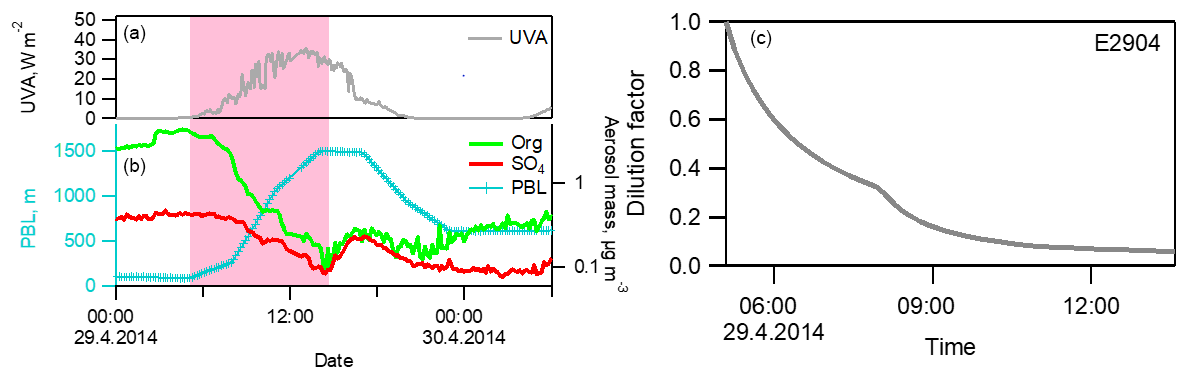
Figure 3A closer view of the decrease in aerosol mass concentrations coinciding with PBL height development in E2904 (29 April 2014). (a) Ultraviolet (UV)-A radiation forcing; (b) the height of the PBL and the mass concentrations of organic and SO4 components measured by AMS; (c) dilution factor, estimated from PBL heights.
The rapid decrease in aerosol concentrations coincided with the increasing PBL height when the sunrise started to heat the surface (Fig. 3). Hence, we developed a PBL dilution model to assist interpreting the measurement results. In the model, we hypothesize that the observed decrease in aerosol mass is caused by the increased dilution due to an increasing PBL height. In the calculation, we converted the heights of the boundary layer to dilution factors as a function of time (Eq. 2). The starting time was defined as the point when the PBL height started to develop and the ending time when the PBL height maximum was reached. The development of the PBL caused a dilution effect on the aerosol concentrations; e.g., in Fig. 3c, the mass concentration of aerosol species was decreased by 94 % at the end. Meanwhile, in the model we did not include the downwards turbulent motions of aerosol particles from the residual layer to the boundary surface layer. Instead, this factor was considered and examined separately and results are shown below.
where PBL_to is the PBL height when the PBL starts to develop and PBL_t represents the height of the PBL at time t.
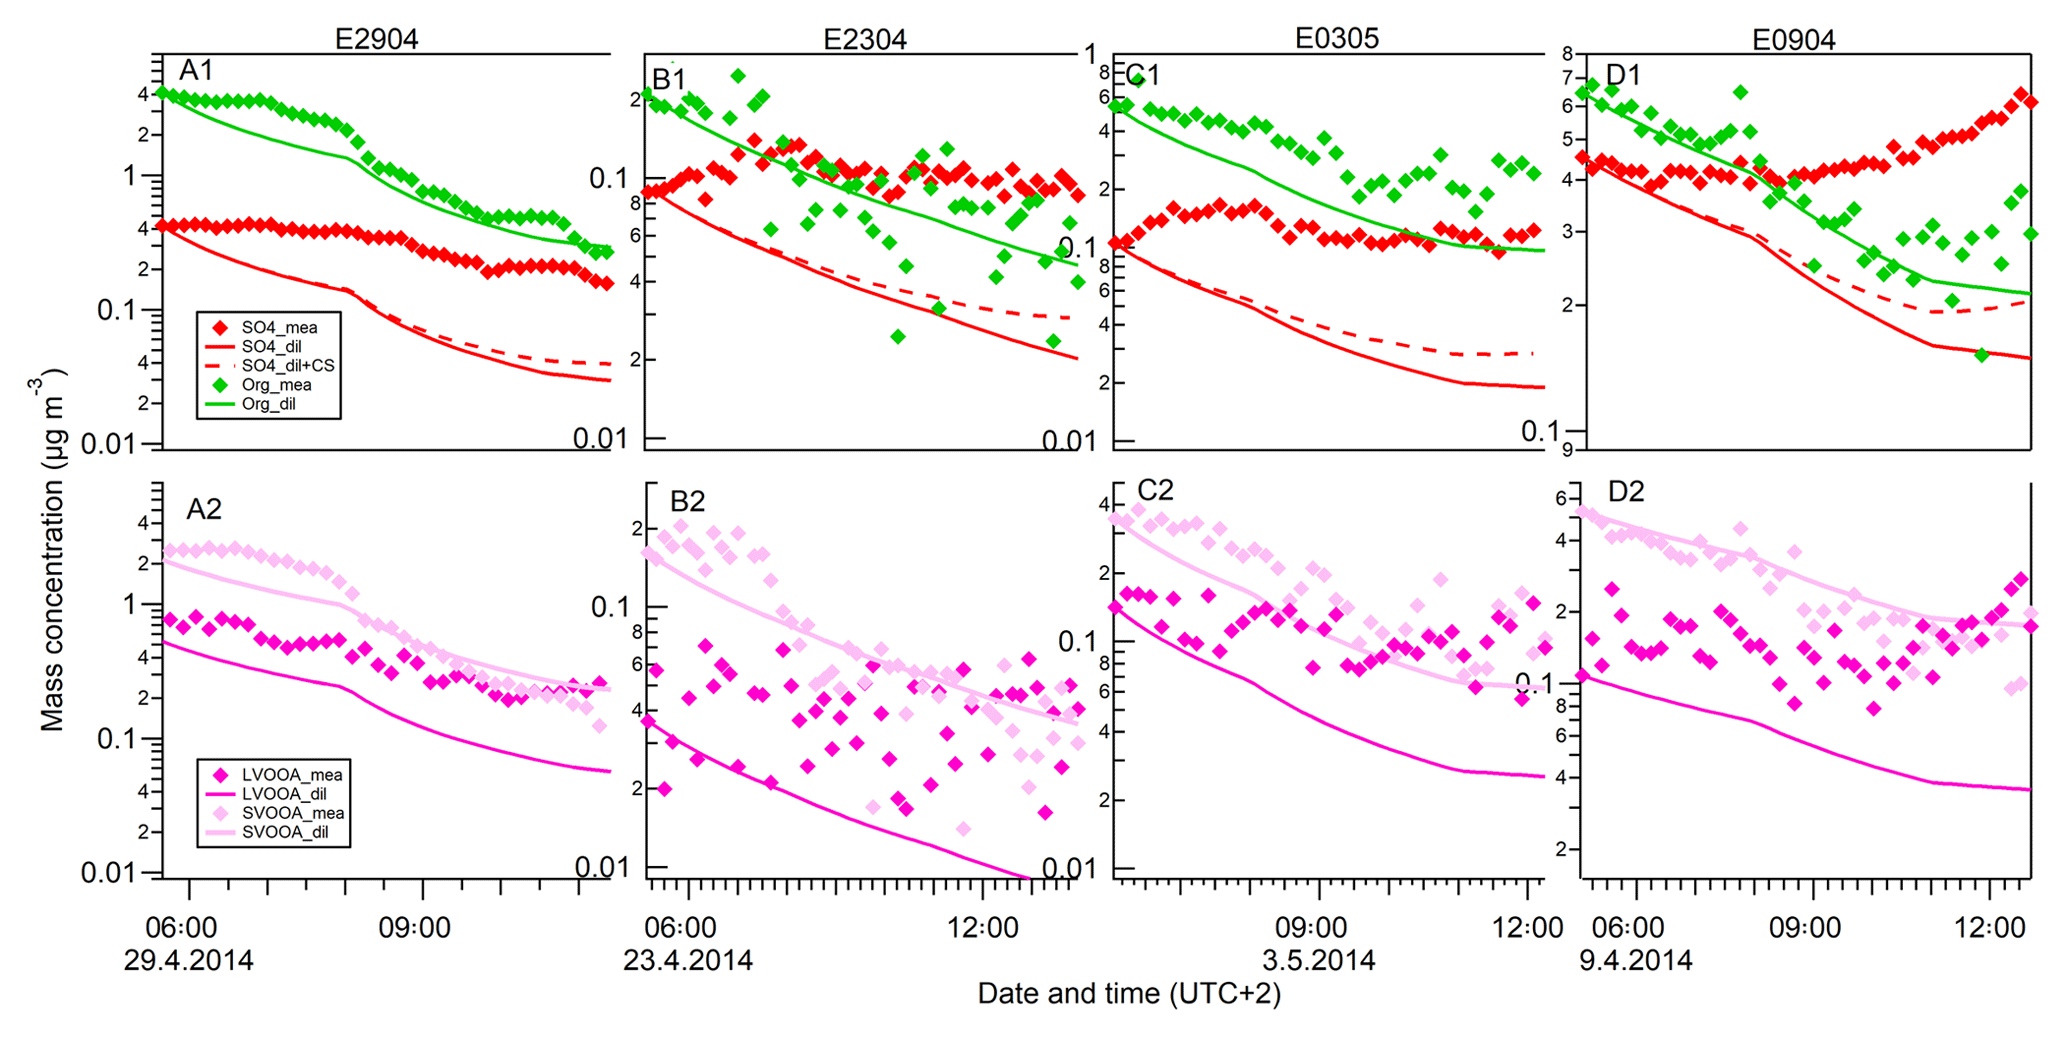
Figure 4The time series of sulfate and organics (a1–d1), and LVOOA and SVOOA (a2–d2) aerosols depending on the dilution and vapor condensation effects before nucleation events in four events (orange bars in Fig. 2). Diamond markers: the measured aerosol concentrations. Solid lines: the modeled aerosol concentrations assuming PBL heights to be the only controlling factor on aerosol mass concentrations. The aerosol concentrations were calculated by accounting for the air volume varying with PBL height. Dashed lines: the modeled aerosol concentrations accounted for by both the dilution effect and condensation of sulfuric acid.
The time series of the measured and modeled organic and sulfate mass concentrations are presented in Fig. 4. The modeled mass concentrations were calculated based on the above-mentioned model, assuming that the change in concentrations was controlled only by the dilution caused by increasing PBL height, i.e., by multiplying the initial concentration (before the sunrise) by the dilution factor (diamond markers in Fig. 4). We see that the general trends in the calculated curves follow the measurements for both organic and sulfate species. During the night, the aerosol particles are concentrated in the shallow boundary layer. In the morning, the solar radiation initiates an increase in the PBL height, leading to dilution and decreasing concentrations.
However, for sulfate species, we observed much higher measured concentrations than the modeled ones (top panels, Fig. 4). The modeled sulfate concentrations can account for only 20.5±4.2 % of the measurement results at the end of studied periods, suggesting that other factors also contributed to the measured sulfate species. There are two explanations for the discrepancy between the measured and modeled concentrations: (1) photochemistry-driven formation of sulfuric acid took place in the gas phase and the condensation of sulfuric acid onto the preexisting particle contributed to the observed aerosol mass concentrations; and/or (2) sulfate-rich particles were transported downwards from the residual layer to the newly developed mixed boundary layer when the PBL developed right after sunrise.
To estimate if the condensation of SA could explain the measured sulfate aerosol mass during the studied time periods, we estimated the condensed SA concentration from the condensation sink and the SA proxy:
where massSA refers to the accumulated SA mass from gas to particle phase over time period t. CS is the condensation sink term for SA and [SA] represents the steady-state concentration of gas-phase SA, which was approximated by the SA proxy approach of Mikkonen et al. (2011).
The calculated sulfate concentrations after taking into account the effects of both the PBL dilution and the SA condensation are shown as the dashed lines in Fig. 4 (in upper panels). For sulfate aerosols, taking into account both the dilution and condensation of SA, the calculation results account for 28.2±5.0 % of measured sulfate concentrations. Furthermore, according to our calculations, in order to explain the discrepancy between the measurement and the pure dilution model by only SA condensation, it would require an H2SO4 concentration of 0.4–2.8×10⁹ molecules cm−3 (based on Eq. 3), which is at least 2 orders of magnitude higher than the H2SO4 concentrations typically found in Hyytiälä (Petäjä et al., 2009). Thus, it is highly likely that the rest of the uncounted sulfate (71.8 %) was originated from vertical turbulent mixing of the sulfate-rich aerosols from the residual layer into the newly formed boundary layer, while the condensation of sulfuric acid played a minor role in contributing to the uncounted sulfate mass concentrations. The horizontal dilution due to the increasing wind speed during the investigated period (wind speed increases from 0.3 to 1.5 m s−1) was not taken into account in the analysis. Horizontal dilution could affect the dilution although in Hyyiälä, where the station is surrounded by the homogeneous forested area, the effect is minor. Our results are consistent with the study by Morgan et al. (2009) showing that the vertical structure of the sulfate aerosol profile was primarily driven by PBL dynamical processes. The results also highlight the fact that measurements on the planetary surface are not always representative of aerosol properties at elevated altitudes. To understand the atmospheric aerosol properties, climate impacts and to make accurate aerosol model predictions, a simultaneous representation of the aerosol vertical distribution is necessary.
For organic aerosols, the dilution model (solid green lines, Fig. 4) can relatively well track the measurements (green diamond markers), reproducing 61.8±36.7 % of the measurement results at the end (upper panels, Fig. 4). Further analysis of the organic aerosol component by PMF reveals that the mass concentrations of LVOOA and SVOOA both decreased. The mass fractions of LVOOA to the total organic mass, however, were increased while the SVOOA mass fractions were decreased during the morning hours when the new particle formation took place (panels e and f, Fig. 2). In addition, when taking into account the PBL dilution, the calculated LVOOA concentrations (pink lines in Fig. 4) are clearly lower than the measured concentrations. The discrepancy between the modeling and measurements could be interpreted by the mixing of LVOOA-rich aerosol from the residual layer to the ground layer and/or by the partitioning of organic vapors between aerosol and gas phase. To get more detailed and quantitative information on these processes, gas-phase measurements of organic vapors would be needed. Unfortunately, quantitative data of organic vapor concentrations are not available for this measurement campaign. For the SVOOA component, the calculated concentrations were generally slightly higher than the measured ones, which indicates that evaporation of SVOOA could have taken place due to the dilution mixing. Overall, it is likely that the temporal profiles of organic concentrations in this study were subjected to the interplay of mixing of LVOOA-rich OA from the residual to the boundary layer and partitioning of organic vapors during the boundary layer evolution and new particle formation.
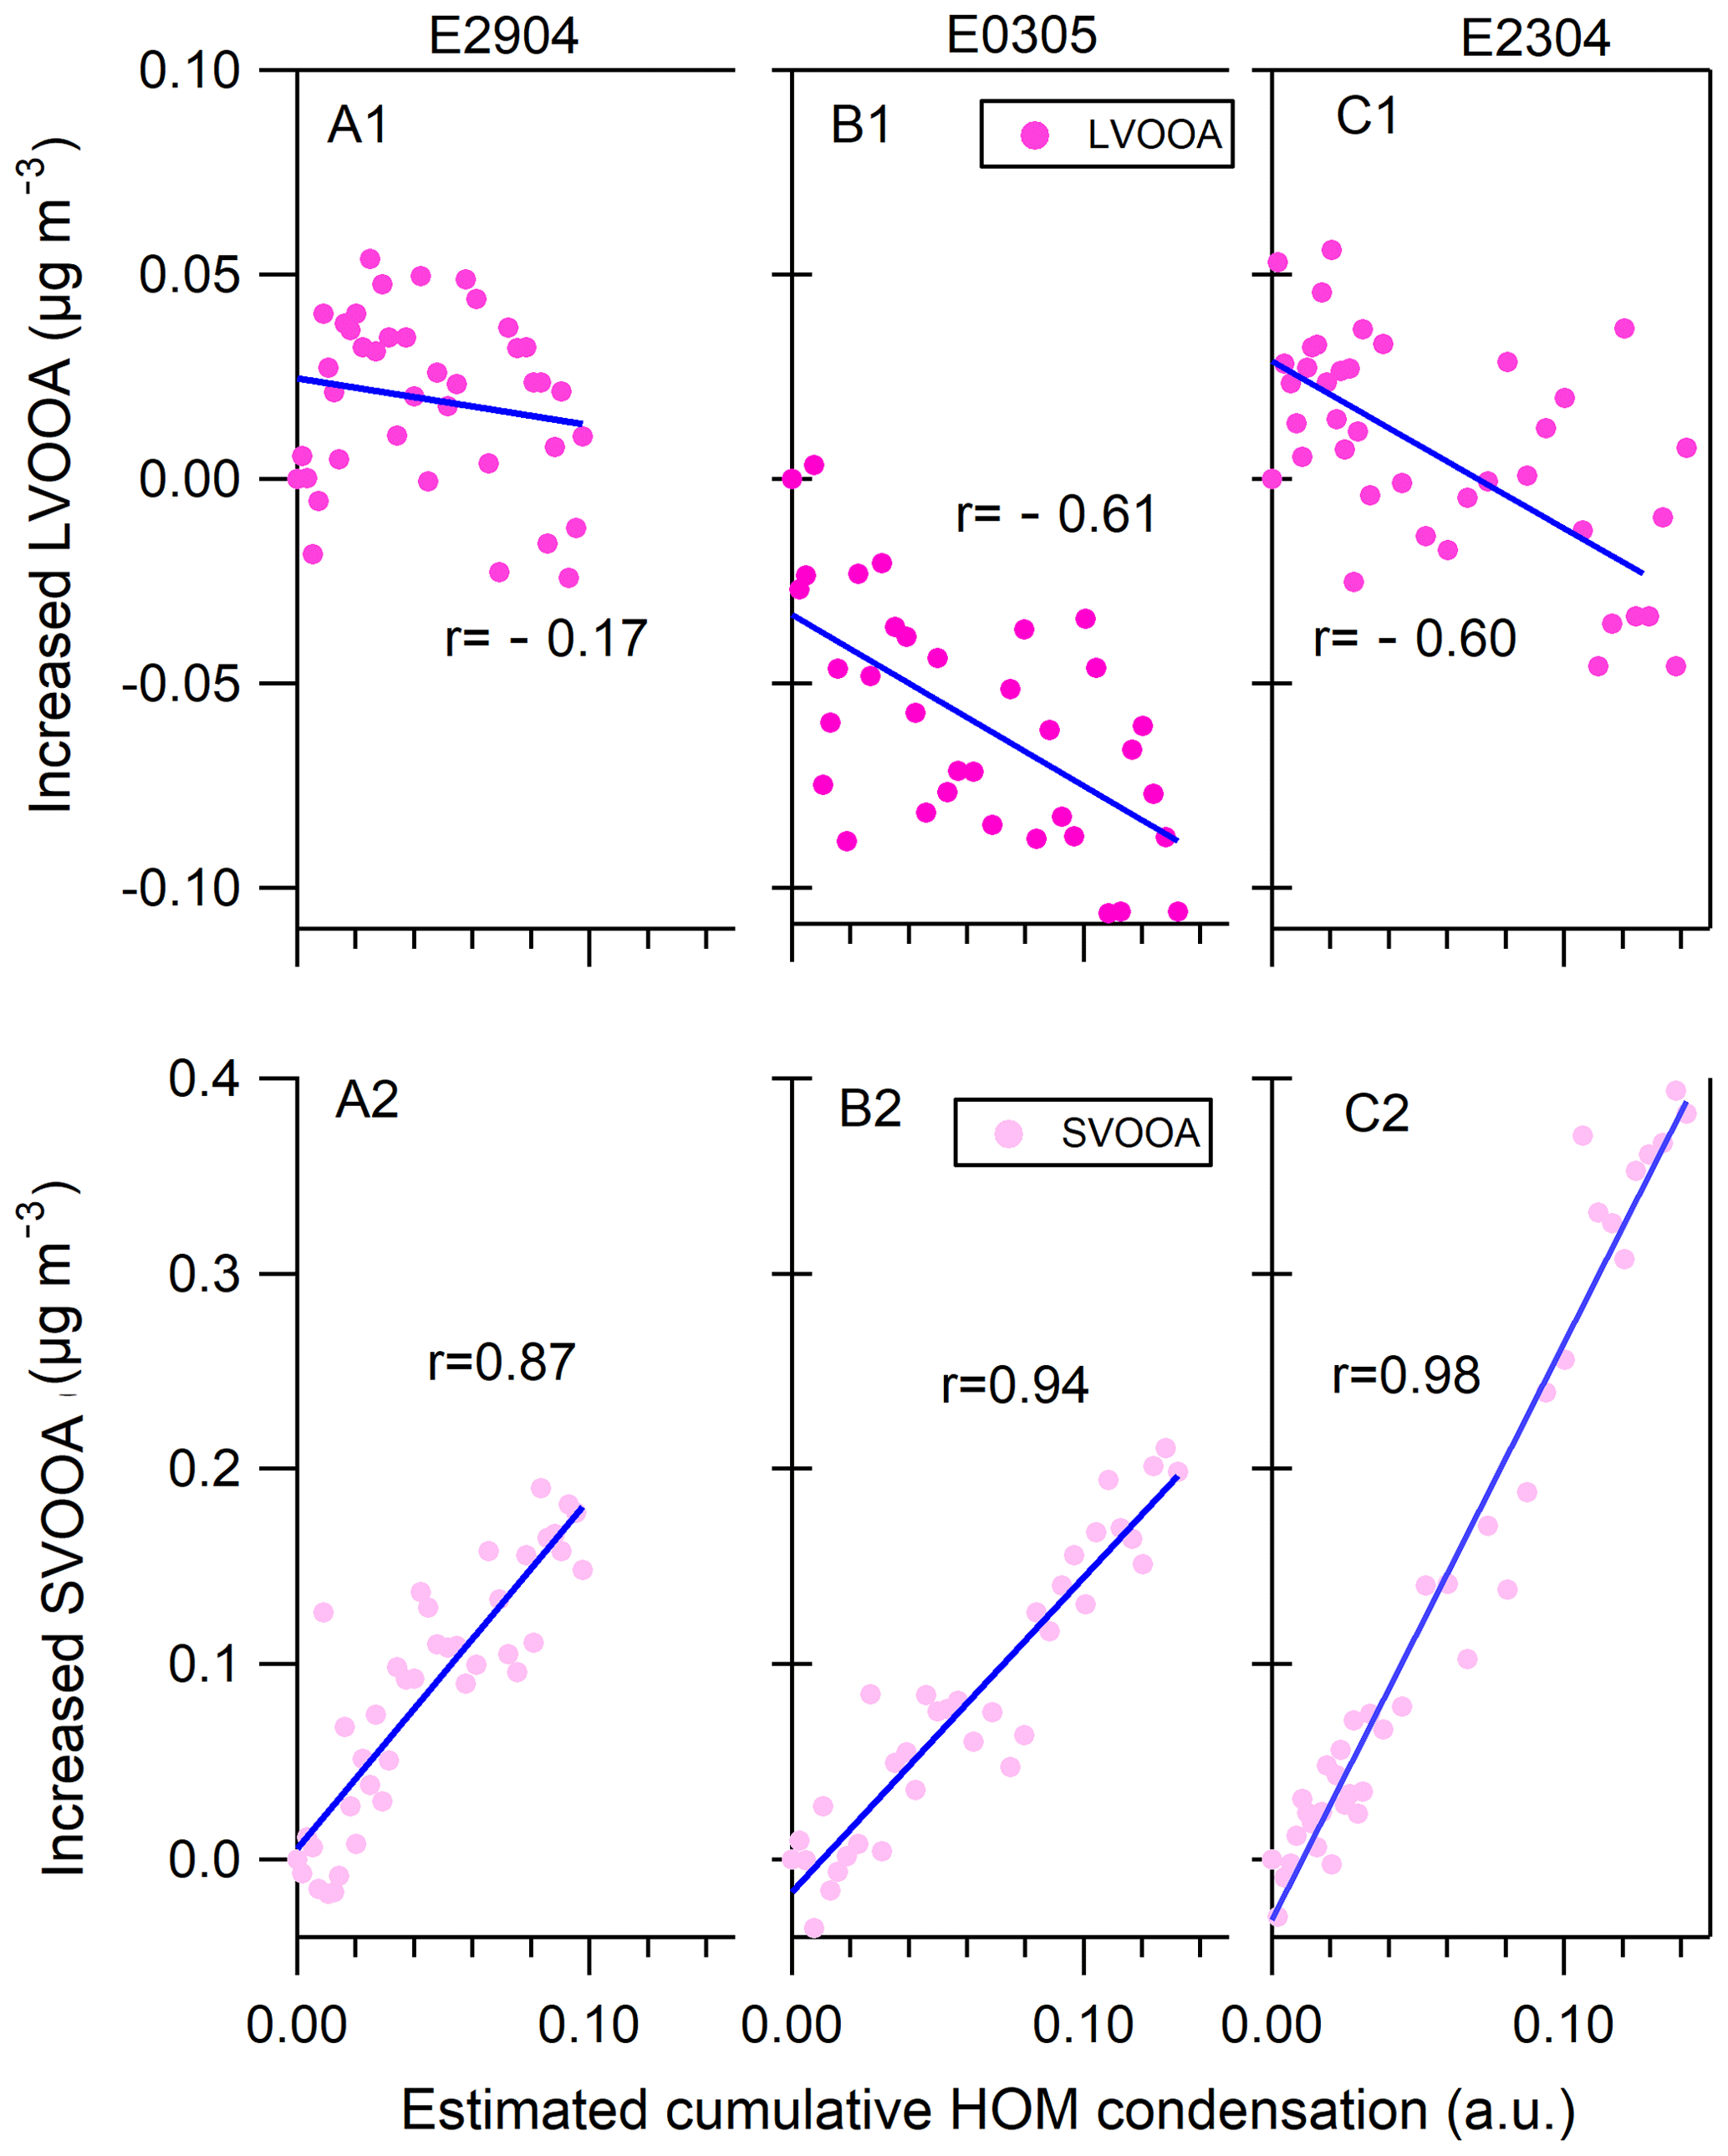
Figure 5Comparisons of the increased mass of LVOOA (a1–c1) and SVOOA (a2–c2) in measurements (vertical axis) to the estimated accumulated amount of HOMs condensed onto the particle phase (horizontal axis) at the particle growth stage (gray bars in Fig. 2). Note that AMS did not work in the E0904 growth period (event day of 9 April 2014) and thus the results are not shown.
Additionally, we conducted the back-calculated approximation of aerosol chemical composition in the residual layer based on the comparison between our measurement and dilution modeling results. In the calculation we assumed that the partitioning of organic vapors is negligible, and the ammonium and nitrate were excluded in the analysis. Hence, only Org and SO4 aerosol were included in the analysis. On average, the approximated aerosol mass in the residual layer was comprised of 62.6±16.6 % SO4, 35.6±15.4 % LVOOA and 1 % SVOOA in the four studied events, in a distinct contrast to aerosol chemical composition of 24.3±11.6 % SO4, 17.2±0.1 % LVOOA and 58.5±0.1 % SVOOA in the stable surface boundary layer before PBL dilution was initiated. The origin of sulfate-rich aerosol in the residual layer is likely related to the cloud processing of aerosols as a significant fraction of sulfate is formed in clouds (Ervens et al., 2011). It is also possible that sulfate-rich aerosol has entrained from the free troposphere. In addition, e.g., Sorooshian et al. (2010) and Hao et al. (2013) reported increased oxidation level of cloud residual particles, suggesting that cloud processing of organics would lead to compounds having elevated O:C ratio. Our results are supported by an earlier study by Janssen et al. (2012) where they have quantitatively studied PBL effects on SOA concentrations using a boundary layer chemistry model in combination with observation in the Hyytiälä area. They have observed that organic aerosol was dominated by dilution and organic aerosol entrainment from the free troposphere in PBL growth, while the condensation of oxidative products from local terpene emissions played a minor role compared to dilution and entrainment.
3.4 Aerosol growth
The growth of atmospheric aerosols from nucleation mode size range to the size at which they can be activated to cloud condensation nuclei is an important step in linking new particle formation to climate change. To understand what is behind the growth mechanisms is thereby of scientific significance. In this study, we also investigated the changes in aerosol composition during the growth period of newly formed particles by AMS (the periods are indicated by gray bars in Figs. 2 and S14). To simplify the analysis, we selected the growth periods in relatively stagnant meteorological conditions with steady WS and WD (in the gray bars, Figs. 2 and S14). In addition, the PBL was fully developed during the studied growth periods. We observed several interesting phenomena in the evolution of aerosol composition at the stage of aerosol growth. Firstly, we observed an obvious increase in organic aerosol mass concentration, comparing to the relatively stable concentration of sulfate aerosol (panel c). Second, PMF results further revealed that the mass concentration of SVOOA increased. In contrast, the mass of LVOOA was almost unchanged (panel f). Third, the mass concentration of organic nitrate was also enhanced (panel g). Last, the growth of aerosol particles took place in the nighttime in all four events.
To investigate in more detail the contribution of highly oxygenated organic molecules to the growth during the nighttime and their contribution to the increased mass concentration of SVOOA, we used the nitrate CI-APi-ToF data. As mentioned before, due to the instrumental problem (water clusters interfered with CI-APi-ToF measurements), the absolute concentrations of measured HOMs could not be estimated. However, as we expect that the response of the CI-APi-ToF stayed fairly constant over the course of these measurements, we can utilize the measured counts for a qualitative analysis. We normalized the HOM ion signals (measured in counts per second, cps) to the corresponding reagent ion signals. In addition, we chose the 10 most abundant ions observed during the aerosol growth periods, as these were least affected by the water interference. The 10 ions included monomers and dimers (one nitrogen-containing): C10H14O7, C10H16O7,C10H14O9, C10H16O9, C10H14O10,C10H16O10, C10H14O11,C20H32O10, C20H32O11 and C20H31O13N. In our calculations we assume that all measured HOMs have extremely low vapor pressure and that we can use the condensation sink approach to calculate the mass of condensed HOMs during the nighttime growth (Eq. 4).
where massHOMs refers to the accumulated amount from gas to particle phase over time period t for HOMs. CS is the condensation sink for HOMs. [HOMs] represents the steady-state concentrations of HOMs.
Figure 5 shows the increase in mass concentration of LVOOA and SVOOA as a function of relative increase in mass due to the HOM condensation during the nighttime aerosol growth periods (gray bars in Fig. 2). It should be noted that the x axis of the Fig. 5 does not represent the quantitative HOM concentration, but rather the relative change in the HOM concentration during the growth period. An excellent linear correlation was established between the condensed amounts of organic vapor and the increased mass of measured particles during the particle growth periods: the correlation coefficients r are in the range of 0.87–0.98. In contrast, the condensed HOMs show negative correlation with LVOOA, with r between −0.17 and −0.60 (top panels, Fig. 5). The results demonstrate that the nighttime condensation of HOMs correlate well with SVOOA mass increase, indicating that the HOMs contribute to the mass increase of SVOOA and total organic mass during the nighttime. Earlier laboratory and field studies have linked HOM to SOA formation (Ehn et al., 2014), but, to our knowledge, our results are the first atmospheric observations showing a connection between increase in SVOOA and condensed HOMs during the nighttime.
As a constituent of organic aerosol, organic nitrate species were estimated to contribute 2.2±0.8 % of the increase in aerosol mass at the growth stage. Note that this study measured only the nitrate functionality (−ONO2) of organic nitrates. Taking into account the molar mass of R−NO3 (where R represents organic components and we assume a lower limit of molar mass of 200 g mol−1) (Xu et al., 2015), the fractional contribution of organic nitrate molecules (RONO2) to the increased aerosol mass should be tripled (which should at least reach 6.6 %). The results demonstrate that organic nitrates are a significant constituent of organic aerosol mass and are consistent with the studies showing that the organic nitrates are important for the increase in monoterpene SOA mass in chamber studies (Berkemeier et al., 2016). The results also suggest that ozonolysis and nitrate radical chemistry have crucial roles in contributing to the increased organic mass of atmospheric aerosols in the nighttime in a boreal environment.
The measurements were conducted to characterize atmospheric submicron aerosol particles during new particle formation events in a boreal forest environment, Finland. The main goal was to investigate the temporal variation of aerosol species in response to the meteorological variation and atmospheric chemistry during new particle formation periods.
The aerosol composition during four focused nucleation events was dominated by organics (62.3 %) and sulfate (20.4 %) in terms of mass concentration. In the beginning of nucleation events, the mass concentrations of organic and sulfate aerosol components were both controlled by the boundary layer development. The temporal variation of sulfate aerosol mass concentration was mainly driven by the mixing of sulfate-rich aerosols from the above residual layer down to the newly formed mixed boundary layer in the first few hours after sunrise, while the condensation of sulfuric acid formed by photochemistry played a minor role. Based on our observations, we also hypothesize that the temporal evolution of organic concentration in the beginning of nucleation was caused by the interplay of mixing of organic aerosol from the above residual layer down to the boundary layer and/or possible condensation or evaporation of organic vapors. During the nighttime, we observed an increase in the organic aerosol and organic nitrate mass concentrations, compared to the relative stable sulfate mass concentrations. The nighttime increase in organic mass was driven by the SVOOA components and the increase in SVOOA mass correlated well with the calculated increase in condensed HOM mass, indicating that the HOMs contribute to the mass increase of SVOOA and total organic mass during the nighttime.
The data included in this paper can be obtained by contacting the authors.
The supplement related to this article is available online at: https://doi.org/10.5194/acp-18-17705-2018-supplement.
LH, TP, MK, KL, DW and AV designed the experiments and the sampling site. LH, OG, ME, PM, PM, TJ and PA performed the experiments. LH and AV performed the full data analysis with contributions by OG, ME, SM, TJ, PR, TY and JJ. LH and AV wrote the paper with contributions from all co-authors.
The authors declare that they have no conflict of interest.
The authors acknowledge Pekka Rantala for providing PTR-MS data,
as well as Antti Manninen and Kimmo Korhonen for measuring and analyzing PBL data.
We also thank Aki Kortelainen, Hao Wang and Aki Pajunoja for
maintaining AMS in the campaign. The financial support by European Research
Council (starting grants 355478 and 638703), the Academy of Finland Centre
of Excellence program (decision no. 307331), the Academy of Finland (259005)
and the UEF Postdoc Research Foundation (930275) is gratefully acknowledged.
Edited by: Fangqun Yu
Reviewed by: two anonymous referees
Berkemeier, T., Ammann, M., Mentel, T. F., Pöschl, U., and Shiraiwa, M.: Organic nitrate contribution to new particle formation and growth in secondary organic aerosols from α-pinene ozonolysis, Environ. Sci. Technol., 50, 6334–6342, 2016.
Canagaratna, M. R., Jayne, J. T., Jimenez, J. L., Allan, J. D., Alfarra, M. R., Zhang, Q., Onasch, T. B., Drewnick, F., Coe, H., Middlebrook, A., Delia, A., Williams, L. R., Trimborn, A. M., Northway, M. J., DeCarlo, P. F., Kolb, C. E., Davidovits, P., and Worsnop, D. R.: Chemical and Microphysical Characterization of Ambient Aerosols with the Aerodyne Aerosol Mass Spectrometer, Mass Spectrom. Rev., 26, 185–222, 2007.
Canagaratna, M. R., Jimenez, J. L., Kroll, J. H., Chen, Q., Kessler, S. H., Massoli, P., Hildebrandt Ruiz, L., Fortner, E., Williams, L. R., Wilson, K. R., Surratt, J. D., Donahue, N. M., Jayne, J. T., and Worsnop, D. R.: Elemental ratio measurements of organic compounds using aerosol mass spectrometry: characterization, improved calibration, and implications, Atmos. Chem. Phys., 15, 253–272, https://doi.org/10.5194/acp-15-253-2015, 2015.
Corrigan, A. L., Russell, L. M., Takahama, S., Äijälä, M., Ehn, M., Junninen, H., Rinne, J., Petäjä, T., Kulmala, M., Vogel, A. L., Hoffmann, T., Ebben, C. J., Geiger, F. M., Chhabra, P., Seinfeld, J. H., Worsnop, D. R., Song, W., Auld, J., and Williams, J.: Biogenic and biomass burning organic aerosol in a boreal forest at Hyytiälä, Finland, during HUMPPA-COPEC 2010, Atmos. Chem. Phys., 13, 12233–12256, https://doi.org/10.5194/acp-13-12233-2013, 2013.
Dal Maso, M., Kulmala, M., Riipinen, I., Wagner, R., Hussein, T., Aalto, P. P., and Lehtinen, E. J.: Formation and growth of fresh atmospheric aerosols: eight years of aerosol size distribution data from SMEAR II, Hyytiälä, Finland, Boreal Environ. Res., 10, 323–336, 2005.
DeCarlo, P. F., Kimmel, J. R., Trimborn, A., Northway, M. J., Jayne, J. T., Aiken, A. C., Gonin, M., Fuhrer, K., Horvath, T., Docherty, K., Worsnop, D. R., and Jimenez, J. L.: Field-Deployable, High-Resolution, Time-of-Flight Aerosol Mass Spectrometer, Anal. Chem., 78, 8281–8289, 2006.
Ehn, M., Thornton, J.A., Kleist, E., Sipila, M., Junninen, H., Pullinen, I., Springer, M., Rubach, F., Tillmann, R., Lee, B., Lopez-Hilfiker, F., Andres, S., Acir, I. H., Rissanen, M., Jokinen, T., Schobesberger, S., Kangasluoma, J., Kontkanen, J., Nieminen, T., Kurten, T., Nielsen, L. B., Jorgensen, S., Kjaergaard, H.G., Canagaratna, M., Dal Maso, M., Berndt, T., Petaja, T., Wahner, A., Kerminen, V. M., Kulmala, M., Worsnop, D. R., Wildt, J., and Mentel, T. F.: A large source of low-volatility secondary organic aerosol, Nature, 506, 476–479, 2014.
Ervens, B., Turpin, B. J., and Weber, R. J.: Secondary organic aerosol formation in cloud droplets and aqueous particles (aqSOA): a review of laboratory, field and model studies, Atmos. Chem. Phys., 11, 11069–11102, https://doi.org/10.5194/acp-11-11069-2011, 2011.
Gordon, H., Sengupta, K., Rap, A., Duplissy, J., Frege, C., Williamson, C., Heinritzi, M., Simon, M., Yan, C., Almeida, J., Tröstl, J., Nieminen, T., Ortega, I. K., Wagner, R., Dunne, E. M., Adamov, A., Amorim, A., Bernhammer, A., Bianchi, F., Breitenlechner, M., Brilke, S., Chen, X., Craven, J. S., Dias, A., Ehrhart, S., Fischer, L., Flagan, R. C., Franchin, A., Fuchs, C., Guida, R., Hakala, J., Hoyle, C. R., Jokinen, T., Junninen, H., Kangasluoma, J., Kim, J., Kirkby, J., Krapf, M., Kürten, A., Laaksonen, A., Lehtipalo, K., Makhmutov, V., Mathot, S., Molteni, U., Monks, S. A., Onnela, A., Peräkylä, O., Piel, F., Petäjä, T., Praplan, A. P., Pringle, K. J., Richards, N. A. D., Rissanen, M. P., Rondo, L., Sarnela, N., Schobesberger, S., Scott, C. E., Seinfeld, J. H., Sharma, S., Sipilä, M., Steiner, G., Stozhkov, Y., Stratmann, F., Tomé, A., Virtanen, A., Vogel, A. L., Wagner, A. C., Wagner, P. E., Weingartner, E., Wimmer, D., Winkler, P. M., Ye, P., Zhang, X., Hansel, A., Dommen, J., Donahue, N. M., Worsnop, D. R., Baltensperger, U., Kulmala, M., Curtius, J., and Carslaw, K. S.: Reduced anthropogenic aerosol radiative forcing caused by biogenic new particle formation, P. Natl. Acad. Sci. USA, 113, 12053–12058, https://doi.org/10.1073/pnas.1602360113, 2016.
Hari, P. and Kulmala, M.: Station for Measuring Ecosystem-Atmosphere relations (SMEAR II), Boreal Environ. Res., 10, 315–322, 2005.
Hao, L., Romakkaniemi, S., Kortelainen, A., Jaatinen, A., Portin, H., Miettinen, P., Komppula, M., Leskinen, A., Virtanen, A., Smith, J. N., Sueper, D., Worsnop, D. R., Lehtinen, K. E. J., and Laaksonen, A.: Aerosol Chemical Composition in Cloud Events by High Resolution Time-of-Flight Aerosol Mass Spectrometry, Environ. Sci. Technol., 47, 2645–2653, 2013.
Hao, L. Q., Kortelainen, A., Romakkaniemi, S., Portin, H., Jaatinen, A., Leskinen, A., Komppula, M., Miettinen, P., Sueper, D., Pajunoja, A., Smith, J. N., Lehtinen, K. E. J., Worsnop, D. R., Laaksonen, A., and Virtanen, A.: Atmospheric submicron aerosol composition and particulate organic nitrate formation in a boreal forestland-urban mixed region, Atmos. Chem. Phys., 14, 13483–13495, https://doi.org/10.5194/acp-14-13483-2014, 2014.
IPCC: Climate change 2013: The physical science basis, Intergovernmental panel on Climate Change, Cambridge University Press, New York, 2013.
Janssen, R. H. H., Vilà-Guerau de Arellano, J., Ganzeveld, L. N., Kabat, P., Jimenez, J. L., Farmer, D. K., van Heerwaarden, C. C., and Mammarella, I.: Combined effects of surface conditions, boundary layer dynamics and chemistry on diurnal SOA evolution, Atmos. Chem. Phys., 12, 6827–6843, https://doi.org/10.5194/acp-12-6827-2012, 2012.
Jayne, J. T., Leard, D. C., Zhang, X. F., Davidovits, P., Smith, K. A., Kolb, C. E., and Worsnop, D. R.: Development of an Aerosol Mass Spectrometer for size and composition analysis of submicron particles, Aerosol Sci. Technol., 33, 49–70, 2000.
Jokinen, T., Sipilä, M., Junninen, H., Ehn, M., Lönn, G., Hakala, J., Petäjä, T., Mauldin III, R. L., Kulmala, M., and Worsnop, D. R.: Atmospheric sulphuric acid and neutral cluster measurements using CI-APi-TOF, Atmos. Chem. Phys., 12, 4117–4125, https://doi.org/10.5194/acp-12-4117-2012, 2012.
Junninen, H., Lauri, A., Keronen, P., Aalto, P., Hiltunen, V., Hari, P., and Kulmala, M.: Smart-SMEAR: on-line data exploration and visualization tool for SMEAR stations, Boreal Environ. Res., 14, 447–457, 2009.
Kerminen, V.-M., Paramonov, M., Anttila, T., Riipinen, I., Fountoukis, C., Korhonen, H., Asmi, E., Laakso, L., Lihavainen, H., Swietlicki, E., Svenningsson, B., Asmi, A., Pandis, S. N., Kulmala, M., and Petäjä, T.: Cloud condensation nuclei production associated with atmospheric nucleation: a synthesis based on existing literature and new results, Atmos. Chem. Phys., 12, 12037–12059, https://doi.org/10.5194/acp-12-12037-2012, 2012.
Kortelainen, A., Hao, L., Tiitta, P., Jaatinen, A., Miettinen, P., Kulmala, M., Smith, J. N., Laaksonen, A., Worsnop, D. R., and Virtanen, A.: Sources of particulate organic nitrate in the boreal forest in Finland, Boreal Environ. Res., 22, 13–26, 2017.
Kulmala, M. and Kerminen, V. M.: On the formation and growth of atmospheric nanoparticles, Atmos. Res., 90, 132–150, 2008.
Kulmala, M., Pirjola, U., and Makela, J. M.: Stable sulphaste cluster as a source of new atmospheric particles, Nature, 404, 632–636, 2000.
Kulmala, M., Vehkamäki, H., Petäjä, T., Dal Maso, M., Lauri, A., Kerminen, V.-M., Birmili, W., and McMurry, P. H.: Formation and growth rates of ultrafine atmospheric particles: a review of observations, J. Aerosol. Sci., 35, 143–176, 2004.
Laakso, L., Petäjä, T., Lehtinen, K. E. J., Kulmala, M., Paatero, J., Hõrrak, U., Tammet, H., and Joutsensaari, J.: Ion production rate in a boreal forest based on ion, particle and radiation measurements, Atmos. Chem. Phys., 4, 1933–1943, https://doi.org/10.5194/acp-4-1933-2004, 2004.
Laakso, L., Gronholm, T., Kulmala, L., Haapanala, S., Hirsikko, A., Lovejoy, E. R., Kazil, J., Kurten, T., Boy, M., Nilsson, E.D., Sogachev, A., Riipinen, I., Stratmann, F., and Kulmala, M.: Hot-air balloon as a platform for boundary layer profile measurements during particle formation, Boreal Environ. Res., 12, 279–294, 2007.
Lehtinen, K. E. J., Korhonen, H., Dal Maso, M., and Kulmala, M.: On the concept of condensation sink diameter, Boreal Environ. Res., 8, 405–411, 2003.
Mikkonen, S., Romakkaniemi, S., Smith, J. N., Korhonen, H., Petäjä, T., Plass-Duelmer, C., Boy, M., McMurry, P. H., Lehtinen, K. E. J., Joutsensaari, J., Hamed, A., Mauldin III, R. L., Birmili, W., Spindler, G., Arnold, F., Kulmala, M., and Laaksonen, A.: A statistical proxy for sulphuric acid concentration, Atmos. Chem. Phys., 11, 11319–11334, https://doi.org/10.5194/acp-11-11319-2011, 2011.
Morgan, W. T., Allan, J. D., Bower, K. N., Capes, G., Crosier, J., Williams, P. I., and Coe, H.: Vertical distribution of sub-micron aerosol chemical composition from North-Western Europe and the North-East Atlantic, Atmos. Chem. Phys., 9, 5389–5401, https://doi.org/10.5194/acp-9-5389-2009, 2009.
Nieminen, T., Kerminen, V.-M., Petäjä, T., Aalto, P. P., Arshinov, M., Asmi, E., Baltensperger, U., Beddows, D. C. S., Beukes, J. P., Collins, D., Ding, A., Harrison, R. M., Henzing, B., Hooda, R., Hu, M., Hõrrak, U., Kivekäs, N., Komsaare, K., Krejci, R., Kristensson, A., Laakso, L., Laaksonen, A., Leaitch, W. R., Lihavainen, H., Mihalopoulos, N., Németh, Z., Nie, W., O'Dowd, C., Salma, I., Sellegri, K., Svenningsson, B., Swietlicki, E., Tunved, P., Ulevicius, V., Vakkari, V., Vana, M., Wiedensohler, A., Wu, Z., Virtanen, A., and Kulmala, M.: Global analysis of continental boundary layer new particle formation based on long-term measurements, Atmos. Chem. Phys., 18, 14737–14756, https://doi.org/10.5194/acp-18-14737-2018, 2018.
Nilsson, E., Rannik, Ü, Kulmala, M., Buzorius, G., and O'dowd, C.: Effects of continental boundary layer evolution, convection, turbulence and entrainment, on aerosol formation, Tellus B, 53, 441–461, 2001.
O'Dowd, C. D., Yoon, Y. J., Junkermann, W., Aalto, P., Kulmala, M., Lihavainen, H., and Viisanen, Y.: Airborne measurements of nucleation mode particles II: boreal forest nucleation events, Atmos. Chem. Phys., 9, 937–944, https://doi.org/10.5194/acp-9-937-2009, 2009.
Onasch, T. B., Trimborn, A., Fortner, E. C., Jayne, J. T., Kok, G. L., Williams, L. R., Davidovits, P., and Workshop, D. R.: Soot Particle Aerosol Mass Spectrometer: Development, Validation, and Initial Application, Aerosol Sci. Technol., 46, 804–817, 2012.
Paatero, P. and Tapper, U.: Positive Matrix Factorization: a non-negative factor model with optimal utilization of error estimates of data values, Environmetrics, 5, 111–126, 1994.
Petäjä, T., Mauldin, III, R. L., Kosciuch, E., McGrath, J., Nieminen, T., Paasonen, P., Boy, M., Adamov, A., Kotiaho, T., and Kulmala, M.: Sulfuric acid and OH concentrations in a boreal forest site, Atmos. Chem. Phys., 9, 7435–7448, https://doi.org/10.5194/acp-9-7435-2009, 2009.
Petäjä, T., O'Connor, E. J., Moisseev, D., Sinclair, V. A., Manninen, A. J., Vaananen, R., von Lerber, A., Thorntoton, J. A., Nicocoll, K., Petersen, W., Chandrasekar, V., Smith, J. N., Winkler, PM., Kruger, O., Hakola, H., Timonen, H., Brus, D., Laurila, T., Asmi, E., Riekkola, M. L., Mona, L., Massoli, P., Engelmann, R., Komppppula, M., Wang, J., Kuang, C. G., Back, J., Virtanen, A., Levula, J., Ritsche, M., and Hickmon, N.: BAECC: A Field Campaign to Elucidate the Impact of Biogenic Aerosols on Clouds and Climate, B. Am. Meteorol. Soc., 97, 1909–1928, 2016.
Pirjola, L., Kulmala, M., Wilck, M., Bischoff, A., Stratmann, F., and Otto, E.: Formation of sulphuric acid aerosols and cloud condensation nuclei: An expression for significant nucleation and model comparison, J. Aerosol Sci., 30, 1079–1094, 1999.
Reid, R. C., Prausnitz, J. M., and Poling, B. E.: The properties of gases & liquids, Fourth Edition, McGraw-Hill, Inc., 1987.
Salcedo, D., Onasch, T. B., Dzepina, K., Canagaratna, M. R., Zhang, Q., Huffman, J. A., DeCarlo, P. F., Jayne, J. T., Mortimer, P., Worsnop, D. R., Kolb, C. E., Johnson, K. S., Zuberi, B., Marr, L. C., Volkamer, R., Molina, L. T., Molina, M. J., Cardenas, B., Bernabé, R. M., Márquez, C., Gaffney, J. S., Marley, N. A., Laskin, A., Shutthanandan, V., Xie, Y., Brune, W., Lesher, R., Shirley, T., and Jimenez, J. L.: Characterization of ambient aerosols in Mexico City during the MCMA-2003 campaign with Aerosol Mass Spectrometry: results from the CENICA Supersite, Atmos. Chem. Phys., 6, 925–946, https://doi.org/10.5194/acp-6-925-2006, 2006.
Schobesberger, S., Vaananen, R., Leino, K., Virkkula, A., Backman, J., Pohja, T., Siivola, E., Franchin, A., Mikkila, J., Paramonov, M., Aalto, P. P., Krejci, R., Petaja, T., and Kulmala, M.: Airborne measurements over the boreal forest of southernFinland during new particle formation events in 2009 and 2010, Boreal Environ. Res., 18, 145–163, 2013.
Sorooshian, A., Murphy, S. M., Hersey, S., Bahreini, R., Jonsson, H., Flagan, R. C., and Seinfeld, J. H.: Constraining the contribution of organic acids and AMS m/z 44 to the organic aerosol budget: On the importance of meteorology, aerosol hygroscopicity, and region, Geophys. Res. Lett., 37, L21807, https://doi.org/10.1029/2010GL044951, 2010.
Stull, R. B.: An introduction to boundary layer meteorology, Springer Science & Business Media, 2012.
Sun, Y. L., Zhang, Q., Schwab, J. J., Yang, T., Ng, N. L., and Demerjian, K. L.: Factor analysis of combined organic and inorganic aerosol mass spectra from high resolution aerosol mass spectrometer measurements, Atmos. Chem. Phys., 12, 8537–8551, https://doi.org/10.5194/acp-12-8537-2012, 2012.
Tröstl, J., Chuang, W.K., Gordon, H., Heinritzi, M., Yan, C., Molteni, U., Ahlm, L., Frege, C., Bianchi, F., Wagner, R., Simon, M., Lehtipalo, K., Williamson, C., Craven, J.S., Duplissy, J., Adamov, A., Almeida, J., Bernhammer, A.K., Breitenlechner, M., Brilke, S., Dias, A., Ehrhart, S., Flagan, R.C., Franchin, A., Fuchs, C., Guida, R., Gysel, M., Hansel, A., Hoyle, C. R., Jokinen, T., Junninen, H., Kangasluoma, J., Keskinen, H., Kim, J., Krapf, M., Kürten, A., Laaksonen, A., Lawler, ,M., Leiminger, M., Mathot, S., Möhler, O., Nieminen, T., Onnela, T., Petäjä, T., Piel, F. M., Miettinen, P., Rissanen, M. P., Rondo, L., Sarnela, N., Schobesberger, S., Sengupta, K., Sipilä, M., Smith, J. N., Steiner, G., Tomè, A., Virtanen, A., Wagner, A. C., Weingartner, E., Wimmer, D., Winkler, P. M., Ye, P., Carslaw, K. S., Curtius, J., Dommen, J., Kirkby, J., Kulmala, M., Riipinen, I., Worsnop, D. R., Donahue, N. M., and Baltensperger, U.: The role of low-volatility organic compounds in initial particle growth in the atmosphere, Nature, 533, 527–531, 2016.
Ulbrich, I. M., Canagaratna, M. R., Zhang, Q., Worsnop, D. R., and Jimenez, J. L.: Interpretation of organic components from Positive Matrix Factorization of aerosol mass spectrometric data, Atmos. Chem. Phys., 9, 2891–2918, https://doi.org/10.5194/acp-9-2891-2009, 2009.
Wehner, B., Siebert, H., Ansmann, A., Ditas, F., Seifert, P., Stratmann, F., Wiedensohler, A., Apituley, A., Shaw, R. A., Manninen, H. E., and Kulmala, M.: Observations of turbulence-induced new particle formation in the residual layer, Atmos. Chem. Phys., 10, 4319–4330, https://doi.org/10.5194/acp-10-4319-2010, 2010.
Xu, L., Suresh, S., Guo, H., Weber, R. J., and Ng, N. L.: Aerosol characterization over the southeastern United States using high-resolution aerosol mass spectrometry: spatial and seasonal variation of aerosol composition and sources with a focus on organic nitrates, Atmos. Chem. Phys., 15, 7307–7336, https://doi.org/10.5194/acp-15-7307-2015, 2015.
Xu, P., Zhang, J., Ji, D., Liu, Z., Tang, G., Jiang, C., and Wang, Y.: Characterization of submicron particles during autumn in Beijing, China, J. Environ. Sci., 63, 16–27, 2018.
Zhang, J. K., Cheng, M. T., Ji, D. S., Liu, Z. R., Hu, B., Sun, Y., and Wang, Y. S.: Characterization of submicron particles during biomass burning and coal combustion periods in Beijing, China, Sci. Total Environ., 562, 812–821, 2016.
Zhang, Q., Stanier, C. O., Canagaratna, M. R., Jayne, J. T., Worsnop, D. R., Pandis, S. N., and Jimenez, J. L.: Insights into the chemistry of new particle formation and growth events in Pittsburgh based on aerosol mass spectrometry, Environ. Sci. Technol., 38, 4797–4809, 2004.
Zhang, R. Y., Khalizov, A., Wang, L., Hu, M., and Xu, W.: Nucleation and growth of nanoparticles in the atmosphere, Chem. Rev., 112, 1957–2011, https://doi.org/10.1021/cr2001756, 2012.