the Creative Commons Attribution 4.0 License.
the Creative Commons Attribution 4.0 License.
 | 30 Nov 2018
Surface–atmosphere exchange of inorganic water-soluble gases and associated ions in bulk aerosol above agricultural grassland pre- and postfertilisation
Robbie Ramsay
Chiara F. Di Marco
Mathew R. Heal
Marsailidh M. Twigg
Nicholas Cowan
Matthew R. Jones
Sarah R. Leeson
William J. Bloss
Louisa J. Kramer
Leigh Crilley
Matthias Sörgel
Meinrat Andreae
The increasing use of intensive agricultural practices can lead to damaging consequences for the atmosphere through enhanced emissions of air pollutants. However, there are few direct measurements of the surface–atmosphere exchange of trace gases and water-soluble aerosols over agricultural grassland, particularly of reactive nitrogen compounds. In this study, we present measurements of the concentrations, fluxes and deposition velocities of the trace gases HCl, HONO, HNO3, SO2 and NH3 as well as their associated water-soluble aerosol counterparts Cl−, , , and as determined hourly for 1 month in May–June 2016 over agricultural grassland near Edinburgh, UK, pre- and postfertilisation. Measurements were made using the Gradient of Aerosols and Gases Online Registrator (GRAEGOR) wet-chemistry two-point gradient instrument. Emissions of NH3 peaked at 1460 3 h after fertilisation, with an emission of HONO peaking at 4.92 occurring 5 h after fertilisation. Apparent emissions of aerosol were observed after fertilisation which, coupled with a divergence of HNO3 deposition velocity (Vd) from its theoretical maximum value, suggested the reaction of emitted NH3 with atmospheric HNO3 to form ammonium nitrate aerosol. The use of the conservative exchange fluxes of tot- and tot- indicated net emission of tot-, implying a ground source of HNO3 after fertilisation. Daytime concentrations of HONO remained above the detection limit (30 ng m−3) throughout the campaign, suggesting a daytime source for HONO at the site. Whilst the mean Vd of was 0.93 mm s−1 in the range expected for the accumulation mode, the larger average Vd for Cl− (3.65 mm s−1), (1.97 mm s−1) and (1.89 mm s−1) reflected the contribution of a super-micron fraction and decreased with increasing PM2.5∕PM10 ratio (a proxy measurement for aerosol size), providing evidence – although limited by the use of a proxy for aerosol size – of a size dependence of aerosol deposition velocity for aerosol chemical compounds, which has been suggested from process-orientated models of aerosol deposition.
- Article
(6108 KB) - Full-text XML
- BibTeX
- EndNote


As the demand for food production grows in line with an increasing global population, so too does the development of intensive agricultural practices. These can have deleterious impacts on the environment and human health (Godfray et al., 2010; Foley et al., 2011), particularly through the emission of trace gases and the formation of airborne particles generated by their reactive chemistry. It is therefore important that measurements be made of the surface–atmosphere exchange of trace gases and associated aerosol compounds to quantify the emissions from – and deposition to – land used for agriculture, in order to quantify the impact of agricultural activities on the atmosphere and environment. Such studies can inform the development of abatement strategies and legislation designed to control emissions from agricultural activities. This also provides important process understanding to represent better the dry deposition processes in chemistry and transport models used to predict air quality and climate change.
Of particular importance to the surface–atmosphere exchange over agricultural land is the formation of atmospheric reactive nitrogen (Nr) compounds. These include the gases ammonia (NH3) and nitrous acid (HONO), the latter of which, together with nitric acid (HNO3), also derives from the oxidation of nitrogen oxides (NOx) emitted by combustion sources. NH3 and HNO3, and their aerosol equivalents and , are the primary contributors to atmospheric reactive nitrogen (Nr) dry deposition (Andersen and Hovmand, 1999). The majority of NH3 emissions originate from agricultural sources, either from direct point sources from the application of N-containing fertilisers or from long-term sources from livestock (Behera et al., 2013). The use of urea as a fertiliser is associated with particularly large losses of NH3 after application, due to the action of the urease enzyme present in soil, which leads to NH3 volatilisation (Suter et al., 2013). Ferm (1998) estimate that fertiliser losses as NH3 average 14 % of the N applied. Nitrogen losses from animal waste present on grassland used for sheep grazing have also been observed (Cowan et al., 2015). While NH3 is predominantly deposited close to the source, resulting aerosol can be transported over large distances.
HNO3 is primarily formed from the oxidation of nitrogen oxides (NOx), which are principally anthropogenic in origin but also have a soil biogenic origin (Pilegaard, 2013). HNO3 is extremely water soluble and is rapidly removed from the atmosphere through deposition or by gas–particle interactions, leading to a high deposition velocity. The gas-phase equilibrium reaction of HNO3 with NH3, which is dependent upon temperature and relative humidity (RH) (Mozurkewich, 1993; Robertson et al., 2013), gives rise to ammonium nitrate (Reaction R1).
The associated condensed-phase components of ammonium () and nitrate () exist in equilibrium (as ammonium nitrate (NH4NO3)) with NH3 and HNO3. Higher temperatures and humidity favour the decomposition of NH4NO3. The emission of these Nr species and their subsequent deposition by washout (wet deposition) or uptake on the surface (dry deposition) have high spatial and temporal variability and can have critical impacts on terrestrial and aquatic ecosystems, especially those which are nitrogen limited (Galloway et al., 2003; Fowler et al., 2013).
The interaction of NH3 with HNO3 can also lead to overestimation of the HNO3 deposition rate, as the additional sink for HNO3 deposition provided for by the reaction violates the theoretical deposition rate modelled on a zero surface resistance model for HNO3. The dissociation of NH4NO3 over vegetation can induce an opposite effect, with apparent emissions of HNO3 occurring with associated high deposition rates for and (Nemitz and Sutton, 2004). The sums of the total ammonium () and of total nitrate (), however, are conservative quantities (Kramm and Dlugi, 1994), and the use of them in the measurement of exchange fluxes can help to account for the NH3-HNO3-NH4NO3 triad on overall deposition rates.
HONO is similar to HNO3 in that it can derive from oxidation of NOx precursors. Although it can be formed homogeneously in the atmosphere by the reaction of the hydroxyl radical OH with NO (Reaction R2) (Pagsberg et al., 1997), the rate of this reaction is too slow to account for measured concentrations of HONO. Similarly, the heterogeneous reaction involving the reaction of NO2 with H2O on terrestrial surfaces, while potentially a contributory source to atmospheric HONO, has also been found to be too slow to account for measured concentrations (Kleffman, 2007). HONO is photolysed during daytime, being a primary source of OH radicals depending on the source and sink mechanisms that govern its abundance (Sörgel et al., 2015). However, a growing number of field measurements of non-zero HONO concentrations during the day points to the presence of daytime sources (Acker et al., 2006), including the emissions of HONO from soils (Su et al., 2011; Oswald et al., 2013; Scharko et al., 2015).
As the primary basic gas in the atmosphere, NH3 also reacts with trace acidic gases, such as hydrogen chloride (HCl) and sulfuric acid (H2SO4). The products of these reactions give rise to the aerosols ammonium chloride (NH4Cl) and ammonium sulfate ((NH4)2SO4), which along with NH4NO3 act as scattering aerosols that alter the Earth's total albedo and contribute significantly to regional and global climate (Fiore et al., 2015). The ammonium salts make a significant contribution to inhalable particulate matter (PM) associated with human health impacts, with NH4NO3 often dominating PM pollution events in northern Europe (Vieno et al., 2014). Ammonium sulfate is particularly long lived, and its transport and subsequent deposition to surfaces such as agricultural soils can affect plant health (van der Eerden et al., 1992) and lower soil pH (Elliott et al., 2006).
The dry deposition of the acidic gases themselves can also induce soil acidification, which on agricultural soils can limit the growth of crops through perturbation of the uptake of nutrients. HCl, like HNO3, is highly water soluble; is deposited quickly to the surface; and consequently has a high deposition velocity. It can be formed by the reaction of other acidic gases, such as HNO3 and SO2, with sodium chloride found in sea spray (Pio and Harrison, 1987) SO2, which is the precursor for H2SO4 in the atmosphere and is primarily anthropogenic in origin, being emitted via the burning of fossil fuels that contain sulfur.
Measurements of trace gases and associated aerosols are, however, restricted by the availability of appropriate instrumentation, complications in their measurement due to their reactivity and water solubility, and the potential interference of gas–particle interactions.
Techniques to measure concentrations and fluxes of these trace gas and associated aerosol components require multispecies quantification, low detection limits and fast temporal resolution. Eddy covariance, the most direct micrometeorological technique for the measurement of trace gas fluxes, requires fast-response sensors that are not available for some species (such as HNO3) or are limited by the time-response and potential for chemical interferences of the inlet (Neuman et al., 1999). While eddy covariance has been used to measure NH3 concentrations using laser absorption spectroscopy, such as through the use of quantum cascade lasers (QCLs) (Famulari et al., 2004; Zöll et al., 2016), inter-comparisons with more established techniques are still lacking.
The aerodynamic gradient method (AGM) derives fluxes of a tracer from its vertical concentration gradient, which can be obtained from concentration measurements at two or more heights, avoiding the requirement for fast response measurement. Developments in automated wet-chemistry instrumentation have in turn led to the development of the Gradient of Aerosols and Gases Online Registrator (GRAEGOR), a two-point gradient system that measures the concentrations of HCl, HONO, HNO3, SO2 and NH3 as well as their associated aerosol counterparts Cl−, , , and (Thomas et al., 2009). One of the advantages of the modified aerodynamic gradient method is the ability to determine the deposition velocities (Vd) of chemical tracers, provided the flux and concentration at a reference height have been calculated. With the use of the GRAEGOR, which takes measurements of tracers at two heights over 1 h, high-resolution timescale measurements of deposition velocities can be acquired.
Other wet-chemistry instruments have also been developed to measure individual species at one height, such as the Long Path Absorption Photometer (LOPAP), which measures concentrations of HONO with fewer artefacts than the GRAEGOR (Heland et al., 2001). A comparison study between LOPAP HONO measurements and the Gas and Aerosol Collector (GAC) – an instrument which uses similar measurement techniques to the GRAEGOR – was conducted by Dong et al. (2012), but there has not yet been a published comparison between the LOPAP and GRAEGOR in measurements of HONO. Similarly, measurements of trace gases and aerosols above agricultural grassland using the GRAEGOR are limited, and previous studies above these land systems have been restricted to measurements of a limited number of species within a limited particle size range.
The aim of this study was to use the GRAEGOR to measure concentrations and fluxes of the trace gases HCl, HONO, HNO3, SO2 and NH3 as well as their water-soluble aerosol counterparts Cl−, , , and over agricultural grassland in Scotland during a period in early summer (May–June 2016) that included a fertilisation event using urea pellets. The possible formation of NH4NO3 postfertilisation, a link between aerosol deposition velocity and size (specifically, a proxy for size based on the PM2.5∕PM10 ratio from measurements nearby), and the potential ground source formation of HONO are discussed. A further aim of this study was to undertake inter-comparisons between the measurements of HONO by the GRAEGOR and two LOPAP instruments and between measurements of NH3 recorded by a parallel quantum-cascade-laser eddy covariance system.
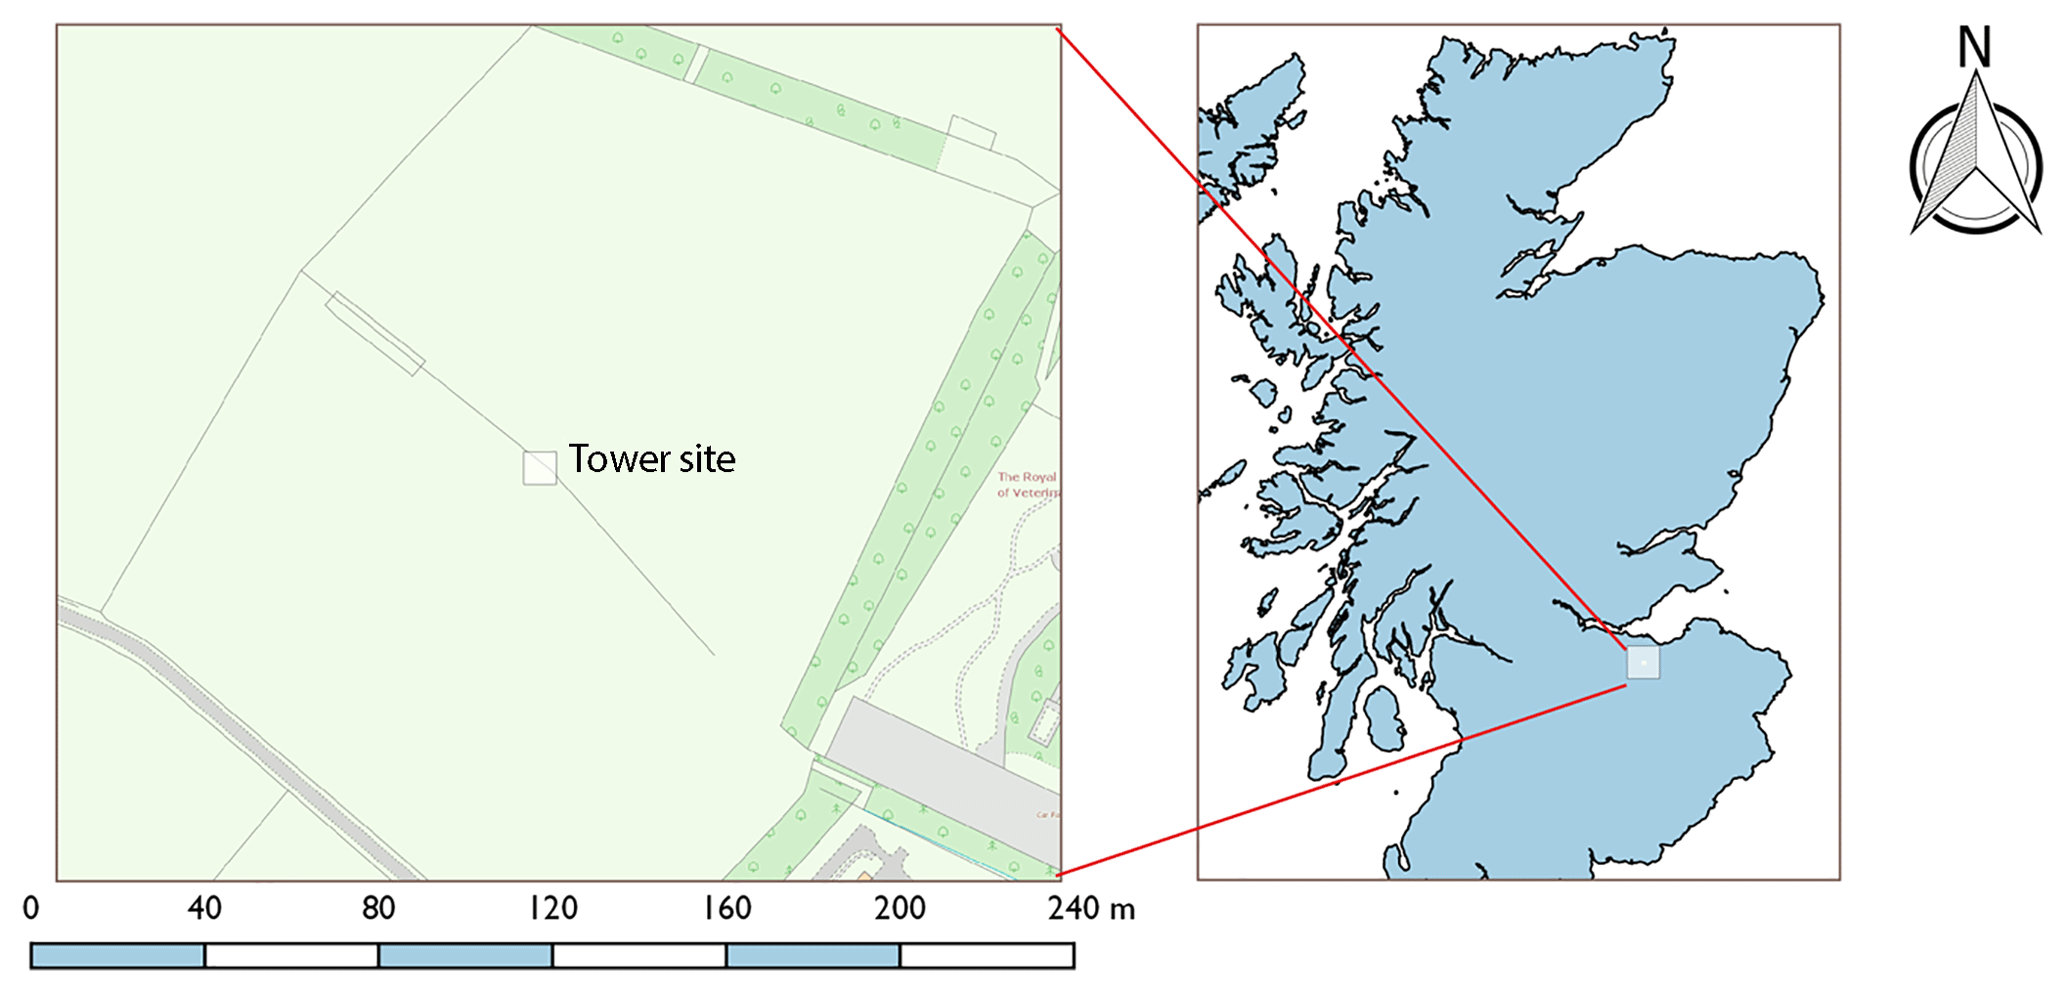
Figure 1Location of the Bush Tower site (3∘12′ W, 55∘52′ N) in relation to surrounding agricultural land and within Scotland, UK.
2.1 Easter Bush site description
The campaign was conducted during the late spring–summer 2016 (21 May–24 June) at the Easter Bush measurement site (3∘12′ W, 55∘52′ N; 190 m above sea level), located 10 km south of Edinburgh, UK. Measurements were made at a 3 m tower situated on the boundary of two intensively managed grassland fields (hereafter referred to as the north and south field) of 16 ha total area, composed principally of Lolium perenne (perennial ryegrass) (Fig. 1). Due to the presence of the Pentland Hills close by to the west, local wind direction is channelled such that SW winds – the predominant wind direction at the site – yield flux footprints over the south field, while NE winds produce flux footprints over the north field.
Both fields are used for year-round (although not continuous) sheep grazing, in rotation with adjacent fields, but the south field also typically has an annual cutting for silage. Mineral fertilisation is carried out twice a year on both fields. During this study, fertilisation of the two fields occurred between 08:00 and 09:00 on 13 June, using urea mineral fertiliser at a rate of 69.9 kg N ha−1. In preparation for this application, sheep that had been present in the fields since April were removed from the south field on 2 June and removed from the north field on 9 June. Sheep were reintroduced to the north field on 21 June.
Over the years the Easter Bush field site has hosted several long-term measurements of CO2, CH4 and NO2 and has participated in a number of international projects, such as GRAMINAE (GRassland AMmonia INteractions Across Europe) (Sutton et al., 2009), Greengrass (Soussana et al., 2007) and NitroEurope (Sutton et al., 2007). It has also supported several individual campaigns of trace gas measurements (Di Marco et al., 2004; Famulari et al., 2004; Jones et al., 2017). In particular, fluxes of NH3 were measured over an 18-month period (Milford et al., 2001) and the GRAEGOR was operated during a period of manure application (Twigg et al., 2011).
2.2 Instrumentation
2.2.1 Gradient of Aerosols and Gases Online Registrator
The GRAEGOR (Energy Research Centre of the Netherlands) is a wet-chemistry instrument that measures the concentrations of reactive trace gases (HCl, HONO, HNO3, SO2 and NH3) and water-soluble aerosols (Cl−, , , and ) continuously, semi-autonomously and with online analysis at hourly resolution (Thomas et al., 2009; Wolff et al., 2010b). The instrument consists of two sampling boxes placed at two heights (during this campaign, z1=0.6 m, z2=2.4 m), from which concentration gradients and hence fluxes can be derived.
Each sample box contains a horizontal wet rotating annular denuder (WRD) (Keuken et al., 1988) and a steam jet aerosol collector (SJAC) (Khlystov et al., 1995; Slanina et al., 2001) connected in series. Air is drawn through each sample box simultaneously by an air pump at a rate of 16.7 L min−1, passing first through the WRD, which is continuously coated with a feeding solution of double-deionised water (DDI) of 18.2 MΩ resistance. Trace gases within the laminar airflow are absorbed into the sorption solution which is then fed from the sample box to a detection unit located at ground level. The trace-gas-free air then passes through the SJAC, where particles within the airflow are mixed with steam generated from the DDI water feeding solution, precipitating a supersaturation event causing the water-soluble particles to grow into droplets. The enlarged droplets are separated out of the air stream by a cyclone and fed as a liquid sample to the detection unit. Liquid samples from the SJAC and WRD of each sample box are analysed for NH3/ using flow injection analysis (FIA) (Wyers, 1993; Norman et al., 2009). An ion chromatography (IC) unit equipped with a Dionex AS12 column quantifies the concentration of HONO/, HNO3/ and SO2/ based on the measured conductivity of the respective anions within the liquid sample compared to a reference standard of 50 ppb Br− added to the sample solution. Analysis by FIA and IC is carried out over 15 min, and using a flow control scheme a half-hourly averaged concentration of trace gases and water-soluble aerosols is generated for each height every hour.
A high-density polyethylene (HDPE) tube (0.3 m length, and outer diameter) with a HDPE filter is placed at the inlet of the WRD in order to minimise the loss of HNO3 and NH3 and to ensure a particle diameter cutoff of 0.2 nm. A biocide of 0.6 mL of hydrogen peroxide (30 %) is added to every 1 L of the DDI water feeding solution to prevent biological contamination in the WRD of each sample box. Airflow is controlled using a critical orifice downstream of the SJAC.
Autonomous calibration of the FIA system was carried out 24 h after the beginning of the campaign and every 72 h thereafter, giving a total of five internal calibrations of this system. Calibration was conducted using three liquid standards of 0, 50 and 500 ppb concentration. The IC unit is continuously checked for analytical performance by the addition of a liquid Br− internal standard (50 ppb concentration) to each column injection. Calibration of the IC unit was conducted twice during the campaign (23 May and 28 June, prior to and after the campaign, respectively) using a mixed ionic liquid standard consisting of 25 ppb , 20 ppb and 20 ppb Cl−.
Measurements of the airflow into the sample boxes were conducted using an independent device (TSI Mass Flowmeter 4140) once every fortnight during the campaign. Additional checks of the field performance of the instrument included daily checks of the WRD tubes and sample box air inlets for signs of visible contamination.
The GRAEGOR sampling boxes have very short inlets with no size selection. Consequently, the aerosol concentration reflects water-soluble total suspended particles (TSP). It detects any compound that dissociates to form the measured ions and therefore has a number of artefacts. These include interferences in HONO measurements through NO2, particularly during periods of high SO2 concentrations (Spindler et al., 2003); the inclusion of dinitrogen pentoxide (N2O5) concentrations in measurements of HNO3 during the nighttime measurement periods, though the magnitude of this unclear in rural environments (Phillips et al., 2013); and the potential for organic chloride compounds to be included in measurements of overall Cl− aerosol (Nemitz et al., 2000b).
The GRAEGOR has been demonstrated to be capable of measuring fluxes in a number of studies both in identical form to the one used here (Wolff et al., 2010a, b; Twigg et al., 2011) and in related variants (Nemitz and Sutton, 2004; Rumsey and Walker, 2016). Ammonia-specific instruments based on the same technology (AMANDA, GRAHAM, ECN, Petten, the Netherlands; Wyers et al., 1993) represent the most commonly used instrument for the automated measurement of ammonia fluxes.
2.2.2 Supplementary measurements
Vertical profiles of temperature were measured at the tower using fine-thread, custom-made thermocouples set at the same heights as the GRAEGOR sample boxes. Located 0.4 m from the tower, an eddy covariance system (Gill Anemometer R01012 with LI-COR-7000) at a height of 2.6 m measured three-dimensional wind speed, sensible heat flux (H), frictional velocity (u∗) and wind direction. Ongoing, long-term measurements of relative humidity (Vaisala 50/Y Humitter), global radiation (Skye Instruments SKS 110 pyranometer) and total rainfall (Campbell Scientific ARG110 tipping bucket rain gauge) were also available at the site for the campaign period. Measurements of HONO taken by a LOPAP (QUMA Elektronik & Analytik, Wuppertal, Germany) and NH3 measurements taken by a quantum cascade laser (Aerodyne Research Inc., Billerica, USA) during the campaign period were used for comparison studies with GRAEGOR measurements. Measurements of NO2 concentration, used in Sect. 4.4.1 to quantify an artefact in GRAEGOR HONO measurements, were recorded by a chemiluminescence NO2 detector (200E, Teledyne API, San Diego, California, USA) located 300 m south-east of the Easter Bush site.
2.3 Micrometeorological theory
2.3.1 Aerodynamic gradient method
The aerodynamic gradient method (AGM), based upon flux–gradient similarity theory, calculates the flux of a tracer (χ, such as a gas or aerosol species) based on its vertical concentration gradient coupled with turbulence parameters (Foken, 2008). In this paper a hybrid version of the AGM is used, in which the flux is calculated as (Flechard, 1998)
where the friction velocity (u∗) is derived from eddy covariance measurements with a sonic anemometer; κ is the von Karman constant (κ=0.41); z2 and z1 are the heights of the sample boxes; d is the displacement height; and ζ is a dimensionless stability parameter expressing the ratio (, where L is the Obukhov length, a measure for atmospheric stability. The parameter ΨH, an integrated form of the heat stability correction term, accounts for deviations from the log-linear profile under non-neutral stratification. By convention, negative and positive flux values denote deposition and emission, respectively.
2.3.2 Choice of displacement height, d, value
A temperature gradient profile for the campaign was derived from measurements of air temperature at the two heights at which concentrations were measured (0.6 and 2.4 m). Sensible heat flux (H) was calculated from the temperature gradient as per Wang and Bras (1998):
where cp is the heat capacity of air, ρair is the density of air, and KH is the eddy diffusivity constant for heat. KH can be calculated as
where z is the absolute height above ground, d is the displacement height, u∗ is the friction velocity, and ΦH is the stability correction for sensible heat. Sensible heat flux and, by extension, the flux of the trace gas and aerosol species, are dependent upon the value of d. In order to ensure that the correct displacement height was chosen, the sensible heat flux based upon the temperature gradient developed from thermocouple measurements was calculated using a variety of different values for displacement height. The resulting values for the sensible heat flux were then compared through linear regression to the value for the sensible heat flux recorded by the eddy covariance system also present. A displacement height value of 0.14 m gave the closest agreement between the sensible heat fluxes derived by the aerodynamic gradient approach and eddy covariance, with a linear regression slope of 0.997 and R2=0.945.
2.3.3 Determination of dry deposition velocities
The dry deposition velocity (Vd) of a tracer is the negative ratio of its flux to its concentration (χ) at height z−d:
The Vd for gas species may also be expressed as the reciprocal of the total resistance for deposition, which is composed of Ra (the aerodynamic resistance), Rb (the quasi-laminar boundary layer resistance) and Rc (the canopy resistance) as per the resistance analogy for dry deposition (Fowler and Unsworth, 1979; Wesely et al., 1985). Ra and Rb were calculated from Eqs. (5) and (6) using meteorological measurements taken at the site using (Garland, 1977)
where B−1, B being the Stanton number, is parameterised by the turbulent Reynolds number, Re∗ (the ratio of the frictional force to the kinematic velocity of air) and the Schmidt number, Sc (the ratio of kinematic velocity of air to the molecular diffusivity coefficient of the gas species):
If Ra and Rb are calculated from measurements, Rc can be inferred via
For gases, a theoretical maximum deposition velocity can be calculated when it is assumed that the gas is completely absorbed by the canopy (i.e. for Rc=0):
The canopy resistance approach can only describe deposition and fails when the exchange of a gas is bidirectional, such as is often the case with NH3. In this case, the canopy compensation point model can be adopted, which considers the surface interaction of NH3 in terms of parallel resistance pathways, composed of individual resistances such as stomatal resistance and cuticular resistance (Nemitz et al., 2000a; Flechard et al., 2007).
The gradient technique is only applicable for inert species whose flux is constant with height. Most studies of surface exchange fluxes of reactive compounds do not have the information to assess whether chemical reactions might interfere with the flux measurement, but in this study the behaviour of HNO3 and HCl allows us to draw conclusions on flux divergence (Sect. 4.2.1). Following precedence in the literature (e.g. Nemitz and Sutton, 2004) we initially evaluate fluxes assuming that chemistry can be ignored, and then discuss the validity of this discussion based on the results.
2.3.4 Limits of detection and estimation of uncertainties in concentration measurements and flux calculations
The concentration limit of detection (LOD) of the instrument for each of the species measured was quantified from a field blank test. The field blank test was carried out prior to the campaign on the 20 March over 24 h by switching off the sample box air pump and sealing the air inlets, but leaving the rest of the system unaltered, as per Thomas et al. (2009). Limits of detection were then calculated as 3 standard deviations from the average background signal. Results from this test are presented in Table 1, expressed as LOD values for each trace gas and corresponding water-soluble aerosol species.
Table 1Limit of detection (LOD, determined as 3 standard deviations from average baseline signal), mean (μA), median (μM), min, max and arithmetic standard deviation (σA) for concentrations measured at 2.4 m for trace gas and water-soluble aerosols measured during the Easter Bush campaign, calculated from hourly data. Number of measurements (N) for each compound is also shown.
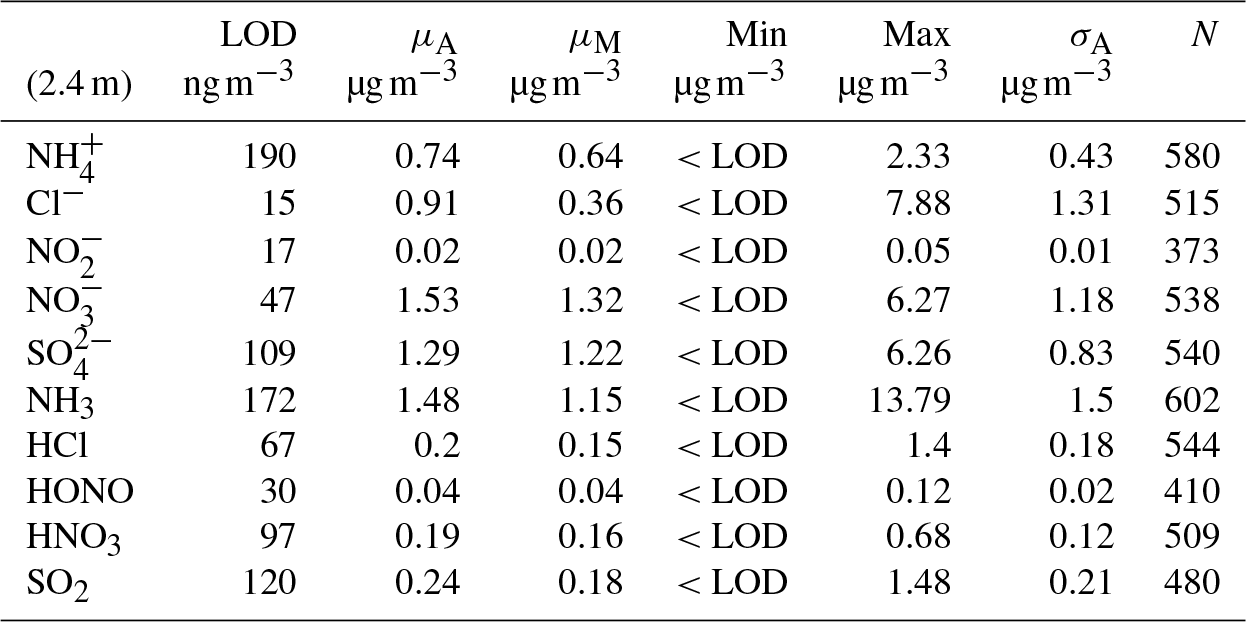
Table 2Mean (μA), median (μM), minimum and maximum values for flux, deposition velocity (Vd), maximum deposition velocity (Vmax) and canopy resistances (Rc) for trace gases measured during the Easter Bush campaign, based on hourly values. Also shown are the median relative standard error (σF), the flux limit of detection (FLOD) evaluated for typical conditions (median u∗ and median concentration) and the fraction of the hourly flux value that exceeds the flux detection limit evaluated for that hour (fLOD).
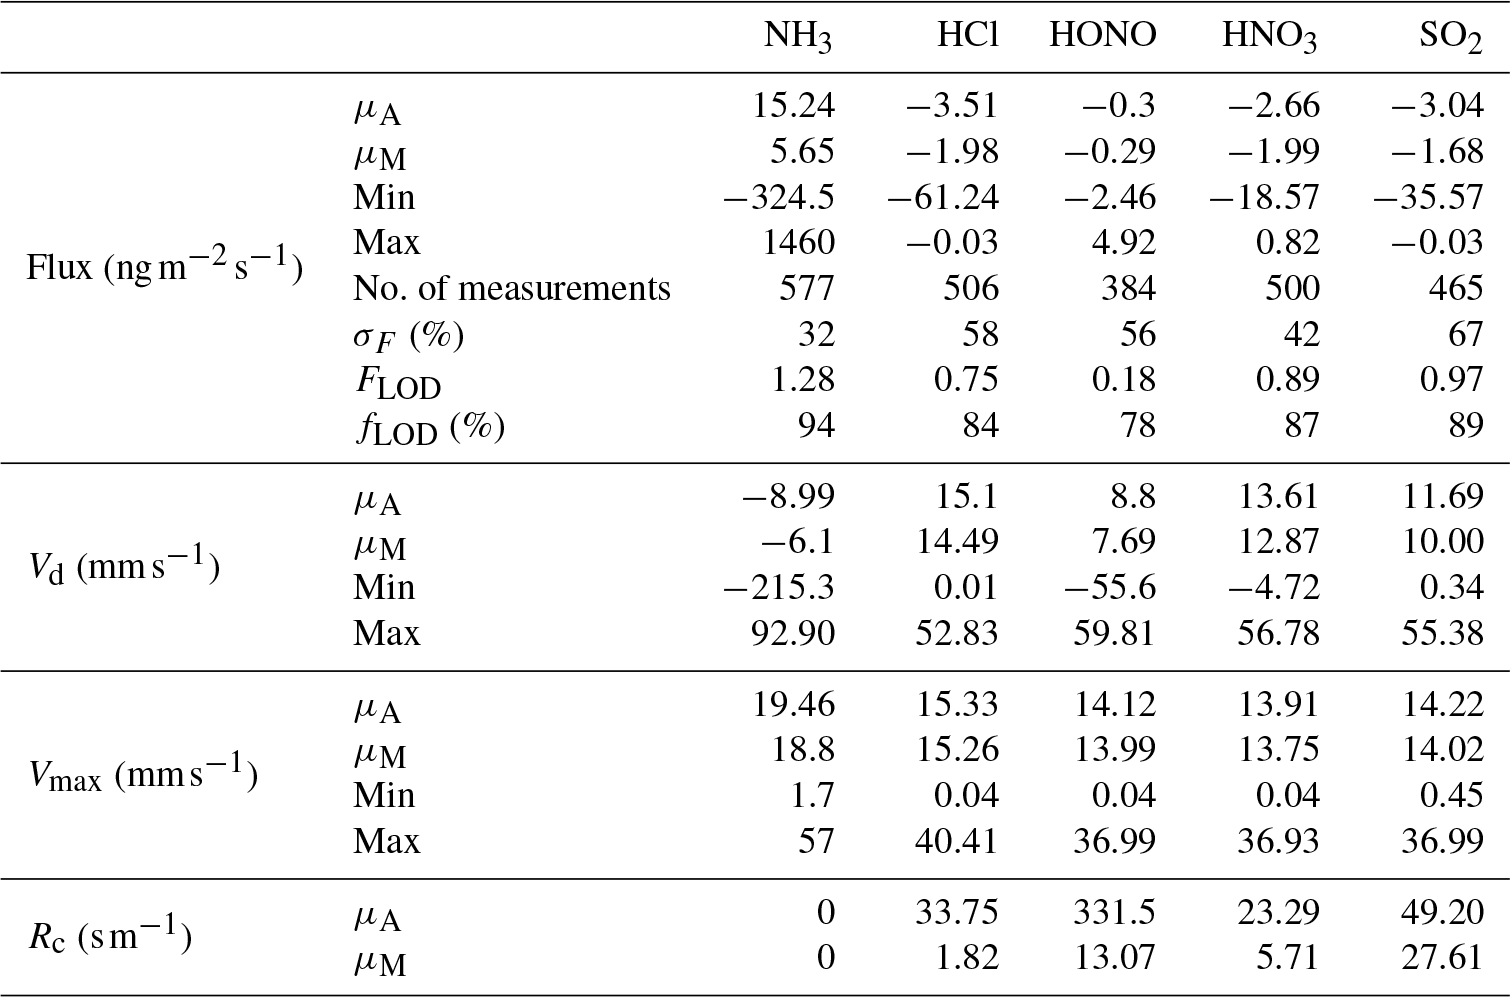
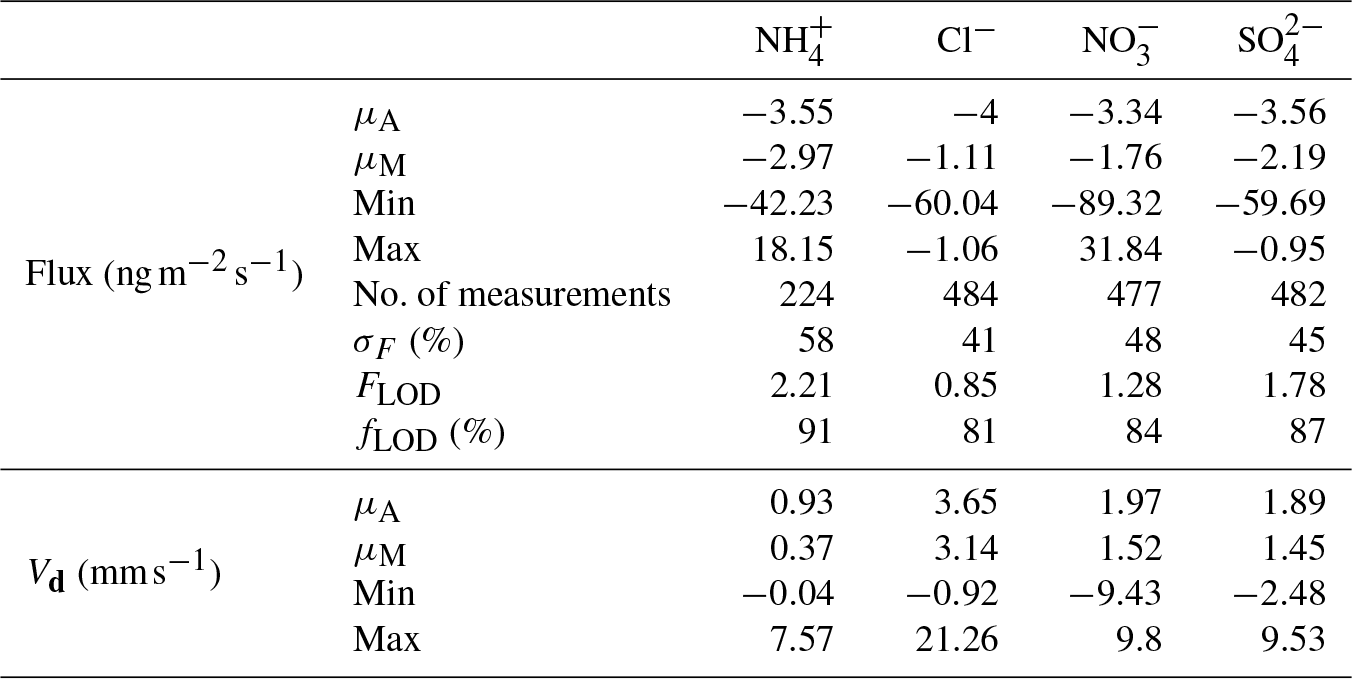
Table 3Mean (μA), median (μM), minimum and maximum values for flux and deposition velocity (Vd) for water-soluble aerosols measured during the Easter Bush campaign. Also shown are the median relative standard error (σF), the flux limit of detection (FLOD) evaluated for typical conditions (median u∗ and median concentration) and the fraction of the hourly flux value that exceeds the flux detection limit evaluated for that hour (fLOD).
The minimum detectable flux for each aerosol and gas species measured by the GRAEGOR is dependent upon atmospheric stability and the ambient concentration of the given trace gas or aerosol species. Based on the method described by Thomas et al. (2009), median minimum detectable fluxes (FLOD) were calculated for each trace gas and aerosol species measured and are detailed in Tables 2 and 3, respectively.
When calculating the flux of a species using the aerodynamic gradient method, it is apparent that errors in individual concentration measurements propagate into an error in the concentration differences and, subsequently, affect the accuracy of the calculated vertical concentration gradient. Some errors systematically affect both heights and therefore affect the gradient to a lesser extent than systemic errors in sampling efficiency at a single height, such as the difference in capture efficiency of the WRD tubes or slight differences in airflow caused by differences in the critical orifices, which may impact the accuracy of concentration measurements and resultantly affect the precision in the error of the concentration difference.
The overall random error in the measurements of the trace gas and water-soluble aerosol concentrations (σm) can be determined using a Gaussian error propagation approach, in which the concentration error is expressed as a product of several individual measurement errors with the mixing ratio, m (Trebs et al., 2004) (Eq. 9):
Here, mliq is the mixing ratio of the compounds found in the analysed liquid sample in ppb, Br(std) the stated mixing ratio of the internal Br− standard, QBr the flow rate of the internal Br− standard, mBr the analysed Br− mixing ratio and Qair the air mass flow through the system. All values have an associated standard deviation, σx. This formulation holds strictly for the species measured by ion chromatography; for NH3 and , the equation is altered by omitting the factor relating to Br− addition and substituting the factor for QBr and its associated standard deviation with the term QS, the flow of the analysed liquid sample of NH3 or .
Uncertainties for the trace gases and water-soluble aerosols measured calculated by error propagation ranged from 8 % to 18 % (3σ) throughout the campaign, varying primarily due to fluctuations in the measured flow rate and analysed concentration of the internal Br− standard.
The error in the concentration difference (σΔc) can be characterised experimentally, by placing both sample boxes at one height or – provided that the absolute difference between sample heights is small – by using one common air inlet at a specified height, with the instrument operated normally. From this side-by-side measurement, linear regression analysis accompanied by orthogonal best fit between the concentrations measured by each sample box can be conducted, with deviation from a 1:1 fit between sample heights defined as a systemic error. Using the calculated orthogonal fit equation, corrections in the concentrations can then be applied, accounting for the systemic bias (Wolff et al., 2010b). After correction using the orthogonal fit, the remaining scatter – termed the residuals – was used to determine the error in the concentration difference. During this campaign, one side-by-side measurement was conducted on 8 June for 16 h by connecting a common air inlet set at z=1.2 m between each sample box. From the results obtained, it was found that for the gases NH3, HCl, HONO, HNO3 and SO2 that deviation from the 1:1 fit resulted in a precision of measurements <4 % (3σ). For the aerosol species Cl−, and , precision was calculated as <8 % (3σ), while for it was calculated as <9 % (3σ).
Errors in flux calculations can similarly be determined through the Gaussian error propagation method applied to Eq. (1). Wolff et al. (2010b), using an analogous form of this equation, showed that total error in the flux is composed of (σΔc) and the error in the flux–gradient relationship (expressed as a transport velocity by Wolff et al., 2010b), which is dominated by the error in u∗ (σu∗).
This simplification neglects the detailed secondary errors associated with the stability correction which to quantify fully is beyond the scope of this paper.
σu∗ is dependent upon the sonic anemometer used and whether conditions are neutral or non-neutral (Foken, 2008; Nemitz et al., 2009b). For neutral conditions, and based on the sonic anemometer used, σu∗ was estimated at ≤10 %. For non-neutral conditions, σu∗ was estimated at 12 % median, which, in combination with σΔc, was used to calculate σF.
Throughout this paper, stated errors for concentration measurements are derived from the measurement uncertainty as calculated by Eq. (10), while stated errors for flux calculations are derived from the flux uncertainty as calculated by Eq. (11). Calculated errors for the uncertainty in concentration measurements, the error in the concentration difference and the error in the calculated fluxes for all species measured are similar to values determined by previous studies which have used the GRAEGOR successfully to measure flux gradients (Thomas et al., 2009; Wolff et al., 2010b; Twigg et al., 2011).
2.3.5 Data postprocessing
Concentrations that were less than 5 times the limit of detection as calculated before the campaign began (20 March) were discarded. Calculated fluxes were filtered according to a standard protocol. Fluxes were not calculated for periods of low wind speed (u<1 m s−1), low friction velocity (u<0.15 m s−1) and very stable conditions as indicated by the Obukhov length absolute value ( m). Fluxes were also discarded for periods when the wind was obstructed by the measurement cabin and other towers (, and ). Calculated fluxes which were below the minimum detectable flux value for their respective trace gas or aerosol species were discarded.
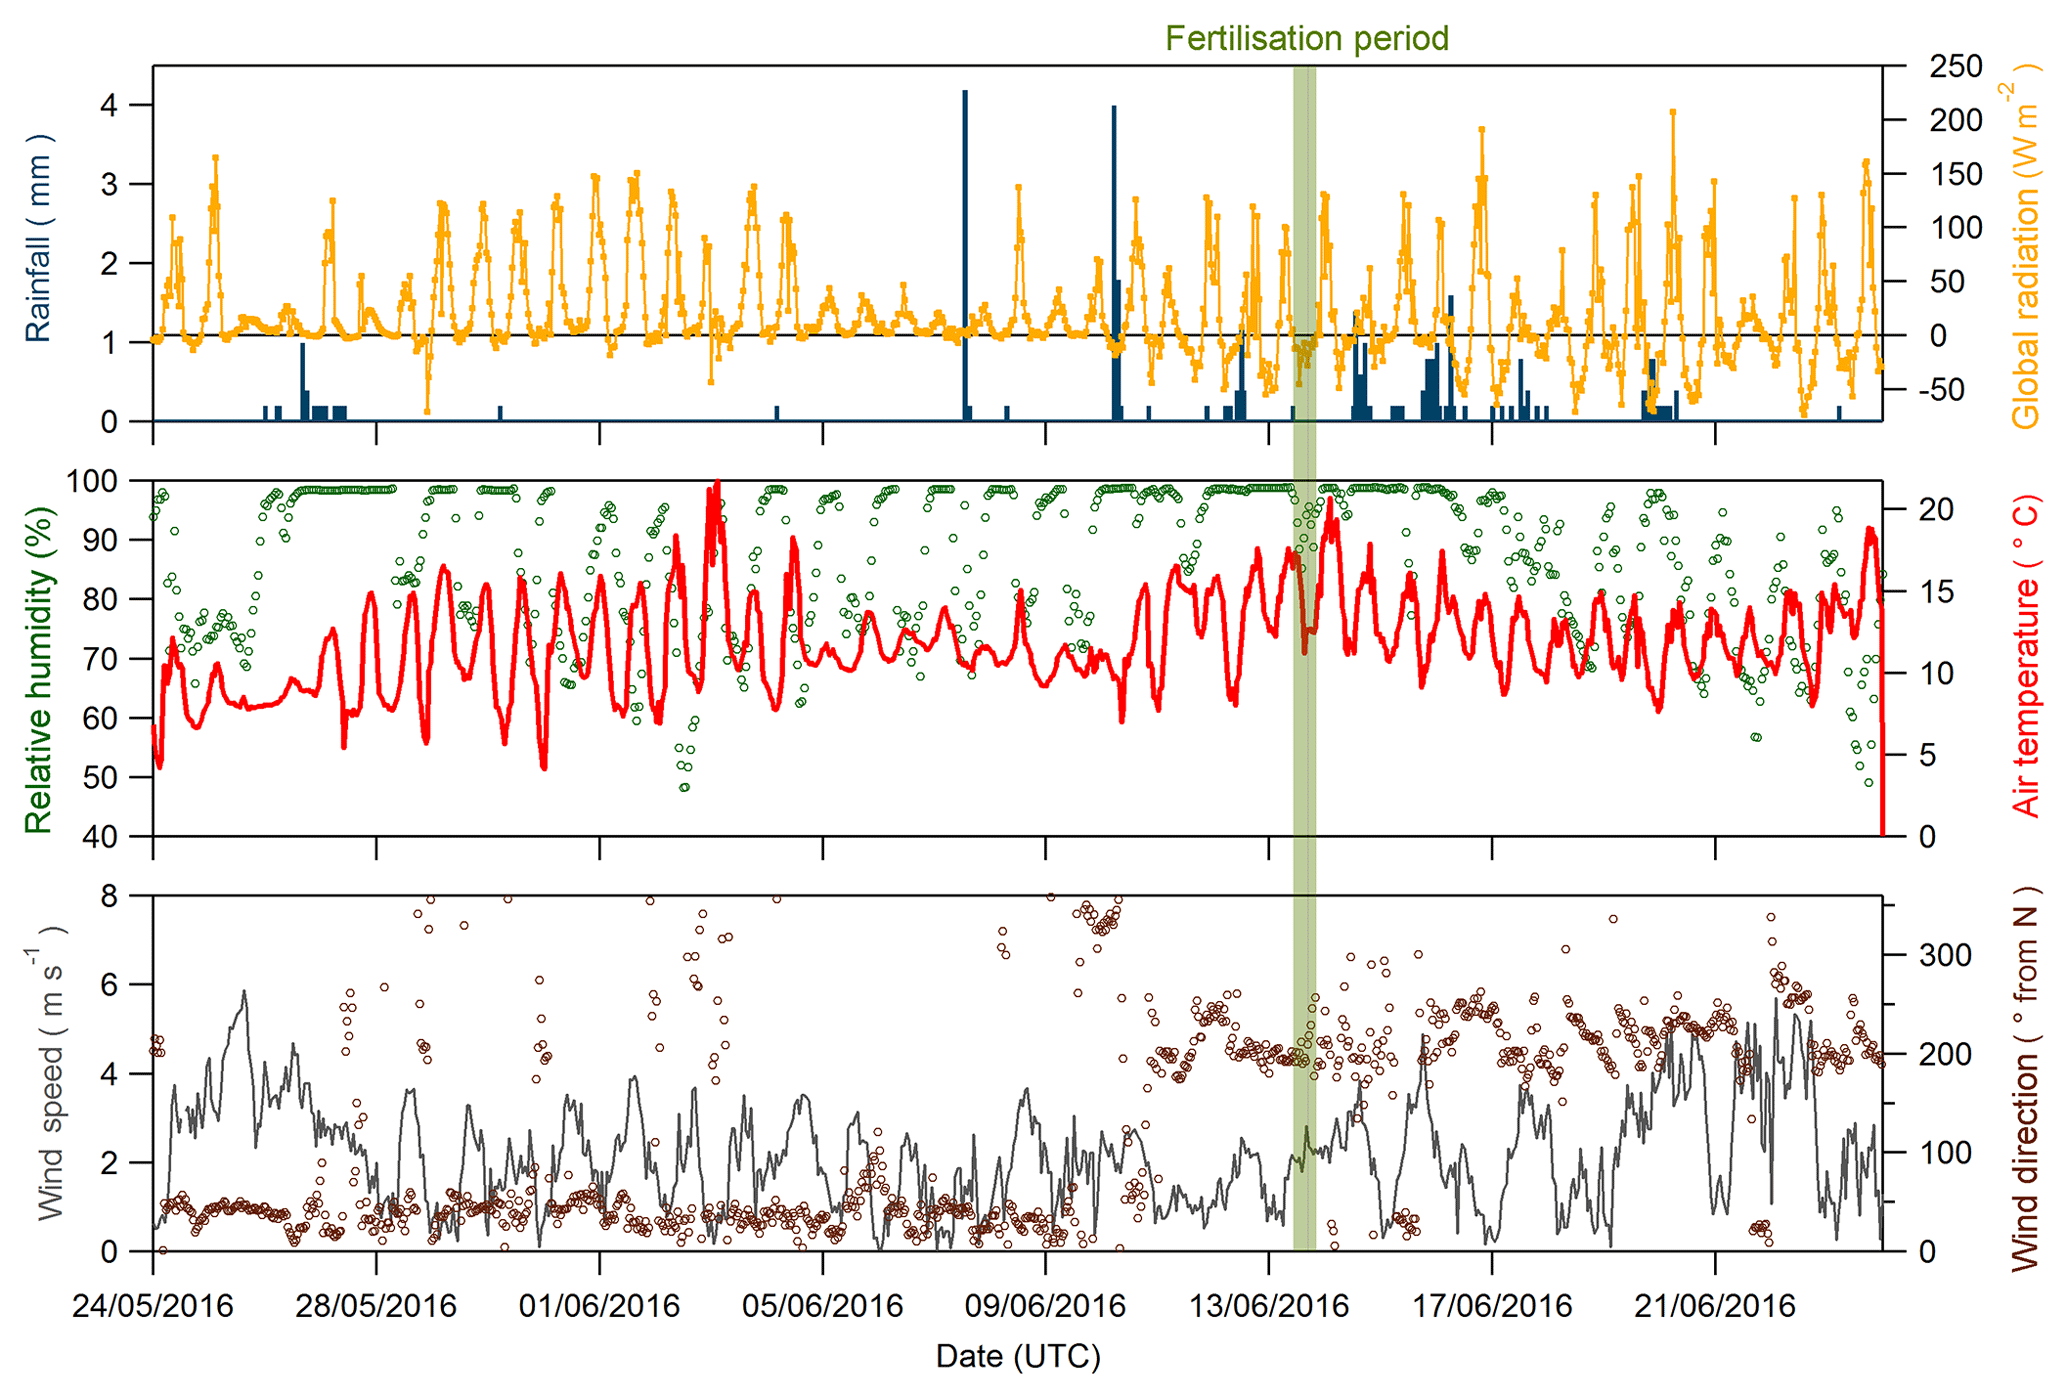
Figure 2Global radiation (orange line), rainfall (blue bars), relative humidity (green dots), air temperature (red line), wind direction (brown circles) and wind speed (grey line) recorded during the Easter Bush campaign, May to June 2016. The fertilisation period was 08:00–09:00 on 13 June and is highlighted in green.
3.1 Meteorology
Figure 2 shows time series of the rainfall, radiation, relative humidity, air temperature, and wind speed and direction measured during the campaign. The meteorology splits into two episodes. From 24 May to 5 June 2016, the dominant prevailing wind direction was north-easterly, accompanied by dry and sunny conditions with air temperature displaying a characteristic diel cycle that increased each day. Following a period of cloudier conditions from 6 to 10 June, the prevailing wind direction shifted to south-westerly for the remainder of the measurement period. Conditions became wetter and the diel air temperature amplitude was reduced. Relative humidity remained high throughout the campaign, with only occasional periods <70 %, such as 3–4 June and 21–23 June. Wind speed was variable throughout, ranging between 0.05 and 5.87 m s−1, with a median value of 2.16 m s−1. During the fertilisation period, the prevailing wind direction was from the SW, and therefore over the south field, with no precipitation but high (>90 %) relative humidity.
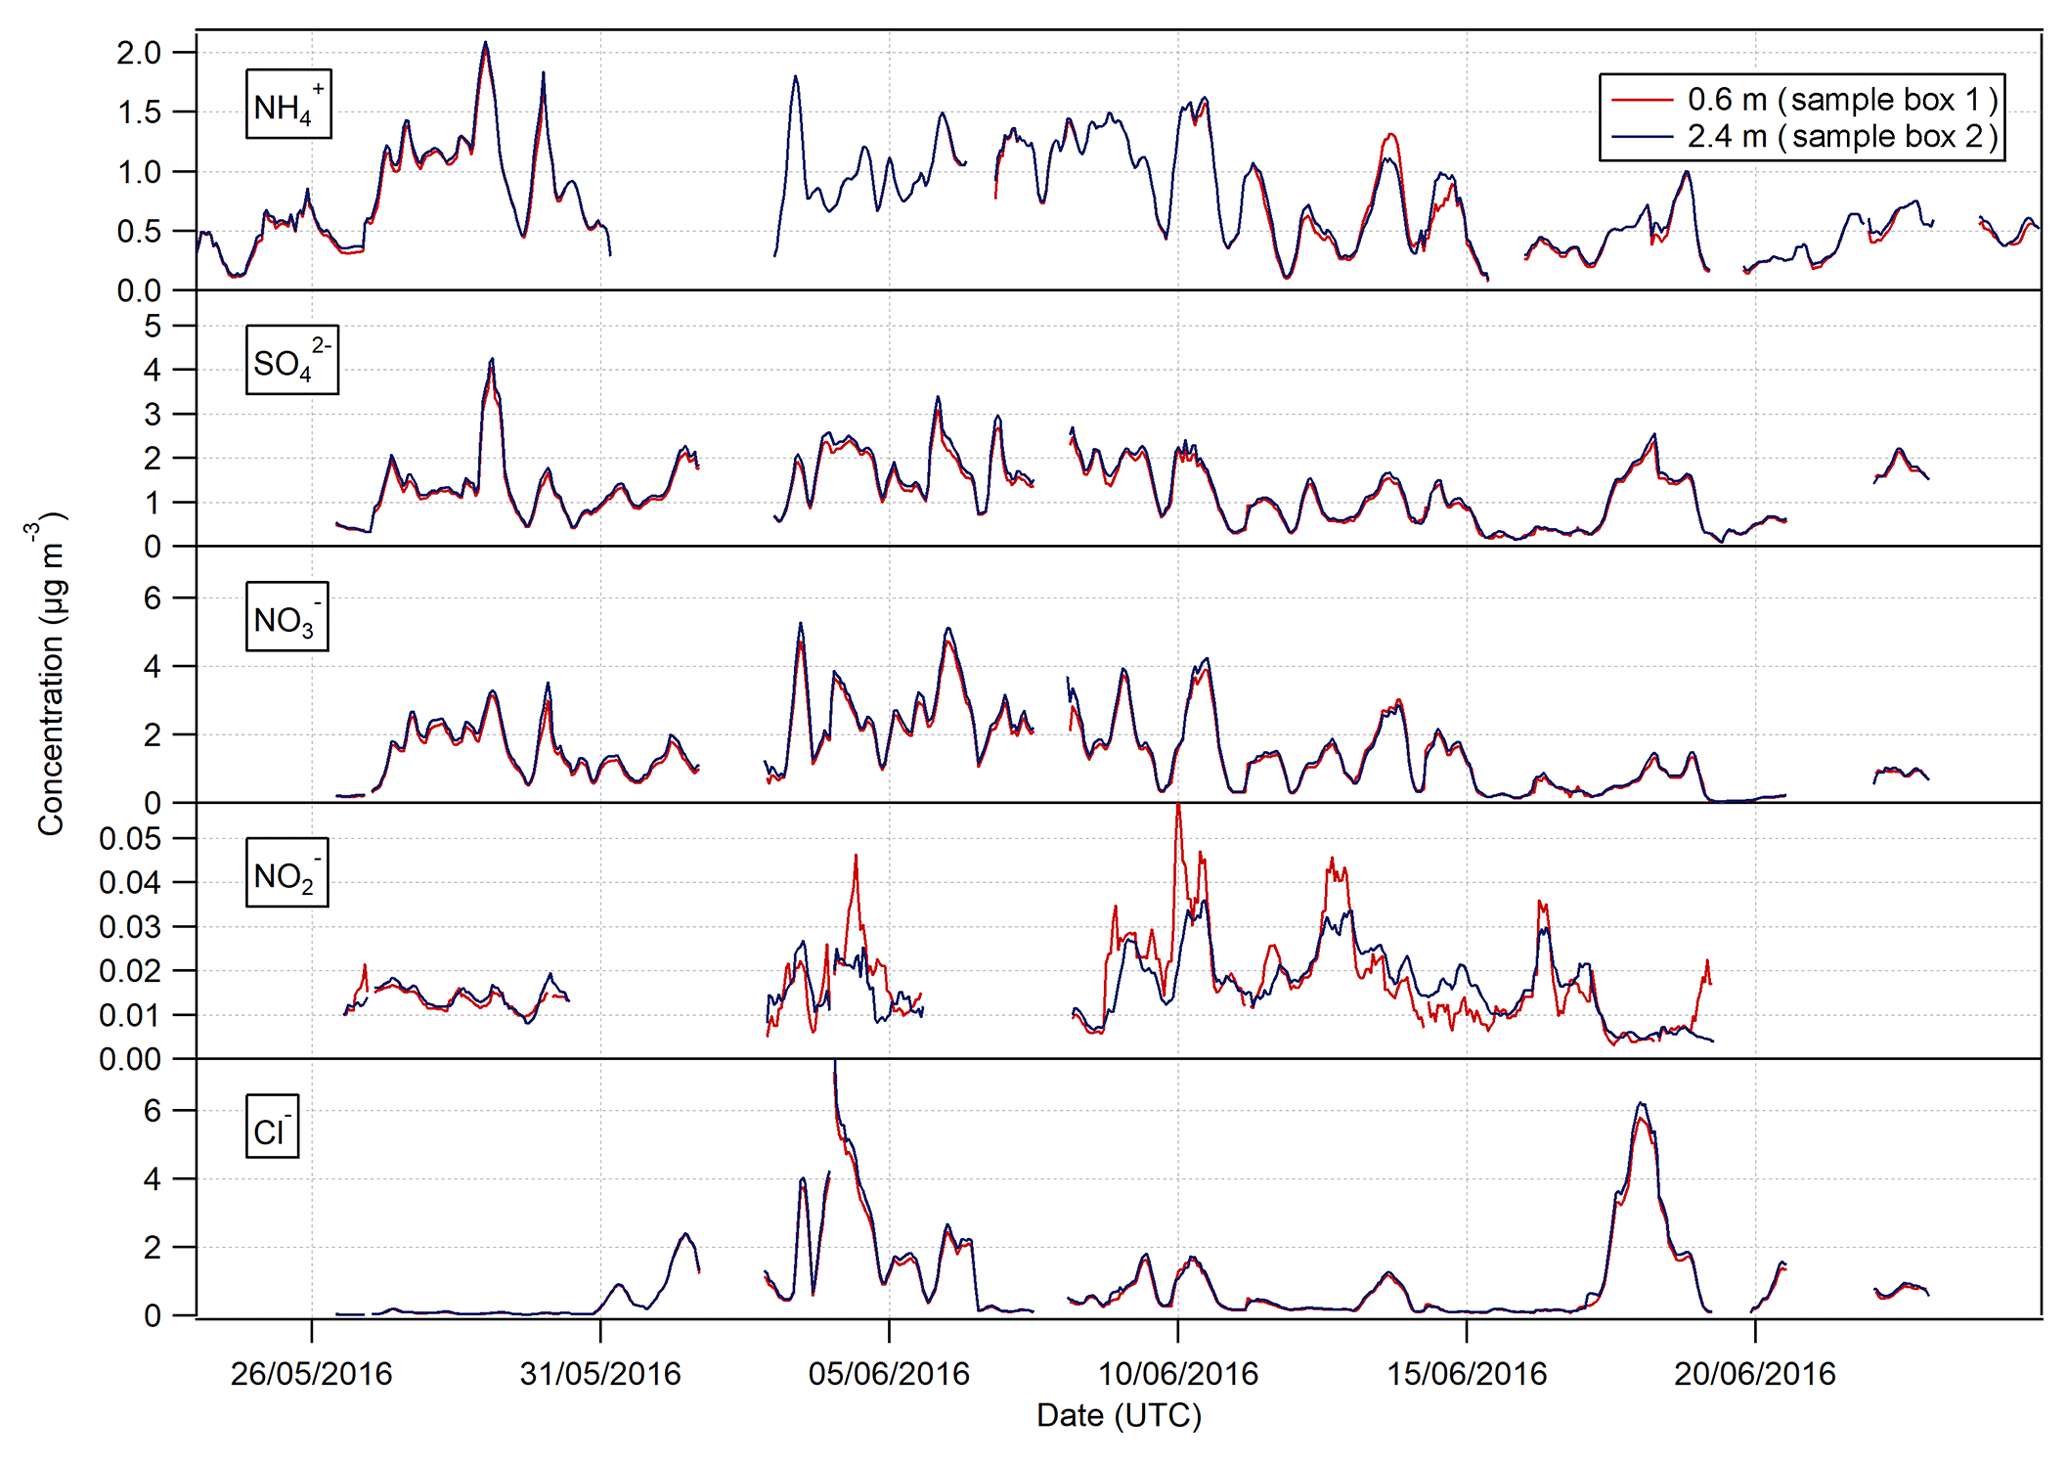
Figure 3Time series of hourly concentrations of the water-soluble aerosol species measured during the Easter Bush campaign. Results smoothed using a 5 h moving point average.

Figure 4Time series of hourly concentrations of the gaseous species measured during the Easter Bush campaign. Results smoothed using a 5 h moving point average.
3.2 Concentrations of trace gases and water-soluble aerosols
Summary statistics for the concentrations of the trace gas and water-soluble aerosol species measured at 2.4 m during the campaign are presented in Table 1. Median values for the concentrations of water-soluble aerosol species were similar to those measured in PM10 at the nearby rural background monitoring site of Auchencorth Moss (Twigg et al., 2015). The time series of the measured aerosol and trace gas concentrations are displayed in Figs. 3 and 4, respectively. Data gaps in the time series are due to in-field calibrations, poor chromatograms, or instability in liquid or airflow.
Mean concentrations of were 1.53 µg m−3 (2.4 m), whereas its gaseous counterpart, HNO3, had mean concentrations of 0.19 µg m−3 (2.4 m). The mean particulate concentrations were therefore almost 6 times greater than the gaseous HNO3 counterpart. The same dominance of particulate concentrations over gaseous SO2 concentrations was also observed.
Median concentrations of particulate Cl− were 0.37 and 0.36 µg m−3 at 0.6 and 2.4 m, respectively. The mean concentrations of Cl− were also similar at both heights at 0.89 and 0.91 µg m−3, respectively. Variation in HCl concentrations at each height was more pronounced, with a mean value of 0.16 µg m−3 at 0.6 m and 0.20 µg m−3 at 2.4 m, and a median value of 0.12 µg m−3 at 0.6 m and 0.15 µg m−3 at 2.4 m. As for particulate and gaseous HNO3, measured particulate Cl− concentrations were greater than those of gaseous HCl, by about a factor of 2 at each height.
In contrast, NH3 concentrations were larger than those of particulate ; median concentrations of NH3 were 1.15 µg m−3 (2.4 m), while median concentrations of were 0.64 µg m−3 (2.4 m). The average concentrations of NH3 were similar to those reported previously at the same site for the same time of year (Milford, 2004). Similarly, the average concentrations of HONO are higher than those of its particulate counterpart, , with median concentrations for HONO of 0.04 µg m−3 (2.4 m) and corresponding concentrations for of 0.02 µg m−3 (2.4 m), respectively.
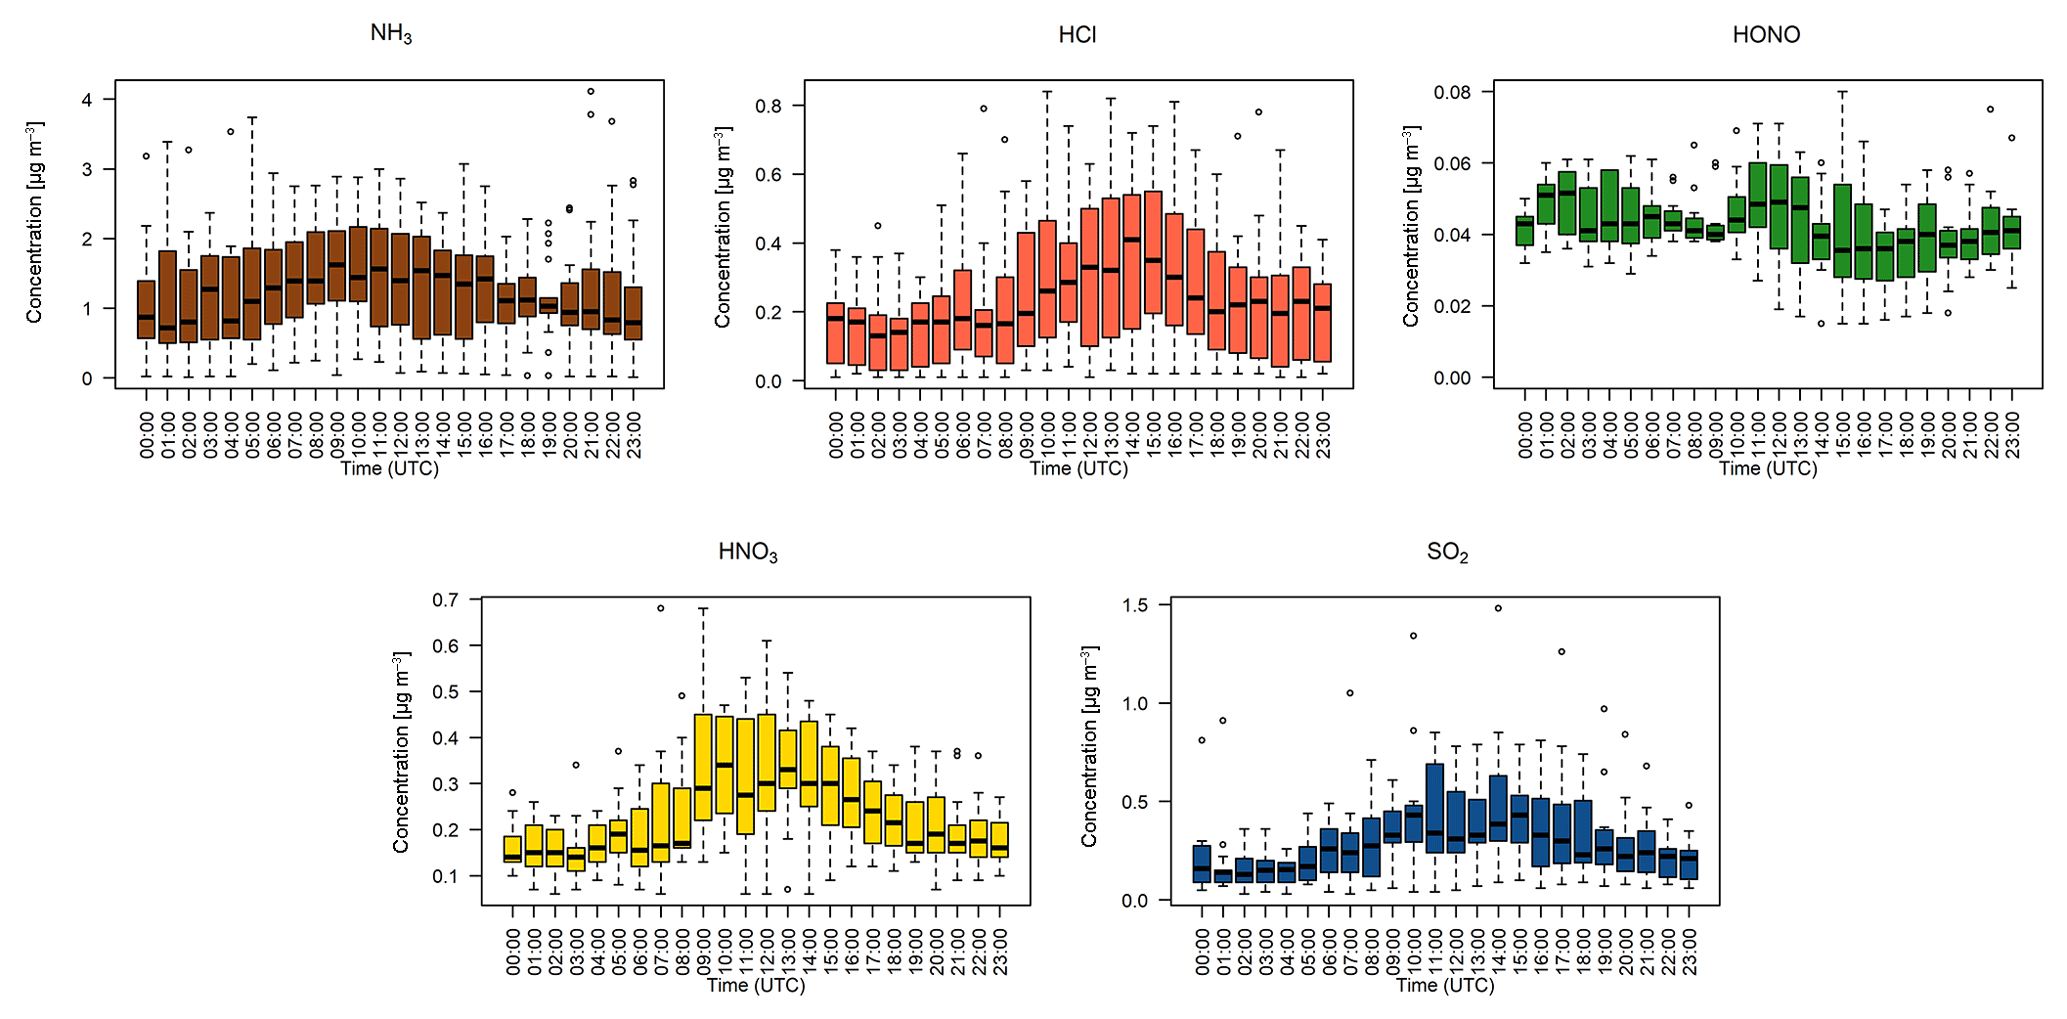
Figure 5Hourly median diel trace gas concentrations measured by the GRAEGOR at 2.4 m. Boxes show the lower and upper quartiles and whiskers the 5 % to 95 % range, with outliers shown as circles.

Figure 6Hourly median diel water-soluble aerosol concentrations measured by the GRAEGOR at 2.4 m. Boxes show the lower and upper quartiles and whiskers the 5 % to 95 % range, with outliers shown as circles.
Maximum concentrations for NH3 and HONO at 0.6 m were 21.4 and 0.15 µg m−3. At 2.4 m, the maximum concentrations for NH3 and HONO were 13.8 and 0.12 µg m−3. The maximum values at each height occurred at 11:00 on the 13 June for NH3, 1 h after fertilisation of the south field, and at 13:00 on 13 June for HONO, 4 h after fertilisation of the south field.
The time series of measurements presented in Figs. 3 and 4 show that both aerosol and trace gas concentrations are affected by prevailing meteorological conditions, with larger concentrations for each species during the drier, warmer period of 28 May to 6 June, followed by decreased concentrations from 6 to 10 June when precipitation increased and temperature decreased. Concentrations were lower – except for the peaks in NH3 and HONO after fertilisation on the 13 June – during the period from 10 June to the end of the campaign, concurrent with the change in prevailing wind direction from the NE to the SW.
The concentrations of HNO3 and SO2 showed a strong diel cycle (Fig. 4) from 26 May to 9 June, with maxima at both measurement heights occurring between 11:00 and 14:00 and minima occurring at night between 03:00 and 06:00. A similar, but weaker, inverted pattern was exhibited by their particulate counterparts, with concentrations at both heights (Fig. 3) having maxima between 02:00 and 04:00 and minima between 12:00 and 15:00.
Figure 5 shows the median diel concentrations of NH3, HCl, HONO, HNO3 and SO2 at 2.4 m prior to fertilisation. The median concentrations of HONO remained above the detection limits of the instrument even during daytime, contrary to its expected photochemistry. While concentrations of HONO peaked during nighttime and decreased during the day as incoming solar radiation increased, there remained a detectable concentration of HONO at both heights even for the measurement minima at 15:00. The median diel concentrations for HCl, HNO3 and SO2 show a shared pattern, with concentrations peaking during the day to reach a maximum between 11:00 and 14:00, followed by a decrease during the night, reaching minima between 02:00 and 04:00. The concentrations of NH3 showed little variation across the day. Figure 6 shows the median diel concentrations of , Cl−, and at 2.4 m prior to fertilisation. The median diel concentrations of reach a minimum at 16:00, with a maximum at 02:00. The concentrations of show a similar pattern of early morning median maxima (04:00) and afternoon minima (13:00). The median diel concentrations had maxima at midnight and a minimum at 16:00. The Cl− concentrations reached a maximum at 03:00 and a minimum at 13:00; however, the upper quartile range was high across all hours, with the maximum concentration of 7.88 µg m−3 recorded at 03:00 (median at this time is 0.5 µg m−3).
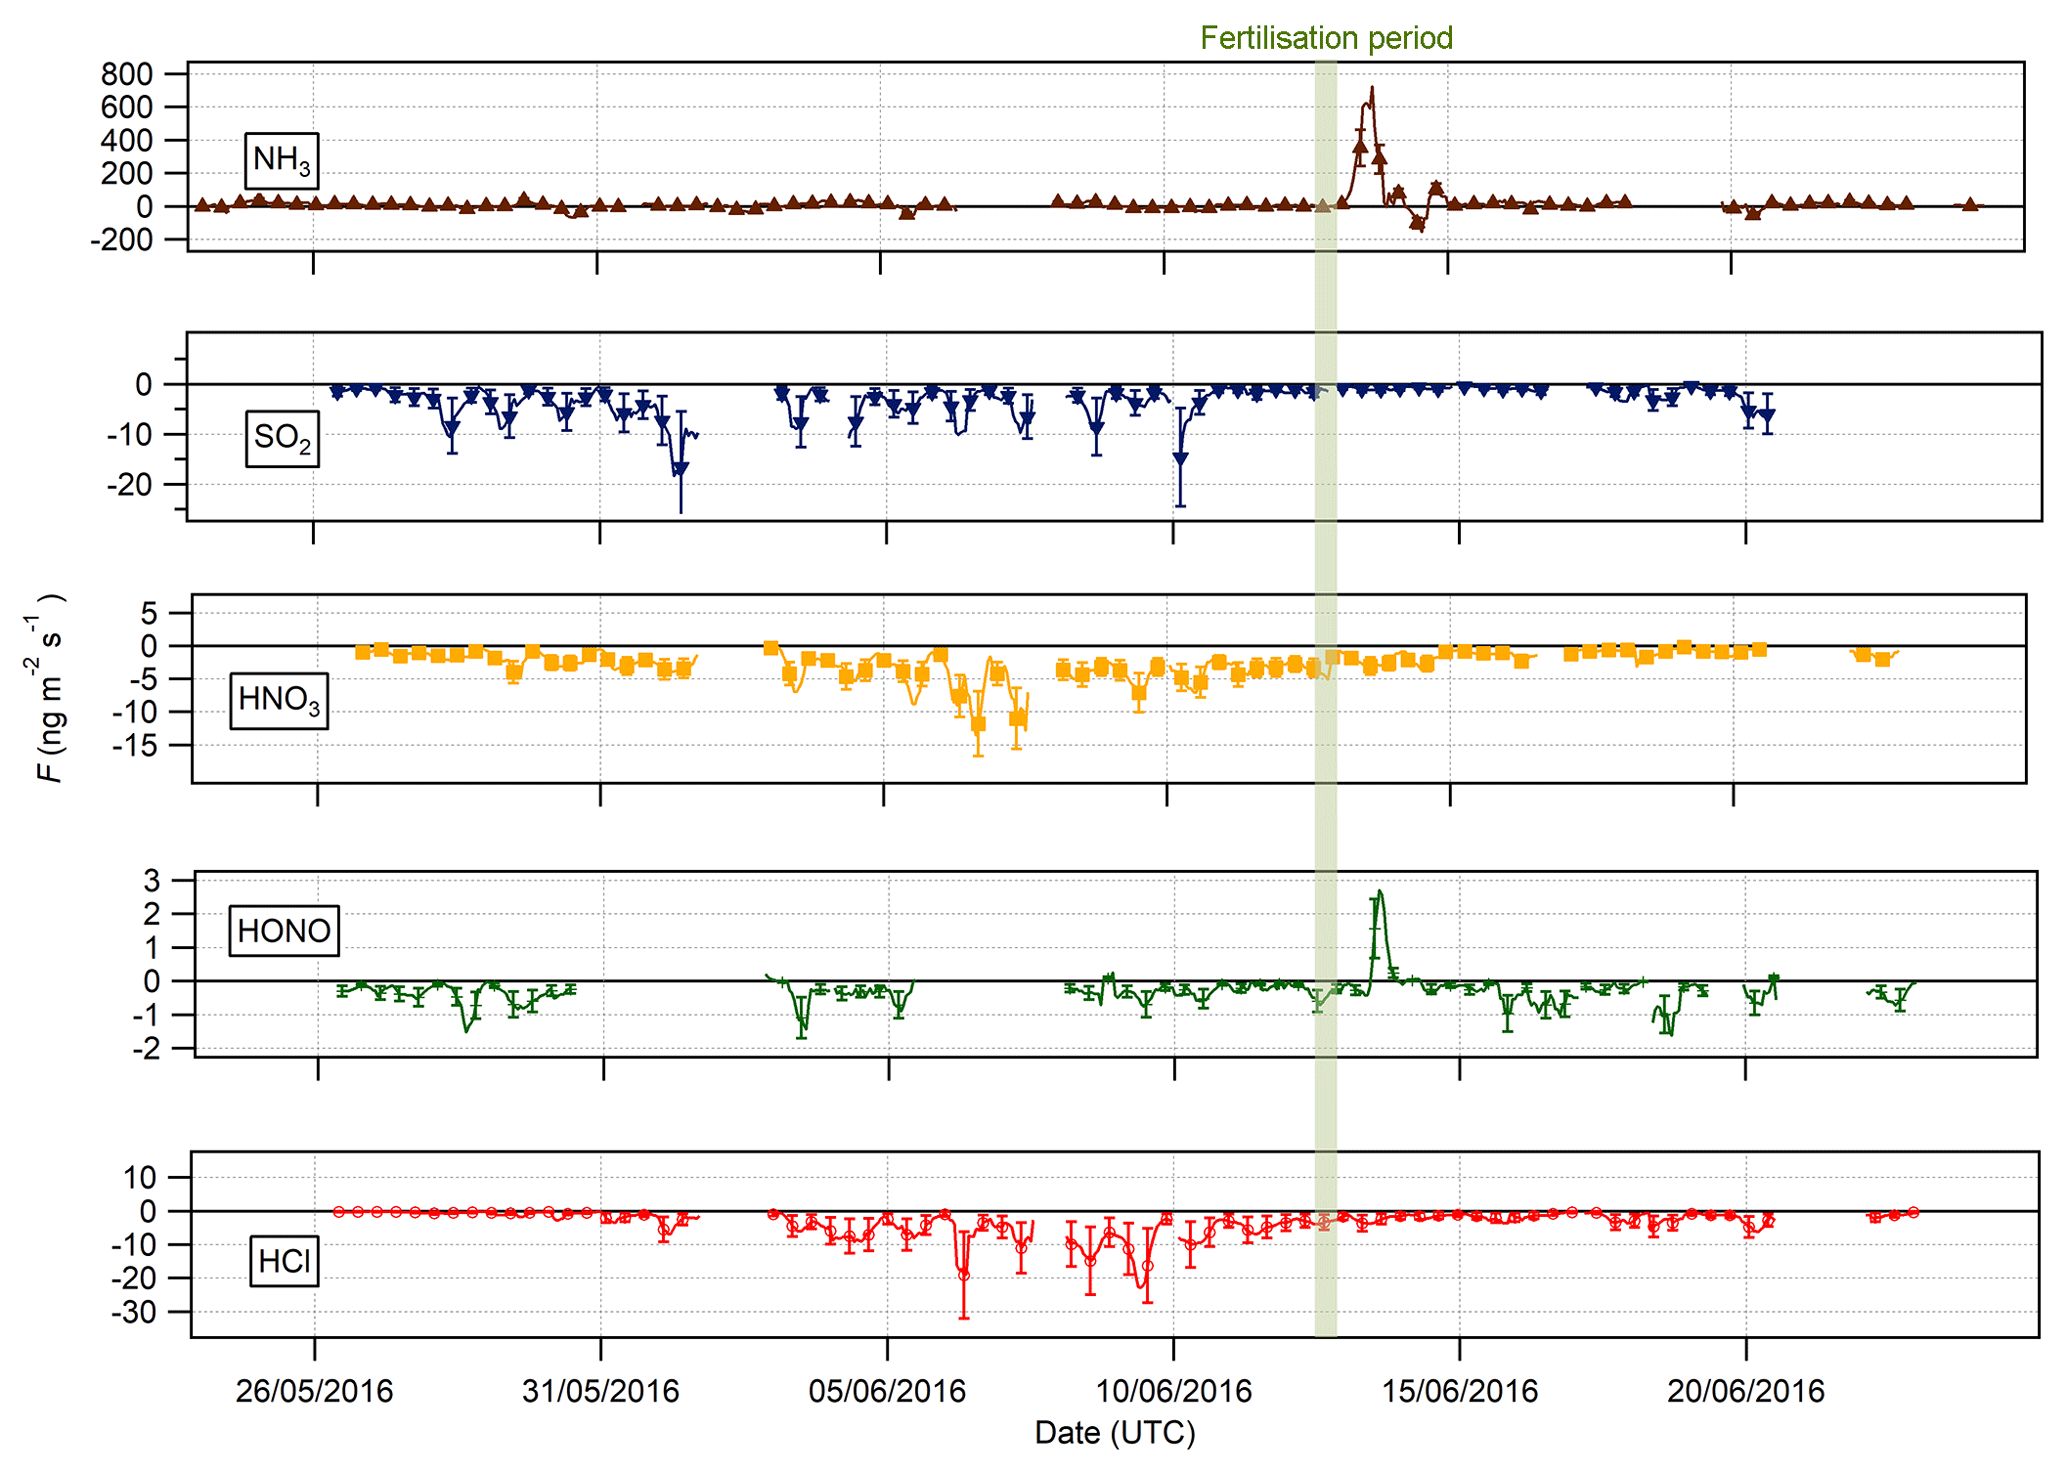
Figure 7Time series of hourly trace gas fluxes measured during the Easter Bush campaign. Results smoothed using a 5 h moving point average. The fertilisation period was 08:00–09:00 on 13 June and is highlighted in green. Flux uncertainties for each trace gas are included as error bars.
3.3 Fluxes, deposition velocities and canopy resistance
3.3.1 Fluxes of trace gases
Figure 7 shows the time series of the fluxes for the traces gases measured during the campaign. Data gaps are due to either absent data points (unpaired concentrations) or periods where data were filtered (refer to Sect. 2.3.4).
Bidirectional fluxes were present for both NH3 and HONO, with emission events for each gas occurring during the period of fertilisation of the south field. For the other trace gases – HCl, HNO3 and SO2 – the flux was unidirectional, with deposition occurring throughout the campaign. The deposition for HCl, HNO3 and SO2 varied, with larger deposition fluxes occurring during the warmer, drier periods, particularly during the period 1–8 June, and smaller deposition fluxes close to zero during the colder, wetter period at the end of the campaign (15–24 June).
Summary statistics for the trace gas fluxes, deposition velocities, theoretical maximum deposition velocities and canopy resistance values are presented in Table 2. The maximum NH3 flux was +1460 , recorded at 12:00 on 13 June, 3 h after fertilisation. The mean flux for NH3 was +15.24 , suggesting that emission was the predominant flux for NH3 during this campaign. For all other gases, the mean flux values were negative, suggesting that deposition was the net flux process overall. However, a maximum flux for HONO of +4.92 , recorded 5 h after fertilisation, highlights the bidirectional flux pattern for HONO during the campaign. The maximum HONO flux measured here was particularly large. Nitrous acid emissions have previously been reported postfertilisation of grassland using cattle slurry at the same field site ranging from +1.0 to +1.5 (Twigg et al., 2011). Table 2 also shows the median relative flux error, the typical flux detection limits (FLOD) and the fraction of 60 min flux values that exceed the FLOD of that period, based on actual concentration and turbulence. It should be noted that the uncertainty of the campaign averages is much smaller as random uncertainty reduces with the square root of the number of observation that enter the calculation of the ensemble average (e.g. Langford et al., 2015).
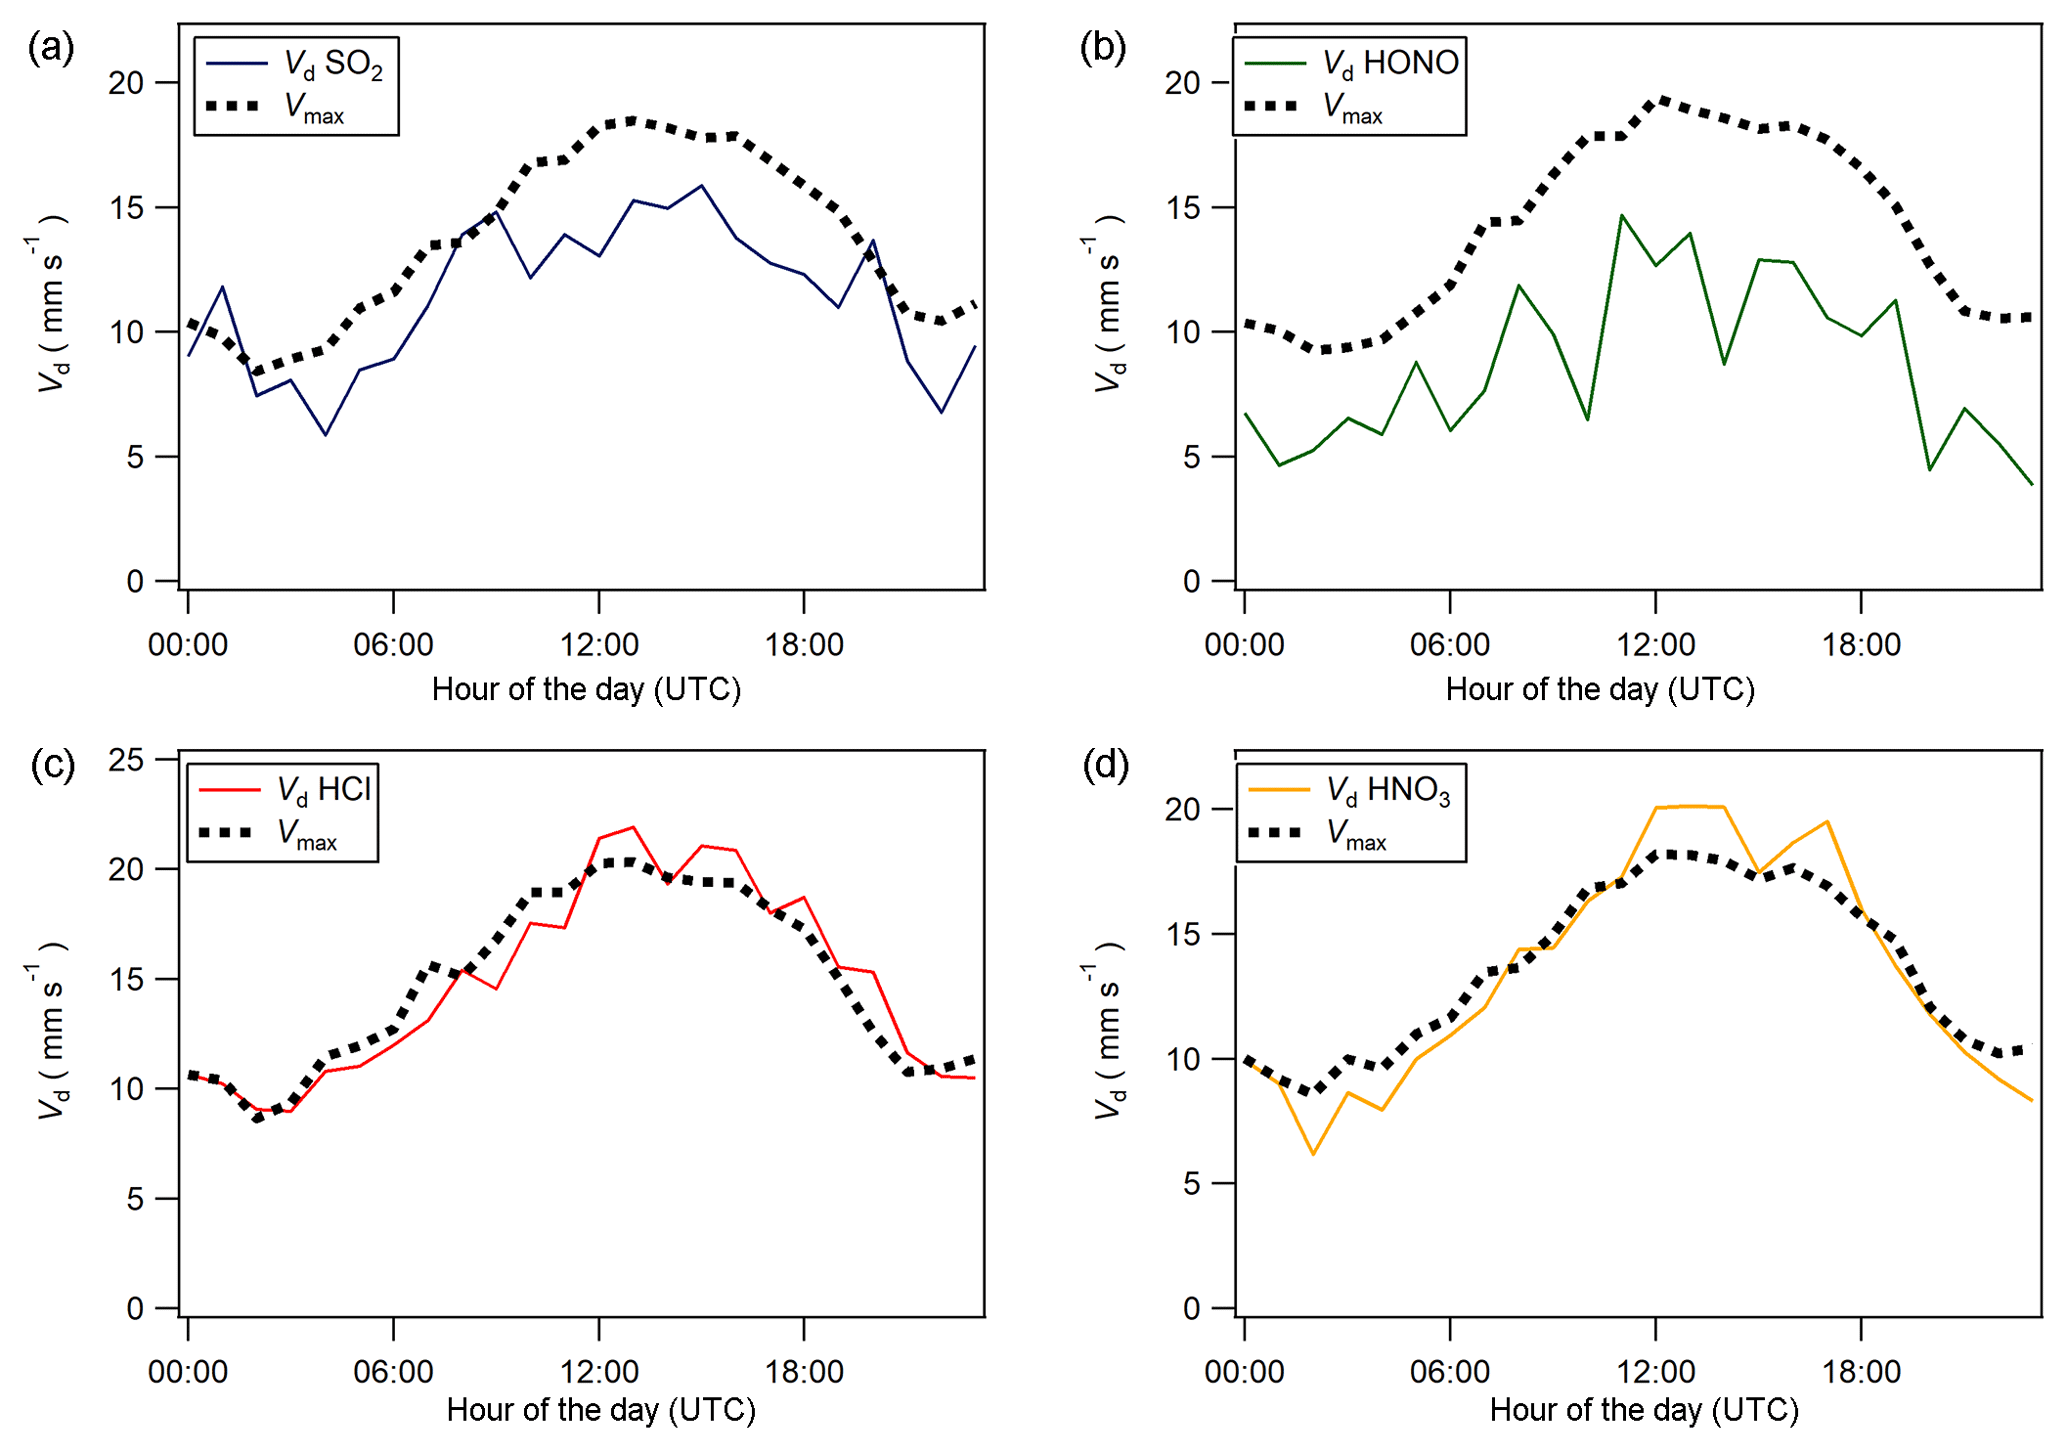
Figure 8Median diel cycles for deposition velocity (Vd) and maximum deposition velocity (Vmax) for (a) SO2, (b) HONO, (c) HCl, and (d) HNO3.
Median diel cycles for the deposition velocity and calculated theoretical maximum deposition velocity for the trace gases HCl, HONO, HNO3 and SO2 are shown in Fig. 8. The calculation of median diel values for trace gas deposition velocities and canopy resistances excludes the period of flux divergence which occurred during fertilisation. The diurnal deposition velocities for HCl and HNO3 were very close to the calculated maximum deposition velocities, which is expected as a result of their reactivity and high water solubility. The deposition velocity for SO2 is near the theoretical maximum during nighttime but is lower during daytime. The deposition velocity for HONO was consistently lower than its theoretical maximum throughout the entire day. While median values for the Vd for HNO3 are close to the values for Vmax, deposition velocities that exceeded their corresponding theoretical maximum were recorded. While most exceedances fall within the uncertainty range of the measurement, a maximum deposition velocity of 56.8 mm s−1 was recorded at 14:00 on 13 June, 4 h after fertilisation.
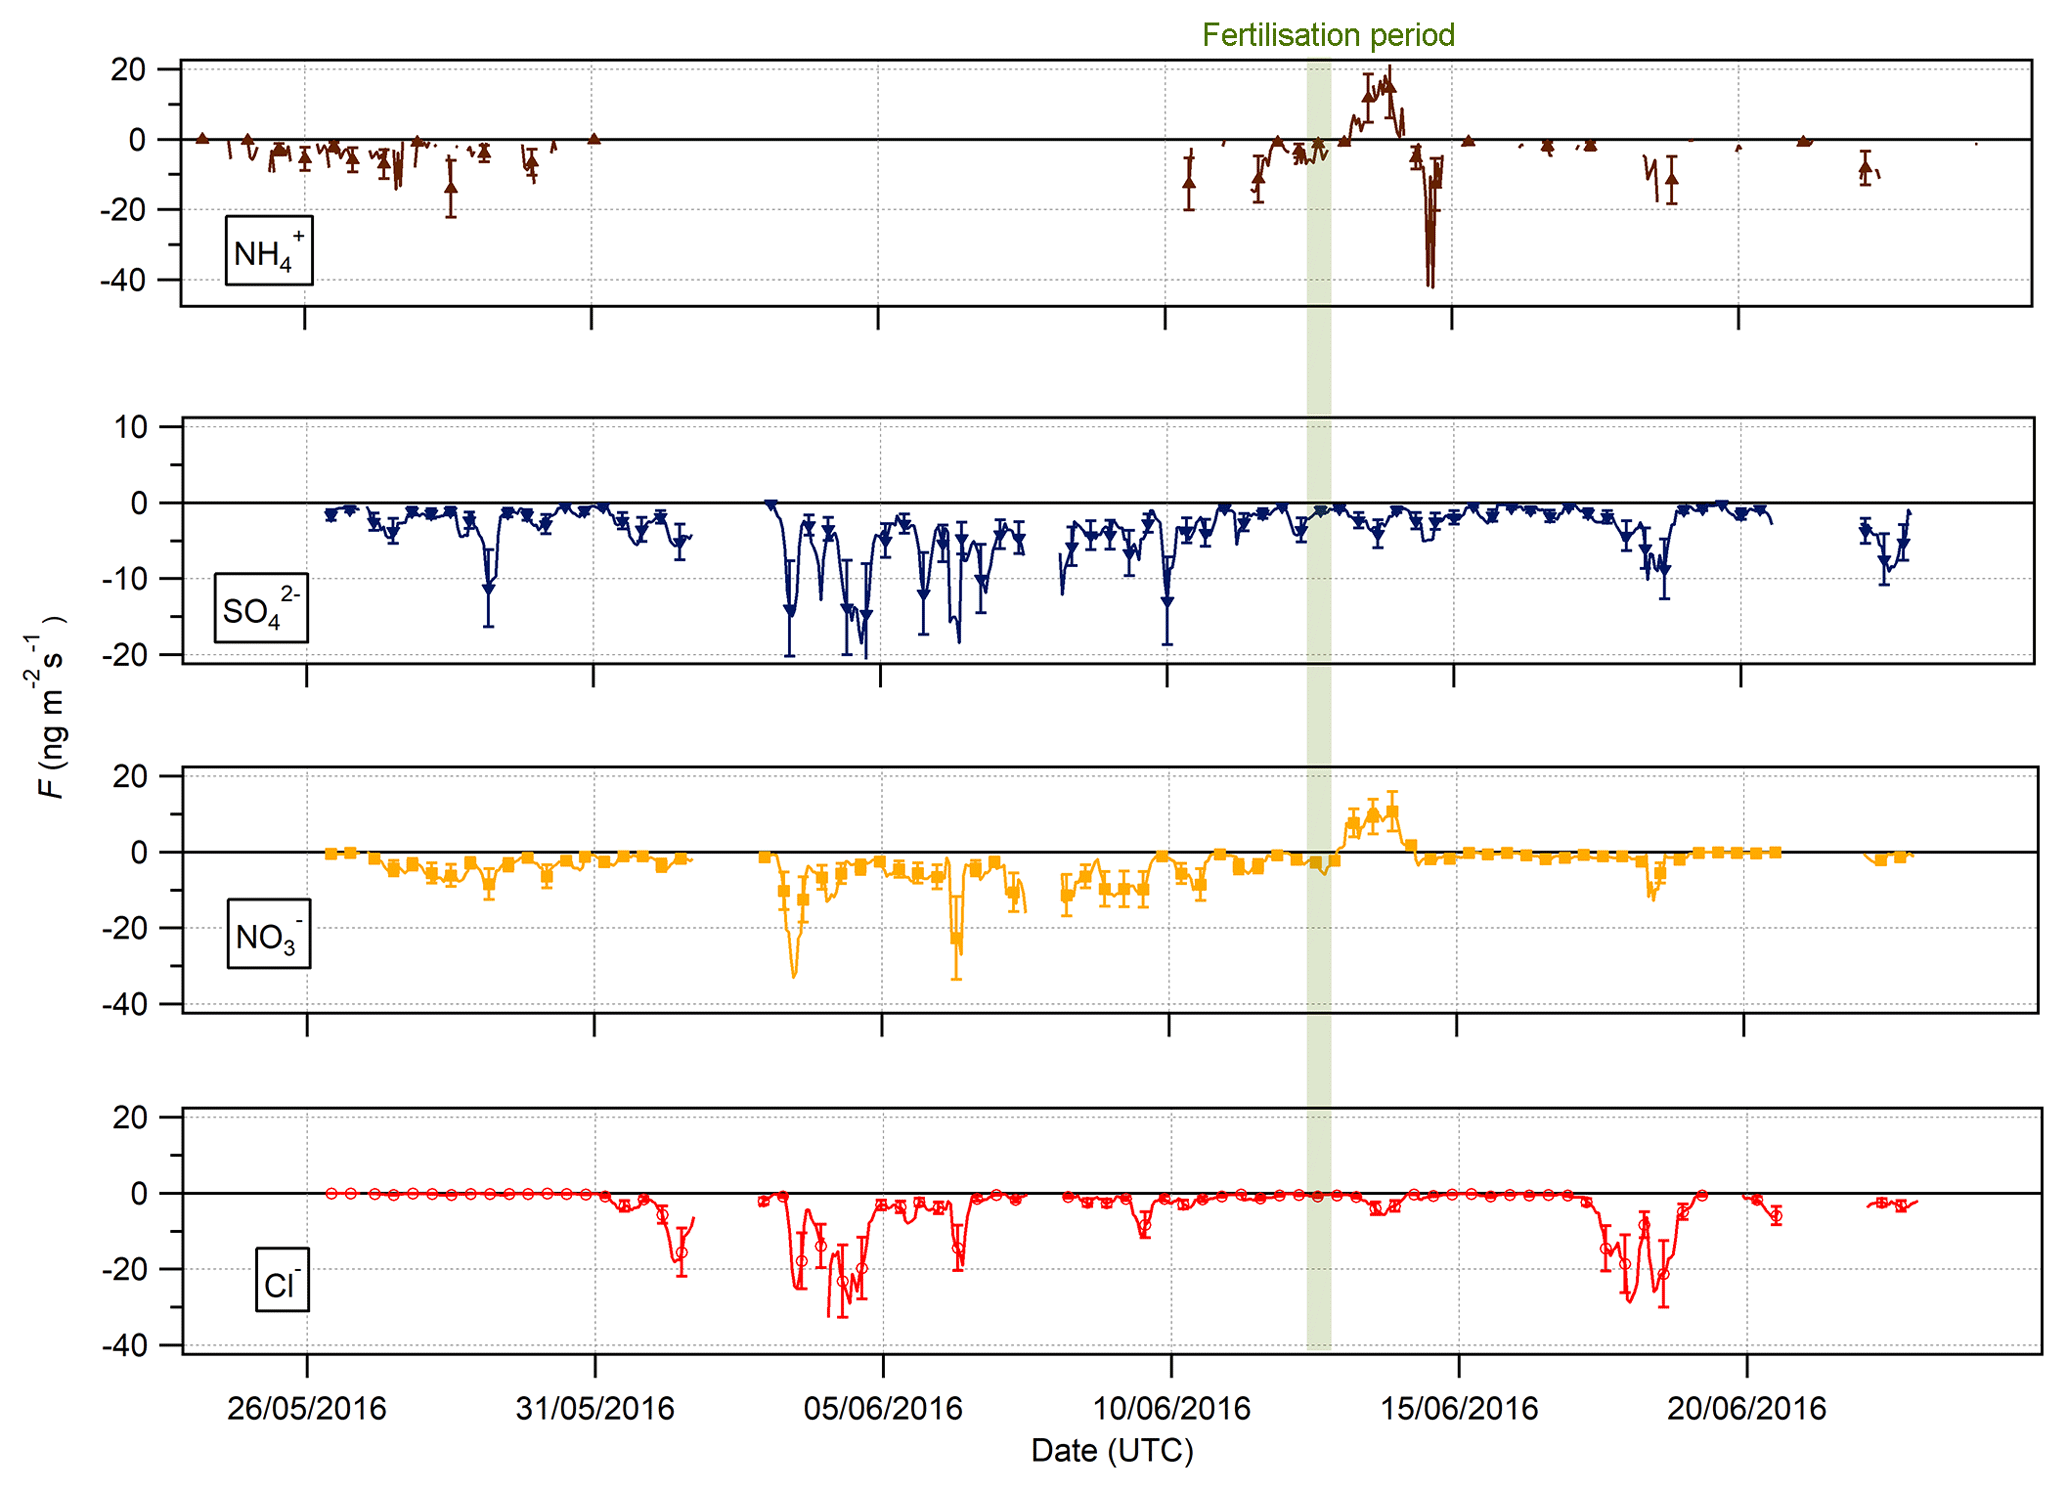
Figure 9Time series of hourly fluxes of water-soluble aerosol species measured during the Easter Bush campaign. Results smoothed using a 5 h moving point average. The fertilisation period was 10:00 on 13 June and is highlighted in green. Flux uncertainties for each aerosol are included as error bars.
3.3.2 Fluxes of water-soluble aerosol components
The measured surface fluxes of the aerosol species Cl−, , and are shown in Fig. 9, as well as the summary statistics for the fluxes and deposition velocities in Table 3. A large data gap in fluxes from 31 May to 10 June 2016 was due to only being measured at one height on account of unreliable data for at the lower height of 0.6 m.
Pre-fertilisation, all aerosol species exhibited deposition fluxes. The deposition fluxes were larger during the drier, warmer period from 31 May to 6 June and close to zero during the wetter conditions at the end of the campaign. An important exception was the emission of and from 13:00 on 13 June to 02:00 on 14 June, starting 4 h after fertilisation of the south field.
Summary statistics for the fluxes and deposition velocities for the aerosol species measured are shown in Table 3. As for the trace gases, the median deposition velocities for the aerosol species exclude the period of flux divergence which occurred during fertilisation. The maximum flux for of +18.16 was recorded at 16:00 on 13 June, 7 h after fertilisation of the south field. Similarly, the maximum flux for (+31.84 ) was also recorded soon after fertilisation, at 18:00 on the 13 June. Overall, however, the mean fluxes for all aerosol species were negative, confirming a predominant net deposition to the surface.
3.4 HONO and NH3 GRAEGOR measurement comparisons with LOPAP and QCL
3.4.1 HONO comparison study between GRAEGOR and LOPAP
A comparison of HONO measurements from the GRAEGOR and two LOPAP instruments was conducted from 26 May to 6 June to investigate the potential artefacts in the WRD method used by the GRAEGOR. The LOPAPs were part of a study to investigate the mechanisms controlling HONO fluxes over managed grassland, including investigating the potential ground sources of HONO, details of which are presented in Di Marco et al. (2018). A series of simple linear regression analyses was conducted to determine the level of agreement between the concentrations of HONO measured by each sample box of the GRAEGOR and each of the LOPAPs. The two LOPAP instruments were operated at the two heights of 0.6 and 2.0 m (hereafter referred to as LOPAP (0.6 m) and LOPAP (2.0 m), respectively). In all comparisons, the GRAEGOR recorded a higher concentration of HONO than either of the LOPAPs. The linear regressions suggest that there is a consistent offset in all GRAEGOR concentrations, varying between 0.01 and 0.02 µg m−3. In comparisons between the GRAEGOR sample box 1 at 0.6 m and both LOPAPs, the linear concentration relation for HONO varies from 0.92 to 0.97. The comparisons between the GRAEGOR sample box 2 (2.4 m) and the LOPAPs suggest that the linear concentration relation for HONO is 1.06 and 1.01 for LOPAP (2.0 m) and LOPAP (0.6 m), respectively. In all comparisons, however, there exists a constant concentration offset, which results in a constant higher concentration recorded by both GRAEGOR sample boxes. The closest agreement is between GRAEGOR sample box 2 (set at height 2.4 m) and LOPAP (2.0 m), where the HONO concentration recorded by the GRAEGOR sample box 2 (2.4 m) is 1.06 that of LOPAP (2.0 m). This comparison also has the best statistical agreement, with an R2 value of 0.67, suggesting a reasonable agreement between the GRAEGOR sample box 2 and LOPAP (2.0 m) measurements.
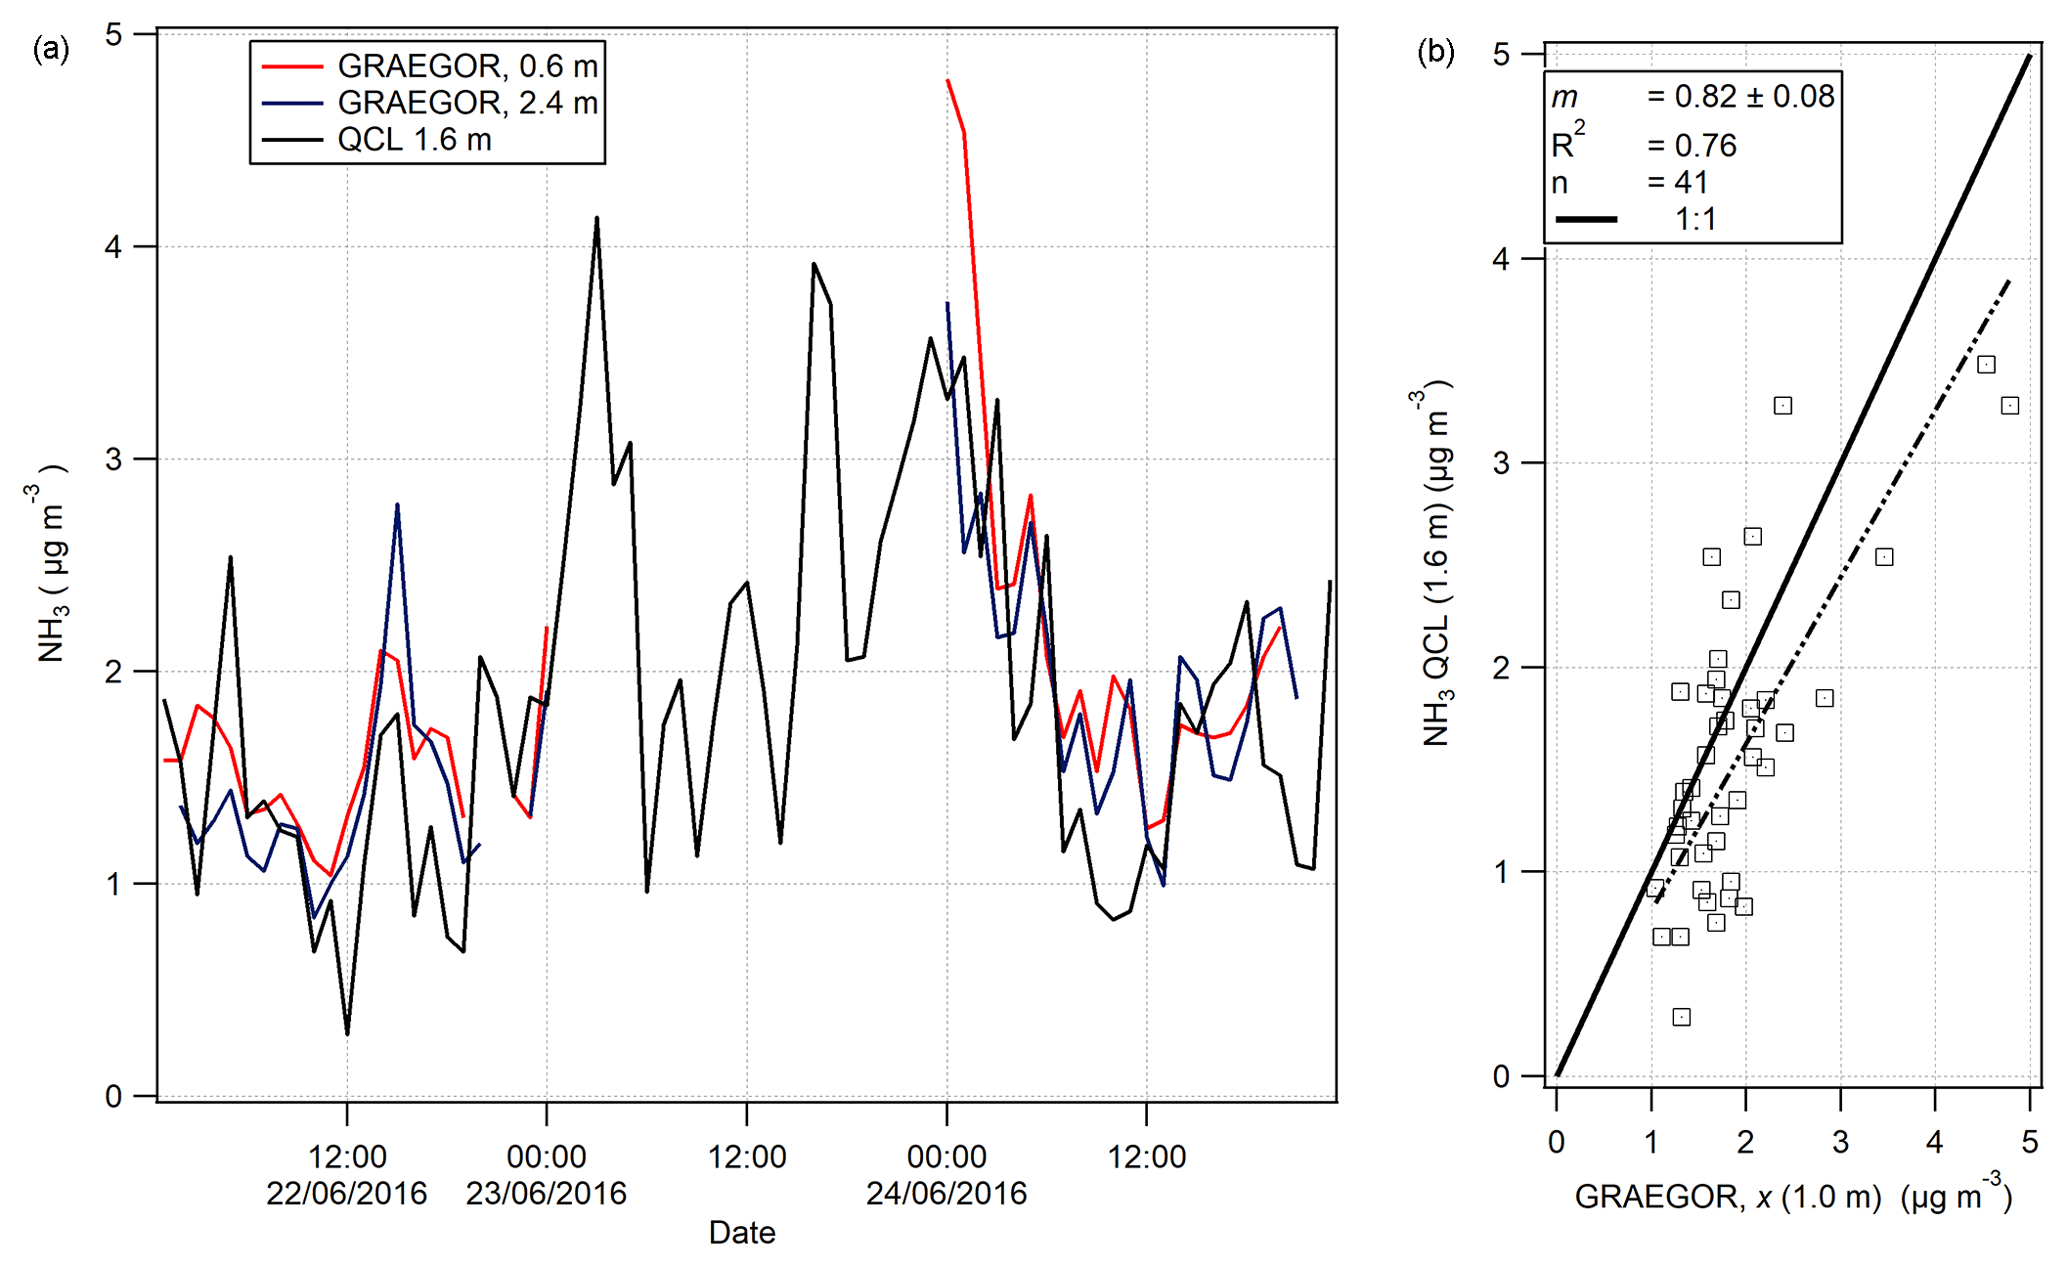
Figure 10(a) Time series of hourly averages of NH3 measurements recorded by GRAEGOR (0.6 and 2.4 m) and QCL. (b) Linear regression analysis between QCL NH3 measurements and GRAEGOR (derived averaged concentration at 1.0 m) NH3 measurements.
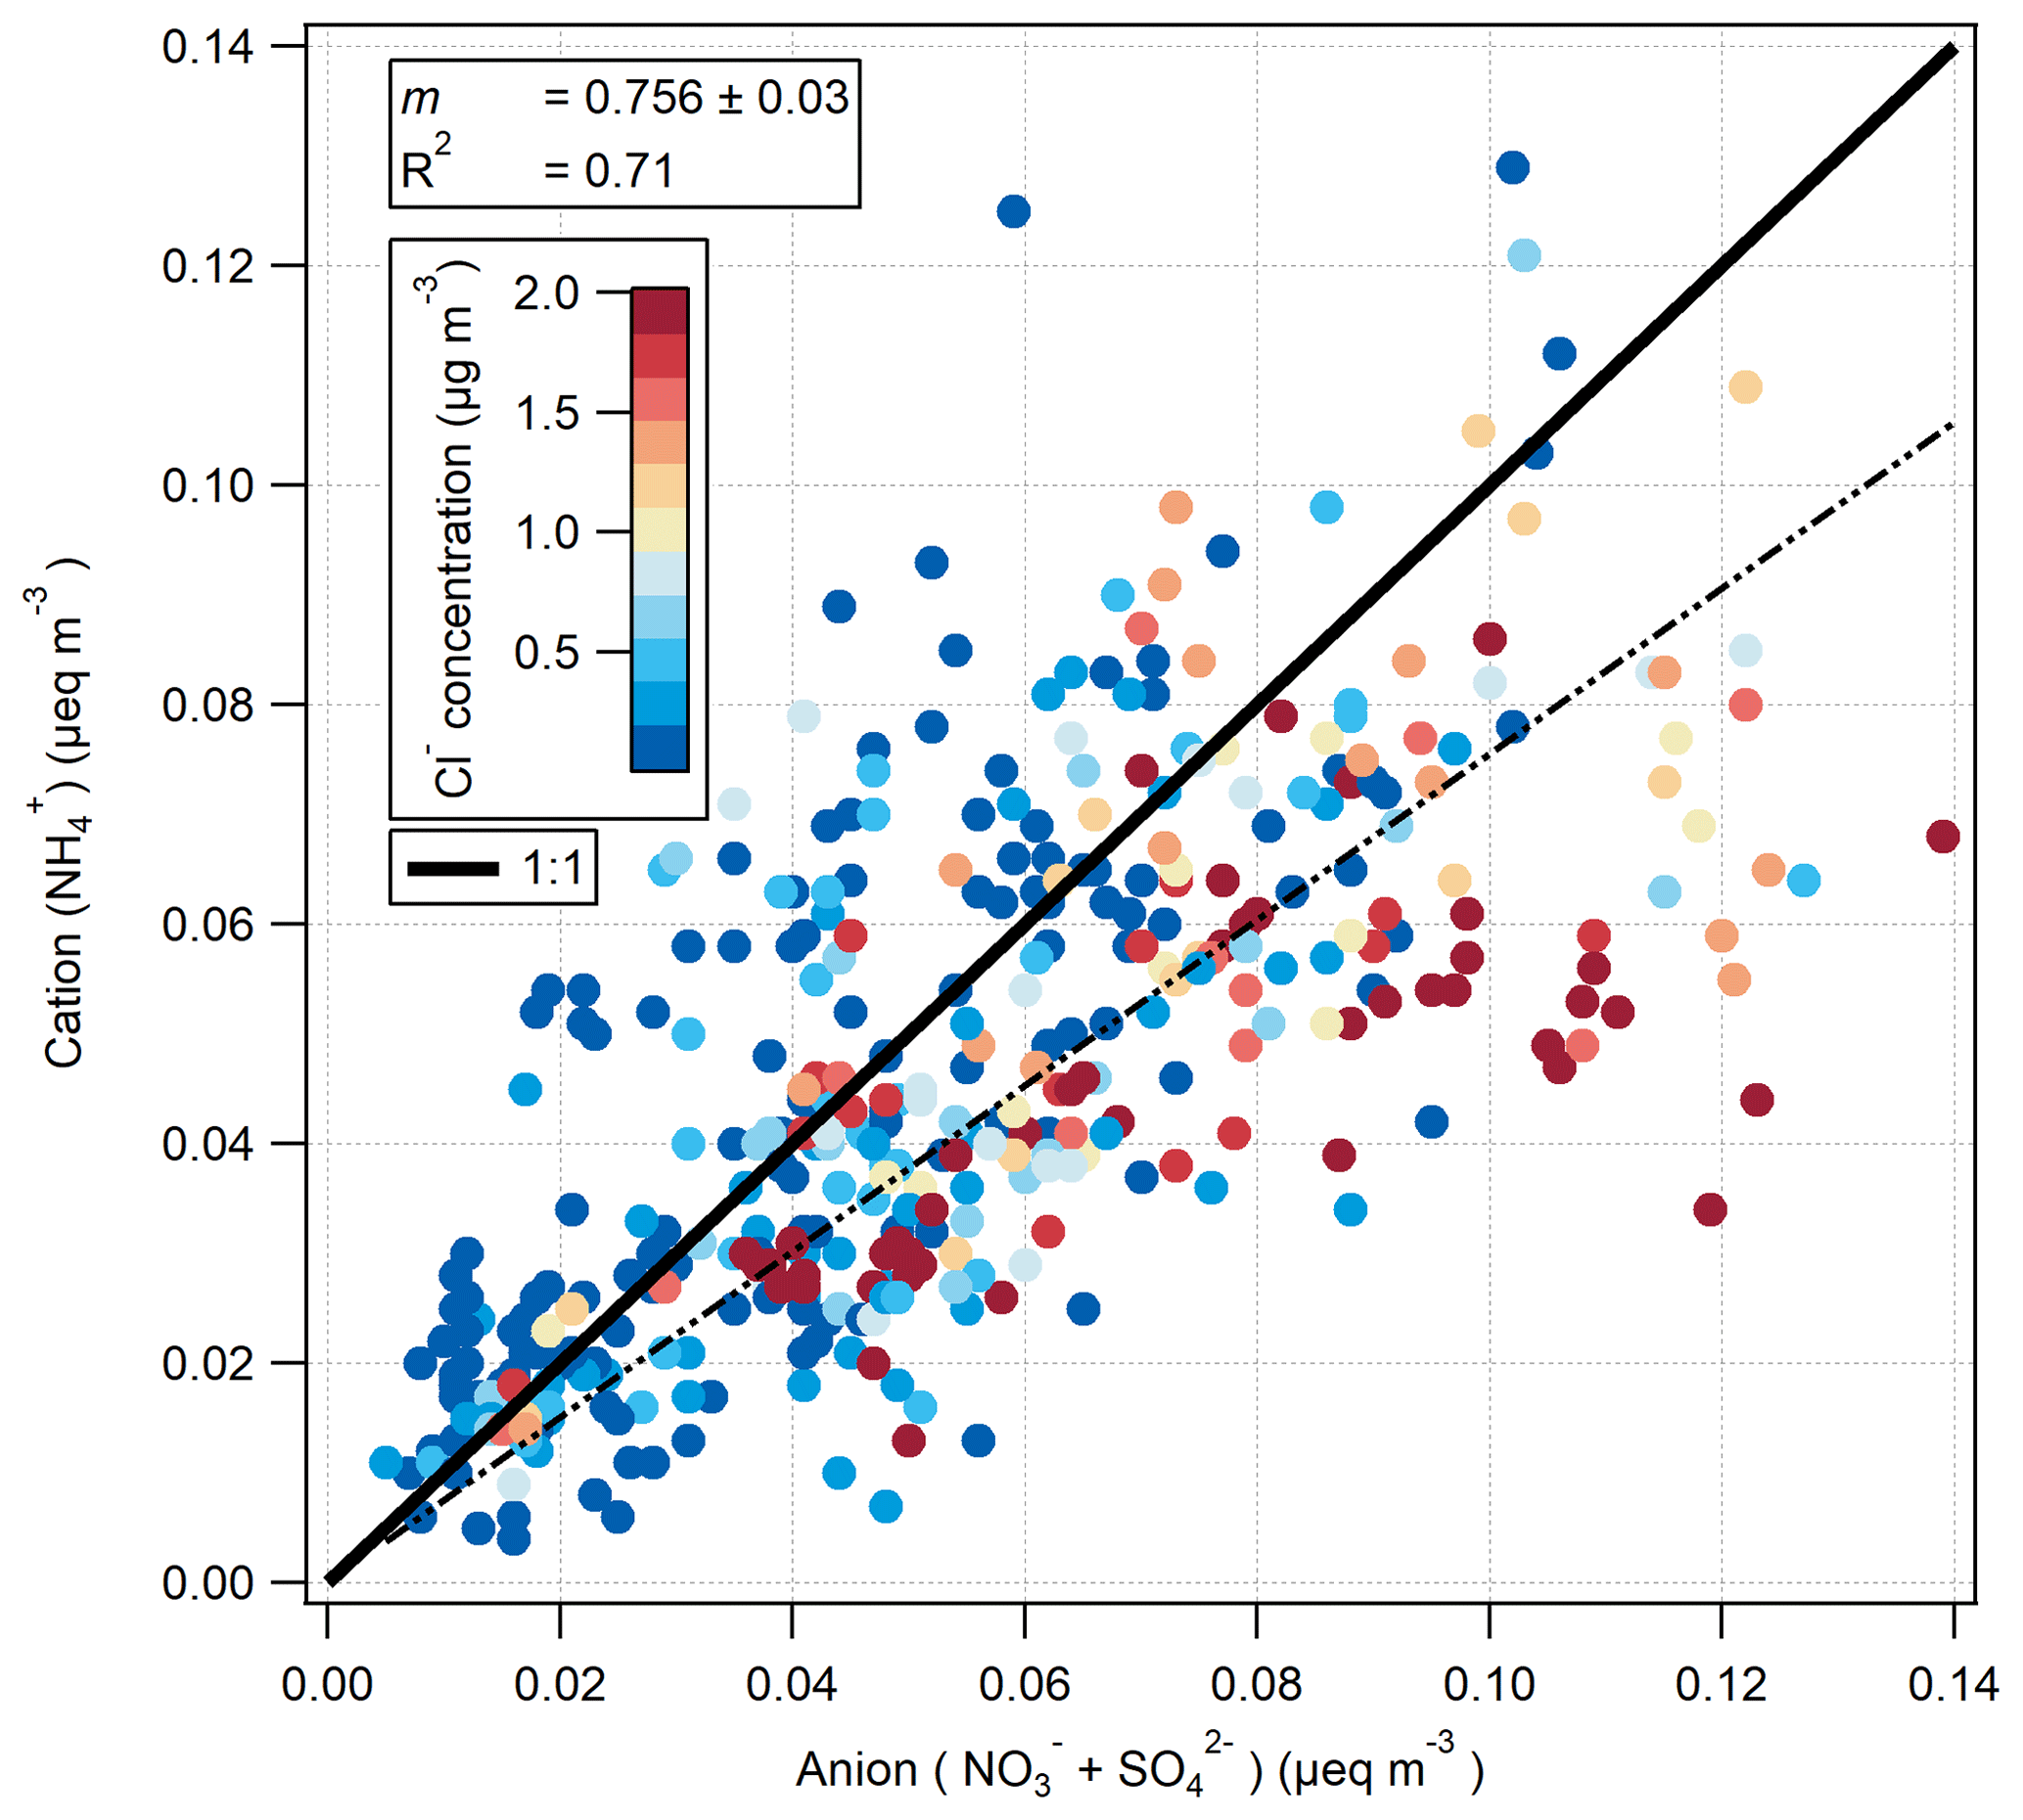
Figure 11The ion balance of measured selected anions () and measured cations () in µeq m−3. The colour scale is capped at 2 to highlight the association of anion excess with periods of sea-salt influence.
3.4.2 NH3 comparison study between GRAEGOR and QCL
On 7 June, a QCL with inlet at height 1.6 m was installed at the Easter Bush site and took measurements of NH3 from 19 June to 7 August. A total of 3 days of concurrent NH3 measurements taken by the GRAEGOR and the QCL were recorded in the period 21–24 June. The time series of the NH3 measurements by each instrument are shown in Fig. 10a. An averaged NH3 concentration at 1.0 m (χ (1 m)) taken by the GRAEGOR was compared with the NH3 concentrations taken by the QCL in a simple linear regression analysis, displayed in Fig. 10b. The linear regression shows that the GRAEGOR recorded a factor of 1.22 higher concentrations of NH3 than the QCL, with an associated R2 value of 0.76. However, the number of concurrent measurements is small, with only 41 shared hourly measurement values across 3 days and a period of 19 continuous hours missing between 02:00 and 23:00 of 23 June.
4.1 Ion balance
The ion balance for the hourly-measured cation () and anion ( and ) aerosol species pre-fertilisation is shown in Fig. 11. Values are shown as molar equivalent concentration, derived from aerosol mass concentrations converted to molar concentrations and subsequently multiplied by their charge. Cl− charge was not included, under the assumption that it would be entirely associated, in the form of sea salt, with Na+ which was not measured by the GRAEGOR. While the correlation between cation and anion species is very good (R2=0.71), the linear regression suggests a deficit of , suggesting that some of the and/or was balanced by ions other than . A likely candidate is Na+: some of the is likely to have represented sea-salt and some NaNO3 is formed by reaction of NaCl with HNO3. Figure 11 is coloured by Cl− concentration, and periods of anion excess tend to be associated with elevated Cl− concentrations.
The formation of NaNO3 through the reaction of HNO3 or NOx with sea salt has been previously observed in coastal sites (Andreae et al., 1999, 2000; Bardouki et al., 2003; Dasgupta et al., 2007; Kutsuna and Ibusuki, 1994) and within the UK and Ireland, where the interaction with marine air with polluted air masses at coastal sites was shown to significantly shift the aerosol to the coarse mode (Yeatman et al., 2001; Twigg et al., 2015). Scavenging of atmospheric H2SO4, formed from SO2 (O'Dowd and de Leeuw, 2007), by sea salt may also be occurring, which would also shift some of the from the fine to the coarse mode.
4.2 Deposition velocities and fluxes of water-soluble aerosol and trace gas species
4.2.1 Fluxes of water-soluble aerosols and trace gases
Fluxes of and Cl− throughout the campaign were deposited unidirectionally towards the canopy surface. However, during the fertilisation period of the south field, bidirectional fluxes of and were observed. Prior to fertilisation these species were deposited to the site. An apparent emission flux of is consistent with the possibility of NH4NO3 formation above grassland suggested by the divergence of HNO3Vd from Vmax (Nemitz et al., 2009a) in the presence of high concentrations of NH3 near the surface. Concentrations of NH3 peak at 21.4 µg m−3 on 13 June, 11:00, which occurs 3 h before peak HNO3 Vd and 7 h prior to the apparent peak in emissions of at 18:00.
Fluxes for the trace gases were bidirectional for NH3 and HONO, with deposition for all other species measured. Emissions of NH3 and HONO occurred throughout the campaign, with HONO emissions particularly present during the early morning. Both species reached peak emissions soon after fertilisation. Increases in atmospheric NH3 concentration and emissions of NH3 resulting from the application of solid urea fertiliser have been previously established (Akiyama et al., 2004; Sommer and Hutchings, 2001), with losses from volatilisation increased if the urea pellets are poorly mixed into the soil and if conditions are dry and warm. While conditions prior to the fertilisation event were cool, temperatures increased quickly throughout the day, peaking at 19.2 ∘C at 13:00, 4 h after fertilisation. Volatilisation was likely exacerbated by the dry conditions throughout 13 June. The increase in concentration and upward flux of NH3 provides the source for the formation of NH4NO3 in the presence of HNO3. The mechanisms of the HONO emission fluxes are not discussed here but can be found in Di Marco et al. (2018).
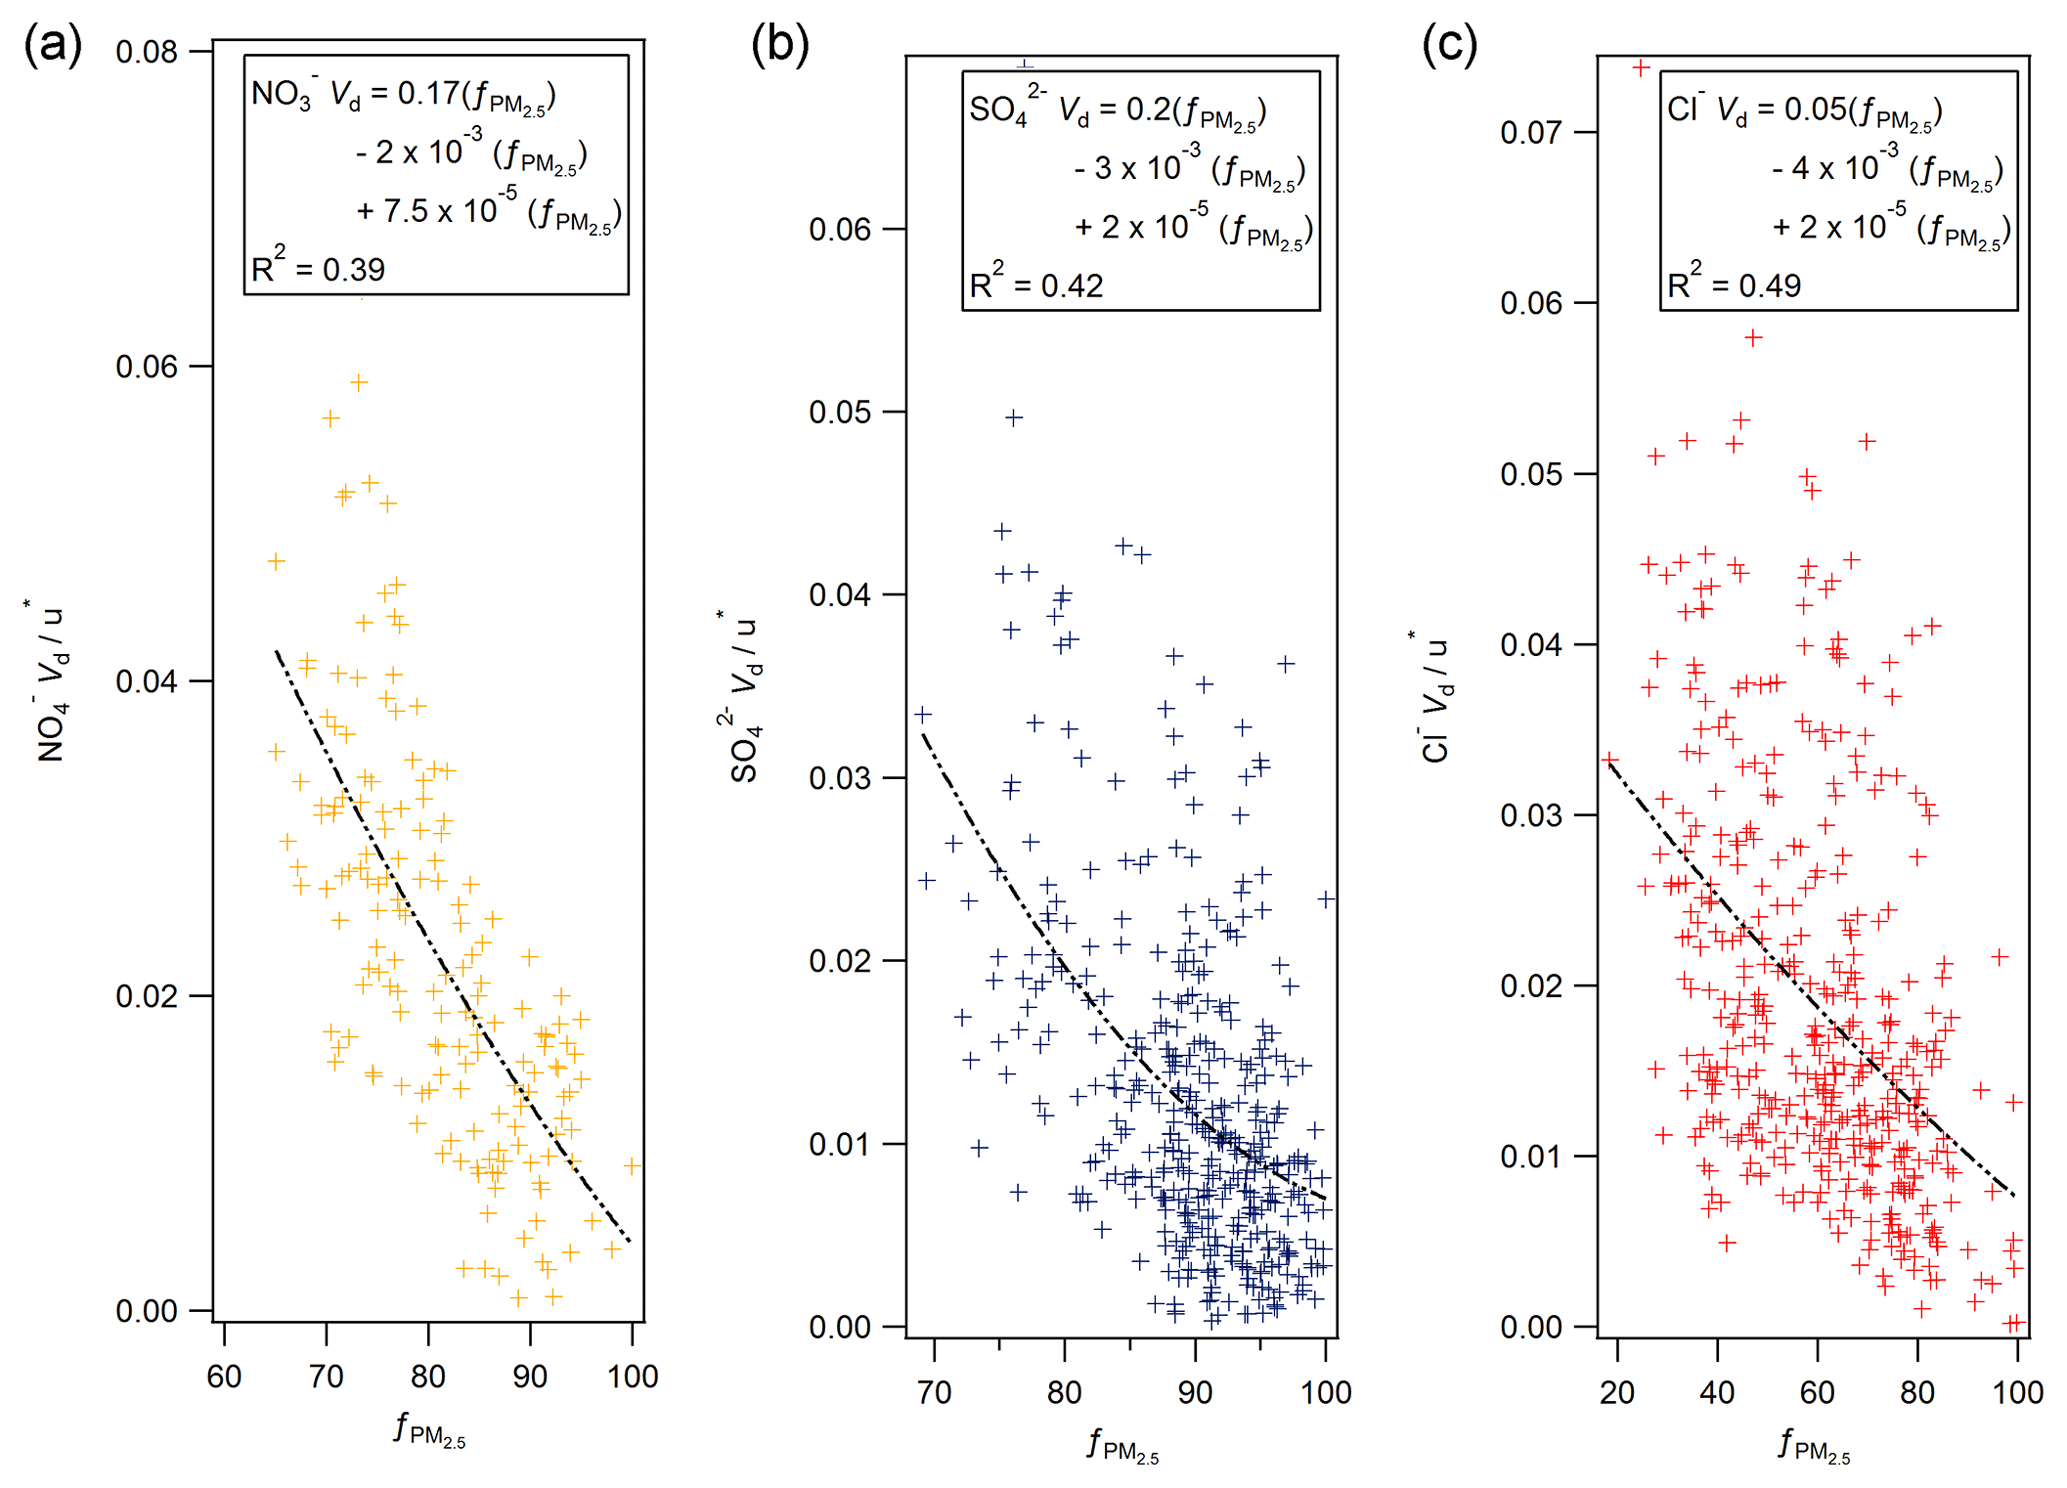
Figure 12The normalised deposition velocity as a function of (expressed as a %) for (a) nitrate, (b) sulfate and (c) chloride, derived from the MARGA measurements at Auchencorth Moss.
4.2.2 Aerosol deposition velocities
Deposition velocities for reached a maximum value of 9.8 mm s−1 during daytime and a minimum of 0.2 mm s−1 outside the period of apparent emission fluxes at night. A similar pattern was observed for sulfate, which reached a maximum value of 9.5 mm s−1 during daytime and a minimum value, outside of apparent emission events, of 0.15 mm s−1 during night. Median Vd values for and were 1.52 and 1.45 mm s−1, respectively. For Cl−, the median Vd was 3.14 mm s−1. The deposition velocities for where larger than those previously observed and derived for accumulation mode particles from theoretical considerations (Petroff et al., 2008). For sulfate in the fine (<0.1 µm diameter) range, Allen et al. (1991) recorded a mean value of 1 mm s−1 for deposition velocity over short grass, similar to observations made by Gallagher et al. (2002), who reported a mean value of 0.9 mm s−1.
The dry deposition of particles can be modelled using a process-orientated approach, which describes the deposition velocity as a function of particle size based on removal mechanisms acting within the vegetation canopy, such as Brownian diffusion, impaction, interception and sedimentation (Slinn and Slinn, 1980; Davidson et al., 1982; Slinn, 1982). The models predict that for particles >0.1 µm in diameter deposition velocity increases with increasing particle size. Vong et al. (2004) recorded deposition velocities greater than 2 mm s−1 for PM10 particles over grassland. If the sulfate and chloride were in particularly coarse particles, deposition velocities would potentially be skewed towards a higher deposition velocity.
Secondary ammonium compounds are typically found in the accumulation mode (0.1 to 1 µm), while sea salt is found in super-micron particles (Myhre et al., 2006). Although measurements of particle size were not made during this campaign, measurements of aerosol species (including Cl− and ) in the PM2.5 and PM10 size fractions were taken by a two-channel Monitor for Aerosols and Gases in Ambient Air (MARGA, Applikon B.V., the Netherlands) instrument located at Auchencorth Moss, 12 km south-west of Easter Bush. Aerosol concentration data were taken from an online database of MARGA measurements (DEFRA, 2018). Agreement between MARGA and GRAEGOR aerosol concentrations was excellent (with correlations for with R2=0.95, and for Cl− with R2=0.91 between MARGA PM10 and GRAEGOR TSP). As proxy for a particle size measurement, the proportion of PM2.5 to PM10 was used, with a lower proportion of PM2.5 indicating a greater proportion of coarse aerosol and a corresponding larger deposition velocity based on process-orientated modelling. To a first-order approximation, particle deposition velocities scale with u∗ (Pryor et al., 2008). Figure 12 shows plots of the normalised deposition velocities () against the fraction of the PM10 mass contained in PM2.5 at Auchencorth Moss () for nitrate (a), sulfate (b) and chloride (c).
While the dynamic range of varied between compounds, third-order polynomial curves consistently describe the relation between the proportion of PM2.5 to overall PM and the normalised Vd for nitrate, sulfate and chloride, suggesting – in line with Slinn (1982) – that deposition velocity increases strongly with increasing particle size above 0.1 µm particle diameter. However, the relationship – although statistically significant – shows significant variability, which may be due to measurement uncertainty, but might also reflect the additional effect of atmospheric stability on particle fluxes (e.g. Wesely et al., 1985; Petroff et al., 2008) or differences in the size distribution between the Auchencorth and Easter Bush measurement sites. It must be stressed that the proportion of PM2.5 to PM10 is a proxy measurement for particle size and can only differentiate the proportions of aerosol of diameter less than or greater than 2.5 µm.
By contrast, the median deposition velocity of 0.37 mm s−1 for was much smaller and within the range of previous measurements of dry deposition velocities of accumulation mode particles to grassland. The average for recorded was 96 %, compared to 78 % for and 86 % for , suggesting that virtually all of the measured was contained in fine particles, within the measurement error. The average normalised deposition velocity () of of 0.04 was in the range of the values for the other compounds evaluated at %.
Thus, the relatively high deposition velocities for Cl−, and (compared with ) are a result of some of these compounds being contained in coarse aerosol. This is consistent with the ion balance (Fig. 11), which suggests that some of these compounds are balanced by sea-salt Na+, which is found mostly in the coarse fraction.
It should be noted that the increase in Vd with increasing contribution of coarse aerosol only accounts for the size dependence of the processes of impaction and interception. As a non-turbulent process, gravitational sedimentation is not reflected in micrometeorological flux measurements and the sedimentation velocity would need to be added to the deposition velocity derived here.
4.2.3 Trace gas deposition velocities
Median diel deposition velocities for HNO3 and HCl closely matched the theoretical maximum deposition velocities within the uncertainty of the measurement (Fig. 8), which closely conforms to their expected physico-chemical behaviour. Both HNO3 and HCl are reactive and highly water soluble, and consequently it is expected that their deposition velocities should equal the theoretical maximum and that the canopy resistance for these species should be equal to zero (Dollard et al., 1987; Muller et al., 1993). The close agreement between Vd and Vmax during most of the campaign suggests that chemistry is not affecting the fluxes and that the standard aerodynamic gradient method is therefore applicable. However, significant deviations of the calculated deposition velocity from the theoretical maximum for HNO3 exist: Rc values for HNO3 were particularly large 40 h after fertilisation, from 15 to 16 June, when the mean Rc value was 14.8 s m−1. Conversely, there were periods when the Vd for HNO3 exceeded the Vmax, such as on 13 June at 13:00 h, when Vd for HNO3 was recorded as 56.8 mm s−1 compared with a calculated maximum of 17.5 mm s−1.
Reductions in Vd for HNO3 (or in other words a non-zero Rc) have been linked to ground-level sources or non-zero vapour pressures of HNO3 over nitrate-containing aerosol (particularly, NH4NO3), which may evaporate from aerosol within the air space below the measurements or previously deposited to leaf surfaces (Brost et al., 1988; Kramm and Dlugi, 1994; Nemitz et al., 2000b; Nemitz and Sutton, 2004). By contrast, values of Vd for HNO3 that exceed the theoretical maximum could suggest the presence of an additional sink for HNO3, which would potentially arise as the result of NH3 reactions with HNO3 to form NH4NO3 (Nemitz et al., 2000a; van Oss et al., 1998). The higher Vd values for HNO3 during the fertilisation period, followed by a higher Rc value 40 h afterwards, could suggest the formation of NH4NO3 immediately following fertilisation followed by its volatilisation soon after. Indeed, the exceedance of Vmax coincided with upward fluxes of and (Fig. 9) and this suggests that, during the period after fertilisation, the increase in NH3 concentration led to an exceedance of the equilibrium vapour pressures of NH4NO3 near the ground, resulting in partitioning of NH3 and HNO3 into the aerosol phase. This would have constituted an additional airborne sink for HNO3 (Vd>Vmax) as well as a source (apparent emission) for and as previously reported by Nemitz et al. (2009a).
It should be noted that during this period the aerodynamic gradient method does not derive accurate fluxes because the condition of flux conservation is not met (Wolff et al., 2010b), and this period has therefore not been included in the diel cycles and summary statistics presented above.
By contrast, fluxes of total ammonium () and total nitrate () would be conserved, as the effect of gas–particle interactions are not considered, and their assessment provides additional information on the processes occurring during periods when fluxes are not conserved with height.
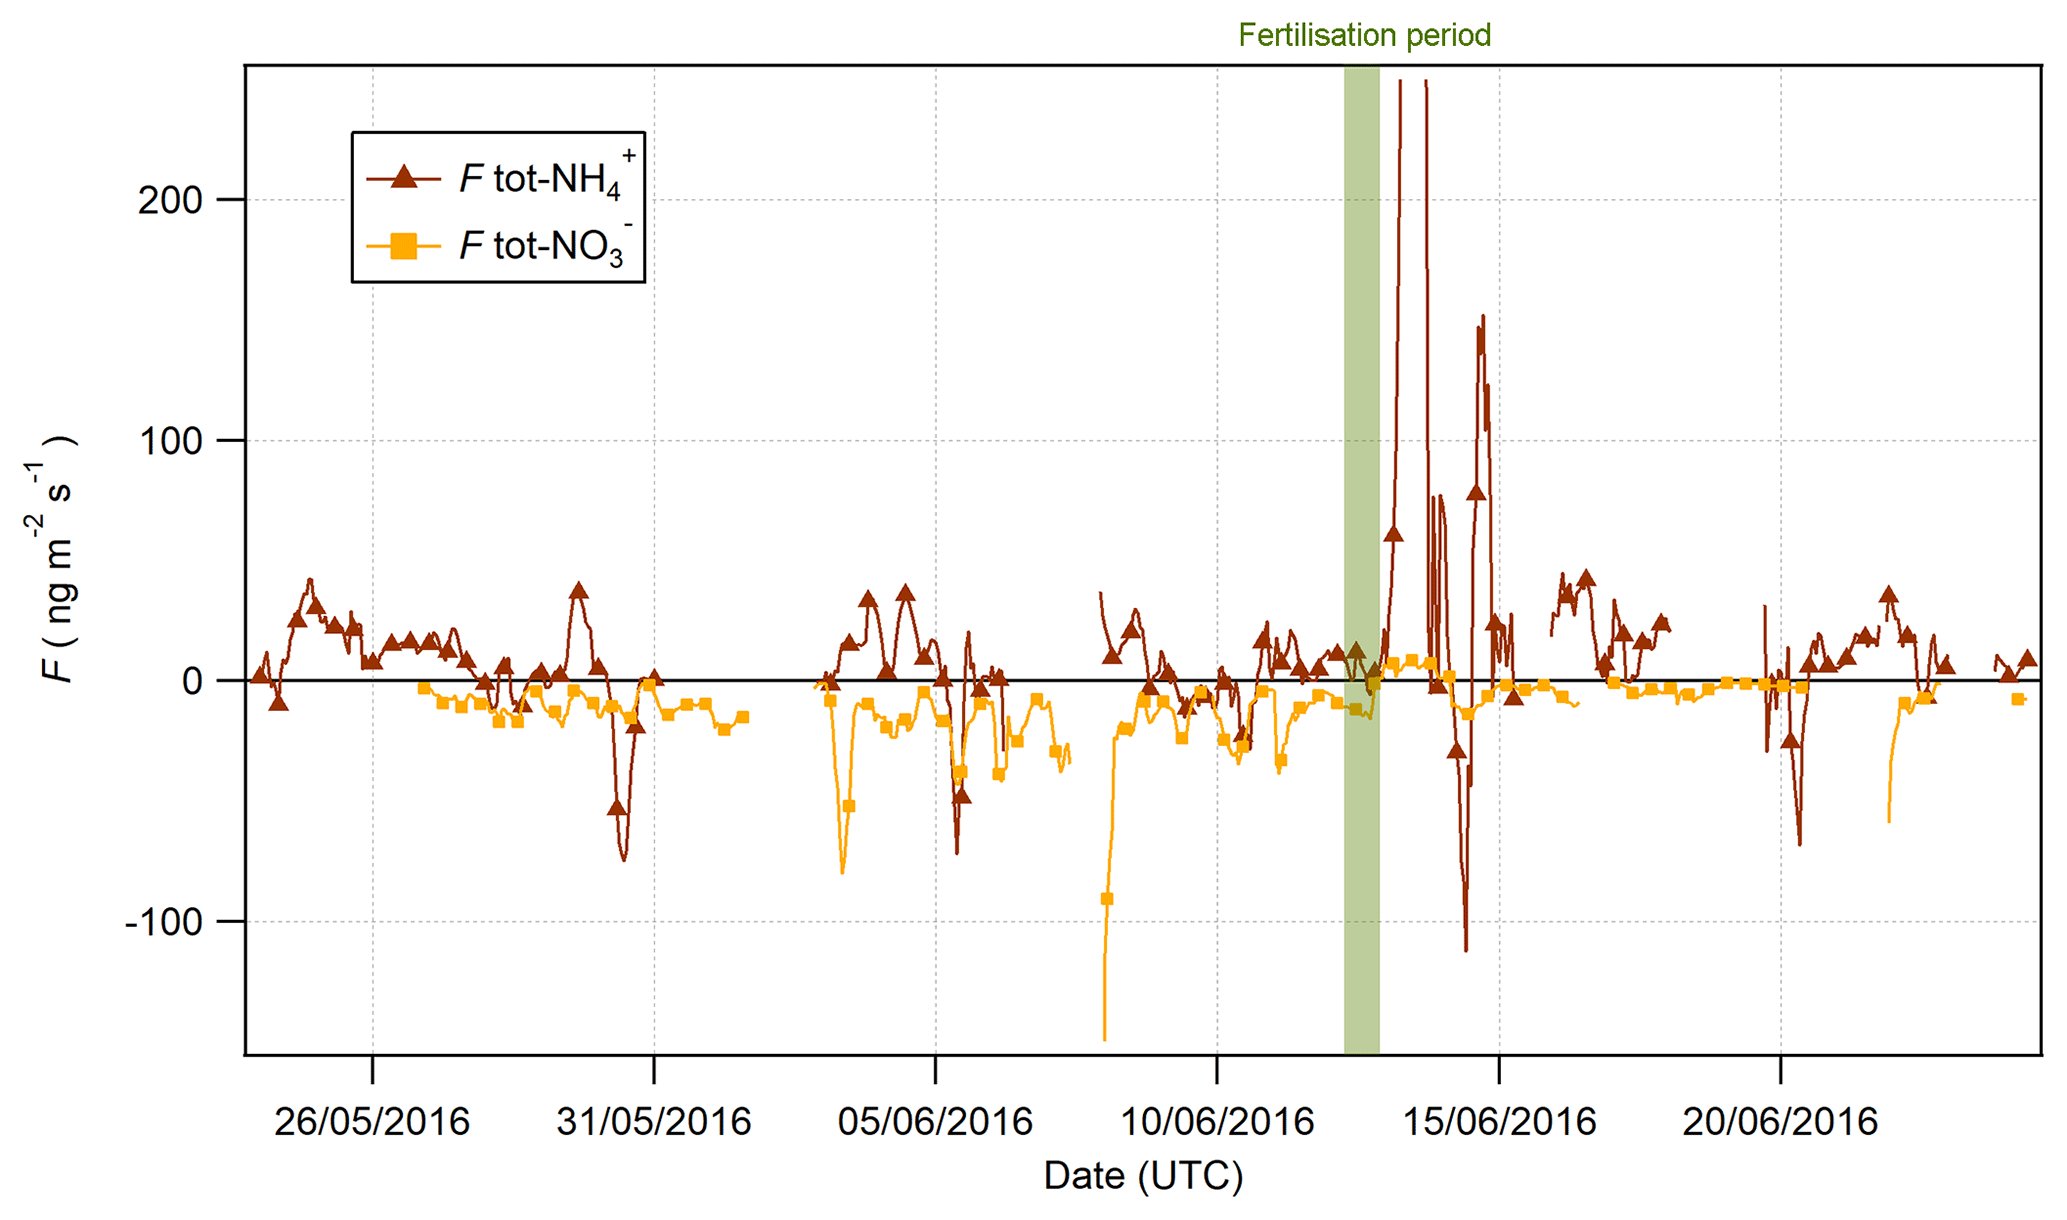
Figure 13Fluxes of tot- and tot- pre- and postfertilisation on 13 June 2016 at 09:00 (marked in green).
The time series for tot- and tot- fluxes are shown in Fig. 13. Prior to the fertilisation event on 13 June, the fluxes for tot- were universally depositional to the surface, while fluxes of tot- were bidirectional with significant variation. However, 6 h after fertilisation, a significant emission event of tot- was observed lasting for 6 h. Interestingly, this indicates that the apparent emission during this period (Fig. 9) exceeded the measured deposition of HNO3 and that there must have been a net source of at the surface during this period. Upward fluxes have previously been reported in the literature where they were attributed to the volatilisation of NH4NO3 from leaf surfaces (Neftel et al., 1996) or alkyl nitrate chemistry (Farmer and Cohen, 2008). Primary emissions of HNO3 could arise from the heterogeneous reaction of NO2 with water (Harrison et al., 1996):
Kleffman (2007) suggests that HNO3 could be formed by the reduction of NO2 on organic sources of humic acid, a process that would also lead to the production of HONO. The formation of HNO3 inferred from observations coincided with emissions of HONO postfertilisation. However, as discussed previously, this reaction is slow and, while possibly contributing to some of the observed HONO emission, may not be able to account for the majority of observed emissions.
A second potential pathway is the emission of HONO from the soil. As described by Scharko et al. (2015), the oxidation of ammonium by microbes in soils with high nitrification rates can lead to biogenic emissions of HONO. The addition of urea to the agricultural soil at Easter Bush would lead to an increase in soil concentrations and subsequently, through oxidation by soil microbes, the observed emission of HONO. Further discussion of the sources of HONO emissions at Easter Bush will be provided in a future paper by Di Marco et al. (2018).
4.3 Daytime source of HONO
As shown in Fig. 5, the median diel concentrations for HONO recorded by the GRAEGOR at 2.4 m do not drop below the detection limits of the instrument, determined to be 30 ng m−3 from calibrations carried out during the campaign. This is contrary to what would be expected based solely on the photolysis rate of HONO, which would suggest that, after accumulation of HONO during nighttime, rapid photolysis should reduce concentrations to below the detectable levels for measurement during early morning (Pagsberg et al., 1997). As measurement approaches have improved over the past 10 years, a growing number of measurements have revealed non-negligible HONO daytime concentrations at rural (Acker et al., 2006; Su et al., 2008; Sörgel et al., 2011), agricultural (Laufs et al., 2017) and urban (Lee et al., 2016) sites, including previous studies at the Easter Bush site (Twigg et al., 2011). Details on the discussion of a potential daytime source of HONO are further discussed in Di Marco et al. (2018).
4.4 Comparison of GRAEGOR with other instrumentation
4.4.1 Comparison of nitrous acid measurement between GRAEGOR and LOPAP
The comparison between the LOPAPs and the GRAEGOR revealed that both sample boxes of the GRAEGOR measured higher HONO concentrations than the LOPAP, principally due to the presence of a constant concentration offset of 0.01 to 0.02 µg m−3 of HONO. Previous comparisons of measurements of HONO have been between the wet annular rotating denuder, as used in the GRAEGOR, and optical absorption techniques, primarily differential optical absorption spectroscopy (DOAS) instruments. In those comparisons, it has been found that HONO measurements by WRD, particularly during daytime and at low concentrations, tend to be significantly higher than DOAS measurements (Appel et al., 1990). By comparison, the LOPAP shows good agreement in HONO measurements with the DOAS (Kleffman et al., 2006), as the DOAS method is a molecule-specific method and the LOPAP method measures any potential NOx artefact.
The higher concentrations recorded by the GRAEGOR can be explained by the presence of chemical interferences that occur on the inlet, at the air–liquid interface and within the sampling solution. As the WRD uses a liquid film to sample HONO, and as HONO can form heterogeneously on such surfaces, overestimation of HONO can occur. Furthermore, interferences by chemical reactions of NO2 with hydrocarbons within the sampler can lead to a further interference (Gutzwiller et al., 2002), particularly in proximity to diesel emissions. It has also been shown that, in high-alkalinity sampling solutions, mixtures of SO2 and NO2 can add a further interference to measurements (Spindler et al., 2003). Finally, photolytically induced artefacts can be introduced in the sampling lines that connect the GRAEGOR sampling box to the detector unit (Kleffman and Wiesen, 2008). The LOPAP, which is also a wet-chemistry-based instrument, is designed to minimise the chemical interferences and artefacts that can be introduced in other wet-chemistry instruments.
A comparison between daytime (06:00 to 18:00) GRAEGOR HONO concentrations and LOPAP HONO concentrations found only a slightly greater difference than the comparison between nighttime (19:00 to 05:00) concentrations recorded by the GRAEGOR and LOPAP. While previous comparisons between the DOAS and the WRD found that daytime concentrations measured by the WRD were higher than the DOAS compared to nighttime measurements, these studies were generally conducted in urban areas where both HONO and NOx concentrations were high (Febo et al., 1996), in contrast to the low concentrations at Easter Bush. The implementation of thermal insulation material around the GRAEGOR sampling lines may have also reduced the influence of photolytic artefacts in exposed sampling lines during the day, which would have elevated daytime HONO measurements recorded by the GRAEGOR.
Spindler et al. (2003) developed the following quantification of the chemical artefact produced by the mixing of NO2 and SO2 in highly alkaline sampling solutions for HONO measurements in their investigation of SO2 and NO2 chemical interference, with all concentrations measured in ppb.
The first term describes the heterogeneous formation of NO2 with water alone, and the second describes the aqueous-phase reaction of NO2 and SO2. Using measurements of SO2 and NO2 concentrations, the HONO artefact for the period of the GRAEGOR–LOPAP comparison was calculated and subtracted from the HONO concentrations recorded by the GRAEGOR. A linear regression between the concentrations recorded by GRAEGOR sample box 2 and LOPAP (2.0 m), which had the best agreement without artefact reduction, indicated better agreement after the correction for the artefact (GRAEGORartefact (2.4 m) , µg m−3, R2=0.72). Coefficient values were altered to produce the best possible agreement between GRAEGOR and LOPAP HONO values, arriving at a final artefact quantification of
Use of these altered coefficients further reduced the offset in GRAEGOR HONO measurements but also reduced the statistical agreement between GRAEGOR and LOPAP HONO measurements (GRAEGORartefact , µg m−3, R2=0.57). Figure 14 shows the results of these analyses, with the linear regression between GRAEGOR sample box 2 (2.4 m) and LOPAP (2.0 m) without the artefact reduction applied to GRAEGOR sample box 2 (2.4 m) HONO concentrations, with Spindler's artefact reduction and with the modified Spindler's artefact reduction. While the agreement between the LOPAP and GRAEGOR is improved by the introduction of an artefact reduction value, it does not fully close the gap even with altered coefficient values, with a constant concentration offset still present in measurements. The possibility that a further artefact is introduced from NO2 mixing with hydrocarbons would require further investigation, with concurrent measurements of hydrocarbons.
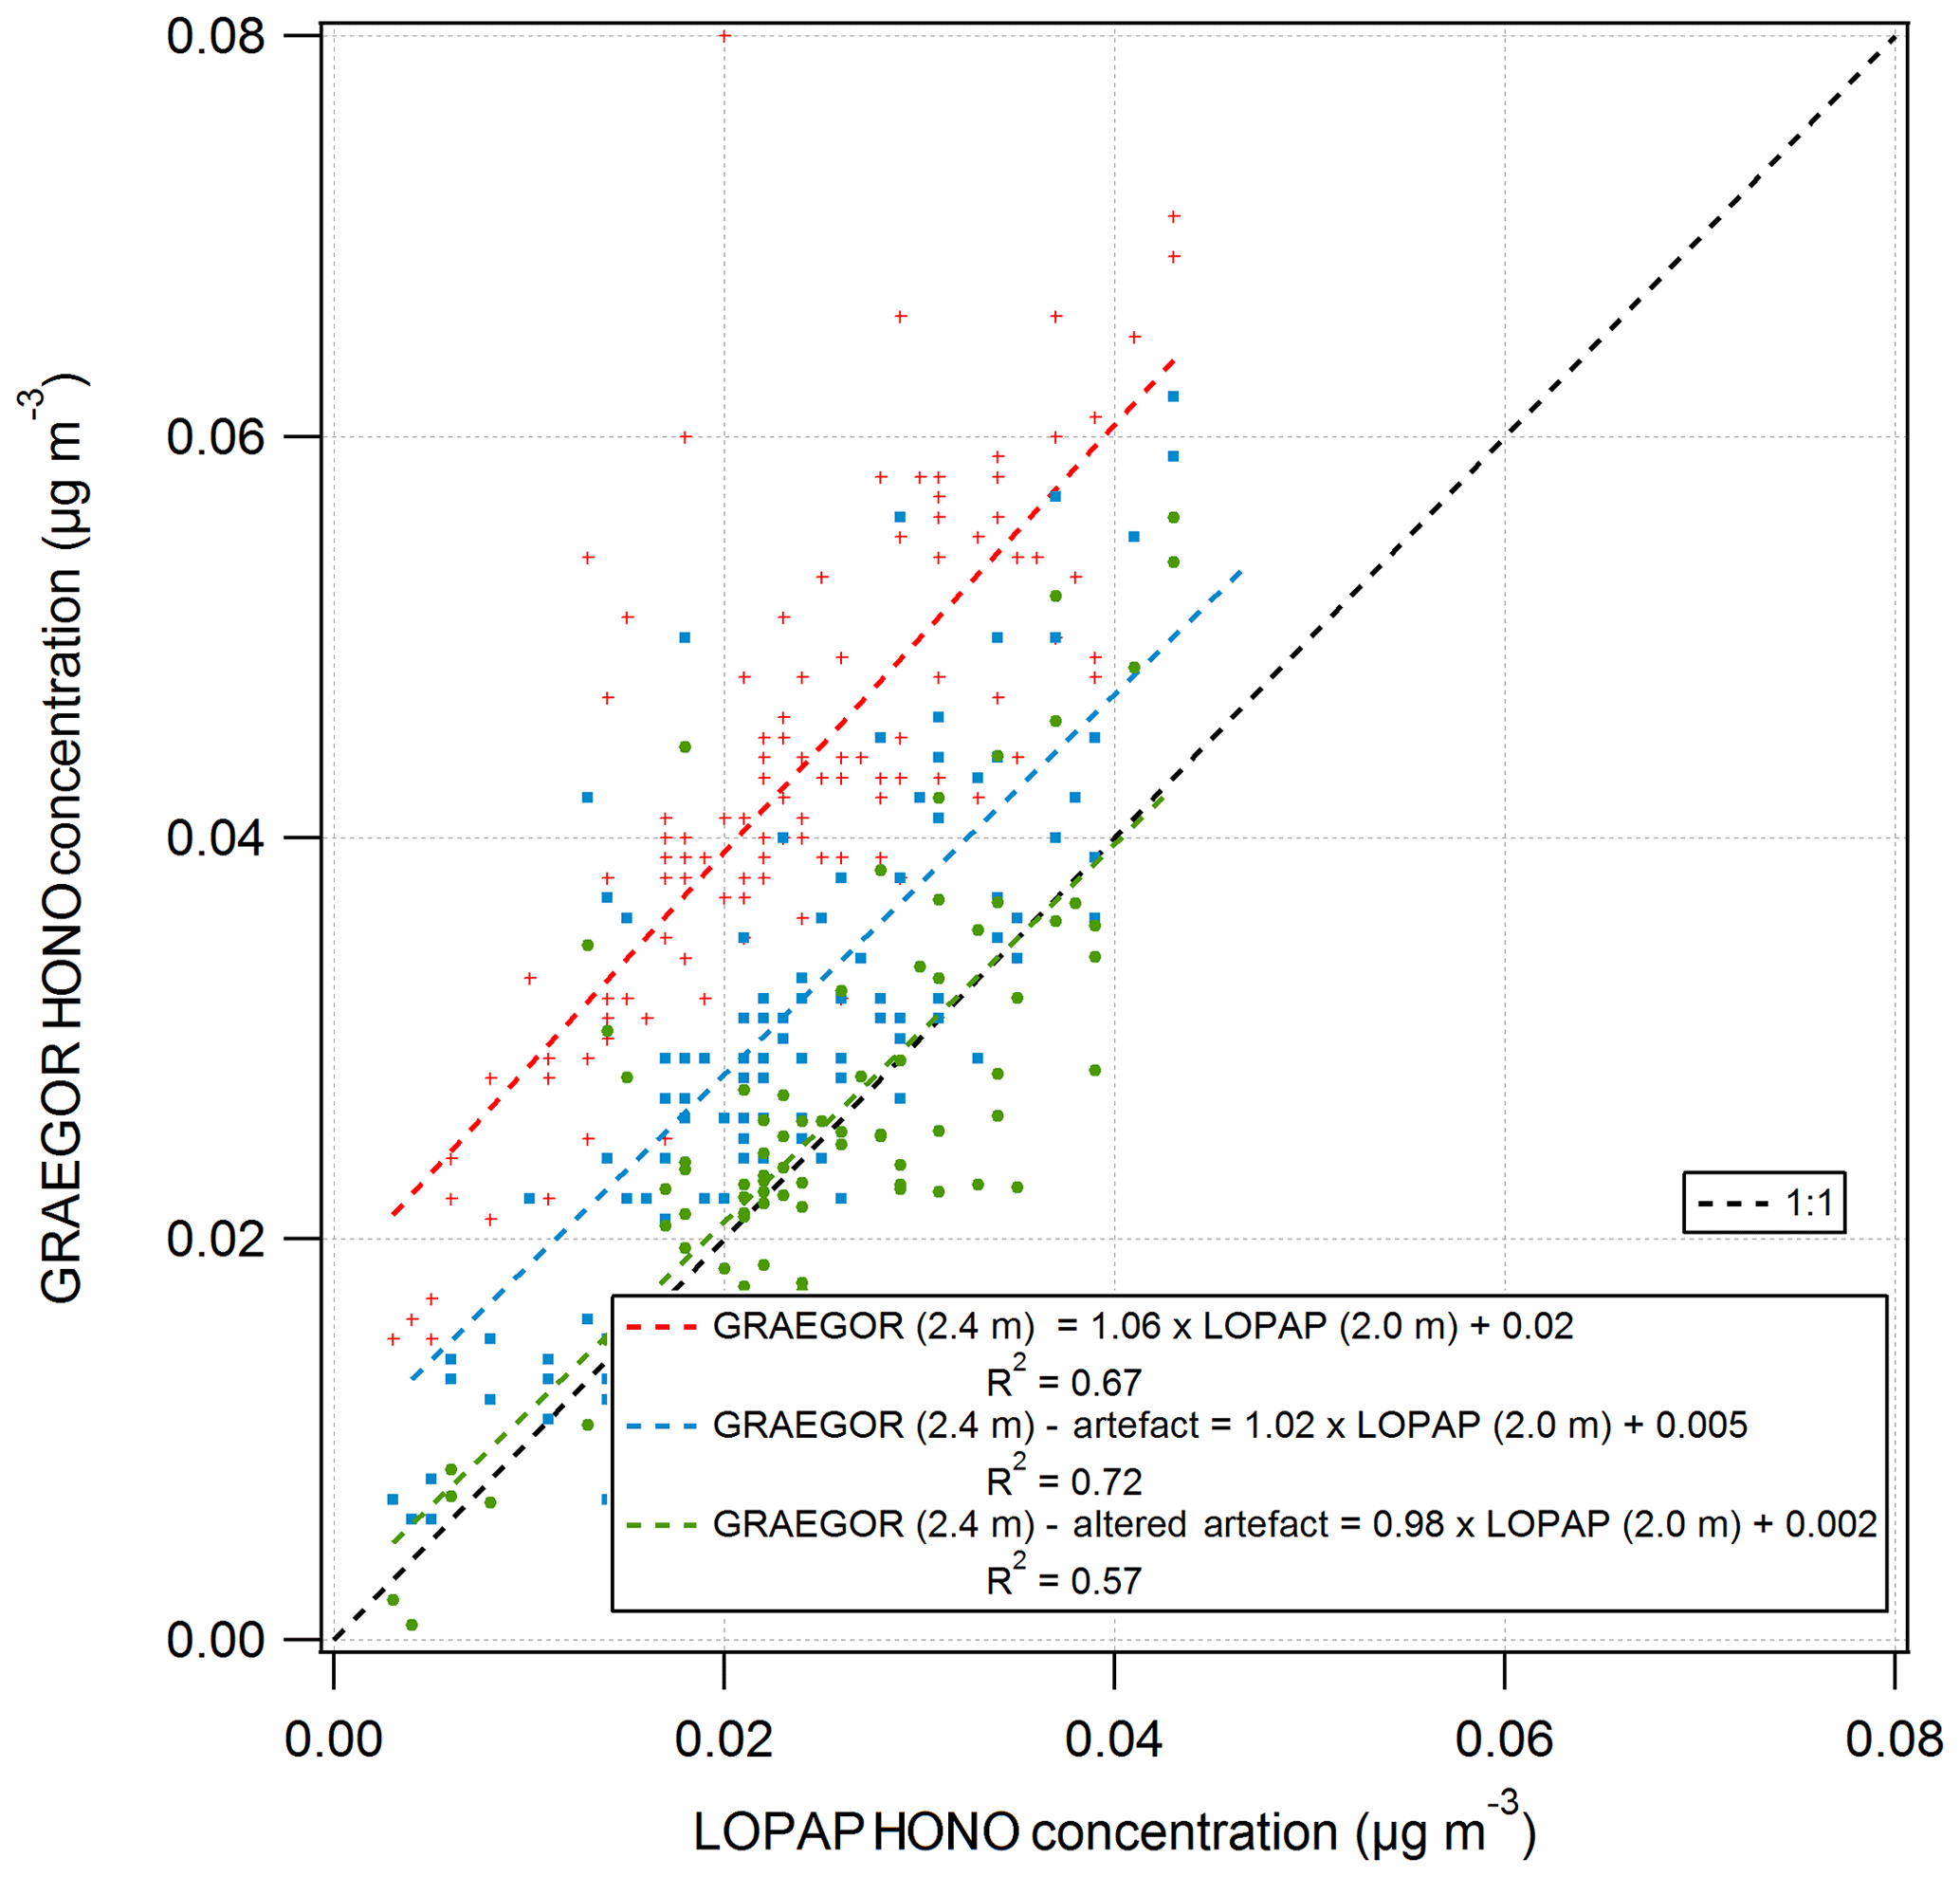
Figure 14Simple linear regression analyses between GRAEGOR (2.4 m) and LOPAP (2.0 m) without artefact reduction (red), with Spindler's artefact reduction (blue) and with a modified Spindler's artefact reduction (green) applied to GRAEGOR (2.4 m) HONO concentration.
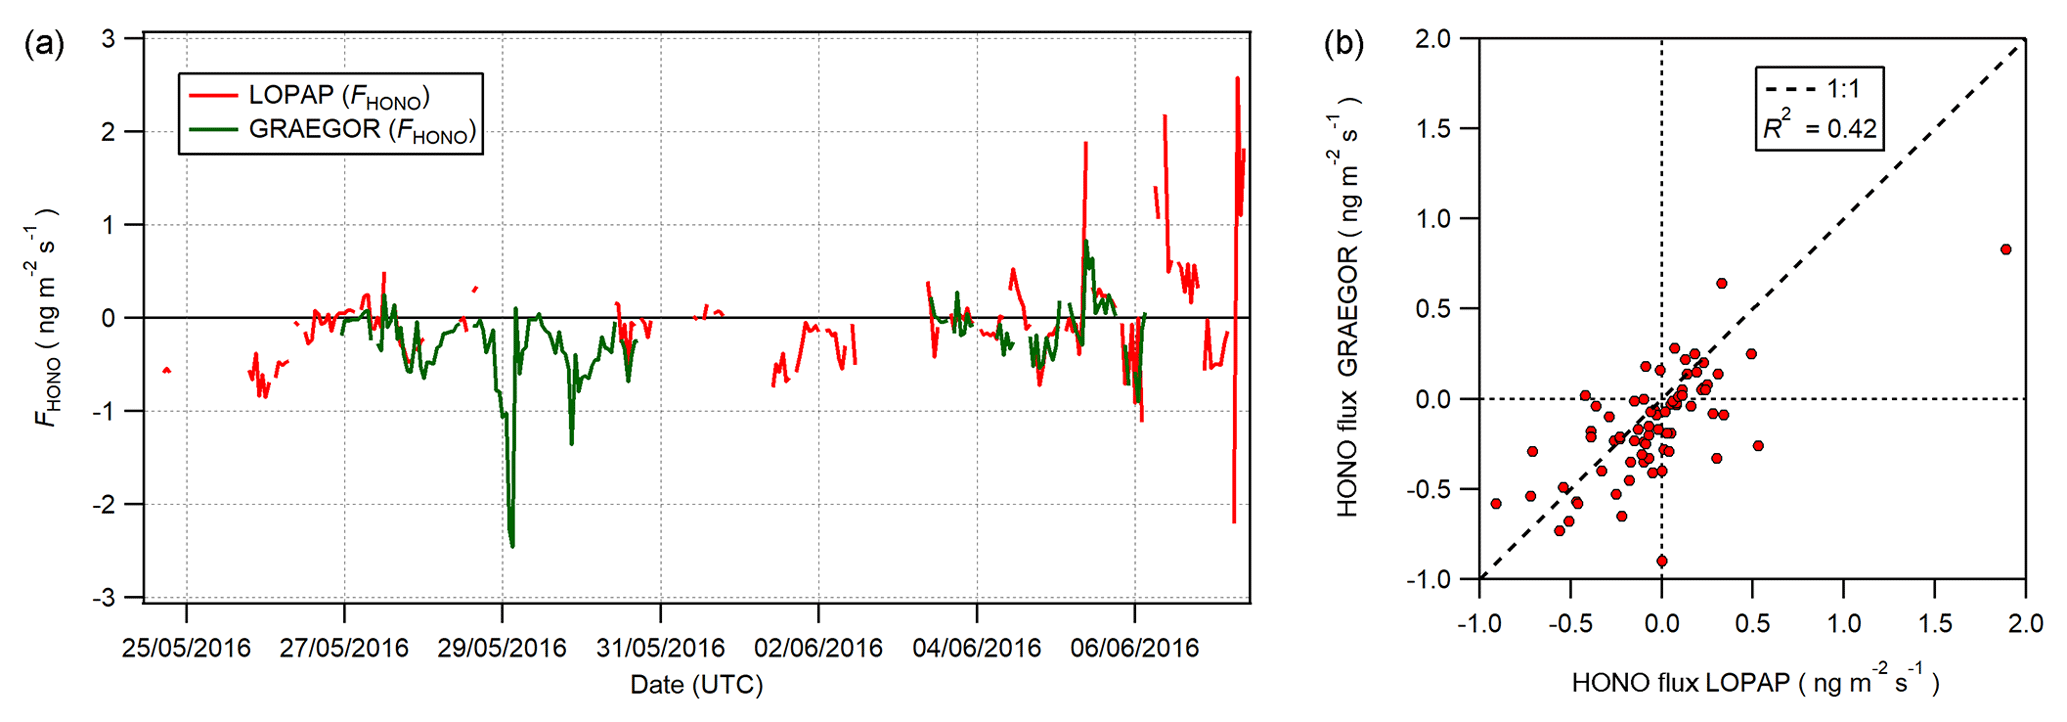
Figure 15(a) Time series of concurrent flux measurements of HONO derived from LOPAP (red) and GRAEGOR (green) measurements. (b) Scatter plot of GRAEGOR HONO flux values against LOPAP HONO flux values.
To determine whether the HONO concentration offset in the GRAEGOR measurements impacted on the measurements of HONO flux, a comparison between the HONO flux values derived from GRAEGOR and LOPAP measurements was conducted. Concurrent fluxes of HONO derived from LOPAP and GRAEGOR measurements exist for 72 hourly measurements, from 26 May to 6 June. Figure 15 shows (a) the full time series of concurrent HONO flux values derived from GRAEGOR and LOPAP measurements and (b) a scatter plot of GRAEGOR against LOPAP HONO flux values. Overall, GRAEGOR HONO fluxes are biased towards deposition, with greater deposition values and lesser emission values compared to concurrent LOPAP values. This pattern would be consistent with the concept of an artefact formation dependent upon SO2 and NO2. SO2 fluxes were unidirectionally depositional at Easter Bush during the campaign as measured by the GRAEGOR. Deposition of SO2 would lead to greater formation of artefacts within the sample box set at a higher height, which is consistent with comparisons of HONO concentrations between each sample box of the GRAEGOR and each LOPAP instrument. In turn, this would lead to a bias in HONO flux values, resulting in a skew towards deposition. It should be noted that the sample size of concurrent measurements of HONO flux from GRAEGOR and LOPAP measurements is limited (n=72).
4.4.2 Comparison of ammonia measurements with GRAEGOR and QCL
The comparison between the GRAEGOR and QCL found that, while there was reasonable agreement between the instruments, the GRAEGOR measured somewhat higher NH3 concentrations than the QCL, by a factor of 1.2. Due to a lack of ancillary micrometeorological data during this campaign, the short overlap in measurements and necessary filtering of unreliable data, there are too few concurrent measurements (15 h) of flux between the QCL and the GRAEGOR for a reliable comparison. There are also only 41 h of concurrent concentration measurements between the two instruments, which overlapped with a period of low NH3 concentrations.
A similar comparison between a WRD system (the Ammonia Measurement by Annular Denuder with Online Analysis, AMANDA) and the QCL system was conducted at the same site in 2004 and 2005 by Whitehead et al. (2008). This comparison also found that the WRD system measured higher concentrations of NH3 compared to the QCL, but at a far greater factor of 1.67. This difference was particularly pronounced during periods of low NH3 concentrations, with better agreement recorded during a fertilisation and cutting event that occurred during that study. The older (pumped) QCL used during the earlier campaign did not derive its concentrations from first principles, in contrast to the QCL used during the comparison with the GRAEGOR reported here, which should be within 3 % of the absolute value without further calibration, according to the manufacturer. An inter-comparison between 11 different measurement techniques for NH3 – including the AMANDA and two QCL instruments (the DUAL-QCLAS and the compact-QCLAS) – was conducted at the Easter Bush site in 2008 (von Bobrutzki et al., 2010). While good statistical agreement was found in linear regression between the AMANDA and both QCL instruments for NH3 concentrations throughout the entirety of the campaign (R2=0.92 and R2=0.97 for the compact-QCL and DUAL-QCLAS, respectively), there was less agreement between the instruments during periods of low (<10 ppb) NH3 concentrations (R2=0.81 and R2=0.52 for the compact-QCL and DUAL-QCLAS, respectively). During periods of low concentration, the QCL systems also underestimated NH3 concentrations compared to the AMANDA.
Any errors in the GRAEGOR's internal NH3 calibration system are unlikely to have an effect at low NH3 concentrations. As a test, the calibration values obtained from all the internal calibration checks which were carried out through the campaign (total calibrations=5) were used to calculate the NH3 concentrations during the period of QCL measurements. No significant concentration difference was found between the concentrations obtained by different calibration values, due to no systematic difference in agreement between the different calibration periods.
While there remain significant differences in measured NH3 concentrations between the GRAEGOR and QCL, the improved agreement between those concentrations, particularly at low values, compared with the results from 2004 and 2005 suggests an improved methodology in use by the QCL system in place at Easter Bush. Further measurements, particularly of fluxes and during periods of high NH3 concentrations, would be required for a more detailed analysis.
In this paper, we have presented for the first time simultaneous measurements of the trace gases HCl, HONO, HNO3, SO2 and NH3 as well as their associated water-soluble aerosols counterparts Cl−, , , and , before and after urea fertilisation of an agricultural grassland. The main findings for this study are described as follows.
-
Simultaneous measurements of the components of the NH3–NO3–NH4NO3 triad suggested formation of ammonium nitrate postfertilisation. The use of the conservative exchange fluxes tot- and tot- indicates the presence of a ground source of HNO3 postfertilisation, which would be rapidly scavenged by high postfertilisation concentrations of NH3 to form NH4NO3. Through this mechanism, use of urea fertiliser becomes a source of regional, rather than local, pollution.
-
The deposition velocities measured for the aerosol compounds Cl−, and were significantly larger than those measured for . After normalisation by turbulence, the measurements suggested a clear relationship between deposition velocity and particle size for Cl−, and , as parameterised using the proxy of compound in PM2.5∕PM10, although the relationship shows significant variability. Therefore, the high deposition velocities for aerosol compounds recorded at the site are a result of a fraction of the compounds being contained in super-micron aerosol, such as sea-salt sulfate and sodium nitrate.
-
Evidence for a HONO daytime source at the site throughout the campaign adds to the growing body of past measurements that has found evidence for HONO daytime formation in rural, urban and agricultural areas. There is also evidence for the emission of HONO postfertilisation at the site.
This also appears to be the first time a comparison between measurements of HONO concentrations determined by the LOPAP and the GRAEGOR instruments has been documented. While good linear agreement exists between HONO measurements taken by GRAEGOR and LOPAP at both measurement heights, a consistent offset in GRAEGOR HONO measurements suggests the presence of chemically induced artefacts within the GRAEGOR system. This is potentially linked to atmospheric SOx and NOx concentrations.
Furthermore, this paper presents a comparison between measurements of NH3 concentration determined by the GRAEGOR and a QCL system. While changes to the QCL operation system compared to previous studies conducted at the site have resulted in better agreement between the GRAEGOR and QCL, particularly for low NH3 concentrations, there still remain significant differences in NH3 concentrations with larger values reported by the denuder system.
Future measurements of aerosol deposition velocities should aim to investigate the effect of particle size upon deposition velocity, using a more robust measurement of particle size than used here. In addition, the ability of urea pellets to act as a potential surface on which heterogeneous formation of HONO and HNO3 occurs should be investigated, particularly as the formation of these compounds can give rise to the formation of the regional pollutant NH4NO3.
Data from the MARGA were obtained from DEFRA (2018) and are subject to Crown copyright, DEFRA, licenced under the Open Government Licence (OGL).
EN, CFDM and WJB devised the study and secured some of the funding. GRAEGOR measurements were taken by RR and CFDM. GRAEGOR data were processed by RR with input from CFDM, MMT and EN. LOPAP HONO measurements were made by CFDM, MMT, LJK and LC. The QCL NH3 measurements were made by NC and the MARGA measurements by SRL and MMT. MRJ and SRL provided field site maintenance and ancillary measurement data. RR interpreted the data with contributions from EN, CFDM, MRH, MMT, WJB, MS and MA. RR led the manuscript with contributions from all the authors.
The authors declare that they have no conflict of interest.
This work was supported through a studentship funded jointly by the Max Planck
Institute for Chemistry and the University of Edinburgh School of Chemistry,
as well as by the UK Natural Environment Research Council (NERC) through the
project Sources of Nitrous Acid in the Atmospheric Boundary Layer (SNAABL, NE/M013405/1),
with additional field-site support from NERC
National Capability funding. The QCL was operated within the framework of
the UK-China Virtual Joint Centre for Improved Nitrogen Agronomy funded
through the Newton programme and administered by the UK Biotechnology and
Biological Sciences Research Council (BBSRC).
Edited by: Leiming Zhang
Reviewed by: four anonymous referees
Acker, K., Möller, D., Wieprecht, W., Meixner, F. X., Bohn, B., Gilge, S., Plass-Dülmer, C., and Berresheim, H.: Strong daytime production of OH from HNO2 at a rural mountain site, Geophys. Res. Lett., 33, 2–5, https://doi.org/10.1029/2005GL024643, 2006.
Akiyama, H., McTaggart, I. P., Ball, B. C., and Scott, A.: N2O, NO, and NH3 emissions from soil after the application of organic fertilizers, urea and water, Water Air Soil Pollut., 156, 113–129, https://doi.org/10.1023/B:WATE.0000036800.20599.46, 2004.
Allen, A. G., Harrison, R. M., and Nicholson, K. W.: Dry deposition of fine aerosol to a short grass surface, Atmos. Environ. A-Gen., 25, 2671–2676, https://doi.org/10.1016/0960-1686(91)90197-F, 1991.
Andersen, H. V. and Hovmand, M. F.: Review of dry deposition measurements of ammonia and nitric acid to forest, For. Ecol. Manage., 114, 5–18, https://doi.org/10.1016/S0378-1127(98)00378-8, 1999.
Andreae, M. O., Elbert, W., Cai, Y., Andreae, T. W., and Gras, J.: Non-sea-salt sulfate, methanesulfonate, and nitrate aerosol concentrations and size distributions at Cape Grim, Tasmania, J. Geophys. Res.-Atmos., 104, 21695–21706, https://doi.org/10.1029/1999JD900283, 1999.
Andreae, M. O., Elbert, W., Gabriel, R., Johnson, D. W., Osborne, S., and Wood, R.: Soluble ion chemistry of the atmospheric aerosol and SO2 concentrations over the eastern North Atlantic during ACE-2, Tellus B, 52, 1066–1087, https://doi.org/10.1034/j.1600-0889.2000.00105.x, 2000.
Appel, B. R., Winer, A. M., Tokiwa, Y., and Biermann, H. W.: Comparison of atmospheric nitrous acid measurements by annular denuder and differential optical absorption systems, Atmos. Environ. A-Gen., 24, 611–616, https://doi.org/10.1016/0960-1686(90)90016-G, 1990.
Bardouki, H., Liakakou, H., Economou, C., Sciare, J., Smolík, J., Ždímal, V., Eleftheriadis, K., Lazaridis, M., Dye, C., and Mihalopoulos, N.: Chemical composition of size-resolved atmospheric aerosols in the eastern Mediterranean during summer and winter, Atmos. Environ., 37, 195–208, https://doi.org/10.1016/S1352-2310(02)00859-2, 2003.
Behera, S. N., Sharma, M., Aneja, V. P., and Balasubramanian, R.: Ammonia in the atmosphere: A review on emission sources, atmospheric chemistry and deposition on terrestrial bodies, Environ. Sci. Pollut. Res., 20, 8092–8131, https://doi.org/10.1007/s11356-013-2051-9, 2013.
Brost, R. A., Delany, A. C., and Huebert, B. J.: Numerical modeling of concentrations and fluxes of HNO3, NH3, and NH4NO3 near the surface, J. Geophys. Res., 93, 7137–7152, 1988.
Cowan, N. J., Norman, P., Famulari, D., Levy, P. E., Reay, D. S., and Skiba, U. M.: Spatial variability and hotspots of soil N2O fluxes from intensively grazed grassland, Biogeosciences, 12, 1585–1596, https://doi.org/10.5194/bg-12-1585-2015, 2015.
Dasgupta, P. K., Campbell, S. W., Al-Horr, R. S., Ullah, S. M. R., Li, J., Amalfitano, C., and Poor, N. D.: Conversion of sea salt aerosol to NaNO3and the production of HCl: Analysis of temporal behavior of aerosol chloride/nitrate and gaseous HCl/HNO3concentrations with AIM, Atmos. Environ., 41, 4242–4257, https://doi.org/10.1016/j.atmosenv.2006.09.054, 2007.
Davidson, C. I., Miller, J. M., and Pleskow, M. A.: The influence of surface structure on predicted particle dry deposition to natural grass canopies, Water. Air. Soil Pollut., 18, 25–43, https://doi.org/10.1007/BF02419401, 1982.
DEFRA: UK Air – Air Information Resource, Data Selector, available at: https://uk-air.defra.gov.uk/data/data_selector, last access: 25 September 2018.
Di Marco, C., Skiba, U., Weston, K., Hargreaves, K., and Fowler, D.: Field Scale N2O Flux Measurements from Grassland Using Eddy Covariance, Water Air, Soil Pollut. Focus, 4, 143–149, https://doi.org/10.1007/s11267-004-3024-2, 2004.
Di Marco, C. F., Kramer, L. J., Twigg, M. M., Crilley, L., Ramsay, R., Cowan, N., Coyle, M., Jones, M. R., Leeson, S. R., Bloss, W. J., and Nemitz, E.: Characterisation of HONO fluxes over grassland, in preparation, 2018.
Dollard, G. J., Atkins, D. H. F., Davies, T. J., and Healy, C.: Concentrations and dry deposition velocities of nitric acid, Nature, 326, 481–483, 1987.
Dong, H.-B., Zeng, L.-M., Hu, M., Wu, Y.-S., Zhang, Y.-H., Slanina, J., Zheng, M., Wang, Z.-F., and Jansen, R.: Technical Note: The application of an improved gas and aerosol collector for ambient air pollutants in China, Atmos. Chem. Phys., 12, 10519–10533, https://doi.org/10.5194/acp-12-10519-2012, 2012.
Elliott, K. J., Vose, J. M., Knoepp, J. D., Johnson, D. W., Swank, W. T., and Jackson, W.: Simulated effects of sulfur deposition on nutrient cycling in class I wilderness areas., J. Environ. Qual., 37, 1419–1431, https://doi.org/10.2134/jeq2007.0358, 2006.
Famulari, D., Fowler, D., Hargreaves, K. J., Milford, C., Nemitz, E., Sutton, M. A., and Weston, K.: Measuring eddy covariance fluxes of ammonia using tunable diode laser absorption spectroscopy, Water Air Soil Pollut. Focus, 4, 151–158, https://doi.org/10.1007/s11267-004-3025-1, 2004.
Farmer, D. K. and Cohen, R. C.: Observations of HNO3, ΣAN, ΣPN and NO2 fluxes: evidence for rapid HOx chemistry within a pine forest canopy, Atmos. Chem. Phys., 8, 3899–3917, https://doi.org/10.5194/acp-8-3899-2008, 2008.
Febo, A., Perrino, C., and Allegrini, I.: Measurement of nitrous acid in Milan, Italy, by DOAS and diffusion denuders, Atmos. Environ., 30, 3599–3609, https://doi.org/10.1016/1352-2310(96)00069-6, 1996.
Ferm, M.: Atmospheric ammonia and ammonium transport in Europe and critical loads: A review, Nutr. Cycl. Agroecosystems, 51, 5–17, https://doi.org/10.1023/A:1009780030477, 1998.
Fiore, A. M., Naik, V., and Leibensperger, E. M.: Air Quality and Climate Connections, J. Air Waste Manage. Assoc., 65, 645–685, https://doi.org/10.1080/10962247.2015.1040526, 2015.
Flechard, C. R.: Turbulent Exchange of Ammonia Above Vegetation, PhD Thesis, University of Nottingham, UK, 237 pp., 1998.
Flechard, C. R., Fowler, D., Sutton, M. A., and Cape, J. N.: A dynamic chemical model of bi-directional ammonia exchange between semi-natural vegetation and the atmosphere, Q. J. Roy. Meteorol. Soc., 125, 2611–2641, https://doi.org/10.1002/qj.49712555914, 2007.
Foken, T.: Micrometeorology, 2nd edn., Springer, Berlin, 2008.
Foley, J. A., Ramankutty, N., Brauman, K. A., Cassidy, E. S., Gerber, J. S., Johnston, M., Mueller, N. D., O'Connell, C., Ray, D. K., West, P. C., Balzer, C., Bennett, E. M., Carpenter, S. R., Hill, J., Monfreda, C., Polasky, S., Rockström, J., Sheehan, J., Siebert, S., Tilman, D., and Zaks, D. P. M.: Solutions for a cultivated planet, Nature, 478, 337, https://doi.org/10.1038/nature10452, 2011.
Fowler, D. and Unsworth, H. M.: Turbulent transfer of sulphur dioxide to a wheat crop, Q. J. Roy. Meteorol. Soc., 105, 767–783, https://doi.org/10.1002/qj.49710544603, 1979.
Fowler, D., Coyle, M., Skiba, U., Sutton, M. A., Cape, J. N., Reis, S., Sheppard, L. J., Jenkins, A., Grizzetti, B., Galloway, N., Vitousek, P., Leach, A., Bouwman, A. F., Butterbach-bahl, K., Dentener, F., Stevenson, D., Amann, M., Voss, M., and Fowler, D.: The global nitrogen cycle in the twenty- first century, Philis. T. R. Soc. B, https://doi.org/10.1098/rstb.2013.0164, 2013.
Gallagher, M. W., Nemitz, E., Dorsey, J. R., Fowler, D., Sutton, M. A., Flynn, M., and Duyzer, J. H.: Measurements and parameterizations of small aerosol deposition velocities to grassland, arable crops, and forest: Influence of surface roughness length on deposition, J. Geophys. Res., 107, 549, https://doi.org/10.1029/2001JD000817, 2002.
Galloway, J. N., Aber, J. D., Erisman, J. W., Seitzinger, S. P., Howarth, R. W., Cowling, E. B., and Cosby, B. J.: The Nitrogen Cascade, Bioscience, 53, 341, https://doi.org/10.1641/0006-3568(2003)053[0341:TNC]2.0.CO;2, 2003.
Garland, J. A.: The dry deposition of sulphur dioxide to land and water surfaces, Proc. R. Soc. London. Ser. A, 354, 245–268, https://doi.org/10.1098/rspa.1977.0066, 1977.
Godfray, H. C. J., Beddington, J. R., Crute, I. R., Haddad, L., Lawrence, D., Muir, J. F., Pretty, J., Robinson, S., Thomas, S. M., and Toulmin, C.: Food Security: The Challenge of Feeding 9 Billion People, Science, 327, 812–818, 2010.
Gutzwiller, L., Arens, F., Baltensperger, U., Gäggeler, H. W., and Ammann, M.: Significance of semivolatile diesel exhaust organics for secondary HONO formation, Environ. Sci. Technol., 36, 677–682, https://doi.org/10.1021/es015673b, 2002.
Harrison, R. M., Peak, J. D., and Collins, G. M.: Tropospheric cycle of nitrous acid, J. Geophys. Res.-Atmos., 101, 14429–14439, https://doi.org/10.1029/96JD00341, 1996.
Heland, J., Kleffmann, J., Kurtenbach, R., and Wiesen, P.: A new instrument to measure gaseous nitrous acid (HONO) in the atmosphere, Environ. Sci. Technol., 35, 3207–3212, https://doi.org/10.1021/es000303t, 2001.
Jones, S. K., Helfter, C., Anderson, M., Coyle, M., Campbell, C., Famulari, D., Di Marco, C., van Dijk, N., Tang, Y. S., Topp, C. F. E., Kiese, R., Kindler, R., Siemens, J., Schrumpf, M., Kaiser, K., Nemitz, E., Levy, P. E., Rees, R. M., Sutton, M. A., and Skiba, U. M.: The nitrogen, carbon and greenhouse gas budget of a grazed, cut and fertilised temperate grassland, Biogeosciences, 14, 2069–2088, https://doi.org/10.5194/bg-14-2069-2017, 2017.
Keuken, M. P., Schoonebeek, C. A., Vanwensveenlouter, A., and Slanina, J.: Simultaneous sampling of NH3, HNO3, HCl, SO2 and H2O2 in ambient air by a wet annular denuder system, Atmos. Environ., 22, 2541–2548, 1988.
Khlystov, A., Wyers, G. P., and Slanina, J.: The steam-jet aerosol collector, Atmos. Environ., 29, 2229–2234, https://doi.org/10.1016/1352-2310(95)00180-7, 1995.
Kleffmann, J.: Daytime sources of nitrous acid (HONO) in the atmospheric boundary layer, Chem. Phys. Chem., 8, 1137–1144, https://doi.org/10.1002/cphc.200700016, 2007.
Kleffmann, J. and Wiesen, P.: Technical Note: Quantification of interferences of wet chemical HONO LOPAP measurements under simulated polar conditions, Atmos. Chem. Phys., 8, 6813–6822, https://doi.org/10.5194/acp-8-6813-2008, 2008.
Kleffmann, J., Lörzer, J. C., Wiesen, P., Kern, C., Trick, S., Volkamer, R., Rodenas, M., and Wirtz, K.: Intercomparison of the DOAS and LOPAP techniques for the detection of nitrous acid (HONO), Atmos. Environ., 40, 3640–3652, https://doi.org/10.1016/j.atmosenv.2006.03.027, 2006.
Kramm, G. and Dlugi, R.: Modeling of the Vertical Fluxes of Nitric-Acid, Ammonia, and Ammonium-Nitrate, J. Atmos. Chem., 18, 319–357, 1994.
Kutsuna, S. and Ibusuki, T.: Fourier transform infrared measurement of the formation of nitrogen compounds on sodium chloride particles exposed to the ambient air in the Arctic, J. Geophys. Res., 99, 25479–25488, 1994.
Langford, B., Acton, W., Ammann, C., Valach, A., and Nemitz, E.: Eddy-covariance data with low signal-to-noise ratio: time-lag determination, uncertainties and limit of detection, Atmos. Meas. Tech., 8, 4197–4213, https://doi.org/10.5194/amt-8-4197-2015, 2015.
Laufs, S., Cazaunau, M., Stella, P., Kurtenbach, R., Cellier, P., Mellouki, A., Loubet, B., and Kleffmann, J.: Diurnal fluxes of HONO above a crop rotation, Atmos. Chem. Phys., 17, 6907–6923, https://doi.org/10.5194/acp-17-6907-2017, 2017.
Lee, J. D., Whalley, L. K., Heard, D. E., Stone, D., Dunmore, R. E., Hamilton, J. F., Young, D. E., Allan, J. D., Laufs, S., and Kleffmann, J.: Detailed budget analysis of HONO in central London reveals a missing daytime source, Atmos. Chem. Phys., 16, 2747–2764, https://doi.org/10.5194/acp-16-2747-2016, 2016.
Milford, C.: Dynamics of Atmospheric Ammonia Exchange with intensively-managed Grassland, PhD Thesis, University of Edinburgh, Edinburgh, 219 pp., 2004.
Milford, C., Theobald, M. R., Nemitz, E., and Sutton, M. A.: Dynamics of ammonia exchange in response to cutting and fertilising in an intensively-managed grass-land, Water Air Soil Pollut., 1, 167–176, 2001.
Mozurkewich, M.: The dissociation constant of ammonium nitrate and its dependence on temperature, relative humidity and particle size, Atmos. Environ. A-Gen., 27, 261–270, https://doi.org/10.1016/0960-1686(93)90356-4, 1993.
Muller, H., Kramm, G., Meixner, F., Dollard, G., Fowler, D., and Possanzini, M.: Determination of HNO3 dry deposition by modified Bowen ratio and aerodynamic profile techniques, Tellus, 45, 346–367, https://doi.org/10.1034/j.1600-0889.45.issue4.1.x, 1993.
Myhre, G., Grini, A., and Metzger, S.: Modelling of nitrate and ammonium-containing aerosols in presence of sea salt, Atmos. Chem. Phys., 6, 4809–4821, https://doi.org/10.5194/acp-6-4809-2006, 2006.
Neftel, A., Blatter, A., Hesterberg, R., and Staffelbach, T.: Measurements of concentration gradients of HNO2 and HNO3 over a semi-natural ecosystem, Atmos. Environ., 30, 3017–3025, https://doi.org/10.1016/1352-2310(96)00011-8, 1996.
Nemitz, E. and Sutton, M. A.: Gas-particle interactions above a Dutch heathland: III. Modelling the influence of the NH3-HNO3-NH4NO3 equilibrium on size-segregated particle fluxes, Atmos. Chem. Phys., 4, 1025–1045, https://doi.org/10.5194/acp-4-1025-2004, 2004.
Nemitz, E., Sutton, M. A., Schjoerring, J. K., Husted, S., and Paul Wyers, G.: Resistance modelling of ammonia exchange over oilseed rape, Agr. Forest Meteorol., 105, 405–425, https://doi.org/10.1016/S0168-1923(00)00206-9, 2000a.
Nemitz, E., Sutton, M. A., Wyers, G. P., Otjes, R. P., Schjoerring, J. K., Gallagher, M. W., Parrington, J., Fowler, D., and Choularton, T. W.: Surface/atmosphere exchange and chemical interaction of gases and aerosols over oilseed rape, Agr. Forest Meteorol., 105, 427–445, https://doi.org/10.1016/S0168-1923(00)00207-0, 2000b.
Nemitz, E., Dorsey, J. R., Flynn, M. J., Gallagher, M. W., Hensen, A., Erisman, J.-W., Owen, S. M., Dämmgen, U., and Sutton, M. A.: Aerosol fluxes and particle growth above managed grassland, Biogeosciences, 6, 1627–1645, https://doi.org/10.5194/bg-6-1627-2009, 2009a.
Nemitz, E., Hargreaves, K. J., Neftel, A., Loubet, B., Cellier, P., Dorsey, J. R., Flynn, M., Hensen, A., Weidinger, T., Meszaros, R., Horvath, L., Dämmgen, U., Frühauf, C., Löpmeier, F. J., Gallagher, M. W., and Sutton, M. A.: Intercomparison and assessment of turbulent and physiological exchange parameters of grassland, Biogeosciences, 6, 1445–1466, https://doi.org/10.5194/bg-6-1445-2009, 2009b.
Neuman, J. A., Huey, L. G., Ryerson, T. B., and Fahey, D. W.: Study of inlet materials for sampling atmospheric nitric acid, Environ. Sci. Technol., 33, 1133–1136, https://doi.org/10.1021/es980767f, 1999.
Norman, M., Spirig, C., Wolff, V., Trebs, I., Flechard, C., Wisthaler, A., Schnitzhofer, R., Hansel, A., and Neftel, A.: Intercomparison of ammonia measurement techniques at an intensively managed grassland site (Oensingen, Switzerland), Atmos. Chem. Phys., 9, 2635–2645, https://doi.org/10.5194/acp-9-2635-2009, 2009.
O'Dowd, C. D. and de Leeuw, G.: Marine aerosol production: a review of the current knowledge, Philos. T. R. Soc. A, 365, 1753–1774, https://doi.org/10.1098/rsta.2007.2043, 2007.
Oswald, R., Behrendt, T., Ermel, M., Wu, D., Su, H., Cheng, Y., Breuninger, C., Moravek, A., Mougin, E., Delon, C., Loubet, B., Pommerening-Röser, A., Sörgel, M., Pöschl, U., Hoffmann, T., Andreae, M. O., Meixner, F. X., and Trebs, I.: HONO emissions from soil bacteria as a major source of atmospheric reactive nitrogen, Science, 341, 1233–1235, https://doi.org/10.1126/science.1242266, 2013.
Pagsberg, P., Bjergbakke, E., Ratajczak, E., and Sillesen, A.: Kinetics of the gas phase reaction and the determination of the UV absorption cross sections of HONO, Chem. Phys. Lett., 272, 383–390, https://doi.org/10.1016/S0009-2614(97)00576-9, 1997.
Petroff, A., Mailliat, A., Amielh, M., and Anselmet, F.: Aerosol dry deposition on vegetative canopies. Part I: Review of present knowledge, Atmos. Environ., 42, 3625–3653, https://doi.org/10.1016/j.atmosenv.2007.09.043, 2008.
Phillips, G. J., Makkonen, U., Schuster, G., Sobanski, N., Hakola, H., and Crowley, J. N.: The detection of nocturnal N2O5 as HNO3 by alkali- and aqueous-denuder techniques, Atmos. Meas. Tech., 6, 231–237, https://doi.org/10.5194/amt-6-231-2013, 2013.
Pilegaard, K.: Processes regulating nitric oxide emissions from soils, Philos. T. R. Soc. Lond. B.-Biol. Sci., 368, 20130126, https://doi.org/10.1098/rstb.2013.0126, 2013.
Pio, C. A. and Harrison, R. M.: The equilibrium of ammonium chloride aerosol with gaseous hydrochloric acid and ammonia under tropospheric conditions, Atmos. Environ., 21, 1243–1246, https://doi.org/10.1016/0004-6981(87)90253-8, 1987.
Pryor, S. C., Gallagher, M., Sievering, H., Larsen, S. E., Barthelmie, R. J., Birsan, F., Nemitz, E., Rinne, J., Kulmala, M., Grönholm, T., Taipale, R., and Vesala, T.: A review of measurement and modelling results of particle atmosphere-surface exchange, Tellus B, 60, 42–75, https://doi.org/10.1111/j.1600-0889.2007.00298.x, 2008.
Robertson, G. P., Bruulsema, T. W., Gehl, R. J., Kanter, D., Mauzerall, D. L., Rotz, C. A., and Williams, C. O.: Nitrogen-climate interactions in US agriculture, Biogeochemistry, 114, 41–70, https://doi.org/10.1007/s10533-012-9802-4, 2013.
Rumsey, I. C. and Walker, J. T.: Application of an online ion-chromatography-based instrument for gradient flux measurements of speciated nitrogen and sulfur, Atmos. Meas. Tech., 9, 2581–2592, https://doi.org/10.5194/amt-9-2581-2016, 2016.
Scharko, N. K., Schütte, U. M. E., Berke, A. E., Banina, L., Peel, H. R., Donaldson, M. A., Hemmerich, C., White, J. R., and Raff, J. D.: Combined Flux Chamber and Genomics Approach Links Nitrous Acid Emissions to Ammonia Oxidizing Bacteria and Archaea in Urban and Agricultural Soil, Environ. Sci. Technol., 49, 13825–13834, https://doi.org/10.1021/acs.est.5b00838, 2015.
Slanina, J., Ten Brink, H. M., Otjes, R. P., Even, A., Jongejan, P., Khlystov, A., Waijers-Ijpelaan, A., Hu, M., and Lu, Y.: The continuous analysis of nitrate and ammonium in aerosols by the steam jet aerosol collector (SJAC): extension and validation of the methodology, Atmos. Environ., 35, 2319–2330, https://doi.org/10.1016/S1352-2310(00)00556-2, 2001.
Slinn, S. A. and Slinn, W. G. N.: Predictions for particle deposition on natural waters, Atmos. Environ., 14, 1013–1016, https://doi.org/10.1016/0004-6981(80)90032-3, 1980.
Slinn, W. G. N.: Predictions for particle deposition to vegetative canopies, Atmos. Environ., 16, 1785–1794, https://doi.org/10.1016/0004-6981(82)90271-2, 1982.
Sommer, S. G. and Hutchings, N. J.: Ammonia emission from field applied manure and its reduction – Invited paper, Eur. J. Agron., 15, 1–15, https://doi.org/10.1016/S1161-0301(01)00112-5, 2001.
Sörgel, M., Trebs, I., Serafimovich, A., Moravek, A., Held, A., and Zetzsch, C.: Simultaneous HONO measurements in and above a forest canopy: influence of turbulent exchange on mixing ratio differences, Atmos. Chem. Phys., 11, 841–855, https://doi.org/10.5194/acp-11-841-2011, 2011.
Sörgel, M., Trebs, I., Wu, D., and Held, A.: A comparison of measured HONO uptake and release with calculated source strengths in a heterogeneous forest environment, Atmos. Chem. Phys., 15, 9237–9251, https://doi.org/10.5194/acp-15-9237-2015, 2015.
Soussana, J. F., Allard, V., Pilegaard, K., Ambus, P., Amman, C., Campbell, C., Ceschia, E., Clifton-Brown, J., Czobel, S., Domingues, R., Flechard, C., Fuhrer, J., Hensen, A., Horvath, L., Jones, M., Kasper, G., Martin, C., Nagy, Z., Neftel, A., Raschi, A., Baronti, S., Rees, R. M., Skiba, U., Stefani, P., Manca, G., Sutton, M., Tuba, Z., and Valentini, R.: Full accounting of the greenhouse gas (CO2, N2O, CH4) budget of nine European grassland sites, Agr. Ecosyst. Environ., 121, 121–134, https://doi.org/10.1016/j.agee.2006.12.022, 2007.
Spindler, G., Hesper, J., Brüggemann, E., Dubois, R., Müller, T., and Herrmann, H.: Wet annular denuder measurements of nitrous acid: Laboratory study of the artefact reaction of NO2 with S(IV) in aqueous solution and comparison with field measurements, Atmos. Environ., 37, 2643–2662, https://doi.org/10.1016/S1352-2310(03)00209-7, 2003.
Su, H., Cheng, Y. F., Shao, M., Gao, D. F., Yu, Z. Y., Zeng, L. M., Slanina, J., Zhang, Y. H., and Wiedensohler, A.: Nitrous acid (HONO) and its daytime sources at a rural site during the 2004 PRIDE-PRD experiment in China, J. Geophys. Res., 113, D14312, https://doi.org/10.1029/2007jd009060, 2008.
Su, H., Cheng, Y., Oswald, R., Behrendt, T., Trebs, I., Meixner, F. X., Andreae, M. O., Cheng, P., Zhang, Y., and Pöschl, U.: Soil nitrite as a source of atmospheric HONO and OH radicals, Science, 333, 1616–1618, https://doi.org/10.1126/science.1207687, 2011.
Suter, H., Sultana, H., Turner, D., Davies, R., Walker, C., and Chen, D.: Influence of urea fertiliser formulation, urease inhibitor and season on ammonia loss from ryegrass, Nutr. Cycl. Agroecosys., 95, 175–185, https://doi.org/10.1007/s10705-013-9556-y, 2013.
Sutton, M. A., Nemitz, E., Erisman, J. W., Beier, C., Bahl, K. B., Cellier, P., de Vries, W., Cotrufo, F., Skiba, U., Di Marco, C., Jones, S., Laville, P., Soussana, J. F., Loubet, B., Twigg, M., Famulari, D., Whitehead, J., Gallagher, M. W., Neftel, A., Flechard, C. R., Herrmann, B., Calanca, P. L., Schjoerring, J. K., Daemmgen, U., Horvath, L., Tang, Y. S., Emmett, B. A., Tietema, A., Peñuelas, J., Kesik, M., Brueggemann, N., Pilegaard, K., Vesala, T., Campbell, C. L., Olesen, J. E., Dragosits, U., Theobald, M. R., Levy, P., Mobbs, D. C., Milne, R., Viovy, N., Vuichard, N., Smith, J. U., Smith, P., Bergamaschi, P., Fowler, D., and Reis, S.: Challenges in quantifying biosphere-atmosphere exchange of nitrogen species, Environ. Pollut., 150, 125–139, https://doi.org/10.1016/j.envpol.2007.04.014, 2007.
Sutton, M. A., Nemitz, E., Milford, C., Campbell, C., Erisman, J. W., Hensen, A., Cellier, P., David, M., Loubet, B., Personne, E., Schjoerring, J. K., Mattsson, M., Dorsey, J. R., Gallagher, M. W., Horvath, L., Weidinger, T., Meszaros, R., Dämmgen, U., Neftel, A., Herrmann, B., Lehman, B. E., Flechard, C., and Burkhardt, J.: Dynamics of ammonia exchange with cut grassland: synthesis of results and conclusions of the GRAMINAE Integrated Experiment, Biogeosciences, 6, 2907–2934, https://doi.org/10.5194/bg-6-2907-2009, 2009.
Thomas, R. M., Trebs, I., Otjes, R., Jongejan, P. A. C. C., Ten Brink, H., Phillips, G., Kortner, M., Meixner, F. X., and Nemitz, E.: An automated analyzer to measure surface-atmosphere exchange fluxes of water soluble inorganic aerosol compounds and reactive trace gases, Environ. Sci. Technol., 43, 1412–1418, https://doi.org/10.1021/es8019403, 2009.
Trebs, I., Meixner, F. X., Slanina, J., Otjes, R., Jongejan, P., and Andreae, M. O.: Real-time measurements of ammonia, acidic trace gases and water-soluble inorganic aerosol species at a rural site in the Amazon Basin, Atmos. Chem. Phys., 4, 967–987, https://doi.org/10.5194/acp-4-967-2004, 2004.
Twigg, M. M., House, E., Thomas, R., Whitehead, J., Phillips, G. J., Famulari, D., Fowler, D., Gallagher, M. W., Cape, J. N., Sutton, M. A., and Nemitz, E.: Surface/atmosphere exchange and chemical interactions of reactive nitrogen compounds above a manured grassland, Agr. Forest Meteorol., 151, 1488–1503, https://doi.org/10.1016/j.agrformet.2011.06.005, 2011.
Twigg, M. M., Di Marco, C. F., Leeson, S., van Dijk, N., Jones, M. R., Leith, I. D., Morrison, E., Coyle, M., Proost, R., Peeters, A. N. M., Lemon, E., Frelink, T., Braban, C. F., Nemitz, E., and Cape, J. N.: Water soluble aerosols and gases at a UK background site – Part 1: Controls of PM2.5 and PM10 aerosol composition, Atmos. Chem. Phys., 15, 8131–8145, https://doi.org/10.5194/acp-15-8131-2015, 2015.
Van der Eerden, L. J., Lekkerkerk, L. J., Smeulders, S. M., and Jansen, A. E.: Effects of atmospheric ammonia and ammonium sulphate on Douglas fir (Pseudotsuga menziesii), Environ. Pollut., 76, 1–9, 1992.
Van Oss, R., Duyzer, J., and Wyers, P.: The influence of gas-to-particle conversion on measurements of ammonia exchange over forest, Atmos. Environ., 32, 465–471, https://doi.org/10.1016/S1352-2310(97)00280-X, 1998.
Vieno, M., Heal, M. R., Hallsworth, S., Famulari, D., Doherty, R. M., Dore, A. J., Tang, Y. S., Braban, C. F., Leaver, D., Sutton, M. A., and Reis, S.: The role of long-range transport and domestic emissions in determining atmospheric secondary inorganic particle concentrations across the UK, Atmos. Chem. Phys., 14, 8435–8447, https://doi.org/10.5194/acp-14-8435-2014, 2014.
von Bobrutzki, K., Braban, C. F., Famulari, D., Jones, S. K., Blackall, T., Smith, T. E. L., Blom, M., Coe, H., Gallagher, M., Ghalaieny, M., McGillen, M. R., Percival, C. J., Whitehead, J. D., Ellis, R., Murphy, J., Mohacsi, A., Pogany, A., Junninen, H., Rantanen, S., Sutton, M. A., and Nemitz, E.: Field inter-comparison of eleven atmospheric ammonia measurement techniques, Atmos. Meas. Tech., 3, 91–112, https://doi.org/10.5194/amt-3-91-2010, 2010.
Vong, R. J., Vickers, D., and Covert, D. S.: Eddy correlation measurements of aerosol deposition to grass, Tellus B, 56, 105–117, https://doi.org/10.1111/j.1600-0889.2004.00098.x, 2004.
Wang, J. and Bras, L. R.: A new method for estimation of sensible heat flux from air temperature, Water Resour. Res., 34, 2281–2288, https://doi.org/10.1029/98WR01698, 1998.
Wesely, M. L., Cook, D. R., and Hart, R. L.: Sulfur Dry Deposition Over Grass, J. Geophys. Res., 90, 2131–2143, 1985.
Whitehead, J. D., Twigg, M., Famulari, D., Nemitz, E., Sutton, M. a, Gallagher, M. W. and Fowler, D.: Evaluation of laser absorption spectroscopic techniques for eddy covariance flux measurements of ammonia, Environ. Sci. Technol., 42, 2041–2046, https://doi.org/10.1021/es071596u, 2008.
Wolff, V., Trebs, I., Ammann, C., and Meixner, F. X.: Aerodynamic gradient measurements of the NH3-HNO3-NH4NO3 triad using a wet chemical instrument: an analysis of precision requirements and flux errors, Atmos. Meas. Tech., 3, 187–208, https://doi.org/10.5194/amt-3-187-2010, 2010a.
Wolff, V., Trebs, I., Foken, T., and Meixner, F. X.: Exchange of reactive nitrogen compounds: concentrations and fluxes of total ammonium and total nitrate above a spruce canopy, Biogeosciences, 7, 1729–1744, https://doi.org/10.5194/bg-7-1729-2010, 2010b.
Wyers, G. P., Otjes, R. P., and Slanina, J.: A continuous-flow denuder for the measurement of ambient concentrations and surface-exchange fluxes of ammonia, Atmos. Environ. A-Gen., 27, 2085–2090, https://doi.org/10.1016/0960-1686(93)90280-C, 1993.
Yeatman, S. G., Spokes, L. J., and Jickells, T. D.: Comparisons of coarse-mode aerosol nitrate and ammonium at two polluted coastal sites, Atmos. Environ., 35, 1321–1335, https://doi.org/10.1016/S1352-2310(00)00452-0, 2001.
Zöll, U., Brümmer, C., Schrader, F., Ammann, C., Ibrom, A., Flechard, C. R., Nelson, D. D., Zahniser, M., and Kutsch, W. L.: Surface–atmosphere exchange of ammonia over peatland using QCL-based eddy-covariance measurements and inferential modeling, Atmos. Chem. Phys., 16, 11283–11299, https://doi.org/10.5194/acp-16-11283-2016, 2016.