the Creative Commons Attribution 4.0 License.
the Creative Commons Attribution 4.0 License.
 | 26 Nov 2018
Spatial and seasonal variations of aerosols over China from two decades of multi-satellite observations – Part 2: AOD time series for 1995–2017 combined from ATSR ADV and MODIS C6.1 and AOD tendency estimations
Larisa Sogacheva
Edith Rodriguez
Pekka Kolmonen
Timo H. Virtanen
Giulia Saponaro
Gerrit de Leeuw
Aristeidis K. Georgoulias
Georgia Alexandri
Konstantinos Kourtidis
Ronald J. van der A
Understanding long-term variations in aerosol loading is essential for evaluating the health and climate effects of airborne particulates as well as the effectiveness of pollution control policies. The expected satellite lifetime is about 10 to 15 years. Therefore, to study the variations of atmospheric constituents over longer periods information from different satellites must be utilized.
Here we introduce a method to construct a combined annual and seasonal long time series of AOD at 550 nm using the Along-Track Scanning Radiometers (ATSR: ATSR-2 and AATSR combined) and the MODerate resolution Imaging Spectroradiometer on Terra (MODIS/Terra), which together cover the 1995–2017 period. The long-term (1995–2017) combined AOD time series are presented for all of mainland China, for southeastern (SE) China and for 10 selected regions in China. Linear regression was applied to the combined AOD time series constructed for individual L3 (1∘ × 1∘) pixels to estimate the AOD tendencies for two periods: 1995–2006 (P1) and 2011–2017 (P2), with respect to the changes in the emission reduction policies in China.
During P1, the annually averaged AOD increased by 0.006 (or 2 % of the AOD averaged over the corresponding period) per year across all of mainland China, reflecting increasing emissions due to rapid economic development. In SE China, the annual AOD positive tendency in 1995–2006 was 0.014 (3 %) per year, reaching maxima (0.020, or 4 %, per year) in Shanghai and the Pearl River Delta regions. After 2011, during P2, AOD tendencies reversed across most of China with the annually averaged AOD decreasing by −0.015 (−6 %) per year in response to the effective reduction of the anthropogenic emissions of primary aerosols, SO2 and NOx. The strongest AOD decreases were observed in the Chengdu (−0.045, or −8 %, per year) and Zhengzhou (−0.046, or −9 %, per year) areas, while over the North China Plain and coastal areas the AOD decrease was lower than −0.03 (approximately −6 %) per year. In the less populated areas the AOD decrease was small.
The AOD tendency varied by both season and region. The increase in the annually averaged AOD during P1 was mainly due to an increase in summer and autumn in SE China (0.020, or 4 %, and 0.016, or 4 %, per year, respectively), while during winter and spring the AOD actually decreased over most of China. The AOD negative tendencies during the 2011–2017 period were larger in summer than in other seasons over the whole of China (ca. −0.021, or −7 %, per year) and over SE China (ca. −0.048, or −9 %, per year).
The long-term AOD variations presented here show a gradual decrease in the AOD after 2011 with an average reduction of 30 %–50 % between 2011 and 2017. The effect is more visible in the highly populated and industrialized regions in SE China, as expected.
- Article
(7490 KB) - Full-text XML
- BibTeX
- EndNote


Atmospheric aerosols play an important role in climate change through both direct and indirect processes. In order to evaluate the effects of aerosols on climate, it is necessary to study their spatial and temporal distributions. Understanding the long-term changes and the trend in the AOD on the Earth, especially in developing countries like China, is becoming increasingly essential for the accurate assessment of the radiative forcing effects on climate (Li et al., 2013). The rapid development of industry, traffic and urbanization, the combustion of fossil fuel, and the emissions of industrial fumes and contaminated gas lead has to a significant increase in atmospheric aerosols, which do not only affect climate, but also constitute a threat to human health (Tie et al., 2009; Cao et al., 2017). Consequently, it is critical for environmental and epidemiological studies to accurately investigate the fine-scale spatial and temporal changes in aerosol concentrations related to industrialization and urbanization (Streets et al., 2009; Kanakidou, 2014).
The air pollution in China is severe (Bouarar et al., 2017), widely distributed and the atmospheric chemical reactions are complex (Kulmala, 2015). The strong economic growth in China (World Bank, 2017; Morrison, 2018) has significantly raised the living standards (Zhang, 2017), but it has also caused serious environmental damage and degradation (Tang et al., 2015). In the period from 1970 to 1990, the dominant contributing sources were large and small coal burning stoves that were widely used in power plants, industry, utilities and households (Jin et al., 2016). Coal smoke mainly contains sulphuric acid (SO2), particulate matter, nitrogen oxides (NOx) and carbon monoxide (CO), which affect air quality due to atmospheric aerosol formation (Sihto et al., 2006; Fuzzi et al., 2015; Sarrafzadeh et al., 2016; Nzihou and Stanmore, 2015). Other sources, such as dust from construction sites, mainly consist of primary PMs. During the period from 1990 to 2000, the growing number of vehicles, mainly in megacities, greatly contributed to the increase in NOx and volatile organic compounds (VOCs). Since 2000, anthropogenic air pollution has been ingrained in Chinese megacities and is spreading to the regional level (Jin et al., 2016). However, national and regional plans, and environmental laws, rules and standards exist in China, which are revised with the Five-Year Plan, which are series of social and economic development initiatives (Jin et al., 2016).
Further urbanization is a consequence of a growing industry. During the 1978–2016 period, more than 550 million migrants moved to China's cities, resulting in a large rise in the urban population from 18 to 57 % (Zhang, 2017). The coastal regions where manufacturing and services are better developed, especially big cities, were the principal destinations (Chan, 2012). During the last 2 decades, a strong population inflow to eastern China has been reported (Ma and Chen, 2012; Center for International Earth Science Information Network – CIESIN – Columbia University, 2017). The population in the North China Plain, the Yangtze River Delta and the Pearl River Delta has been steadily increasing mainly due to the growth of large cities, or metropolises (Fig. 1), on account of migration from less industrialized areas (see also Kourtidis et al., 2015; Stathopoulos et al., 2017). The population density increased in the Beijing–Tianjin–Hebei area, Shanghai, Xiamen and Guangzhou, by more than 200 % in the 2000–2015 period, while in Wuhan, Chengdu and Zhengzhou the population grew by nearly 50 %. Such strong population growth has resulted in fast urbanization and further industrialization and infrastructure development in those regions.
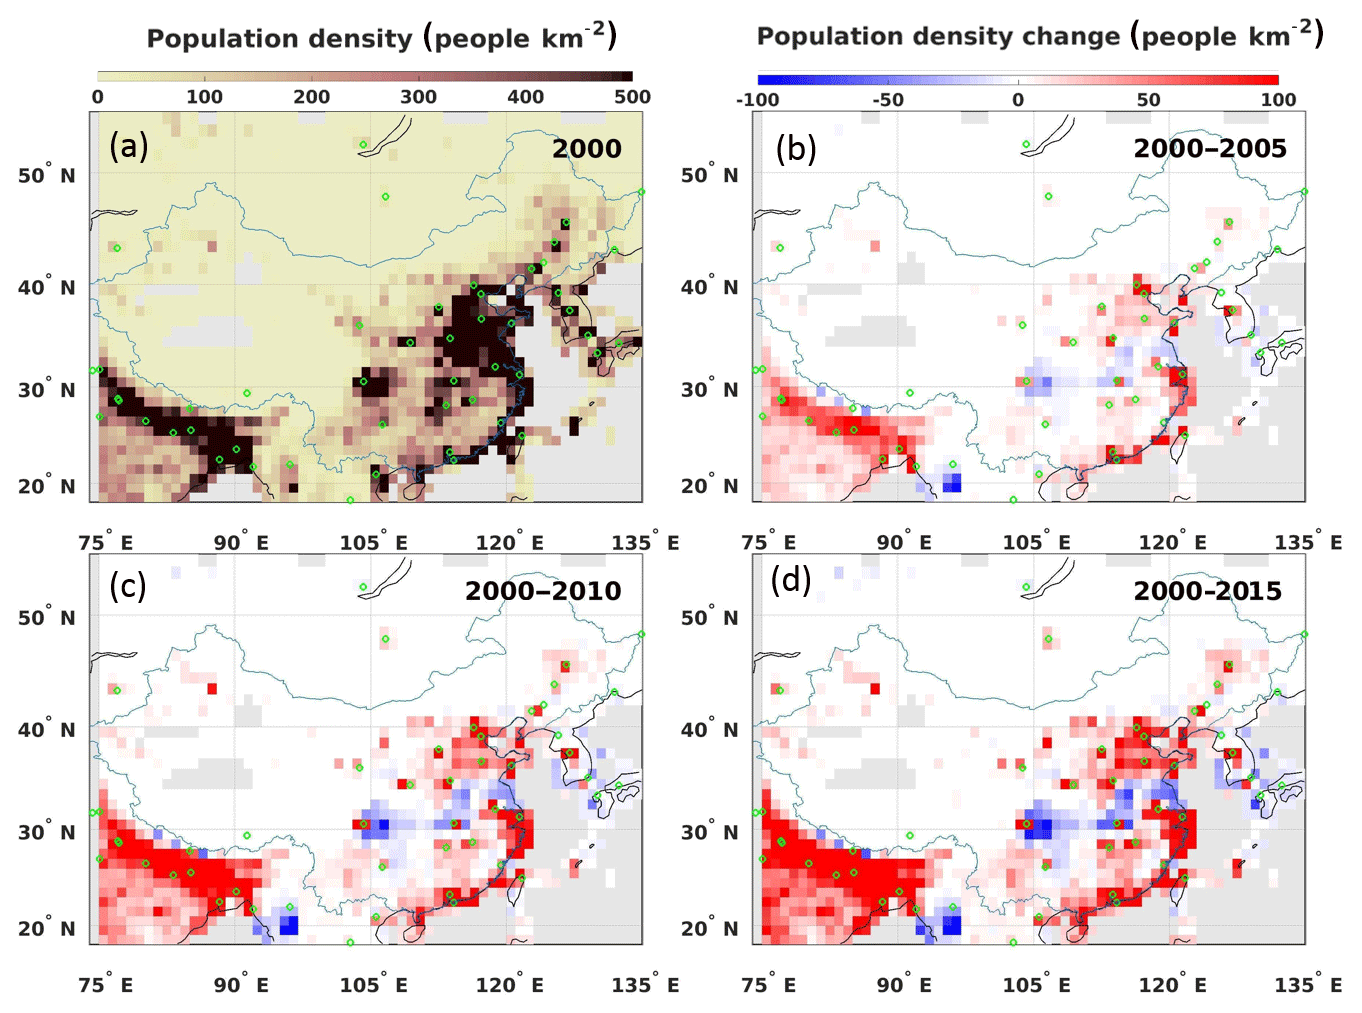
Figure 1The population density in China (https://doi.org/10.7927/H4DZ068D, last access: 21 November 2018) in 2000, (a) and the population density change in 2005 (b), 2010 (c) and 2015 (d) compared with 2000. Megacities are marked using green circles.
Due to the sparse surface network in China and limited data availability, satellite remote sensing is increasingly used to study the long-term changes in aerosol properties in this area. Satellite remote sensing is a rapidly developing technology that may provide good temporal sampling and superior spatial coverage for studying aerosols. The most common parameter derived from satellite observations is the aerosol optical depth (AOD), which is a measure of the extinction of solar radiation at a given wavelength due to the presence of aerosols integrated over the atmospheric column. AOD is a key factor for the estimation of the aerosol concentration, the evaluation of atmospheric conditions and the effect of atmospheric aerosols on climate.
Su et al. (2010) analyzed the AOD distribution over 10 locations in East Asia using the yearly mean AOD products from the POLDER (Polarization and Directionality of the Earth's Reflectance) radiometer during the period from 2005 to 2009 and showed that the spatial distribution of fine-mode aerosols over East Asia is highly associated with human activities. Xie and Xia (2008) reported statistically significant increasing AOD trends in spring and summer in northern China annually during the period from 1982 to 2001 using the Total Ozone Mapping Spectrometer (TOMS). They also demonstrated the increasing tendency of AOD (500 nm) from 1980 to 1991 and a reverse tendency from 1997 to 2001 in northern China. Guo et al. (2012), who analyzed the AOD trends of TOMS and MODIS in China from 1982 to 2008, reported similar findings. The spatial variation in AOD suggests no apparent upward trends in the 1980s; since 1990, both TOMS and MODIS indicate a significant AOD increase across China (Guo et al., 2012). Seasonal patterns in the AOD regional long-term trend are revealed. As shown by Guo et al. (2011), AODs mostly exhibit similar seasonality during the period from 1980 to 2001: an AOD maxima is observed in winter (except for over the Taklimakan Desert), in summer the AOD is higher than in autumn; however, there is no such seasonality in 2000–2008. Li et al. (2014) reported opposite AOD trends in different locations in China using observations from the Aerosol Robotic Network (AERONET, Holben et al., 1998). Increasing trends in China over the last few decades are revealed by Wang et al. (2017), while a few recent studies (Zhang et al., 2016, 2017; He et al., 2016; Mehta et al., 2016; Zhao et al., 2017) have shown decreasing trends in China over the last few years.
The expected satellite lifetime is about 10 to 15 years. Therefore, to study the variations of atmospheric constituents over longer periods, the information from different satellites must be utilized (Weatherhead et al., 2017). Combining multiple sensors could increase the data availability period and reduce data uncertainties (Li et al., 2016).
In this study, we introduce a method to combine seasonal and annual AOD data retrieved from the Along-Track Scanning Radiometer (ATSR-2 and AATSR, hereafter referred to as ATSR) instruments and the MODerate resolution Imaging Spectroradiometer on Terra (MODIS/Terra) to create multi-decadal time series covering the period from 1995 to 2017 to investigate AOD tendencies in China. The method is based on the results from the comparison between ATSR and MODIS AOD products presented in Sogacheva et al. (2018), further referred to as “Part 1”. We also investigate whether the tendencies in AOD are related to the pollution control policies in China. In view of the spatial AOD variations across China (de Leeuw et al., 2018; Part 1, and references cited therein), we present combined AOD time series and estimate AOD tendencies for different regions in China.
The objectives of this study are as follows: (1) to combine the AATSR Dual View (ADV, Ver2.31) and MODIS/Terra Collection 6.1 (C6.1) seasonal and annual aerosol data from 1995 to 2017, and (2) to analyze the spatial and temporal variations of the seasonally and annually averaged AOD and link the AOD tendencies to emission control policies in China.
The paper is structured as follows. The AATSR and MODIS/Terra AOD products are briefly introduced in Sect. 2, including a short description of the instruments, aerosol retrieval algorithms, datasets and validation results (for more details see Part 1). The study area is discussed in Sect. 3, where 10 selected regions are introduced. In Sect. 4, a method is presented to construct the combined dataset from ATSR (1995–2011) and MODIS (2000–2017) seasonal and annual AOD, and the AOD correction applied to ATSR and MODIS AOD is discussed (Sect. 4.1). The long-term annual and seasonal combined AOD time series are then introduced (Sect. 4.2) and evaluated against AERONET data (Sect. 4.3). In Sect. 5 we present and discuss the results for the AOD evolution over China (Sect. 5.1) and relate them to changes in the emission reduction policies (Sect. 5.2). The AOD tendencies for selected periods and regions are presented and discussed in Sect. 5.3. The main conclusions are summarized in Sect. 6.
China covers a huge territory with significant regional differences (Fig. 2). The climate in China varies from subarctic (north) to subtropical (south). The west and north of the country are dominated by deserts (such as the Gobi and the Taklamakan), rolling plateaus and towering massifs. The southern areas of the country comprise hilly and mountainous terrain. The eastern plains and southern coasts consist of fertile lowlands and foothills. Therefore, the contradictions between the economic growth and the environmental quality have varying dimensions in different regions. The largest agricultural provinces are Henan, Sichuan, Hunan, Anhui and Jiangsu, which display low population growth, and Shandong, Heilongjiang, and Hubei, which have balanced urbanization and agricultural development. Hence, corresponding differences among regions exist due to land urbanization (Lin et al., 2015). The highest population density is observed in the east and southeast (Fig. 1). Cities with rapid land urbanization are mainly distributed in the coastal regions and are also scattered throughout the inland regions, whilst the provinces in the western China are sparsely populated areas. Therefore, from a regional perspective, there are large differences in the levels of economic development in China – SE China being far more developed than the central and western regions. Moreover, this gap between these regions is expanding (Yang and Wang, 2013).
As in Part 1, in this paper we focus on the entire area of mainland China, i.e., the area between 18–54∘ N and 73–135∘ E defined as 1∘ × 1∘ grid cells with retrievals over land and constrained by the borders indicated by the black line in Fig. 2. Purple lines indicate SE China, defined in this study as the overland area between 20∘–41∘ N and 103∘–135∘ E. The numbers indicate the 10 study regions. Regions 1–7 almost cover the entire SE China area. Region 8 covers the Tibetan Plateau, region 9 is over the Taklamakan Desert, and region 10 is over northeastern (NE) China. Note that all areas used in this study only consider the AOD over mainland China, i.e., AOD over the oceans or islands is not included.
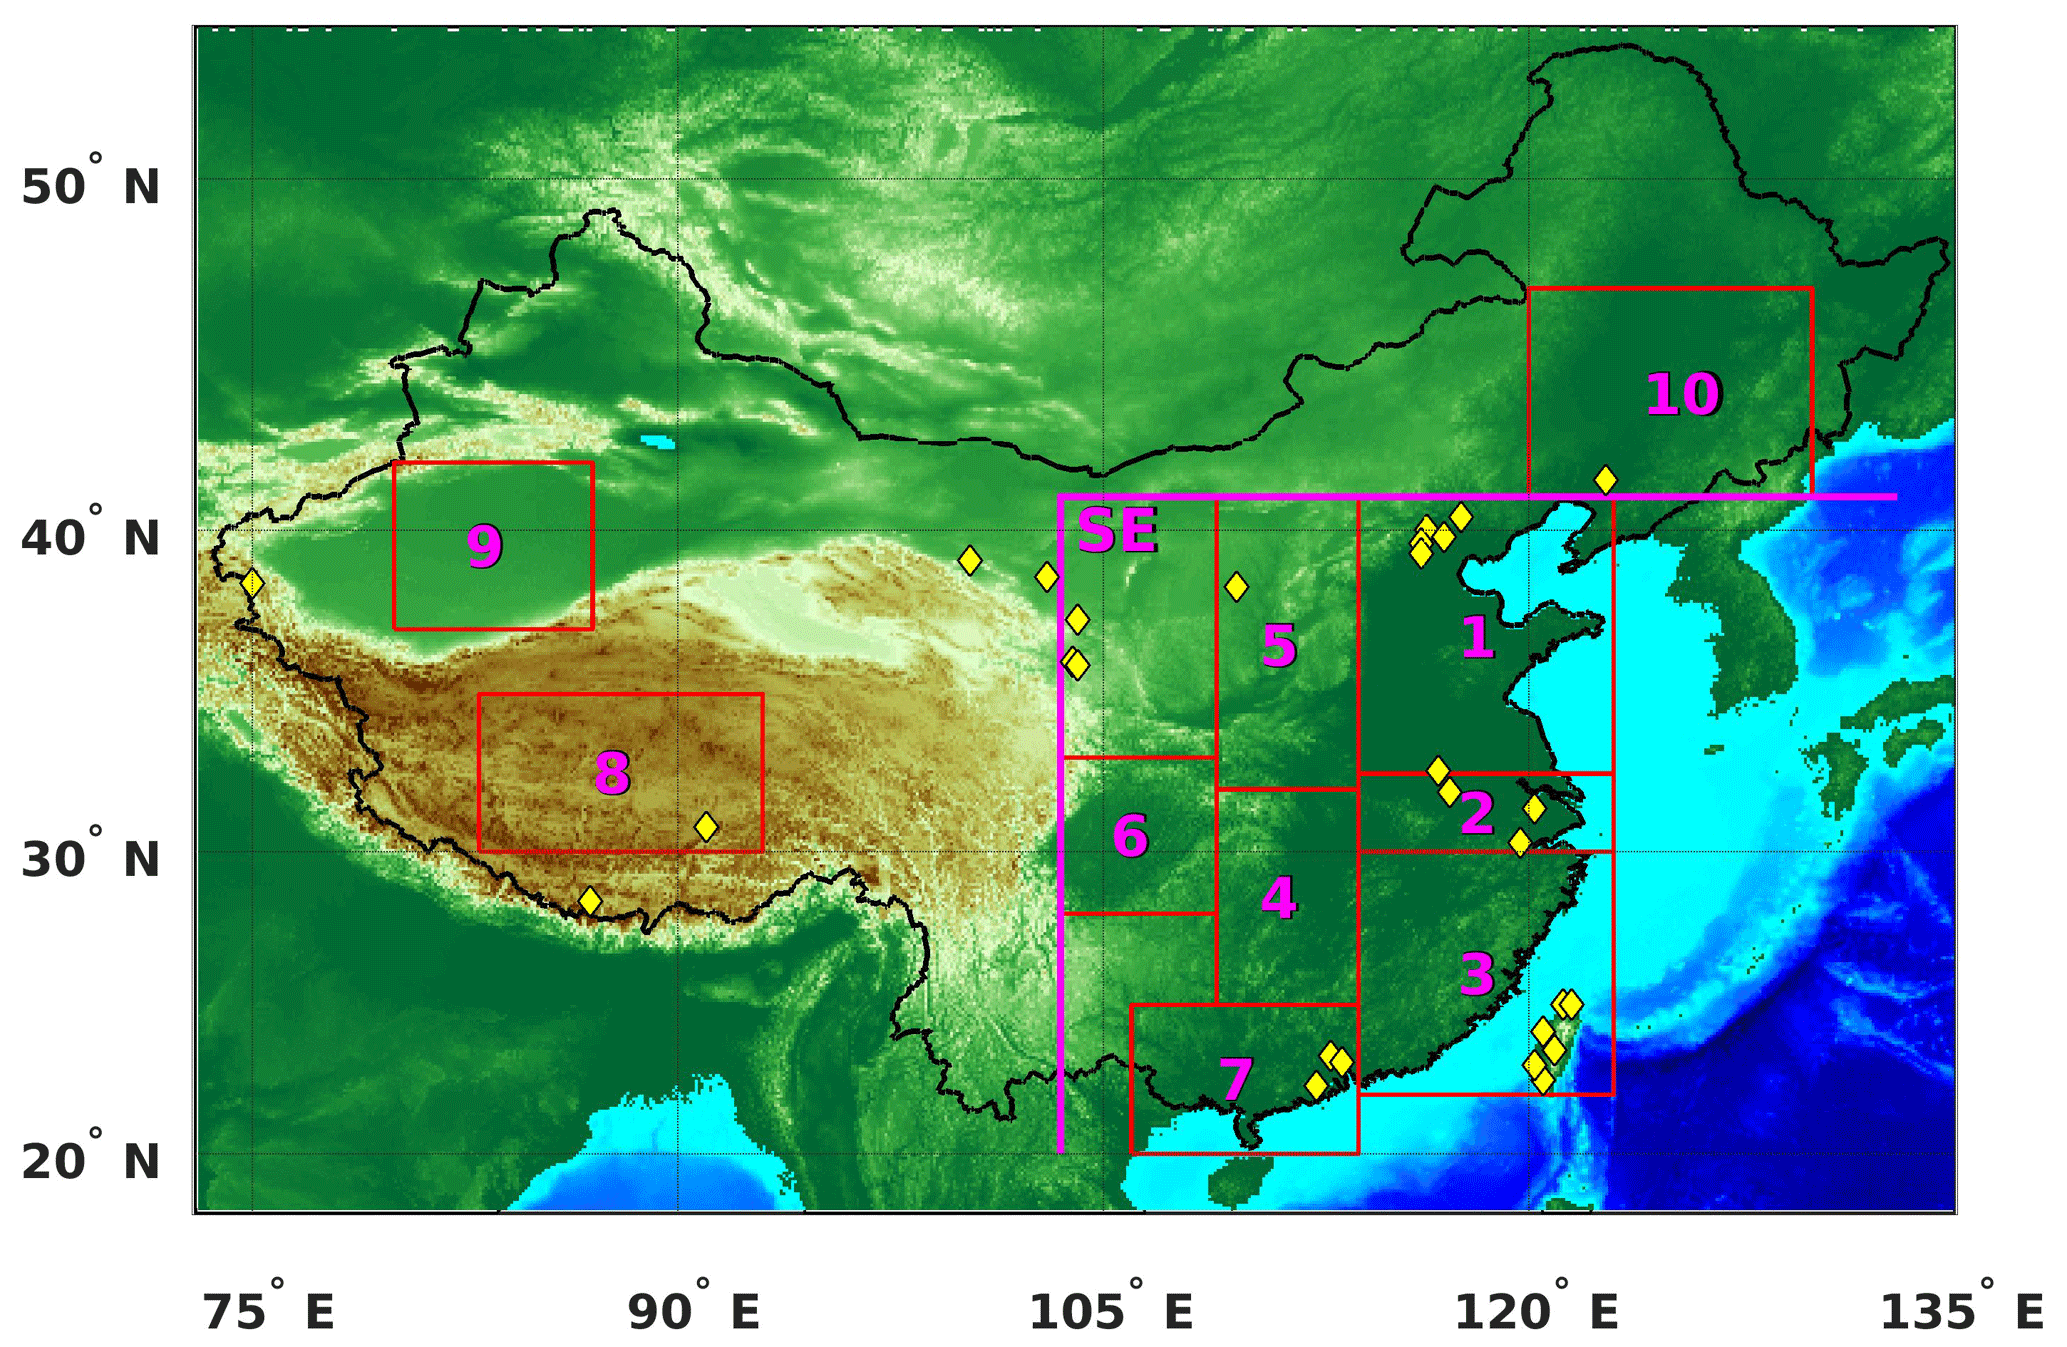
Figure 2Regions over mainland China (indicated by the purple numbers and red borders) selected for the study of the seasonal, interannual and long-term behavior of the AOD, and the locations of the Aerosol Robotic Network (AERONET) sites (yellow diamonds) used in this study for validation. The black line indicates mainland China. A larger area over southeastern China is indicated as “SE” and denoted using a purple border.
With some deviations, the choice of the regions is similar to those in other studies (e.g., Luo et al., 2014; Wang et al., 2017). This choice covers major urban/industrial regions such as the Beijing–Tianjin–Hebei (BTH) area, the Yangtze River Delta (YRD) and the Pearl River Delta (PRD), the Sichuan/Chongqing region as well as cleaner regions in the northwest (region 10 in Fig. 2) and southeast (region 3). The Tibetan Plateau and the Taklamakan Desert regions, which are important sources of dust particles in China, were chosen to represent sparsely populated and less developed, in terms of industrialization, regions.
In the following we briefly introduce the ATSR and MODIS instruments, the AOD retrieval algorithms and the AOD datasets. For more details (e.g., difference in ATSR and MODIS AOD spatial and temporal coverage), see de Leeuw et al. (2018) and Part 1.
3.1 ATSR ADV
The ATSR instruments, ATSR-2 on board the European Remote Sensing satellite ERS-2 (1995–2003) and AATSR on board the Environmental Satellite (Envisat) (2002–2012), hereafter together referred as ATSR, were developed to provide high-accuracy measurements of the sea surface temperature. However, they were also successfully used for atmospheric aerosol retrievals (e.g., Flowerdew and Haigh, 1996; Veefkind et al., 1998; Sayer et al., 2010; de Leeuw et al., 2015; Kolmonen et al., 2016; Popp et al., 2016). Together, these instruments provided 17 years of global data. Both satellites flew in a sun-synchronous descending orbit with a daytime Equator crossing time of 10:30 LT (local time) for ERS-2 and 10:00 LT for Envisat. The ATSR is a dual view instrument. One view is near-nadir and the other is at a 55∘ forward angle. The time between the two views is ca. 150 s along the track. The nominal resolution at nadir is 1×1 km2 and the swath width is 512 km, which results in global coverage in 5–6 days. ATSR has three wave bands in the visible–near-infrared (centered near 555, 659 and 865 nm) and four bands in the mid- to thermal-infrared (centered near 1600, 3700, 10 850 and 12 000 nm).
Over land, the ATSR ADV AOD retrieval algorithm uses the two ATSR views simultaneously to eliminate the contribution of land surface reflectance to the top of atmosphere radiation and to retain the path radiance in cloud-free scenes (Veefkind et al., 1998; Kolmonen et al., 2016; Sogacheva et al., 2017) following Flowerdew and Haigh (1996).
ATSR-2 AOD data are available for the period from June 1995 to December 2003, with some gaps in 1995 (from January to May, globally) and 1996 (from January to June, globally); toward the end of the period (approximately from autumn 2002) the data are also less reliable. AATSR data are available for the May 2002–April 2012 period, but some data are missing in 2002; therefore, we only use AATSR data from August 2002 onward. The consistency between the ATSR-2 and AATSR datasets was discussed in Popp et al. (2016). Over China, the difference between the ADV AOD values retrieved from ATSR-2 and AATSR is small, as shown by pixel-by-pixel and monthly aggregate comparisons as well as validation results (Part 1). This allows for the combination of the ATSR-2 and AATSR AOD time series into one dataset without offset correction over China.
The L3 (averaged on a grid of 1∘ × 1∘) seasonal aggregates were obtained for winter (DJF), spring (MAM), summer (JJA) and autumn (SON) by averaging the L3 monthly aggregates to corresponding seasons. The annual AOD data were obtained by averaging the monthly AOD data. In the following, the ATSR ADV version 2.31 AOD product will be referred to as ADV.
3.2 MODIS
The MODIS/Terra sensor (Salomonson et al., 1989) aboard NASA's Terra satellite has been flying in a near-polar sun-synchronous circular orbit for more than 15 years (since December 1999). MODIS/Terra has a daytime Equator crossing time at 10:30 LT (descending orbit), a viewing swath of 2330 km (cross track) and provides near-global coverage on a daily basis. Its detectors measure 36 spectral bands between 0.405 and 14.385 µm, and it acquires data at three spatial resolutions (250, 500 and 1000 m).
MODIS AOD is retrieved using two separate algorithms, dark target (DT) and deep blue (DB). Furthermore, two different DT algorithms are utilized, one for retrieval over land (Kaufman et al., 1997; Remer et al., 2005; Levy et al., 2013) and one for retrieval over water surfaces (Tanré et al., 1997; Remer et al., 2005; Levy et al., 2013). The DB algorithm (Hsu et al., 2004, 2013) was traditionally used over bright surfaces where DT performance is limited (e.g., deserts, arid and semiarid areas) and was further developed for returning aerosol measurements over all land types (Sayer et al., 2014). Hereafter, the MODIS/Terra AOD C6.1 DTDB merged AOD product will be referred to as MODIS.
3.3 ADV and MODIS validation results
AOD Level 2 (L2, 0.1∘ × 0.1∘ resolution) validation with the AERONET L2.0 (quality-assured) AOD over China for ADV (de Leeuw et al., 2018) and MODIS C6.1 is discussed in detail in Part 1. The locations of the AERONET stations used in this study for validation are shown in Fig. 2. Note that the number of the AERONET stations is limited over northwest of China (de Leeuw et al., 2018; Part 1).Validation results are briefly summarized in this section. For all available collocations between ADV and AERONET and between MODIS and AERONET (Table 1, “All points”), the MODIS algorithm performs slightly better than ADV. The correlation coefficients are 0.88 for ADV and 0.92 for MODIS (note, that as MODIS has better coverage compared with ADV (Part 1), the number of validation points for MODIS is considerably larger). Both algorithms show a similar (in absolute numbers) bias, which is negative for ADV (−0.06) and positive for MODIS (0.07). The AOD standard deviation (δ) and root mean square error (rms) are slightly lower for MODIS. Similar in absolute values but different in sign, the AOD bias was obtained also for “fine-dominated” (AOD>0.2, AE>1) and for “coarse-dominated” (AOD>0.2, AE<1) aerosol conditions (−0.11 and 0.10 for ADV and MODIS, respectively).
Table 1ADV and MODIS AOD validation results over China for the 2000–2011 overlap period. Statistics (number of points – N, correlation coefficient – R, bias, standard deviation – σ and root mean square error – rms) for all validation points, separated by “fine-dominated” (AOD>0.2, AE>1) and “coarse-dominated” (AOD>0.2, AE<1) aerosols, and collocated points (*when ADV and MODIS overpasses are within ±90 min of each other and ADV, MODIS and AERONET retrieve AOD). For collocated points, statistics are also aggregated seasonally for winter (DJF), spring (MAM), summer (JJA) and autumn (SON).
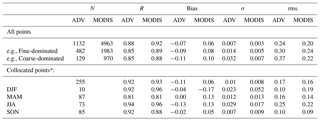
To compare the performance of the two algorithms when both ADV and MODIS retrieve AOD, we carried out the AOD validation for cases where the difference between ATSR and MODIS/Terra overpasses was less than 90 min and both ADV and MODIS successfully retrieved AOD around AERONET (Table 1, “Collocated points”). Altogether, 255 collocations exist between ADV, MODIS and AERONET for the ATSR and MODIS/Terra overlap period (2000–2011) over China. Validation was carried out for all collocated points and for each of the four seasons: DJF, MAM, JJA and SON. For all collocated points, the correlation coefficients (R) were similar for ADV and MODIS (0.92 and 0.93, respectively), ADV was biased negatively (−0.11), and MODIS was biased positively (0.06). In winter, MODIS showed a strong negative bias in AOD (−0.17), while the correlation for MODIS was higher than for ADV (0.96 and 0.92, respectively). Note, that the number of collocated points was low (10) in winter. In spring, R was the same (0.81) for MODIS and ADV, while the bias was 0 for ADV and 0.013 for MODIS. Interestingly, both MODIS and ADV showed a similar tendency to underestimate AERONET AOD for AOD>0.6 in spring. In summer, R was slightly higher for MODIS; biases for ADV and MODIS were equal in an absolute sense but opposite in sign (negative for ADV and positive for MODIS). In autumn, R was a higher for ADV (0.92 versus 0.88 for MODIS), and the bias was negative for ADV (−0.02) and positive for MODIS (0.05).
In summary, MODIS showed a better performance for the “All points” selection (Table 1). A similar (in absolute numbers) bias, which is negative for ADV and positive for MODIS, is considered in Sect. 4, where a method for combining the two datasets is presented. For collocated points, ADV and MODIS showed similar performance.
Here we introduce a method to combine the AOD data from the ATSR (1995–2011) and MODIS/Terra (2000–2017) radiometers, which together cover the period from 1995 to 2017. The results from the comparison of the ADV and MODIS AOD datasets in Part 1 are used here to construct a combined AOD dataset. Below, some conclusions obtained in Part 1 are highlighted.
Similar AOD patterns are observed by ADV and MODIS in yearly and seasonal aggregates (Part 1). However, the ADV-MODIS difference maps (Part 1, Fig. 10c, f, i, l?) show that the MODIS AOD is generally higher than ADV AOD.
The time series in Figs. 13 and S1–S4 (Part 1) show large differences between regions for both sensors, while the interannual patterns in the time series are similar for both ADV and MODIS.
Similar patterns exist in the year-to-year ADV and MODIS annual AOD tendencies in the overlapping period (Part 1, Table S2).
ADV and MODIS validation with AERONET data (Part 1, Sect. 4) shows similar high correlation (0.88 and 0.92, respectively), while the bias is of similar magnitude but opposite in sign: positive for MODIS (0.06) and negative for ADV (−0.07). Similar in absolute values but opposite in sign, the AOD bias is calculated for “fine-dominated” (−0.09 and 0.08, for ADV and MODIS, respectively) and for “coarse-dominated” aerosol conditions (−0.11 and 0.10, for ADV and MODIS, respectively).
4.1 Method
The combined AOD (AODcomb) database for the period from 1995 to 2017 was compiled from AOD estimated for three periods. The first period (T1) is the pre-EOS period (1995–1999), when only ATSR was available, the second period (T2) is the ATSR and MODIS/Terra overlap period (2000–2011) and the third (T3) is the post-ENVISAT (2012–2017) period, when only MODIS/Terra was available:
First, we introduce the combined AOD for the overlap period T2, when AOD for both ADV (AODADV) and MODIS (AODMOD) was available. AOD for each year (AODT2,y) is calculated as a mean of AODADV,y and AODMOD,y:
Simple averaging was applied, as ADV and MODIS show similar biases of opposite signs (Sect. 2.3 and Part 1).
Using ADV and MODIS yearly AOD from T2, the AOD correction (AODcorr) was calculated as the mean difference between ADV and MODIS for the overlapping period:
where N is the length of the overlapping period in years.
For the respective ADV and MODIS datasets, the AOD correction was scaled by the corresponding AOD averaged over the overlapping period:
For T1 and T3, the AOD relative correction (AODrel_corr) was applied as positive correction for ADV AOD, which is usually low compared with AERONET AOD (Eq. 6), and as negative correction for MODIS AOD, which is usually higher compared with AERONET AOD (Eq. 7):
The spatial distributions of the relative correction for MODIS AOD (AODrel_corr,MODIS) are shown in Fig. 3 for annual and seasonal AOD aggregates. As expected, the highest AOD relative correction (30–40 %) corresponds to the areas where the agreement is lower between ADV and MODIS AOD (Fig. 10 in Part 1), e.g., over bright surface areas, such as Tibetan Plateau, the Taklamakan and Gobi deserts and the Harbin area. The reasons for the disagreement between ADV AOD and MODIS AOD, which are mostly related to the coverage and validation results, are discussed in detail in Part 1 and Sect. 3.3 of the current paper. For seasonal aggregates, the highest correction (ca. 45 %) is obtained over the Tibetan Plateau in autumn, when the AOD is lower compared with spring and summer (Fig. 10 in Part 1). In summer, the correction is smaller, as the agreement between the ADV and MODIS AOD is better in summer than in other seasons (Fig. 10 in Part 1). Over SE China, the AOD correction is lower (between 10 % and 20 % of AOD). The ADV AOD relative correction shows similar spatial patterns and is consequently not discussed here.
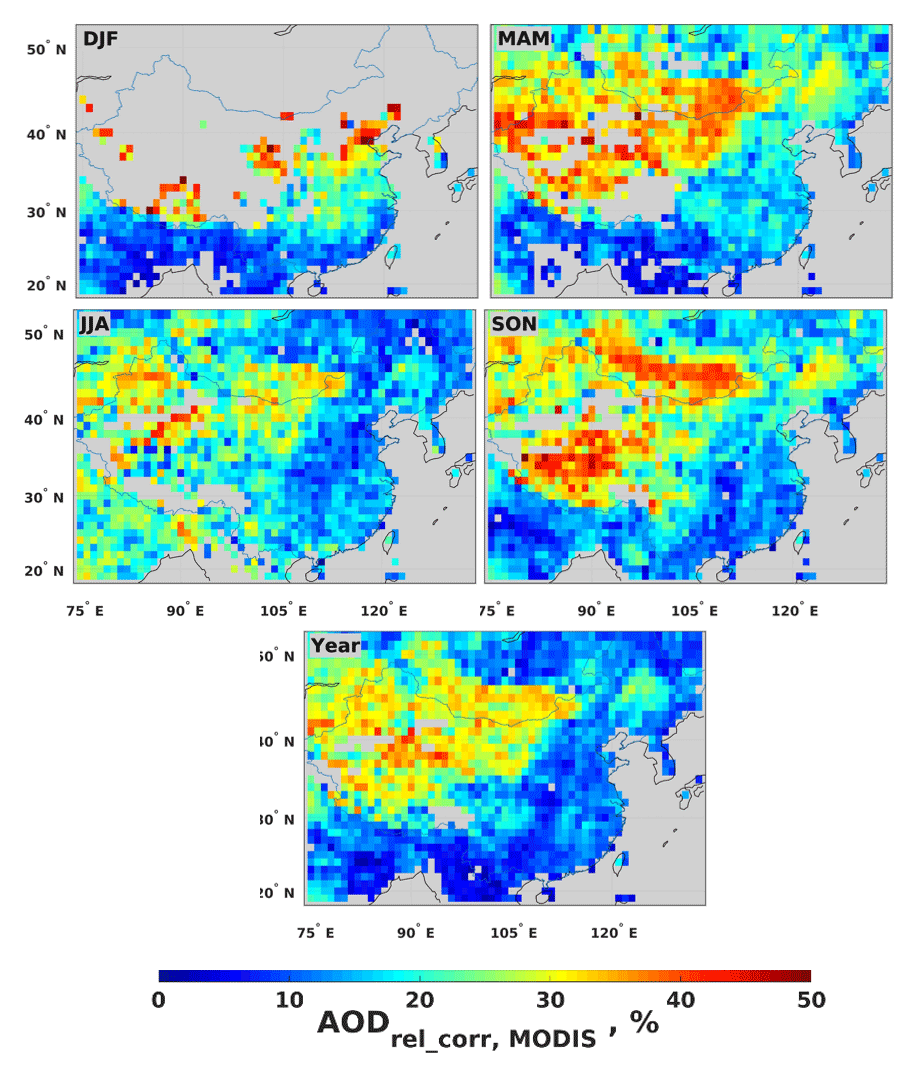
Figure 3AOD relative correction for MODIS seasonal (DJF, MAM, JJA and SON) and annual (Year) AOD for the combined AOD dataset obtained using the method introduced in Sect. 4.1.
The method was applied pixel-wise to L3 annual and seasonal AOD aggregates from ADV and MODIS to build the yearly and seasonal database of the combined AOD. For each season, the AOD relative correction was computed separately, as introduced above for the annual AOD.
4.2 Results
The time series of the seasonally and annually averaged AOD from ADV (red circles), MODIS (green circles) and combined AOD (yellow diamonds) are shown for all of China and for SE China in Fig. 4. Since ADV was negatively biased and MODIS was positively biased with respect to the AERONET AOD, and the biases were similar in absolute value, the combined time series in the pre-EOS and post-Envisat periods are practically corrected by increasing ADV and lowering MODIS AOD using the AOD correction introduced in Sect. 4.1. As expected, the similar interannual variations in the separate datasets are reproduced in the combined time series.
For all seasons, except spring, the difference between ADV and MODIS AOD is small; therefore, the combined time series closely resembles both the ADV and MODIS AOD. In spring, the combined time series show, on average, lower AOD compared with MODIS (which, in relative numbers, is about 10–20 % lower than the MODIS AOD). However, as for annual aggregates, the interannual variability for seasonal combined AOD is similar for both ADV and MODIS.
The annual and seasonal AOD tendencies for the combined time series are estimated in Sect. 5.
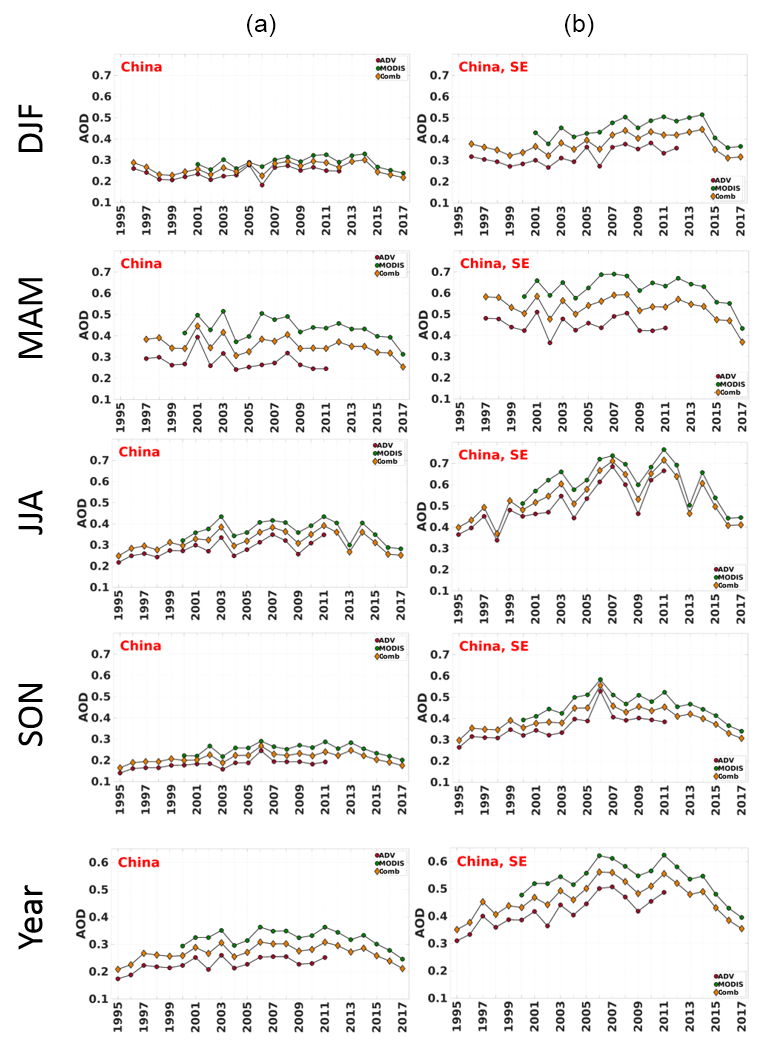
Figure 4ADV (red circles), MODIS (green circles) and combined from ADV and MODIS (yellow diamonds) seasonal and annual AOD time series for China (a) and SE China (b) for winter (DJF), spring (MAM), summer (JJA), autumn (SON) and the whole year (Year). The method used to combine the ADV and MODIS time series is presented in Sect. 4.1.

Figure 5Density scatterplot of ADV AOD (a), MODIS AOD (b) and combined AOD (c) versus AOD from AERONET stations over China for the T2 period (2000–2011). The filled circles are the averaged AOD binned in 0.1 AERONET AOD intervals (0.25 for AERONET AOD>1.0) and the vertical lines on each circle represent the 1σ standard deviation. Statistics in the upper left corner indicate correlation coefficient R, standard deviation, root mean square error (rms) and the number of data points (N). The color bar on the right indicates the number of data points in each bin.
4.3 Combined AOD comparison with AERONET
The combined AOD datasets were built from the L3 data for the seasonal and annual aggregates; thus, a comparison with the AERONET is possible for the corresponding aggregates only. We call the current exercise a comparison rather than a validation, as the temporal coverage in seasonal and annual aggregates for AERONET, ADV, MODIS and combined AOD is different which might bias the aggregated values. The combined AOD was constructed from three periods (T1, T2 and T3, see Sect. 4.1 for details), where different corrections were applied; thus, we perform the AOD comparison for the corresponding periods, as well as for the full ATSR and full MODIS periods.
For T1, the number of AERONET locations is limited to perform the comparison (Part 1). For T2, the agreement between AERONET and combined AOD seasonal and annual aggregates (Fig. 5, Table A1) is slightly better than between AERONET and ADV or MODIS separately. R is higher in DJF, JJA and “Year”, 1σ and rms are lower for all seasons and “Year”. For T3 (Table A1), R is considerably higher in spring (0.49 and 0.61 for MODIS and combined, respectively). AOD standard deviation (σ) and rms are lower for all seasons for combined AOD compared with MODIS AOD.
For 1998–2012, which covers the period when both AERONET and ADV are available, correlation R is higher for combined AOD in winter, autumn and “Year”; rms is lower in all seasons and “Year” for the combined AOD compared with ADV AOD.
For 2000–2017, which covers the period when both AERONET and MODIS are available, comparison results for the combined AOD and MODIS AOD are similar to T3.
5.1 Evolution of AOD over China: annual anomaly maps
To study the temporal evolution of the AOD over China during the whole period (WP) from 1995 to 2017, anomaly maps (Fig. 6) were created by subtracting the multiyear aggregate for the WP from the yearly aggregates. The evolution of the AOD can be followed for different regions; thus, regions with similar or different evolution of the AOD can be identified.
Strong negative anomalies over SE China (and the north of India and Bangladesh, which are outside the scope of this paper) in 1995–2001 show that the AOD was lower compared to the AOD averaged over the WP during this time. Towards 2006, the AOD anomalies became less negative: the yearly AOD increased and the anomaly decreased. Starting from 2006, a positive AOD anomaly, which show that the yearly AOD was higher than the AOD averaged over 2000–2011, was observed over SE China. Between 2006 and 2011, the positive anomalies remained high. Starting in 2011, the anomaly changed from positive to negative, i.e., the AOD decreased. However, from 2015 the anomaly was mostly negative and became stronger towards 2017, which was the last year in our studies.
The AOD anomaly pattern in SE China was very variable. In the BTH area (region 1), the anomaly was strongly negative in 1995, which was the beginning of the time series, and gradually decreased towards 2006, when it became positive. In the area over the YRD (region 2) which encompasses large urban and industrial developments such as Shanghai and Nanjing, the multiyear average appeared to be quite representative of the AOD with negative anomalies until 2000; after 2000 the anomalies fluctuated around zero with neither very high nor very low values.
Similar AOD behavior was observed in the Sichuan/Chongqing area (region 6) with a strong positive anomaly in 1997 and 1999, followed by negative anomalies in 2000–2002. After 2002, no significant deviations were observed until 2005 when the AOD exceeded the multiyear average; this situation then persisted, with small fluctuations, until 2014 when a strong negative anomaly expanded over the wider region of SE China (from 2015 to 2017).
A “belt” of positive AOD anomalies were observed east of the Taklamakan Desert in 2001, which was likely due to the most intensive dust event during the period of interest. The widespread positive AOD anomalies in 1998 and 2003 in the northeast of China were likely the consequence of forest fires over Russia.
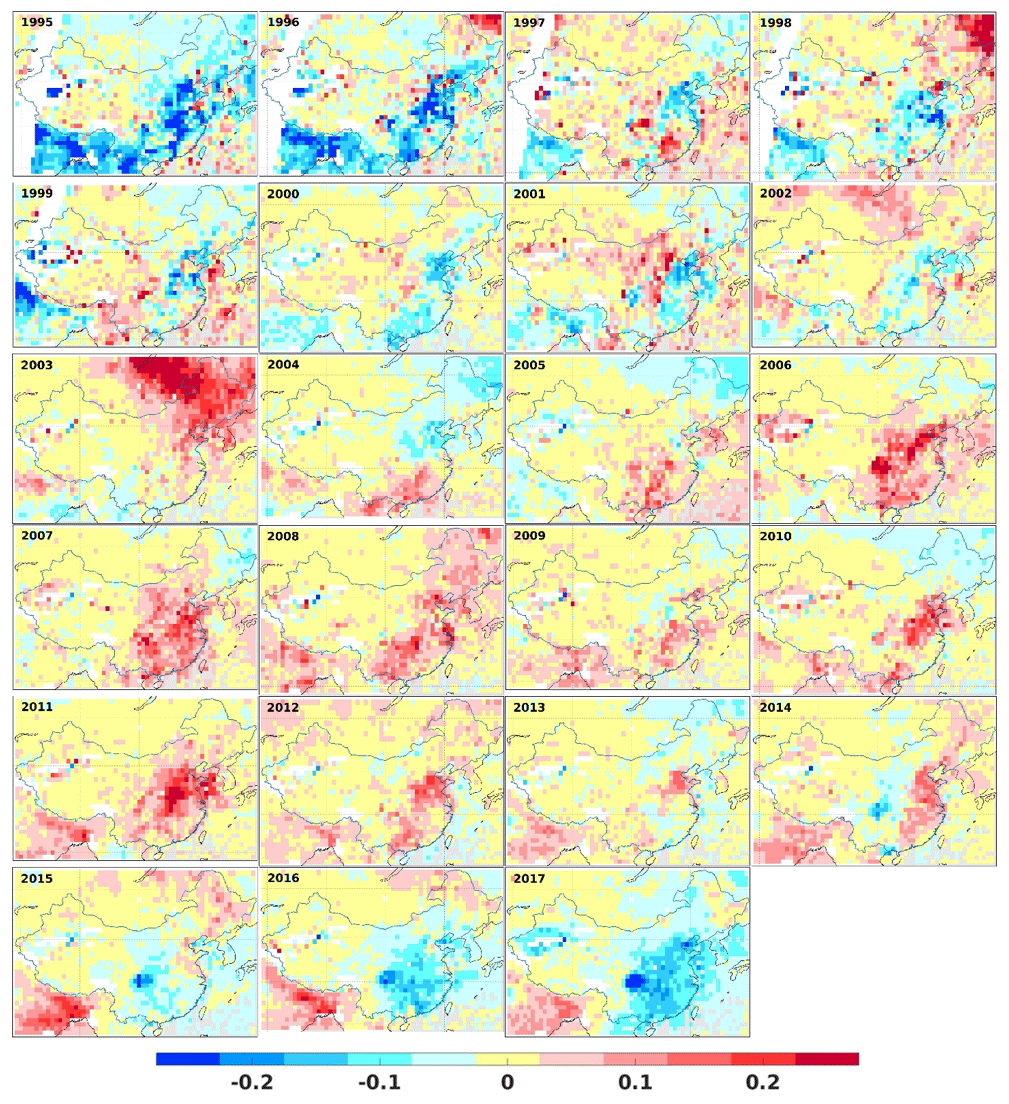
Figure 6AOD anomaly maps for the years from 1995 to 2017 calculated for combined AOD. Anomalies were calculated for each year by subtracting the multiyear (1995–2017) average from the annual aggregates.
Although meteorological conditions play an important role in mixing and transporting pollutants, increasing local aerosol emission from human activities has generally been considered to be the dominant cause of increasing wintertime haze over China in past decades (Yin et al., 2017). One can isolate meteorological changes from emissions changes by normalizing the aerosol concentrations using aerosol concentration efficiencies (Yang et al., 2018). However, the contribution of wind and its associated languishing patterns explain 10 % of the historical increase of regional AOD, while other meteorological contributions show no significant trends over 35 years (Gu et al., 2018).
In the Beijing area, the variation of the AOD has been significantly affected by anthropogenic aerosol emissions (Gu et al., 2018) during the last few decades. In the current paper, we aim to show that changes in the AOD follow the emission control policy in China. Below we present a short overview of the emission regulation policies in China over the last 2 decades.
5.2 Emissions regulation policies in China over the last 2 decades
Jin et al. (2016) showed the following regarding the emission regulation policies in China: (1) the early policies, before 2005, were ineffective at reducing emissions; (2) from 2006 to 2012, new instruments, which interact with political incentives, were introduced in the 11th Five-Year Plan. However, emission control policies on air pollution have not been strongly reconsidered in the 11th Five-Year Plan; thus, no significant reduction in air pollution has been observed. Therefore, regional air pollution problems dominated by fine particulate matter (PM2.5) and ground level ozone (O3) have emerged. Nevertheless, the national goal of reducing total sulphur dioxide (SO2) emissions by 10 % has been achieved (Lin et al., 2010).
Jin et al. (2016) also showed that SO2 emissions, as well as smoke and dust emissions, have been gradually decreasing since 2006. However, the reduction of the total emission of SO2, a single primary pollutant, does not necessarily improve air quality. NOx emissions continued to grow which was explained by the growing number of vehicles – mainly in megacities. Total NOx emissions in East China reached their peak levels in 2012, and have stopped increasing since then (van der A et al., 2017). This stagnation NOx emissions was concurrent with the introduction of regulations requiring the installation of filtering systems, mainly at power plants but also for heavy industry. These regulations for NOx were announced in 2013 in the Air Pollution Prevention and Control Action Plan (CAAC, 2013).
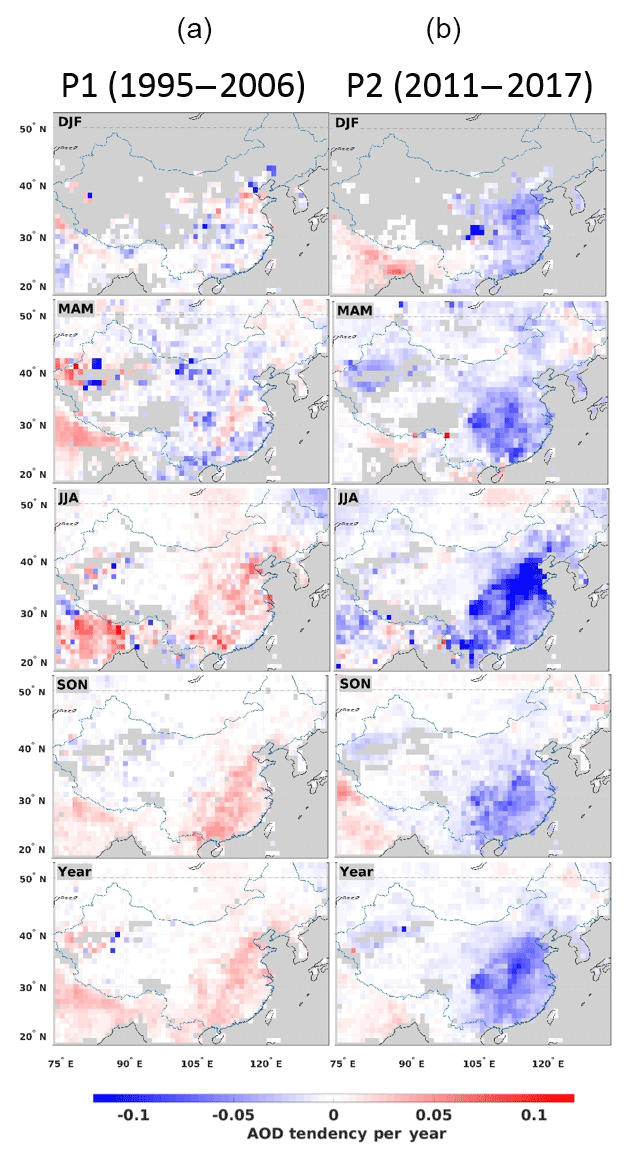
Figure 7AOD tendencies (per year, see color bar) from seasonally and annually aggregated combined AOD time series for two periods: 1995–2006 (P1, a) and 2011–2017 (P2, b).
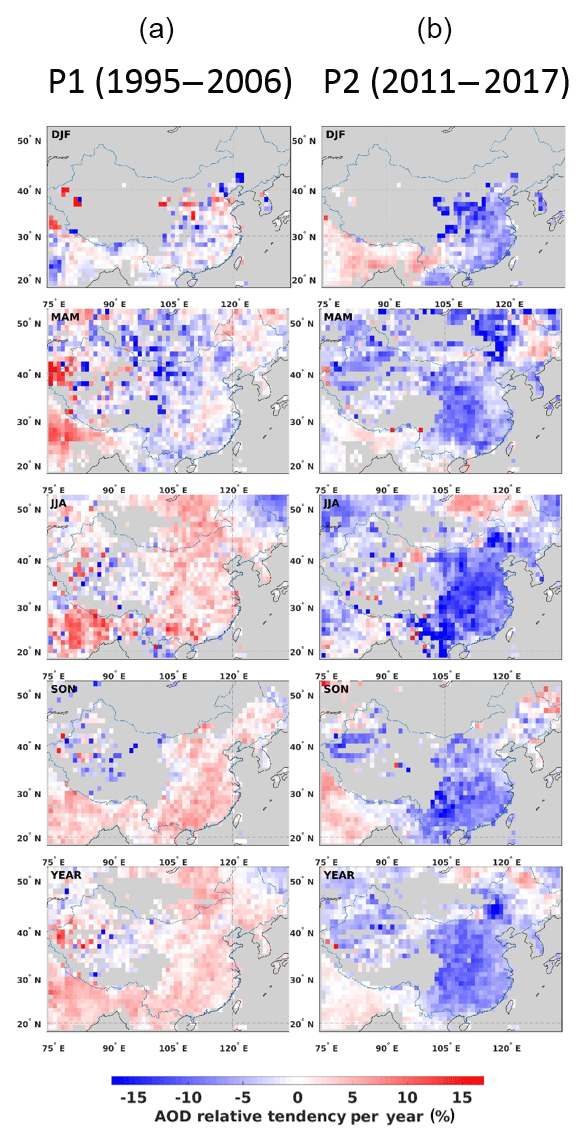
Figure 8AOD relative tendencies (per year, see color bar) from seasonally and annually aggregated combined AOD time series for two periods: 1995–2006 (P1, a) and 2011–2017 (P2, b).
The “total control” of SO2 and NOx has been strengthened and accelerated in China (Zhang et al., 2017). For example, the change in standards for cars from 2011 to 2015 reduced the maximum amount of NOx emissions allowed for on-road vehicles by 50 % (Wu et al., 2017). Further emission control scenarios exist in China regarding the coal-burning thermal power plants.
The newly designed control policies considered in Wang et al. (2018) are predicted to lead to reductions in January PM2.5, PM10, NO2 and SO2 levels of between −8.6 % and −14.8 % in Beijing. However, regional differences in emission controls currently exist. For example, stricter regulations for on-road vehicles (e.g., a ban on older polluting cars) have been introduced on a city level, e.g., in Beijing, rather than nationwide (van der A et al., 2017).
In June 2013, the State Council issued the Action Plan for Air Pollution Prevention and Control. This document laid out the roadmap for air pollution prevention and control across China for the 2013–2017 period. In 2016, the second report was published (http://cleanairasia.org/wp-content/uploads/2016/08/China-Air-2016-Report-Full.pdf, last access: 21 November 2018) showing the considerable emission reductions and improved air quality. The air quality mostly improved in developed regions. This report finds that cities which failed to attain the 2015 air quality target show slow progress and still suffer from poor air quality; these cities are concentrated in Henan Province, Shandong Province and in the northeast of China. The abovementioned locations all had less experience regarding air pollution, in addition to an insufficient capacity to carry out air pollution prevention and control compared with more developed regions such as the BTH. Such regional differences might result in some deviation of regional emission tendencies compared to those averaged over the whole of China.
Therefore, three periods, closely related to the Five-Year Plan initiative (before 2006, 2006–2011 and after 2011), can be identified, when the emission reduction policies in China are considered.
5.3 AOD seasonal and annual tendencies for the selected periods: 1995–2006 and 2011–2017
In addition to selecting the study periods based on emission reduction policy according to the Five-Year Plan initiative, we performed statistical tests, where we looked at the AOD tendencies, the uncertainties and the errors on an annual/seasonal basis for different periods for all selected regions. The results (not shown here) prove that, with some exception (1–2 year shifts for a few regions, depending on the season) years 2006 and 2011 can be chosen as a pivot points for the AOD tendencies in China.
Linear regression was applied to individual L3 pixels of the combined AOD time series to estimate the AOD tendencies over China for two periods: 1995–2006 (P1) and 2011–2017 (P2). For P1 and P2, the AOD tendencies (dAOD) per year were estimated, as P2 is too short to estimate the decadal tendencies. Results for the 2006–2011 period are not shown here as the AOD tendency during that period was close to zero. We also estimated the AOD relative tendencies, which are the ratios of tendencies and the corresponding time series averages (Schönwiese and Rapp, 1997). The AOD tendencies and the AOD relative tendencies for annual aggregates for P1 and P2 are shown in Figs. 7 and 8, respectively. To avoid a high but scientifically unimportant AOD relative change over a fairly clean background, the relative tendencies are shown if the corresponding time series AOD averages were above 0.1. AOD positive tendencies are denoted by red; AOD negative tendencies are denoted by blue.
In P1 (Figs. 7a and 8a), the AOD increase in summer (JJA) and autumn (SON) of 0.1 to 0.5 (ca. 3–7 % of the AOD averaged over the corresponding period) per year contributed most to the annual AOD increase over SE China. In spring (MAM), the AOD tendency was positive over the Yangtze River Delta, northern China and the western Tibetan Plateau, (between 0.1 and 0.3, or 2–4 %, per year) and negative over other parts of China. In winter (DJF), when the satellite data coverage is low compared with other seasons (Part 1), irregular patterns of both positive and negative AOD tendencies are observed over China.
For annual aggregates, an increase in the AOD of 0.02 to 0.04 (3–6 %) per year (Fig. 8a) was observed in P1 over SE China. Over western China, the AOD tendencies were slightly negative (between 0 and −0.01 per year). Over northern China they were slightly positive (between 0 and 0.4 per year) for most of the pixels.
In P2 (Figs. 7b and 8b), the AOD tendencies were opposite in sign, compared with P1. The strongest AOD decrease (up to −0.16 per year) was observed over the northern part of SE China in summer. The AOD decrease was slightly lower for other seasons over SE China, while for central and western China the AOD tendencies were close to zero in P2. The relative AOD tendency was between −5 % and −10 % per year in winter and spring over SE China and more than −10 % per year over the Sichuan region in summer and autumn. For annual AOD aggregates, the AOD decrease of −0.02 to −0.04 per year (Fig. 7b), with an average reduction of 30 %–50 % between 2011 and 2017, was observed in P2 over SE China. In the Sichuan and Henan regions the AOD decrease more with a reduction of −0.1 per year. The most negative AOD tendency (more than −10 % per year) is observed in northern China over the eastern inner Mongolia area (Fig. 8b). A small AOD decrease is observed over the Taklamakan Desert; a small AOD increase was observed over the most northeastern part of China. Over other areas, the AOD tendencies in P2 were close to zero.
To reveal more detailed differences in AOD tendencies over China, we apply a similar fits to the annual and seasonal AOD averaged over the selected regions in China. The results are presented and discussed in Sect. 5.4.
5.4 AOD tendencies for the selected regions
5.4.1 Annual AOD tendencies
In Fig. 9 we show the annual AOD combined time series (black line) for China, SE China and the 10 selected regions (corresponding red numbers in the left upper corner of each region), which are defined in Sect. 2 and Fig. 2. For P1 and P2, we also show the AOD tendencies per year and the corresponding relative AOD tendencies. The AOD tendencies and the metrics describing the linear fit for P1 and P2 are summarized in the Appendix (Table A2).
As expected, the AOD tendencies and the AOD relative tendencies were positive in P1 in all of the chosen regions, except for the sparsely populated Tibetan Plateau (region 8), where the AOD is very low and varies very little from year to year. The maximum AOD increase in P1 (0.020, or 4 %, per year) was observed in the Shanghai area (region 2) and the PRD and the Guangxi Province (region 7). In the BTH (region 1), and in Hunan and Guizhou (region 4), dAOD was also high (0.016, or 3 %, per year). Those regions strongly contributed to the AOD increase in SE China (0.014, or 3 %, per year). In regions 1, 2, 4, 7 and for all of China, AOD tendency uncertainties were within 25 % of the AOD tendency in P1. For regions 3, 5, 6 and SE China, the uncertainties related to the tendency estimation were between 25 % and 50 % of the AOD tendency. In regions 8–10, the uncertainties were higher, which can be explained by the low AOD and the lower AOD coverage.
In P2, the AOD decrease was observed in all selected regions and thus also in SE China and all of China. In absolute numbers, dAOD was almost twice as high in P2 as in P1. The most rapid AOD decrease (ca. −0.045, or −8 %, per year) was observed in the central regions of SE China (regions 4 and 6), while for the rest of SE China, including regions 1, 2, 3, 5 and 7, dAOD was about −0.03, or ca. −6 %, per year. For regions 8–10, which are less populated and less industrialized, the dAOD was lower (−0.002, −0.014 and −0.004, respectively, or −2 %, −5 % and −1 % per year). Uncertainties related to the AOD tendency estimation were within 25 % of the AOD tendency in regions 1 to 7, SE China and China. In regions 8 and 10, where AOD is low, the uncertainties were above 50 %.
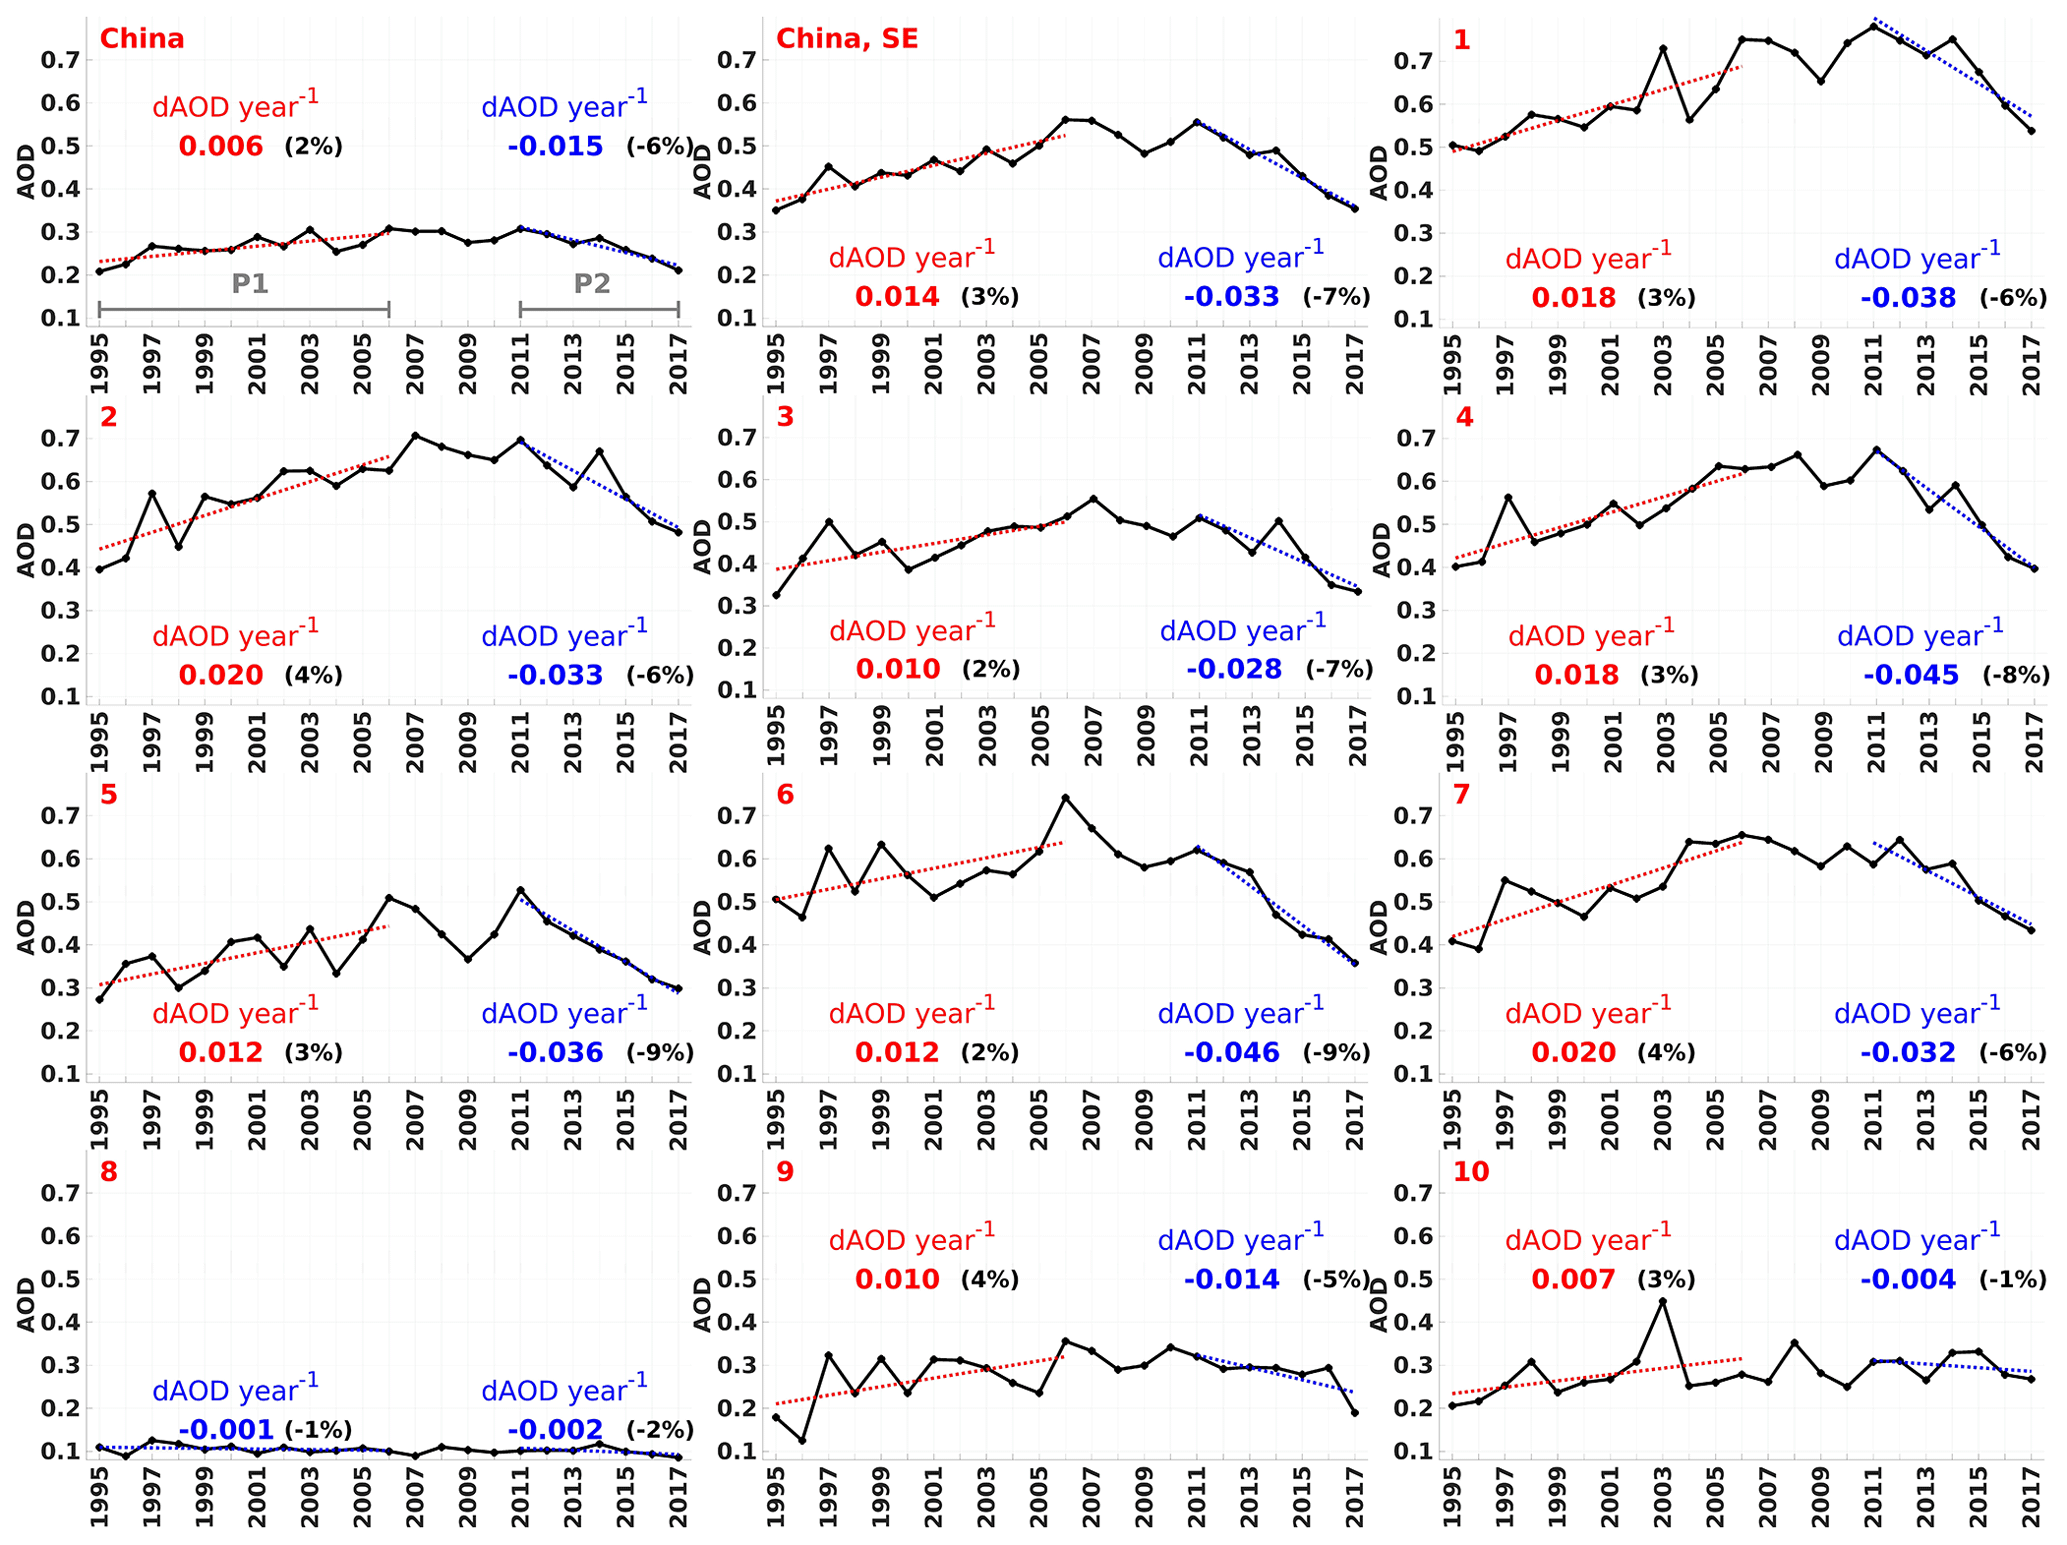
Figure 9Time series (black line) of the annually averaged AOD combined from ATSR and MODIS for China, SE China and 10 selected regions (see Fig. 2, corresponding red numbers in the left upper corner of each region). Results for the linear fitting of AOD are shown for two periods, P1 (1995–2011) and P2 (2011–2017), marked using grey lines in upper left subplot. Fitting lines (dashed lines) and AOD tendencies (numbers) are shown when the AOD tendency was positive (red) and when AOD tendency was negative (blue). The corresponding relative AOD tendencies for each fit are shown in brackets (in black; %).
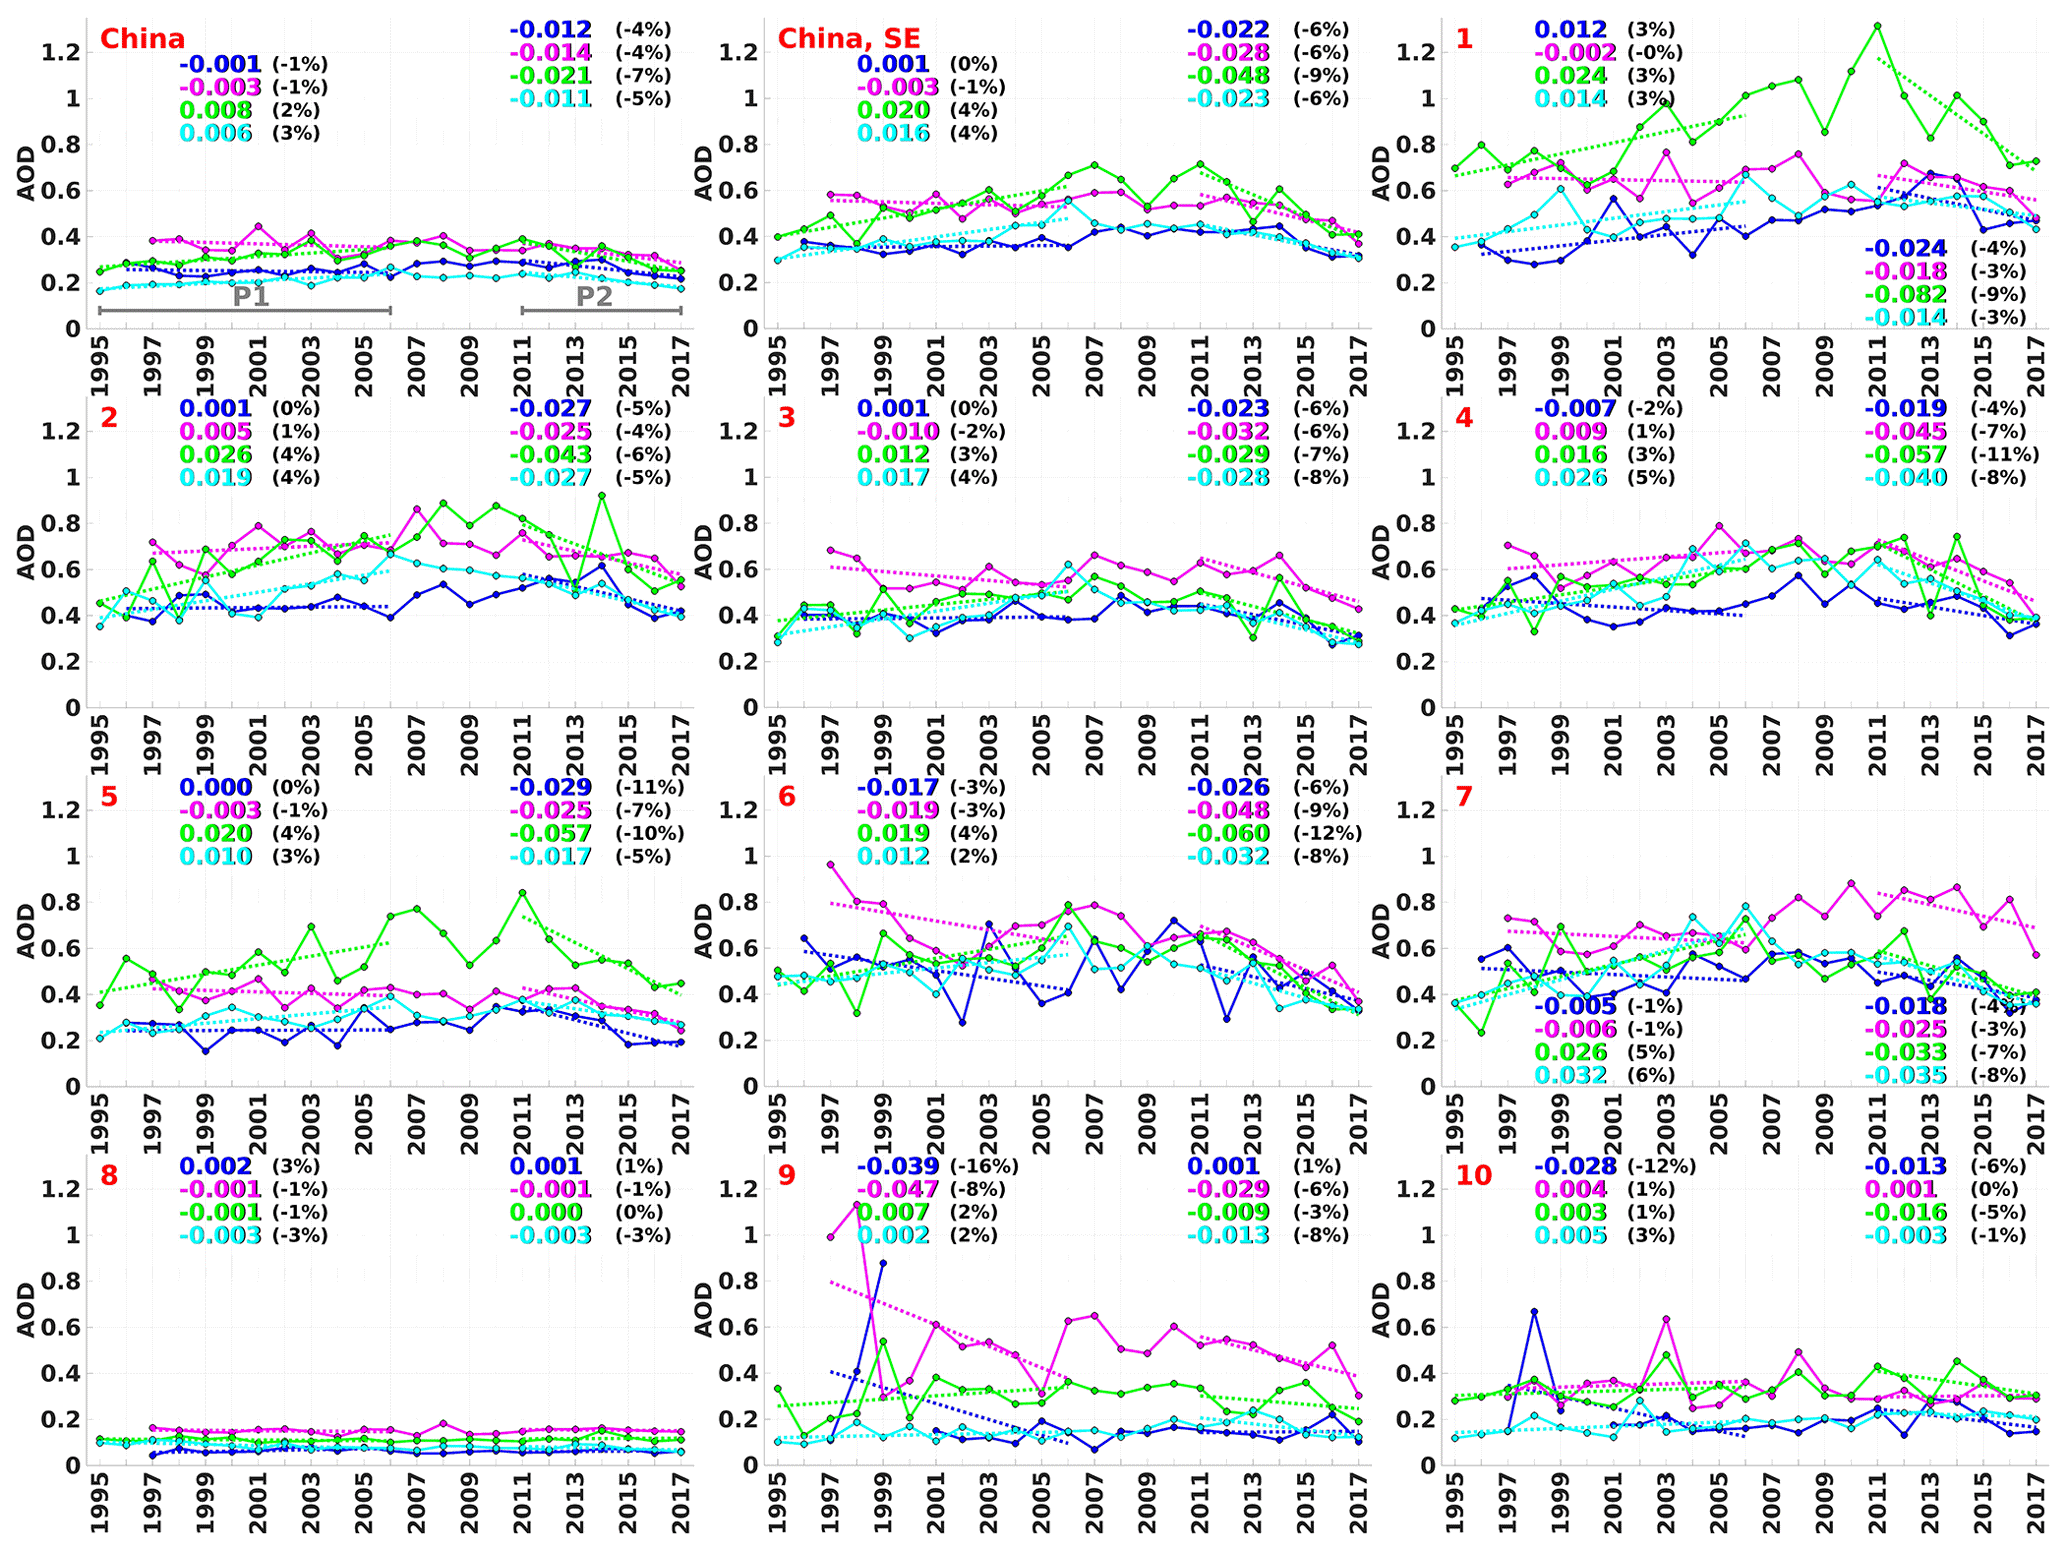
Figure 10The AOD seasonal long-time series (solid lines), the linear fits (dashed lines) and the AOD tendency (numbers) for P1 (1995–2011) and P2 (2011–2017; shown using grey lines in the upper left subplot) are shown using different colors for each season (DJF – blue, winter; MAM – purple, spring; JJA – green, summer; and SON – cyan, autumn). The corresponding relative AOD tendencies for each fit are shown in brackets (in black; %).
5.4.2 Seasonal AOD tendencies
As shown in Part 1 and Sect. 5.3, spatial and temporal patterns in the seasonal AOD differ from those of the annual AOD. To examine if the AOD tendencies in different seasons equally contributed to variations of the annual AOD or if the AOD year-to-year variations were more pronounced in certain seasons, we applied similar regression analyses for the seasonal aggregates of AOD for P1 and P2. As for the annually averaged AOD (Fig. 9), Fig. 10 shows the seasonally combined AOD time series for China, SE China and the 10 selected regions. We also show the linear fit of AOD for two periods, P1 and P2. For P1 and P2, we show the AOD tendency per year and the corresponding relative AOD tendencies. The time series, the linear fitting line and the AOD tendency are shown in different colors for each season.
In P1, during winter and spring, AOD does not vary much (within ±0.01 per year) in any of the regions (Fig. 10). A negative AOD tendency of −0.017, or −3 %, per year was observed in the Sichuan area (region 6) and in regions 9 and 10, where AOD coverage is low in winter and high AOD variability is observed. In the Hunan and Guizhou provinces and the PRD (regions 4 and 7) the AOD decreases a little, by ca. −0.006 (−2 %), per year. In other regions it increases somewhat (ca. 1–2 % per year). In spring, the dAOD was slightly positive in regions 4, 8 and 10 and slightly negative in other regions. In summer and autumn, a AOD increase was seen in all regions in SE China (regions 1 to 7). In regions 1, 2, 5 and 6 (north and west of the SE China region, respectively) the AOD increase was stronger in summer (ca. 0.020, or 3–4 %, per year). In regions 3, 4 and 7 (east-central to southern part of the SE China region) the dAOD was larger in autumn, increasing towards the south and reaching maxima (0.032, or 6 %, per year) in region 7. Over the whole of SE China, dAOD was 0.020, or 4 %, per year in summer and 0.016, or 4 %, per year in autumn; in winter and spring dAOD was close to zero. In western and northern China (regions 8–10), year-to-year changes in the seasonal AOD in P1 were low (within ±0.01 per year). Over all of China, AOD showed an increase of 0.008, or 2 %, and 0.006, or 3 %, per year in summer and autumn, respectively, and a small decrease (ca. −0.02, or −1 %, per year) in winter and spring. Therefore, summer and spring contribute most to the annual AOD increase (Fig. 7) during the 1995–2006 period (P1), and AOD changes were considerably higher in SE China than in other areas.
In SE China, which includes regions 1–7, a strong AOD increase (0.020, or 4 %, per year) was observed in summer. The second maxima occurs in autumn (0.016, or 4 %, per year). In winter, the AOD increase was small (0.001 per year), while in spring a small AOD decrease (−0.003, or −1 %, per year) was observed. AOD tendencies averaged seasonally over all of China for P1 show a similar AOD increase in summer (0.008, or 2 %, per year) and autumn (0.006, or 3 %, per year). In winter and spring, AOD decreased slightly (by −1 % per year). The AOD tendency uncertainties were <50 % of the AOD tendencies in regions 2–7, SE China and China in JJA and SON. In other seasons and regions, the uncertainties were >50 % of the AOD tendencies.
In P2, the AOD tendencies over selected regions were negative and about twice as strong (in absolute numbers) as in P1. AOD tendency uncertainties were lower in P2 than in P1. However in regions 8–10, the AOD tendency uncertainties were >50 % of the AOD tendencies in all seasons. In winter, the AOD decrease was high (between −0.024 and −0.029 per year) in regions 1, 2 and 5. The relative AOD tendency was −11 % per year in region 5, which is west of the BTH area, between −4 % and −6,% per year over SE China and regions 1–7, and lower over other areas. In spring, the AOD decreased more strongly than in winter in regions 3, 4, 6 and 9. A high negative relative tendency (from −6 % to −9 %) was observed in regions 4–9 in spring. In summer, a high negative AOD relative tendency (between −10 % and −12 %) was observed in the southern part of SE China, regions 4–7. The highest absolute AOD decrease (−0.082, or −9 %, per year) was observed in summer in the BTH area (region 1). In autumn, the AOD tendencies were lower than in spring and summer in most of the regions. In SE China, which includes regions 1–7, the strongest AOD decrease (−0.048, or −9 %, per year) was observed in summer. For other seasons, the AOD decreased by −0.022, −0.028 and −0.023 per year (for DJF, MAM and SON, respectively), which was ca. −6 % of the AOD per year for each season.
Over all of China, the AOD decrease was also more pronounced in summer (−0.021, or −7 %, per year). For other seasons, the AOD was decreased by −0.012, −0.014 and −0.011 per year (for DJF, MAM and SON, respectively), which was −4 % per year in winter and spring and −5 % per year in autumn.
Thus, the AOD changes in P2 in summer contributed most to the AOD annual year-to-year variability. The AOD seasonal year-to-year changes are more pronounced over eastern China, which is explained by the uneven regional economic development in China.
Due to rapid economic development and further urbanization, the concentration of anthropogenic aerosols has been increasing in China. However, the emission reduction policies in China over the last 2 decades have successfully reduced the concentration of atmospheric trace gases (van der A et al., 2017) due to increased emission control after 2011 (Jin et al., 2016). In this study, we investigate whether tendencies in the AOD over the last 2 decades follow the pollution control policies in China.
The limited lifetime of satellites makes it impossible to follow AOD changes over several decades using a single instrument. Therefore, in this paper, we introduced a method for constructing a multi-decadal AOD time series by combining data from three different sensors: AATSR-2, ATSR and MODIS/Terra, which together cover the period from 1995 to 2017. The method is based on the ADV and MODIS comparison discussed in Part 1. In brief, (1) ADV and MODIS show similar AOD annual and seasonal spatial and temporal patterns and (2) using AERONET AOD as an independent reference dataset, ADV is negatively biased, while MODIS is positively biased by about the same amount. The method was applied pixel-wise to L3 annual and seasonal AOD aggregates from ADV and MODIS to construct the combined AOD dataset.
This combined dataset was used to produce long-term (1995–2017) annual and seasonal AOD time series for all of China, SE China and 10 selected regions. Linear regression was applied to individual L3 (1∘ × 1∘) pixels of the annual and seasonal combined AOD time series to estimate the changes in AOD over China for two periods: 1995–2006 (P1) and 2011–2017 (P2). The years 2006 and 2011 were identified as pivot points using statistical analysis. These pivot points coincide well with the changes in the emission regulation policy in China related to the Chinese Five-Year Plan initiative. The length of the periods is too short to estimate the AOD trends; therefore, we discuss the AOD tendencies per year for the corresponding periods.
The main results and conclusions are summarized below:
-
In P1, associated with the increase of emissions induced by rapid economic development (Jin et al., 2016), AOD increased strongly over the wide industrial areas. For the annual AOD, the positive tendency of 0.006 (or 2 % of the AOD averaged over the corresponding period), per year was observed for all of China. In SE China, the annual AOD positive tendency in 1995–2006 was 0.014, or 3 %, per year, reaching maxima (0.020, or 4 %, per year) in Shanghai and the Pearl River Delta regions.
-
In P2, negative AOD tendencies (−0.015, or −6 %, per year) were identified across most of China after 2011 in conjunction with effective emission reduction of anthropogenic primary aerosols, SO2 and NOx (Jin et al., 2016; van der A et al., 2017; Georgoulias et al., 2018). The air quality generally improved in developed regions. Overall, the AOD decrease in P2 was 2–3 times stronger than the AOD increase in P1 over most of SE China. The strongest AOD decrease during the 2011–2011 period is observed in the Chengdu (−0.045, or −8 %, per year) and Zhengzhou (−0.046, or −9 %, per year) areas, while the AOD decrease was , or ca. −6 %, per year over the North China Plain and coastal areas. In the less populated areas, the AOD decrease was small.
Seasonal patterns in the AOD regional long-term tendencies are evident. The contribution of seasonal AOD tendencies to annual tendencies was not equal throughout the year. While the annual AOD tendency was positive in P1, the AOD tendencies in winter and spring were slightly negative (ca. −0.002, or −1 %, per year) over most of China during that period. AOD tendencies were positive in summer (0.008, or 2 %, per year) and autumn (0.006, or 6 %, per year) over mainland China and SE China (0.020, or 4 %, per year and 0.016, or 4 %, per year in summer and autumn, respectively). As in P1, the AOD negative tendencies in P2 were higher compared with other seasons in summer over China (ca. −0.021, or −7 %, per year) and over SE China (ca. −0.048, or −9 %, per year). In the east, seasonal variations in the AOD tendencies were less pronounced.
Table A1Comparison of the seasonal and annual ADV, MODIS and combined AOD with AERONET AOD for different periods: T2 (2000–2011, ADV and MODIS overlap period), T3 (2011–2017, MODIS), ADV period (1998–2012), MODIS/Terra whole period (2000–2017); number of points (N), correlation coefficient (R), standard deviation (σ) and root mean square error (rms).

Table A2AOD tendency (dAOD) per year and statistics for the annual combined AOD time series linear fit (p-value, bias, slope, uncertainty and relative error – re, %) for two periods: P1 (1995–2006), and P2 (2011–2017) for the different regions (r, where region 11 is all of mainland China and region 12 is mainland SE China).
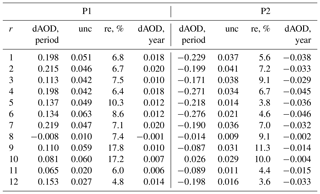
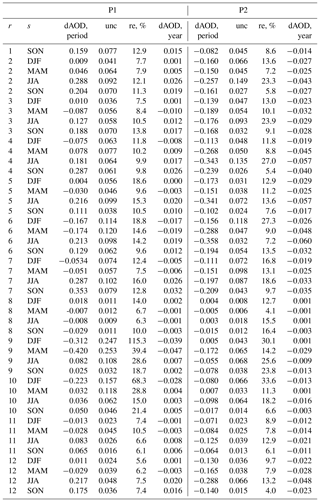
Table A3AOD tendency (dAOD) per period and year, uncertainty (unc) and relative error (re, %) for the seasonally combined AOD time series for two periods: P1 (1995–2006) and P2 (2011–2017) for the different regions (r, where region 11 is mainland China and region 12 is mainland SE China) and different seasons (s, DJF – winter, MAM – spring, JJA – summer, SON – autumn).
The ATSR data used in this paper are publicly available (after registration a password will be issued) at: http://www.icare.univ-lille1.fr/ (last access: 21 November 2018). MODIS data are publicly available at: https://ladsweb.modaps.eosdis.nasa.gov/ (last access: 21 November 2018). AERONET data are available at AERONET: https://aeronet.gsfc.nasa.gov/ (last access: 21 November 2018).
The whole team designed the research. LS and ER performed the analysis and prepared the figures and tables. LS wrote the paper with comments/contributions from the whole team.
The authors declare that they have no conflict of interest.
Work presented in this contribution was undertaken as part of the MarcoPolo project supported by the EU, FP7 SPACE grant agreement no. 606953 and as part of the GlobEmission project ESA-ESRIN Data Users Element (DUE), project AO/1-6721/11/I-NB; it also contributes to the ESA/MOST DRAGON4 program. The ATSR algorithm (ADV/ASV) used in this work is improved with support from ESA as part of the Climate Change Initiative (CCI) project Aerosol_cci (ESA-ESRIN projects AO/1-6207/09/I-LG and ESRIN/400010987 4/14/1-NB). Further support was received from the Centre of Excellence in Atmospheric Science funded by the Finnish Academy of Sciences Excellence (project no. 272041). Many thanks are expressed to the NASA Goddard Space Flight Center (GSFC) Level 1 and Atmosphere Archive and Distribution System (LAADS) (http://ladsweb.nascom.nasa.gov, last access: 21 November 2018) for making the L3 MODIS/Terra C6.1 aerosol data available. The AERONET team is acknowledged for establishing and maintaining the AERONET sites used in this study.
We would also like to thank the reviewer Andrew Sayer for his criticisms and
valuable suggestions regarding the paper.
Edited by: Stelios Kazadzis
Reviewed by: Andrew Sayer and one anonymous referee
Aerosol Robotic Network AERONET, NASA and PHOTONS: available at: https://aeronet.gsfc.nasa.gov/, last access: 21 November, 2018..
Bouarar, I., Wang, X., and Brasseur, G. P.: Air Pollution in Eastern Asia: An Integrated Perspective, Springer, p. 504, 2017.
CAAC: Clean Air Alliance of China, State Council air pollution prevention and control action plan, issue II, October 2013, available at: http://en.cleanairchina.org/product/6346.html (last access: 8 March 2017), English translation, 2013.
Cao, Q., Liang, Y., and Niu, X.: China's Air Quality and Respiratory Disease Mortality Based on the Spatial Panel Model., Int. J. Environ. Res. Public Health, 14, 1081, https://doi.org/10.3390/ijerph14091081, 2017.
Center for International Earth Science Information Network – CIESIN – Columbia University. Gridded Population of the World, Version 4 (GPWv4): Population Density, Revision 10. Palisades, NY: NASA Socioeconomic Data and Applications Center (SEDAC), https://doi.org/10.7927/H4DZ068D, 2017.
Chan, K. W.: Migration and development in China: trends, geography and current issues, Migr. Develop., 1, 187–205, 2012.
de Leeuw, G., Holzer-Popp, T., Bevan, S., Davies, W., Descloitres, J., Grainger, R.G., Griesfeller, J., Heckel, A., Kinne, S., Klüser, L., Kolmonen, P., Litvinov, P., Martynenko, D., North, P.J.R., Ovigneur, B., Pascal, N., Poulsen, C., Ramon, D., Schulz, M., Siddans, R., Sogacheva, L., Tanré, D., Thomas, G.E., Virtanen, T. H., von Hoyningen Huene, W., Vountas, M., and Pinnock, S.: Evaluation of seven European aerosol optical depth retrieval algorithms for climate analysis, Remote Sens. Environ., 162, 295–315, https://doi.org/10.1016/j.rse.2013.04.023, 2015.
de Leeuw, G., Sogacheva, L., Rodriguez, E., Kourtidis, K., Georgoulias, A. K., Alexandri, G., Amiridis, V., Proestakis, E., Marinou, E., Xue, Y., and van der A, R.: Two decades of satellite observations of AOD over mainland China using ATSR-2, AATSR and MODIS/Terra: data set evaluation and large-scale patterns, Atmos. Chem. Phys., 18, 1573–1592, https://doi.org/10.5194/acp-18-1573-2018, 2018.
Flowerdew, R. J. and Haigh, J.: Retrieval of aerosol optical thickness over land using the ATSR-2 dual-look satellite radiometer, Geogr. Res. Lett., 23, 351–354, ISSN:0094-8276, 1996.
Fuzzi, S., Baltensperger, U., Carslaw, K., Decesari, S., Denier van der Gon, H., Facchini, M. C., Fowler, D., Koren, I., Langford, B., Lohmann, U., Nemitz, E., Pandis, S., Riipinen, I., Rudich, Y., Schaap, M., Slowik, J. G., Spracklen, D. V., Vignati, E., Wild, M., Williams, M., and Gilardoni, S.: Particulate matter, air quality and climate: lessons learned and future needs, Atmos. Chem. Phys., 15, 8217–8299, https://doi.org/10.5194/acp-15-8217-2015, 2015.
Georgoulias, A. K., van der A, R. J., Stammes, P., Boersma, K. F., and Eskes, H. J.: Trends and trend reversal detection in two decades of tropospheric NO2 satellite observations, Atmos. Chem. Phys. Discuss., https://doi.org/10.5194/acp-2018-988, in review, 2018.
Gu, X., Bao, F., Cheng, T., Chen, H., Wang, Y., and Guo, H.: The impacts of regional transport and meteorological factors on aerosol optical depth over Beijing, 1980–2014, Sci. Reports, 8, 5113, 2018.
Guo, J. P., Zhang, X. Y., Wu, Y. R., Zhaxi, Y., Che, H. Z., La, B., Wang, W., and Li, X. W.: Spatio-temporal variation trends of satellite-based aerosol optical depth in China during 1980–2008, Atmos. Environ., 4537, 6802–6811, 2011.
Guo, J., Wu, Y., and Li, X.: Long term variation trends of aerosol optical depth in China from MODIS and toms, IEEE Int. Geosci. Remote Sens. Symp., Munich, 3712–3715, https://doi.org/10.1109/IGARSS.2012.6350511, 2012.
He, Q., Ming, Z., and Huang, B.: Spatio-temporal variation and impact factors analysis of satellite based aerosol optical depth over China from 2002 to 2015, Atmos. Environ., 129, 79–90, 2016.
Holben, B. N., Eck, T. F., Slutsker, I., Tanré, D., Buis, J. P., Setzer, A., Vermote, E., Reagan, J. A., Kaufman, Y., Nakajima, T., Lavenu, F., Jankowiak, I., and Smirnov, A.: AERONET – A federated instrument network and data archive for aerosol characterization, Remote Sens. Environ., 66, 1–16, 1998.
Hsu, N. C., Tsay, S. C., King, M. D., and Herman, J. R.: Aerosol properties over bright-reflecting source regions, IEEE Trans. Geosci. Remote Sens., 42, 557–569, https://doi.org/10.1109/TGRS.2004.824067, 2004.
Hsu, N. C., Jeong, M.-J., Bettenhausen, C., Sayer, A. M., Hansell, R., Seftor, C. S., Huang, J., and Tsay, S.-C.: Enhanced Deep Blue aerosol retrieval algorithm: The second generation, J. Geophys. Res.-Atmos., 118, 9296–9315, https://doi.org/10.1002/jgrd.50712, 2013.
ICARE data and service center, France, available at: http://www.icare.univ-lille1.fr/, last access: 21 November, 2018.
Jin, Y., Andersson, H., and Zhang, S.: Air Pollution Control Policies in China: A Retrospective and Prospects, Int. J. Environ. Res. Public Health, 13, 1219, https://doi.org/10.3390/ijerph13121219, 2016.
Kanakidou, M.: Atmospheric Aerosols and Climate Impacts. In Aerosol Science, eds. I. Colbeck and M. Lazaridis, Chapter 8, John Wiley & Sons, Ltd, https://doi.org/10.1002/9781118682555, 2014.
Kaufman, Y. J., Tanrι, D., Remer, L. A., Vermote, E. F., Chu, A., and Holben, B. N.: Operational remote sensing of tropospheric aerosol over land from EOS moderate resolution imaging spectroradiometer, J. Geophys. Res., 102, 17051, https://doi.org/10.1029/96JD03988, 1997.
Kolmonen, P., Sogacheva, L., Virtanen, T. H., de Leeuw, G., and Kulmala, M.: The ADV/ASV AATSR aerosol retrieval algorithm: current status and presentation of a full-mission AOD data set, In. J. Digit. Earth, 9, 545–561, https://doi.org/10.1080/17538947.2015.1111450, 2016.
Kourtidis, K., Stathopoulos, S., Georgoulias, A. K., Alexandri, G., and Rapsomanikis, S.: A study of the impact of synoptic weather conditions and water vapor on aerosol–cloud relationships over major urban clusters of China, Atmos. Chem. Phys., 15, 10955–10964, https://doi.org/10.5194/acp-15-10955-2015, 2015.
Kulmala, M.: Atmospheric chemistry: China's choking cocktail, Nature, 526, 497–499, https://doi.org/10.1038/526497a, 2015.
LAADS DAAC the Level-1 and Atmosphere Archive & Distribution System Distributed Active Archive Center, NASA, available at: https://ladsweb.modaps.eosdis.nasa.gov/, last access: 21 November, 2018.
Levy, R. C., Mattoo, S., Munchak, L. A., Remer, L. A., Sayer, A. M., Patadia, F., and Hsu, N. C.: The Collection 6 MODIS aerosol products over land and ocean, Atmos. Meas. Tech., 6, 2989–3034, https://doi.org/10.5194/amt-6-2989-2013, 2013.
Li, J., Zhiwei Han, Z., and Xie, Z.: Model analysis of long-term trends of aerosol concentrations and direct radiative forcings over East Asia, Tellus B, 65, 20410, https://doi.org/10.3402/tellusb.v65i0.20410, 2013.
Li, J., Carlson, B. E., Dubovik, O., and Lacis, A. A.: Recent trends in aerosol optical properties derived from AERONET measurements, Atmos. Chem. Phys., 14, 12271–12289, https://doi.org/10.5194/acp-14-12271-2014, 2014.
Li, J., Li, X., Carlson, B. E., Kahn, R. A., Lacis, A., Dubovik, O., and Nakajima, T.: Reducing multisensor satellite monthly mean aerosol optical depth uncertainty: 1. Objective assessment of current AERONET locations, J. Geophys. Res.-Atmos., 121, 13609–13627, https://doi.org/10.1002/2016JD025469, 2016.
Lin, J., Nielsen, C. P., Zhao, Y., Lei, Y., Liu Y., and Mcelroy, B.: Recent Changes in Particulate Air Pollution over China Observed from Space and the Ground: Effectiveness of Emission Control, Environ. Sci. Technol., 44, 7771–7776, 2010.
Lin, X., Wang, Y., Wang, S., and Wang, D.: Spatial differences and driving forces of land urbanization in China, J. Geogr. Sci., 25, 545–558, 2015.
Luo, Y., Zheng, X., Zhao, T., and Chen, J.: A climatology of aerosol optical depth over China from recent 10 years of MODIS remote sensing data, Int. J. Climatol., 34, 863–870, 2014.
Ma, H. and Chen, Z.: Patterns of Interprovincial Migration in China: Evidence from the Sixth Population Census, Populat. Res., 6, 87–99, 2012.
Mehta, M., Singh, R., Singh, A., Singh, N., and Anshumali: Recent global aerosol optical depth variations and trends – a comparative study using MODIS and MISR level 3 datasets, Remote Sens. Environ., 181, 137–50, 2016.
Morrison, W. M.: China's Economic Rise: History, Trends, Challenges, and Implications for the United States, Congressional Research Service 7-5700, RL33534, available at: https://fas.org/sgp/crs/row/RL33534.pdf, last access: 5 September 2018.
Nzihou, A. and Stanmore, B. R.: The Formation of Aerosols During the Co-combustion of Coal and Biomass, Waste Biomass Valor., 6, 947–957, https://doi.org/10.1007/s12649-015-9390-3, 2015.
Popp, T., de Leeuw, G., Bingen, C., Brühl, C., Capelle, V., Chedin, A., Clarisse, L. , Dubovik, O., Grainger, R., Griesfeller, J., Heckel, A., Kinne, S., Klüser, L., Kosmale, M., Kolmonen, P., Lelli, L., Litvinov, P., Mei, L., North, P., Pinnock, S., Povey, A., Robert, C., Schulz, M., Sogacheva, L., Stebel, K., Stein Zweers, D., Thomas, G., Tilstra, L.G., Vandenbussche, S., Veefkind, P., Vountas, M., and Xue, Y.: Development, production and evaluation of aerosol Climate Data Records from European satellite observations (Aerosol_cci), Remote Sens., 8, 421, https://doi.org/10.3390/rs8050421, 2016.
Remer, L. A., Kaufman, Y. J., Tanré, D., Mattoo, S., Chu, D. A., Martins, J. V., Li, R.-R., Ichoku, C., Levy, R. C., Kleidman, R. G., Eck, T. F., Vermote, E., and Holben, B. N.: The MODIS Aerosol Algorithm, Products, and Validation, J. Atmos. Sci., 62, 947–973, https://doi.org/10.1175/JAS3385.1, 2005.
Salomonson, V. V., Barnes, W. L., Maymon, P. W., Montgomery, H. E., and Ostrow, H.: MODIS: Advanced facility instrument for studies of the Earth as a system, IEEE T. Geosci. Remote, 27, 145–153, 1989.
Sarrafzadeh, M., Wildt, J., Pullinen, I., Springer, M., Kleist, E., Tillmann, R., Schmitt, S. H., Wu, C., Mentel, T. F., Zhao, D., Hastie, D. R., and Kiendler-Scharr, A.: Impact of NOx and OH on secondary organic aerosol formation from β-pinene photooxidation, Atmos. Chem. Phys., 16, 11237–11248, https://doi.org/10.5194/acp-16-11237-2016, 2016.
Sayer, A. M., Thomas, G. E., and Grainger, R. G.: A sea surface reflectance model for (A)ATSR, and application to aerosol retrievals, Atmos. Meas. Tech., 3, 813–838, https://doi.org/10.5194/amt-3-813-2010, 2010.
Sayer, A. M., Munchak, L. A., Hsu, N. C., Levy, R. C., Bettenhausen, C., and Jeong, M.-J.: MODIS Collection 6 aerosol products: Comparison between Aqua's e-Deep Blue, Dark Target, and “merged” data sets, and usage recommendations, J. Geophys. Res.-Atmos., 119, 13965–13989, https://doi.org/10.1002/2014JD022453, 2014.
Schönwiese, C. D. and Rapp, J.: Climate trend atlas of Europe based on observations 1891–1990, Kluwer Academic Pub., Netherlands, 228, 1997.
Sihto, S.-L., Kulmala, M., Kerminen, V.-M., Dal Maso, M., Petäjä, T., Riipinen, I., Korhonen, H., Arnold, F., Janson, R., Boy, M., Laaksonen, A., and Lehtinen, K. E. J.: Atmospheric sulphuric acid and aerosol formation: implications from atmospheric measurements for nucleation and early growth mechanisms, Atmos. Chem. Phys., 6, 4079–4091, https://doi.org/10.5194/acp-6-4079-2006, 2006.
Sogacheva, L., Kolmonen, P., Virtanen, T. H., Rodriguez, E., Saponaro, G., and de Leeuw, G.: Post-processing to remove residual clouds from aerosol optical depth retrieved using the Advanced Along Track Scanning Radiometer, Atmos. Meas. Tech., 10, 491–505, https://doi.org/10.5194/amt-10-491-2017, 2017.
Sogacheva, L., de Leeuw, G., Rodriguez, E., Kolmonen, P., Georgoulias, A. K., Alexandri, G., Kourtidis, K., Proestakis, E., Marinou, E., Amiridis, V., Xue, Y., and van der A, R. J.: Spatial and seasonal variations of aerosols over China from two decades of multi-satellite observations – Part 1: ATSR (1995–2011) and MODIS C6.1 (2000–2017), Atmos. Chem. Phys., 18, 11389–11407, https://doi.org/10.5194/acp-18-11389-2018, 2018.
Stathopoulos, S., Georgoulias, A. K., and Kourtidis, K.: Spaceborne observations of aerosol – cloud relations for cloud systems of different heights, Atmos. Res., 183, 191–201, 2017.
Streets, D. G., Yan, F., Chin, M., Diehl, T., Mahowald, N., Schultz, M., Wild, M., Wu, Y. and Yu, C.: Anthropogenic and natural contributions to regional trends in aerosol optical depth, 1980–2006, J. Geophys. Res., 114, D00D18, https://doi.org/10.1029/2008JD011624, 2009.
Su, X., Goloub, P., Chiapello, I., Chen, H., Ducos, F., and Li, Z.: Aerosol variability over East Asia as seen by POLDER space-borne sensors, J. Geophys. Res., 115, D24215, https://doi.org/10.1029/2010JD014286, 2010.
Tang, X., McLellan, B. C., Snowden, S., Zhang, B., and Höök, M.: Dilemmas for China: Energy, Economy and Environment, Sustainability, 7, 5508–5520, 2015.
Tanré, D., Kaufman, Y. J., Herman, M., and Mattoo, S.: Remote sensing of aerosol properties over oceans using the MODIS/EOS spectral radiances, J. Geophys. Res.-Atmos., 102, 16971–16988, https://doi.org/10.1029/96JD03437, 1997.
Tie, X. X., Wu, D., and Brasseur, G.: Lung cancer mortality and exposure to atmospheric aerosol particles in Guangzhou, China, Atmos. Environ., 43, 2375–2377, 2009.
van der A, R. J., Mijling, B., Ding, J., Koukouli, M. E., Liu, F., Li, Q., Mao, H., and Theys, N.: Cleaning up the air: effectiveness of air quality policy for SO2 and NOx emissions in China, Atmos. Chem. Phys., 17, 1775–1789, https://doi.org/10.5194/acp-17-1775-2017, 2017.
Veefkind, J. P., de Leeuw, G., and Durkee, P. A.: Retrieval of aerosol optical depth over land using two-angle view satellite radiometry during TARFOX, Geophys. Res. Let., 25, 3135–3138, 1998.
Wang, L., Li, P., Yu, S., Mehmood, K., Li, Z., Chang, S., Liu, W., Rosenfeld, D., Flagan R. C., and Seinfeld, J. H.: Predicted impact of thermal power generation emission control measures in the Beijing-Tianjin-Hebei region on air pollution over Beijing, China, Sci. Reports, 8, 934, https://doi.org/10.1038/s41598-018-19481-0, 2018.
Wang, P., Ning, S., Dai, J., Sun, J., Li, M., Song, Q., Dai, X., Zhao, J., and Yu, D.: Trends and Variability in Aerosol Optical Depth over North China from MODIS C6 Aerosol Products during 2001–2016, Atmosphere, 8, 223, https://doi.org/10.3390/atmos8110223, 2017.
Weatherhead, E. C., Harder, J., Araujo-Pradere, E. A., Bodeker, G., English, J. M., Flynn, L. E., Frith, S. M., Lazo, J. K., Pilewskie, P., Weber, M., and Woods, T. N.: How long do satellites need to overlap? Evaluation of climate data stability from overlapping satellite records, Atmos. Chem. Phys., 17, 15069–15093, https://doi.org/10.5194/acp-17-15069-2017, 2017.
World Bank: China Economic Update, December 2017, available at: http://pubdocs.worldbank.org/en/485891513640933352/CEU-Dec-1219-EN.pdf (last access: 6 September 2018), 2017.
Wu, Y., Zhang, S., Hao, J., Liu, H., Wu, X., Hu, J., Walsh, M. P., Wallington, T. J., Zhang, K. M., and Stevanovic, S.: On-road vehicle emissions and their control in China: A review and outlook, Sci. Total Environ., 574, 332–349, https://doi.org/10.1016/j.scitotenv.2016.09.040, 2017.
Xie, J. X. and Xia, X. A.: Long-term trend in aerosol optical depth from 1980 to 2001 in north China, Particuology, 6, 106–111, 2008.
Yang, L. and Wang, K.-L.: Regional differences of environmental efficiency of China's energy utilization and environmental regulation cost based on provincial panel data and DEA method, Math. Comput. Model, 58, 1074–1083, 2013.
Yang, Y., Wang, H., Smith, S.J., Zhang, R., Lou, S., Qian, Y., Ma, P. L., and Rasch, P. J.: Recent intensification of winter haze in China linked to foreign emissions and meteorology, Sci. Reports, 8, 2107, 2018.
Yin, Z., Wang, H., and Chen, H.: Understanding severe winter haze events in the North China Plain in 2014: roles of climate anomalies, Atmos. Chem. Phys., 17, 1641–1651, https://doi.org/10.5194/acp-17-1641-2017, 2017.
Zhang, K.: Urbanization and Industrial Development in China, in: book: China's Urbanization and Socioeconomic Impact, edited by: Tang, Z., Springer, 21–35, https://doi.org/10.1007/978-981-10-4831-9_2, 2017.
Zhang, J., Reid, J. S., Alfaro-Contreras, R., and Xian, P.: Has China been exporting less particulate air pollution over the past decade?, Geophys. Res. Lett., 44, 2941–2948, https://doi.org/10.1002/2017GL072617, 2017.
Zhang, Q., Xin, J., Yin, Y., Wang, L., and Wang, Y.: The variations and trends of MODIS C5 & C6 products' errors in the recent decade over the background and urban areas of North China, Remote Sens., 8, 754, https://doi.org/10.3390/rs8090754, 2016.
Zhao, B., Jiang, J. H., Gu, Y., Diner, D., Worden, J., Liou, K.-N., Su, H., Xing, J., Garay, M., and Huang, L.: Decadal-scale trends in regional aerosol particle properties and their linkage to emission changes, Environ. Res. Lett., 12, 054021, https://doi.org/10.1088/1748-9326/aa6cb2, 2017.
- Abstract
- Introduction
- Study area and selection of the regions
- AOD data: instrumentation, AOD retrieval algorithms and aerosol datasets
- Long-term (1995–2017) annual and seasonal AOD time series combined from ADV and MODIS
- AOD tendencies for the 1995–2017 period
- Summary and conclusions
- Appendix A
- Data availability
- Author contributions
- Competing interests
- Acknowledgements
- References