the Creative Commons Attribution 4.0 License.
the Creative Commons Attribution 4.0 License.
 | 22 Nov 2018
Estimating the influence of transport on aerosol size distributions during new particle formation events
Runlong Cai
Indra Chandra
Dongsen Yang
Lei Yao
Yueyun Fu
Xiaoxiao Li
Lun Luo
Jiming Hao
Yan Ma
Jun Zheng
Takafumi Seto
Jingkun Jiang
New particle formation (NPF) and subsequent particle growth occur frequently in various atmospheric environments. Significant influence of transport on aerosol size distributions is commonly observed, especially for non-regional NPF events. With certain assumptions and approximations, a population balance method is proposed to examine the influence of transport on the temporal evolution of aerosol size distributions during NPF events. The method is derived from the aerosol general dynamic equation in the continuous form. Meteorological information (e.g., wind speed, wind direction, and water vapor mixing ratio) was used to complement the analysis. The NPF events observed in Southeast Tibet, Fukue Island, and urban Beijing were analyzed using the proposed method. Significant contribution of transport to the observed aerosol size distributions is found during the NPF events in both Southeast Tibet and Fukue Island. The changes in the contribution of transport have a good correlation with the changes in wind speed and direction. This correlation indicates that local mountain and valley breezes govern the observed new particles at the Southeast Tibet site. Most NPF events observed at Fukue Island are closely related to the long-range transport of aerosols and gaseous precursors due to the movement of air masses. Regional NPF events are typically observed in urban Beijing and the contribution of transport to the observed aerosol size distributions is negligible when compared to other processes such as condensational growth and coagulation scavenging. In a relatively clean atmospheric environment, the proposed method can be used to characterize the contribution of transport to particles in the size range from ∼10 to ∼50 nm. During intense NPF events in a relatively polluted atmospheric environment, however, the estimated contribution of transport is sensitive to the uncertainties in condensational growth and coagulation scavenging due to the dominance of their corresponding terms in the population balance equation.
- Article
(7856 KB) - Full-text XML
-
Supplement
(723 KB) - BibTeX
- EndNote


Understanding the formation mechanism of secondary aerosols and their interactions with cloud and radiation will contribute to a better prediction of global climate (IPCC, 2013). Secondary new particle formation (NPF) is a common phenomenon observed in various atmospheric environments (Kulmala et al., 2004). During an NPF event, gaseous precursors form molecular clusters spontaneously by random collisions, which can grow rapidly into larger particles due to condensation if they survive evaporation and coagulation scavenging. Both field measurements and theoretical modeling indicate that NPF is an important source of cloud condensation nuclei (e.g., Kuang et al., 2009; Kerminen et al., 2012). During a typical regional NPF event, new particles can be formed in a spatial scale extending over several hundred kilometers (Hussein et al., 2009); thus nucleation and the subsequent growth of particles are usually regarded as regional phenomena and the influence of transport is often assumed to be negligible (e.g., Kulmala et al., 2001; Cai and Jiang, 2017). However, during a non-regional NPF event, the influence of transport can be significant.
The shape of temporal evolution of aerosol size distributions was used to identify whether the observed NPF event is a regional one or not. A banana-shaped event was usually regarded as a regional event (Kulmala et al., 2012), whereas other shapes (e.g., “apple” and “hump” shapes) may indicate non-regional events (Vana et al., 2008). For instance, significant increases in sub-50 nm particle concentrations were observed at ground level during precipitation in the central Amazon basin due to the vertical transport from the lower free troposphere to the boundary layer (Wang et al., 2016). At Jungfraujoch in Switzerland, the increase in the number concentration of 10–50 nm particles was observed on 55 % of days without any direct evidence of local nucleation or condensational growth. The observed new particles were perhaps formed off-site (Tröstl et al., 2016). At Mace Head on the west coast of Ireland, gaseous precursors are formed away from the observation site, and thus apple and hump events were sometimes observed (Vana et al., 2008). In fact, reported influence of transport on particle formation can be dated back to John Aitken's studies (e.g., Aitken, 1912). Usually, it is easy to identify that the observed aerosol size distributions are non-negligibly affected by transport during these “non-banana” events.
In addition, a typical “banana” event does not evidently indicate that new particles are formed without the influence of transport. During some banana NPF events, no significant increase in the number concentration of sub-5 nm particles was observed, indicating that the observed new particles were not formed locally. For instance, only particle growth was observed without high concentrations of sub-5 nm particles during some NPF events at Fukue Island. A possible reason is that nucleation occurred upstream of the observation site and the newly formed particles had grown into larger diameters during the long-range transport of the air masses (Chandra et al., 2016). The contribution of transport to the observed aerosol size distributions cannot be simply assumed negligible in such events. To the best of our knowledge, however, methods to quantitatively analyze a NPF event for estimating the contribution of transport have not been reported previously.
The population balance method based on the aerosol general dynamic equation may help to estimate the influence of transport. In previous studies, the population balance method was used to estimate new particle formation rates (Kulmala et al., 2001, 2012; Cai and Jiang, 2017) and size-resolved particle growth rate (Kuang et al., 2012). Neglecting the influence of transport is one of the fundamental assumptions of these applications. In contrast, if condensational growth and particle loss due to coagulation scavenging can be properly quantified, the contribution of transport to the observed aerosol size distributions can perhaps be estimated.
In this study, we propose a population balance method for examining the contribution of transport to the temporal evolution of the observed aerosol size distributions during atmospheric NPF events. It is derived from the aerosol general dynamic equation in the continuous form with certain assumptions and approximations. The proposed method is applied to analyze the NPF events observed in Southeast Tibet, Fukue Island, and urban Beijing. Meteorological data at these sites are also analyzed. The feasibility and uncertainties of the proposed method are discussed.
The proposed method for estimating the contribution of transport to the temporal evolution of aerosol size distributions is based on the aerosol general dynamic equation. For a particle larger than ∼10 nm that consists of sufficient molecules, the particle diameter can be approximated to be a continuous (rather than discrete) function of the molecular number. Accordingly, we use the general dynamic equation in the continuous form to characterize the temporal evolution of aerosol size distributions in this study. The general dynamic equation accounting for the influence of transport is shown in Eq. (1):
where the subscripts i and j correspond to the specific particle diameters (dp, in m) di and dj, respectively; N[i,j] (in no. m−3) is the number concentration of particles ranging from di to dj; t is time (in s); dN ∕ dt characterizes the change in the observed particle number concentration (in no. m−3 s−1); GR is the condensational growth rate (in m s−1) defined as ddp ∕ dt; n is the aerosol size distribution function (in no. m−4), dN ∕ ddp; CoagSrc[i,j] and CoagSnk[i,j] are the formation and loss rates due to coagulation for particles ranging from di to dj (in no. m−3 s−1), respectively; and TR[i,j] is the newly introduced transport term (in no. m−3 s−1, to be explained below). The terms on the right-hand side of Eq. (1) correspond to the five processes leading to the change in observed particle number concentration: particle condensational growth into and out of the size range, formation and scavenging due to coagulation, and the contribution of transport. The theoretical expressions for CoagSrc[i,j] and CoagSnk[i,j] in the integral form are shown in Eqs. (2) and (3), respectively (Kuang et al., 2012).
where β(x,y) is the coagulation coefficient (m3 s−1) for particles with the diameter dx and those with the diameter dy. The value of β(x,y) can be estimated using Fuchs' formula (Eq. 13.56 in Seinfeld and Pandis, 2006); dx and dy are variables representing particle diameters determined by the limits of integration; is the subscript of , and is defined by ; nx, ny, and are the aerosol size distribution functions (dN ∕ ddp) at dx, dy, and , respectively.
The transport term in Eq. (1), TR[i,j], characterizes the contribution of transport to the observed dN[i,j] ∕ dt. However, the physical meanings of TR[i,j] and dN[i,j] ∕ dt should be specially clarified. When aerosol is well mixed, i.e., there is no difference among the aerosol size distributions at different spatial positions, the observed dN[i,j] ∕ dt is only affected by coagulation and condensational growth into and out of the size range. However, there is no absolute homogeneity of aerosols in the real ambient air. Since the air is constantly flowing, whereas the sampling inlet for the instrument is usually fixed at a specific position, the observed aerosol size distributions at different times actually correspond to different aerosol populations. As shown in Fig. 1, the observed N[i,j] at time t is and z1 denotes the detected aerosol population at t. For the sake of illustration, we may assume that the aerosols at different spatial positions do not mix with each other and hence z1 can be related to the Lagrangian position of the observed aerosol population. After a short time interval, dt, we assume that the observed particle number concentration is , where z2 indicates that the detected aerosol population has changed due to transport. The measured time rate of change of particle number concentration, dN[i,j] ∕ dt, is the synergistic result of changes in both time and fluid position, which can be mathematically described as
At time t + dt, the number concentration of aerosols at the initial position z1 should become . The value of can be theoretically estimated using the general dynamic equation:
Equations (1), (4), and (5) indicate that TR[i,j] essentially characterizes the difference between the measured and the theoretically predicted aerosol concentrations, i.e., the difference between the two aerosol populations at z1 and z2, as shown in Eq. (6).
Note that the illustrations above maintain generality without the assumption of aerosol mixing, except that there is no simple relationship between z and the Lagrangian position of aerosols when considering mixing.

Figure 1The schematic to illustrate the definition of the transport term. The subscripts [i,j] of CoagSrc, CoagSnk, and TR are omitted in the figure. The boxes with a solid edge represent the observed particles at different times. The box with a semi-dashed edge cannot be detected because observed aerosol population changes with time; however, their number concentration can be theoretically estimated using the general dynamic equation. The z axis denotes different aerosol populations; z corresponds to the Lagrangian positions if there is no mixing among particles at different spatial positions.
TR[i,j] can be estimated using Eq. (1) if the other terms can be properly quantified with certain assumptions. The formulas to estimate CoagSrc[i,j] and CoagSnk[i,j] can be simplified if the concerned size range, [di, dj], is relatively narrow. CoagSnk[i,j] can be approximated using the following equation:
The subscript m corresponds to the representative diameter, dm of the size range [di, dj]; dm is usually the arithmetic or geometric mean diameter of di and dj; Nk is the particle number concentration in a size bin and k is the corresponding bin number; β(m,k) is the coagulation coefficient between the two particles with diameters dm and dk. The summation term is the coagulation sink (CoagS; Kulmala et al., 2001); however, CoagS is not referred to in order to avoid confusion with CoagSnk. Note that when using Eq. (7) to estimate the CoagSnk[i,j], the concerned size range, [di, dj] should be narrow enough so that dm can serve as a representative diameter when estimating the coagulation coefficients (Cai and Jiang, 2017).
During NPF events in relatively clean atmospheric environments, CoagSrc[i,j] is usually much smaller than CoagSnk[i,j] for nucleation-mode particles (< 50 nm). As shown in Eqs. (2) and (3), one of the integrals for CoagSnk[i,j] covers all the particle diameters, whereas CoagSrc[i,j] is only determined by particles in a limited size range. In addition, the coagulation coefficient, β(x,y), tends to be higher if the differences between dx and dy are larger. Thus, it is reasonable to simply neglect CoagSrc[i,j] during NPF events in a relatively clean atmospheric environment (where the number concentration of new particles is relatively low) like in some previous balance formulas to estimate new particle formation rates (Kulmala et al., 2001, 2012). In a relatively polluted atmospheric environment, CoagSrc[i,j] should be considered to avoid potential overestimation of TR[i,j] (Cai and Jiang, 2017). However, during the test NPF event in a relatively polluted atmospheric environment in Sect. 4.3, CoagSrc[i,j] is also negligible compared to CoagSnk[i,j].
In the perspective of the kinetic theory of gases, the condensational increment in the particle diameter is caused by random collisions of various gaseous precursors (such as sulfuric acid and organics) onto preexisting particle surfaces. Without loss of generality, we may use a single representative gaseous precursor, e.g., sulfuric acid, to illustrate the size dependence of the growth rate. The growth rate contributed by the condensation of sulfuric acid monomer can be estimated as follows (Weber et al., 1997; Kuang et al., 2010):
where VSA is the volume of a sulfuric acid monomer (in m3); NSA is the number concentration of sulfuric acid monomer (in no. m−3); is the mean relative thermal velocity between a sulfuric acid monomer and a particle (in m s−1); βm is a fitted dimensionless correction coefficient; and dSA is the diameter of a sulfuric acid monomer (in m). An expression for βm is shown in Eq. (8) (Fuchs and Sutugin, 1971), where α is the mass accommodation coefficient and Kn is the Knudsen number.
The condensational growth rates for particles in a certain size range (e.g., 10–50 nm) can be approximated as a constant value. The size dependence of particle grow rate is relatively weak in the size range from 10 to 50 nm. When assuming an α of 1.0, the estimated growth rate for 50 nm particles using Eq. (8) is ∼82 % of the grow rate for 10 nm particles (293 K, 101 kPa). Note that the value of GRSA is insensitive to dSA in the size range from 10 to 50 nm; i.e., the diameters of different gaseous precursors do not significantly affect the size dependency of the condensational growth rate. The evaporation of gaseous precursors due to the Kelvin effect is significant for small particles, especially in the sub-3 nm size range. However, it can be neglected for relatively large particles. Size-dependent growth rates were estimated during atmospheric NPF events (Kuang et al., 2012) and in chamber studies (Pichelstorfer et al., 2018). The estimated growth rates were relatively constant within acceptable uncertainties when the particles were larger than certain diameters, e.g., ∼3 nm in Kuang et al. (2012) and ∼10 nm in Pichelstorfer et al. (2018). Thus, GRi and GRj in Eq. (1) can be approximated using a size-independent GR inferred from the measured aerosol size distributions (e.g., Kulmala et al., 2012). Note that the approximation of the size independence is only valid for a limited size range, e.g., 10–50 nm, yet such a size range is usually sufficiently wide for analysis on the influence of transport during typical NPF events.
Based on Eq. (1) and the discussions above, the formula to estimate the influence of particle transport in practical applications can be simplified as
where the corresponding diameters of i and j (di and dj) are usually the lower and upper size limits of each particle size bin, respectively. The last term in Eq. (10) is referred to as the growth term in the following discussions; dN[i,j] ∕ dt and CoagSnk[i,j] can be estimated using the particle size distributions (PSDs) and GR is inferred from the time rate of change of the fitted peak diameter (see Fig. 3a). The contribution of transport to the apparent increase in particle diameter is neglected in this study. A negative growth term indicates that more particles grow into than out of the concerned size bin, [di, dj]. Although CoagSrc[i,j] is neglected in Eq. (10), the contribution of the coagulation source may be partially accounted for because the observed particle growth is the synergistic result of condensation and coagulation (Stolzenburg et al., 2005).
The estimated transport term usually needs to be properly smoothed to reduce the impact of the uncertainties in the estimated dN[i,j] ∕ dt, CoagSnk[i,j], and the growth term. Using a wide size range of the concerned size bin ([di, dj]) can help to reduce measurement uncertainties. Alternatively, the transport term can be integrated with respect to time. The temporal evolution of the particle number concentration (dN[i,j] ∕ dt) and the other terms in Eq. (10) can be converted into the temporal evolution of the aerosol size distribution function and subsequently integrated from midnight. For instance, the transformations applied to the dN[i,j] ∕ dt term are shown in Eq. (11):
where dm is the mean diameter of di and dj. In this study, di and dj are the limits of particle diameter for the same size bin. The term is the difference between the size distribution function (dN ∕ ddp at dm) at time t and at midnight. The transport term, CoagSnk, and the growth term in Eq. (10) are named as cumulative terms correspondingly (e.g., cumulative transport term) after the transformations illustrated in Eq. (11), characterizing the cumulative contributions to the observed aerosol size distributions since midnight. A positive cumulative growth term indicates net particle growth out of the concerned size bin, [di, dj], while the cumulative CoagSnk is always nonnegative. In addition to reducing the impact of the fluctuations in the observed aerosol size distributions due to measurement uncertainties, these transformations facilitate the comparison among different size bins. In this study, we use a single measured size bin to analyze the contribution of transport to minimize the systematic error caused by the assumption of a size-independent GR. The representativeness of an analyzed size bin is tested by comparing it to its adjacent size bins, as in the example shown in Fig. S1 the Supplement.
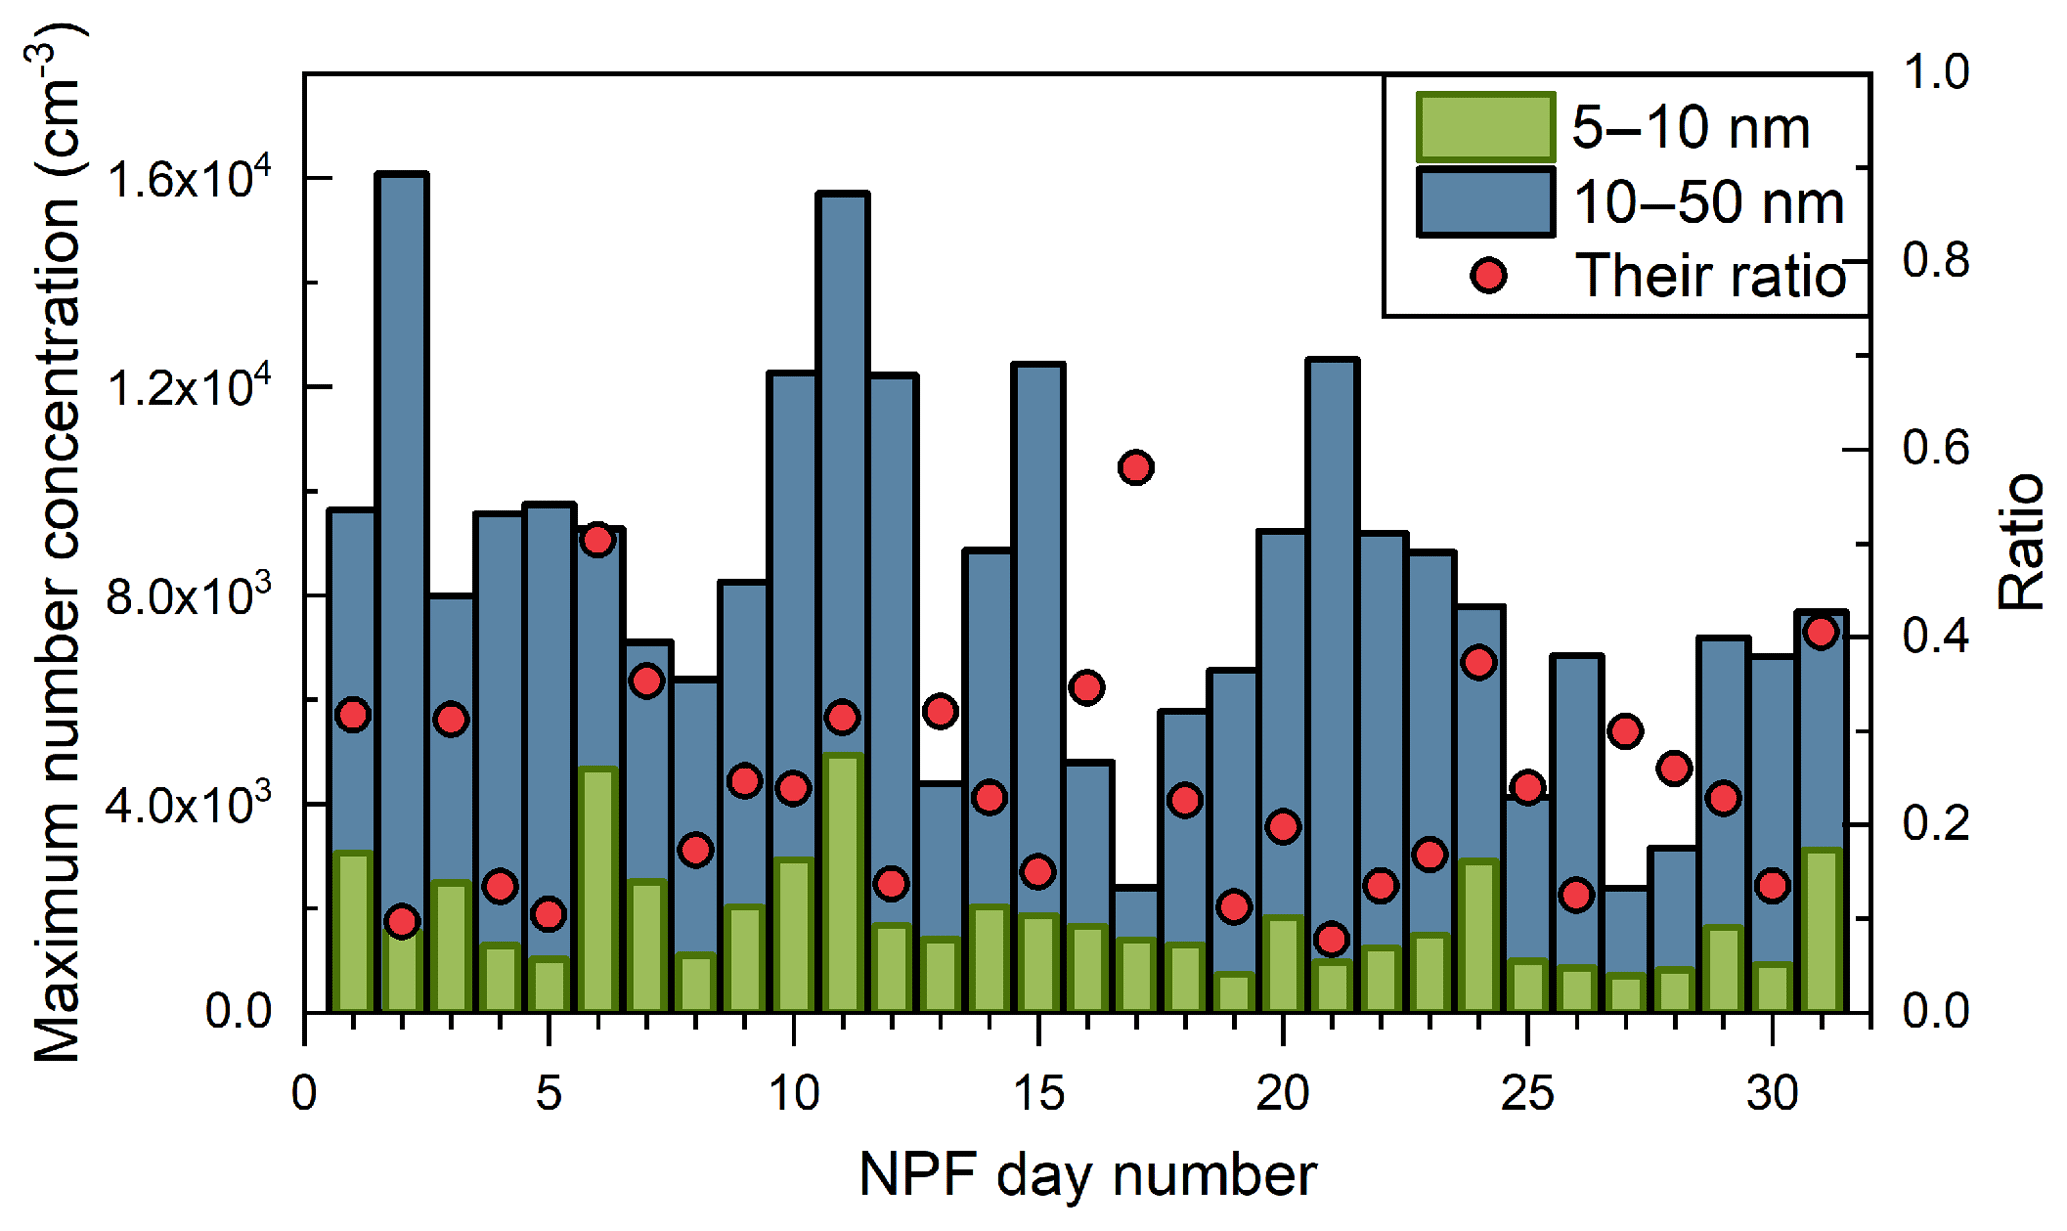
Figure 2The daily maximum number concentrations of 5–10 nm particles and 10–50 nm particles during the new particle formation period at the Lulang River valley. Note that the exact time corresponding to the two maximum values on each NPF day was not necessarily the same.
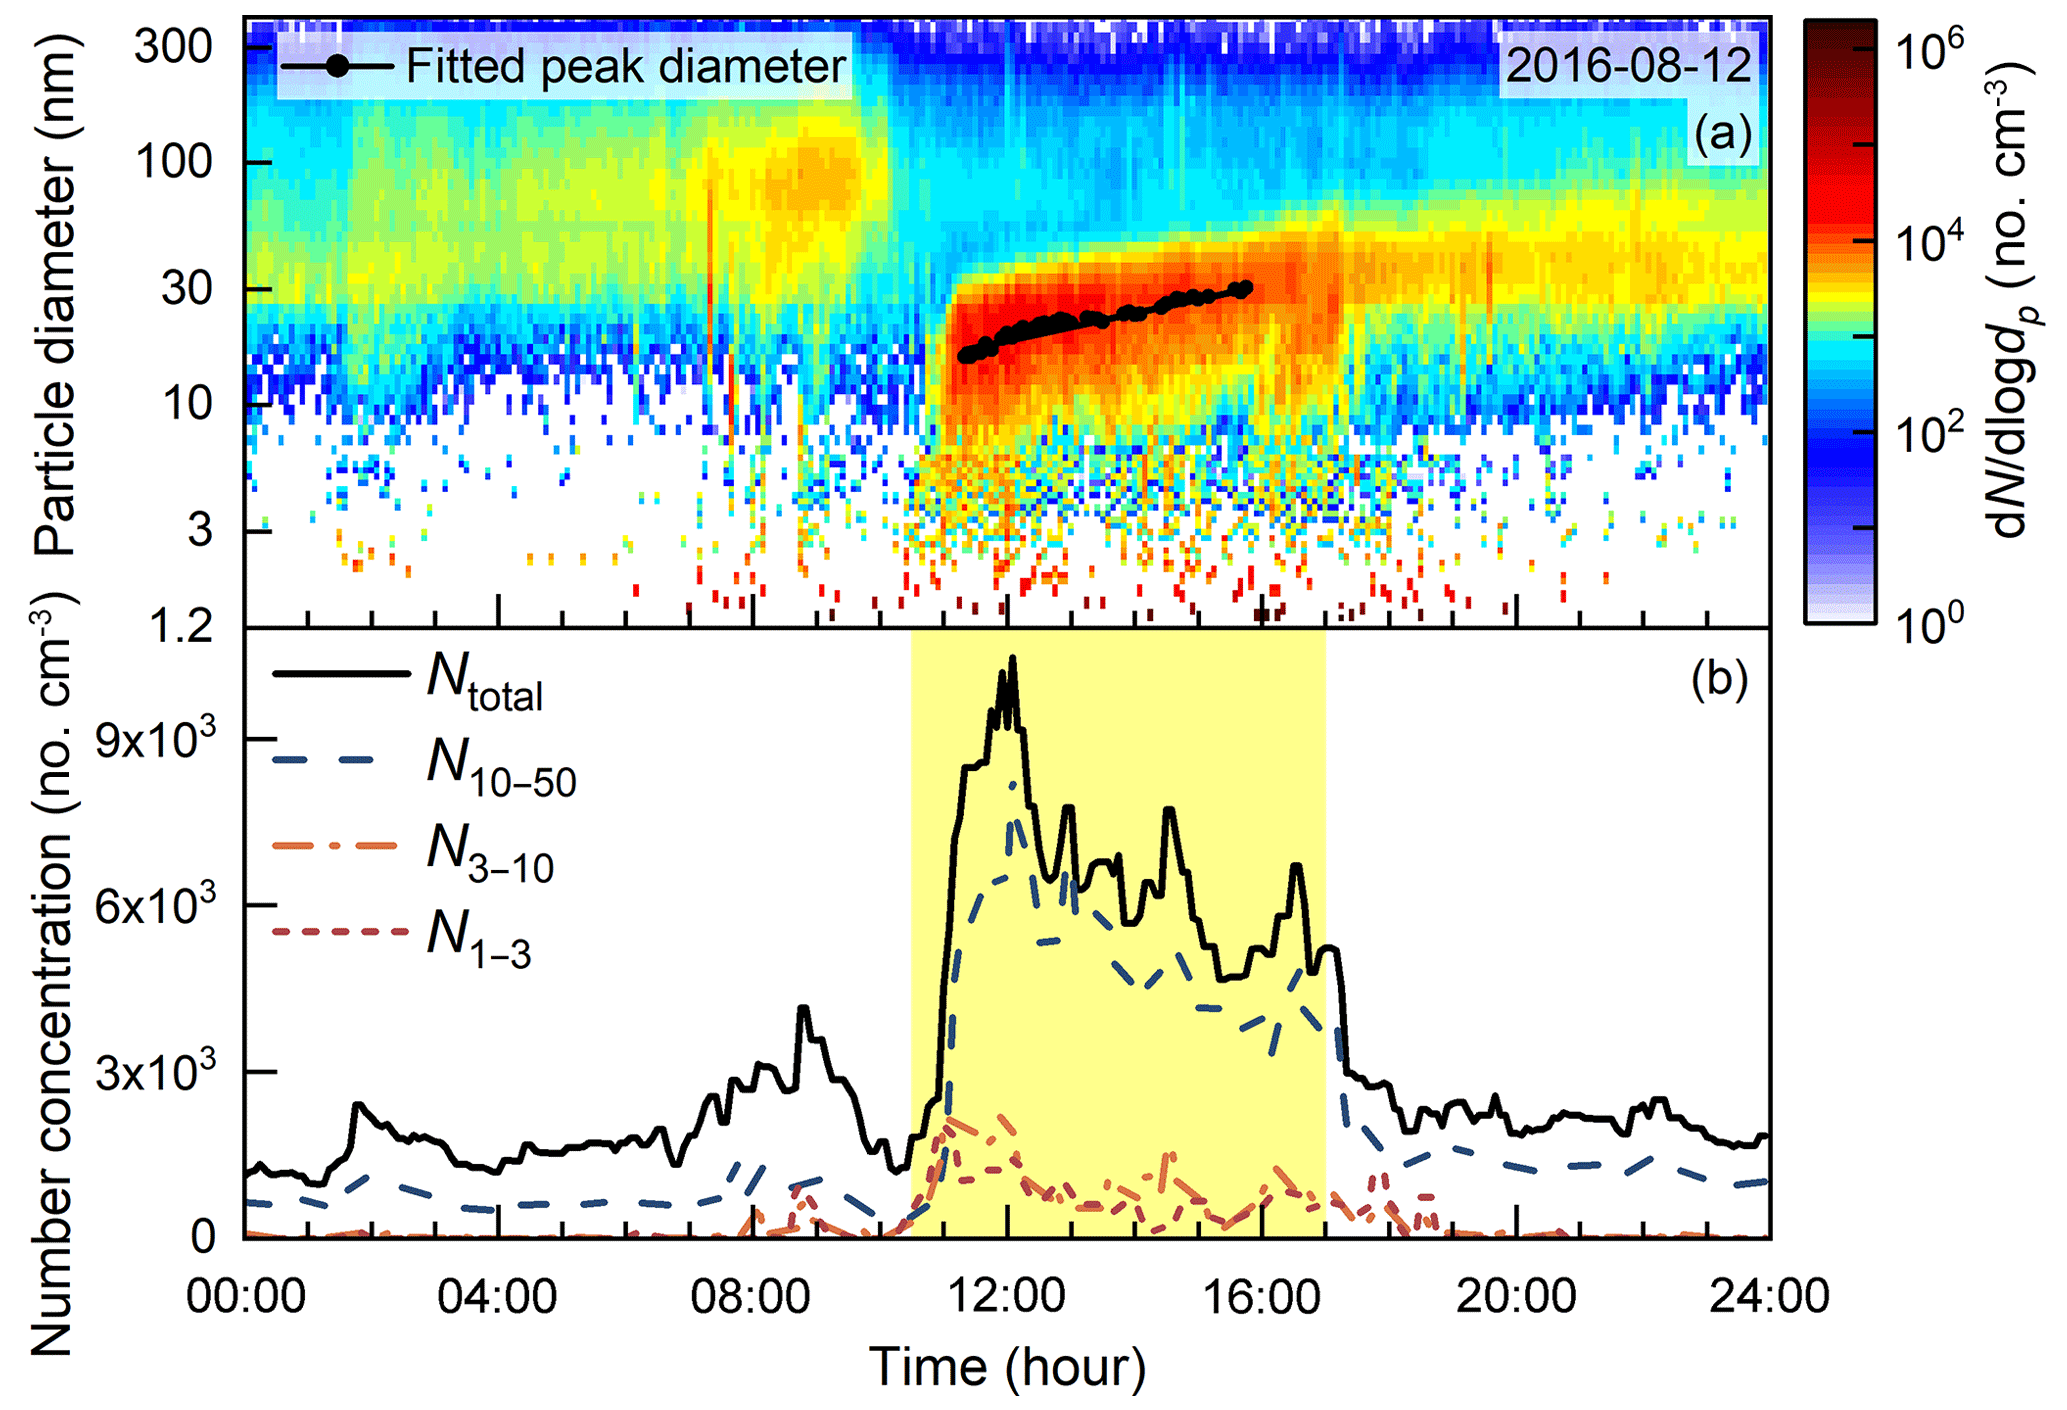
Figure 3The temporal evolution of the aerosol size distribution observed at the Lulang River valley on 12 Aug 2016. (a) The contour plot of aerosol size distributions. The black dots with the solid line are the peak diameters of the fitted lognormal distributions. The growth rate of the new particles was determined as the average slope of the fitted peak diameter over time. (b) The time series of the number concentration of 2 nm–10 µm (Ntotal), 10–50, 3–10, and 1–3 nm (reported by the PSM) particles. The period of time governed by the valley breeze is shaded with light yellow (see Fig. 4).
For the particles in the concerned size range, [di, dj], the assumptions (indicated by 1–4) and approximations (indicated by 5–6) made in Eq. (10) are listed as follows:
-
The influences of primary emission, particle evaporation, and other losses except for coagulation loss are negligible.
-
Condensation of gaseous vapors is the reason for the observed particle growth.
-
The condensational growth rates for different particle sizes in the concerned size range are the same.
-
The mass accommodation coefficient is assumed to be known (1.0 in this study).
-
Particle formation due to coagulation (CoagSrc[i,j]) is negligible compared to particle loss due to coagulation scavenging (CoagSnk[i,j]) and condensational growth (characterized using the growth term).
-
A representative particle diameter can be used when estimating the coagulation coefficients (see Eq. 7).
One should check the reliability of these assumptions before using Eq. (10) in case of the influence of other potential particle sources or sinks. It should be clarified that the transport term, TR[i,j], is simply a mathematically defined parameter using the balance method rather than being directly derived from first principles. Equation (10) does not guarantee that the estimated transport term is the result of transport. In fact, the transport term indicates all the neglected physical processes and the errors of other estimated terms in Eq. (1). Thus, additional information such as meteorological data should be used to infer the source of the transport term. For instance, when the changing height of the boundary layer is the major reason for the change in particle number concentration (although the timescale of this change is much larger than the typical timescale of the variations in aerosol size distributions during NPF events), the estimated transport term mainly characterizes the effect of dilution rather than convectional transport. The approximations above (indicated by 1–4) can also be violated in some circumstances. In this case, Eq. (10) can be readily updated using Eqs. (2) and (3) and the contribution of coagulation to the apparent grow rate can be corrected using the method in Stolzenburg et al. (2005). However, the discussion in Sect. 4.3 will reveal that the estimated transport term may be sensitive to the uncertainties if the approximations are violated due to the uncertainties in the estimated CoagSnk[i,j].
The accuracy of the estimated transport term is affected by the uncertainty of the estimated growth rate. Equation (10) is usually not valid for analyzing sub-5 nm particles (where 5 nm is only an approximate value rather than a critical threshold) because the condensational growth rate may be strongly size-dependent in this range (Kuang et al., 2012; Kulmala et al., 2013; Pichelstorfer et al., 2018). For particles larger than ∼200 nm, liquid-phase reactions are possibly an important mechanism for particle growth (e.g., McMurry and Wilson, 1983; Moch et al., 2018; Song et al., 2018), indicating significant errors in assuming a size-independent growth-rate in this size range. Even in the recommended size range, 10–50 nm, particle growth rate may sometimes be size-dependent due to the uptake of semi-volatile vapors (Pichelstorfer et al., 2018). Accordingly, we recommend using a narrow size range for estimating the transport term to minimize the potential systematic error caused by the size-dependent growth rate. The change in particle diameter due to transport may sometimes contribute significantly to the estimated growth rate. For instance, a diameter shift in particle diameter due to a sudden shift in wind direction may be mistaken as condensational growth if using a time-resolved growth rate. It is usually difficult to decouple the particle diameter shift due to transport and condensational growth rate because the contribution of transport is usually assumed negligible when estimating the growth rate. Accordingly, we recommend determining the growth rate by only fitting particle peak diameter over a time range when the wind speed and direction are relatively stable. Although this fitting method does not decouple the influence of transport, it may help to reduce uncertainties in the estimated growth rate. In addition, if there is a significant error in the method of estimating the growth rate (Li and McMurry, 2018), the error will also propagate into the estimated transport term.
The proposed method was used to analyze aerosol size distributions observed at three sites: the Southeast Tibet site, the Fukue Island site, and the urban Beijing site. The observation in Southeast Tibet was conducted at the Southeast Tibet Observation and Research Station for the Alpine Environment (94∘44′ E, 29∘46′ N; elevation: 3326 m; Guo et al., 2016). The station is located at Lulang River valley, Linzhi, China. The Lulang River valley is the intersection of the Lulang River and the Niyang River and is surrounded by mountains such as Gyala Peri (∼23 km away, elevation: 7294 m) and Namcha Barwa (∼35 km away, elevation: 7782 m). There are ∼300 people living in the nearest village located ∼1.5 km away. The whole town of Lulang has ∼1100 inhabitants, and the town center is situated ∼7 km away. In front of the station is the China National Highway 318, located ∼50 m away from the sampling inlet, which was a potential anthropogenic pollution source. However, no significant influence of traffic emission was found from the measured CO concentration, the chemical composition of PM1, and the aerosol size distributions.
The field campaign was conducted from 15 July to 3 September 2016, which was during the monsoon season in the Lulang River valley. The precipitation was frequent in July and gradually descended from August. The influence of pollutant long-range transport is the lowest during this season among the whole year (Zhao et al., 2013). The aerosol size distributions on a total of 38 days were recorded during the campaign, while the rest of the data were missing because of the instability of the electricity supply or the malfunction of the local hydropower station. A particle size distribution (PSD) system including two scanning mobility particle spectrometers (SMPSs) covering different size range and one aerodynamic particle sizer (APS, TSI 3321) was used to measure particles ranging from 3 nm to 10 µm (Liu et al., 2016). The sub-3 nm aerosol size distributions were measured using a prototype diethylene glycol SMPS (DEG-SMPS, Jiang et al., 2011; Cai et al., 2017a) and a commercialized particle size magnifier (PSM, Airmodus A11). The laminar condensation particle counters serving as the detectors of the SMPSs probably underestimated the particle concentrations around the 50 % cutoff size due to the low ambient pressure of 69 kPa (Takegawa et al., 2016). Thus, the data for 2–6 nm particles of the incorporated aerosol size distributions were from the DEG-SMPS, and the sub-2 nm data measured by the DEG-SMPS did not participate in any calculation. The PSM might also be affected by the inlet pressure problem (Kangasluoma et al., 2016). The meteorological data were obtained from the local weather station (Guo et al., 2016), including wind speed, wind direction, temperature, relative humidity, and the atmospheric pressure.
The Fukue Island supersite (32∘48′ N, 128∘42′ E) is located on Fukue Island, Nagasaki, Japan. The site is usually on the pathway of the long-range transport of particles and gaseous precursors in the East Asian region during winter and spring. The aerosol size distributions in the range from 3 to 710 nm were monitored using two SMPSs. A DEG-SMPS (TSI 3938E77) was deployed to measure sub-3 nm particles since 2016. Local wind speed and direction were measured. The backward trajectories were obtained from the online HYSPLIT server of the National Oceanic and Atmospheric Administration (NOAA). Details on the Fukue Island site were reported in previous studies (Takami et al., 2005; Seto et al., 2013; Chandra et al., 2016).
The observation site in urban Beijing is located on the campus of Tsinghua University (40∘00′ N, 116∘19′ E; He et al., 2001; Cai and Jiang, 2017). The field campaign to study NPF was conducted in March and April 2016. The aerosol size distributions ranging from ∼1 nm to 10 µm were measured using the PSD system and the prototype DEG-SMPS. The meteorological data were obtained from a weather station (Davis 6250) on the site. More details on the campaign can be found in Cai and Jiang (2017) and Cai et al. (2017b).
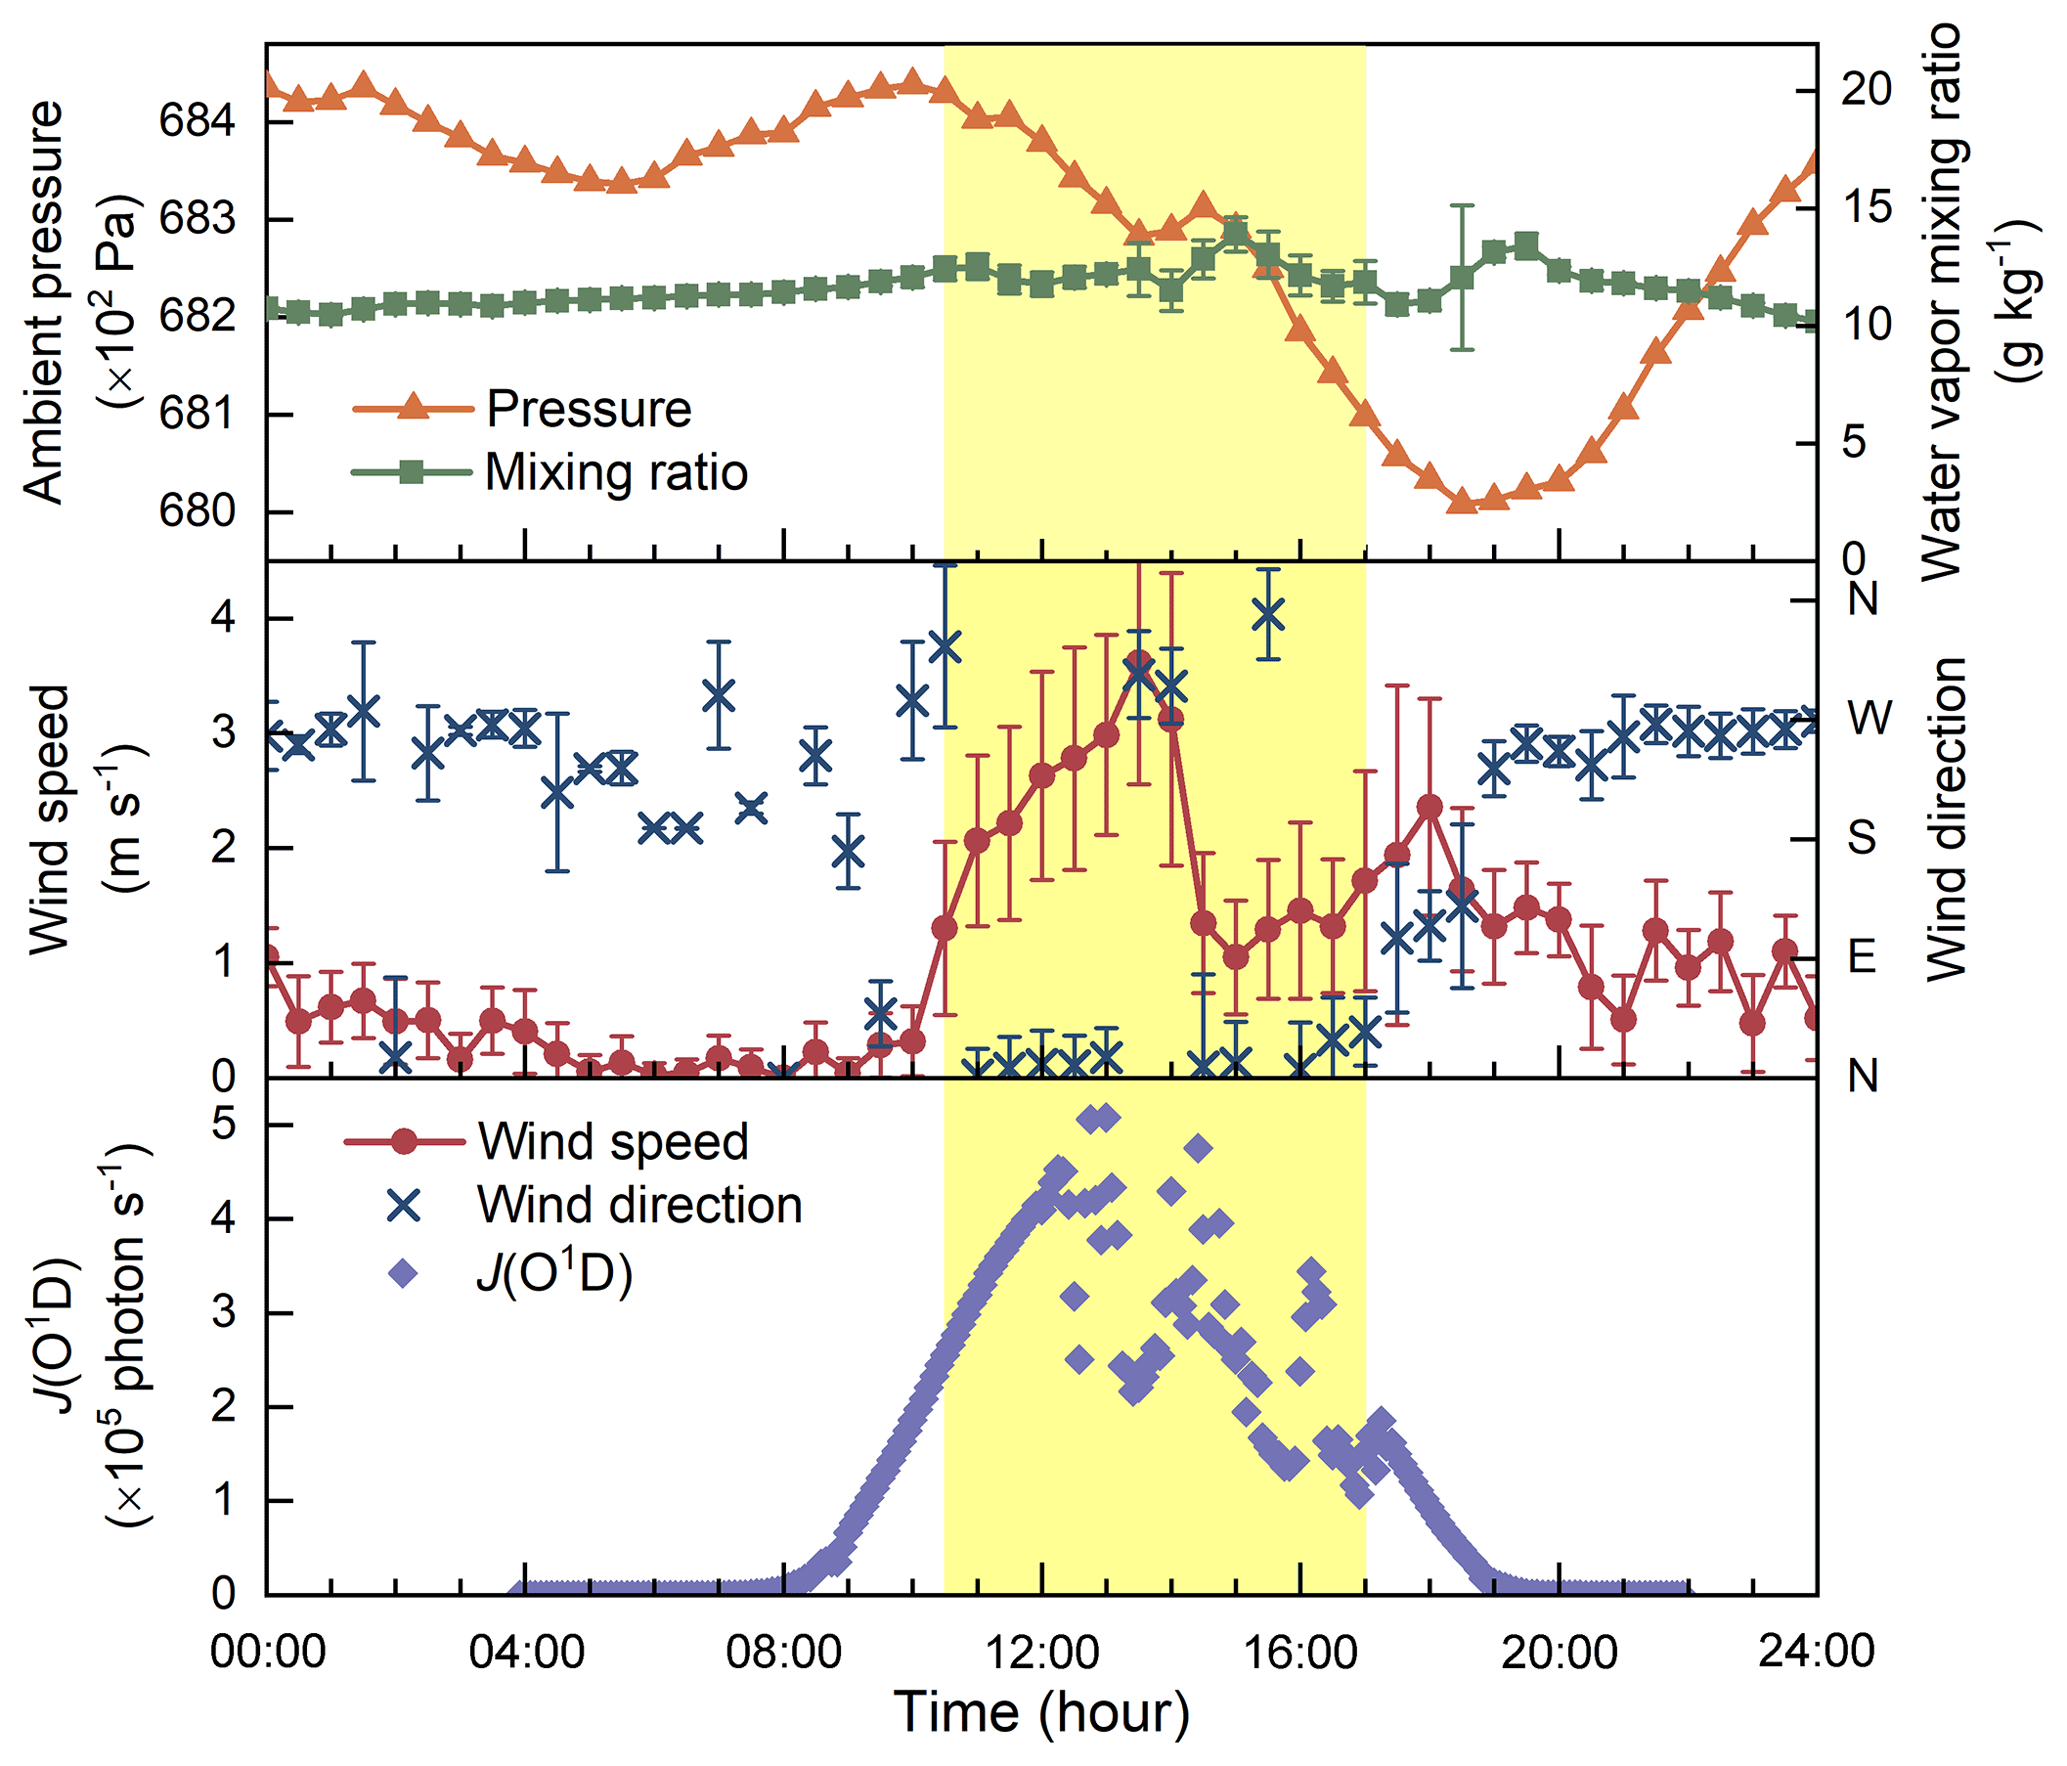
Figure 4The time series of atmospheric pressure, water vapor mixing ratio, wind speed, wind direction, and the photolysis frequency of ozone, J(O1D), on 12 August 2016 at the Lulang River valley. The period of time when wind came from north (indicating the valley breeze) is shaded with light yellow. The error bars are the standard deviations.
4.1 Lulang River valley
Frequent NPF events were observed in the Lulang River valley; however, most of the new particles were not formed locally at the observation site. As the newly formed particles grow into larger sizes, the particle number concentration decreases due to the coagulation loss. Thus, the maximum number concentration of smaller new particles during an NPF event is theoretically larger than the concentration of larger new particles. However, the daily maximum number concentration of 5–10 nm particles was always lower than the concentration of 10–50 nm particles, and their ratio was mostly smaller than 40 % on the observed NPF days in the Lulang River valley (Fig. 2). This low concentration of 5–10 nm particles was not sufficient to explain the origin of the observed 10–50 nm particles if assuming a regional NPF event with negligible influence of transport. For instance, on 12 August, a typical NPF day, the number concentration of sub-50 nm particles increased sharply at around 10:30 (Fig. 3). These new particles grew at a relatively constant growth rate of 2.6 nm h−1 for ∼6 h, while their number concentration decreased steadily with fluctuations during the same period (after the sharp increase to the peak value). However, the increase in particle number concentration at the beginning of the observed NPF event was mainly contributed by 10–50 nm particles, whereas a correspondingly high number concentration of 3–10 nm particles or sub-3 nm particles was not observed. To confirm that the observed low concentration of sub-3 nm particles was not caused by the instrumental detection efficiency, the DEG-SMPS was used to classify and detect particles with a fixed diameter of 2 nm for the whole NPF day on 19 August. No particles were detected at all over the whole day expect for a total of 11 counts, possibly due to the background noise of the instrument. Although there were uncertainties in the detection efficiency of the DEG-SMPS due to the low ambient pressure (69 kPa), the classified particle diameter was accurate because the pressure effect was accounted for. The low sub-10 nm particle concentration indicates that the majority of the observed particles were formed away from the observation site and the observed aerosol size distributions were non-negligibly affected by transport.
Mountain and valley breezes dominate the local air transport in the Lulang River valley. The valley ground is heated after sunrise and the warm air climbs up along the slopes, leading to a gradual decline in the ambient pressure on the ground level (as shown in Fig. 4). The air at higher altitude transports downward vertically during daytime due to the pressure difference. The mountain breeze blows into the valley during nighttime. The circulation of the mountain and valley breezes is a regular pattern in the Lulang River valley throughout a year (Wang et al., 2010). Note that the local transport due to the mountain and valley breezes is not necessarily accompanied by the movement of air mass in a large spatial scale. As shown in Fig. 4, the water vapor mixing ratio, i.e., the amount of water vapor per unit of dry air (in g kg−1), was relatively constant on 12 August, indicating that the air circulation occurred inside the same air mass.
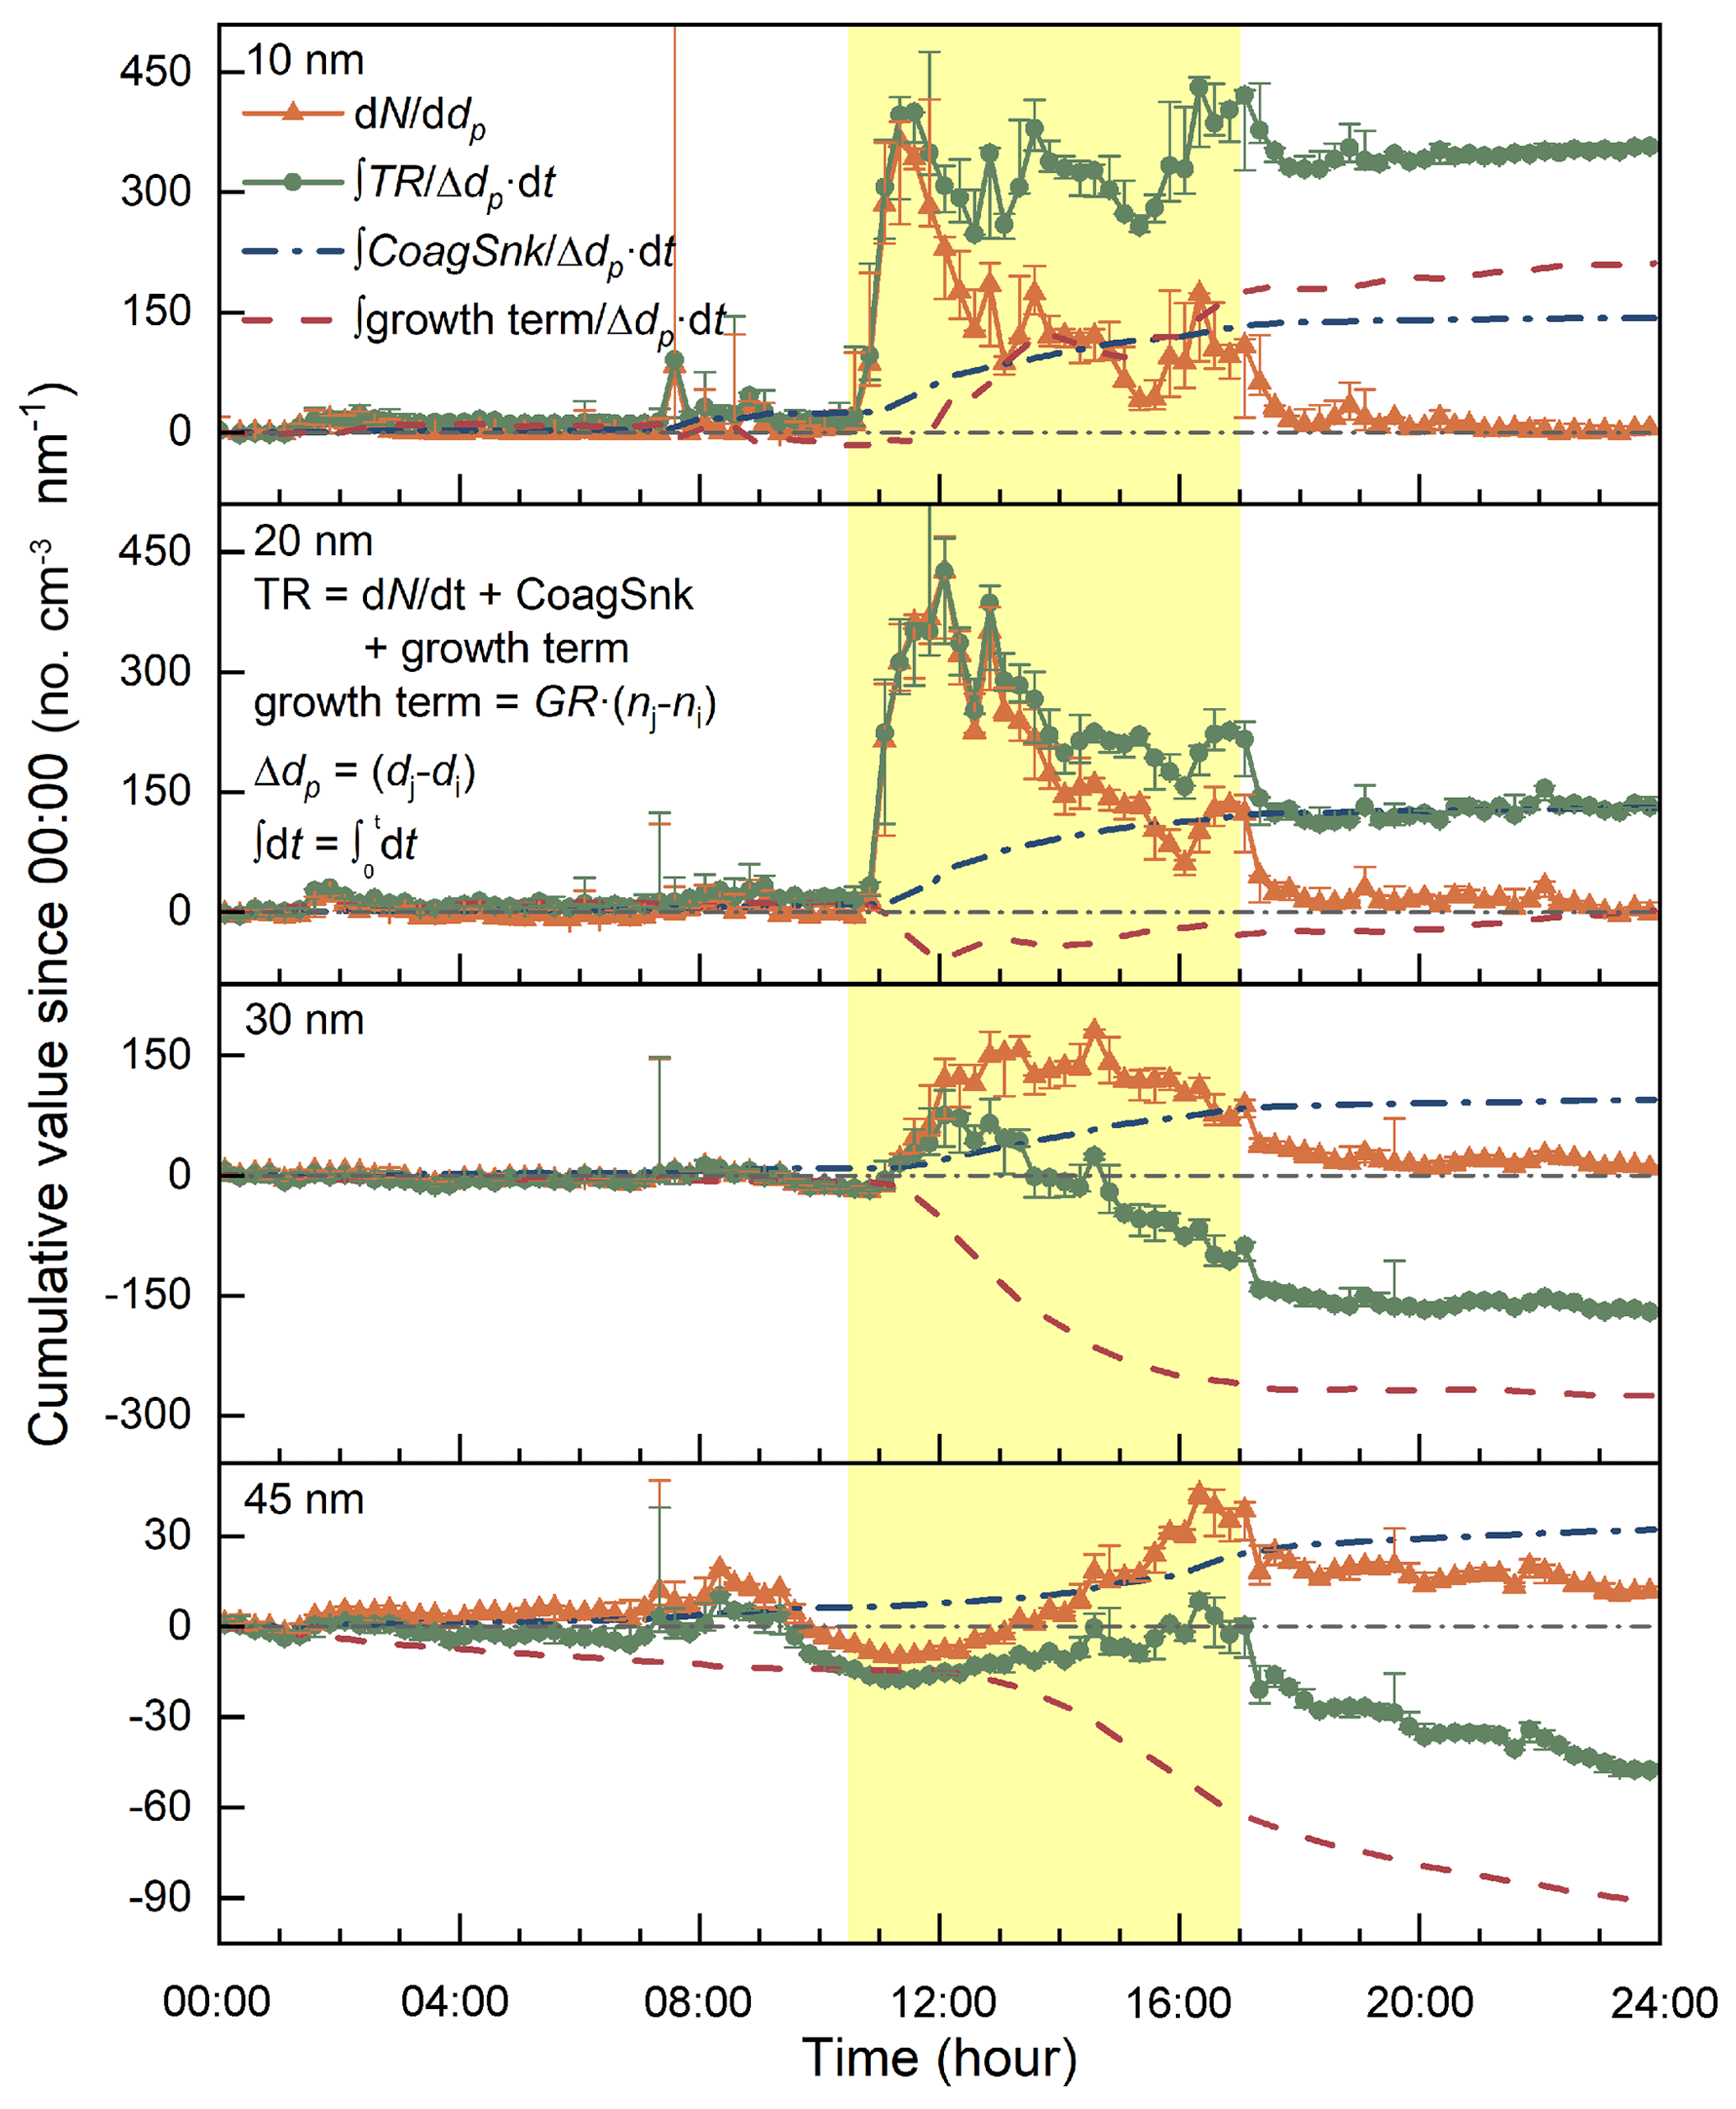
Figure 5The time series of dN ∕ ddp (i.e., the cumulative dN ∕ dt), the cumulative transport term, the cumulative CoagSnk, and the cumulative growth term in Eq. (11) at four different diameters on 12 August 2016, at the Lulang River valley. Note that dN ∕ ddp represented by orange symbols and lines was zero at 00:00 according to Eq. (11). The dN / ddp and TR were averaged every 15 min, and the error bars indicate the maximum and minimum values in the corresponding time bins. The period of time when wind blew from north (indicating the valley breeze) is shaded with light yellow.
The cumulative transport terms at different particle diameters are correlated with the shift between the mountain and valley breezes. The valley breeze started around 10:30 on 12 August, indicated by the changes in wind speed and direction (Fig. 4). The contribution of transport to the observed aerosol size distributions at different diameters on 12 August was analyzed using the proposed method (Eqs. 10 and 11). As shown in Fig. 5, the size distribution functions (dN ∕ ddp) for 10 and 20 nm particles increased sharply at almost the same time, and the cumulative transport term was the predominant cause. The contribution of transport to the size distribution function for 10 nm particles remained at a relatively constant level, while the size distribution function decreased gradually because of coagulation scavenging and particle growth into larger sizes. The relatively large fluctuations in the observed size distribution function and the cumulative transport term were possibly due to atmospheric turbulence. The size distribution function for 20 nm particles showed a similar trend except for a negative contribution of transport between 12:00 and 14:00. The relatively constant cumulative transport terms of 10 and 20 nm particles between 12:00 and 14:00 indicate a relatively small contribution of transport to the observed shift in particle diameter and hence the estimated growth rate. For 30 and 40 nm particles, transport did not lead to a sharp increase in their size distribution functions when the local wind shifted from mountain breeze to valley breeze (around 10:30). The increases in the size distribution functions for 30 and 40 nm particles were mainly due to condensational growth, indicated by the comparatively large cumulative growth terms. At around 17:00, the wind direction changed back from north to west, indicating that the mountain breeze started to take over the control. The sudden decreases in the size distribution function and the cumulative transport term were thus observed at all of the four analyzed diameters. After 19:00, the mountain breeze dominated the wind field in the valley and air stability increased (as indicated by the standard deviation of the measured wind direction, wind direction, and water vapor mixing ratio); thus the cumulative transport terms stayed at relatively stable levels. There were no significant differences among the wind speed and direction measured at the four different heights from 1.5 and 18 m, indicating that turbulent mixing in the vertical direction was not a major reason for the cumulative transport term. In addition, no direct correlation was observed during the NPF events between the aerosol size distribution function and the radiation represented by the photolysis frequencies of ozone, J(O1D), indicating that radiation was not the direct cause of the rapid changes in the observed aerosol concentrations.
On all the NPF days observed in the Lulang valley during the campaign, the aforementioned characteristics were observed; i.e., (1) the number concentration of nanoparticles increased sharply around noon; however, most of these new particles were larger than 10 nm. (2) Continuous banana-shaped particle growth was observed. (3) The number concentration of grown new particles decreased suddenly in the late afternoon (around 17:00). During most NPF events, the changes in the aerosol size distribution function and the cumulative transport term were correlated with the changes of the local wind field. According to the analysis using the proposed population balance method, the particle transport governed by the mountain and valley breezes contributed significantly to the observed NPF events in the Lulang valley. We hypothesize that the new particles were formed elsewhere and brought to the site by the valley breeze. The measured sub-5 nm particle concentration was relatively low because the new particles had grown when they arrived at the observation site. The observed new particles were probably formed upstream of the valley breeze, either in the upper air or in the valley. More studies are needed to further evaluate this hypothesis.
4.2 Fukue Island
The contribution of transport to the observed aerosol size distributions at Fukue Island was correlated with the changes of the air mass origin during typical NPF events. The observed NPF events at Fukue Island were classified into two types (Chandra et al., 2016) according to whether sub-10 nm particles were observed (type A) or not (type B). On 16 March 2015, the local wind speed and direction were relatively stable before 22:00. However, a typical type-B NPF event was observed, indicating that the new particles were formed elsewhere and subsequently transported to the observation site (Fig. 6). The cumulative transport term was estimated using Eqs. (10) and (11). The cumulative transport terms for 15 and 20 nm particles started to increase around 14:00, and the cumulative transport terms for 30 and 40 nm particles started to increase around 16:00. All the estimated cumulative transport terms were relatively stable after 19:00 (Fig. 7). No significant change was observed in the wind speed or wind direction during the NPF period, whereas the water vapor mixing ratio increased steadily before the NPF event, indicating that the transport occurred in a relatively large spatial scale during the type-B NPF event. According to the backward trajectories, the origins of the air masses observed at the Fukue Island site changed gradually from the Korean Peninsula to the Yellow Sea (Fig. S3) from 13:00 to 18:00. Thus, we infer that new particles was formed upstream of the air mass trajectories on the Yellow Sea but probably not in the Korean Peninsula for the analyzed type-B NPF event. It should be clarified that particle loss due to coagulation at Fukue Island was underestimated because the size distributions of particles larger than 710 nm were not measured. However, it is reasonable to assume that the underestimation was negligible because the CoagSnk for each size bin was mainly contributed by particles smaller than 500 nm (as shown in Fig. S2).
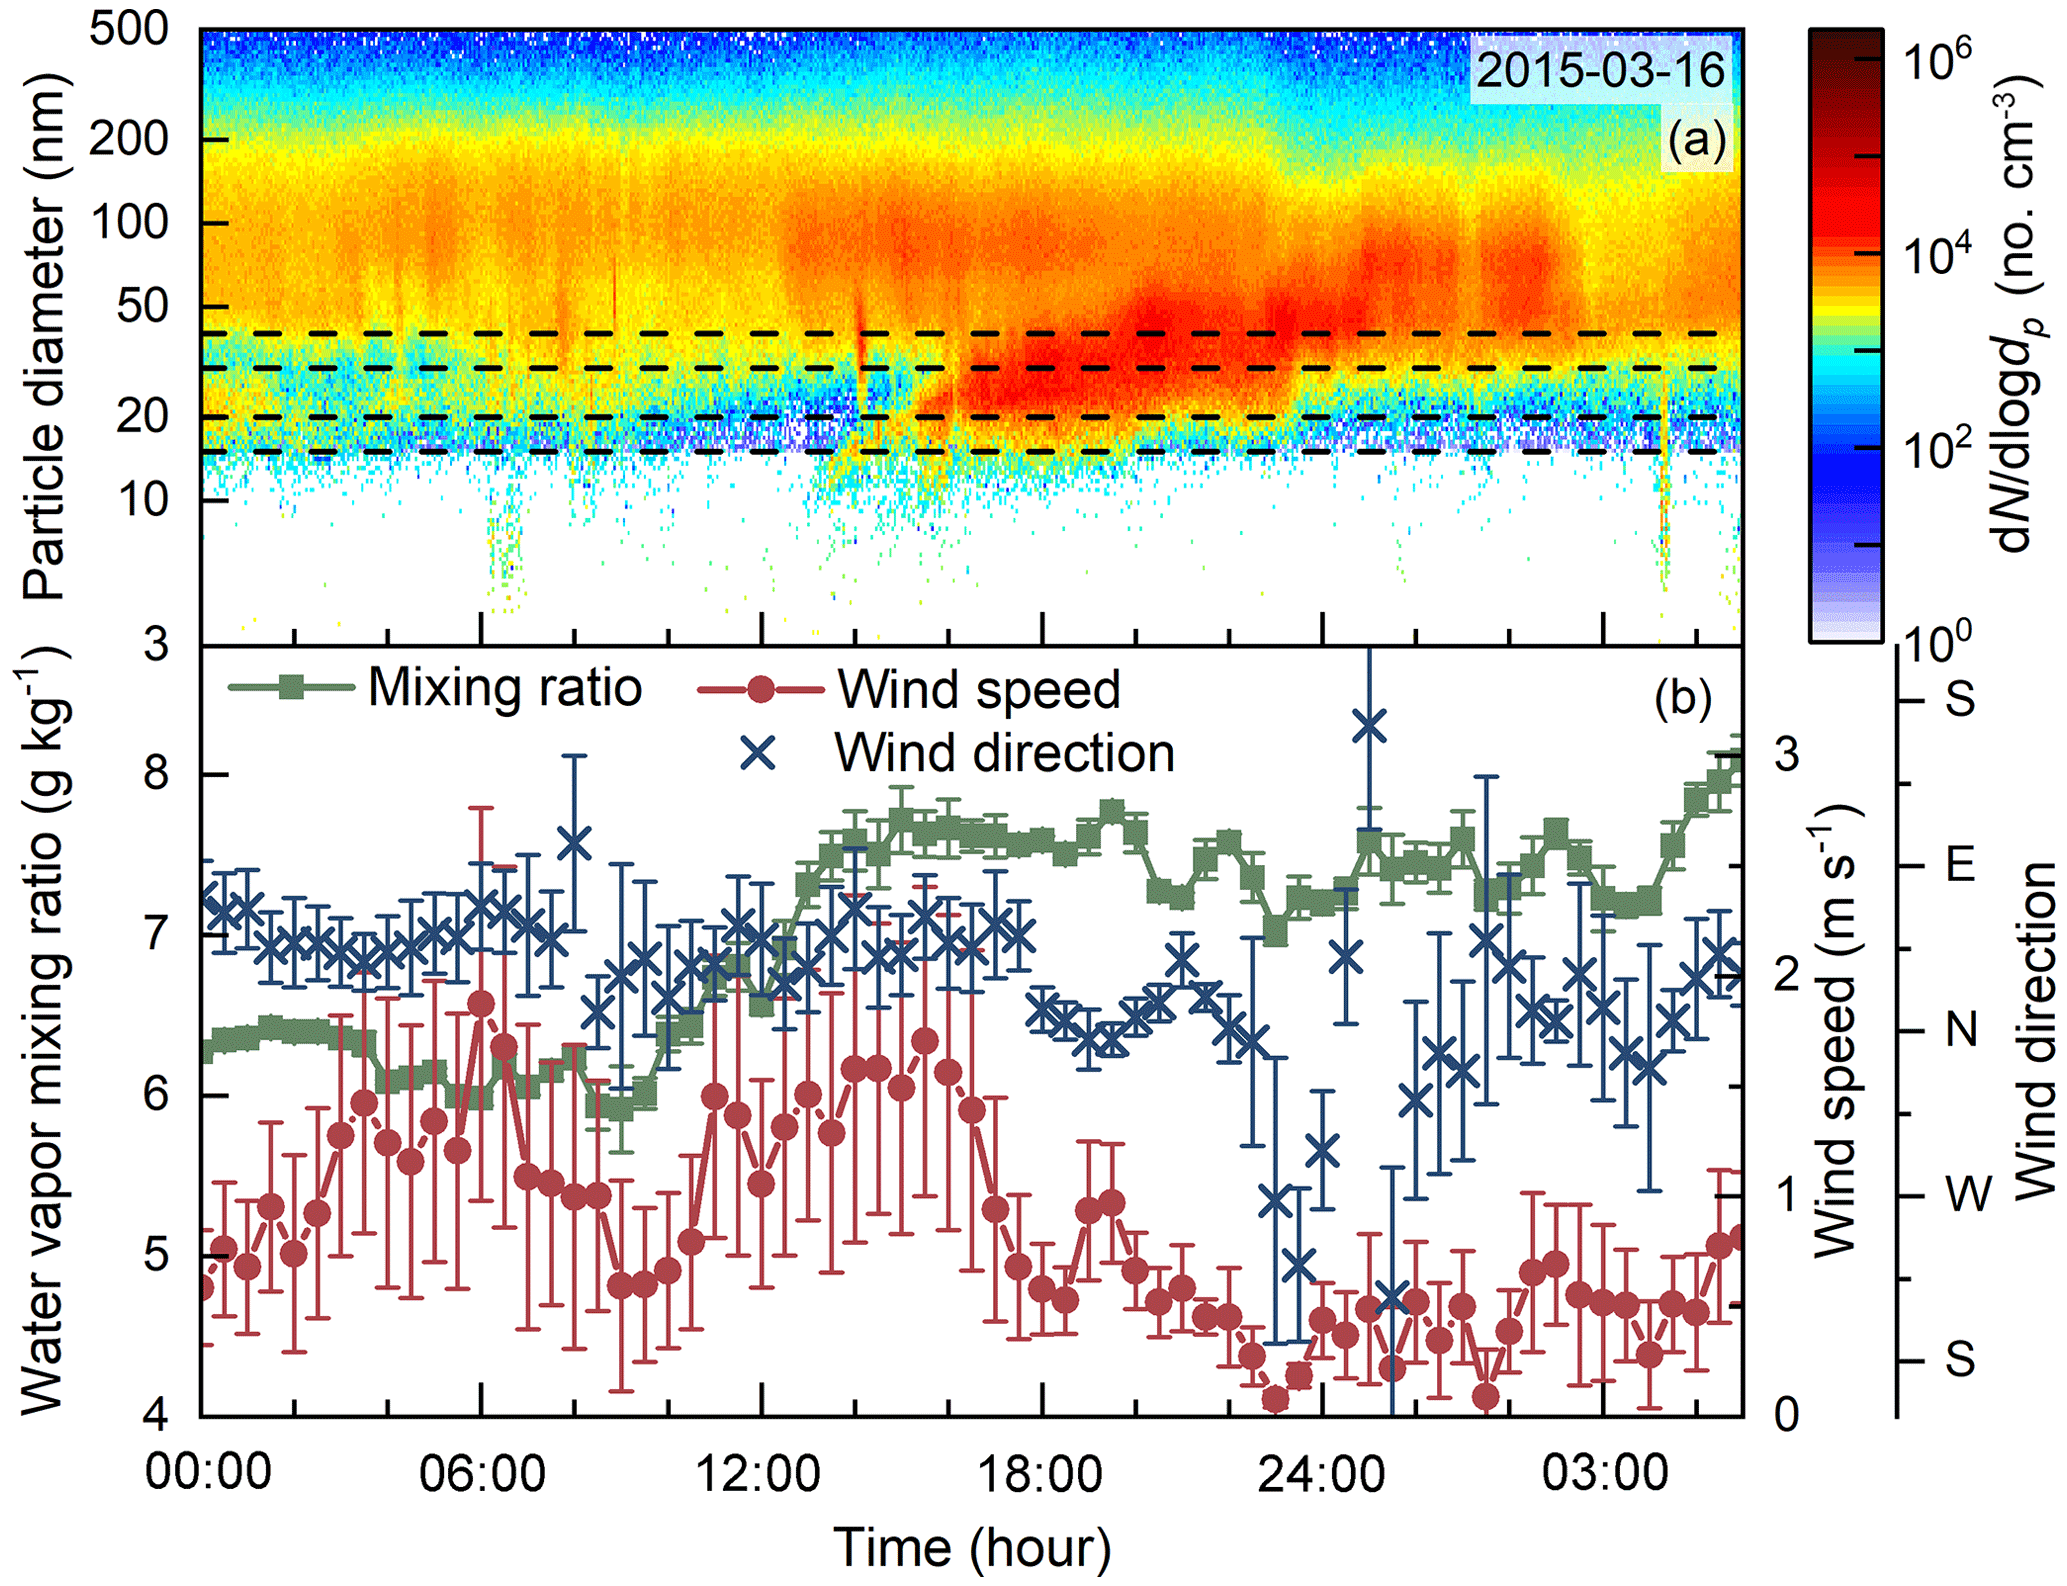
Figure 6(a) The contour plot of aerosol size distributions of a typical type-B new particle formation event observed on 16 March 2015, at the Fukue Island site. The dashed lines indicate the analyzed particle diameters. (b) The time series of wind speed, wind direction, and water vapor mixing ratio. The error bars are the standard deviations.
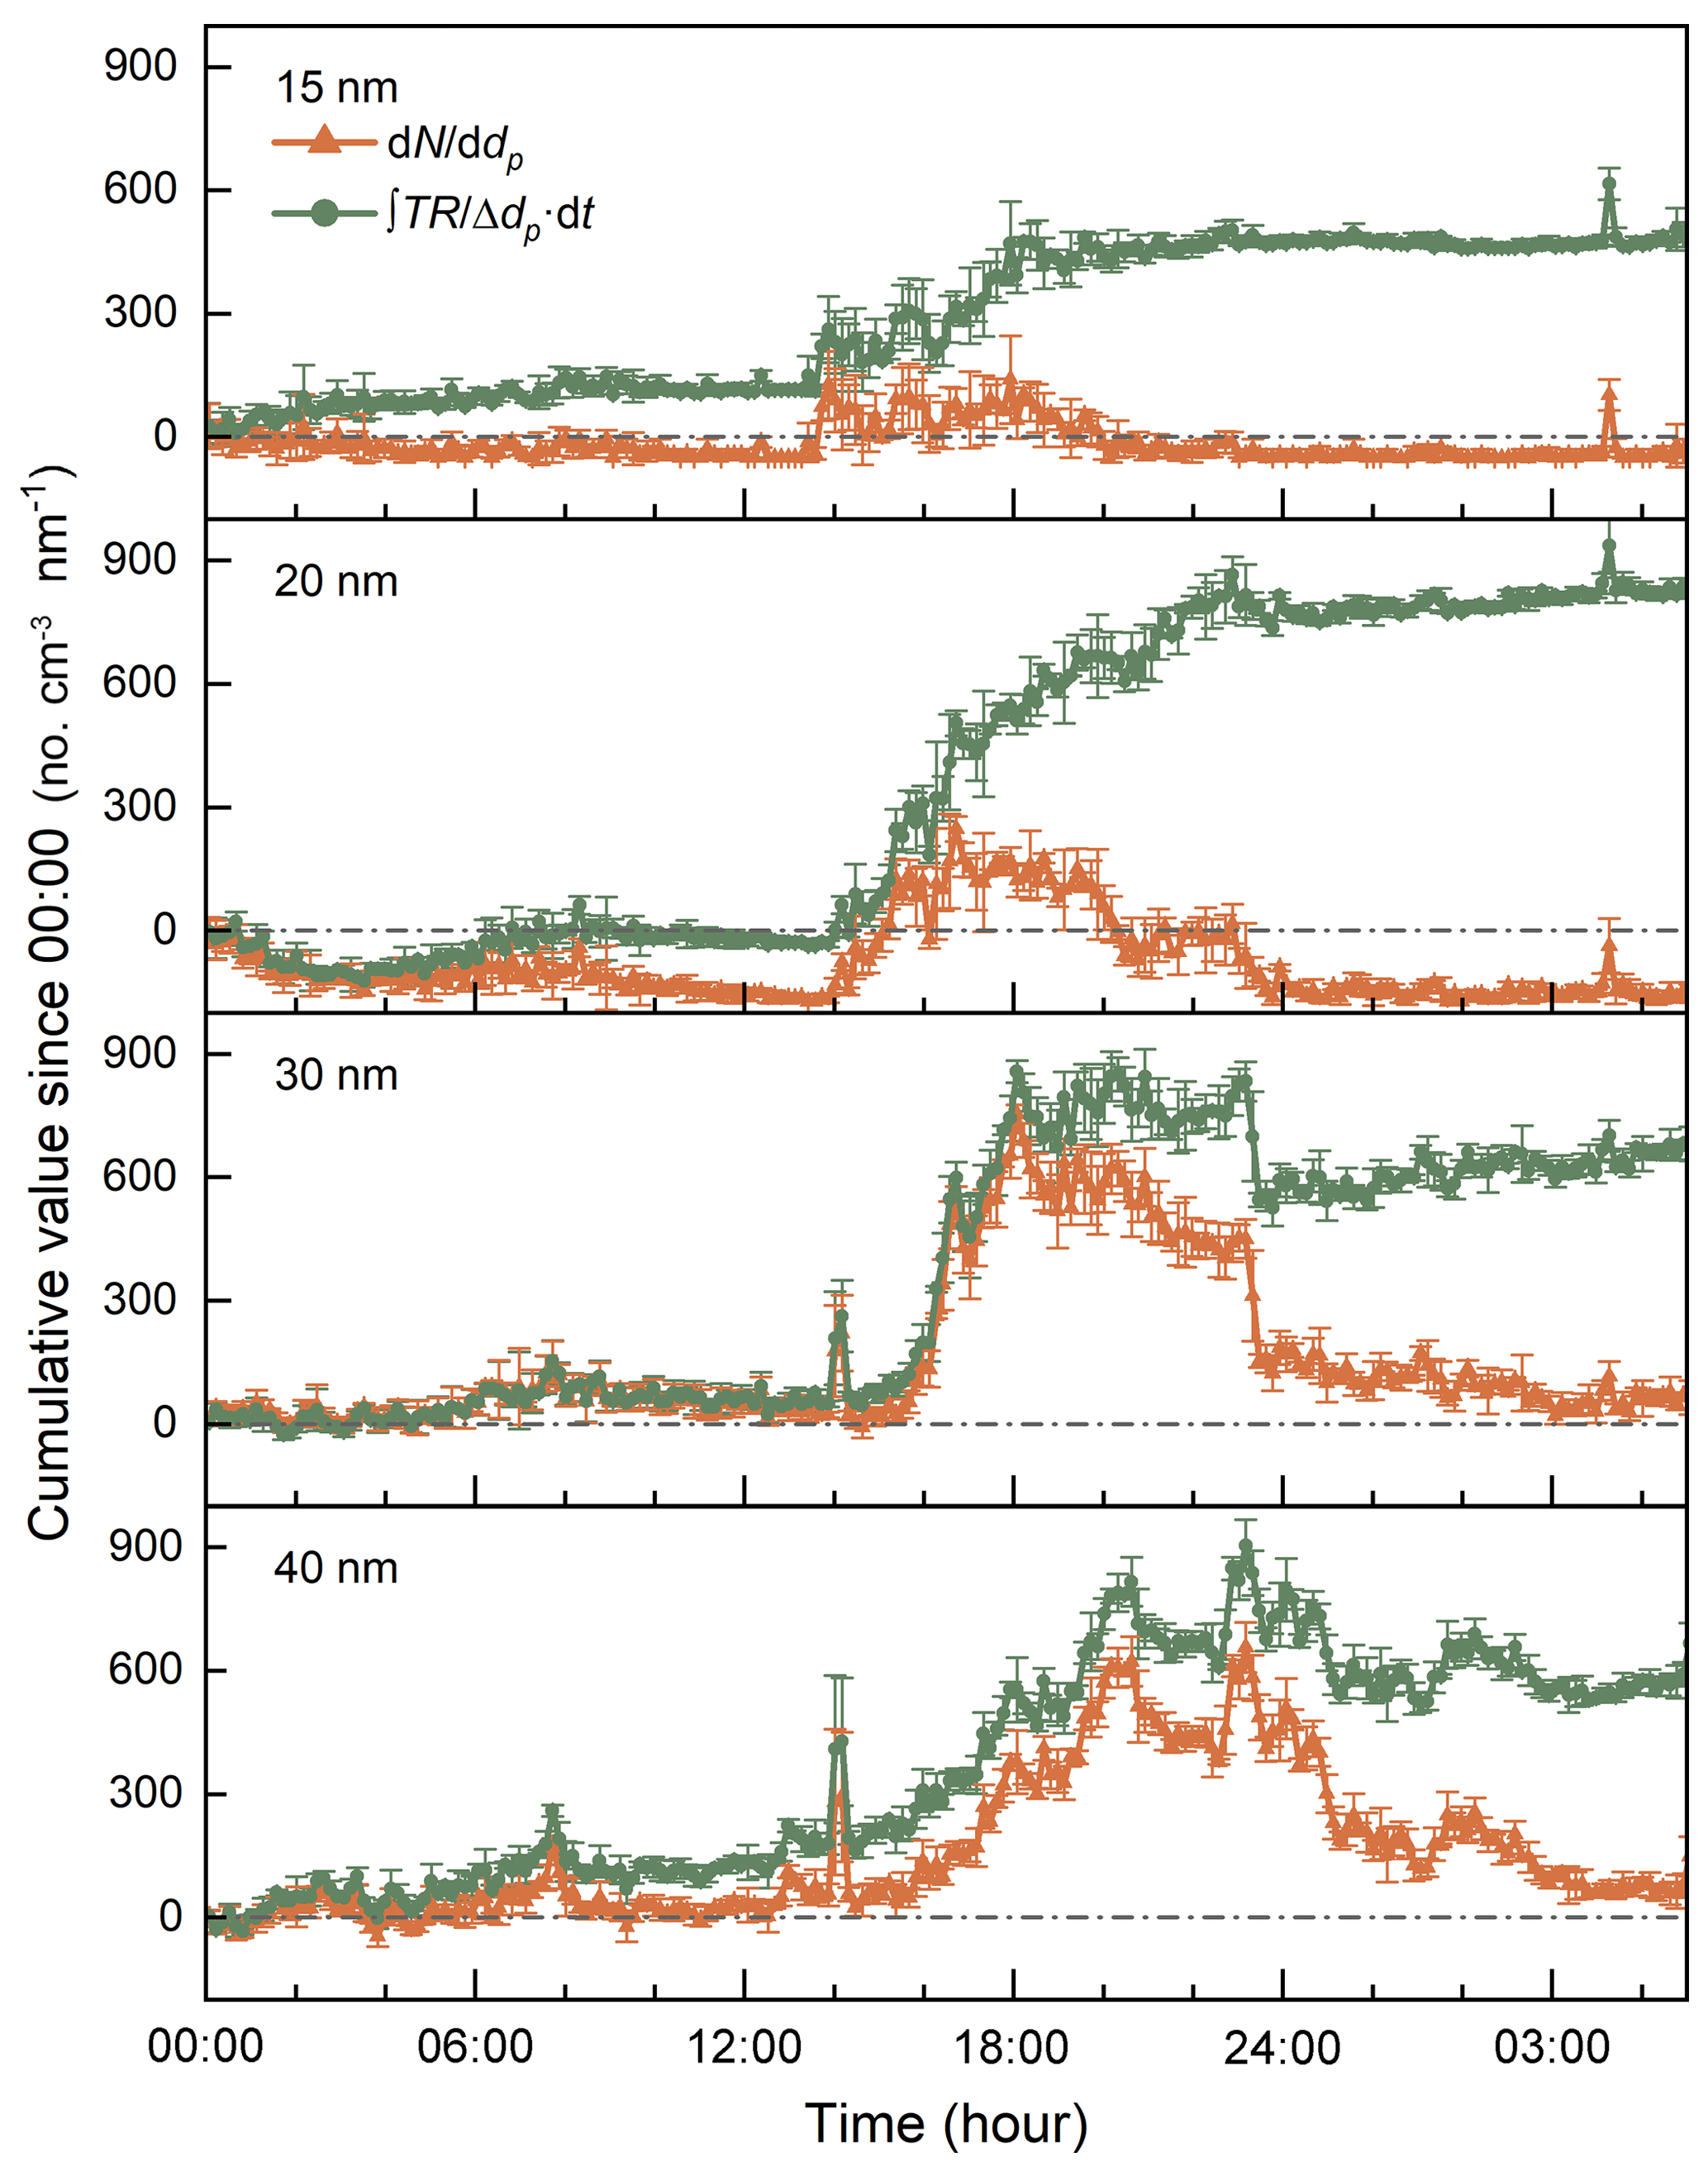
Figure 7The time series of dN ∕ ddp and the cumulative transport term on the 16–17 March 2015, at the Fukue Island. The dN / ddp and cumulative transport term were averaged every 9 min. The error bars indicate the maximum and minimum values in the corresponding time bins.
The change in the wind direction is another potential cause of the local particle transport at the Fukue Island site. During the type-A NPF event on 2 March 2016, the estimated transport terms of 10, 15, and 20 nm particles fluctuated between 11:00 and 15:00 (Fig. 8). No significant change was observed in the backward trajectory of the air mass during the event (Fig. S4). As shown in Fig. 8, there was a sharp valley in the transport term at approximately 12:00. At the same time, the wind direction started to change from east to the west. The wind direction at the observation site changed from north to southwest from 11:00 to 16:00, which is correlated with the change in the cumulative transport term. Accordingly, the estimated cumulative transport terms for the type-A NPF event mainly reflect the inhomogeneity of the air masses at the observation site rather than their movement.
4.3 Urban Beijing
The proposed method was used to analyze an intensive NPF event observed in urban Beijing on 23 March 2016. The minimum detected particle electrical mobility diameter was 1.53 nm during the event (Cai et al., 2017b). The wind direction at the observation site was north or northwest between 08:00 and 16:00, and the wind speed was relatively stable. There was no direct evidence to prove that this NPF event was a regional event, i.e., by comparing the particle size distributions observed at two different sites. However, the characteristics of the observed NPF event agree with the criterions of the regional NPF events (Kulmala et al., 2013), and the NPF events observed in urban Beijing were usually observed simultaneously at a background station 120 km away (Wang et al., 2013). As shown in Fig. 9, the estimated cumulative transport terms for 20 and 30 nm particles during the whole NPF day were negligible compared to the estimated cumulative CoagSnk and the cumulative growth terms. Different from the NPF events observed in clean atmospheric environments, the concentrations of the newly formed particles and background aerosols are comparatively high during typical NPF events in Beijing (Cai and Jiang, 2017). The CoagSnk and the growth term in the population balance formulas (e.g., Eqs. 1 and 10) are usually much larger than dN ∕ dt. The negligible contribution of transport to the observed aerosol size distributions on 23 March agreed well with the characteristics of an regional event (as shown in the contour plot of aerosol size distributions; see Fig. 9a). The CoagSrc was negligible compared to CoagSnk during this event, and the contribution of coagulation to particle growth was corrected (Stolzenburg et al., 2005).

Figure 8(a) The contour plot of aerosol size distributions of a typical type-A new particle formation event observed on 2 March 2016, at the Fukue Island site. The dashed lines indicate the analyzed particle diameters. (b) The time series of wind speed, wind direction, and water vapor mixing ratio. (c) The time series of the estimated cumulative transport terms for various sized particles.
When analyzing the intense NPF events in a relatively polluted atmospheric environment such as urban Beijing, however, the estimated contribution of transport is sensitive to the uncertainties in CoagSnk and the growth term. The transport term is obtained based on the population balance method; thus the uncertainties in the estimated CoagSnk and growth term will propagate in the estimated transport term. During the analyzed NPF event on 23 March, the transport term was approximately 10 % that of the CoagSnk term and the growth term. There is a probability that the estimated transport term is mainly due to the uncertainties in estimating CoagSnk and the growth term rather than particle transport. For instance, a 30 % overestimation of the particle growth rate will cause an approximately 300 % overestimation of the transport term. The systematic errors in the estimated transport term can be reduced using Eqs. (2) and (3) instead of Eq. (7), yet the errors are still sensitive to the uncertainties in the observed aerosol size distributions. Thus, the reliability of the estimated contribution of transport is challenged when the approximations of the CoagSnk and the growth term in Eq. (10) (indicated by 5–6) are violated. Nevertheless, the analysis above still indicates a negligible contribution of transport to the observed NPF event in urban Beijing.
4.4 Remarks on the feasibility of the proposed balance method
During the NPF events analyzed above, correlations are found between the estimated transport terms and the changes in the local wind field or the movement of air masses. These correlations indicate that the proposed balance method is feasible to characterize the contribution of transport to the observed aerosol size distributions. In addition to NPF event, the proposed balance method can theoretically be applied to analyze non-NPF events. However, the particle growth rate is usually difficult to determine during non-NPF periods.
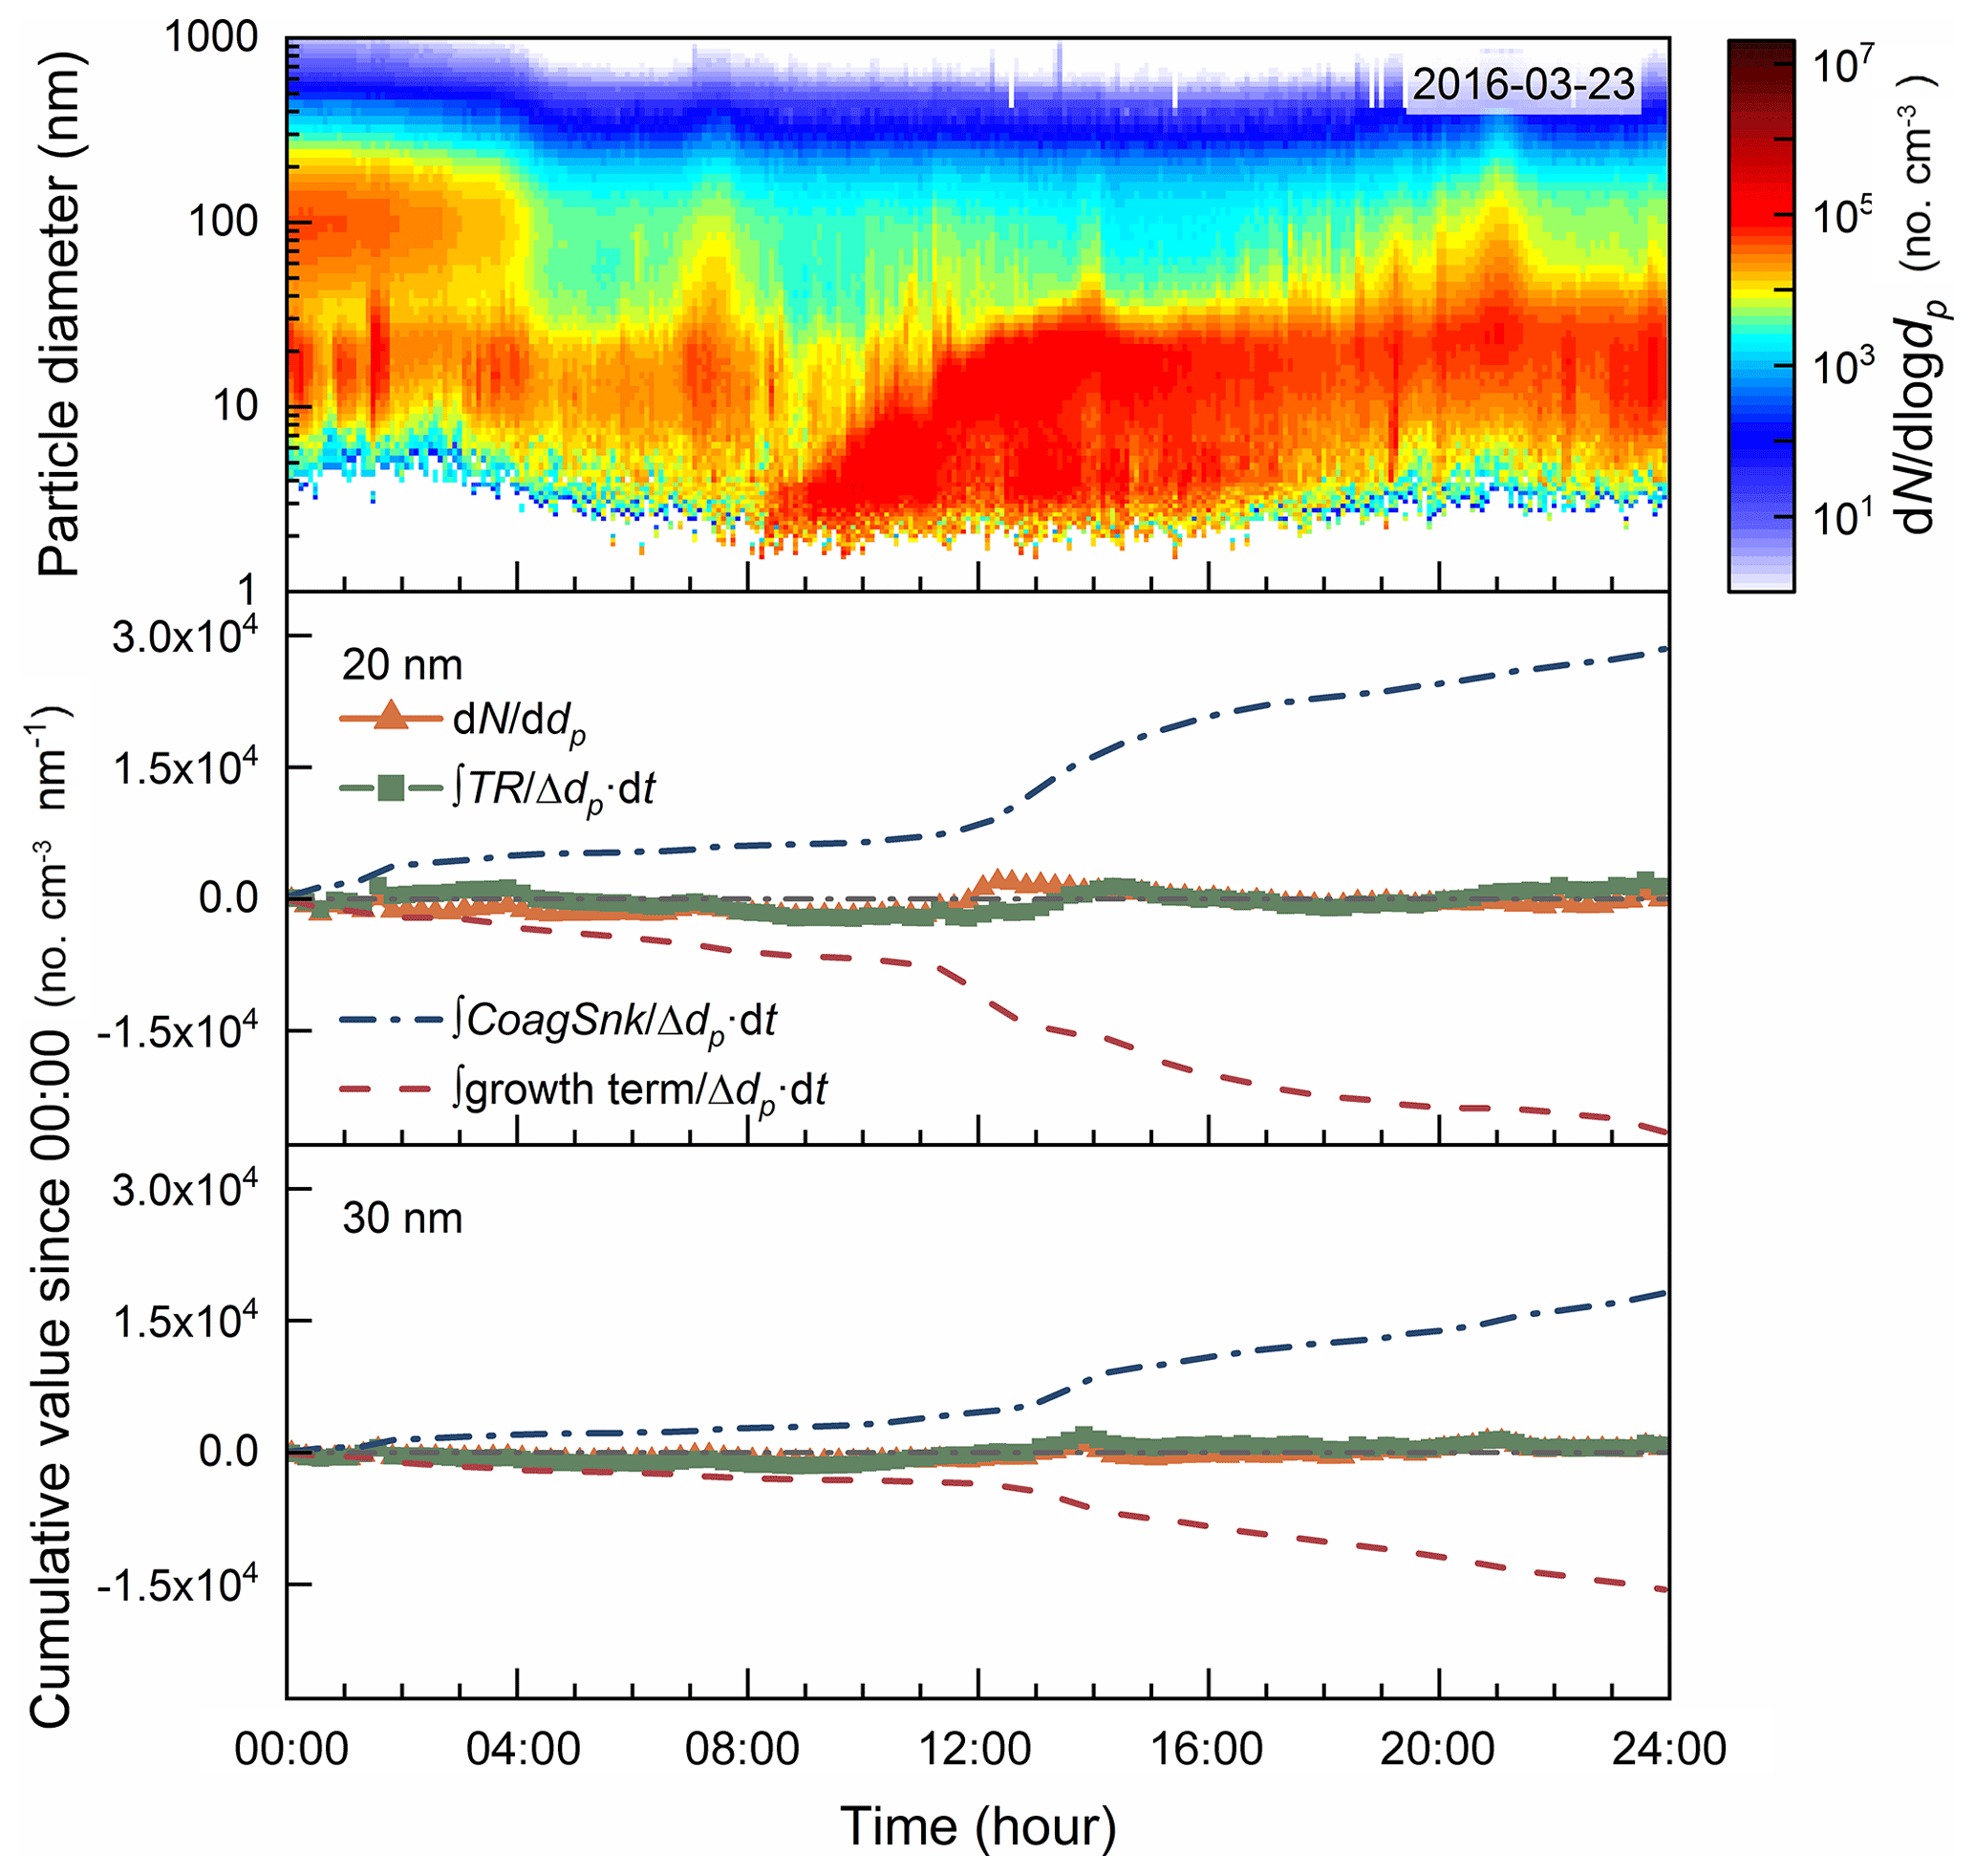
Figure 9The contour plot of aerosol size distribution and the time series of dN ∕ ddp, the cumulative transport term, the cumulative CoagSnk, and the cumulative growth term on 23 March 2016, in urban Beijing; dN ∕ ddp and the cumulative transport term were averaged every 15 min. The contribution of coagulation to the estimated grow rate was corrected (Stolzenburg et al., 2005). The cumulative CoagSrc was estimated but not shown considering its negligible values.
One should always keep in mind that the transport term is only a mathematically defined parameter. If the fundamental assumptions (indicated by 1–4) are violated, the estimated transport term indicates the additional causes of the change in the observed particle number concentration that are not accounted for. The errors in the estimated CoagSnk and the growth term also contribute to the uncertainties in the estimated transport term. Thus, the estimated transport term should be compared with other data and analyzed results (e.g., wind direction or atmospheric stability), while it is not reliable to determine the contribution of transport using the estimated transport term alone. Conversely, this method can possibly be modified to estimate the contributions to the observed aerosol size distributions due to other reasons, e.g., to analyze the change in particle dilution rate in the plume of a primary emission source when the emission rate is relatively constant.
A population balance method was proposed to estimate the contribution of transport to the temporal evolutions of the observed aerosol size distributions during atmospheric new particle formation events. This method is based on the aerosol general dynamic equation in the continuous form. The condensational growth rate is assumed to be independent of the particle diameter in the analyzed particle size range. According to the assumptions and approximations, we recommend that the analyzed particle sizes are in the range from ∼10 to ∼50 nm, which is usually wide enough to analyze the influence of transport during a new particle formation event. The other reasons for the change in particle number concentration except for condensational growth, coagulation loss, and particle transport are assumed to be negligible. This method was used to analyze the new particle formation events observed in Southeast Tibet, Fukue Island, and urban Beijing. The contribution of transport to the observed aerosol size distributions at the Southeast Tibet site is significant according to the analysis. The change in the cumulative transport term is correlated with the changes in local wind speed and direction. We hypothesize that new particles are formed elsewhere and subsequently transported to the observation site by the valley breeze. Significant influence of transport was found during the new particle formation events at the Fukue Island site. The estimated contribution of transport was correlated with the movement of the air masses or the change in the local wind field. These tests indicate the feasibility of the balance method to analyze new particle formation events in a relatively clean atmospheric environment. During an intense new particle formation event observed in urban Beijing, the estimated contribution of transport is negligible compared to coagulation scavenging and condensational growth, indicating that the observed event is a regional new particle formation event. However, the estimated coagulation loss term and the condensational growth term are approximately 1 order of magnitude larger than the rate of change in particle number concentration (dN ∕ dt) in urban Beijing. Accordingly, the relative error of the estimated transport term is sensitive to the uncertainties in the estimated coagulation loss rate and condensational grow rate.
The Matlab scripts for the proposed balance method are available upon request.
The supplement related to this article is available online at: https://doi.org/10.5194/acp-18-16587-2018-supplement.
RC and JJ conceived this study. RC, DY, LY, YF, XL, YL, LL, JH, YM, LW, JZ, and JJ conducted the field campaign in Southeast Tibet. IC and TS conducted the field campaign at Fukue Island. RC, DY, YF, XL, JH, YM, JZ, and JJ conducted the field campaign in urban Beijing. RC analyzed data using the proposed balance method with contributions from JJ and all other co-authors. RC and JJ wrote the paper with contributions from all other co-authors.
The authors declare that they have no conflict of interest.
Financial support from the National Key R&D Program of China
(2017YFC0209503) and the National Science Foundation of China (21876094,
41730106, & 91643201) is acknowledged. The authors gratefully acknowledge
the NOAA Air Resources Laboratory (ARL) for the provision of the HYSPLIT
transport and dispersion model and/or READY website
(http://www.ready.noaa.gov, last accessed: 5 April 2018) used in this study. We thank Peter McMurry at
the University of Minnesota for helpful discussions on the assumptions and
uncertainties of the proposed method.
Edited
by: Kari Lehtinen
Reviewed by: two anonymous referees
Aitken, J.: XVI – The Sun as a Fog Producer, P. R. Soc. Edin., 32, 183–215, https://doi.org/10.1017/s0370164600012864, 1912.
Cai, R. and Jiang, J.: A new balance formula to estimate new particle formation rate: reevaluating the effect of coagulation scavenging, Atmos. Chem. Phys., 17, 12659–12675, https://doi.org/10.5194/acp-17-12659-2017, 2017.
Cai, R., Chen, D.-R., Hao, J., and Jiang, J.: A miniature cylindrical differential mobility analyzer for sub-3 nm particle sizing, J. Aerosol Sci., 106, 111–119, https://doi.org/10.1016/j.jaerosci.2017.01.004, 2017a.
Cai, R., Yang, D., Fu, Y., Wang, X., Li, X., Ma, Y., Hao, J., Zheng, J., and Jiang, J.: Aerosol surface area concentration: a governing factor in new particle formation in Beijing, Atmos. Chem. Phys., 17, 12327–12340, https://doi.org/10.5194/acp-17-12327-2017, 2017b.
Chandra, I., Kim, S., Seto, T., Otani, Y., Takami, A., Yoshino, A., Irei, S., Park, K., Takamura, T., Kaneyasu, N., and Hatakeyama, S.: New particle formation under the influence of the long-range transport of air pollutants in East Asia, Atmos. Environ., 141, 30–40, https://doi.org/10.1016/j.atmosenv.2016.06.040, 2016.
Fuchs, N. A. and Sutugin, A. G.: Highly dispersed aerosol, in: Topics in Current Aerosol Research, edited by: Hidy, G. M. and Brock, J. R., Pergamon, New York, 1971.
Guo, X., Wang, Y., Zhang, G., Wang, Z., Xie, Y., Xue, Y., and Yang, X.: An atmospheric physics dataset observed from field stations on Tibetan Plateau, China Scientific data, 1, 1–13, https://doi.org/10.11922/csdata.170.2015.0003, 2016.
He, K., Yang, F., Ma, Y., Zhang, Q., Yao, X., Chan, C. K., Cadel, S., Chan, T., and Mulawa, P.: The characteristics of PM2.5 in Beijing, China, Atmos. Environ., 35, 4959–4970, 2001.
Hussein, T., Junninen, H., Tunved, P., Kristensson, A., Dal Maso, M., Riipinen, I., Aalto, P. P., Hansson, H.-C., Swietlicki, E., and Kulmala, M.: Time span and spatial scale of regional new particle formation events over Finland and Southern Sweden, Atmos. Chem. Phys., 9, 4699–4716, https://doi.org/10.5194/acp-9-4699-2009, 2009.
IPCC: Climate Change 2013: IPCC Fifth Assessment Report (AR5), Cambridge University Press, 2013.
Jiang, J., Chen, M., Kuang, C., Attoui, M., and McMurry, P. H.: Electrical Mobility Spectrometer Using a Diethylene Glycol Condensation Particle Counter for Measurement of Aerosol Size Distributions Down to 1 nm, Aerosol Sci. Tech., 45, 510–521, https://doi.org/10.1080/02786826.2010.547538, 2011.
Kangasluoma, J., Franchin, A., Duplissy, J., Ahonen, L., Korhonen, F., Attoui, M., Mikkilä, J., Lehtipalo, K., Vanhanen, J., Kulmala, M., and Petäjä, T.: Operation of the Airmodus A11 nano Condensation Nucleus Counter at various inlet pressures and various operation temperatures, and design of a new inlet system, Atmos. Meas. Tech., 9, 2977–2988, https://doi.org/10.5194/amt-9-2977-2016, 2016.
Kerminen, V.-M., Paramonov, M., Anttila, T., Riipinen, I., Fountoukis, C., Korhonen, H., Asmi, E., Laakso, L., Lihavainen, H., Swietlicki, E., Svenningsson, B., Asmi, A., Pandis, S. N., Kulmala, M., and Petäjä, T.: Cloud condensation nuclei production associated with atmospheric nucleation: a synthesis based on existing literature and new results, Atmos. Chem. Phys., 12, 12037–12059, https://doi.org/10.5194/acp-12-12037-2012, 2012.
Kuang, C., McMurry, P. H., and McCormick, A. V.: Determination of cloud condensation nuclei production from measured new particle formation events, Geophys. Res. Lett., 36, L09822, https://doi.org/10.1029/2009gl037584, 2009.
Kuang, C., Riipinen, I., Sihto, S.-L., Kulmala, M., McCormick, A. V., and McMurry, P. H.: An improved criterion for new particle formation in diverse atmospheric environments, Atmos. Chem. Phys., 10, 8469–8480, https://doi.org/10.5194/acp-10-8469-2010, 2010.
Kuang, C., Chen, M., Zhao, J., Smith, J., McMurry, P. H., and Wang, J.: Size and time-resolved growth rate measurements of 1 to 5 nm freshly formed atmospheric nuclei, Atmos. Chem. Phys., 12, 3573–3589, https://doi.org/10.5194/acp-12-3573-2012, 2012.
Kulmala, M., Dal Maso, M., Mäkelä, J. M., Pirjola, L., Väkevä, M., Aalto, P., Miikkulainen, P., Hämeri, K., and O'dowd, C. D.: On the formation, growth and composition of nucleation mode particles, Tellus, 53, 479–490, 2001.
Kulmala, M., Vehkamäki, H., Petäjä, T., Dal Maso, M., Lauri, A., Kerminen, V. M., Birmili, W., and McMurry, P. H.: Formation and growth rates of ultrafine atmospheric particles: a review of observations, J. Aerosol Sci., 35, 143–176, https://doi.org/10.1016/j.jaerosci.2003.10.003, 2004.
Kulmala, M., Petäjä, T., Nieminen, T., Sipilä, M., Manninen, H. E., Lehtipalo, K., Dal Maso, M., Aalto, P. P., Junninen, H., Paasonen, P., Riipinen, I., Lehtinen, K. E., Laaksonen, A., and Kerminen, V. M.: Measurement of the nucleation of atmospheric aerosol particles, Nat. Protoc., 7, 1651–1667, https://doi.org/10.1038/nprot.2012.091, 2012.
Kulmala, M., Kontkanen, J., Junninen, H., Lehtipalo, K., Manninen, H. E., Nieminen, T., Petäjä, T., Sipilä, M., Schobesberger, S., Rantala, P., Franchin, A., Jokinen, T., Jarvinen, E., Äijälä, M., Kangasluoma, J., Hakala, J., Aalto, P. P., Paasonen, P., Mikkilä, J., Vanhanen, J., Aalto, J., Hakola, H., Makkonen, U., Ruuskanen, T., Mauldin, R. L., 3rd, Duplissy, J., Vehkamäki, H., Bäck, J., Kortelainen, A., Riipinen, I., Kurtén, T., Johnston, M. V., Smith, J. N., Ehn, M., Mentel, T. F., Lehtinen, K. E., Laaksonen, A., Kerminen, V.-M., and Worsnop, D. R.: Direct observations of atmospheric aerosol nucleation, Science, 339, 943–946, https://doi.org/10.1126/science.1227385, 2013.
Li, C. and McMurry, P. H.: Errors in nanoparticle growth rates inferred from measurements in chemically reacting aerosol systems, Atmos. Chem. Phys., 18, 8979–8993, https://doi.org/10.5194/acp-18-8979-2018, 2018.
Liu, J., Jiang, J., Zhang, Q., Deng, J., and Hao, J.: A spectrometer for measuring particle size distributions in the range of 3 nm to 10 µm, Front. Environ. Sci. Eng., 10, 63–72, https://doi.org/10.1007/s11783-014-0754-x, 2016.
McMurry, P. H. and Wilson, J. C.: Droplet phase (heterogeneous) and gas phase (homogeneous) contributions to secondary ambient aerosol formation as functions of relative humidity, J. Geophys. Res., 88, 5101–5108, 1983.
Moch, J. M., Dovrou, E., Mickley, L. J., Keutsch, F. N., Cheng, Y., Jacob, D. J., Jiang, J., Li, M., Munger, J. W., Qiao, X., and Zhang, Q.: Contribution of Hydroxymethane Sulfonate to Ambient Particulate Matter: A Potential Explanation for High Particulate Sulfur During Severe Winter Haze in Beijing, Geophys. Res. Lett., 45, https://doi.org/10.1029/2018gl079309, in press, 2018.
Pichelstorfer, L., Stolzenburg, D., Ortega, J., Karl, T., Kokkola, H., Laakso, A., Lehtinen, K. E. J., Smith, J. N., McMurry, P. H., and Winkler, P. M.: Resolving nanoparticle growth mechanisms from size- and time-dependent growth rate analysis, Atmos. Chem. Phys., 18, 1307–1323, https://doi.org/10.5194/acp-18-1307-2018, 2018.
Seinfeld, J. H. and Pandis, S. N.: Atmospheric Chemistry and Physics, 2nd ed., John Wiley & Sons, Inc., New Jersey, 2006.
Seto, T., Kim, S., Otani, Y., Takami, A., Kaneyasu, N., Fujimoto, T., Okuyama, K., Takamura, T., and Hatakeyama, S.: New particle formation and growth associated with East-Asian long range transportation observed at Fukue Island, Japan in March 2012, Atmos. Environ., 74, 29–36, https://doi.org/10.1016/j.atmosenv.2013.03.033, 2013.
Song, S., Gao, M., Xu, W., Sun, Y., Worsnop, D. R., Jayne, J. T., Zhang, Y., Zhu, L., Li, M., Zhou, Z., Cheng, C., Lv, Y., Wang, Y., Peng, W., Xu, X., Lin, N., Wang, Y., Wang, S., Munger, J. W., Jacob, D., and McElroy, M. B.: Possible heterogeneous hydroxymethanesulfonate (HMS) chemistry in northern China winter haze and implications for rapid sulfate formation, Atmos. Chem. Phys. Discuss., https://doi.org/10.5194/acp-2018-1015, in review, 2018.
Stolzenburg, M. R., McMurry, P. H., Sakurai, H., Smith, J. N., Mauldin, R. L., Eisele, F. L., and Clement, C. F.: Growth rates of freshly nucleated atmospheric particles in Atlanta, J. Geophys. Res., 110, D22S05, https://doi.org/10.1029/2005jd005935, 2005.
Takami, A., Miyoshi, T., Shimono, A., and Hatakeyama, S.: Chemical composition of fine aerosol measured by AMS at Fukue Island, Japan during APEX period, Atmos. Environ., 39, 4913–4924, https://doi.org/10.1016/j.atmosenv.2005.04.038, 2005.
Takegawa, N., Iida, K., and Sakurai, H.: Modification and laboratory evaluation of a TSI ultrafine condensation particle counter (Model 3776) for airborne measurements, Aerosol Sci. Tech., 51, 235–245, https://doi.org/10.1080/02786826.2016.1261990, 2016.
Tröstl, J., Herrmann, E., Frege, C., Bianchi, F., Molteni, U., Bukowiecki, N., Hoyle, C. R., Steinbacher, M., Weingartner, E., Dommen, J., Gysel, M., and Baltensperger, U.: Contribution of new particle formation to the total aerosol concentration at the high-altitude site Jungfraujoch (3580 m asl, Switzerland), J. Geophy. Res.-Atmos., 121, 11692–11711, https://doi.org/10.1002/2015jd024637, 2016.
Vana, M., Ehn, M., Petäjä, T., Vuollekoski, H., Aalto, P., de Leeuw, G., Ceburnis, D., O'Dowd, C. D., and Kulmala, M.: Characteristic features of air ions at Mace Head on the west coast of Ireland, Atmos. Res., 90, 278–286, https://doi.org/10.1016/j.atmosres.2008.04.007, 2008.
Wang, J., Krejci, R., Giangrande, S., Kuang, C., Barbosa, H. M., Brito, J., Carbone, S., Chi, X., Comstock, J., Ditas, F., Lavric, J., Manninen, H. E., Mei, F., Moran-Zuloaga, D., Pohlker, C., Pohlker, M. L., Saturno, J., Schmid, B., Souza, R. A., Springston, S. R., Tomlinson, J. M., Toto, T., Walter, D., Wimmer, D., Smith, J. N., Kulmala, M., Machado, L. A., Artaxo, P., Andreae, M. O., Petaja, T., and Martin, S. T.: Amazon boundary layer aerosol concentration sustained by vertical transport during rainfall, Nature, 539, 416–419, https://doi.org/10.1038/nature19819, 2016.
Wang, Y., Ma, Y., Zhu, Z., and Li, M.: Variation Characteristics of Meteorological Elements in Near Surface Layer over the Lulang Valley of Southeastern Tibetan Plateau, Plateau Meterology, 29, 63–69, 2010.
Wang, Z. B., Hu, M., Sun, J. Y., Wu, Z. J., Yue, D. L., Shen, X. J., Zhang, Y. M., Pei, X. Y., Cheng, Y. F., and Wiedensohler, A.: Characteristics of regional new particle formation in urban and regional background environments in the North China Plain, Atmos. Chem. Phys., 13, 12495–12506, https://doi.org/10.5194/acp-13-12495-2013, 2013.
Weber, R. J., Marti, J. J., McMurry, P. H., Eisele, F. L., Tanner, D. J., and Jefferson, A.: Measurements of new particle formation and ultrafine particle growth rates at a clean continental site, J. Geophys. Res.-Atmos., 102, 4375–4385, https://doi.org/10.1029/96jd03656, 1997.
Zhao, Z., Cao, J., Shen, Z., Xu, B., Zhu, C., Chen, L. W. A., Su, X., Liu, S., Han, Y., Wang, G., and Ho, K.: Aerosol particles at a high-altitude site on the Southeast Tibetan Plateau, China: Implications for pollution transport from South Asia, J. Geophys. Res.-Atmos., 118, 11360–311375, https://doi.org/10.1002/jgrd.50599, 2013.