the Creative Commons Attribution 4.0 License.
the Creative Commons Attribution 4.0 License.
Lagrangian process attribution of isotopic variations in near-surface water vapour in a 30-year regional climate simulation over Europe
Stephan Pfahl
Miro Meyer
Heini Wernli
Stable water isotopes are naturally available tracers of moisture in the atmosphere. Due to isotopic fractionation, they record information about condensation and evaporation processes during the transport of air parcels, and therefore present a valuable means for studying the global water cycle. However, the meteorological processes driving isotopic variations are complex and not very well understood so far, in particular on short (hourly to daily) timescales. This study presents a Lagrangian method for attributing the isotopic composition of air parcels to meteorological processes, which provides new insight into the isotopic history of air parcels. It is based on the temporal evolution of the isotope ratios, the humidity, the temperature, and the location of the air parcels. Here these values are extracted along 7-day backward trajectories started every 6 hours from near the surface in a 30-year regional climate simulation over Europe with the isotope-enabled version of the model of the Consortium for Small-Scale Modelling (COSMOiso). The COSMOiso simulation has a horizontal resolution of 0.25∘ and is driven at the lateral boundaries by a T106 global climate simulation with the isotope-enabled version of the European Centre Hamburg model (ECHAMwiso). Both simulations are validated against measurements from the Global Network of Isotopes in Precipitation (GNIP), which shows that nesting COSMOiso within ECHAMwiso improves the representation of δ2H and deuterium excess in monthly accumulated precipitation. The method considers all isotopic changes that occur inside the COSMOiso model domain, which, on average, correspond to more than half of the mean and variability in both δ2H and deuterium excess at the air parcels' arrival points. Along every trajectory, the variations in the isotope values are quantitatively decomposed into eight process categories (evaporation from the ocean, evapotranspiration from land, mixing with moister air, mixing with drier air, liquid cloud formation, mixed phase cloud formation, ice cloud formation, and no process). The results show that for air parcels arriving over the ocean, evaporation from the ocean is the primary factor controlling δ2H and deuterium excess. Over land, evapotranspiration from land and mixing with moister air are similarly important. Liquid and mixed phase cloud formation contribute to the variability of δ2H and deuterium excess, especially over continental Europe. In summary, the presented method helps to better understand the linkage between the meteorological history of air parcels and their isotopic composition, and may support the interpretation of stable water isotope measurements in future.
- Article
(27865 KB) - Full-text XML
-
Supplement
(8999 KB) - BibTeX
- EndNote
Stable water isotopes (HO, HD16O, and HO) experience fractionation during phase transitions, meaning that they become enriched in one phase and depleted in the other. In this way they can record information about evaporation and condensation processes during the transport of air parcels. Since the strength of fractionation depends on meteorological conditions (e.g. temperature, relative humidity and wind speed), stable water isotopes have become useful tracers of the global water cycle. For example, low δ2H or δ18O values in atmospheric water vapour (where the δ notation describes the concentrations of the heavy isotopes relative to Vienna Standard Mean Ocean Water – VSMOW) indicate low temperatures and strong rainout of air parcels (e.g. Jacob and Sonntag, 1991; Yoshimura et al., 2011), and high deuterium excess values (defined as ) indicate low relative humidities at the moisture sources (e.g. Gat et al., 2003; Aemisegger et al., 2014). Similar quantitative relations exist between atmospheric processes and isotope signals in precipitation (e.g. Dansgaard, 1964; Pfahl and Sodemann, 2014).
However, the attribution of isotope signals to individual meteorological processes is challenging, since all phase transitions involving the vapour phase (except snow sublimation) cause fractionation and therefore change δ2H, δ18O, and the deuterium excess. While δ2H and δ18O are to first order governed by equilibrium fractionation processes, which are caused by the higher binding energies of the heavy isotopes, the deuterium excess is more sensitive to nonequilibrium fractionation effects, which are caused by the slower diffusion velocities of the heavy isotopes. Hence, the isotope signal of an air parcel at a specific measurement site represents the total imprint of all equilibrium and nonequilibrium fractionation processes that occurred during its transport, typically including evaporation from the ocean, evapotranspiration from land, cloud formation, and below-cloud rain evaporation and equilibration. Additionally, mixing with surrounding air can further influence the isotopic composition of air parcels. These processes can occur almost simultaneously, and most air parcels experience a combination of them on short timescales of a few hours to days. Thus, to fully explore the potential of stable water isotopes as tracers of the water cycle, a good understanding of the imprint of these processes on the isotopic composition of air parcels is necessary.
Due to this complexity, numerical models are an essential tool for studying these processes and their influence on isotopes. Several Eulerian and Lagrangian isotope models have been developed so far. Eulerian isotope models simulate the atmosphere (and oceans) by solving the equations expressing conservation of momentum, energy, and mass on a fixed grid, and represent, in parts with simplified parameterizations, all meteorological processes that modify the isotopic composition of water vapour and precipitation. They have been used for sensitivity studies to clarify the role of specific processes on isotopic variability. For example, Risi et al. (2013) used the isotope-enabled version of the Laboratoire de Météorologie Dynamique Zoom general circulation model (LMDZiso; Risi et al., 2010) to quantify the effects of moisture source conditions, rainout, mixing, rain re-evaporation, and supersaturation in ice clouds on the deuterium excess and the 17O excess in precipitation at different latitudes. Moore et al. (2014) used the isotope version of the System for Atmospheric Modeling (IsoSAM; Blossey et al., 2010) to determine the relative importance of moisture convergence and rain evaporation and equilibration for the amount effect (i.e. decreasing δ2H and δ18O with increasing precipitation amount) in an idealized simulation, and Christner et al. (2018) used the isotope version of the Consortium for Small-Scale Modelling (COSMOiso; Pfahl et al., 2012) for attributing δ2H in European water vapour and precipitation to evapotranspiration, rainout, and rain evaporation and equilibration. The disadvantage of Eulerian isotope models is that, due to their complexity and consequently the many inherent feedbacks, it can be difficult to isolate the impact of individual processes on isotopic variability.
In contrast, Lagrangian isotope models follow air parcels and simulate their isotopic composition during transport. They provide a direct link to the most important processes and moisture sources, while still having a relatively simple numerical structure. They have been applied for understanding the isotopic history of air parcels arriving at various measurement sites. For example, Helsen et al. (2007) used a Rayleigh-type isotope model in combination with backward trajectory calculations to simulate and interpret the isotopic composition of snow in Antarctica. Sodemann et al. (2008a) applied a Lagrangian moisture source diagnostic to simulate the effects of the North Atlantic Oscillation on δ2H and δ18O in snow on Greenland. Sinclair et al. (2011) used three different Rayleigh-type models to test the effect of topography on δ18O in snow in western Canada, and Christner et al. (2017) used a Lagrangian isotope model based on realistic trajectories to quantify the influence of snow sublimation and meltwater evaporation on δ2H in water vapour over Europe. The disadvantage of Lagrangian isotope models is that, since they require a strong simplification of meteorological processes, e.g. they neglect mixing with surrounding air (Noone and Sturm, 2010), they cannot capture the full complexity of the global water cycle.
In this study, we combine the Eulerian and Lagrangian approaches by tracing isotopes along Lagrangian backward trajectories in a 30-year Eulerian model simulation over Europe. Thus, we avoid some of the simplifications used in Lagrangian isotope models, while still focusing on the history of air parcels and on the imprint of meteorological processes on their isotopic composition. With the help of this new approach we will address the following question: which processes in the atmospheric water cycle determine the mean and variability in the isotope signal in near-surface water vapour at different locations across Europe?
The long-term simulation of 30 years allows for investigating variability from the daily to the interannual timescale. We focus on water vapour near the surface, where isotopes are most often measured, and distinguish between the following seven process categories: evaporation from the ocean, evapotranspiration from land, mixing with moister air, mixing with drier air, liquid cloud formation, mixed phase cloud formation, and ice cloud formation. For the simulation, the limited-area isotope model COSMOiso (Pfahl et al., 2012) is used, which is based on the nonhydrostatic weather forecast and climate model COSMO (Steppeler et al., 2003). Concentrating on a limited area allows a high output frequency and a high spatial resolution (here 0.25∘), which is favourable for trajectory calculations. A new method is introduced to attribute all isotopic changes along the trajectories to one of the meteorological processes mentioned above, or to a “no process category”, as will be explained in Sect. 3.2. In this way, the contribution of each process to the air parcels' final isotopic composition can be determined. This evaluation with a large set of trajectories driven by a high-resolution regional climate simulation is a promising new approach to address the above question in a quantitative way. The results will be presented in Sect. 3.5 and 3.6 and discussed in Sect. 4. Conclusions are given in Sect. 5.
2.1 Model
COSMO (Steppeler et al., 2003) is a numerical weather forecast and climate model that is operationally used at several European weather services. It is based on the hydro-thermodynamical equations describing compressible nonhydrostatic flow and can be used for simulations with horizontal resolutions of less than 1 km. The isotope implementation (COSMOiso; Pfahl et al., 2012) is similar to other Eulerian isotope models (e.g. Joussaume et al., 1984; Sturm et al., 2005; Blossey et al., 2010; Werner et al., 2011): it includes two parallel water cycles for each of the heavy isotopes (HD16O and HO), which are used purely diagnostically and do not affect other model components. The heavy isotopes experience the same processes as the light isotope (HO), except during phase transitions when isotopic fractionation occurs. A one-moment microphysics scheme is used and convection is parameterized following Tiedtke (1989). For a detailed description of the physics and isotope parameterizations see Doms et al. (2011) and Pfahl et al. (2012), respectively.
2.2 Simulation setup
The simulation is run for 30 years (1982–2011) in a model domain covering most of Europe, the Mediterranean, and part of the North Atlantic and north Africa (Fig. 1). The grid spacing is 0.25∘ in the horizontal and between 16 and 2808 m in the vertical, with 40 terrain-following model levels. Initial and boundary conditions are provided by a nudged historical isotope simulation (Butzin et al., 2014) performed with the isotope-enabled European Centre Hamburg Model (ECHAMwiso; Werner et al., 2011) at T106 horizontal resolution and on 31 vertical levels. COSMOiso runs freely inside the model domain. Isotopic fractionation during evaporation from the ocean is parameterized with the Craig–Gordon model (Craig and Gordon, 1965) using a wind speed independent formulation of the nonequilibrium fractionation factor (Pfahl and Wernli, 2009). The isotope content of the soil is prescribed by external data from ECHAMwiso, and no fractionation is assumed to occur during evapotranspiration from land surfaces. This setup has been found to be the best out of six setups with different initial and boundary conditions and different parameterizations of fractionation during ocean evaporation and land evapotranspiration, when compared with monthly isotope measurements of precipitation from the Global Network of Isotopes in Precipitation (GNIP; IAEA/WMO, 2016) (Dütsch, 2016).
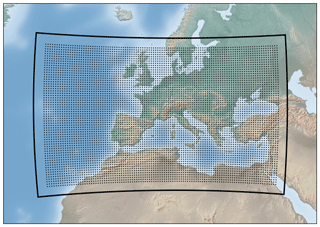
Figure 1Model domain of the COSMOiso simulation (black line) and the starting points of the backward trajectories (dots).
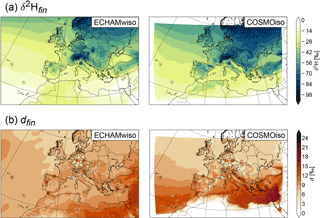
Figure 2The 30-year mean of (a) δ2H and (b) d in precipitation from ECHAMwiso (left) and COSMOiso (right). The GNIP measurements are shown as dots.
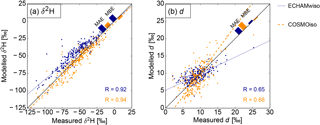
Figure 3Seasonal mean values of (a) δ2H and (b) d in precipitation from ECHAMwiso (dark blue) and COSMOiso (orange) with respect to the GNIP measurements. Each dot represents the value at one GNIP station averaged over one season and 30 years. The lines are orthogonal regression lines (Adcock, 1878). MAE, MBE, and R are the mean absolute error, the mean bias error, and the linear correlation coefficient, respectively.
2.3 Evaluation with GNIP measurements
Figure 2 shows δ2H and deuterium excess in precipitation in ECHAMwiso and COSMOiso together with GNIP measurements. The values correspond to the unweighted mean of the weighted monthly means, i.e. the monthly means are weighted by the precipitation amount (according to the GNIP measurements), but the 30-year mean of the models and the measurements is unweighted. Only stations that measured during at least a third of the time are considered. Both models nicely reproduce the δ2H gradients from the continent to the ocean (continental effect) and from north to south (latitude effect), which are also observed at the GNIP stations (Fig. 2a). The finer resolution of the COSMOiso simulation, and consequently its better representation of topography, reveals small-scale structures of δ2H that are not visible in ECHAMwiso. For example, the Atlas, Pyrenees, Carpathian, or Balkan mountains clearly receive more depleted precipitation than their surrounding flatlands (altitude effect). Furthermore, COSMOiso tends to produce more depleted precipitation than ECHAMwiso, especially over continental Europe. The deuterium excess varies on small horizontal scales and differs more between the models and the GNIP measurements (Fig. 2b). This indicates that nonequilibrium fractionation, which to first order governs the deuterium excess, is more difficult to simulate than equilibrium fractionation, which to first order governs δ2H and δ18O. ECHAMwiso produces the highest deuterium excess over north Africa, while COSMOiso has the highest values over the Mediterranean and relatively low values everywhere else.
In Fig. 3, the modelled 30-year averaged seasonal values of δ2H and deuterium excess in precipitation are plotted against the GNIP measurements (again the unweighted mean of the weighted monthly means). The modelled values are interpolated linearly to the GNIP stations. At all stations, months are included if a GNIP measurement and values from both models are available. Furthermore, only stations are shown with measurements in at least a third of the months in the respective season and 30 years. As already indicated in Fig. 2, ECHAMwiso tends to overestimate and COSMOiso tends to underestimate δ2H in precipitation (Fig. 3a). Nonetheless the mean bias error (MBE) as well as the mean absolute error (MAE) of both models are small and the correlations (R) are high (0.92 for ECHAMwiso, 0.94 for COSMOiso). COSMOiso slightly outperforms ECHAMwiso in terms of all three measures for δ2H. The correlations of modelled and measured deuterium excess are smaller (0.65 for ECHAMwiso, 0.68 for COSMOiso; Fig. 3b). ECHAMwiso overestimates low and underestimates high deuterium excess values, and COSMOiso does the opposite. This leads to a relatively small MBE in both models, but a larger MAE, while ECHAMwiso outperforms COSMOiso in terms of MAE.
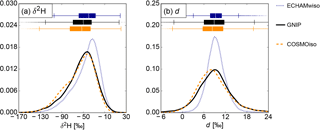
Figure 4Box plots and probability density functions of the monthly mean (a) δ2H and (b) d in precipitation from ECHAMwiso (dark blue), COSMOiso (orange) and the GNIP measurements (black).
Figure 4 depicts the statistical distributions of the individual monthly δ2H and deuterium excess values of the two models and the GNIP measurements, again only for the months for which a GNIP measurement and values from both models are available. The probability density functions were calculated with a kernel density estimate using Gaussian kernels and Scott's rule (Scott, 1992) for the bandwidth selection. The distribution of δ2H is left-skewed (Fig. 4a), whereas the deuterium excess is almost normally distributed (Fig. 4b). COSMOiso nicely matches the measured distributions of both δ2H and deuterium excess with only a small shift towards lower values. ECHAMwiso produces too narrow distributions and overestimates their medians. Overall, both δ2H and deuterium excess from the GNIP measurements are better reproduced by COSMOiso than by ECHAMwiso. This underlines the added value of high-resolution numerical model simulations of stable water isotopes, and motivates the following more detailed analysis of the isotopic signals in near-surface atmospheric water vapour induced by the different meteorological processes.
3.1 Trajectories
To represent the history of air parcels, stable water isotopes are traced along backward trajectories. The trajectories are computed from one hourly output fields of the COSMOiso simulation using the Lagrangian Analysis Tool (LAGRANTO; Sprenger and Wernli, 2015). They start every 6 hours and every 0.5∘ (Fig. 1) from the first, third, and fifth model level and go 7 days backwards in time or until they leave the model domain. Along the trajectories, one out of eight process categories (evaporation from the ocean, evapotranspiration from land, mixing with moister air, mixing with drier air, liquid cloud formation, mixed phase cloud formation, ice cloud formation, no process) is assigned to every time step, based on the change in specific humidity, the location, temperature, and relative humidity of the trajectory. The allocation of the process categories builds upon the moisture source analysis introduced by Sodemann et al. (2008b) and is described in the following.
3.2 Process allocation
If specific humidity increases during a certain time step (), moisture is assumed to have evaporated or transpired from the surface or to be mixed into the air parcel (i.e. the parcel mixes with moister air). The distinction between evaporation and mixing is made based on the trajectory's height z compared to the boundary layer height (BLH) and the sign of the hourly accumulated evaporation flux E from the surface. If the trajectory is located within an extended boundary layer (, where the factor 1.5 takes into account the uncertainty of the boundary layer height parameterization in COSMO), and the evaporation flux is from the surface to the atmosphere (E>0), then the moisture increase is assigned to evaporation; if not, it is assigned to mixing. Evaporation is said to originate from the ocean if the interpolated land sea mask (LSM) at the trajectory's location is less than or equal to 0.75, and originate from land otherwise. Note that there is no separate category for rain evaporation. This process is included either in evaporation from the surface or mixing, depending on the trajectory's location.
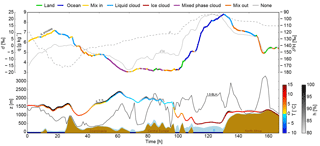
Figure 5Time series of q (coloured with processes, see legend at the top), δ2H (solid grey line), d (dashed grey line), z (coloured with T and h), 1.5⋅BLH (solid black line), and E (light blue shading, scaled by 106) along an example trajectory arriving in north Africa (33∘ N, 1∘ E) on 3 October 1989 at 00:00 UTC. The brown and blue shadings indicate land and ocean surfaces, respectively.
If specific humidity decreases (), moisture is assumed to have condensed or to be mixed out of the air parcel (i.e. the parcel mixes with drier air). The distinction between condensation and mixing is made based on the relative humidity h with respect to liquid water in the air parcel. If h≥80 %, the probability for subgrid-scale condensation is high, and the moisture decrease is assigned to condensation; if not, it is assigned to mixing. The condensate is liquid if temperature T>0 ∘C, solid (ice) if ∘C, and mixed phase if −23 ∘C.
To avoid noise, a minimum change of specific humidity g kg−1 is required. If , no process is assigned to the time step. The results of this process allocation can be seen exemplarily in Fig. 5. For instance, at t=60 h, specific humidity decreases while the trajectory is ascending above the boundary layer. Temperature is below 0 ∘C and the relative humidity is above 80 %, therefore the attributed process is condensation in mixed phase clouds. During an extended period around t=120 h, specific humidity increases while the trajectory is in the oceanic boundary layer and ocean evaporation is the attributed process. A third example is the moisture increase at t=160 h, when the trajectory is in the boundary layer over land. In this case, the relevant process is land evapotranspiration. An idealization here is that only one process, the one that is regarded as most important, is attributed to a time step along the trajectories. In reality, different processes might often act simultaneously.
3.3 Weighting with moisture
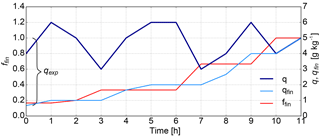
An air parcel typically experiences several moisture uptakes and losses. Processes occurring earlier during the transport of the air parcel therefore contribute less to its final isotopic composition, since part of the signal is lost during moisture losses and overwritten by later moisture uptakes. The relative contribution of a process at time n is proportional to the amount of moisture at time n that is still contained in the air parcel at its arrival point (at time N). To determine the corresponding fraction of moisture is calculated. With by definition, along the trajectories can be derived backward in time:
where denotes the minimum of 1 and the ratio of specific humidities at times n+1 and n. This weighting is equivalent to the weighting applied in the moisture source diagnostic by Sodemann et al. (2008b). Figure 6 shows the time series of q, qfin, and ffin along a hypothetical trajectory. If q decreases from time n to time n+1 (forward), qfin stays constant, while ffin increases. This means that the contributions of the times n and n+1 to the air parcel's final composition are equal, since no new moisture enters the parcel from time n to n+1. If q increases, qfin increases proportionally, while ffin stays constant. This means that the contribution of time n+1 is larger than the contribution of time n, since the air parcel takes up new moisture, which partly overwrites the signal from time n. If q stays constant, both qfin and ffin stay constant as well.
3.4 Isotopes
For quantifying the impact of the processes on the air parcels' final isotope ratio δN (where δ=δ2H or d), we consider, at time n, only the moisture that is still contained in the air parcel at its arrival point (), and reformulate δN to express the sum of the initial isotope ratio δ0 and the changes during transport, all weighted by :
Hence, the air parcels' final isotope ratio (δfin≡δN) is given by the sum of the weighted initial isotope ratio (δini) and the weighted changes along the trajectories (Δδ):
where δini corresponds to the value of the trajectory either 7 days prior to its arrival or at the time when it enters the model domain. Furthermore, the contribution of a process k to the final isotopic composition is
where the subscript k denotes time steps assigned to process k.
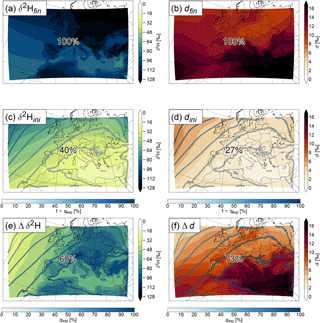
Figure 7The 30-year mean of δ2H (a, c, e) and deuterium excess (b, d, f) in water vapour averaged over the first, third, and fifth lowest model level (a, b), the weighted contributions of the initial values (c, d), and changes along the trajectories (e, f). The numbers show the mean contribution of each term to the final value (δ2Hfin and dfin). The contours show 1−qexp (c, d) and qexp (e, f) in %.
For the processes that increase the moisture content of the air parcels (), Δδk corresponds to the isotopic composition of the moisture added by the processes, weighted by :
For the processes that decrease the moisture content of the air parcels (), Δδk corresponds to the change in isotopic composition experienced by the remaining moisture due to the processes, weighted by .
Comparison of the different Δδ2Hk and Δdk will then show which processes contributed how much to the final isotopic composition of the air parcels.
The summed-up weights of each process will hereafter be referred to as the amount of moisture “explained” by the process (in %):
The sum of all of the moisture increasing processes will be referred to as the total fraction of explained moisture (qexp) and corresponds to the fraction of final moisture taken up by the trajectories inside the model domain ().
The influence of the processes on isotopic variability is addressed by considering days, months, and years when δ2H or deuterium excess are unusually high or low, i.e. when the anomalies with respect to the climatological mean are in the highest or lowest 25 % (33 % for years). This means that, for each grid point, the 2739 days, 90 months, and 10 years with the highest and lowest δ2H and deuterium excess anomalies are selected. For the daily anomalies, the climatological mean is calculated as the 31-day running mean of the 30-year daily climatology, for the monthly anomalies it corresponds to the 30-year monthly climatology, and for the yearly anomalies to the 30-year yearly climatology. The difference of Δδ2Hk and Δdk between high and low anomaly days, months, and years represents the contribution of process k to the anomalies (and thus, to isotopic variability on the given timescale).
3.5 Mean δ2H and deuterium excess
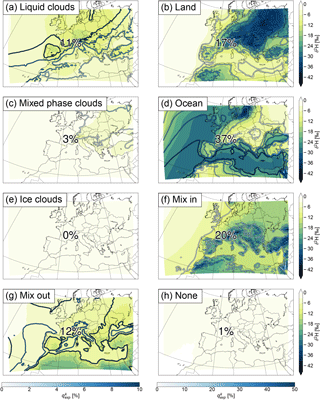
Figure 7 shows the 30-year mean δ2H and deuterium excess in water vapour averaged over the first, third, and fifth lowest model level (δ2Hfin and dfin; Fig. 7a, b) together with the separate contributions of the initial values (δ2Hini and dini; Fig. 7c, d) and the total changes along the trajectories induced by the processes specified in Sect. 3.2 (Δδ2H and Δd; Fig. 7e, f). By construction, the weighted initial values and changes along the trajectories fully explain δ2H and d at the trajectories' arrival points (; see Eq. 6). Note that δini and Δδ are not drawn at the grid points where they occur but at the grid points where the corresponding trajectory arrives. Also, δfin corresponds to a straightforward Eulerian average of the COSMOiso output over 30 years and model levels 1, 3, and 5. The percentage of moisture explained by the initial state and the changes along the trajectories is shown in contours and corresponds to for the initial state (Fig. 7c, d) and to qexp for the changes along the trajectories (Fig. 7e, f). Due to the multiplication of δ with at each time step (see Eq. 3), the patterns of δini and Δδ depend on both qexp and δ. For δ2H, which is (almost) always negative, multiplication with a higher positive number (larger qexp) results in a lower (more negative) number. Thus a lower Δδ2H can result from a lower δ2H in moisture uptakes, a stronger decrease and/or weaker increase in δ2H during moisture losses, or a larger qexp (or a combination of the three). For deuterium excess, which is typically positive, multiplication with a higher positive number results in a higher (more positive) number, and a higher Δd can result from a higher deuterium excess in moisture uptakes, a stronger increase and/or weaker decrease of deuterium excess during moisture losses or a larger qexp (or again a combination of the three).
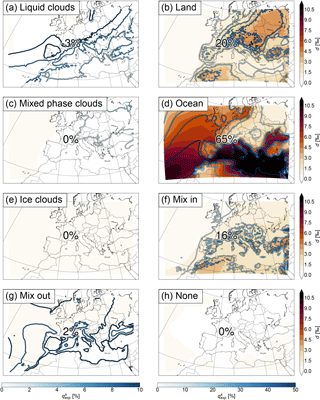
Similarly as δ2H in precipitation (cf. Fig. 2a), δ2Hfin in water vapour shows a positive gradient from north to south (latitude effect) and from the continent towards the ocean (continental effect) (Fig. 7a). The latitude effect is already visible in δ2Hini (Fig. 7c). However, this is mainly due to the lower qexp in the north than in the south, meaning that more initial moisture is contained in the air parcels in the north than in the south. δ2H0 alone has no north–south gradient (not shown). The processes (Δδ2H; Fig. 7e) add the land–sea contrast (continental effect) to δ2Hfin and the depletion in mountainous regions (altitude effect). dini (Fig. 7d) shows a similar pattern as δ2Hini, but of the opposite sign. This again corresponds quite well to the pattern of 1−qexp. The high values of dfin (Fig. 7b) in the south of the domain, especially over the Mediterranean, originate from the changes along the trajectories (Fig. 7f). The mean contribution of Δδ2H to δ2Hfin and Δd to dfin are 60 and 73 %, respectively, meaning that more than half of the mean of both isotope parameters is determined during the previous 7 days and within the COSMOiso domain. These parts can be further separated into the relative contributions of the different processes. They are shown in Fig. 8 for δ2H and in Fig. 9 for deuterium excess. For δ2H, all contributions are negative, since δ2H in the moisture added to the air parcels, e.g. by surface evaporation, is (almost) always negative, and moisture decreasing processes, such as rainout, typically also decrease δ2H. For deuterium excess, the contributions are mostly positive but can also be negative, since the deuterium excess in the moisture uptakes is typically positive, but some processes, such as the formation of liquid clouds, lead to a decrease.
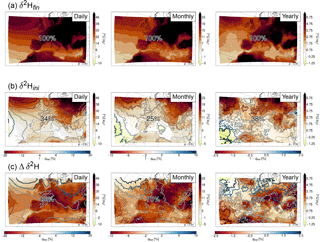
Figure 10Difference in δ2H between the high and low anomaly days (left), months (middle), and years (right) at each grid point. (a) Shows the mean δ2H in water vapour averaged over the first, third, and fifth lowest model level and (b, c) show the weighted contributions of the initial values and the changes along the trajectories, respectively. The numbers show the mean contribution of each term to δ2Hfin, and the contours show the difference in 1−qexp (b) and qexp (c) in %. Stippling indicates areas where p<0.01. Note the different colour scales.
For δ2H, evaporation from the ocean contributes most with 37 % on average. Mixing with moister air, evapotranspiration from land, mixing with drier air, and the formation of liquid clouds contribute with 20, 17, 12, and 11 %, respectively. The formation of mixed phase and ice clouds, and the time steps for which no process was assigned, are only of minor importance. For the trajectories arriving over the ocean, evaporation from the ocean is the dominant process. Over land, evapotranspiration from land, mixing with moister and with drier air, and the formation of liquid clouds are more important than evaporation from the ocean. The patterns correspond quite well to the amount of moisture explained by the processes (). It is generally high where δ2H is low, meaning that the importance of the processes for determining δ2H is in line with the amount of moisture they contribute.
For deuterium excess, evaporation from the ocean is clearly the most important process with 65 % contribution on average. The other two moisture-increasing processes, evapotranspiration from land and mixing with moister air, account for 20 and 16 %, respectively. Cloud formation processes and mixing with drier air have almost no influence. The formation of liquid clouds shows a small negative contribution (−3 %), meaning that it slightly decreases the deuterium excess. Again, evaporation from the ocean is most important for the trajectories arriving over the ocean, while for the trajectories arriving over land evapotranspiration from land and mixing with moister air are dominant. The contribution of the moisture-increasing processes to the final deuterium excess also corresponds well to their respective , whereas no relation to can be found for the moisture-decreasing processes.
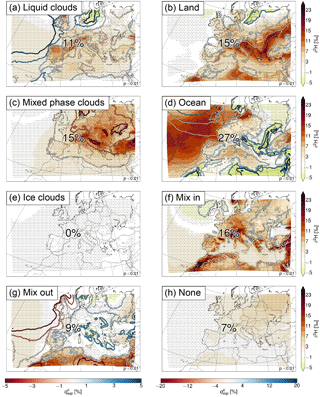
Figure 11Contributions of the processes to the daily Δδ2H in Fig. 10c. The numbers show the mean contribution of each process, and the contours show the difference in (see Eqs. 10 and 11) between the high and low anomaly days in %. Stippling indicates areas where p<0.01. Note the different colour scales for between the left- and right-hand sides.
3.6 Variability in δ2H and deuterium excess
Figure 10 shows the difference in the anomalies of δ2H with respect to the climatological mean between the 25 % of days and months and 33 % of years when they were highest and the 25 % of days and months and 33 % of years when they were lowest. Stippling indicates where the probability of obtaining the difference between the two samples (high and low) by chance is p<1 %. p was calculated from a two-sided t test for the null hypothesis that the samples have identical mean values. The difference in δ2H is larger over land than over ocean with values above 38 ‰ for the daily, above 19 ‰ for the monthly, and above 4.75 ‰ for the yearly anomalies (Fig. 10a). This means that the variability in δ2H is larger over land than over ocean. Apart from the scale divided by 2 and 8 for the monthly and yearly compared to the daily anomalies, the three spatial patterns are very similar. Also here, the pattern of Δδ2H depends on both qexp and δ2H. Thus, a positive anomaly in Δδ2H can imply a higher δ2H and/or a lower qexp.
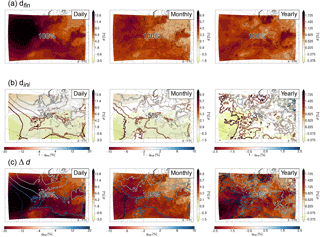
Figure 12Difference in deuterium excess between the high and low anomaly days (left), months (middle), and years (right) at each grid point. (a) Shows the mean deuterium excess in water vapour averaged over the first, third, and fifth lowest model level and (b, c) show the weighted contributions of the initial values and the changes along the trajectories, respectively. The numbers show the mean contribution of each term to dfin, and the contours show the difference in 1−qexp (b) and qexp (c) in %. Stippling indicates areas where p<0.01. Note the different colour scales.
For these anomalies, the contribution of the initial values (δ2Hini; Fig. 10b) is smaller and the contribution of the changes along the trajectories (Δδ2H; Fig. 10c) is larger than for the climatological mean δ2Hfin (cf. Fig. 7). The changes along the trajectories on average account for 66, 75, and 62 % of the daily, monthly, and yearly anomalies, respectively. This means that they are mainly responsible for the observed variability of δ2H. The δ2H anomalies resulting from the changes along the trajectories can again be separated into the different processes (Fig. 11). The results for the daily, monthly, and yearly anomalies are very similar, and we therefore only show results for the daily anomalies here (see Figs. S1 and S2 in the Supplement for the monthly and yearly anomalies, respectively). The contributions of the different processes show a large spatial variability. Over the ocean, the main reason for the higher δ2H is the higher δ2H values during evaporation from the ocean, since the difference in is small (Fig. 11d). Evaporation from the ocean leads to a negative anomaly at the coasts of the Mediterranean, Black Sea, and partly the North Atlantic. Here this is due to the higher fraction of moisture coming from the ocean on days with high δ2H (and not due to lower δ2H, as can be seen from the positive difference in from ocean evaporation in these regions). For the same areas the fraction of moisture coming from evapotranspiration from land is lower, resulting in a positive anomaly for this process (Fig. 11b), which compensates the negative anomaly from evaporation from the ocean. Over the Atlas mountains, the negative anomaly is compensated by mixing with moister air (Fig. 11f). Hence these trajectories experience more evaporation from the ocean and less evapotranspiration from land and mixing on days with high δ2H. Over other parts of Europe, the high δ2H anomalies are a mixture of contributions from mixed phase and liquid cloud formation (less mixed phase and more liquid clouds associated with weaker fractionation and thus higher δ2H), evaporation from the ocean, evapotranspiration from land, and mixing with moister air. Especially noteworthy is the large contribution of mixed phase clouds to the δ2H anomalies (on average 15 %; Fig. 11c) in comparison to their small influence on the climatological mean δ2H (on average 3 %; see Fig. 8c). Mixing with drier air is mostly relevant over north Africa. Ice clouds have no influence, and the time steps for which no process was assigned contribute slightly positively to the anomalies over Europe.
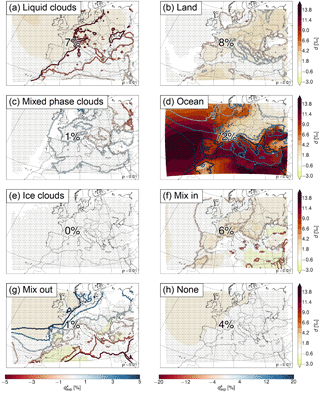
Figure 12 shows the difference between the high and low anomaly composites for deuterium excess. Here the difference is larger over ocean than over land, especially on the daily timescale (Fig. 12a), hence, the variability is larger over the ocean. The initial values contribute slightly negatively to the daily, monthly, and yearly deuterium excess anomalies (Fig. 12b). As a consequence, the changes along the trajectories contribute with more than 100 % to the anomalies (Fig. 12c), and are therefore able to fully explain the variability in deuterium excess.
Separation of these changes into the different processes shows less spatial variability than for the δ2H anomalies, and a clear dominance of one process, which is evaporation from the ocean (Fig. 13 for the daily anomalies; Figs. S3 and S4 for the monthly and yearly anomalies, respectively). It contributes with 72 % on average to the daily anomalies, and with 82 % over the ocean. This is primarily due to the larger moisture input from the ocean (positive difference in Fig. 13d) due to lower relative humidity and stronger evaporation (which is likely related to the lower amount of liquid clouds over the ocean, i.e. the negative difference in Fig. 13a). Over land, the formation of liquid clouds, evapotranspiration from land, and mixing with moister air are similarly important as evaporation from the ocean. Mixed phase clouds, ice clouds, mixing with drier air, and the time steps for which no process is assigned are of minor importance for deuterium excess variability.
This study presents a new Lagrangian method, which quantitatively decomposes the isotopic composition of water vapour into contributions from meteorological processes that occurred during the transport of air parcels, and may help interpreting isotope measurements at different locations across the world. Here, the method was applied to a 30-year climatological COSMOiso simulation over Europe. COSMOiso reproduced the mean and variability of δ2H in GNIP measurements remarkably well, and led to an improvement compared to the global model ECHAMwiso. This is in accordance with previous studies that demonstrated the added value of regional high-resolution simulations of stable water isotopes (e.g. Sturm et al., 2007; Pfahl et al., 2012). Here we limited the evaluation to GNIP measurements in precipitation, and therefore cannot completely rule out compensating errors of different fractionation processes. However, Christner et al. (2018) validated a similar climatological simulation with COSMOiso over Europe against measurements in water vapour as well as GNIP measurements and found that the model reproduces δ2H in water vapour even more accurately than δ2H from the GNIP measurements. Thus, we are confident that COSMOiso represents the influence of the different meteorological processes on δ2H in a realistic way. The deuterium excess, being more sensitive to nonequilibrium fractionation processes, is more difficult to simulate than δ2H and the correlations between the modelled and measured values were lower. This means that the imprint of meteorological processes on deuterium excess could potentially be biased and therefore the results for deuterium excess have to be taken more cautiously. Nevertheless, the nicely matched statistical distribution of the modelled and measured values shows that COSMOiso is able to cover a representative range of deuterium excess values.
Decomposing δ2H and deuterium excess in near-surface water vapour into the different processes showed that the relative contributions of the processes vary strongly in space, and that the variability in the isotope signal is not always governed by the same processes as the mean. On average, the moisture increasing processes (ocean evaporation, land evapotranspiration, mixing with moister air) primarily determine both δ2H and deuterium excess. The moisture decreasing processes (formation of liquid clouds, mixed phase clouds, ice clouds and mixing with drier air) had smaller contributions, but some of them (e.g. the formation of mixed phase clouds) were important for the variability. Ocean evaporation and land evapotranspiration were dominant especially for the deuterium excess, which is in line with its common application as a proxy for moisture source conditions (e.g. Jouzel et al., 1982; Steffensen et al., 2008; Aemisegger et al., 2014). In the current setting with the starting points of the backward trajectories at low levels, all air parcels descend towards the end (except those having their starting point on a mountain). This means that they tend to take up moisture towards the end, which overwrites previous signals from other processes. This may explain why the moisture increasing processes are more important than the moisture decreasing processes. In future research we will investigate how the results change for trajectories started from higher levels.
A limitation of the study is the binary distinction between processes based on thresholds, which assumes that only one process occurs per time step. With a time step of 1 hour, this is not very realistic. For example, it could happen that an air parcel loses moisture by precipitation but at the same time takes up new moisture from evaporation. This would mean that either the contribution of cloud formation or of evaporation is underestimated, depending on the net change in specific humidity. At the same time it would lead to an overestimation of processes occurring earlier during the transport of the air parcel, since they are not discounted during the hidden moisture loss. This has been shown in a similar way by Beusch (2017), who performed a moisture source analysis with trajectories based on different temporal resolutions and found a tendency towards more local moisture sources with increasing temporal resolution due to larger fluctuations in specific humidity and stronger discounting of earlier moisture uptakes. However, the amount of noise also increases with increasing temporal resolution, leading to unrealistically many moisture uptakes and losses on short timescales. Thus, it is not sure whether a higher temporal resolution would improve the estimate of the contributions of the different meteorological processes. The sensitivity of the results to the selection of thresholds (specifically LSM and h) has been tested for 1 year and two locations by Meyer (2016). As can be expected, changing the LSM threshold from LSM≤0.75 to LSM≤0.5 leads to a larger contribution of land evapotranspiration and a smaller contribution of ocean evaporation, while changing the h threshold from h≥80 % to h≥70 % leads to a larger contribution of cloud formation and a smaller contribution of mixing with drier air. However, the differences are small, and the patterns are qualitatively very similar. We abstained from performing sensitivity tests in the 30-year simulation, not least due to limited computational resources.
Furthermore, one aspect that is currently not accounted for is rain evaporation and equilibration. This process is especially important for the isotopic composition of precipitation; however, it can also influence water vapour (e.g. Aemisegger et al., 2015). In future research the distinction between rain evaporation and equilibration and mixing or evaporation from the surface could be made by additionally tracing liquid cloud water and rain along the trajectories, and categorizing a time step as rain evaporation and equilibration if rain is present but no liquid cloud water. However, for this purpose, a higher temporal resolution of the trajectories would be required.
We have presented a Lagrangian process attribution of isotopic variations in water vapour, which follows air parcel trajectories and assigns all isotopic changes during transport to a meteorological process. In this way, we quantified the imprint of the processes on the isotopic composition of near-surface water vapour in a 30-year climatological simulation using the regional isotope-enabled model COSMOiso with lateral boundary conditions from ECHAMwiso. The main findings of the study can be summarized as follows:
-
Nesting COSMOiso within ECHAMwiso improves the representation of δ2H and deuterium excess when validated against GNIP measurements, underlining the added value of simulating stable water isotopes with high spatial resolutions.
-
More than half of the mean and variability in δ2H and deuterium excess in near-surface water vapour can be explained with the help of 7-day backward trajectories, meaning that they are determined by processes occurring during the previous 7 days and within the simulation domain.
-
The relative contributions of the processes vary strongly in space. On average, evaporation from the ocean is the primary factor controlling δ2H and deuterium excess for trajectories arriving over the ocean, while evapotranspiration from land and mixing with moister air are similarly important for trajectories arriving over land.
-
Liquid and mixed phase cloud formation contribute to the variability in δ2H and deuterium excess, especially over continental Europe.
The Lagrangian process attribution is a new, quantitative method for better understanding the linkage between the meteorological history of air parcels and their isotopic composition. It can be applied to any Eulerian model simulation in any region of the world to provide insight into the characteristics of different processes and support the interpretation of isotope measurements in water vapour (and precipitation).
COSMOiso output data are available from the authors upon request (marina.duetsch@env.ethz.ch).
The supplement related to this article is available online at: https://doi.org/10.5194/acp-18-1653-2018-supplement.
The authors declare that they have no conflict of interest.
This work was supported by a grant from the Swiss National Supercomputing
Centre (CSCS) under project ID s520. We would like to thank Martin Werner for
providing the ECHAMwiso data, the IAEA/WMO for providing the GNIP data, and
Hui Tang and Emanuel Christner for the help with setting up COSMOiso in
climate mode. Moreover we are grateful to two anonymous reviewers for their
constructive comments, which helped to clarify the manuscript.
Edited by: Jørgen Brandt
Reviewed by: two
anonymous referees
Adcock, R. J.: A problem in least squares, Analyst, 5, 53–54, https://doi.org/10.2307/2635758, 1878. a
Aemisegger, F., Pfahl, S., Sodemann, H., Lehner, I., Seneviratne, S. I., and Wernli, H.: Deuterium excess as a proxy for continental moisture recycling and plant transpiration, Atmos. Chem. Phys., 14, 4029–4054, https://doi.org/10.5194/acp-14-4029-2014, 2014. a, b
Aemisegger, F., Spiegel, J. K., Pfahl, S., Sodemann, H., Eugster, W., and Wernli, H.: Isotope meteorology of cold front passages: A case study combining observations and modeling, Geophys. Res. Lett., 42, 5652–5660, https://doi.org/10.1002/2015GL063988, 2015. a
Beusch, L.: Towards moisture sources analysis using online trajectories in convection-resolving simulations, MSc Thesis, ETH Zurich, Zurich, Switzerland, 2017. a
Blossey, P. N., Kuang, Z., and Romps, D. M.: Isotopic composition of water in the tropical tropopause layer in cloud-resolving simulations of an idealized tropical circulation, J. Geophys. Res., 115, D24309, https://doi.org/10.1029/2010JD014554, 2010. a, b
Butzin, M., Werner, M., Masson-Delmotte, V., Risi, C., Frankenberg, C., Gribanov, K., Jouzel, J., and Zakharov, V. I.: Variations of oxygen-18 in West Siberian precipitation during the last 50 years, Atmos. Chem. Phys., 14, 5853–5869, https://doi.org/10.5194/acp-14-5853-2014, 2014. a
Christner, E., Kohler, M., and Schneider, M.: The influence of snow sublimation and meltwater evaporation on δD of water vapor in the atmospheric boundary layer of central Europe, Atmos. Chem. Phys., 17, 1207–1225, https://doi.org/10.5194/acp-17-1207-2017, 2017. a
Christner, E., Aemisegger, F., Pfahl, S., Werner, M., Cauquoin, A., Schneider, M., Hase, F., Barthlott S., and Schädler G.: The climatological footprints of continental surface evaporation, rainout, and sub-cloud processes in δD of water vapor and precipitation in Europe, J. Geophys. Res., revised, 2018. a, b
Craig, H. and Gordon, L. I.: Deuterium and oxygen 18 variations in the ocean and the marine atmosphere, in: Stable isotopes in oceanographic studies and paleo-temperatures, Lab. Geol. Nucl., Pisa, Italy, 9–130, 1965. a
Dansgaard, W.: Stable isotopes in precipitation, Tellus, 16, 436–468, https://doi.org/10.3402/tellusa.v16i4.8993, 1964. a
Doms, G., Förstner, J., Heise, E., Herzog, H.-J., Mironov, D., Raschendorfer, M., Reinhardt, T., Ritter, B., Schrodin, R., Schulz, J.-P., and Vogel, G.: A description of the nonhydrostatic regional COSMO model. Part II: Physical parameterization, Deutscher Wetterdienst, Offenbach, Germany, 2011. a
Dütsch, M.: Stable water isotope fractionation processes in weather systems and their influence on isotopic variability on different time scales, PhD thesis, ETH Zurich, Zurich, Switzerland, https://doi.org/10.3929/ethz-b-000000058, No. 23939, 2016. a
Gat, J. R., Klein, B., Kushnir, Y., Roether, W., Wernli, H., Yam, R., and Shemesh, A.: Isotope composition of air moisture over the Mediterranean Sea: an index of the air–sea interaction pattern, Tellus B, 55, 953–965, https://doi.org/10.1034/j.1600-0889.2003.00081.x, 2003. a
Helsen, M. M., Van de Wal, R. S. W., and Van den Broeke, M. R.: The isotopic composition of present-day Antarctic snow in a Lagrangian atmospheric simulation, J. Climate, 20, 739–756, https://doi.org/10.1175/JCLI4027.1, 2007. a
IAEA/WMO: Global Network of Isotopes in Precipitation, the GNIP database, available at: http://www.iaea.org/water, 2016. a
Jacob, H. and Sonntag, C.: An 8-year record of the seasonal variation of 2H and 18O in atmospheric water vapour and precipitation at Heidelberg, Germany, Tellus B, 43, 291–300, https://doi.org/10.1034/j.1600-0889.1991.t01-2-00003.x, 1991. a
Joussaume, S., Jouzel, J., and Sadourny, R.: Water isotope cycles in the atmosphere: First simulation using a general circulation model, Nature, 311, 24–29, 1984. a
Jouzel, J., Merlivat, L., and Lorius, C.: Deuterium excess in an East Antarctic ice core suggests higher relative humidity at the oceanic surface during the last glacial maximum, Nature, 299, 688–691, 1982. a
Meyer, M.: Fraktionierungsprozesse entlang von Trajektorien, BSc Thesis, ETH Zurich, Zurich, Switzerland, 2016. a
Moore, M., Kuang, Z., and Blossey, P. N.: A moisture budget perspective of the amount effect, Geophys. Res. Lett., 41, 1329–1335, https://doi.org/10.1002/2013GL058302, 2014. a
Noone, D. and Sturm, C.: Comprehensive dynamical models of global and regional water isotope distributions, in: Isoscapes, Springer, Dordrecht, the Netherlands, 195–219, https://doi.org/10.1007/978-90-481-3354-3_10, 2010. a
Pfahl, S. and Sodemann, H.: What controls deuterium excess in global precipitation?, Clim. Past, 10, 771–781, https://doi.org/10.5194/cp-10-771-2014, 2014. a
Pfahl, S. and Wernli, H.: Lagrangian simulations of stable isotopes in water vapor: An evaluation of nonequilibrium fractionation in the Craig-Gordon model, J. Geophys. Res., 114, D20108, https://doi.org/10.1029/2009JD012054, 2009. a
Pfahl, S., Wernli, H., and Yoshimura, K.: The isotopic composition of precipitation from a winter storm – a case study with the limited-area model COSMOiso, Atmos. Chem. Phys., 12, 1629–1648, https://doi.org/10.5194/acp-12-1629-2012, 2012. a, b, c, d, e
Risi, C., Bony, S., Vimeux, F., and Jouzel, J.: Water-stable isotopes in the LMDZ4 general circulation model: Model evaluation for present-day and past climates and applications to climatic interpretations of tropical isotopic records, J. Geophys. Res., 115, D12118, https://doi.org/10.1029/2009JD013255, 2010. a
Risi, C., Landais, A., Winkler, R., and Vimeux, F.: Can we determine what controls the spatio-temporal distribution of d-excess and 17O-excess in precipitation using the LMDZ general circulation model?, Clim. Past, 9, 2173–2193, https://doi.org/10.5194/cp-9-2173-2013, 2013. a
Scott, D. W.: Multivariate density estimation: theory, practice, and visualization, John Wiley & Sons, New York, NJ, USA, 1992. a
Sinclair, K. E., Marshall, S. J., and Moran, T. A.: A Lagrangian approach to modelling stable isotopes in precipitation over mountainous terrain, Hydrol. Process., 25, 2481–2491, https://doi.org/10.1002/hyp.7973, 2011. a
Sodemann, H., Masson-Delmotte, V., Schwierz, C., Vinther, B. M., and Wernli, H.: Interannual variability of Greenland winter precipitation sources: 2. Effects of North Atlantic Oscillation variability on stable isotopes in precipitation, J. Geophys. Res., 113, D12111, https://doi.org/10.1029/2007JD009416, 2008a. a
Sodemann, H., Schwierz, C., and Wernli, H.: Interannual variability of Greenland winter precipitation sources: Lagrangian moisture source diagnostic and North Atlantic Oscillation influence, J. Geophys. Res., 113, D03107, https://doi.org/10.1029/2007JD008503, 2008b. a, b
Sprenger, M. and Wernli, H.: The LAGRANTO Lagrangian analysis tool – version 2.0, Geosci. Model Dev., 8, 2569–2586, https://doi.org/10.5194/gmd-8-2569-2015, 2015. a
Steffensen, J. P., Andersen, K. K., Bigler, M., Clausen, H. B., Dahl-Jensen, D., Fischer, H., Goto-Azuma, K., Hansson, M., Johnsen, S. J., Jouzel, J., Masson-Delmotte, V., Popp, T., Rasmussen, S. O., Röthlisberger, R., Ruth, U., Stauffer, B., Siggaard-Andersen, M.-L., Sveinbjörnsdóttir, Á. E., Svensson, A., and White, J. W. C.: High-resolution Greenland ice core data show abrupt climate change happens in few years, Science, 321, 680–684, https://doi.org/10.1126/science.1157707, 2008. a
Steppeler, J., Doms, G., Schättler, U., Bitzer, H., Gassmann, A., Damrath, U., and Gregoric, G.: Meso-gamma scale forecasts using the nonhydrostatic model LM, Meteorol. Atmos. Phys., 82, 75–96, https://doi.org/10.1007/s00703-001-0592-9, 2003. a, b
Sturm, C., Hoffmann, G., and Langmann, B.: Simulation of the stable water isotopes in precipitation over South America: Comparing regional to global circulation models, J. Climate, 20, 3730–3750, https://doi.org/10.1175/JCLI4194.1, 2007. a
Sturm, K., Hoffmann, G., Langmann, B., and Stichler, W.: Simulation of delta O-18 in precipitation by the regional circulation model REMOiso, Hydrol. Process., 19, 3425–3444, https://doi.org/10.1002/hyp.5979, 2005. a
Tiedtke, M.: A comprehensive mass flux scheme for cumulus parameterization in large-scale models, Mon. Weather Rev., 117, 1779–1800, https://doi.org/10.1175/1520-0493(1989)117<1779:ACMFSF>2.0.CO;2, 1989. a
Werner, M., Langebroek, P. M., Carlsen, T., Herold, M., and Lohmann, G.: Stable water isotopes in the ECHAM5 general circulation model: Toward high-resolution isotope modeling on a global scale, J. Geophys. Res., 116, D15109, https://doi.org/10.1029/2011JD015681, 2011. a, b
Yoshimura, K., Frankenberg, C., Lee, J., Kanamitsu, M., Worden, J., and Röckmann, T.: Comparison of an isotopic atmospheric general circulation model with new quasi-global satellite measurements of water vapor isotopologues, J. Geophys. Res., 116, D19118, https://doi.org/10.1029/2011JD016035, 2011. a


