the Creative Commons Attribution 4.0 License.
the Creative Commons Attribution 4.0 License.
 | 21 Nov 2018
Dominant contribution of oxygenated organic aerosol to haze particles from real-time observation in Singapore during an Indonesian wildfire event in 2015
Sri Hapsari Budisulistiorini
Matthieu Riva
Michael Williams
Takuma Miyakawa
Jing Chen
Masayuki Itoh
Jason D. Surratt
Mikinori Kuwata
Recurring transboundary haze from Indonesian wildfires in previous decades significantly elevated particulate matter (PM) concentrations in Southeast Asia. During that event on 10 to 31 October 2015, we conducted a real-time observation of non-refractory submicron PM (NR-PM1) in Singapore using an Aerodyne aerosol mass spectrometer. Simultaneously, we characterized carbonaceous components and organic aerosol (OA) tracers from fine PM (PM2.5) samples to support source apportionment of the online measurements. The real-time analysis demonstrated that OA accounted for approximately 80 % of NR-PM1 mass during the wildfire haze period. Source apportionment analysis applied to the OA mass spectra using the multilinear-engine (ME-2) approach resulted in four factors: hydrocarbon-like OA (HOA), biomass burning OA (BBOA), peat burning OA (PBOA), and oxygenated OA (OOA). The OOA can be considered as a surrogate of both secondary organic aerosol (SOA) and oxidized primary organic aerosol (OPOA), while the other factors are considered as surrogates of primary organic aerosol (POA). The OOA accounted for approximately 50 % of the total OA mass in NR-PM1, while POA subtypes from wildfires (BBOA and PBOA) contributed to approximately 30 % of the total OA mass. Our findings highlight the importance of atmospheric chemical processes, which likely include POA oxidation and SOA formation from oxidation of gaseous precursors, to the OOA concentration. As this research could not separately quantify the POA oxidation and SOA formation processes, further studies should attempt to investigate the contribution of gaseous precursor oxidation and POA aging to the OOA formation in wildfire plumes.
- Article
(1859 KB) - Full-text XML
-
Supplement
(4102 KB) - BibTeX
- EndNote


Transboundary haze caused by wildfires has been a recurring issue in Southeast Asia for the past few decades, causing economic and health problems (Atwood et al., 2013; Engling et al., 2014; Heil and Goldammer, 2001; Nichol, 1997, 1998; Pavagadhi et al., 2013). Haze occurrence has been associated with anomalously low precipitation induced by the El Niño Southern Oscillation and the Indian Ocean Dipole (Field et al., 2009, 2016; Gaveau et al., 2015). Wildfires are especially pronounced in Indonesian tropical rainforests and peatlands due to land clearing activities, including the extensive development of agricultural activities (Dennis et al., 2005; Murdiyarso et al., 2004; Siegert et al., 2001). During the 1997 El Niño period, the wildfires in Indonesia consumed both peat and surface vegetation and caused a severe transboundary haze (Heil and Goldammer, 2001).
A prolonged wildfire event occurred in Indonesia during September and October 2015, coinciding with an intense El Niño period (Field et al., 2016). The scale of this 2015 wildfire is thought to be the largest after the wildfire event in 1997, and was estimated to release 227 Tg of carbon into the atmosphere (Huijnen et al., 2016). These carbon emissions in 2015 were at least on an order of magnitude larger than those emitted by the 2013 wildfires in Indonesia (31 Tg of carbon; Gaveau et al., 2015), although lower than 800–2500 Tg of carbon released from the wildfire in 1997 (Page et al., 2002). By using atmospheric chemistry transport models, previous studies calculated the excess mortality rate associated with the 2015 wildfire haze to be between 11 000 to 100 000 individuals across Indonesia, Malaysia, and Singapore (Crippa et al., 2016; Koplitz et al., 2016). These model estimations already consider emission, atmospheric processing, and removal of gas and particulate matter (PM) emitted by the wildfires. However, atmospheric processing of aerosol particles in haze from Indonesian wildfires has scarcely been investigated. This lack of study inhibits a detailed treatment of atmospheric chemical processes in the models, including aerosol aging and secondary aerosol formation. Laboratory studies have shown that atmospheric processing of biomass burning smoke resulted in organic aerosol (OA) enhancement due to secondary organic aerosol (SOA) formation (Cubison et al., 2011; Ortega et al., 2013). Although SOA has been shown to significantly contribute to OA concentration in other parts of the world (e.g., Huang et al., 2014; Weber et al., 2007), the contribution of SOA formation in haze particles from wildfires in the Southeast Asia has never been quantified.
Online aerosol measurement techniques, such as the aerosol mass spectrometer (AMS) and the aerosol chemical speciation monitor (ACSM) developed by Aerodyne Inc., are useful for investigating atmospheric processing of aerosol particles, due to their high time resolution for chemical characterization of bulk aerosol composition (Jayne et al., 2000; Ng et al., 2011a). These techniques quantify the chemical characteristics of bulk OA, allowing further multivariate factor analysis of the mass spectra matrix by positive matrix factorization (PMF) (Ulbrich et al., 2009; Q. Q. Zhang et al., 2011) or multilinear engine (ME-2) solvers (Canonaco et al., 2013; Crippa et al., 2014). These multivariate factor analyses have been shown to be useful for identifying sources and atmospheric processes of OA, especially when combined with offline analytical techniques providing the molecular-level chemical composition (e.g., Budisulistiorini et al., 2013; Zhang et al., 2005a).
In this study, we conducted an atmospheric observation of haze particles in Singapore induced by Indonesian wildfires using the time-of-flight ACSM (ToF-ACSM) from 10 to 31 October 2015. We characterized subtypes of ambient OA in the non-refractory PM1 (NR-PM1) using the Source Finder (SoFi) interface for the ME-2. In addition to the real-time measurements, we collected integrated filter samples over the course of the haze episode for elemental, organic, and water-soluble organic carbon (EC, OC, and WSOC) analysis as well as molecular-level chemical characterization of OA constituents. Data from the ToF-ACSM and offline chemical analysis were combined for identifying and quantifying OA sources. We demonstrated in this study that Indonesian wildfires influenced the increasing NR-PM1 and OA concentrations in Singapore, and atmospheric chemical processing likely contributed significantly to the total OA.
2.1 Measurement site
We conducted the 2015 haze measurement from 10 to 31 October 2015 on the fourth floor of the North Spine building at Nanyang Technological University (NTU), Singapore (1.3483∘ N, 103.6831∘ E). Forested areas are located less than 1 km north, west, and southwest of the sampling location. Jurong Island, where many chemical industries and petroleum refineries are located, is situated approximately 7 km south of the observation site. Traffic in the NTU campus is dominated by passenger vehicles and public transportation.
2.2 Real-time measurements by the ToF-ACSM
Ambient NR-PM1 was measured continuously from 10 to 31 October 2015. Aerosols were drawn through 150 cm × 0.925 cm of outer diameter (0.622 cm of inner diameter) copper tubes from a PM2.5 cyclone (URG Corporation, North Carolina). The residence time for PM2.5 in the sampling inlet was ∼1 s at a sampling flow rate of 3 L min−1. Aerosol-laden air was dried using an Aerodyne dryer module consisting of a multi-tube Nafion dryer (Perma Pure, New Jersey), which was operated in reflux mode. Under these operating conditions, the dried sampling flow for the ToF-ACSM was recycled as the sheath flow for the dryer to maintain the relative humidity (RH) of the sample below 20 %. The aerodynamic lens mounted in the ToF-ACSM allowed only PM1 to penetrate into the vacuum chamber (Fröhlich et al., 2013, 2015). The ToF-ACSM has mass-to-charge resolution and can measure up to m∕z 300. Data were obtained with a time resolution of 200 s using IgorDAQ v2.0.20 and the data were analyzed by Tofware version 2.5.6 written in Igor Pro (Wave Metrics Inc., Lake Oswego, Oregon). We calibrated the sampling flow rate, ionization efficiency (IE) of nitrate, and relative IE (RIE) of ammonium and sulfate before and after the campaign. The calibration results before and after the campaign were consistent. A composition-dependent collection efficiency (Middlebrook et al., 2012) factor of approximately 0.5 (0.49±0.17) was applied and confirmed by plotting total NR-PM1 mass concentration measured by the ToF-ACSM against PM2.5 mass concentration published on the website of the National Environment Agency (NEA) of Singapore (Fig. S1 in the Supplement). The orthogonal linear regression analysis yielded a slope of 0.66±0.01. We estimated PM1 mass concentration by adding a concentration of EC from integrated sample measurements (details in Sect. 2.4.1) to the NR-PM1 mass concentration. The orthogonal linear regression analysis of PM1 versus PM2.5 yielded a slope of 0.73±0.05. A previous observation in Singapore during the haze episode showed that aerosol particles mainly compose of submicron particles (size range of ≤1.0 µm) and only 1 %–4 % of the fine aerosol mass is in the size range of 1.0–2.5 µm (Betha et al., 2014). Hence, the mass difference found in this study (20 %–30 %) could not solely be attributed to particles with an aerodynamic diameter between 1 and 2.5 µm that were not measured in this study. A possible cause is the collection efficiency of the ToF-ACSM system, which is similar to AMS system, decreases for particle sizes larger than 550 nm (Jayne et al., 2000). On the other hand, particles in the size range of 0.5–1.0 µm were a notable contributor (8 %–17 %) to the total fine aerosol mass during the haze episode (Betha et al., 2014). Hence, the low collection efficiency for size ranges of 0.5–1.0 µm might cause the ToF-ACSM measured less PM1 mass than previous observation (∼97 % of PM2.5 mass; Betha et al., 2014).
2.3 ME-2 analysis
The time series of OA mass spectra were deconvolved using an ME-2 solver, Source Finder (SoFi) tool version 6.2 written in Igor Pro (Canonaco et al., 2013). Details of the ME-2 analysis are described elsewhere (Canonaco et al., 2013; Crippa et al., 2014; Elser et al., 2016; Fröhlich et al., 2015) as well as in the Supplement (Sect. B). Briefly, a solution was first explored without any a priori information, meaning that no reference mass spectra were provided as constraints. Subsequently, mass spectra which originated from previous field and laboratory observations were introduced to constrain one or more solution spectra. The strength of the constraints was adjusted by varying the degree of freedom (a value).
In this study, mass spectra from ambient measurements, such as hydrocarbon-like OA (HOA) and biomass burning OA (BBOA) (Ng et al., 2011c) and laboratory-generated peat burning OA (PBOA; Budisulistiorini et al., 2017a), were employed to allow each factor to vary within a specific range. The factor solution variability (a value) ranged between 0 and 0.3 (with a 0.05 step) from the constraint or reference values. The optimum factors solution was selected by evaluating Q∕Qexp. Q is the sum of the squared residuals weighted by their respective uncertainties (i.e., measurement and model), and Qexp is the degree of freedom of the model solution calculated based on the size of the data matrix and the number of factors (Canonaco et al., 2013; Ulbrich et al., 2009). The optimum factor solution was also examined by their correlations with chemical tracers and reference mass spectra. Analysis of the solutions is described in the Supplement (Tables S1–S4; Figs. S2–S4).
2.4 Integrated sample analyses
Ambient aerosols were sampled through a PM2.5 cyclone (URG, North Carolina) at a total flow rate of approximately 16.7 L min−1 connected to two 47 mm filter holders. The first filter holder was operated at a flow rate of 4 L min−1 for ∼24 h (starting around 08:00 LT, local time) on 14, 15, and 19–23 October 2015. This filter holder hosted 47 mm quartz fiber filters, which were pre-combusted at 900 ∘C for 3 h. Single-filter and dual-filter samples (consisting of front and back filters) were collected alternately over 8 days. In total, only samples for 8 days were collected because of a limited number of filters. These samples were analyzed for EC, OC, WSOC and inorganic ions, as described in Sect. 2.4.1.
The second filter holder was operated at a flow rate of 4.2 L min−1. The sampling duration was set to ∼24 h when average hourly PM2.5 reported on the NEA website was less than 50 µg m−3. The sampling duration was changed to ∼12 h (08:00–19:45 LT for daytime and 20:00–07:45 LT for nighttime) when average hourly PM2.5 was higher than 50 µg m−3. In total, 26 filter samples were collected. Particles were collected on 47 mm quartz fiber filters pre-baked at 250 ∘C for 16 h. The filters were baked at different temperature settings due to the availability of ovens. Filter samples from this second holder were analyzed for OA tracers, as described in Sect. 2.4.2. All samples were covered by pre-baked aluminum foil and stored at −20 ∘C until they were analyzed. In addition to particle samples, field blanks were collected by putting filters in the holders for 5–10 min when the sampling pump was turned off. Field blanks were stored in the same manner to those of particle samples until analysis.
2.4.1 OC, EC, WSOC, and inorganic ion analyses
EC and OC were quantified using a semicontinuous field type EC/OC analyzer (Sunset Laboratories Inc.), following the IMPROVE-A protocol (Miyakawa et al., 2015). The instrument was calibrated using a standard sucrose solution. The particulate OC was estimated by subtracting the back-filter OC from the front-filter OC, assuming that (1) particulate OC was collected by the front filter, and (2) the gas-phase OC was collected on both the front and back filters. Analysis of WSOC was performed using a total organic carbon (TOC) analyzer (Model 800, Sievers, Colorado), following extraction of a portion (8 mm in diameter) of filter samples by 10 mL of HPLC-grade water (Kanto Chemical Co. Inc., Tokyo, Japan) and using an orbital shaker for 21 h. The extracted sample solutions were filtered by syringe filters (PTFE; pore size 0.2 µm) prior to injection to the TOC analyzer. Possible interference of gaseous species on WSOC was also subtracted using the data from back filters, as in the case of the OC analysis.
Table 1Average concentrations with 1 standard deviation (SD) of chemical species measured during the October 2015 haze episode in Singapore using ToF-ACSM (online) and integrated filter samples (offline) measurements. Wind speed and precipitation data were retrieved from the website of the Meteorological Service Singapore, and other meteorological parameters were from measurement at the sampling location.
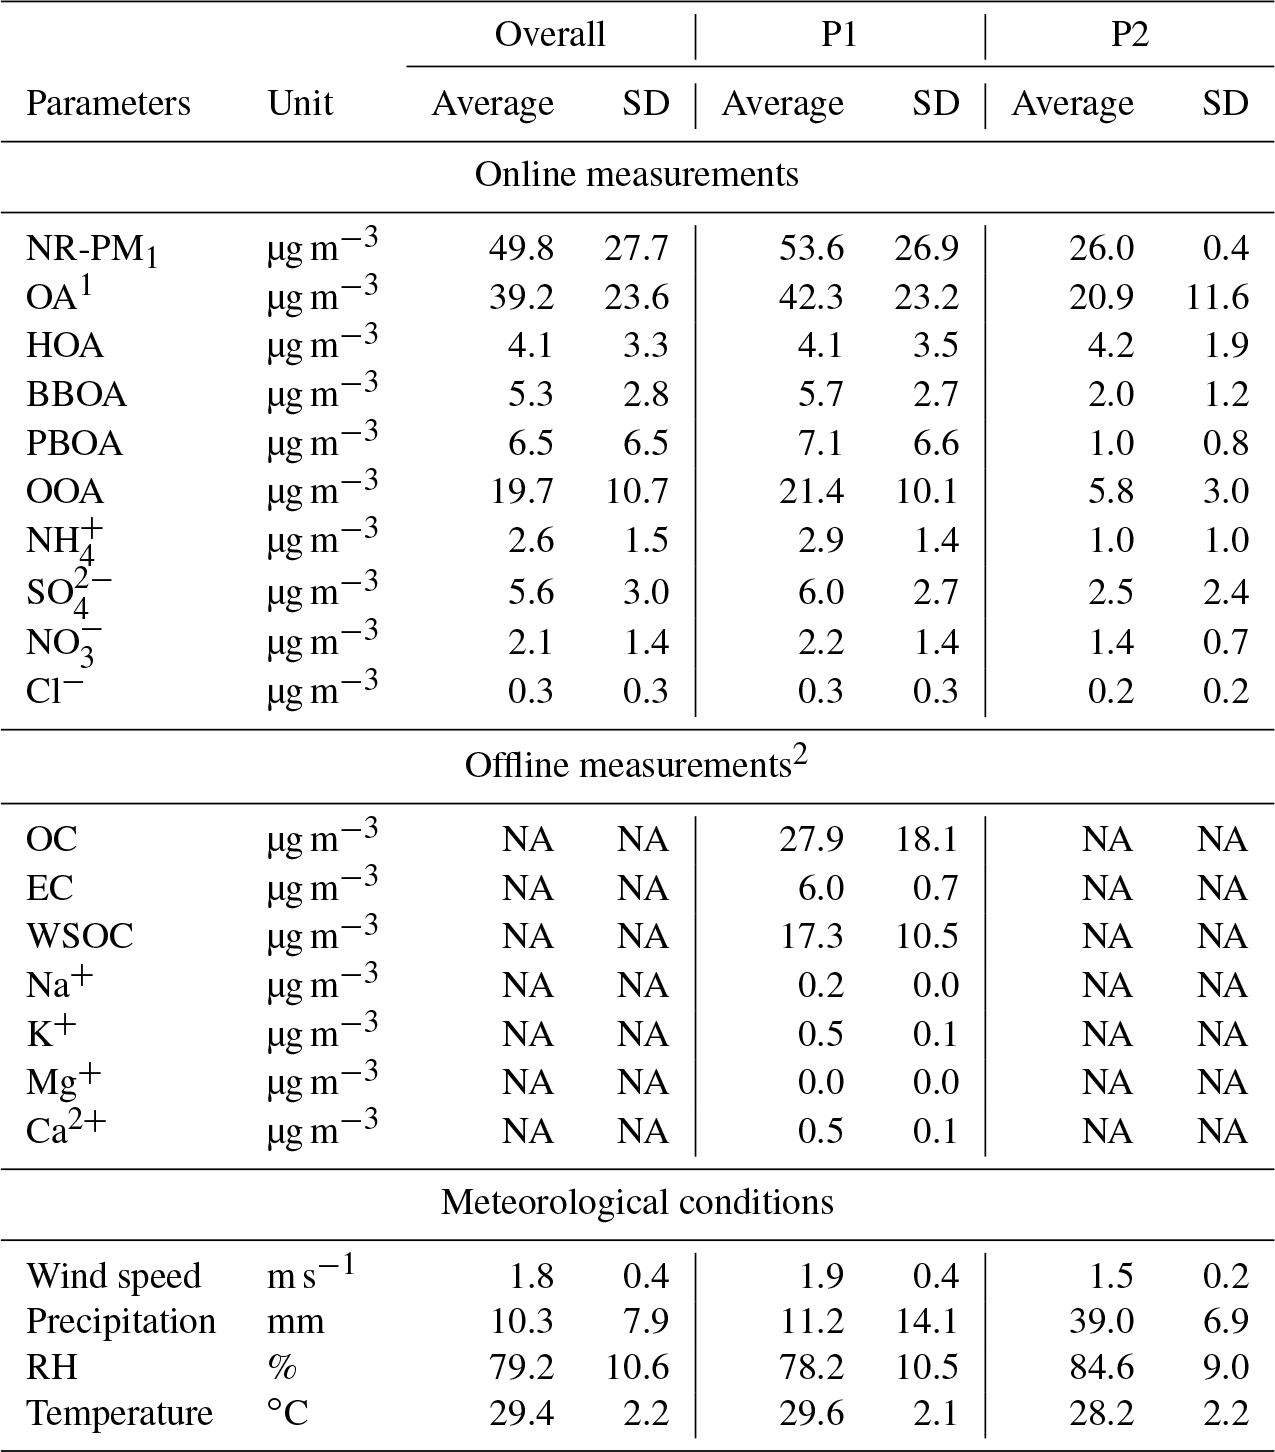
1 About 95 % of OA matrix was resolved into four components by the ME-2 analysis. 2 These measurements were conducted only during the P1 period. “NA” – not available.
For the inorganic ion analysis, a portion of the filter samples (1 cm ×1 cm) was soaked in a solvent (4.75 mL Milli-Q and 0.25 mL ethanol). Ions were extracted by ultrasonication for 15 min, filtered by syringe filters (hydrophilic polyvinylidene fluoride, PVDF; pore size 0.45 µm), and were subsequently analyzed using ion chromatography (IC, Dionex ICS 1000, Thermo Fisher Scientific K.K.) (Miyakawa et al., 2015). The measured OC, EC, WSOC, and inorganic ions are reported in Table 1. The inorganic ions were corrected for blank interference but not corrected for positive artifacts. We use the measured inorganic ions to identify the source of OA factors from the ME-2 analysis. Hence, we mainly compare the time trend of ions with the OA factors, and do not compare their absolute masses. Additionally, we only reported inorganic cations that are associated with particles emitted from peat and biomass burning, i.e., Na+, K+, Mg+, and Ca2+ (Iinuma et al., 2007). For other inorganic ions, such as sulfate and nitrate, we reported those measured by ToF-ACSM because they have a higher time resolution (∼3 min) than those measured in the integrated samples (sampling time ∼23 h).
2.4.2 OA tracer analysis by chromatographic techniques
The second set of samples was analyzed by gas and liquid chromatographic techniques interfaced to mass spectrometry for molecular-level analysis. Details of the chromatography techniques and some of the results for OA tracer analysis have been reported in Budisulistiorini et al. (2017a). Briefly, the liquid chromatography system consists of a ultra-performance liquid chromatograph coupled in line to both a diode array detector and high-resolution quadrupole time-of-flight mass spectrometer equipped with an electrospray ionization source (UPLC/DAD-ESI-HR-QTOFMS, hereafter called LC-MS; 6520 Series, Agilent, California) using a Waters ACQUITY UPLC HSS T3 column (2.1 mm ×100 mm, 1.8 µm particle size). The LC-MS samples were prepared using a quarter of the particle-laden filters. The samples were extracted by adding 22 mL of methanol (LC-MS CHROMASOLV-grade, Sigma-Aldrich, Missouri) and then sonication for 45 min at room temperature. To estimate recovery efficiency, ketopinic and camphor sulfonic acids were spiked onto a quarter of the filters prior to extraction for estimation of recovery efficiency. The methanol extracts were gently dried by blowing an N2 stream at room temperature. The dried extracts were reconstituted using 150 µL of methanol and were subsequently analyzed by the LC-MS operated in negative ionization mode. Details of the LC-MS operating conditions are described elsewhere (H. Zhang et al., 2011). Table S5 in the Supplement provides a list of standard compounds used for quantification of OA tracers.
The gas chromatograph was coupled in line to a mass spectrometer equipped with electron impact ionization (GC/EI-MS, hereafter called GC-MS; 5890 Hewlett Packard, HP, Series II gas chromatograph) and interfaced to an HP 5971A Series mass selective detector. An Econo-Cap™ EC-5 column (30 m ×0.25 mm ×0.25 µm) was used for the analysis. The GC-MS samples were extracted and dried in the same manner to the LC-MS samples. The dried extracts were trimethylsilylated by adding 100 µL of N,O-bis(trimethylsilyl)trifluoroacetamide (BSTFA) + trimethylchlorosilane (TMCS; 99:1, v∕v, Supelco, Sigma-Aldrich, Missouri) and 50 µL pyridine (Sigma-Aldrich, Missouri), and subsequently heated at 70 ∘C for 1 h. Within 24 h following trimethylsilylation, samples were analyzed by the GC-MS operating at 70 eV. Operating conditions and temperature program are described elsewhere (Surratt et al., 2010). Standards used for quantifying OA tracers by GC-MS are available in Table S6. Filter blanks were subtracted from the sample to account for artifacts that were not removed during the filter pre-baking process.
2.5 Elemental analysis
We measured elemental compositions (carbon, hydrogen, nitrogen, and sulfur) of peat and vegetation samples from Riau and Central Kalimantan, Indonesia, using a 2400 CHNS elemental analyzer (Perkin Elmer). Samples were dried at 105 ∘C for 16 h and subsequently pulverized. The instrument was calibrated using 2.5-Bis(5-tert-butyl-benzoxazol-2-yl)thiophene (BBOT) prior to the analysis. Table S7 lists the peat and vegetation samples that were analyzed for their elemental composition. In total, 11 samples were analyzed, including eight samples of peat and three samples of vegetation.
2.6 Public domain data and analysis
The NOAA HYSPLIT back-trajectory model (Rolph et al., 2017; Stein et al., 2015) was used for estimating the origins of air masses. The trajectories were calculated from the observation site at 200 and 500 m above ground level (a.g.l.) at 06:00 LT of each day during the entire measurement period. In addition, trajectories were also estimated for four time periods (06:00, 12:00, 18:00, and 00:00 LT) of 19 and 20 October from the observation site at 500 m a.g.l. Fire hotspots in Indonesia during October 2015 were retrieved from near-real-time (NRT) Moderate Resolution Imaging Spectroradiometer (MODIS) Thermal Anomalies/Fire Locations Collection 6 processed by the Land, Atmosphere Near real-time Capability for EOS (Earth Observing System) Fire Information for Resource Management System (LANCE-FIRMS, 2015). The air quality monitoring data, including 1 h PM2.5, 8 h CO, and NO2, from the website of the National Environment Agency (https://www.haze.gov.sg/, last access: 15 November 2018) were also used in the analysis. Meteorological data, including wind speed, precipitation, relative humidity (RH), and temperature, were obtained from the website of the Meteorological Service Singapore (http://www.weather.gov.sg/, last access: 13 June 2017).
3.1 Air mass back-trajectories
The back-trajectories of air masses during the haze episode in Singapore are shown in Fig. S5. Air masses originated from south and southeast of Singapore, likely carried haze from wildfires in Sumatra and Kalimantan, Indonesia. Towards the end of the sampling period (29–31 October) the wind direction shifted, transporting air masses from northeast and east of Singapore. Air masses during this period might have been more dominated by local emissions as well as regional emissions from Malaysia and the South China Sea (e.g., ship emissions and sea spray; Betha et al., 2014). Therefore, we classified the measurement period into P1 (for 10–28 October), and P2 (for 29–31 October) in accordance with the wind directions. The highest concentration of haze particles was observed during 19 and 20 October (hereafter referred to as the peak event). Back-trajectories of air masses arriving at Singapore during this period show that the air mass was influenced by wildfires in Kalimantan and Sumatra, Indonesia (Fig. S6).

Figure 1Time profiles of the meteorological parameters and aerosol concentrations. Daily (a) wind speed and (c) precipitation data retrieved from the Meteorological Service Singapore website, hourly (b) relative humidity (RH) and (c) temperature measured at NTU campus from 10 to 31 October 2015. (d) Time profiles of organic aerosol (OA), ammonium (), sulfate (), nitrate (), and chloride (Cl−) measured by the ToF-ACSM and total PM2.5 mass published on the National Environment Agency website. Pie charts of ToF-ACSM species contribution to the total NR-PM1 mass for (e) the overall, (f) P1 (10–28 October 2015), and (g) P2 (29–31 October 2015) periods are similarly color coded to the time profiles on plot (d). The shaded area in plot (d) is referred to as the peak event.
3.2 Time series of aerosol species and meteorological parameters
Figure 1a–c shows a time series of meteorological data. Wind speed and temperature measured at the sampling site during the P1 period were on average 1.9±0.4 m s−1 and 29.6±2.1 ∘C, respectively (Table 1). Wind speed and temperature during the P2 period were slightly lower than those of the P1 period, although the data of both periods agreed within 1 standard deviation. Average RH during the P1 period was 78.2±10.5 %, and average precipitation during the corresponding period was 11.2±14.1 mm day−1, which occurred between 24 and 28 October. This result suggests that precipitation and wet deposition were negligible for most of the P1 period. Both average RH (84.6 %) and precipitation (39.0 mm day−1) were higher during the P2 period. This enhanced precipitation could contribute to decreasing aerosol concentration during the P2 period, in addition to the termination of wildfires in Indonesia and the change of wind direction as indicated by back-trajectories and fire hotspots in Fig. S5.
Figure 1d shows a time series of mass concentration of aerosol species measured by the ToF-ACSM as well as PM2.5 reported by the NEA. The average NR-PM1 mass concentrations during P1 and P2 periods were 53.6 and 26.0 µg m−3, respectively (Table 1). The highest concentration of NR-PM1 was observed during the P1 period accounting for 312.6 µg m−3 on 19 October around 22:00 LT. OA was the major contributor to the ambient submicron aerosol, accounting for ∼80 % of the NR-PM1, as shown in Fig. 1e–g. During the P1 period, OA reached the maximum concentration of 264.6 µg m−3 (19 October), at around the same time when NR-PM1 reached the maximum concentration (312.6 µg m−3). The minimum concentration of OA during the P1 period was 5.6 µg m−3. During the P2 period, the maximum and minimum OA concentrations were 34.6 and 5.3 µg m−3, respectively. The small difference (0.3 µg m−3) between the minimum OA concentrations of the P1 and P2 periods implies that the background concentration at the sampling site was approximately 5 µg m−3. This value is within the range of previous estimations of organic matter (OM) concentration in ambient fine aerosol during clear days in Singapore (Engling et al., 2014; See et al., 2006).
Sulfate () was the most abundant inorganic species during the entire campaign (Fig. 1e–g). The maximum concentration of (26.7 µg m−3) was observed around the same time as the maximum concentration of NR-PM1. Elemental analysis of peat samples from Kalimantan yielded a trace of sulfur of 0.1 %–0.3 % weight (Fig. S7), which could contribute to formation by oxidizing SO2 during the atmospheric transport process. Moreover, a previous study showed an increase in SO2 levels during a fire episode in Kalimantan, Indonesia (Hayasaka et al., 2014). Thus, the enhancement of might be caused by the oxidation of SO2 originating from the wildfires in Indonesia.
Ammonium () was the second most abundant inorganic species, and contributed 11 %–12 % of the total NR-PM1 across the entire campaign. The average concentration of during the P1 period (2.9 µg m−3) was approximately 3 times higher than that of the P2 period (1.0 µg m−3). Estimation of the ratio of measured to neutralized (meas∕ neu) yielded ratios of 1.0±0.1 for the P1 period and 0.7±0.3 for the P2 period (Table S8 and Fig. S8; Supplement Sect. F). The meas∕ neu ratio during the P1 period suggests that the cations () were in excess for neutralization of the anions (i.e., , , and Cl−; Zhang et al., 2007a), which was caused by elevated NH3 emission from the peatland fires (Stockwell et al., 2016). The meas∕ neu ratio does not indicate that aerosol during the 2015 haze episode is neutral. Using a thermodynamic model (ISORROPIA-II; Fountoukis and Nenes, 2007), we estimated aerosol liquid water content (LWC) to be 38.1±5.6 and 41.9±5.6 mol L−1, during P1 and P2 periods, respectively (Table S9). Aerosol acidity estimation was omitted because of the lack of NH3 and organic water in the model's input data (Budisulistiorini et al., 2017b; Weber et al., 2016).
Nitrate () contributed 4.1 % and 5.5 % to the total NR-PM1 during the P1 and P2 periods, respectively (Fig. 1f–g). During the P1 period, the concentration reached a maximum of ∼14 µg m−3 and decreased substantially to approximately 4 µg m−3 during the P2 period. Hence, NOx originating from wildfire (Hayasaka et al., 2014), combined with enhanced NH3 concentration (Stockwell et al., 2016) during the P1 period, could increase the NH4NO3 concentration, and thus increase the concentration.
Chloride (Cl−) was a minor component of NR-PM1 during the haze event, accounting for less than 1 % of aerosol concentration during P1 and P2 periods (Fig. 1f–g). The maximum concentrations during P1 and P2 periods were 2.4 µg m−3 (average 0.3 µg m−3) and 0.9 µg m−3 (average 0.2 µg m−3), respectively. The difference in Cl− maximum concentrations indicates the contribution of Cl− to the increase in NR-PM1 during the haze event, as previously observed in Singapore and Indonesia (See et al., 2006, 2007).
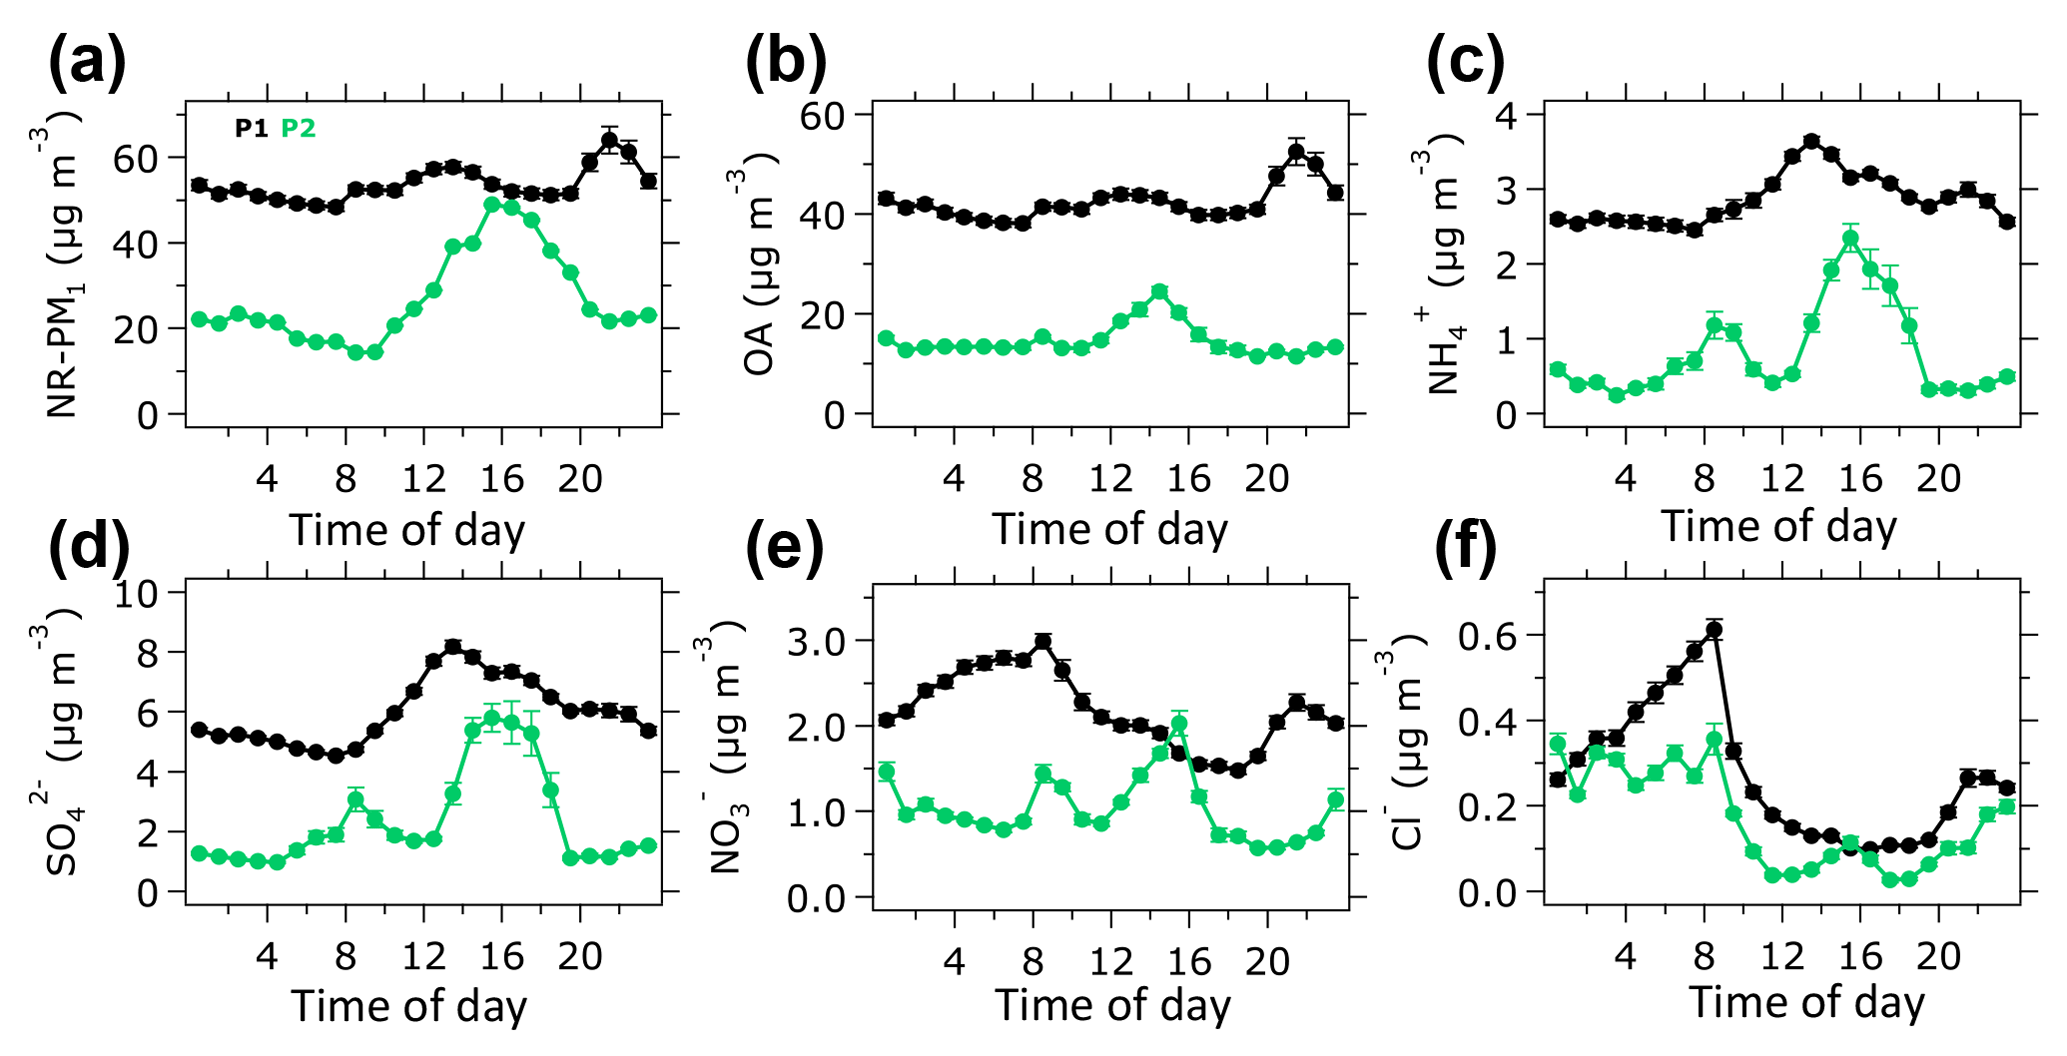
Figure 2Average diurnal profiles of NR-PM1 chemical species during the 2015 haze episode in Singapore. Vertical bars show one standard deviation.
3.3 Diurnal profiles of aerosol species
The average diurnal profile of NR-PM1 during the P1 period shows that the concentrations typically peaked around 14:00 and 22:00 LT (Fig. 2a). The nighttime increase was possibly driven by the peak event on 19–20 October when transport of highly concentrated haze plume from wildfires in Indonesia arrived in Singapore (Fig. S9a). During the P2 period, the average diurnal profile of NR-PM1 increases in the afternoon, suggesting a formation of secondary aerosol species such as SOA and inorganics (e.g., , ). During the P1 period, a slight increase in OA concentration in the afternoon and a large increase at nighttime as shown in Fig. 2b suggest that the local formation of OA was limited during the P1 period. Additionally, we found that the peak event influenced the nighttime increase in OA concentration during the P1 period (Fig. S9b), indicating that the night peak could be attributed to the arrival of highly concentrated haze plumes from wildfires in Indonesia. An increase in OA concentration in the afternoon during the P2 period indicates that the local formation of SOA at the observation site was significant.
The concentration peaked around 14:00 LT in the afternoon (Fig. 2d), which resulted from the oxidation of SO2 by hydroxyl radicals (Margitan, 1984). The diurnal profile of during the P2 period – when wildfires were less influential – suggests the existence of other sources of SO2, including vehicles, ships, industries, and/or volcanoes (Carmichael et al., 2002; Carn et al., 2017; Klimont et al., 2013; Seinfeld et al., 2004; Streets et al., 2000). Dimethyl sulfide (DMS) from the ocean could also contribute to formation in a coastal environment (Hoffmann et al., 2016; Ohizumi et al., 2016) such as Singapore. Diurnal profiles of during the P1 and P2 periods increase in the afternoon (Fig. 2c). During the P1 period, the concentration of slightly increased at nighttime. This small nighttime increase was likely caused by the peak event (Fig. S9c), associated with the arrival of highly concentrated haze plumes from Indonesian wildfires. The diurnal profile of during the P1 period (Fig. 2e) shows an increase at nighttime, which was not caused by the peak event (Fig. S9e). This nighttime increase in might be resulted from the shift of the gas–aerosol phase equilibrium of towards the particle phase. The concentration of Cl− increased in the morning and nighttime during the P1 and P2 periods (Fig. 2f). The Cl− concentration during the P1 period was slightly higher than that of the P2 period, which suggests a slight influence of wildfires.
Table 2Ratios of OM:OC, OC:EC, and WSOC:OC of the atmospheric aerosols from urban and rural or background in Singapore and other Asian sites.
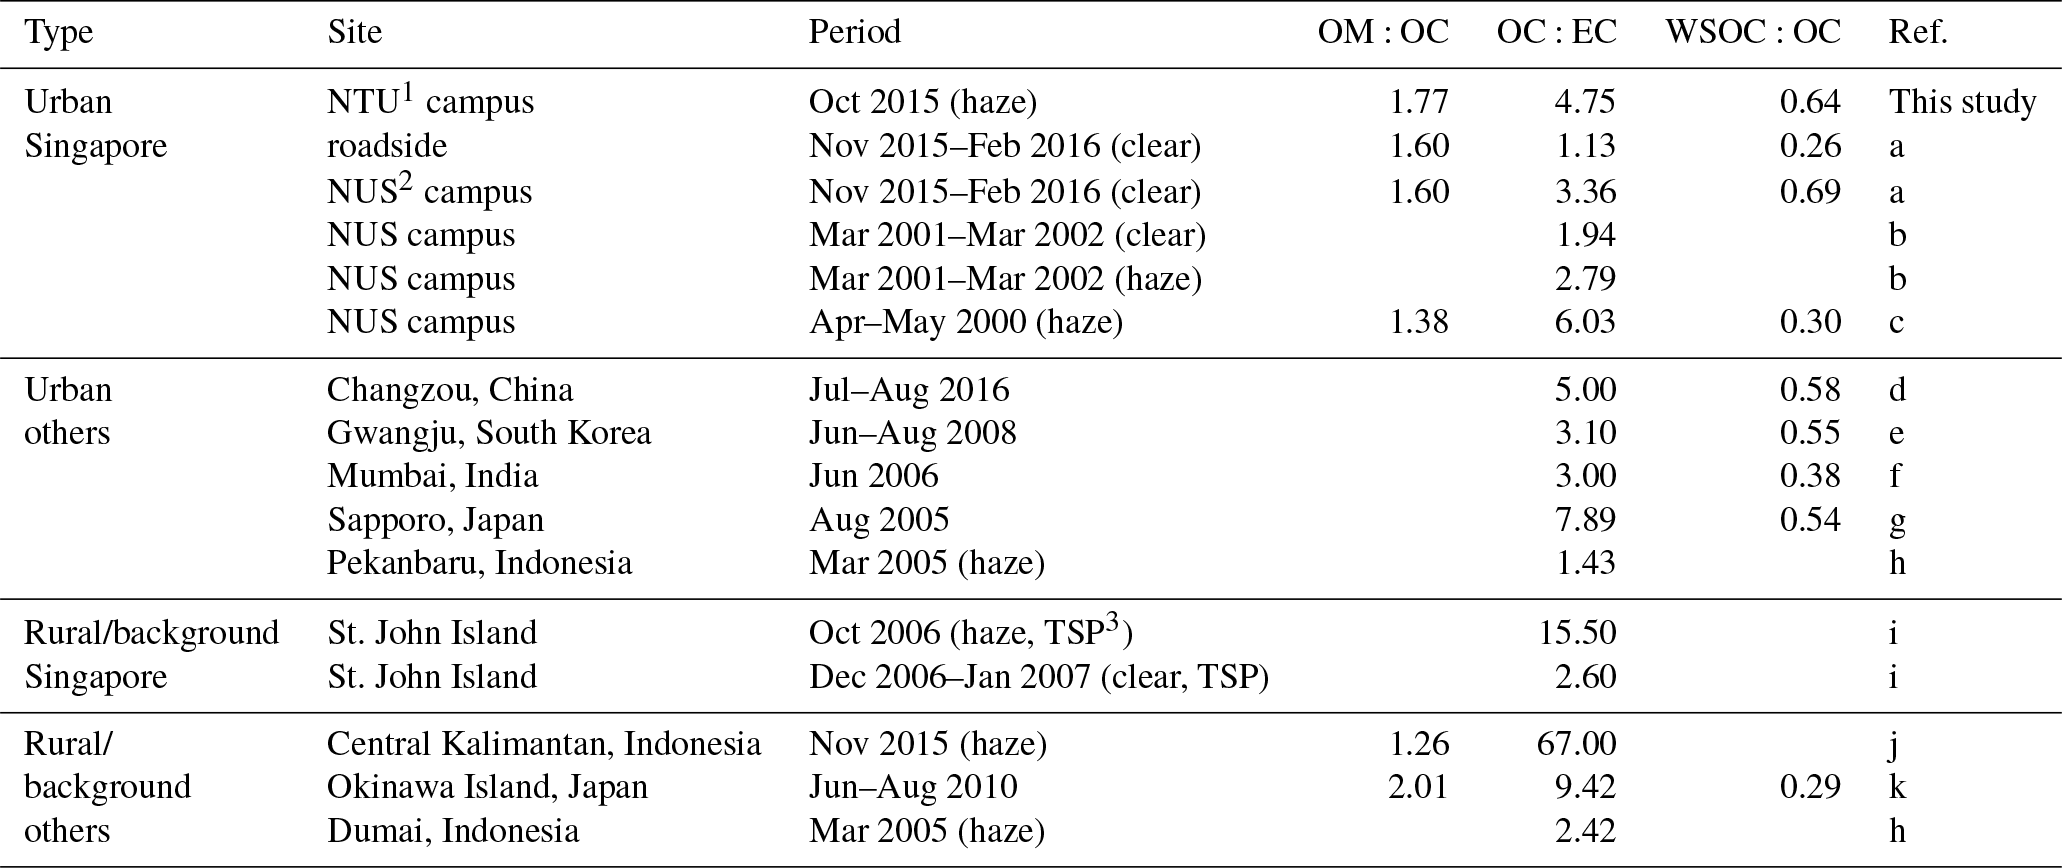
1 NTU is Nanyang Technological University. 2 NUS is National University of Singapore. 3 TSP is total suspended particle. References: (a) Zhang et al. (2017); (b) See et al. (2006); (c) Balasubramanian et al. (2003); (d) Ye et al. (2017); (e) Park and Cho (2011); (f) Aggarwal et al. (2013); (g) Agarwal et al. (2010); (h) See et al. (2007); (i) Engling et al. (2014); (j) Jayarathne et al. (2018); (k) Kunwar and Kawamura (2014).
3.4 Offline analysis data
Table 2 summarizes the ratios of organic matter (OM, which is OA from ToF-ACSM) to OC (OM:OC), OC:EC, and WSOC:OC from the current and previous ambient measurements (Agarwal et al., 2010, 2013; Balasubramanian et al., 2003; Engling et al., 2014; Jayarathne et al., 2018; Kunwar and Kawamura, 2014; Park and Cho, 2011; See et al., 2006, 2007; Ye et al., 2017; Zhang et al., 2017). The OM:OC ratio of the current study (∼1.8) is slightly higher than 1.6 estimated from urban air samples influenced by traffic emissions (Zhang et al., 2017). The OC:EC ratio was higher (∼4.8) than previous measurements (1.1–3.4) during clear days (Engling et al., 2014; Zhang et al., 2017); however, it was within the range of measurements (2.8–6.0) during hazy days (Balasubramanian et al., 2003; See et al., 2006). The WSOC:OC ratio during the 2015 haze event (∼0.6) is higher compared to ∼0.3 of the 2000 haze event (Balasubramanian et al., 2003). However, since the OM:OC ratio in 2015 was also higher, the ratios of WSOC:OM during the haze episodes in 2015 and 2000 are not significantly different (approximately 0.4 in 2015 and 0.2 in 2000).
Figure S10 shows concentrations of OA tracer compounds and OC measured by the offline analysis, and OA measured by the ToF-ACSM. The OA concentration was averaged over filter sampling time. Brown carbon (BrC) is a sum of light-absorbing constituents identified in Budisulistiorini et al. (2017a). These tracers are used in identifying OA sources resolved by the ME-2 analysis (Table S4).
4.1 Characterization of OA sources
The average OA mass spectra during the entire campaign (P1 and P2 periods) are shown in Fig. 3. The mass spectra are generally similar with subtle differences in the intensity of some ion signals, such as ions at m∕z 44 and m∕z 43. Using the ME-2 analysis, we further investigated the different sources of OA, based on the covariant of their mass spectra and time series. The ME-2 analysis resolved approximately 91 % of the OA mass. The rest of the OA mass (∼9 %) was unresolved (i.e., unexplained residual and noise in Fig. S3). An increasing number of factors did not improve deconvolution of the OA mass, as shown by insignificant decreases of the unexplained residual and noise for the more than four factors (Fig. S3) and similarities between the oxygenated organic aerosol (OOA) factors (Fig. S2). The four OA factors from the 2015 haze data sets include both primary and secondary factors. The hydrocarbon-like organic aerosol (HOA) from fossil fuel combustion, biomass burning organic aerosol (BBOA), and peat burning organic aerosol (PBOA) from non-fossil burning processes are surrogates of POA. The OOA can be considered as a surrogate of both SOA and oxidized POA (OPOA) (Donahue et al., 2009; Jimenez et al., 2009; Zhang et al., 2005a, 2007b).
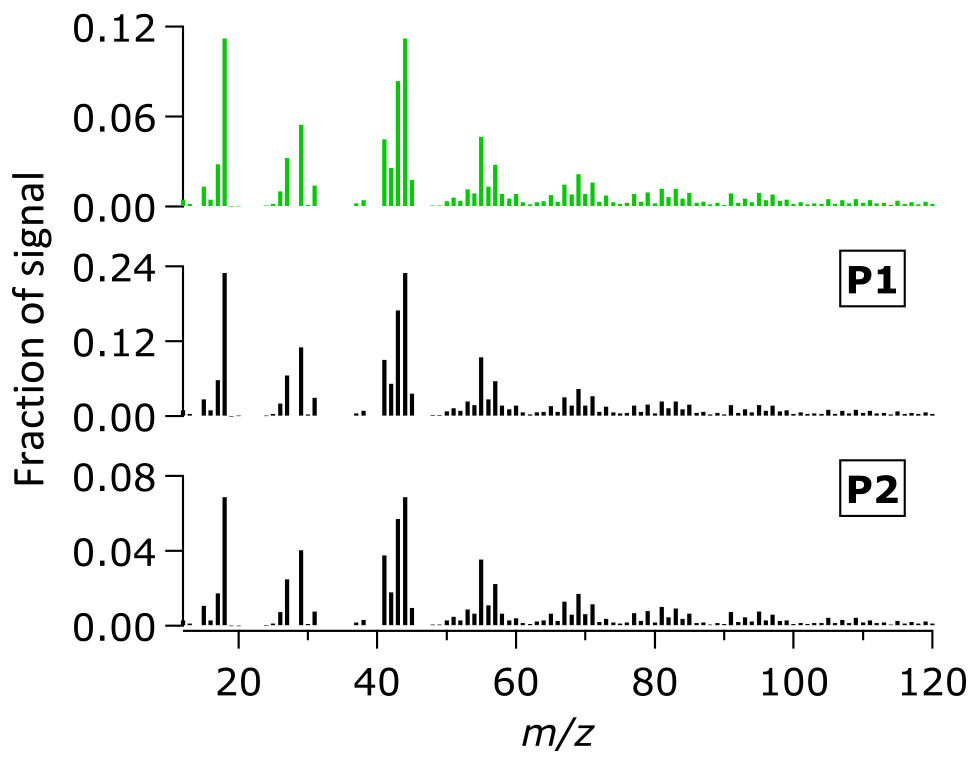
Figure 3Average mass spectra of OA during the entire sampling period (top) and the P1 and P2 periods.
Figure 4a and b show the mass spectra and time series of the OA factors, respectively. To support the identification of the OA factors, we compare the OA factors with chemical species identified by offline analyses (i.e., LC-MS, GC-MS, Sunset OC/EC, and IC-MS). Using the offline analyses, we characterized ambient particle tracers, such as levoglucosan and BrC constituents (Budisulistiorini et al., 2017a), EC and inorganic cations. Table S4 presents the correlation between the OA factors and the ambient particle tracers. The HOA factor, which is identified by a distinctive signal at m∕z 57, is attributed to emissions from fossil fuel combustion processes, such as diesel exhaust and lubricating oil (Zhang et al., 2005a, b). Previous studies reported good correlations (R2 > 0.7) between HOA and CO, NOx, and EC, known tracers of primary emission (Zhang et al., 2005a, b). EC measured from the integrated samples was not correlated with HOA (R2=0; Table S4). The limited number of integrated filter samples (n=8) and the long sampling time (t∼23 h) might have inhibited capturing the temporal variation in EC. The 8 h average CO concentration retrieved from the NEA website was weakly correlated (R2∼0.2; Table S4) with the HOA factor. The average CO concentration during the P1 period (∼1 mg m−3) was higher than during the P2 period (∼0.6 mg m−3), indicating that wildfires in Indonesia were the dominant source of CO during the observation period. Relatively better correlations between CO and PBOA, as well as OOA (R2∼0.4), prove that CO mostly originated from the wildfires.
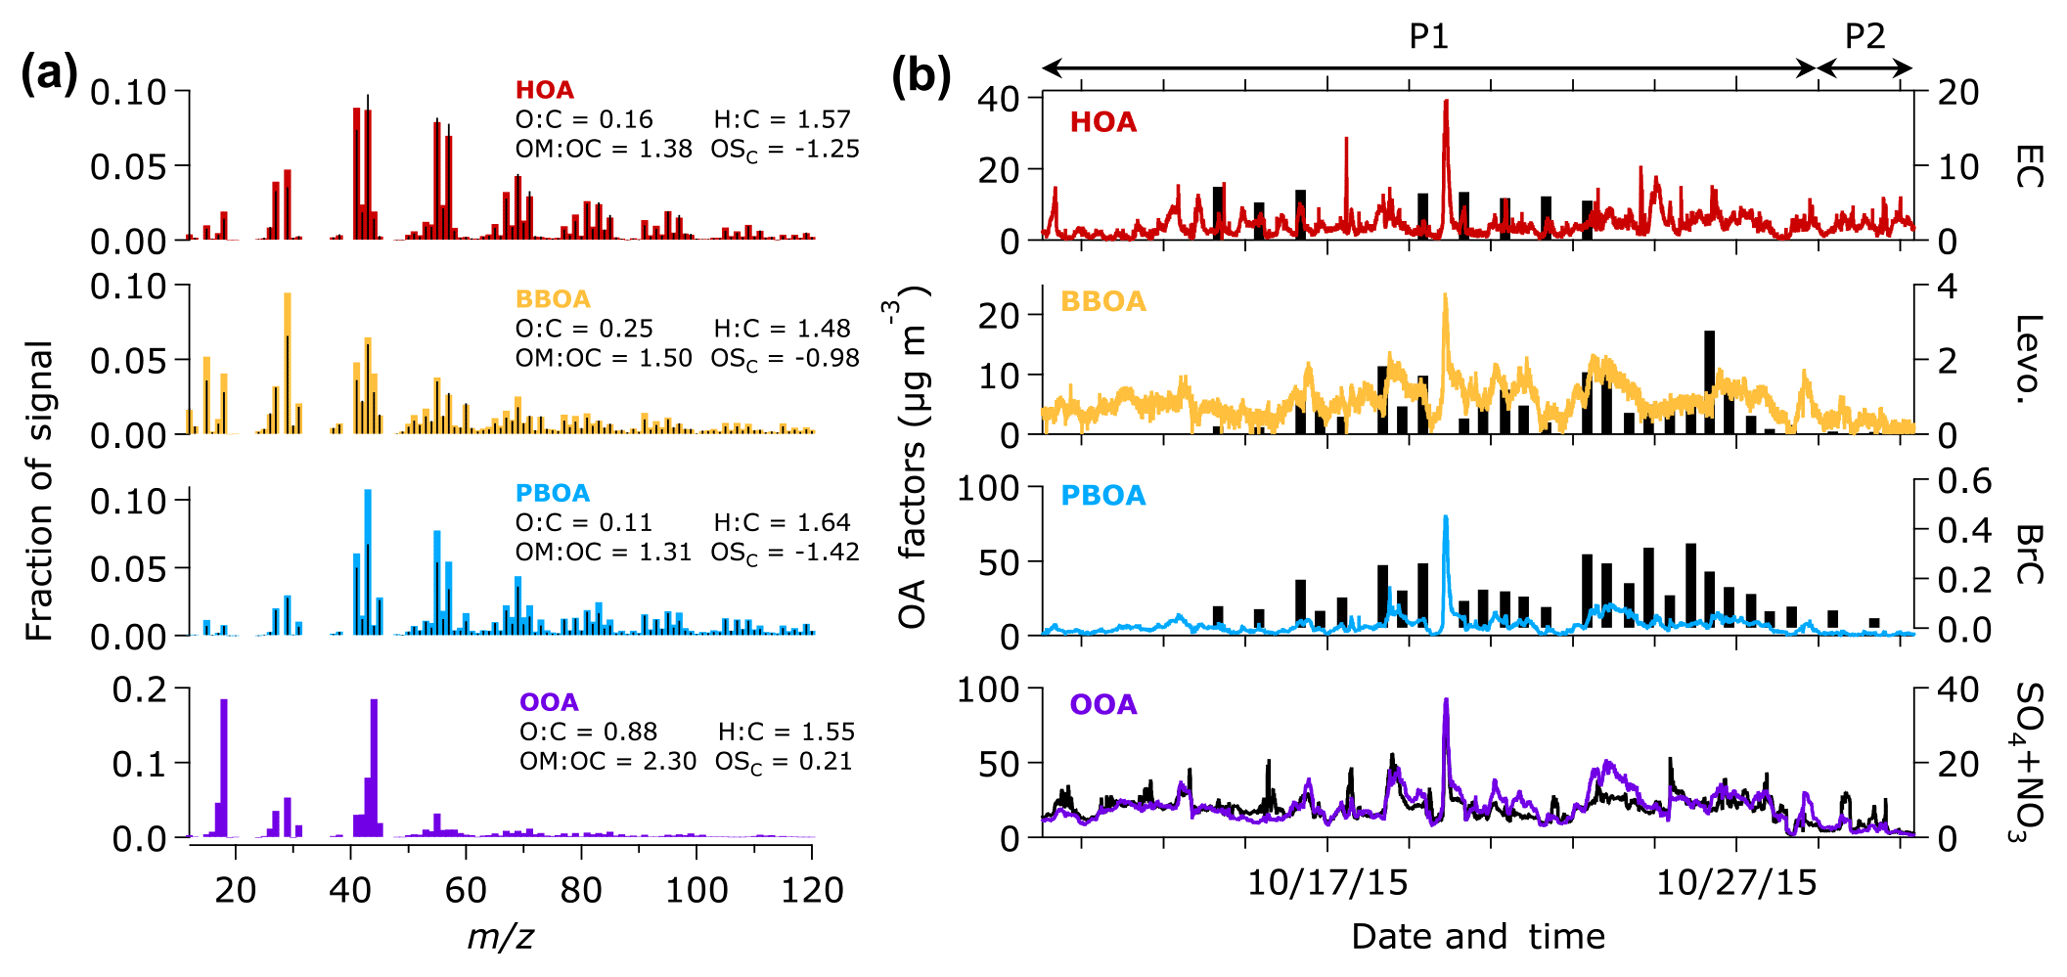
Figure 4(a) Mass spectra of OA components resolved by the ME-2 analysis. Black bars represent the reference mass spectra of HOA and BBOA (Ng et al., 2011c) and peat burning aerosol (Budisulistiorini et al., 2017a) used as the constraints in the ME-2 analysis. The elemental ratios were estimated from signals of mass-to-charge ratios (m∕z) 44 (f44) and 43 (f43) using the improved ambient elemental analysis method (Canagaratna et al., 2015). (b) Time series of OA factors observed in Singapore during the 2015 haze episode. Time series of EC, levoglucosan, the sum of brown carbon (BrC) constituents, and the sum of and in units of µg m−3 are shown against the time series of HOA, BBOA, PBOA, and OOA, respectively.
The BBOA factor can be attributed to vegetative burning. The MS of BBOA shows significant ion signals at m∕z 60 and 73 (mostly and , respectively). These ions were associated with levoglucosan and other monosaccharide derivatives produced from thermal decomposition of cellulose during the combustion of wood and peat (Bates et al., 1991; Budisulistiorini et al., 2017a; Iinuma et al., 2007; Simoneit et al., 1999). Hence, levoglucosan can be used as a tracer for identifying the BBOA factor from general biomass burning (e.g., Alfarra et al., 2007; Lanz et al., 2008), and PBOA from peat burning (Budisulistiorini et al., 2017a; Iinuma et al., 2007). A good correlation (R2∼0.6; Table S4 and Fig. 4b) between BBOA and levoglucosan measured from integrated samples proves that BBOA can be associated with biomass burning. Additionally, we found that PBOA correlates well with levoglucosan (R2∼0.7, Table S4). The good correlations of BBOA and PBOA factors with levoglucosan suggest that BBOA and PBOA factors can be associated with vegetative and vegetative-detritus burning, respectively.
We identified the PBOA factor by a good correlation (R2=0.97; Table S3) with the mass spectrum of laboratory peat burning aerosol (Budisulistiorini et al., 2017a). As it was constrained with freshly emitted aerosol from laboratory peat burning, PBOA can be categorized as a primary aerosol although it might be slightly oxidized during atmospheric transport. Prominent signals at m∕z 43, 55, 57, 60, and 73 of the PBOA mass spectrum suggest a combined characteristic of BBOA and HOA factors. However, the temporal variation in PBOA was different from HOA (R2∼0.5) and slightly similar to BBOA (R2∼0.6). We found a good correlation (R2=0.6–0.7, Table S4 and Fig. 4b) between PBOA and levoglucosan as well as the sum of BrC constituents characterized from laboratory peat burning aerosol and the ambient samples of the 2015 haze event (Budisulistiorini et al., 2017a). A weaker correlation between the BrC constituents with the BBOA (R2∼0.4) and HOA (R2∼0.5) factors indicates that the BrC constituents might be more closely associated with peat burning than with other sources.
Potassium (K+) has also been used as a tracer for vegetative burning; however, it can also originate from sea salt, soil resuspension, and fertilizers (Andreae, 1983; Urban et al., 2012; Watson et al., 2001; Watson and Chow, 2001). To remove the contribution of sea salt, we estimated the non-sea-salt K+ (nss-K+) concentration by assuming that (1) the chemical composition of sea-salt particles is similar to that of seawater, and (2) the sodium (Na+) particles in the samples is mainly from seawater spray (e.g., Balasubramanian et al., 2003). A weak correlation (R2∼0.2; Fig. S11) between nss-K+ and levoglucosan indicates the influence of other sources of potassium (e.g., fertilizers and soil resuspension from gardening) that might exist at or around the observation site during the P1 period (Pachon et al., 2013). Since we did not have K+ measurements during the non-hazy days of the P2 period, we could not confirm the influence of the non-burning sources. Further linear regression analysis between nss-K+ and OA factors yielded a weak or no correlation (R2=0.1–0.3). The weak correlations between nss-K+ and the OA factors could be due to (1) the inability of integrated samples to capture the temporal variation in potassium, and/or (2) the contribution of other sources that could not be identified in this study. Therefore, K+ might not be a good tracer for identifying BBOA and PBOA factors at this observation site.
The OOA component was identified by the prominent ion signal at m∕z 44 () representing oxygenated compounds (e.g., carboxylic acids group; Zhang et al., 2005a). The OOA factor correlates well with (R2=0.6; Table S4 and Fig. 4b) the sum of and nitrate (secondary aerosols) suggesting that the OOA might be formed through SOA formation processes. The OOA factor is more pronounced during the P1 period than during the P2 period, suggesting that SOA formation from oxidation of volatile organic compounds (VOCs) emitted from the peatland fire could contribute to the OOA factor. In fact, some SOA precursors such as benzene, toluene, phenol, and isoprene (Claeys et al., 2004; Yu et al., 2014) were identified from field measurements in Kalimantan, Indonesia, during the 2015 peatland fire (Stockwell et al., 2016). Water-soluble organic gases (WSOGs), such as glyoxal, methylglyoxal, and isoprene epoxidiol (IEPOX), produced from oxidation of VOCs could partition to aerosol liquid water, cloud droplets, or fog water and form SOA (Blando and Turpin, 2000; Ervens et al., 2011; Sareen et al., 2017). Additionally, the OOA factor might also be influenced by oxidation of POA (BBOA and PBOA) during the P1 period, as indicated by the presence of levoglucosan ion tracer (m∕z 60) in the mass spectra of OOA that is slightly higher than that of the typical background (Cubison et al., 2011).
4.2 Diurnal variations in OA sources
Figure 5 shows the average diurnal variations in the OA factors during the P1 and P2 periods. During the P1 period (Fig. 5a and c), HOA concentration increased in the morning (07:00–09:00 LT) and evening (18:00–23:00 LT) implying that this HOA factor can be associated with morning and evening traffic. A small decrease in the night peak when the peak event (19–20 October) was excluded from diurnal profile calculation (Fig. S12a) proves that the night peak of HOA during the P1 period was mainly influenced by night traffic. Diurnal variations in BBOA and PBOA show significant peaks at nighttime driven by the peak event during the P1 period, although no substantial variations were observed during daytime (Fig. S12b–c). The OOA concentration started to increase around 08:00 LT and peaked around 14:00 LT (Fig. 5a), indicating the contribution of photooxidation processes. The elevated OOA concentration at nighttime was also generated by the peak event on 19–20 October (Fig. S12d).
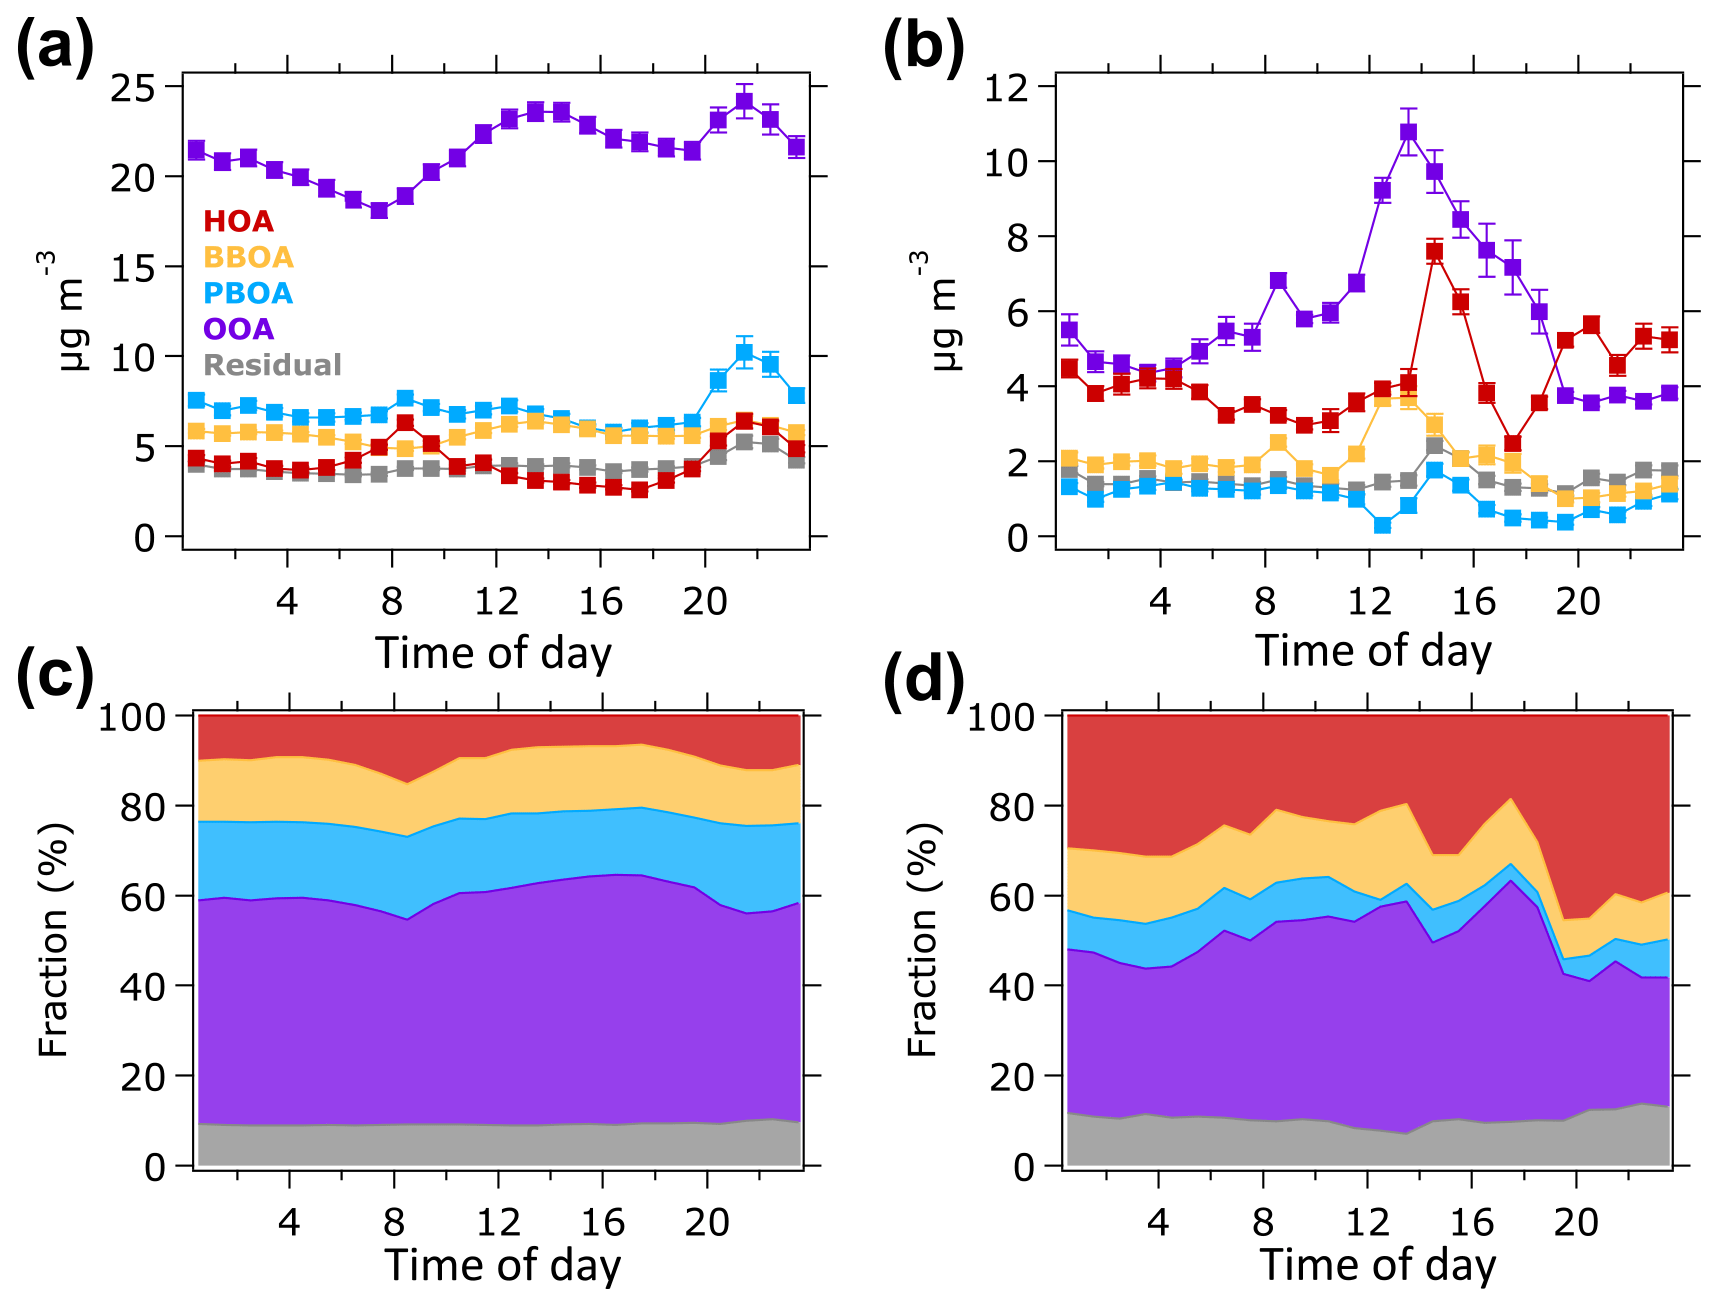
Figure 5Average diurnal profiles of OA sources in units of µg m−3 (top panels) for (a) the P1 and (b) P2 periods. Bottom panels show similar diurnal profile but in fraction contribution to the total OA mass for (c) the P1 and (d) P2 periods.
During the P2 period (Fig. 5b and d), the HOA concentration increased in the evening, while no significant change was observed in the morning. The HOA concentration in the morning of the P2 period was almost half of its concentrations in the afternoon and evening resulting in an insignificant concentration profile in the morning. The HOA enhancement in the evening can be associated with an evening traffic. An increase in the HOA concentration in the late afternoon (14:00–16:00 LT) could be caused by heavy vehicle traffic from construction sites within the NTU campus, as well as regular traffic relating to school activities. It should be noted that the P2 period was shorter (29–31 October) than the P1 period. Hence, the diurnal profile of OA factors might not capture the actual variation in OA sources during non-hazy days. The BBOA concentration increased at noontime, although no significant local source of biomass burning was available during the P2 period. The BBOA enhancement at noontime could be due to the transport of biomass burning plume event from Peninsular Malaysia that might occur during the short P2 period (Miettinen et al., 2017; Smith et al., 2017). The PBOA concentration did not vary significantly during the P2 period, suggesting that it might not be produced locally. The OOA concentration peaked around 14:00 LT and decreased in the evening, indicating that during the P2 period, OOA was likely formed through photooxidation.
4.3 Contribution of OA sources
The average concentration of OA sources to ambient fine aerosol during the 2015 haze episode in Singapore is illustrated in Fig. 6a. The average concentrations of three OA components – BBOA (5.7 µg m−3), PBOA (7.1 µg m−3), and OOA (21.4 µg m−3) – were notably higher during the P1 period than during the P2 period (BBOA =1.9 µg m−3, PBOA =1.1 µg m−3, and OOA =5.8 µg m−3). On the other hand, the HOA concentration remained consistent around 4 µg m−3 during both periods.
The changes in average concentration of OA factors during the P1 and P2 periods were not similar to the changes in contributions of OA factors to the total OA masses. As illustrated in Fig. 6b, the contribution of OOA to the total OA mass was higher during the P1 period (50.7 %) than during the P2 period (39.9 %). Similarly, the PBOA contribution was also higher during the P1 period (16.8 %) than the P2 period (7.2 %). The higher contribution of OOA and PBOA during the P1 period suggests that the factors were influenced by Indonesian wildfires. The BBOA contribution was relatively similar (∼14 %) during both periods, although the average BBOA concentration was 3 times higher during the P1 period than the P2 period. The consistent contribution of BBOA during both periods might indicate an influence of other sources of BBOA (e.g., wildfires in Peninsular Malaysia; Miettinen et al., 2017; Smith et al., 2017) in addition to wildfires in Indonesia. Additionally, locally emitted cooking OA (COA), which has been shown to have similar mass spectra to BBOA (Lee et al., 2015; Liu et al., 2017), could also contribute to BBOA during the P2 period. This observation of the average concentrations and contributions of OA factors indicate that (1) fossil fuel combustion was likely the main source of HOA at most of the observation period, and (2) Indonesian wildfires contributed to the elevated BBOA, PBOA, and OOA concentrations during the P1 period.
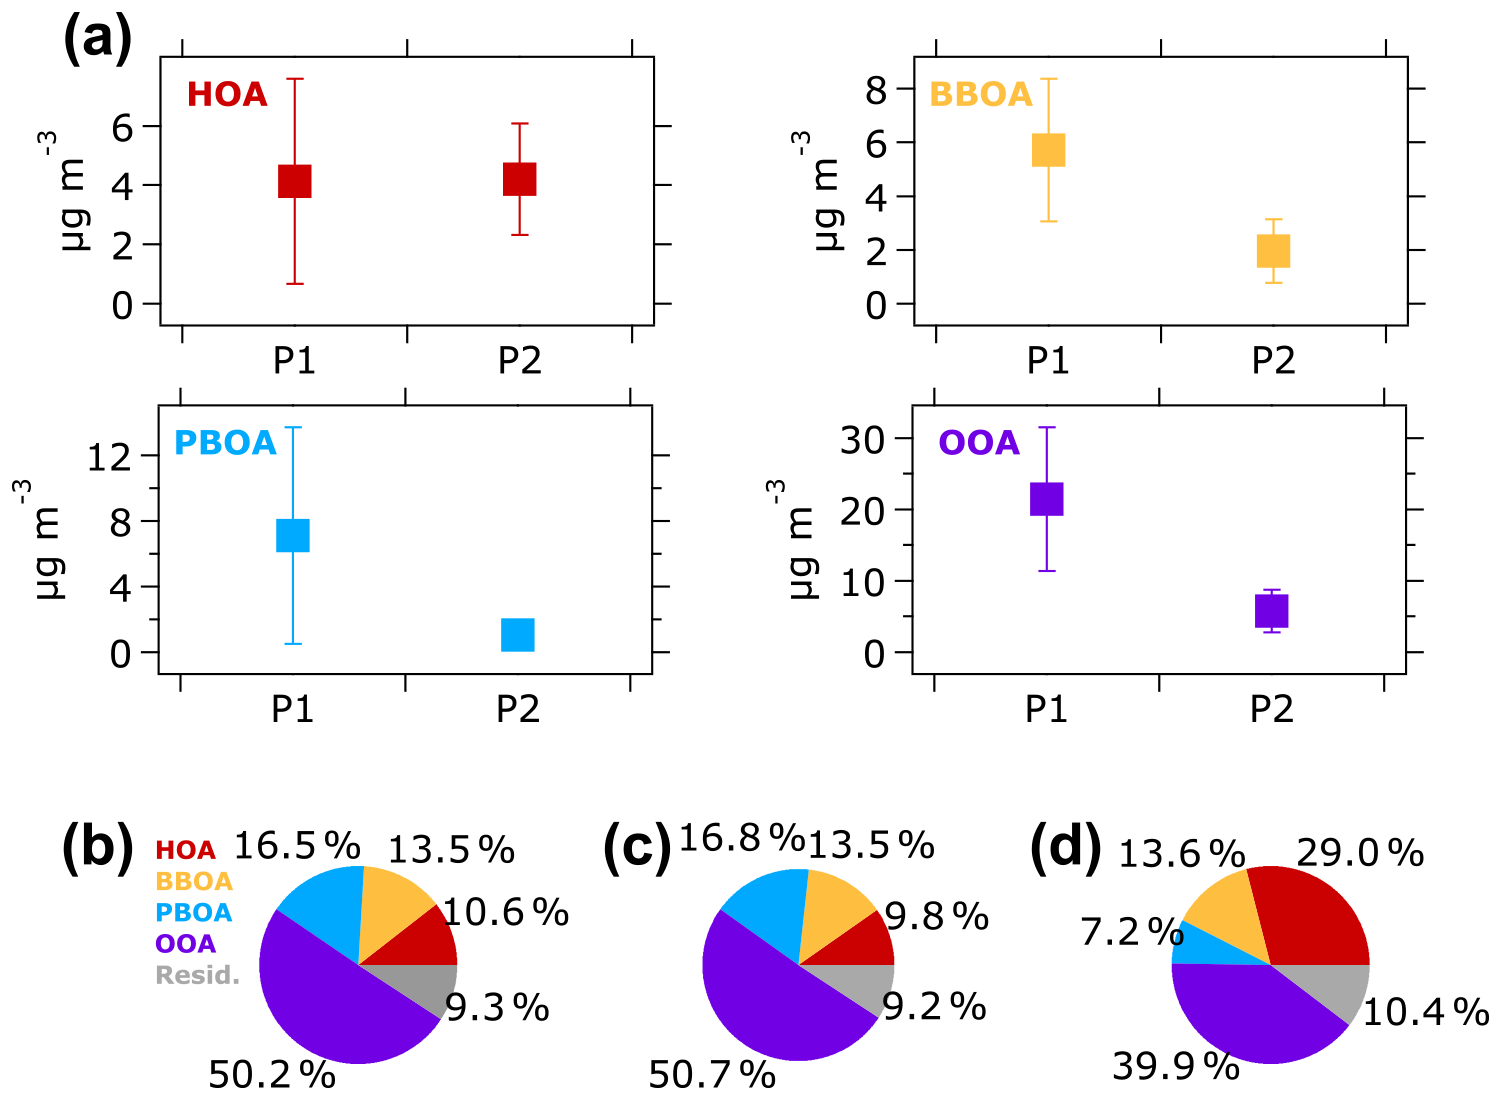
Figure 6(a) Average concentrations of OA factors during the P1 and P2 periods. Vertical lines represent one standard deviation. The contribution of each OA factor to the total OA mass during (b) the overall, (c) P1, and (d) P2 periods are illustrated in pie charts. Residual is the portion of time series OA mass spectra that could not be resolved by the ME-2 solver.
4.4 Chemical characteristics of OOA
The oxidation degree of the total OA (and the OA factors) may provide information of the OOA formation processes. Figure 7a illustrates the relationship between the mass fraction of m∕z 44 () to the total OA (f44) versus f43 (mass fraction of m∕z 43, mostly C2H3O+, Fig. S13, to the total OA). This plot, known as a triangle plot (Ng et al., 2011b), illustrates an evolution of OA in the plume. Most of the OA during the entire campaign extends from the bottom to the middle-top of the triangle region (Fig. 7a). This OA distribution indicates the transition of OA, from less- to more-oxidized OA. The distribution of less- to more-oxidized OA is also supported by the plot of f44 versus f43 of the OA factors. BBOA, PBOA, and HOA reside near the bottom of the triangle region, representing the less-oxidized OA factor that exhibits low carbon oxidation states (8 to −1.42). OOA, which exhibits the highest carbon oxidation state (), resides near the top, indicating the more-oxidized OA factor.
The evolution of OA is also indicated by the diurnal profile of f44 (Fig. S14a). f44 started to increase in the morning and reached a maximum in the afternoon during both the P1 and P2 periods, suggesting an influence of oxidation processes on OA composition during the daytime. Figure S14b shows that during the P1 period, f43 decreased in the afternoon and increased in the evening. The same figure shows that during the P2 period, f43 peaked in the early morning and afternoon.
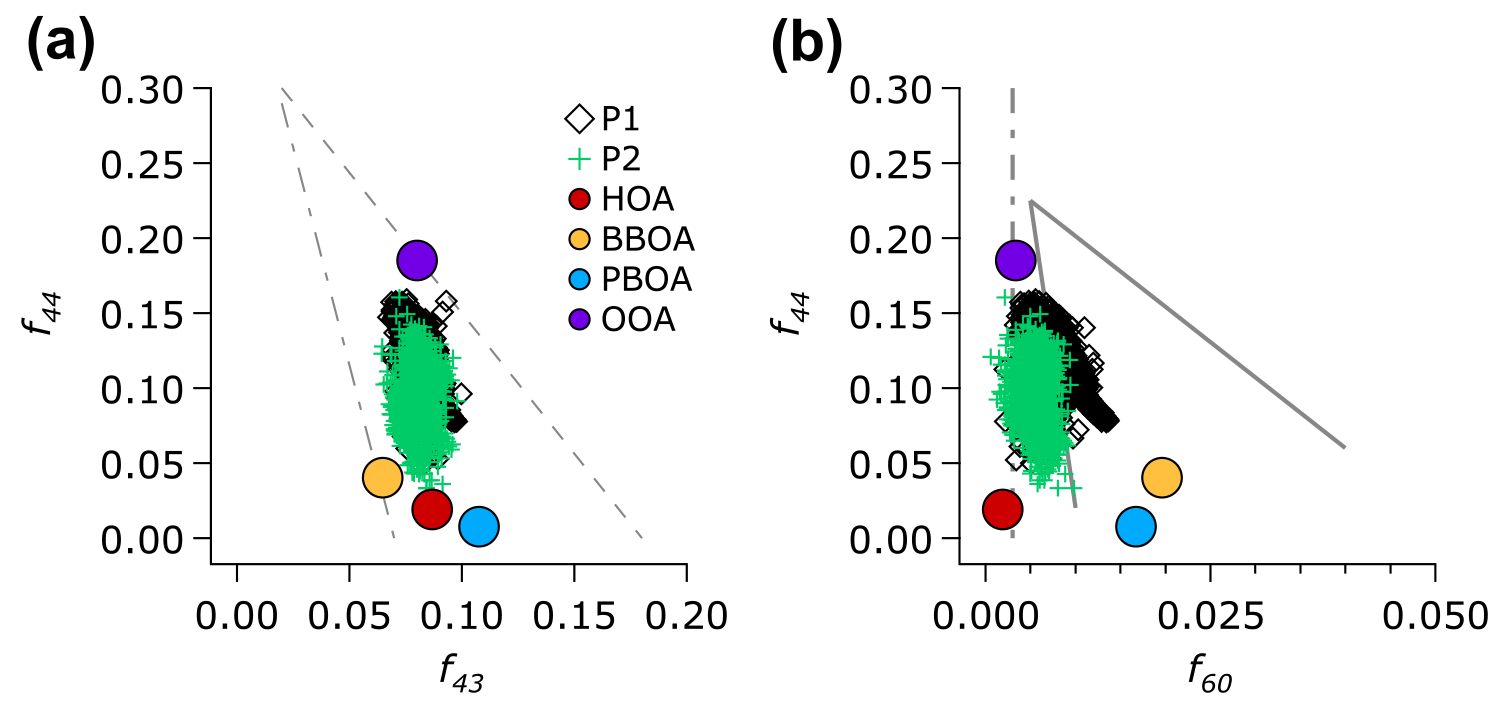
Figure 7(a) Scatter plot of f44 (mass fraction of m∕z 44 to the total OA) as a function of f43 (mass fraction of m∕z 43) of the OA and the factors resolved by the ME-2 analysis. The grey dashed lines depicts the triangle plot (Ng et al., 2010), which is a guide to show aging of the total OA (classified into the P1 and P2 periods) and the OA factors. (b) Scatter plot of f44 as a function of f60 of the total OA and the OA factors is plotted over the conceptual space for biomass burning aerosol aging (solid grey lines) and the nominal background/urban value of f60 at 0.3 % (grey dashed and dotted line; Cubison et al., 2011).
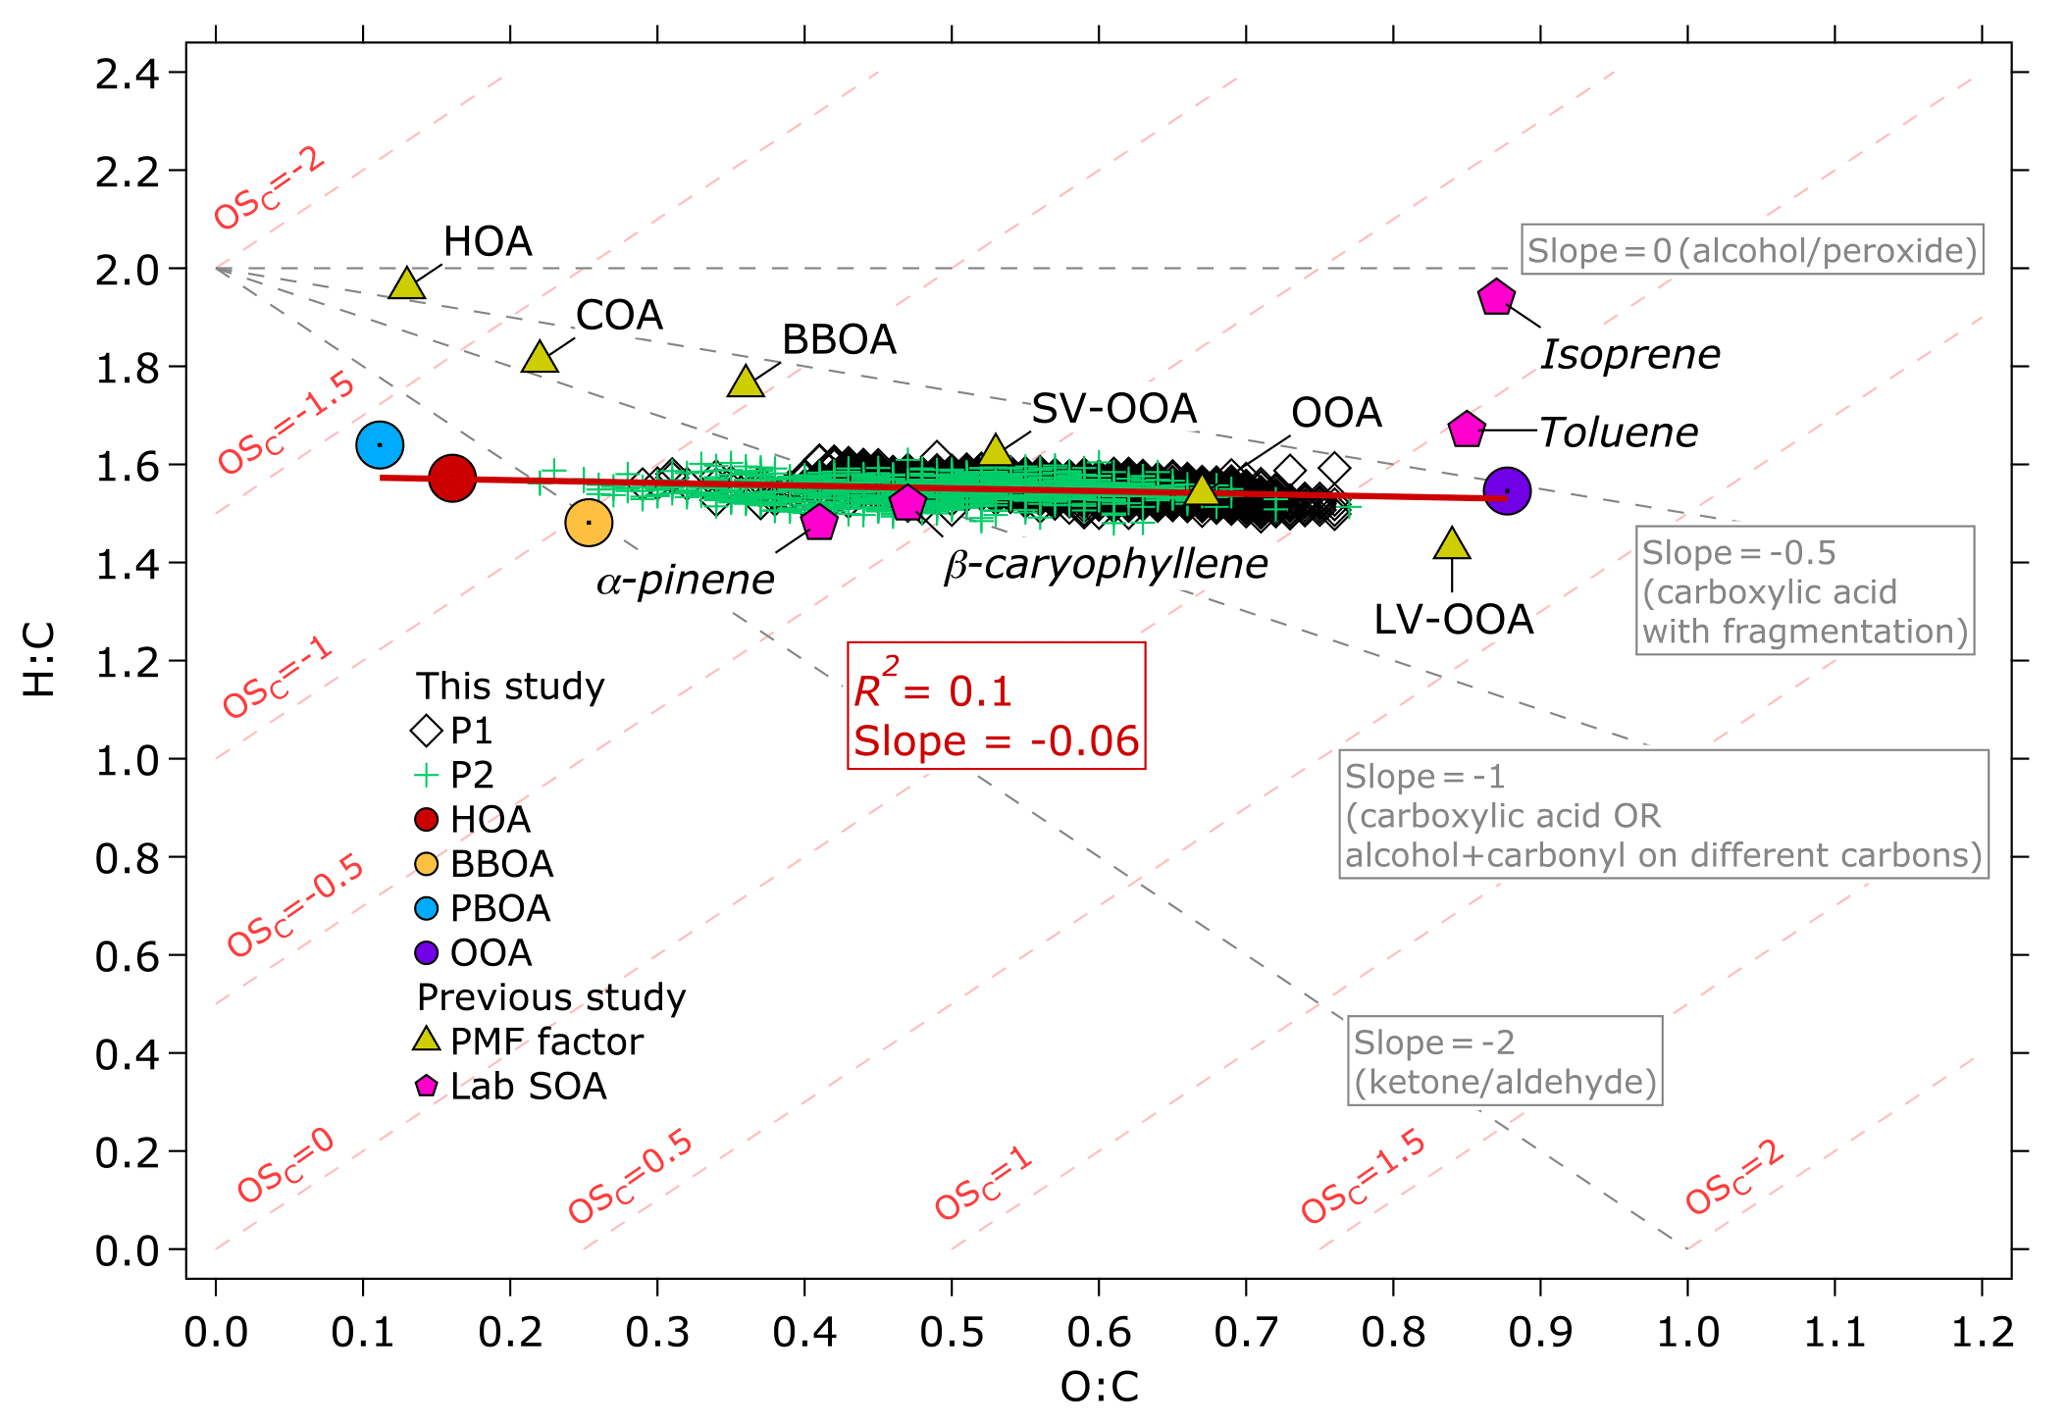
Figure 8Van Krevelen diagram of the OA measured during the 2015 haze episode and the OA factors resolved by the ME-2 analysis. The H:C to O:C ratios are colored based on the P1 and P2 periods. The H:C to O:C ratios of the OA factors resolved by the ME-2 analysis of this study are plotted as colored circles. Linear regression analysis of H:C vs. O:C from the OA factors yielded R2=0.1 and slope as plotted on the figure. Comparison with HOA, BBOA, cooking OA (COA), OOA, semi-volatile OOA (SV-OOA), and low-volatility OOA (LV-OOA, triangle markers) and laboratory-generated SOA (hexagonal markers) of previous studies (Canagaratna et al., 2015, and references therein) show that the OOA factor of this study exhibits close characteristics to LV-OOA and toluene-derived SOA, indicating that its formation could be attributed to atmospheric processing.
Figure 7b shows a relationship between f44 and f60 (mass fraction of m∕z 60, , to the total OA), which can serve as an indicator of the oxidation process of OA in plumes emitted by biomass burning (Cubison et al., 2011). Ion markers of biomass burning (f60) during the P1 period were larger than a typical background level in f60 of ∼0.3 % (Aiken et al., 2010), while those during the P2 period were very close to the background level (Fig. S14c). The slope of the P1 period (−3.3) indicates a more pronounced progression towards a higher f44 (more oxidized aerosol), whilef60 only slightly decreased. The changes in f44 versus f60 are possibly due to the atmospheric oxidation processes, such as levoglucosan decay (Cubison et al., 2011; Hoffmann et al., 2010), as well as SOA formation processes that enhance ion signals at m∕z 44.
We estimated the ratios of H:C and O:C with the improved ambient method for unit mass resolution suggested by Canagaratna et al. (2015) and average following Kroll et al. (2011). The estimated H:C versus O:C values as well as of the bulk OA measurements and the OA factors were plotted on a van Krevelen (VK) diagram (Heald et al., 2010) in Fig. 8. The of OOA (0.21) shown in Fig. 8 is similar to that of low-volatility OOA (LV-OOA, 0.25) described in a previous study (Canagaratna et al., 2015), suggesting that OOA was highly oxidized. The of OOA also closely agreed with that of laboratory-generated toluene-derived SOA (0.10) estimated by Canagaratna et al. (2015). The close agreement between OOA and laboratory studies indicates that SOA formation could potentially contribute to the OOA factor, considering that SOA precursors – for instance, toluene, benzene, xylene, and other VOCs – were emitted at notable levels (0.1–1 g kg−1) from wildfires in Kalimantan, Indonesia (Stockwell et al., 2016). Linear regression analyses of H:C versus O:C for the OA factors resulted in the slope of –0.06. The slope of the OA factors is close to 0, suggesting that POA aging through hydroxyl group oligomerization in dark chemistry (Gilardoni et al., 2016), and/or the addition of highly oxidized carboxylic and/or peroxide groups (Kumar et al., 2016), might also contribute to the OOA factor.
Overall, the observation of the 2015 haze episode in Singapore indicated the dominant contribution of OOA to the total OA. OOA formation could be caused by (1) oxidation of POA, and (2) the formation of SOA through oxidation of VOCs emitted from wildfires as well as partitioning of WSOGs onto aerosol liquid water or cloud droplets during atmospheric transport. This present study, however, could not separately quantify the contribution of POA oxidation and SOA formation to the total OOA. Therefore, further studies are needed to investigate the contribution of SOA formation and POA oxidation to the OOA formation in the wildfire haze particles.
We investigated contributions of inorganic and organic particles to the Indonesian wildfire haze through directly measuring NR-PM1 in Singapore from 10 to 31 October 2015, and demonstrated the dominant presence of OOA. The measurement period was separated into the P1 period, which was influenced by Indonesian wildfires, and the P2 period, which was less influenced by the fires. The average submicron particle (NR-PM1) concentration was notably higher (∼54 µg m−3) during the P1 period than during the P2 period (∼26 µg m−3). Similar trends were observed for OA, , , and characterized from the NR-PM1. OA was the most abundant species measured during the entire campaign, averaging 42 and 12 µg m−3 during the P1 and P2 periods, respectively. The concentration was higher during the P1 period (6 µg m−3) than that of the P2 period (3 µg m−3). The higher concentrations of OA and demonstrate the influence of wildfire emission.
Characterization of OA sources by the ME-2 analysis yielded four components, i.e., HOA, BBOA, PBOA, and OOA, which can be associated with vehicles and traffics, wood or biomass burning, wildfires, and atmospheric processing, respectively. OOA was the most abundant (∼51 % of OA), followed by PBOA (∼17 %), BBOA (∼14 %), and HOA (∼10 %). PBOA was associated with peat burning BrC constituents (R2∼0.6), while other OA factors showed less correlation. BBOA was characterized by correlating (R2∼0.6) with levoglucosan, which is a known wood or biomass burning tracer. An association between levoglucosan and OOA (R2∼0.6) during the P1 period and a notable decrease in OOA concentration in the P2 period, indicates the contribution of Indonesian wildfire emissions to OOA formation.
The relationships between f44 versus f60, as well as H:C versus O:C ratios of the OA factors, suggest that OOA formation in Singapore during the 2015 haze event could be driven by (1) POA aging, and (2) SOA formation from the oxidation of gas precursors and/or the aqueous-phase chemistry of WSOGs during atmospheric transport. The significant contribution of OOA to the total OA warrants further study to investigate the contribution of oxidation of gas-phase precursors and aging of primary aerosols emitted from Indonesian wildfires.
The data set for this publication is available upon contacting the corresponding authors.
The supplement related to this article is available online at: https://doi.org/10.5194/acp-18-16481-2018-supplement.
SHB and MK designed the study. SHB performed the ambient and laboratory measurements, analyzed the ToF-ACSM data, and wrote the manuscript with contributions from MK. MR, MW, and JDS conducted the LC-MS and GC-MS analysis. TM conducted the inorganic ions, OC, EC, and WSOC analyses. JC performed the ambient and laboratory measurements. MI provided the biomass samples.
The authors declare that they have no conflict of interest.
We acknowledge Haris Gunawan for supporting our research in Indonesia. We thank
Gisella B. Lebron and Web-Chien Lee for assisting in the particle sampling and data
collection, and Kyle Niezgoda and Shaoneng R. He for the meteorological data. We
gratefully acknowledge the NOAA Air Resources Laboratory (ARL) for the
provision of the HYSPLIT transport and dispersion model and/or READY website
(https://www.ready.noaa.gov, last access: 17 September 2018) used in this publication. We acknowledge the use of
fire data from LANCE-FIRMS operated by the NASA/GSFC/Earth Science Data and
Information System (ESDIS) with funding provided by NASA/HQ. The research is
funded by the National Research Foundation Singapore (NRF) under its
Singapore National Research Fellowship scheme (National Research Fellow
Award, NRF2012NRF-NRFF001-031), NRF Campus for Research Excellence and
Technological Enterprise (CREATE) program (NRF2016-ITC001-021), the Earth Observatory of Singapore
(EOS), and Nanyang Technological University.
Edited by: Sachin S. Gunthe
Reviewed by: two anonymous
referees
Agarwal, S., Aggarwal, S. G., Okuzawa, K., and Kawamura, K.: Size distributions of dicarboxylic acids, ketoacids, a-dicarbonyls, sugars, WSOC, OC, EC and inorganic ions in atmospheric particles over Northern Japan: implication for long-range transport of Siberian biomass burning and East Asian polluted aerosols, Atmos. Chem. Phys., 10, 5839–5858, https://doi.org/10.5194/acp-10-5839-2010, 2010.
Aggarwal, S. G., Kawamura, K., Umarji, G. S., Tachibana, E., Patil, R. S., and Gupta, P. K.: Organic and inorganic markers and stable C-, N-isotopic compositions of tropical coastal aerosols from megacity Mumbai: sources of organic aerosols and atmospheric processing, Atmos. Chem. Phys., 13, 4667–4680, https://doi.org/10.5194/acp-13-4667-2013, 2013.
Aiken, A. C., de Foy, B., Wiedinmyer, C., DeCarlo, P. F., Ulbrich, I. M., Wehrli, M. N., Szidat, S., Prevot, A. S. H., Noda, J., Wacker, L., Volkamer, R., Fortner, E., Wang, J., Laskin, A., Shutthanandan, V., Zheng, J., Zhang, R., Paredes-Miranda, G., Arnott, W. P., Molina, L. T., Sosa, G., Querol, X., and Jimenez, J. L.: Mexico city aerosol analysis during MILAGRO using high resolution aerosol mass spectrometry at the urban supersite (T0) – Part 2: Analysis of the biomass burning contribution and the non-fossil carbon fraction, Atmos. Chem. Phys., 10, 5315–5341, https://doi.org/10.5194/acp-10-5315-2010, 2010.
Alfarra, M. R., Prévôt, A. S. H., Szidat, S. A., Sandradewi, J., Weimer, S., Lanz, V. A., Schreiber, D., Mohr, M., and Baltensperger, U.: Identification of the mass spectral signature of organic aerosols from wood burning emissions, Environ. Sci. Technol., 41, 5770–5777, https://doi.org/10.1021/es062289b, 2007.
Andreae, M. O.: Soot carbon and excess fine potassium: long-range transport of combustion-derived aerosols, Science, 220, 1148–1151, https://doi.org/10.1126/science.220.4602.1148, 1983.
Atwood, S. A., Reid, J. S., Kreidenweis, S. M., Yu, L. E., Salinas, S. V, Chew, B. N., and Balasubramanian, R.: Analysis of source regions for smoke events in Singapore for the 2009 El Niño burning season, Atmos. Environ., 78, 219–230, https://doi.org/10.1016/j.atmosenv.2013.04.047, 2013.
Balasubramanian, R., Qian, W.-B., Decesari, S., Facchini, M. C., and Fuzzi, S.: Comprehensive characterization of PM2.5 aerosols in Singapore, J. Geophys. Res., 108, 4523, https://doi.org/10.1029/2002JD002517, 2003.
Bates, A. L., Hatcher, P. G., Lerch, H. E., Cecil, C. B., Neuzil, S. G., and Supardi: Studies of a peatified angiosperm log cross-section from Indonesia by nuclear-magnetic-resonance spectroscopy and analytical pyrolysis, Org. Geochem., 17, 37–45, https://doi.org/10.1016/0146-6380(91)90038-L, 1991.
Betha, R., Behera, S. N., and Balasubramanian, R.: 2013 Southeast Asian smoke haze: fractionation of particulate-bound elements and associated health risk, Environ. Sci. Technol., 48, 4327–4335, https://doi.org/10.1021/es405533d, 2014.
Blando, J. D. and Turpin, B. J.: Secondary organic aerosol formation in cloud and fog droplets: a literature evaluation of plausibility, Atmos. Environ., 34, 1623–1632, https://doi.org/10.1016/S1352-2310(99)00392-1, 2000.
Budisulistiorini, S. H., Canagaratna, M. R., Croteau, P. L., Marth, W. J., Baumann, K., Edgerton, E. S., Shaw, S. L., Knipping, E. M., Worsnop, D. R., Jayne, J. T., Gold, A., and Surratt, J. D.: Real-time continuous characterization of secondary organic aerosol derived from isoprene epoxydiols in downtown Atlanta, Georgia, using the Aerodyne Aerosol Chemical Speciation Monitor, Environ. Sci. Technol., 47, 5686–5694, https://doi.org/10.1021/es400023n, 2013.
Budisulistiorini, S. H., Riva, M., Williams, M., Chen, J., Itoh, M., Surratt, J. D., and Kuwata, M.: Light-absorbing brown carbon aerosol constituents from combustion of Indonesian peat and biomass, Environ. Sci. Technol., 51, 4415–4423, https://doi.org/10.1021/acs.est.7b00397, 2017a.
Budisulistiorini, S. H., Nenes, A., Carlton, A. G., Surratt, J. D., McNeill, V. F., and Pye, H. O. T.: Simulating aqueous-phase isoprene-epoxydiol (IEPOX) secondary organic aerosol production during the 2013 Southern Oxidant and Aerosol Study (SOAS), Environ. Sci. Technol., 51, 5026–5034, https://doi.org/10.1021/acs.est.6b05750, 2017b.
Canagaratna, M. R., Jimenez, J. L., Kroll, J. H., Chen, Q., Kessler, S. H., Massoli, P., Hildebrandt Ruiz, L., Fortner, E., Williams, L. R., Wilson, K. R., Surratt, J. D., Donahue, N. M., Jayne, J. T., and Worsnop, D. R.: Elemental ratio measurements of organic compounds using aerosol mass spectrometry: characterization, improved calibration, and implications, Atmos. Chem. Phys., 15, 253–272, https://doi.org/10.5194/acp-15-253-2015, 2015.
Carmichael, G. R., Streets, D. G., Calori, G., Amann, M., Jacobson, M. Z., Hansen, J., and Ueda, H.: Changing Trends in Sulfur Emissions in Asia:? Implications for Acid Deposition, Air Pollution, and Climate, Environ. Sci. Technol., 36, 4707–4713, https://doi.org/10.1021/es011509c, 2002.
Carn, S. A., Fioletov, V. E., McLinden, C. A., Li, C., and Krotkov, N. A.: A decade of global volcanic SO2 emissions measured from space, Sci. Rep., 7, 44095, https://doi.org/10.1038/srep44095, 2017.
Canonaco, F., Crippa, M., Slowik, J. G., Baltensperger, U., and Prévôt, A. S. H.: SoFi, an IGOR-based interface for the efficient use of the generalized multilinear engine (ME-2) for the source apportionment: ME-2 application to aerosol mass spectrometer data, Atmos. Meas. Tech., 6, 3649–3661, https://doi.org/10.5194/amt-6-3649-2013, 2013.
Claeys, M., Graham, B., Vas, G., Wang, W., Vermeylen, R., Pashynska, V., Cafmeyer, J., Guyon, P., Andreae, M. O., Artaxo, P., and Maenhaut, W.: Formation of secondary organic aerosols through photooxidation of isoprene, Science, 303, 1173–1176, https://doi.org/10.1126/science.1092805, 2004.
Crippa, M., Canonaco, F., Lanz, V. A., Äijälä, M., Allan, J. D., Carbone, S., Capes, G., Ceburnis, D., Dall'Osto, M., Day, D. A., DeCarlo, P. F., Ehn, M., Eriksson, A., Freney, E., Hildebrandt Ruiz, L., Hillamo, R., Jimenez, J. L., Junninen, H., Kiendler-Scharr, A., Kortelainen, A.-M., Kulmala, M., Laaksonen, A., Mensah, A. A., Mohr, C., Nemitz, E., O'Dowd, C., Ovadnevaite, J., Pandis, S. N., Petäjä, T., Poulain, L., Saarikoski, S., Sellegri, K., Swietlicki, E., Tiitta, P., Worsnop, D. R., Baltensperger, U., and Prévôt, A. S. H.: Organic aerosol components derived from 25 AMS data sets across Europe using a consistent ME-2 based source apportionment approach, Atmos. Chem. Phys., 14, 6159–6176, https://doi.org/10.5194/acp-14-6159-2014, 2014.
Crippa, P., Castruccio, S., Archer-Nicholls, S., Lebron, G. B., Kuwata, M., Thota, A., Sumin, S., Butt, E., Wiedinmyer, C., and Spracklen, D. V: Population exposure to hazardous air quality due to the 2015 fires in Equatorial Asia, Sci. Rep., 6, 37074, https://doi.org/10.1038/srep37074, 2016.
Cubison, M. J., Ortega, A. M., Hayes, P. L., Farmer, D. K., Day, D., Lechner, M. J., Brune, W. H., Apel, E., Diskin, G. S., Fisher, J. A., Fuelberg, H. E., Hecobian, A., Knapp, D. J., Mikoviny, T., Riemer, D., Sachse, G. W., Sessions, W., Weber, R. J., Weinheimer, A. J., Wisthaler, A., and Jimenez, J. L.: Effects of aging on organic aerosol from open biomass burning smoke in aircraft and laboratory studies, Atmos. Chem. Phys., 11, 12049–12064, https://doi.org/10.5194/acp-11-12049-2011, 2011.
Dennis, R. A., Mayer, J., Applegate, G., Chokkalingam, U., Colfer, C. J. P., Kurniawan, I., Lachowski, H., Maus, P., Permana, R. P., Ruchiat, Y., Stolle, F., Suyanto, and Tomich, T. P.: Fire, people and pixels: linking social science and remote sensing to understand underlying causes and impacts of fires in Indonesia, Hum. Ecol., 33, 465–504, https://doi.org/10.1007/s10745-005-5156-z, 2005.
Donahue, N. M., Robinson, A. L., and Pandis, S. N.: Atmospheric organic particulate matter: from smoke to secondary organic aerosol, Atmos. Environ., 43, 94–106, https://doi.org/10.1016/j.atmosenv.2008.09.055, 2009.
Elser, M., Huang, R.-J., Wolf, R., Slowik, J. G., Wang, Q., Canonaco, F., Li, G., Bozzetti, C., Daellenbach, K. R., Huang, Y., Zhang, R., Li, Z., Cao, J., Baltensperger, U., El-Haddad, I., and Prévôt, A. S. H.: New insights into PM2.5 chemical composition and sources in two major cities in China during extreme haze events using aerosol mass spectrometry, Atmos. Chem. Phys., 16, 3207–3225, https://doi.org/10.5194/acp-16-3207-2016, 2016
Engling, G., He, J., Betha, R., and Balasubramanian, R.: Assessing the regional impact of indonesian biomass burning emissions based on organic molecular tracers and chemical mass balance modeling, Atmos. Chem. Phys., 14, 8043–8054, https://doi.org/10.5194/acp-14-8043-2014, 2014.
Ervens, B., Turpin, B. J., and Weber, R. J.: Secondary organic aerosol formation in cloud droplets and aqueous particles (aqSOA): a review of laboratory, field and model studies, Atmos. Chem. Phys., 11, 11069–11102, https://doi.org/10.5194/acp-11-11069-2011, 2011.
Field, R. D., van der Werf, G. R., and Shen, S. S. P.: Human amplification of drought-induced biomass burning in Indonesia since 1960, Nat. Geosci., 2, 185–188, https://doi.org/10.1038/ngeo443, 2009.
Field, R. D., van der Werf, G. R., Fanin, T., Fetzer, E. J., Fuller, R., Jethva, H., Levy, R., Livesey, N. J., Luo, M., Torres, O., and Worden, H. M.: Indonesian fire activity and smoke pollution in 2015 show persistent nonlinear sensitivity to El Niño-induced drought, P. Natl. Acad. Sci. USA, 113, 9204–9209, https://doi.org/10.1073/pnas.1524888113, 2016.
Fountoukis, C. and Nenes, A.: ISORROPIA II: a computationally efficient thermodynamic equilibrium model for K+–Ca2+–Mg2+––Na+-––Cl−–H2O aerosols, Atmos. Chem. Phys., 7, 4639–4659, https://doi.org/10.5194/acp-7-4639-2007, 2007.
Fröhlich, R., Cubison, M. J., Slowik, J. G., Bukowiecki, N., Prévôt, A. S. H., Baltensperger, U., Schneider, J., Kimmel, J. R., Gonin, M., Rohner, U., Worsnop, D. R., and Jayne, J. T.: The ToF-ACSM: a portable aerosol chemical speciation monitor with TOFMS detection, Atmos. Meas. Tech., 6, 3225–3241, https://doi.org/10.5194/amt-6-3225-2013, 2013.
Fröhlich, R., Cubison, M. J., Slowik, J. G., Bukowiecki, N., Canonaco, F., Croteau, P. L., Gysel, M., Henne, S., Herrmann, E., Jayne, J. T., Steinbacher, M., Worsnop, D. R., Baltensperger, U., and Prévôt, A. S. H.: Fourteen months of on-line measurements of the non-refractory submicron aerosol at the Jungfraujoch (3580 m a.s.l.) – chemical composition, origins and organic aerosol sources, Atmos. Chem. Phys., 15, 11373–11398, https://doi.org/10.5194/acp-15-11373-2015, 2015.
Gaveau, D. L. A., Salim, M. A., Hergoualc'h, K., Locatelli, B., Sloan, S., Wooster, M., Marlier, M. E., Molidena, E., Yaen, H., DeFries, R., Verchot, L., Murdiyarso, D., Nasi, R., Holmgren, P., and Sheil, D.: Major atmospheric emissions from peat fires in Southeast Asia during non-drought years: evidence from the 2013 Sumatran fires, Sci. Rep., 4, 6112, https://doi.org/10.1038/srep06112, 2015.
Gilardoni, S., Massoli, P., Paglione, M., Giulianelli, L., Carbone, C., Rinaldi, M., Decesari, S., Sandrini, S., Costabile, F., Gobbi, G. P., Pietrogrande, M. C., Visentin, M., Scotto, F., Fuzzi, S., and Facchini, M. C.: Direct observation of aqueous secondary organic aerosol from biomass-burning emissions, P. Natl. Acad. Sci., 113, 10013–10018, https://doi.org/10.1073/pnas.1602212113, 2016.
Hayasaka, H., Noguchi, I., Putra, E. I., Yulianti, N., and Vadrevu, K.: Peat-fire-related air pollution in Central Kalimantan, Indonesia, Environ. Pollut., 195, 257–266, https://doi.org/10.1016/j.envpol.2014.06.031, 2014.
Heald, C. L., Kroll, J. H., Jimenez, J. L., Docherty, K. S., DeCarlo, P. F., Aiken, A. C., Chen, Q., Martin, S. T., Farmer, D. K., and Artaxo, P.: A simplified description of the evolution of organic aerosol composition in the atmosphere, Geophys. Res. Lett., 37, L08803, https://doi.org/10.1029/2010GL042737, 2010.
Heil, A. and Goldammer, J.: Smoke-haze pollution: a review of the 1997 episode in Southeast Asia, Reg. Environ. Chang., 2, 24–37, https://doi.org/10.1007/s101130100021, 2001.
Hoffmann, D., Tilgner, A., Iinuma, Y., and Herrmann, H.: Atmospheric stability of levoglucosan: a detailed laboratory and modeling study, Environ. Sci. Technol., 44, 694–699, https://doi.org/10.1021/es902476f, 2010.
Hoffmann, E. H., Tilgner, A., Schrödner, R., Bräuer, P., Wolke, R., and Herrmann, H.: An advanced modeling study on the impacts and atmospheric implications of multiphase dimethyl sulfide chemistry, P. Natl. Acad. Sci. USA, 113, 11776–11781, https://doi.org/10.1073/pnas.1606320113, 2016.
Huang, R.-J., Zhang, Y., Bozzetti, C., Ho, K.-F., Cao, J.-J., Han, Y., Daellenbach, K. R., Slowik, J. G., Platt, S. M., Canonaco, F., Zotter, P., Wolf, R., Pieber, S. M., Bruns, E. A., Crippa, M., Ciarelli, G., Piazzalunga, A., Schwikowski, M., Abbaszade, G., Schnelle-Kreis, J., Zimmermann, R., An, Z., Szidat, S., Baltensperger, U., El Haddad, I., and Prévôt, A. S. H.: High secondary aerosol contribution to particulate pollution during haze events in China, Nature, 514, 218–222, https://doi.org/10.1038/nature13774, 2014.
Huijnen, V., Wooster, M. J., Kaiser, J. W., Gaveau, D. L. A., Flemming, J., Parrington, M., Inness, A., Murdiyarso, D., Main, B., and van Weele, M.: Fire carbon emissions over maritime southeast Asia in 2015 largest since 1997, Sci. Rep., 6, 26886, https://doi.org/10.1038/srep26886, 2016.
Iinuma, Y., Brüggemann, E., Gnauk, T., Müller, K., Andreae, M. O., Helas, G., Parmar, R., and Herrmann, H.: Source characterization of biomass burning particles: the combustion of selected European conifers, African hardwood, savanna grass, and German and Indonesian peat, J. Geophys. Res.-Atmos., 112, D08209, https://doi.org/10.1029/2006JD007120, 2007.
Jayarathne, T., Stockwell, C. E., Gilbert, A. A., Daugherty, K., Cochrane, M. A., Ryan, K. C., Putra, E. I., Saharjo, B. H., Nurhayati, A. D., Albar, I., Yokelson, R. J., and Stone, E. A.: Chemical characterization of fine particulate matter emitted by peat fires in Central Kalimantan, Indonesia, during the 2015 El Niño, Atmos. Chem. Phys., 18, 2585–2600, https://doi.org/10.5194/acp-18-2585-2018, 2018.
Jayne, J. T., Leard, D. C., Zhang, X., Davidovits, P., Smith, K. A., Kolb, C. E., and Worsnop, D. R.: Development of an aerosol mass spectrometer for size and composition analysis of submicron particles, Aerosol Sci. Technol., 33, 49–70, https://doi.org/10.1080/027868200410840, 2000.
Jimenez, J. L., Canagaratna, M. R., Donahue, N. M., Prévôt, A. S. H., Zhang, Q., Kroll, J. H., DeCarlo, P. F., Allan, J. D., Coe, H., Ng, N. L., Aiken, A. C., Docherty, K. S., Ulbrich, I. M., Grieshop, A. P., Robinson, A. L., Duplissy, J., Smith, J. D., Wilson, K. R., Lanz, V. A., Hueglin, C., Sun, Y. L., Tian, J., Laaksonen, A., Raatikainen, T., Rautiainen, J., Vaattovaara, P., Ehn, M., Kulmala, M., Tomlinson, J. M., Collins, D. R., Cubison, M. J., E., Dunlea, J., Huffman, J. A., Onasch, T. B., Alfarra, M. R., Williams, P. I., Bower, K., Kondo, Y., Schneider, J., Drewnick, F., Borrmann, S., Weimer, S., Demerjian, K., Salcedo, D., Cottrell, L., Griffin, R., Takami, A., Miyoshi, T., Hatakeyama, S., Shimono, A., Sun, J. Y., Zhang, Y. M., Dzepina, K., Kimmel, J. R., Sueper, D., Jayne, J. T., Herndon, S. C., Trimborn, A. M., Williams, L. R., Wood, E. C., Middlebrook, A. M., Kolb, C. E., Baltensperger, U., and Worsnop, D. R.: Evolution of organic aerosols in the atmosphere, Science, 326, 1525–1529, https://doi.org/10.1126/science.1180353, 2009.
Klimont, Z., Smith, S. J., and Cofala, J.: The last decade of global anthropogenic sulfur dioxide: 2000–2011 emissions, Environ. Res. Lett., 8, 14003, https://doi.org/10.1088/1748-9326/8/1/014003, 2013.
Koplitz, S. N., Mickley, L. J., Marlier, M. E., Buonocore, J. J., Kim, P. S., Liu, T., Sulprizio, M. P., DeFries, R. S., Jacob, D. J., Schwartz, J., Pongsiri, M., and Myers, S. S.: Public health impacts of the severe haze in Equatorial Asia in September–October 2015: demonstration of a new framework for informing fire management strategies to reduce downwind smoke exposure, Environ. Res. Lett., 11, 94023, https://doi.org/10.1088/1748-9326/11/9/094023, 2016.
Kroll, J. H., Donahue, N. M., Jimenez, J. L., Kessler, S. H., Canagaratna, M. R., Wilson, K. R., Altieri, K. E., Mazzoleni, L. R., Wozniak, A. S., Bluhm, H., Mysak, E. R., Smith, J. D., Kolb, C. E., and Worsnop, D. R.: Carbon oxidation state as a metric for describing the chemistry of atmospheric organic aerosol, Nat. Chem., 3, 133–139, https://doi.org/10.1038/nchem.948, 2011.
Kumar, B., Chakraborty, A., Tripathi, S. N., and Bhattu, D.: Highly time resolved chemical characterization of submicron organic aerosols at a polluted urban location, Environ. Sci. Process. Impacts, 18, 1285–1296, https://doi.org/10.1039/C6EM00392C, 2016.
Kunwar, B. and Kawamura, K.: One-year observations of carbonaceous and nitrogenous components and major ions in the aerosols from subtropical Okinawa Island, an outflow region of Asian dusts, Atmos. Chem. Phys., 14, 1819–1836, https://doi.org/10.5194/acp-14-1819-2014, 2014.
LANCE-FIRMS: MODIS/Aqua+Terra Thermal Anomalies/Fire locations 1km FIRMS V006 NRT (Vector data), https://doi.org/10.5067/FIRMS/MODIS/MCD14DL.NRT.006, 2015.
Lanz, V. A., Alfarra, M. R., Baltensperger, U., Buchmann, B., Hueglin, C., Szidat, S. A., Wehrli, M. N., Wacker, L., Weimer, S., Caseiro, A., Puxbaum, H., and Prévôt, A. S. H.: Source attribution of submicon organic aerosols during wintertime inversions by advanced factor analysis of aerosol mass spectra, Environ. Sci. Technol., 42, 214–220, https://doi.org/10.1021/es0707207, 2008.
Lee, B. P., Li, Y. J., Yu, J. Z., Louie, P. K. K., and Chan, C. K.: Characteristics of submicron particulate matter at the urban roadside in downtown Hong Kong – Overview of 4 months of continuous high-resolution aerosol mass spectrometer measurements, J. Geophys. Res.-Atmos., 120, 7040–7058, https://doi.org/10.1002/2015JD023311, 2015.
Liu, T., Li, Z., Chan, M., and Chan, C. K.: Formation of secondary organic aerosols from gas-phase emissions of heated cooking oils, Atmos. Chem. Phys., 17, 7333–7344, https://doi.org/10.5194/acp-17-7333-2017, 2017.
Margitan, J. J.: Mechanism of the atmospheric oxidation of sulfur dioxide. Catalysis by hydroxyl radicals, J. Phys. Chem., 88, 3314–3318, https://doi.org/10.1021/j150659a035, 1984.
Middlebrook, A. M., Bahreini, R., Jimenez, J. L., and Canagaratna, M. R.: Evaluation of composition-dependent collection efficiencies for the Aerodyne aerosol mass spectrometer using field data, Aerosol Sci. Technol., 46, 258–271, https://doi.org/10.1080/02786826.2011.620041, 2012.
Miettinen, J., Shi, C., and Liew, S. C.: Fire distribution in Peninsular Malaysia, Sumatra and Borneo in 2015 with special emphasis on peatland fires, Environ. Manage., 60, 747–757, https://doi.org/10.1007/s00267-017-0911-7, 2017.
Miyakawa, T., Kanaya, Y., Taketani, F., Tabaru, M., Sugimoto, N., Ozawa, Y., and Takegawa, N.: Ground-based measurement of fluorescent aerosol particles in Tokyo in the spring of 2013: potential impacts of nonbiological materials on autofluorescence measurements of airborne particles, J. Geophys. Res.-Atmos., 120, 1171–1185, https://doi.org/10.1002/2014JD022189, 2015.
Murdiyarso, D., Lebel, L., Gintings, A. N., Tampubolon, S. M. H., Heil, A., and Wasson, M.: Policy responses to complex environmental problems: insights from a science–policy activity on transboundary haze from vegetation fires in Southeast Asia, Agr. Ecosyst. Environ., 104, 47–56, https://doi.org/10.1016/j.agee.2004.01.005, 2004.
Ng, N. L., Canagaratna, M. R., Zhang, Q., Jimenez, J. L., Tian, J., Ulbrich, I. M., Kroll, J. H., Docherty, K. S., Chhabra, P. S., Bahreini, R., Murphy, S. M., Seinfeld, J. H., Hildebrandt, L., Donahue, N. M., DeCarlo, P. F., Lanz, V. A., Prévôt, A. S. H., Dinar, E., Rudich, Y., and Worsnop, D. R.: Organic aerosol components observed in Northern Hemispheric datasets from Aerosol Mass Spectrometry, Atmos. Chem. Phys., 10, 4625–4641, https://doi.org/10.5194/acp-10-4625-2010, 2010.
Ng, N. L., Herndon, S. C., Trimborn, A., Canagaratna, M. R., Croteau, P. L., Onasch, T. B., Sueper, D., Worsnop, D. R., Zhang, Q., Sun, Y. L., and Jayne, J. T.: An aerosol chemical speciation monitor (ACSM) for routine monitoring of the composition and mass concentrations of ambient aerosol, Aerosol Sci. Technol., 45, 780–794, https://doi.org/10.1080/02786826.2011.560211, 2011a.
Ng, N. L., Canagaratna, M. R., Jimenez, J. L., Chhabra, P. S., Seinfeld, J. H., and Worsnop, D. R.: Changes in organic aerosol composition with aging inferred from aerosol mass spectra, Atmos. Chem. Phys., 11, 6465–6474, https://doi.org/10.5194/acp-11-6465-2011, 2011b.
Ng, N. L., Canagaratna, M. R., Jimenez, J. L., Zhang, Q., Ulbrich, I. M., and Worsnop, D. R.: Real-time methods for estimating organic component mass concentrations from aerosol mass spectrometer data, Environ. Sci. Technol., 45, 910–916, https://doi.org/10.1021/es102951k, 2011c.
Nichol, J.: Bioclimatic impacts of the 1994 smoke haze event in Southeast Asia, Atmos. Environ., 31, 1209–1219, https://doi.org/10.1016/S1352-2310(96)00260-9, 1997.
Nichol, J.: Smoke haze in Southeast Asia: a predictable recurrence, Atmos. Environ., 32, 2715–2716, https://doi.org/10.1016/S1352-2310(98)00086-7, 1998.
Ohizumi, T., Take, N., Inomata, Y., Yagoh, H., Endo, T., Takahashi, M., Yanahara, K., and Kusakabe, M.: Long-term variation of the source of sulfate deposition in a leeward area of Asian continent in view of sulfur isotopic composition, Atmos. Environ., 140, 42–51, https://doi.org/10.1016/j.atmosenv.2016.05.057, 2016.
Ortega, A. M., Day, D. A., Cubison, M. J., Brune, W. H., Bon, D., de Gouw, J. A., and Jimenez, J. L.: Secondary organic aerosol formation and primary organic aerosol oxidation from biomass-burning smoke in a flow reactor during FLAME-3, Atmos. Chem. Phys., 13, 11551–11571, https://doi.org/10.5194/acp-13-11551-2013, 2013.
Pachon, J. E., Weber, R. J., Zhang, X., Mulholland, J. A., and Russell, A. G.: Revising the use of potassium (K) in the source apportionment of PM2.5, Atmos. Pollut. Res., 4, 14–21, https://doi.org/10.5094/APR.2013.002, 2013.
Page, S. E., Siegert, F., Rieley, J. O., Boehm, H.-D. V., Jaya, A., and Limin, S.: The amount of carbon released from peat and forest fires in Indonesia during 1997, Nature, 420, 61–65, https://doi.org/10.1038/nature01131, 2002.
Park, S. S. and Cho, S. Y.: Tracking sources and behaviors of water-soluble organic carbon in fine particulate matter measured at an urban site in Korea, Atmos. Environ., 45, 60–72, https://doi.org/10.1016/j.atmosenv.2010.09.045, 2011.
Pavagadhi, S., Betha, R., Venkatesan, S., Balasubramanian, R., and Hande, M. P.: Physicochemical and toxicological characteristics of urban aerosols during a recent Indonesian biomass burning episode, Environ. Sci. Pollut. Res., 20, 2569–2578, https://doi.org/10.1007/s11356-012-1157-9, 2013.
Rolph, G., Stein, A., and Stunder, B.: Real-time environmental applications and display system: READY, Environ. Model. Softw., 95, 210–228, https://doi.org/10.1016/j.envsoft.2017.06.025, 2017.
Sareen, N., Waxman, E. M., Turpin, B. J., Volkamer, R., and Carlton, A. G.: Potential of Aerosol Liquid Water to Facilitate Organic Aerosol Formation: Assessing Knowledge Gaps about Precursors and Partitioning, Environ. Sci. Technol., 51, 3327–3335, https://doi.org/10.1021/acs.est.6b04540, 2017.
See, S. W., Balasubramanian, R., and Wang, W.: A study of the physical, chemical, and optical properties of ambient aerosol particles in Southeast Asia during hazy and nonhazy days, J. Geophys. Res.-Atmos., 111, D10S08, https://doi.org/10.1029/2005JD006180, 2006.
See, S. W., Balasubramanian, R., Rianawati, E., Karthikeyan, S., and Streets, D. G.: Characterization and source apportionment of particulate matter 2.5 µm in Sumatra, Indonesia, during a recent peat fire episode, Environ. Sci. Technol., 41, 3488–3494, https://doi.org/10.1021/es061943k, 2007.
Seinfeld, J. H., Carmichael, G. R., Arimoto, R., Conant, W. C., Brechtel, F. J., Bates, T. S., Cahill, T. A., Clarke, A. D., Doherty, S. J., Flatau, P. J., Huebert, B. J., Kim, J., Markowicz, K. M., Quinn, P. K., Russell, L. M., Russell, P. B., Shimizu, A., Shinozuka, Y., Song, C. H., Tang, Y., Uno, I., Vogelmann, A. M., Weber, R. J., Woo, J.-H., and Zhang, X. Y.: ACE-ASIA: Regional Climatic and Atmospheric Chemical Effects of Asian Dust and Pollution, B. Am. Meteorol. Soc., 85, 367–380, https://doi.org/10.1175/BAMS-85-3-367, 2004.
Siegert, F., Ruecker, G., Hinrichs, A., and Hoffmann, A. A.: Increased damage from fires in logged forests during droughts caused by El Niño, Nature, 414, 437–440, https://doi.org/10.1038/35106547, 2001.
Simoneit, B. R. T., Schauer, J. J., Nolte, C. G., Oros, D. R., Elias, V. O., Fraser, M. P., Rogge, W. F., and Cass, G. R.: Levoglucosan, a tracer for cellulose in biomass burning and atmospheric particles, Atmos. Environ., 33, 173–182, https://doi.org/10.1016/S1352-2310(98)00145-9, 1999.
Smith, T. E. L., Evers, S., Yule, C. M., and Gan, J. Y.: In situ tropical peatland fire emission factors and their variability, as determined by field measurements in Peninsula Malaysia, Global Biogeochem. Cy., 31, 18–31, https://doi.org/10.1002/2017GB005709, 2017.
Stein, A. F., Draxler, R. R., Rolph, G. D., Stunder, B. J. B., Cohen, M. D., and Ngan, F.: NOAA's HYSPLIT atmospheric transport and dispersion modeling system, B. Am. Meteorol. Soc., 96, 2059–2077, https://doi.org/10.1175/BAMS-D-14-00110.1, 2015.
Stockwell, C. E., Jayarathne, T., Cochrane, M. A., Ryan, K. C., Putra, E. I., Saharjo, B. H., Nurhayati, A. D., Albar, I., Blake, D. R., Simpson, I. J., Stone, E. A., and Yokelson, R. J.: Field measurements of trace gases and aerosols emitted by peat fires in Central Kalimantan, Indonesia, during the 2015 El Niño, Atmos. Chem. Phys., 16, 11711–11732, https://doi.org/10.5194/acp-16-11711-2016, 2016.
Streets, D. G., Guttikunda, S. K., and Carmichael, G. R.: The growing contribution of sulfur emissions from ships in Asian waters, 1988–1995, Atmos. Environ., 34, 4425–4439, https://doi.org/10.1016/S1352-2310(00)00175-8, 2000.
Surratt, J. D., Chan, A. W. H., Eddingsaas, N. C., Chan, M., Loza, C. L., Kwan, A. J., Hersey, S. P., Flagan, R. C., Wennberg, P. O., and Seinfeld, J. H.: Reactive intermediates revealed in secondary organic aerosol formation from isoprene, P. Natl. Acad. Sci. USA, 107, 6640–6645, https://doi.org/10.1073/pnas.0911114107, 2010.
Ulbrich, I. M., Canagaratna, M. R., Zhang, Q., Worsnop, D. R., and Jimenez, J. L.: Interpretation of organic components from Positive Matrix Factorization of aerosol mass spectrometric data, Atmos. Chem. Phys., 9, 2891–2918, https://doi.org/10.5194/acp-9-2891-2009, 2009.
Urban, R. C., Lima-Souza, M., Caetano-Silva, L., Queiroz, M. E. C., Nogueira, R. F. P., Allen, A. G., Cardoso, A. A., Held, G., and Campos, M. L. A. M.: Use of levoglucosan, potassium, and water-soluble organic carbon to characterize the origins of biomass-burning aerosols, Atmos. Environ., 61, 562–569, https://doi.org/10.1016/j.atmosenv.2012.07.082, 2012.
Watson, J. G. and Chow, J. C.: Source characterization of major emission sources in the Imperial and Mexicali Valleys along the US/Mexico border, Sci. Total Environ., 276, 33–47, https://doi.org/10.1016/S0048-9697(01)00770-7, 2001.
Watson, J. G., Chow, J. C., and Houck, J. E.: PM2.5 chemical source profiles for vehicle exhaust, vegetative burning, geological material, and coal burning in Northwestern Colorado during 1995, Chemosphere, 43, 1141–1151, https://doi.org/10.1016/S0045-6535(00)00171-5, 2001.
Weber, R. J., Sullivan, A. P., Peltier, R. E., Russell, A., Yan, B., Zheng, M., de Gouw, J., Warneke, C., Brock, C., Holloway, J. S., Atlas, E. L., and Edgerton, E.: A study of secondary organic aerosol formation in the anthropogenic-influenced southeastern United States, J. Geophys. Res., 112, D13302, https://doi.org/10.1029/2007JD008408, 2007.
Weber, R. J., Guo, H., Russell, A. G., and Nenes, A.: High aerosol acidity despite declining atmospheric sulfate concentrations over the past 15 years, Nat. Geosci., 9, 282–285, https://doi.org/10.1038/ngeo2665, 2016.
Ye, Z., Li, Q., Ma, S., Zhou, Q., Gu, Y., Su, Y., Chen, Y., Chen, H., Wang, J., and Ge, X.: Summertime Day-Night Differences of PM2.5 Components (Inorganic Ions, OC, EC, WSOC, WSON, HULIS, and PAHs) in Changzhou, China, Atmos., 8, 1–17, https://doi.org/10.3390/atmos8100189, 2017.
Yu, L., Smith, J., Laskin, A., Anastasio, C., Laskin, J., and Zhang, Q.: Chemical characterization of SOA formed from aqueous-phase reactions of phenols with the triplet excited state of carbonyl and hydroxyl radical, Atmos. Chem. Phys., 14, 13801–13816, https://doi.org/10.5194/acp-14-13801-2014, 2014.
Zhang, H., Surratt, J. D., Lin, Y. H., Bapat, J., and Kamens, R. M.: Effect of relative humidity on SOA formation from isoprene/NO photooxidation: enhancement of 2-methylglyceric acid and its corresponding oligoesters under dry conditions, Atmos. Chem. Phys., 11, 6411–6424, https://doi.org/10.5194/acp-11-6411-2011, 2011.
Zhang, Q., Alfarra, M. R., Worsnop, D. R., Allan, J. D., Coe, H., Canagaratna, M. R., and Jimenez, J. L.: Deconvolution and quantification of hydrocarbon-like and oxygenated organic aerosols based on aerosol mass spectrometry, Environ. Sci. Technol., 39, 4938–4952, https://doi.org/10.1021/es048568l, 2005a.
Zhang, Q., Worsnop, D. R., Canagaratna, M. R., and Jimenez, J. L.: Hydrocarbon-like and oxygenated organic aerosols in Pittsburgh: insights into sources and processes of organic aerosols, Atmos. Chem. Phys., 5, 3289–3311, https://doi.org/10.5194/acp-5-3289-2005, 2005b.
Zhang, Q., Jimenez, J. L., Worsnop, D. R., and Canagaratna, M.: A case study of urban particle acidity and its influence on secondary organic aerosol, Environ. Sci. Technol., 41, 3213–3219, https://doi.org/10.1021/es061812j, 2007a.
Zhang, Q., Jimenez, J. L., Canagaratna, M. R., Allan, J. D., Coe, H., Ulbrich, I., Alfarra, M. R., Takami, A., Middlebrook, A. M., Sun, Y. L., Dzepina, K., Dunlea, E., Docherty, K., DeCarlo, P. F., Salcedo, D., Onasch, T., Jayne, J. T., Miyoshi, T., Shimono, A., Hatakeyama, S., Takegawa, N., Kondo, Y., Schneider, J., Drewnick, F., Borrmann, S., Weimer, S., Demerjian, K., Williams, P., Bower, K., Bahreini, R., Cottrell, L., Griffin, R. J., Rautiainen, J., Sun, J. Y., Zhang, Y. M., and Worsnop, D. R.: Ubiquity and dominance of oxygenated species in organic aerosols in anthropogenically-influenced Northern Hemisphere midlatitudes, Geophys. Res. Lett., 34, L13801, https://doi.org/10.1029/2007GL029979, 2007b.
Zhang, Q. Q., Jimenez, J.-L., Canagaratna, M. R., Ulbrich, I. M., Ng, N. L., Worsnop, D. R., and Sun, Y.: Understanding atmospheric organic aerosols via factor analysis of aerosol mass spectrometry: a review, Anal. Bioanal. Chem., 401, 3045–3067, https://doi.org/10.1007/s00216-011-5355-y, 2011.
Zhang, Z.-H., Khlystov, A., Norford, L. K., Tan, Z.-K., and Balasubramanian, R.: Characterization of traffic-related ambient fine particulate matter (PM2.5) in an Asian city: Environmental and health implications, Atmos. Environ., 161, 132–143, https://doi.org/10.1016/j.atmosenv.2017.04.040, 2017.