the Creative Commons Attribution 4.0 License.
the Creative Commons Attribution 4.0 License.
 | 19 Oct 2018
The monsoon effect on energy and carbon exchange processes over a highland lake in the southwest of China
Huizhi Liu
Lujun Xu
Yang Liu
Lei Wang
Erhai Lake is a subtropical highland shallow lake on the southeast margin of the Tibetan Plateau, which is influenced by both South Asian and East Asian summer monsoons. Based on 4 years of continuous eddy covariance (EC) data over Erhai Lake, the monsoon effect on water–atmosphere exchange processes is investigated by comparing the energy and CO2 flux patterns and their main drivers during pre-monsoon (March–April), monsoon (May–October) and post-monsoon (November–December) periods. The results show that the atmospheric properties display a large difference during the three different periods. There is a negative difference between water surface and air temperature (T) during the pre-monsoon period, while a positive T during the post-monsoon period. The diurnal sensible heat flux (Hs) is larger during the post-monsoon period, while the latent heat flux (LE) is larger during the monsoon period. The monthly average Hs and heat storage (Q) in the lake remain negative during the pre-monsoon period and the early monsoon period, and they become positive in the middle monsoon period, which indicates that the lake absorbs heat at first and releases it subsequently. LE plays a dominating role in the energy partitioning of the lake. The Bowen ratio is higher during the post-monsoon period. The uptake of CO2 flux is observed in the middle of the day during monsoon and post-monsoon periods. The ΔT is the main driver for Hs and the effect of ΔT is increased as timescales are extended from half-hourly to monthly. The wind speed has a weak effect on Hs but a strong effect on LE and CO2 fluxes. Similar main drivers for Hs are found during the pre-monsoon and post-monsoon periods, which is also found for CO2 flux, indicating a large impact of the monsoon on the heat and carbon exchange processes over Erhai Lake.
- Article
(5376 KB) - Full-text XML
- BibTeX
- EndNote


There are 304 million lakes globally and they are of significant importance in determining local weather and climate through complex physical, biochemical and biological interactions (Cole et al., 2001; Downing et al., 2006; Shao et al., 2015). Because of the substantial differences in underlying surface characteristics between lake surface and its surrounding land surface (i.e., albedo, roughness, heat capacity; O'Donnell et al., 2010), the carbon and energy exchange processes over lakes are expected to respond different way to climate change. Lakes react rapidly to a change in the atmospheric parameters and are able to modify the surrounding atmospheric circulation (Marie-Noëlle et al., 2012). Plenty of studies on water–atmosphere carbon and energy exchange processes have been reported over high-latitude water bodies (Nordbo et al., 2011; Huotari et al., 2011; Mammarella et al., 2015). However, the characteristics of water–atmosphere exchange processes differ for lake size, water depth, regional climate and geographical location (Liu et al., 2009). High-altitude lakes are exposed to more extreme meteorological conditions and are more sensitive to variations in meteorological forcing (Rueda et al., 2007). Shallow lakes respond more quickly to changes in the atmospheric forcing due to a smaller heat capacity (Liu et al., 2012; Zhang and Liu, 2013). Understanding the turbulent exchange processes between the lake surface and atmosphere and the response to atmospheric properties is essential for improving numerical weather prediction and climate models (Dutra et al., 2010; Nordbo et al., 2011).
The change in atmospheric properties over a water surface can cause large fluctuations in atmospheric forcing for lake–atmosphere interactions, and subsequently affects the turbulent exchange processes (Lenters et al., 2005; Liu et al., 2011; Huotari et al., 2011; Z. Li et al., 2015). The southeasterly wind with warm moist air masses reduced and inverted the vertical temperature difference between water surface and atmosphere to be negative over a large high-latitude saline lake (Qinghai Lake) on the northeastern Qinghai–Tibetan Plateau (QTP) in China (Li et al., 2016). The cold fronts and the meteorological properties of the air masses behind cold fronts (e.g., windy, cold and dry) significantly promoted turbulent exchange of sensible heat (Hs) and latent heat (LE) through enhanced turbulent mixing (thermally and mechanically), whereas southerly winds with warm and humid air masses generally suppressed turbulent exchanges of Hs and LE over a mid-latitude large reservoir in Mississippi (Liu et al., 2009, 2012). In response to the changes in the weather conditions, the heat balance over a large tropical reservoir in Brazil is substantially altered, and the heat loss can be twice or 3-fold greater during cold-front days than that during the non-cold-front days (Curtarelli et al., 2014). Consistent diurnal peaks in LE flux during the afternoon were observed as a result of strong, dry winds coinciding with peak water surface temperatures over a small subtropical reservoir in Australia (McGloin et al., 2015). An increasing sensible heat flux over the lake retarded the cooling of lower atmosphere (below 500 m) and weakened the vertical potential temperature gradient over the lake, while increasing wind speed and vertical wind shear further facilitated the buoyancy flux to exert a higher heat convection efficiency when cold air arrived over Ngoring Lake in the Tibetan Plateau (TP; Li et al., 2017).
The CO2 emissions from lakes are traditionally measured by non-continuous or indirect methods, e.g., floating chamber (Riera et al., 1999) and boundary layer transfer techniques (Cole and Caraco, 1998). The uncertainty in the floating chamber method is that the flux it measures only represents a very small area and it produces biases because the disturbances in the water–air surface (Vachon et al., 2010). The boundary layer method estimates CO2 flux by the difference in CO2 concentration between the water and atmosphere and the gas transfer velocity, which is traditionally parameterized only by wind speed (Cole and Caraco, 1998). However, it has been reported that different processes including convection, microwave breaking and stratification could influence the gas transfer velocity (Zappa et al., 2001; Eugster et al., 2003; Podgrajsek et al., 2014). The eddy covariance technique (EC) could provide long-term continuous measurements and the high-resolution data allows for examining the relation between gas exchange velocity and other meteorological variables besides wind speed (Mammarella et al., 2015). The changes in atmospheric properties could affect the lake–air CO2 flux. Huotari et al. (2011) reported that the CO2 efflux was enhanced under persistent extratropical cyclone activities over high-latitude water bodies. The synoptic weather events associating with extratropical cyclones produced larger CO2 effluxes by bringing the bottom rich CO2 water to the surface through upwelling, internal wave-induced mixing and mixing by convection (Liu et al., 2016). The windy and stormy days increased 16 % of the annual CO2 effluxes over Ross Barnett reservoir in central Mississippi, USA (Liu et al., 2016). A 15-year long study found that the amount of precipitation had a large effect on dissolved organic carbon (DOC) concentrations in rivers (Pumpanen et al., 2014). The waterside convection was believed to cause the higher CO2 fluxes during night compared to day (Podgrajsek et al., 2014).
Erhai Lake is a subtropical highland shallow lake on the southeast margin of TP, which is influenced by both the South Asian and East Asian summer monsoons. The summer monsoon induces an abrupt change in large-scale atmospheric circulation and convective activity over Asia, and carries in air mass with distinct atmospheric properties (i.e., air temperature, wind direction, relative humidity; Li and Yanai, 1996; Lau and Yang, 1997; Zhou et al., 2012). The seasonal reversals of atmospheric properties caused by summer monsoon circulation play an important role in regulating land–atmosphere heat and water exchange processes (Flohn, 1957; Hsu et al., 1999). The land–atmosphere exchange processes are found to be closely related to the onset and retreat of summer monsoon (Zhang et al., 2012). It is reported that most of the available energy was transformed into Hs before the arrival of monsoonal winds, whereas LE increased and exceeded Hs after the onset of monsoonal wind (Xu et al., 2009; Mauder et al., 2007; Li et al., 2016). Considering the substantial difference in atmospheric properties during the monsoon and non-monsoon periods, the water–atmosphere carbon and energy exchange processes are expected to display large differences. However, few studies have reported the variation in heat and carbon fluxes over lakes during different monsoonal periods, and the effect of the monsoon on water–atmosphere heat and carbon is not clear.
Four years of continuous EC measurements from 2012 to 2015 have been obtained over Erhai Lake. The summer monsoon generally bursts in May and retreats in October. According to the activity of summer monsoon, three monsoon periods are defined, including pre-monsoon (March–April), monsoon (May–October) and post-monsoon (November–December) periods. We hypothesize that the contrasting atmospheric properties during these three different monsoon periods play an important role in modulating the turbulent exchange processes over Erhai Lake. The objectives of this study are to investigate the energy and CO2 exchange processes and their response to changes in atmospheric properties during different monsoon periods.
2.1 Site description
Erhai Lake ( N, E) is located on the southeast margin of TP, southwest China, (Fig. 1). The altitude of the region is about 1972 m. The lake has a length of 42.6 km from south to north, and a width ranging from 3.1 to 8.8 km from east to west, with a total area of 256.5 km2. The water depth of the lake varies from 10 to 20.7 m. The water depth around the tower is about 10 m. The land surface of its surrounding area mainly consists of cropland and towns. Because of the subtropical climate, no ice period occurs throughout the whole year. More than 100 rivers and streams drain into the lake, with only one outlet in the southwest (Xier River). The water level is artificially regulated, ranging between 1971.1 and 1974.1 m. Due to the full mixing of the water, only a short stratification period occurs in the middle of the year (Feng et al., 2015).
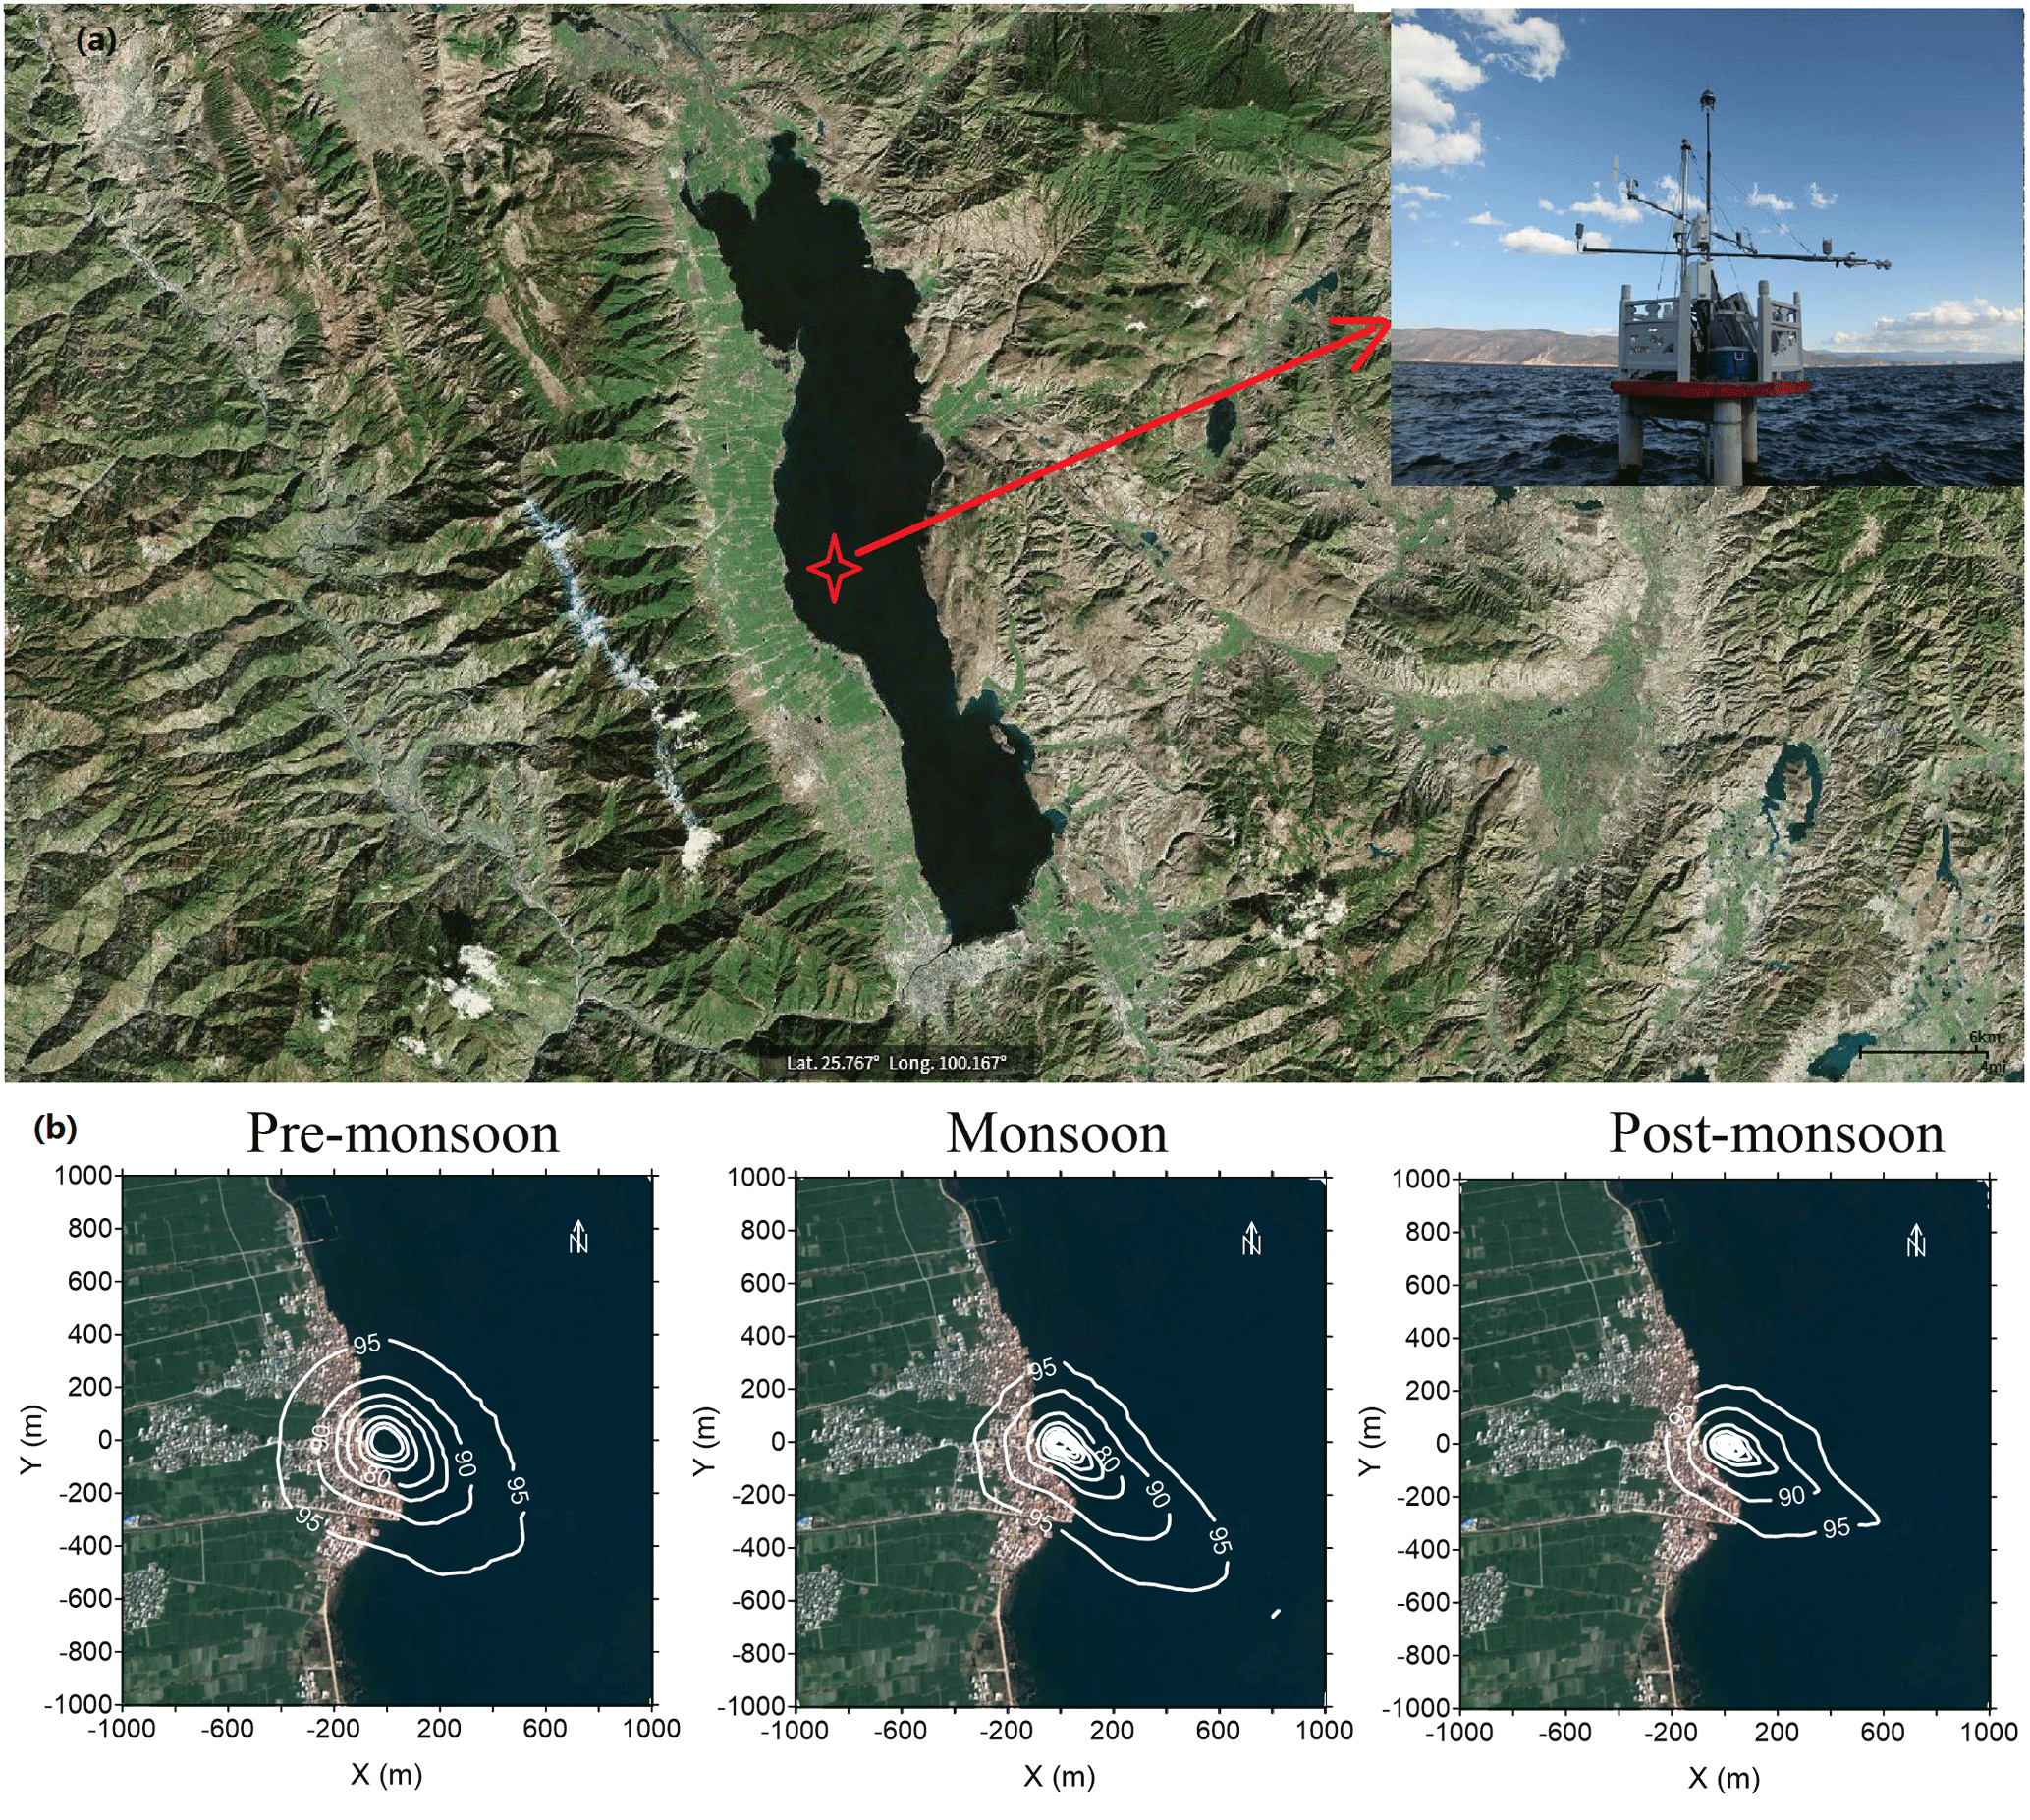
Figure 1(a) The location of Erhai Lake (Google) and the eddy covariance measurement system (the red star denotes the flux tower); (b) Average footprint source over Erhai Lake flux tower during the three different monsoon periods (pre-monsoon period, monsoon period and post-monsoon period) from 2012 to 2015. The maximum radius of contour lines shows the source area contributing to 95 % of flux.
Erhai Lake has a subtropical highland monsoon climate, characterized by a distinct wet and dry season. During the monsoon period (May–October), the area is mainly controlled by both the southwest flow from tropical depression in the Bay of Bengal and southeast flow from the subtropical Pacific high. The moist marine air mass brings in abundant water vapor and intensive precipitation. During the non-monsoon period (November–April), as a result of the southward movement of the westerlies, the area is dominated by continental air mass mainly from desert and arid area of Arabian countries, and characterized by a warm and dry season. The average annual precipitation from 1981 to 2010 is 1055 mm. The majority of precipitation is concentrated in the monsoon period, with an average of 895 mm. The average precipitation is only 64 mm during the pre-monsoon period, and 42 mm during the post-monsoon period.
2.2 Observation
The EC instrument is mounted on a concrete platform at a height of 2.5 m (Fig. 1). The turbulent fluxes (Hs and LE) and CO2 flux are simultaneously measured with an ultrasonic anemometer (CSAT3, Campbell Scientific, Logan, UT, USA) and an open-path infrared gas analyzer (LI-7500, LI-COR Inc., Lincoln, NE, USA). The three components of wind and virtual air temperature are measured with an ultrasonic anemometer. The H2O and CO2 concentrations are acquired by an infrared gas analyzer. The EC sensors are mounted on a pipe orienting to the prevailing wind direction (southeast), which is shown in Fig. 2. A CR500 data logger (CR500, Campbell Scientific) is applied to record the measurements with a 10 Hz sampling frequency. Water temperature at eight depths (0.05, 0.2, 0.5, 1, 2, 4, 6 and 8 m below water surface) are measured with temperature probes (model 109-L, Campbell Scientific, inc., USA) to obtain the water temperature profile, which are tied to a buoy and can change with the water level. The water surface temperature (Ts) is calculated from longwave radiation. Moreover, different micro-meteorological elements are also measured at a height of 1.5 m above the platform. Air temperature and relative humidity are also measured (HMP45C, Vaisala, Vantaa, Finland). The radiation balance components, including upward and downward shortwave radiation as well as upward and downward longwave radiation, are measured with CNR1 (CNR1, Kipp & Zonen B.V., Delft, the Netherlands). Meanwhile, the photosynthetic active radiation (PAR) is also measured with an LI-190SB quantum sensor (Campbell Scientific inc., USA). The wind speed and wind direction is measured with a cup anemometer (034B, Met One Instruments Inc., Grants Pass, OR, USA). The Dali National Climatic Observatory, with a distance of 15 km from the flux tower, has provided the precipitation data.
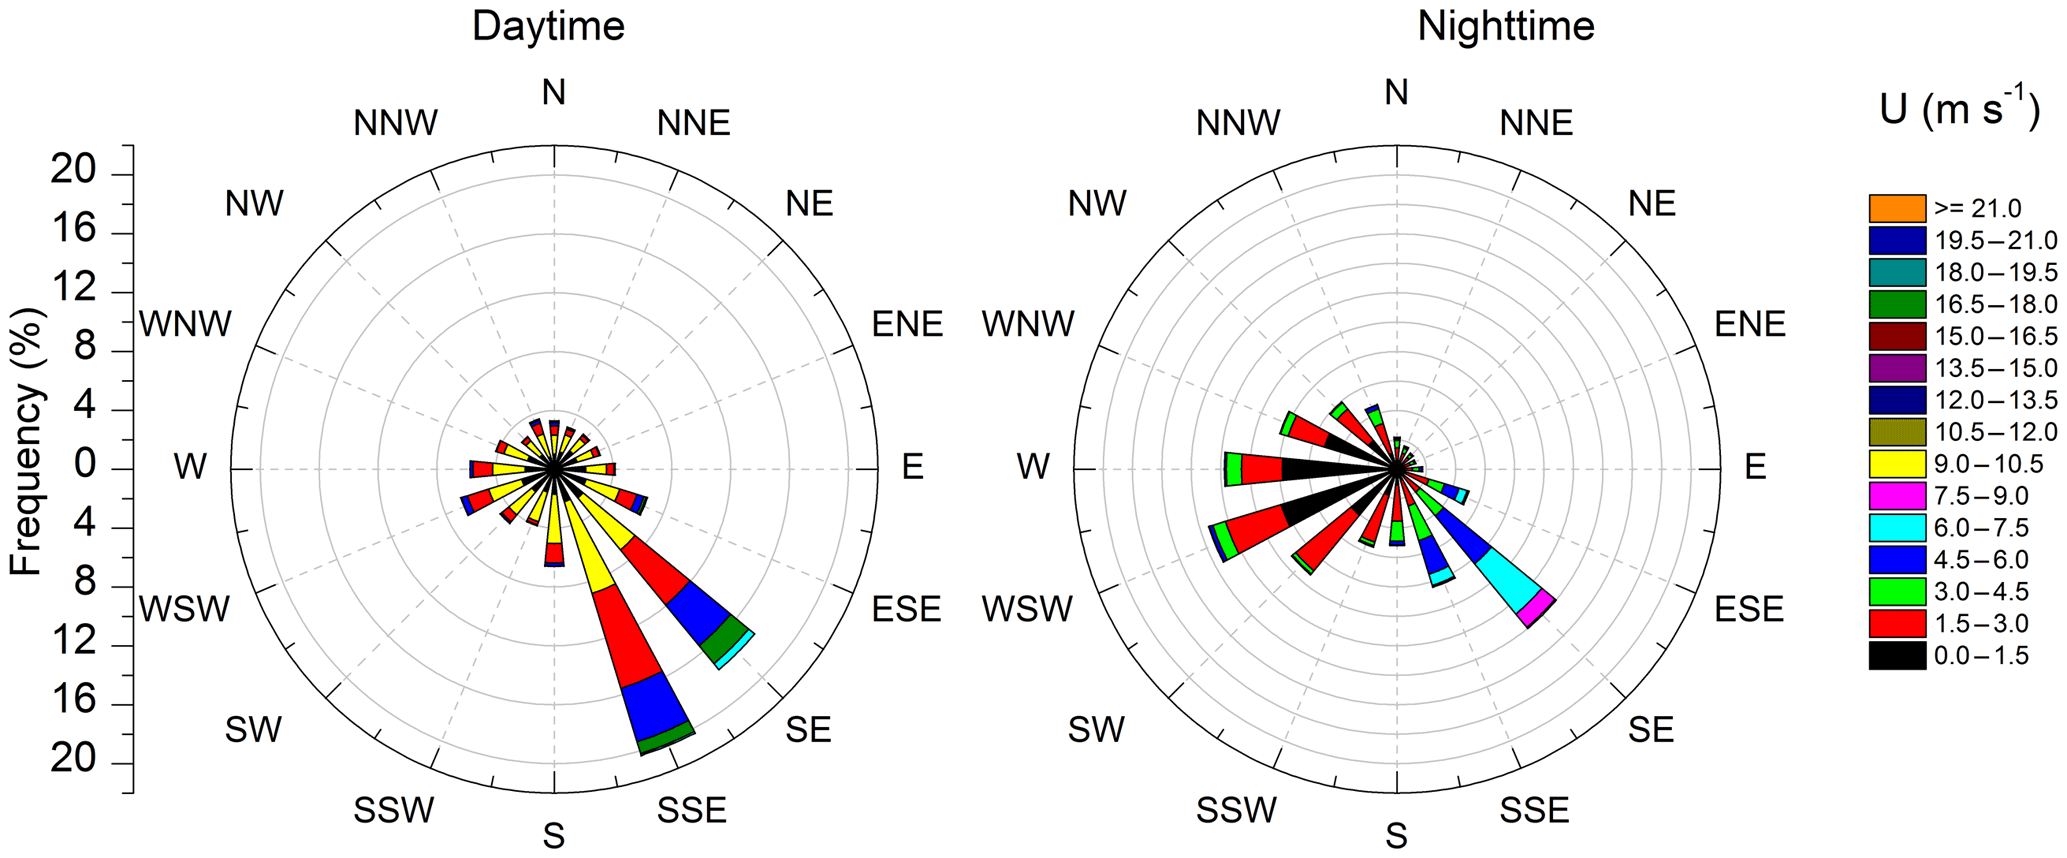
Figure 2The wind rose of Erhai Lake during daytime (when downward shortwave radiation is greater than 20 W m−2) and nighttime (when downward shortwave radiation is less than 20 W m−2) from 2012 to 2015.
2.3 Data processing
The raw data are checked and spikes as a result of physical noise and instrument malfunction are discarded according to the procedures suggested by Vickers and Mahrt (1997). The data values measured with the AGC (active gain control) that are more than 40, which is recorded by the LI-7500, are also filtered. The abnormal data points with a magnitude exceeding 3.5 times the average standard deviations are also needed to be removed. The collected raw 10 Hz data are processed with EddyPro software, version 4.2 (LI-COR Inc., 2013, USA). The double rotation method is applied to adjust the coordinate system and tilt the vertical wind speed to be zero (Kaimal and Finnigan, 1994). The 30 min average turbulent fluxes are calculated with the block average method. The time lags between anemometric variables and gas analyzer measurements are compensated by the circular correlation procedure, which determines the time lag that maximizes the covariance of two variables, within a window of plausible time lags (Fan et al., 1990). Density corrections for LE and CO2 flux are also applied with the Webb–Pearman–Leuning (WPL) correction procedure (Webb et al., 1980). We evaluate the uncertainty in the WPL correction on CO2 flux based on the raw data from October of 2015. The daily average CO2 flux with and without WPL correction is 0.91±1.95 and g C m−2 d−1, respectively, indicating the large effect of WPL correction. The high-pass filtering effect is also corrected to compensate the flux losses at a high frequency (Moncrieff et al., 2004). Quality checks for stability and integral turbulent characteristic tests are applied to remove the low-quality fluxes (Foken et al., 2004). Data quality is marked following the schemes of Mauder and Foken (2006), and the high and moderate quality data are retained. After data quality control, the available data for LE, Hs and CO2 flux account for 54 %, 66 % and 55 %, respectively. A 3-month data gap from September to November occurred in 2014 due to instrument failure. More detailed information about measurements and post-processing procedures can be found in our previous study (Liu et al., 2015).
The drag coefficient (the momentum bulk transfer coefficient, CD), Dalton number (the heat bulk transfer coefficient, CH) and Stanton number (the moisture bulk transfer coefficient, CE) are determined by the bulk transfer relations, which are widely used for computing ocean–air fluxes in numerical models (Fairall et al., 2003):
where τ is momentum flux (N m−2), ρa is air density (kg m−3), U is wind speed, Ca is the specific heat of air (1005 J kg−1 K−1), Ts is water surface temperature (∘C), Ta is air temperature (∘C), LV is latent heat of vaporization (J kg−1), qs is specific humidity at saturation (kg kg−1) and qa is specific humidity (kg kg−1).
The heat storage (ΔQ) in the lake is also calculated:
where Ts is water temperature (∘C), ρw is the density of water (kg m−3), Cp is the specific heat of water at constant pressure (4192 J kg−1 K−1), is the depth-weighted time derivative of the water column temperature (K s−1), and z is maximum depth of measured water temperature profile (m). The ΔQ is defined as positive when it is absorbed by the lake surface (heat is stored by the lake).
Because the flux site is close to the west bank of the lake, a footprint model (Kormann and Meixner, 2001) is applied to analyze the distribution of source area contributing to the flux. The 95 % of source area contributing to flux ranges from 600 m in the southeast direction and 400 m in the west direction during different periods (Fig. 1). Because the flux in the west direction mainly originates from the land surface, the flux in the wind direction (225 to 315∘) is excluded. The flux during the pre-monsoon period is more affected by land surface compared to the other two periods. Nearly 80 % flux originates from the lake surface during monsoon and post-monsoon periods. Approximately 22 %, 15 % and 8 % of flux data are filtered based on the footprint analysis.
The data recorded during rainfall is also discarded. According to the quality control procedure presented above, around 34 % of the Hs, 46 % of LE and 45 % of CO2 fluxes are removed and the retained data are analyzed in our study. Although the gap ratio is large, it is similar to other studies over lakes (Nordbo et al., 2011; Goldbach and Kuttler, 2015; Shao et al., 2015). A long, large gap between August and November exists in 2014 due to a malfunction. The times given in this study are in Beijing Time (UTC+8).
3.1 Atmospheric properties during different monsoon periods
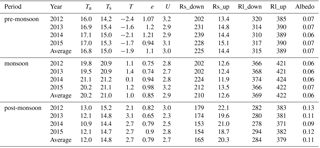
The atmospheric properties show large differences during different monsoon periods (Fig. 3; Table 1). There is a similar diurnal course for air temperature (Ta) during different monsoon periods, but with a large difference for the magnitudes. The diurnal mean Ta is the largest during the monsoon period, second largest during the pre-monsoon period and smallest during the post-monsoon period. The difference for diurnal mean Ta between the monsoon and pre-monsoon periods is smaller (3.4 ∘C) than that between the monsoon and post-monsoon periods (8.1 ∘C). There is a large difference for diurnal mean water surface temperature (Ts) between the monsoon period and the other two periods (around 6∘C), but a small difference between pre-monsoon and post-monsoon periods (around 0.2 ∘C). The difference between water surface and air temperature (ΔT) remains negative during most of the pre-monsoon period but positive during the post-monsoon period, with an average values of −1.9 and 2.7 ∘C, respectively. The ΔT has a maximum around 08:00 and minimum around 18:00 (all times in this study are according to Beijing Time, UTC+8), which is opposite with the diurnal pattern of Ta and Ts.

Figure 3The average diurnal pattern of air temperature (Ta), water surface temperature (Ts), difference between water surface temperature and air temperature (ΔT), water–air vapor pressure deficit (Δe) and wind speed (U) during pre-monsoon, monsoon and post-monsoon periods from 2012 to 2015.
Table 1Daily average air temperature (Ta, ∘C), water surface temperature (Ts, ∘C), difference between water surface temperature and air temperature (ΔT, ∘C), vapor pressure difference (e, kPa) between water surface (es, kPa) and the air (ea, kPa), wind speed (U, m s−1), the downward and upward shortwave radiation flux (Rs_down and Rs_up, W m−2), the downward and upward long wave radiation flux (Rl_down and Rl_up, W m−2), and albedo during pre-monsoon, monsoon and post-monsoon periods from 2012 to 2015.
The water–air vapor pressure difference (Δe) has an opposite diurnal pattern with ΔT, which has a maximum around 18:00 and the minimum around 08:00. Overall, Δe is relatively high during the pre-monsoon period and low during the post-monsoon period, with average values of 1.10 and 0.79 kPa, respectively. There is a larger difference for Δe between pre-monsoon period and monsoon period during 2012 and 2013, but a larger difference between post-monsoon period and monsoon period during 2014 and 2015, attributed to the annual variation in timing distribution of precipitation. The wind speed (U) has a larger difference in daytime than nighttime during different periods. The diurnal mean U is slightly higher during the pre-monsoon period than the other two periods. In general, the pre-monsoon period is characterized by higher U and e, while the post-monsoon period is characterized by a lower U and Ta. The Ta and Ts are the highest during the monsoon period. There is a large difference for average Ts (around 6 ∘C) between monsoon period and the other two periods, but a slight difference between pre-monsoon and post-monsoon periods. The diurnal T remains negative during the pre-monsoon period but positive during the post-monsoon period. A weak diurnal variation in T is observed during the monsoon period.
The wind direction over Erhai Lake displays a typical diurnal pattern during the three study periods (Fig. 4). Overall, the southeasterly wind and westerly wind are dominant in daytime and nighttime, respectively, which represents the lake breeze and land breeze. Generally, the wind direction shifts from west to southeast in the morning (around 09:00), indicating the onset of lake breeze. The lake breeze lasts until the afternoon. Then the wind direction shifts abruptly from southeast to west around 17:00, which indicates that the lake breeze transforms into land breeze. The numerical simulation of local circulation over Erhai Lake also proved the development of lake breeze circulation during daytime and land breeze circulation during nighttime (Xu et al., 2018). The wind direction switches at the time of ΔT reaching a maximum or minimum. The alternation between lake breeze and land breeze is more obvious during pre-monsoon and post-monsoon periods, attributed to a larger thermal difference between land and lake surface, compared to monsoon period. Because the region is mainly dominated by a westerly belt during non-monsoon season, a strong westerly wind is observed during nighttime during pre-monsoon and post-monsoon periods. During the monsoon period, due to the northward motion of a westerly belt, the westerly wind becomes weak during nighttime, while the southwesterly and southeasterly flow, respectively, from tropical depression in the Bay of Bengal and subtropical Pacific high, dominate the Dali region. However, Cang Mountain, which is located close to the western side of Erhai Lake, has obstructed the passing of southwesterly wind and makes the southeasterly wind the prevailing wind over Erhai Lake during this period. Because of the continuous southeasterly wind during nighttime, a weak circulation of lake to land breeze occurs during the monsoon period.
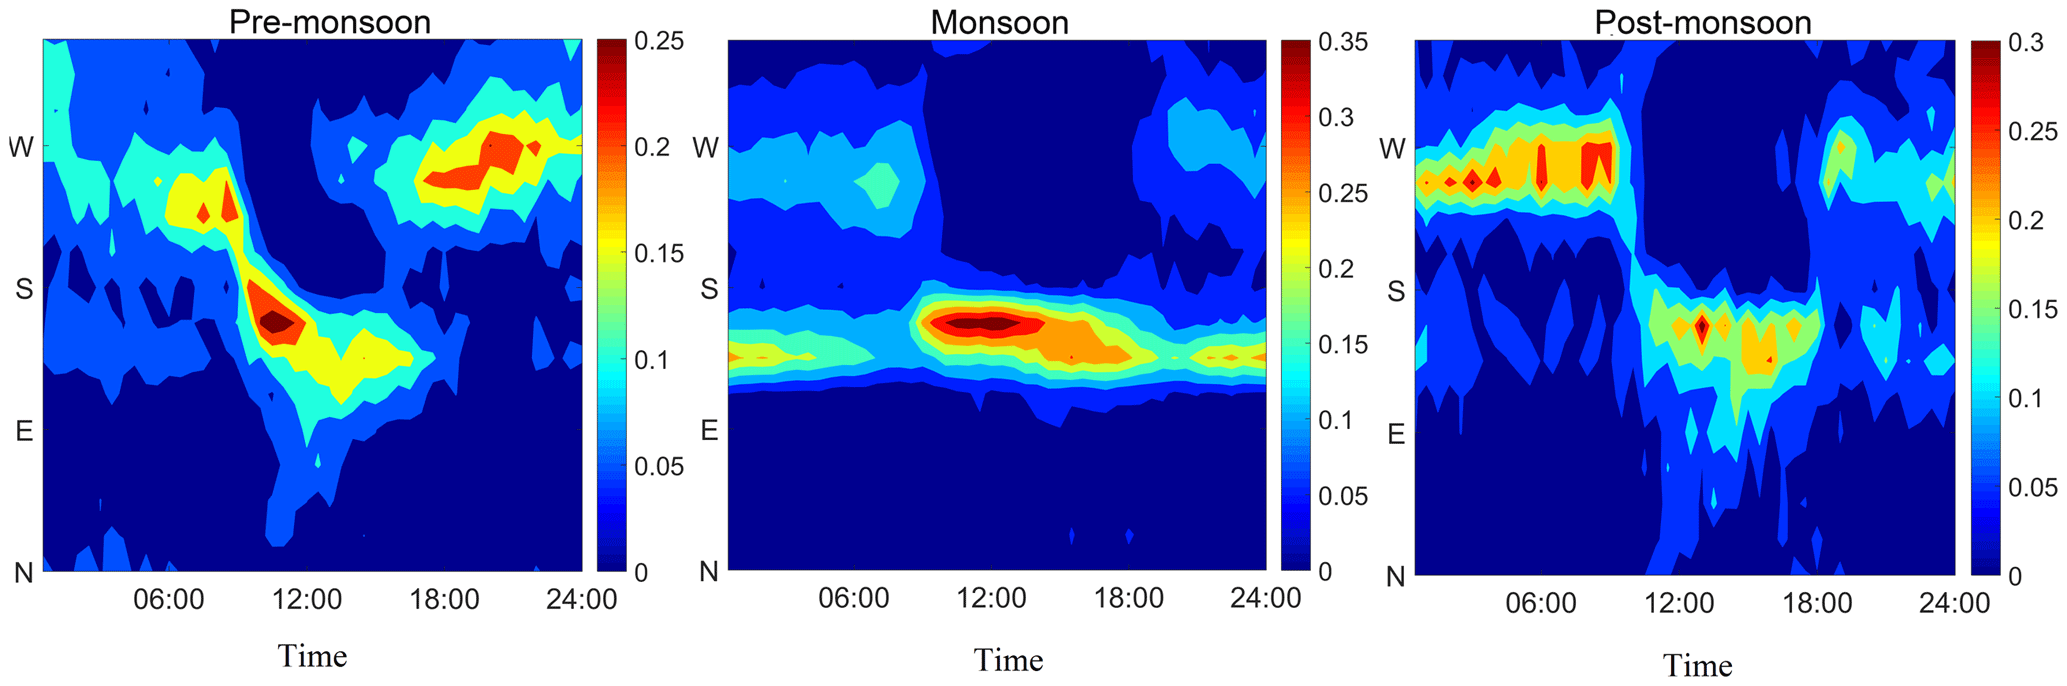
Figure 4The average diurnal pattern of frequency distribution of wind direction during pre-monsoon, monsoon and post-monsoon periods from 2012 to 2015.
The characteristics of air masses from different wind directions are examined by the bin-averaged wind speed (U), air temperature and relative humidity against wind directions (Fig. 5). The U shows a large variability against wind direction. The wind speed from the southeast is the highest than that from other directions, which indicates that the lake breeze is stronger than land breeze. The southeasterly wind is stronger during the monsoon period, whereas the land breeze, which is from the west direction, is stronger during the pre-monsoon period.

Figure 5The bin-averaged wind speed (U), air temperature (Ta) and relative humidity (RH) along with wind direction (WD) during pre-monsoon, monsoon and post-monsoon periods from 2012 to 2015. Every 22.5∘ was bin averaged.
As a result of the control of the maritime atmospheric mass, the air mass during the monsoon period is the warmest and wettest, which has a higher Ta and relative humidity (RH) than that during the other two periods. The characteristics of air masses also show variability in different wind directions. The air mass from the southeast direction is warmer than that from the west direction during both monsoon and post-monsoon periods, while it is opposite during the pre-monsoon period. The land surface is warmed faster during the early period and cooled faster during the latter period of the whole year compared to the lake surface, which results in a warmer air mass from the land surface during the pre-monsoon period, while a colder air mass during the other two periods. The difference in RH between pre-monsoon and post-monsoon periods is small in the southeast direction but large in the west direction. The RH of air mass from west direction is higher during the post-monsoon period than pre-monsoon period, which is attributed to the intensive precipitation during the monsoon period.
The atmospheric stratification and bulk transfer coefficients for Erhai Lake during different monsoon periods are also analyzed, as they are fundamental parameters for computing sensible and latent heat fluxes between water surface and air in numeric models (Fairall et al., 2003). The atmospheric surface layer is mainly near neutral stratification during the three study periods (Fig. 6). As Erhai Lake is located in a subtropical highland area, the seasonal uniformly air temperature and the abundance of cloud have contributed to the occurrence of neutral stratification. During the pre-monsoon period, the near neutral stratification accounts for as much as 85 % in daytime and 92 % during nighttime, respectively. Compared to pre-monsoon period, the near neutral stratification declined about 20 % in daytime and 10 % during nighttime during the other two periods, as a result of the increase in weakly unstable and unstable stratification. The weakly unstable stratification accounts for about 12 % during the monsoon period and post-monsoon period, but only 3 % during the pre-monsoon period. Most of the unstable stratification occurs during monsoon and post-monsoon periods, and the percentage is much higher in daytime (20 %) than nighttime (about 5 %), while it is scarcely observed during the pre-monsoon period. On the contrary, the stable stratification is hardly observed during the post-monsoon period. The difference for the atmospheric stability during the three periods is primarily caused by the variation in ΔT, which can be roughly used as an indicator of atmosphere stability (Derecki, 1981; Croley, 1989). An unstable stratification typically associates with a positive ΔT (Ts>Ta). On diurnal scales, the Ts is higher than Ta most of the time during the post-monsoon period, while it is opposite during the pre-monsoon period (Fig. 3), which results in the occurrence of unstable stratification during the post-monsoon period and stable stratification during the pre-monsoon period, respectively. The stable stratification was also observed in the spring and summer in high-latitude lakes since the Ts increases much more slowly than the overlying Ta (Oswald and Rouse, 2004). While in the fall and winter, the air temperature decreases faster than the water surface, resulting in a positive ΔT.
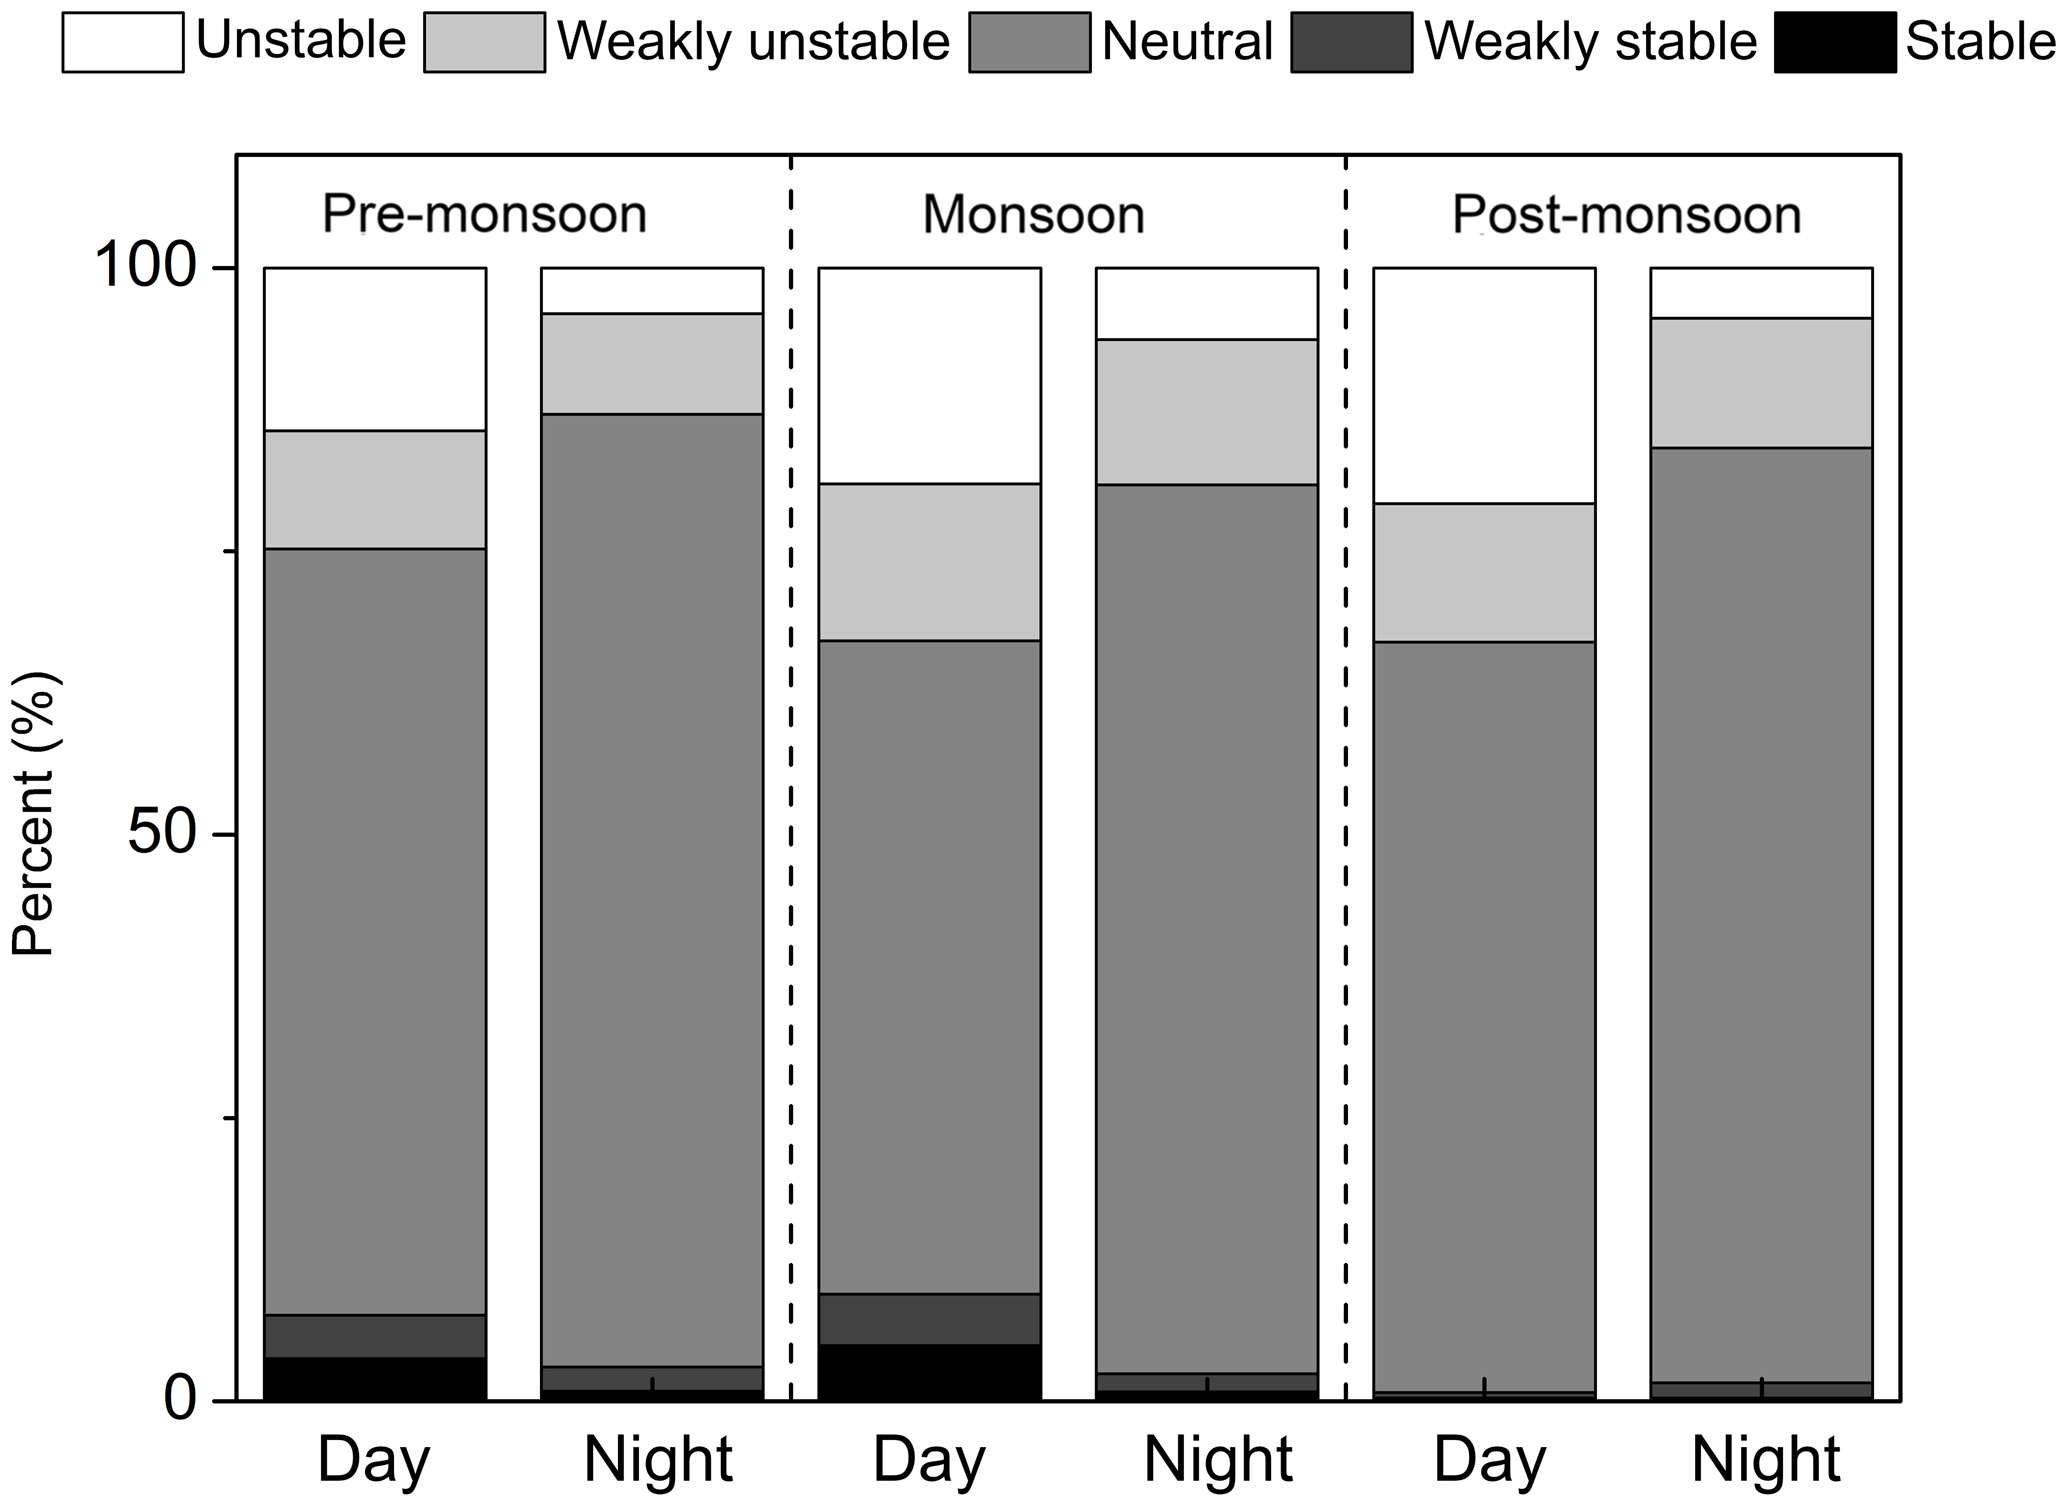
Figure 6Frequency percent of stability classes in day (when the shortwave radiation is >20 W m−2) and night (when the shortwave radiation is ≤20 W m−2) during pre-monsoon, monsoon and post-monsoon periods from 2012 to 2015. The stable classes are defined as atmosphere stability (, where z is the measurement height and L is the Monin-Obukhov length): stable (ζ>0.1), weakly stable (), near neutral (), weakly unstable () and unstable ().
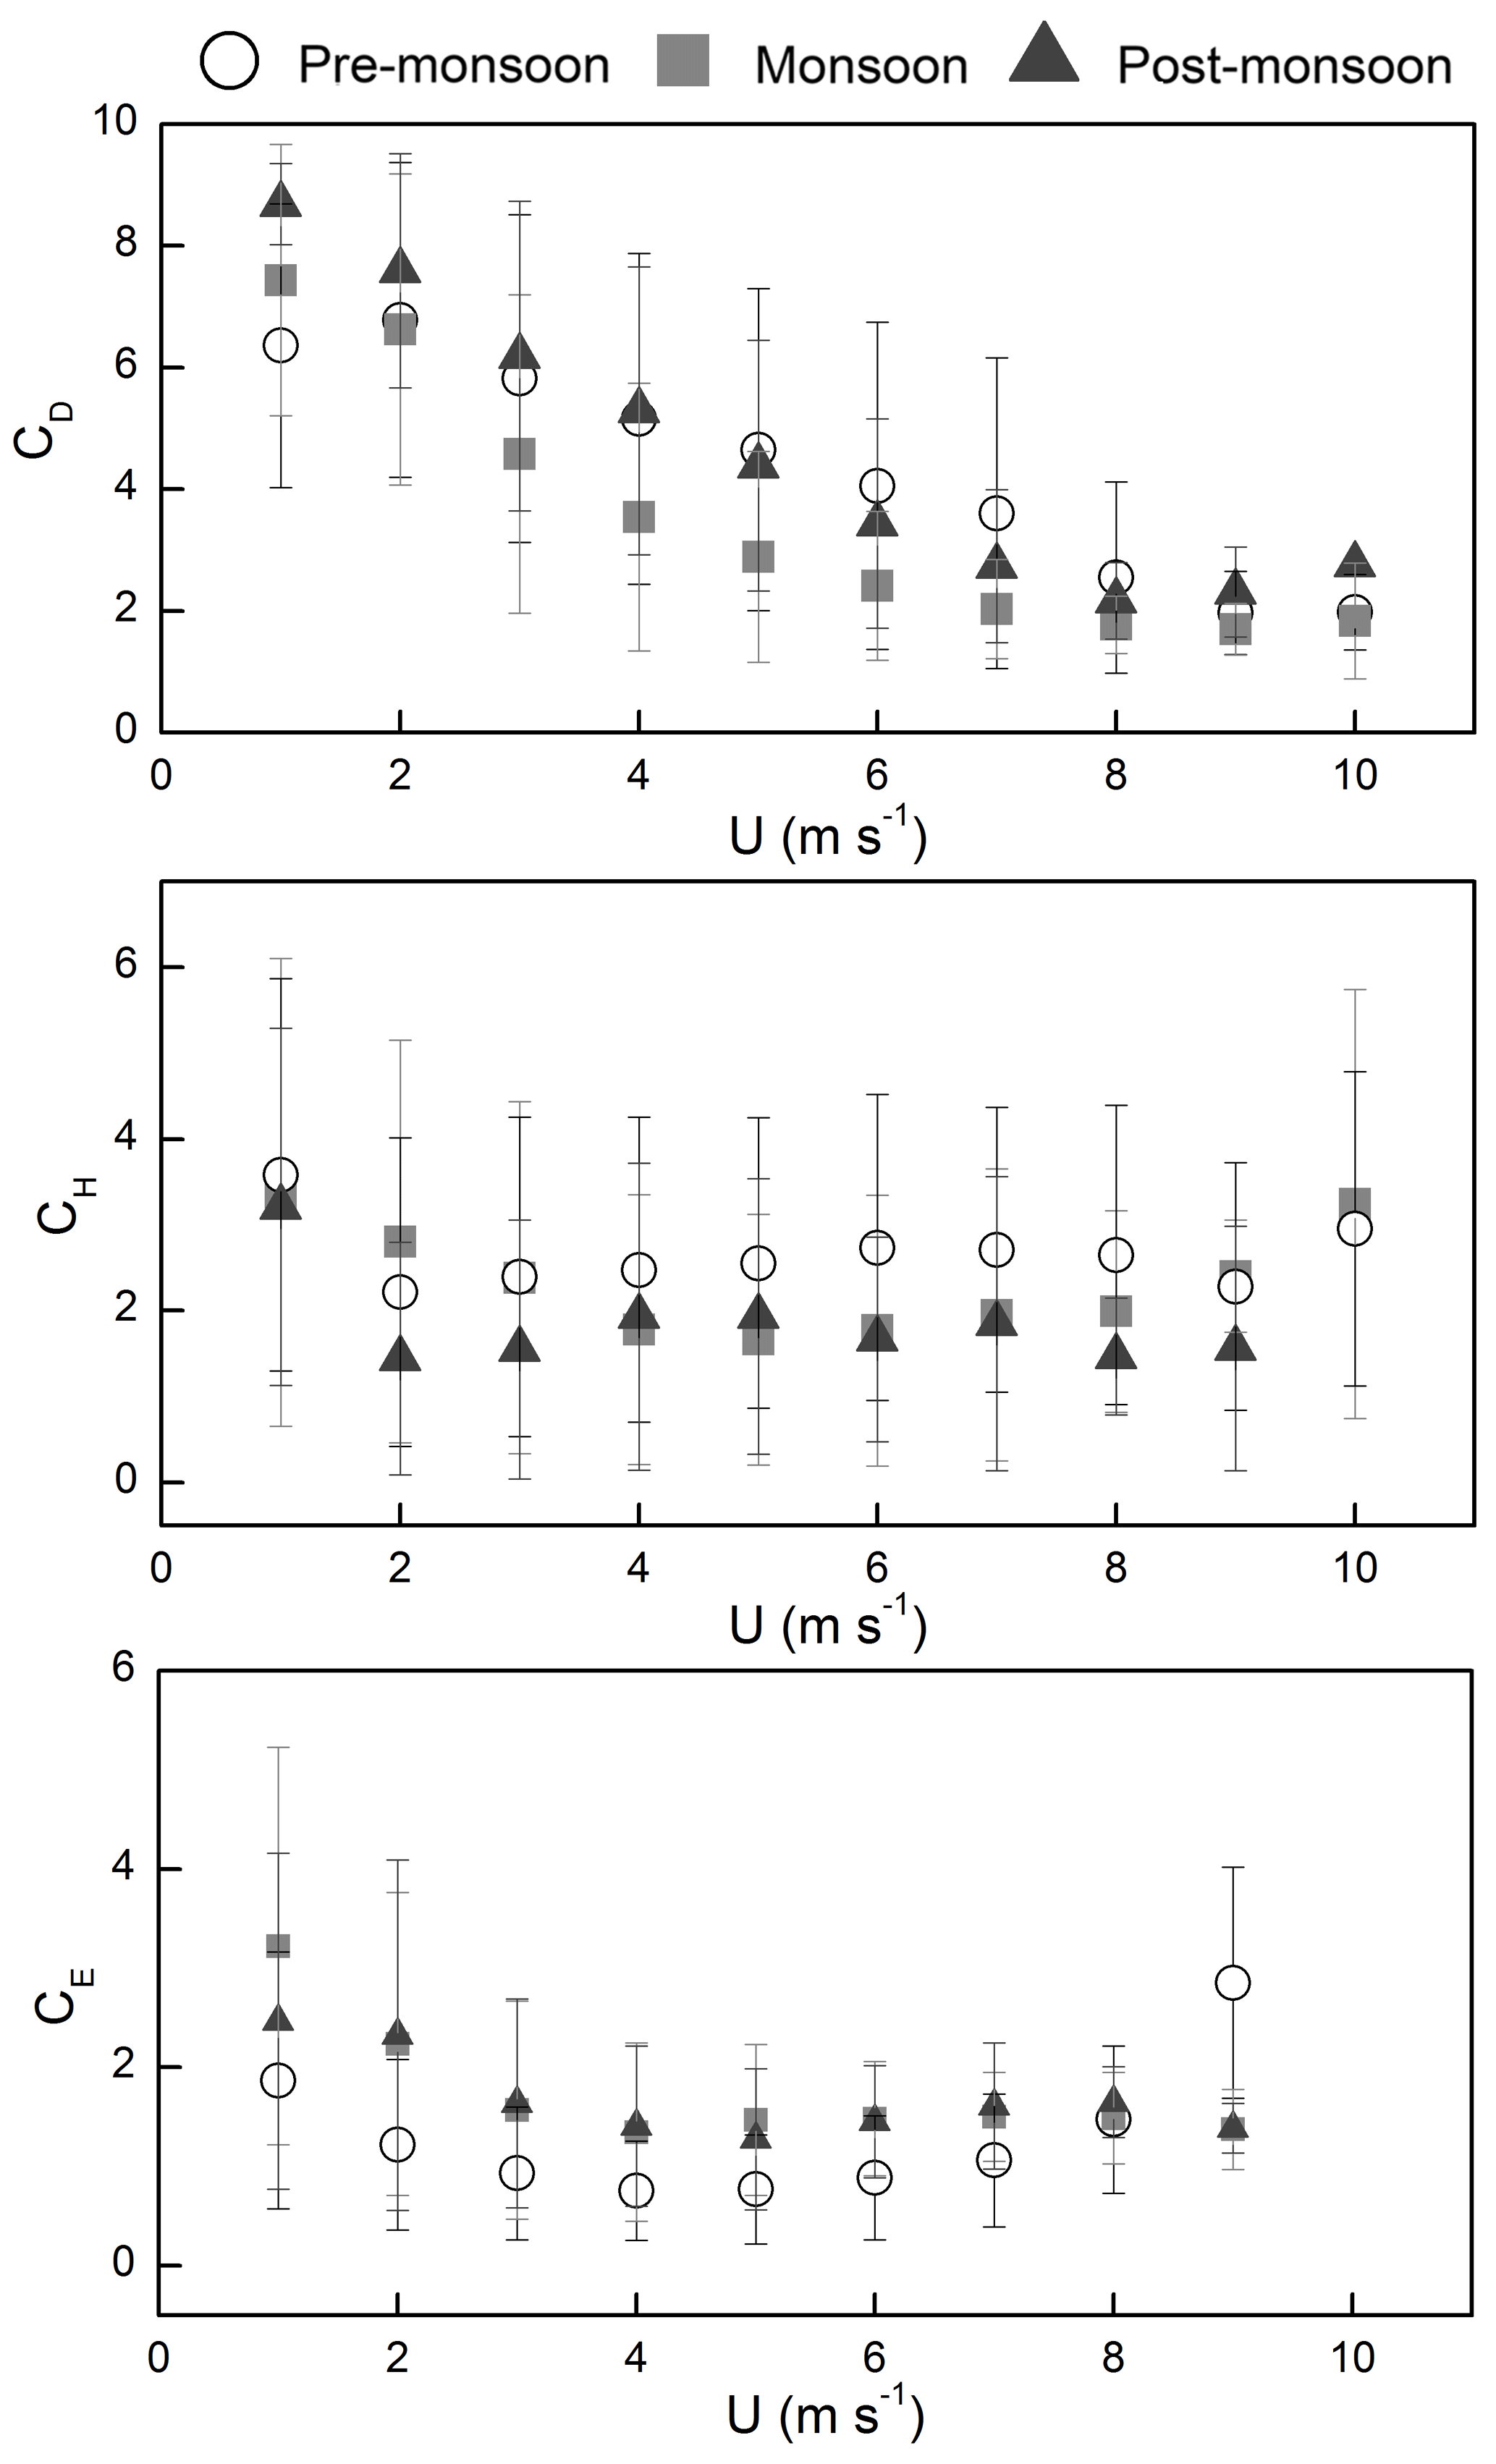
Figure 7The relationship between bin (bin width 1 m s−1) averaged drag coefficient (the momentum bulk transfer coefficient, CD), Dalton number (the heat bulk transfer coefficient, CH), Stanton number (the moisture bulk transfer coefficient, CE) and wind speed (U) during pre-monsoon, monsoon and post-monsoon periods for the whole study period. The error bars show the ±1 standard deviation of the average value.
The relationship between wind speed and bulk transfer coefficients during different monsoon periods is shown in Fig. 7. The drag coefficient decreased rapid with increasing wind speed when wind speed is lower than 8 m s−1. When wind speed increased, the Stanton number first decreased and then gradually increased. The Dalton number changed rapidly only under a very low or high wind speed, and remained constant at most times. The negative relationship between bulk transfer coefficients and wind speed under lower wind speed is also found in other lake studies (Yusup and Liu, 2016; Xiao et al., 2013; Verburg and Antenucci, 2010). Although there is no obvious tendency for the bulk transfer coefficients to increase with wind speed, it is not contradictory to the bulk parameterization scheme in COARE (Fairall et al., 2003), as the wind speed over Erhai Lake corresponds to the transitional range (<10 m s−1). The observation also indicates that a larger bias may be caused under weak wind conditions when simulating water–air fluxes for shallow water regimes (Xiao et al., 2013). The CD values during pre-monsoon and post-monsoon are close to each other and both are larger than that during the monsoon period. There is a relatively larger CH and lower CE during the pre-monsoon period compared to the other two periods. The CD is larger than CH and CE during all periods, which is consistent with another lake study (Nordbo et al., 2011).
3.2 Diurnal pattern of energy balance components and CO2 flux during different monsoon periods
The diurnal pattern of net radiation (Rn) is larger during the pre-monsoon period, and lower during the post-monsoon period (Fig. 8). The difference for maximum diurnal Rn is around 60 W m−2 between pre-monsoon period and monsoon period, and around 76 W m−2 between the monsoon period and post-monsoon period, respectively. The diurnal pattern of sensible heat flux (Hs) is consistent with T, which reaches a maximum in the morning and the minimum in the afternoon. The diurnal Hs is largest during the post-monsoon period, with a maximum value of 28 W m−2 in 2013. The fluctuation of diurnal Hs is very small during the monsoon period, with a difference between a maximum and the minimum of about 10 W m−2, attributed to the weak diurnal variation in T. The diurnal Hs remains positive during monsoon and post-monsoon periods. The diurnal Hs has a greater amplitude during the pre-monsoon period, with its magnitudes ranging from −24 to 5 W m−2. The diurnal Hs during the pre-monsoon period remains negative for most times of the day, and changes to be positive for a short time in the morning.

Figure 8The average diurnal patterns of energy balance components (the net radiation flux, Rn; the sensible heat flux, Hs; the latent heat flux, LE; and the storage heat flux in the lake, ΔQ), Bowen ratio (Bowen) and CO2 flux (Fc) during pre-monsoon, monsoon and post-monsoon periods from 2012 to 2015.
The latent heat flux (LE) has an opposite diurnal pattern with Hs, which reaches a maximum in the afternoon and the minimum in the morning. The maximum diurnal LE values during the three study periods are close to each other, with a value around 130 W m−2. Diurnal LE remains at a relatively high level for most times of the day during the monsoon period compared to the other two periods. The difference in LE between the three periods is more evident during nighttime than daytime. The larger LE during the monsoon period than the other two periods is not consistent with the variation in e, which is larger during the pre-monsoon period, indicating a weak relation between e and LE. Since there is a higher Hs and lower LE during the post-monsoon period, the Bowen ratio is higher during this period than the other two periods, with an average value of 0.16. There is a relatively small difference in Bowen ratio between post-monsoon and monsoon periods during nighttime, and between pre-monsoon period and monsoon period in daytime.
The diurnal pattern of storage heat in the lake (Q) is similar with Rn, with a maximum value occurring at noon. The diurnal Q remains negative during nighttime and changes to be positive after sunrise, indicating the heat is released to the atmosphere during nighttime and absorbed to the lake in daytime. The diurnal mean Q values during pre-monsoon, monsoon and post-monsoon periods are 28.9, 5.2 and −14.5 W m−2, respectively. The lake absorbs more heat flux during daytime and releases less during nighttime during the pre-monsoon period in most years compared to the other two periods.
The diurnal pattern of LE and Hs are not in the same phase with Rn, which was also reported in high-latitude and midlatitude water bodies, and they were more closely related with other meteorological variables (i.e., e, T, U; Assouline et al., 2008; Nordbo et al., 2011). There is a smaller difference for diurnal LE during the three different periods, whereas there is a larger difference for diurnal Hs, indicating a larger effect of monsoon on heat exchange processes over Erhai Lake. The LE over Erhai Lake has a large diurnal variation compared to the midlatitude reservoir (Liu et al., 2012).
Two peaks are observed for diurnal variation in CO2 fluxes during the whole study period, one occurs in the early morning and the other one in the evening. The CO2 fluxes could switch to be negative around noon time during monsoon and post-monsoon periods, indicating the CO2 flux uptake in the middle of the day during these two periods. The observed maximum diurnal average CO2 flux was µmol m−2 s−1 during the monsoon period (2014) and µmol m−2 s−1 during the post-monsoon period (2013), respectively. The CO2 flux uptake is believed to be caused by the phytoplankton due to the eutrophication of Erhai Lake. It has been reported that the shallow lake is more affected by rich phytoplankton (Huotari et al., 2011; Shao et al., 2015). However, the CO2 uptake is weaker during daytime during the pre-monsoon period compared to other periods. The seasonal fluctuation of phytoplankton in Erhai Lake has been reported by some researchers. Yu et al. (2014) observed that the concentration of Chl a and phytoplankton in Erhai Lake were higher in mid-summer and fall and decreased from winter until April.
3.3 Daily and Monthly average of turbulent fluxes during different monsoon periods
The daily average Hs during pre-monsoon is lower than that during other two periods (Fig. 9). The average daily Hs during the post-monsoon period has a larger annual variation compared to other two periods. The difference in daily average Hs among the 4 years could be as large as 11 W m−2 during the post-monsoon period. The LE has a small variation among different years compared to Hs. The daily average LE is larger during the monsoon period, ranging from 102.5±39.2 to 114.8±29.6 W m−2. The ΔQ is observed to have a larger annual variation. The daily average ΔQ remains positive during the pre-monsoon period and negative during the post-monsoon period. The daily average heat absorption during the pre-monsoon period is 29.8±13.4 W m−2 and heat emission during the post-monsoon period is W m−2. Although the CO2 uptake is observed during midday, the daily average CO2 fluxes remain positive during different periods. The daily average CO2 flux is larger during the pre-monsoon period compared to other two periods. The daily average CO2 flux is 0.55±0.23 and 0.19±0.08 g C m−2 d−1 during pre-monsoon and post-monsoon periods, respectively.
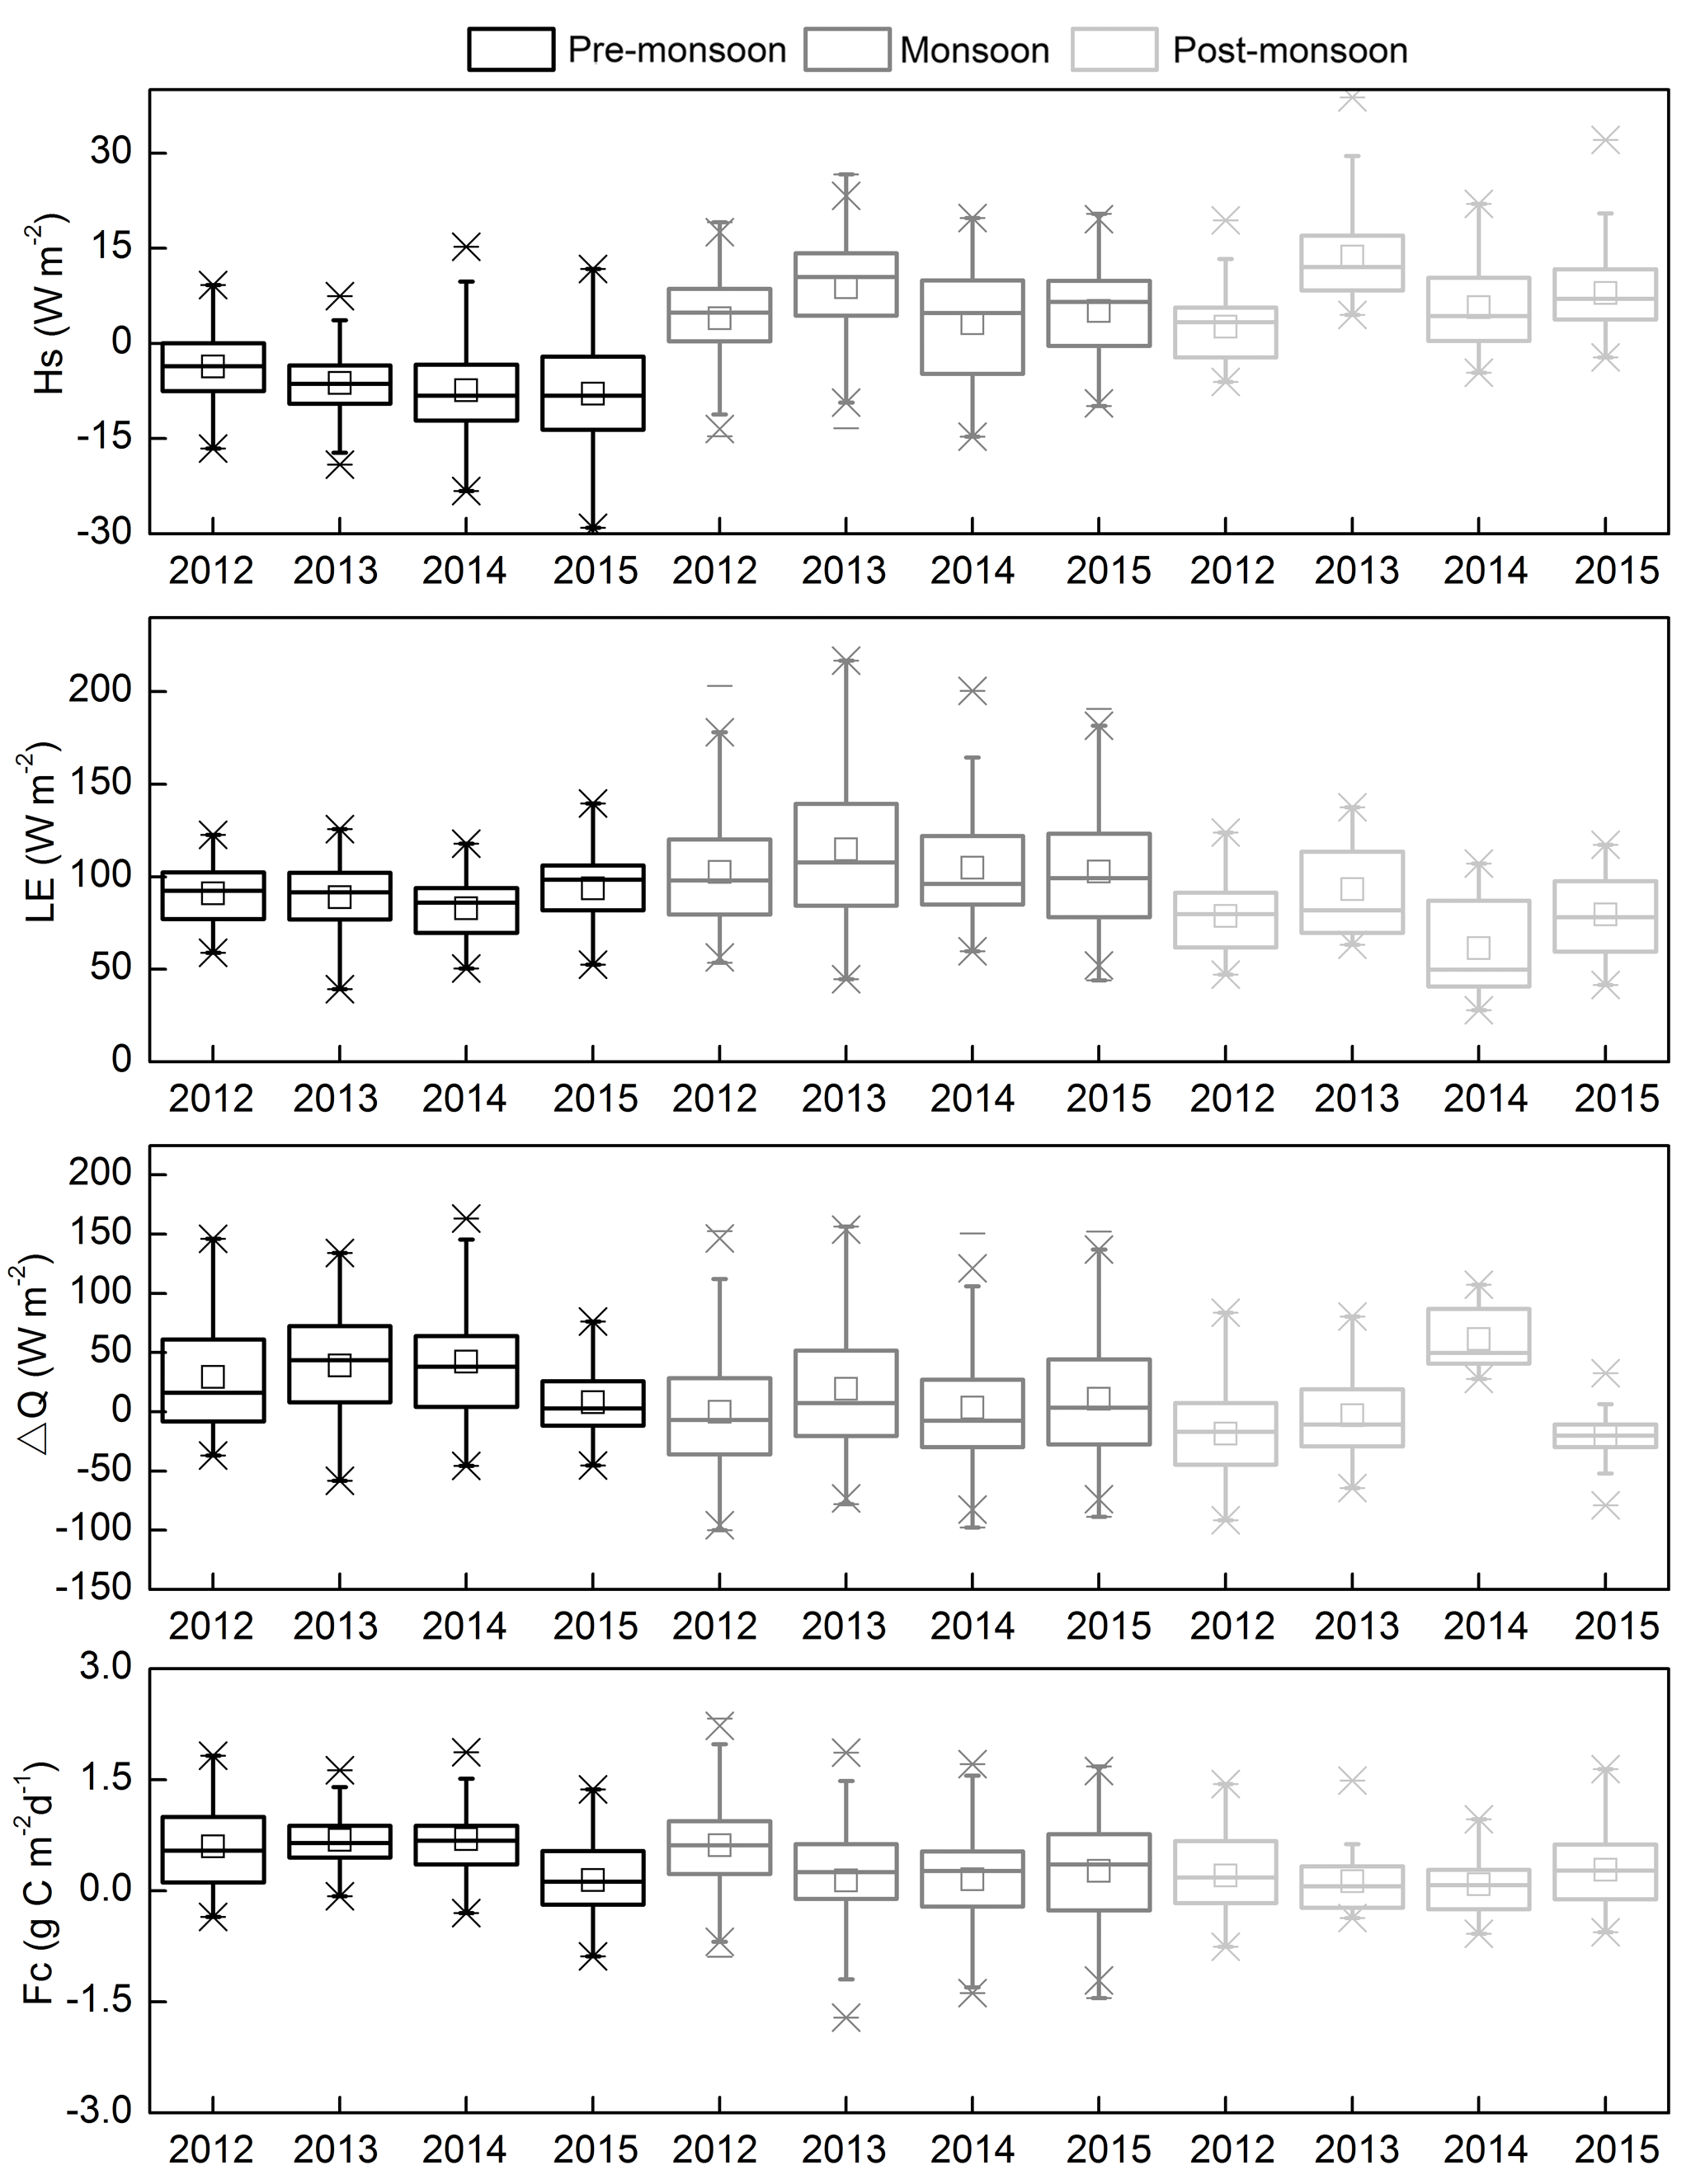
Figure 9Box plot of daily average sensible heat flux (Hs), latent heat flux (LE), the storage heat flux in the lake (ΔQ) and CO2 flux (Fc) during pre-monsoon, monsoon and post-monsoon periods from 2012 to 2015. The upper and lower limits of the box represent the 75 and 25 percentiles; the horizontal line in each box represent the 1.5 inter-quartile range of the upper and lower quartile; the band inside the box is the median; the squares inside the box represent the average value; the cross-hatches represent the 1 and 99 percentiles; the end whiskers represent maximum and minimum values.
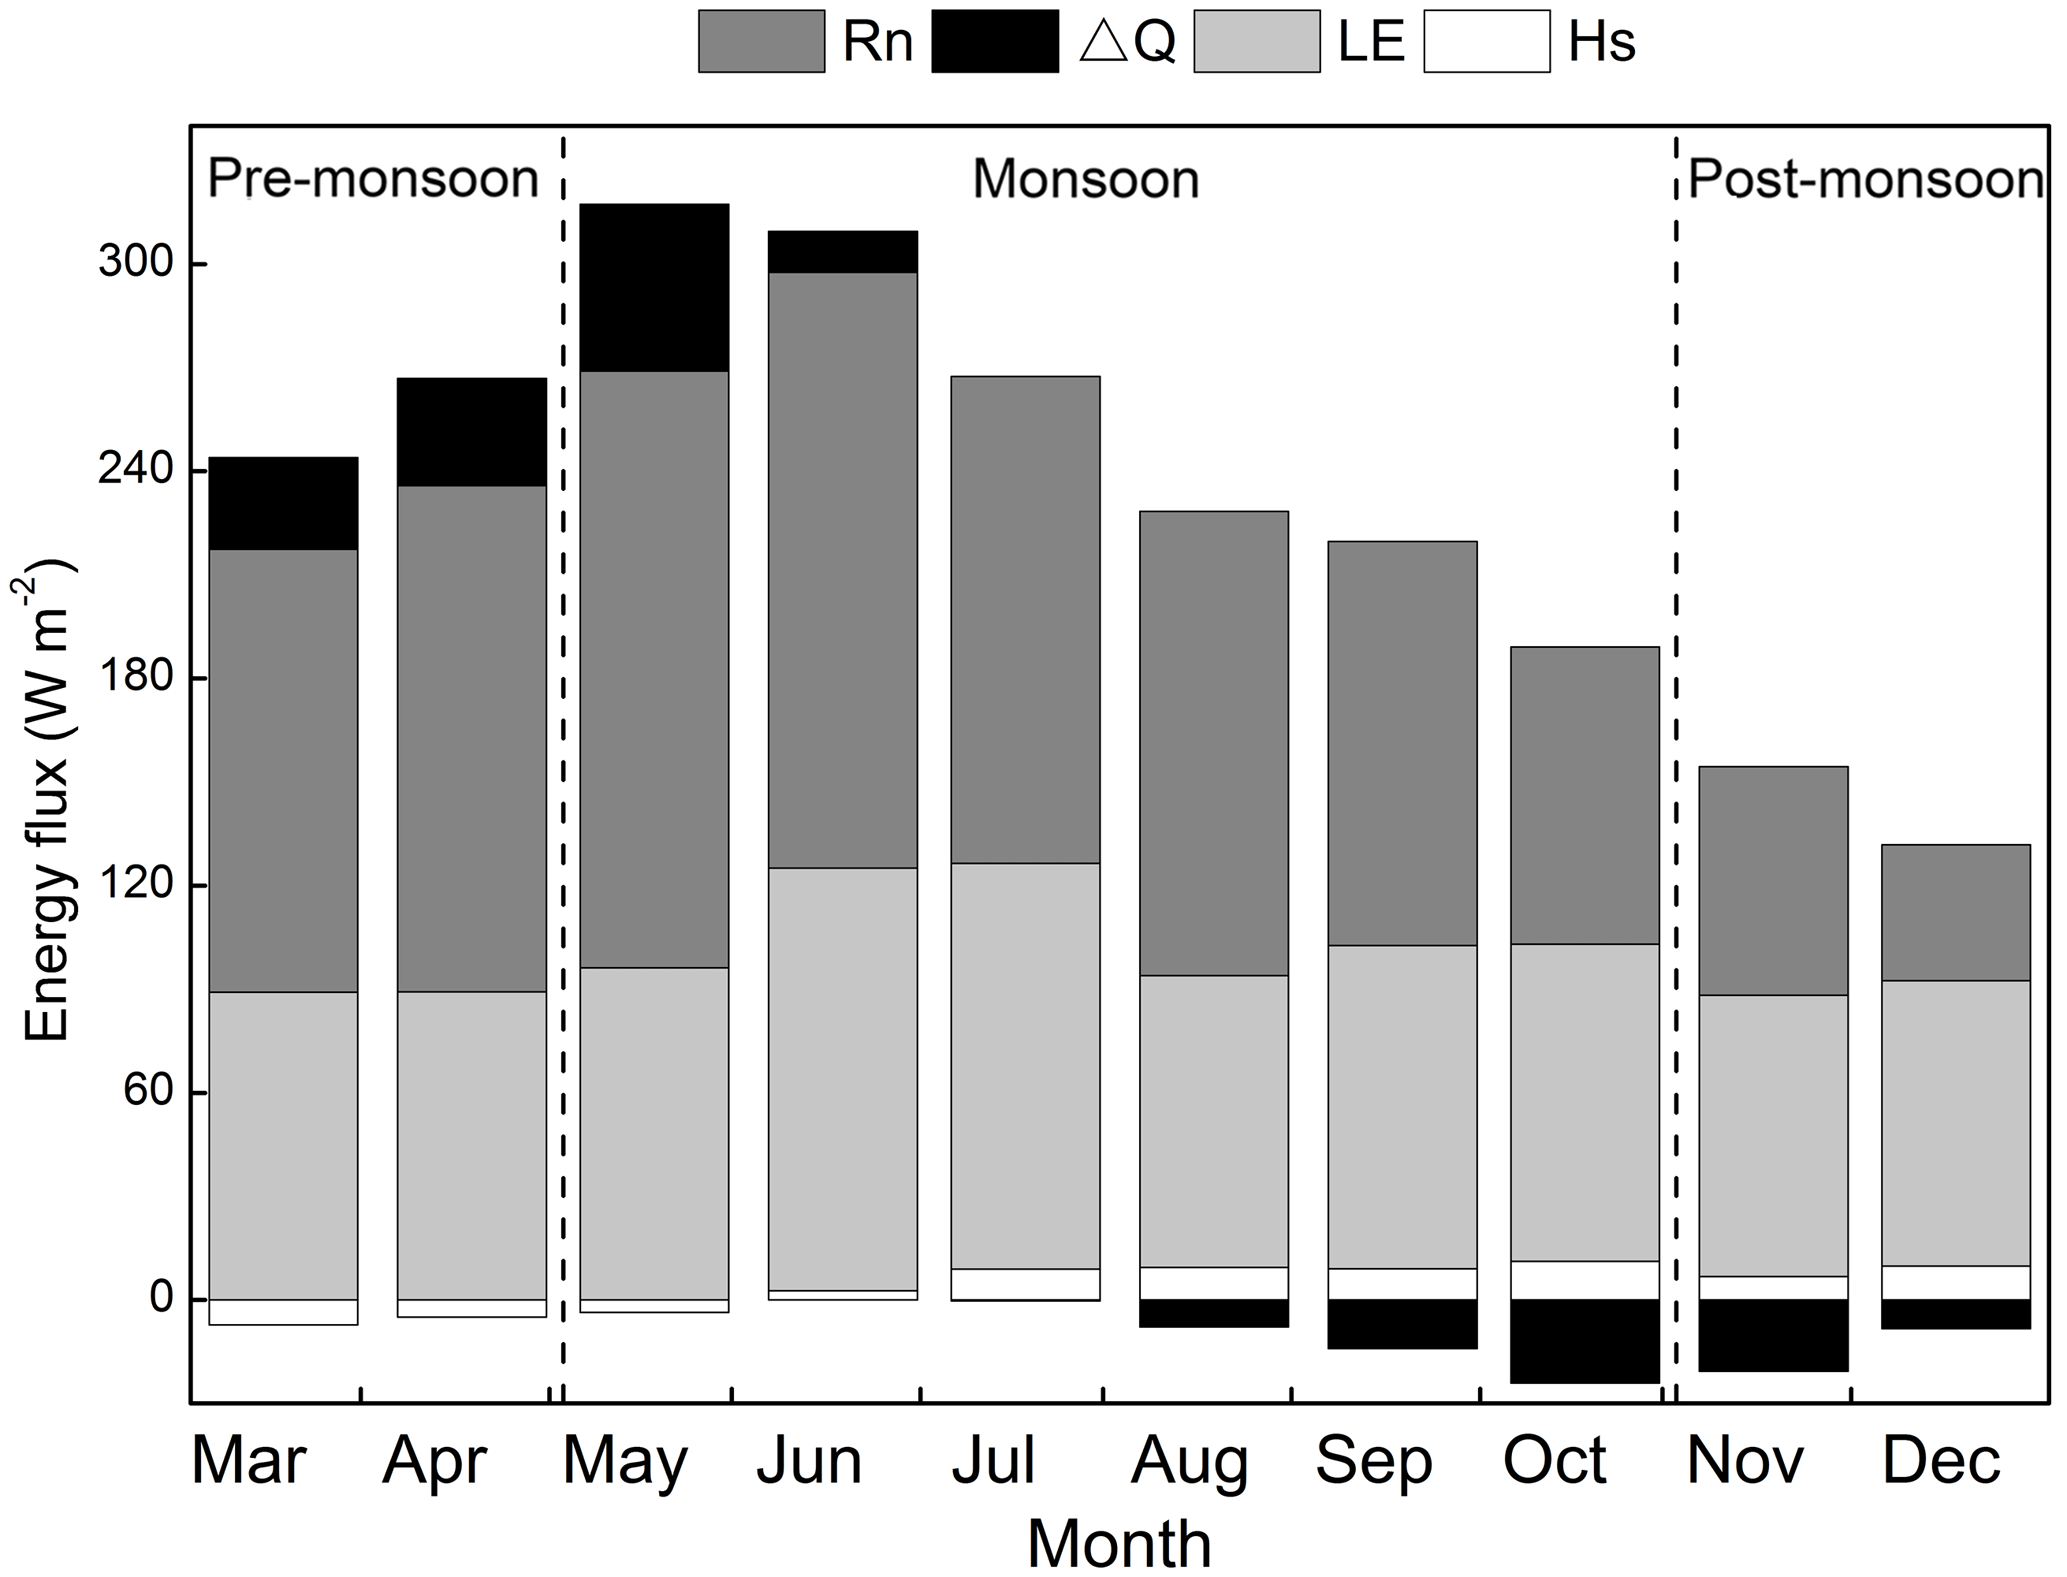
Figure 10The monthly average energy fluxes (the storage heat flux in the lake, ΔQ; the net radiation flux, Rn; the latent heat flux, LE; and the sensible heat flux, Hs) during pre-monsoon, monsoon and post-monsoon periods from 2012 to 2015.
The monthly average energy balance components (Rn, ΔQ, LE and Hs) show clear variations during the three different periods from 2012 to 2015 (Fig. 10). Rn gradually increases from pre-monsoon period to the early monsoon period and then decreases until the post-monsoon period. The monthly average Rn during the post-monsoon period is lower than 40 % of the other two periods. LE remains at a higher level during the three periods, with an average monthly value of 89.1, 103.9 and 82.2 W m−2 during pre-monsoon, monsoon and post-monsoon periods, respectively. The average monthly LE∕Rn ratio has a smaller annual variation during the pre-monsoon period, which ranges from 0.50 to 0.82 for 4-year study period. LE∕Rn ratio has a larger fluctuation during the monsoon period, which varies from 0.53 to 1 from 2012 to 2015. As a result of the decrease in Rn, LE∕Rn ratio exceeds 1 rapidly during the post-monsoon period, with an average value of 1.68. LE plays a dominant role in energy partitioning of the lake, while Hs dominated the major proportion of Rn in the terrestrial land surface (Roth et al., 2016). The monthly average Hs remains negative during the pre-monsoon period and the early monsoon period, and switches to be positive in the middle monsoon period. The magnitude of monthly average Hs remains at a very low level, with a value of less than 14 W m−2 during the three periods. There is a negative monthly average Hs∕Rn ratio during pre-monsoon due to the negative monthly Hs, indicating the Rn is consumed by heating the water body. During the monsoon period, the Hs∕Rn ratio is still very low with an average value of 0.06, and the Rn is primarily used for evaporation. Correspondingly, a positive monthly average ΔQ is observed during pre-monsoon and early monsoon period, and a negative monthly average ΔQ during the other periods, indicating that the lake absorbs heat at first and releases it subsequently. The average monthly ΔQ values during the pre-monsoon and post-monsoon periods are 28 and −14 W m−2, respectively. The Hs∕Rn ratio increases to 0.20 and (Hs+LE)∕Rn ratio reaches as high as 1.72 during the post-monsoon period. The excessive portion of the energy released from the heat storage in the lake is transferred through the turbulent exchanges, which is similar with other lakes (Rouse et al., 2005). A lower Hs∕Rn ratio with an annual average of 0.16 and a higher LE∕Rn ratio with an annual average of 0.81 were also observed in a midlatitude reservoir (Liu et al., 2012). However, other lakes have been reported to have a positive Hs on a monthly timescale over a whole year (Liu et al., 2012; M. Li et al., 2015). The difference between them and Erhai Lake is likely to be attributed to the positive T and unstable stratification throughout the year in this midlatitude reservoir, whereas a negative T during the pre-monsoon period and the major portion of near neutral stratification over Erhai Lake.
3.4 Main drivers for Hs during different monsoon periods
The correlation coefficients between Hs and meteorological variables (ΔT, U, Ta, Ts, Rn and rain) on half-hourly, daily and monthly timescales are investigated during the three different periods (Table 2). On half-hourly scale, the product of U and ΔT (U⋅ΔT) is the main controlling factor Hs, which could explain 44 % and 30 % variance in Hs during monsoon and post-monsoon periods, respectively. However, during the pre-monsoon period, both ΔT and the product of U and ΔT are found to have a major effect on half-hourly Hs. A close relationship between half-hourly ΔT and Hs is also observed during the monsoon period, with a Pearson correlation coefficient between them of 0.56. On daily timescales, the ΔT is found to be most closely related with Hs during all three different periods, with a correlation coefficient ranging from 0.55 during the post-monsoon period to 0.78 during the monsoon period. Besides, Rn is also one of the major drivers of Hs during the monsoon period; as the rain was mainly falling during the monsoon period, the role of Rn on Hs becomes noticeable. The product of U and ΔT is observed to have a main effect on Hs only during the pre-monsoon period. The Ta is also responsible for the variation in daily Hs during pre-monsoon and monsoon periods, which explain about 30 % variance in daily Hs. The factors controlling Hs during the monsoon period are similar with those during the post-monsoon period on a monthly timescale. The ΔT remains as the most significant factor controlling monthly Hs, which could explain 85 % and 89 % variance in Hs during the monsoon and post-monsoon periods, respectively. The product of U and ΔT also shows close relationship with monthly Hs during monsoon and post-monsoon periods. The similar relationship between meteorological variables and monthly Hs is not observed during the pre-monsoon period. Only the rain and Rn are found to be closely correlated with monthly Hs during the pre-monsoon period. The correlation between rain and Rn is also observed during the monsoon period, indicating the large effect of Rn during these two periods.
Table 2The Pearson correlation coefficients between 30Min, Daily and Monthly sensible heat flux (Hs) and difference between water surface and air temperature (ΔT), wind speed (U), the product of wind speed and difference between water surface and air temperature (U⋅ΔT), air temperature (Ta), water surface temperature (Ts), net radiation (Rn), and rain, during pre-monsoon, monsoon and post-monsoon periods for the whole study period (2012 to 2015). The significant levels of 0.01 and 0.05 are marked with and ∗, respectively. The correlation coefficients between rain and Hs are estimated only at daily and monthly timescales.
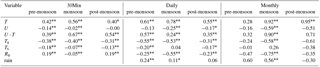
In general, no significant relationship between U and Hs is observed from half-hourly to monthly timescales during all three study periods. The ΔT remains as the main factor controlling Hs on all temporal scales during the three periods, and the effect of ΔT is increased as the correlation coefficients between them rises when timescales are extended from half-hourly to monthly. During the monsoon period, the role of Rn on Hs becomes more important. The relationship between meteorological factors and Hs is more complicated during the monsoon period, while there are similar main drivers for Hs during the pre-monsoon period and post-monsoon period.
3.5 Main drivers for LE during different monsoon periods
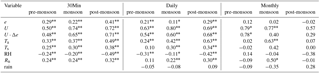
The relationship between LE and meteorological variables during pre-monsoon, monsoon and post-monsoon periods from half-hourly, daily and monthly timescales from 2012 to 2015 are also analyzed (Table 3). Unlike the relationship between U and Hs, a significant relationship between U and LE is observed on all temporal scales during the three different periods, with a higher correlation coefficient ranging from 0.51 to 0.80. However, the range of the correlation coefficients between U and LE is similar on different timescales, indicating that the effect of U does not increase as timescale changes. The large effect of U on LE has been reported in small lakes. The product of U and e is the second major factor controlling LE during the three periods, especially on half-hourly and daily scales, with a correlation coefficient ranging from 0.48 to 0.71. On monthly timescales, the significant effect of the product of U and e on LE is only observed during the pre-monsoon period, which could explain 60 % variance in monthly LE. During the monsoon period, both Ta and Rn show a close relationship with LE on a monthly timescale. The effect of Rn on LE has also been reported in other studies. Because the variation in monthly Ta is mainly determined by the magnitude of the available energy, the close relationship between Ta and monthly LE reflects the effect of Rn on LE during the monsoon period. During the monsoon period, Rn is also found to be responsible for variation in LE on monthly scale, which is similar with monthly Hs. The close relationship between Rn and LE was also observed in a small boreal lake (Nordbo et al., 2011; Goldbach and Kuttler, 2015).
Table 3The Pearson correlation coefficients between 30Min, Daily and Monthly latent heat flux (LE) and vapor pressure difference (e) between water surface (es) and the air (ea), wind speed (U), the product of wind speed and vapor pressure difference (e) between water surface and the air (U⋅Δe), air temperature (Ta), water surface temperature (Ts), relative humidity (RH), net radiation (Rn), and rain, during pre-monsoon, monsoon and post-monsoon periods for the whole study period (2012 to 2015). The significant levels of 0.01 and 0.05 are marked with and ∗, respectively. The correlation coefficients between rain and LE are estimated only at daily and monthly timescales.
3.6 Main drivers for CO2 flux during different monsoon periods
The correlation coefficients between CO2 flux and meteorological variables during the three different periods from half-hourly to monthly scales are shown in Table 4. On half-hourly scale, there is a similar relationship between meteorological variables and CO2 flux during pre-monsoon and post-monsoon periods. Both Rn and photosynthetically active radiation (PAR) are found to have a slightly higher correlation coefficient with CO2 flux than other meteorological variables, which indicates that the carbon exchange processes over Erhai Lake is affected by both physical and biological processes. The U is found to have a significant relationship with CO2 flux during the monsoon period. There is a relatively high correlation coefficient between U and CO2 flux on all temporal scales during the monsoon period, which increases from half-hourly (0.23) to monthly scales (0.81). During the post-monsoon period, the U also has a large impact on CO2 flux, mainly on longer temporal scale. The correlation coefficient between them is also the highest on daily and monthly scales during the post-monsoon period. The U could mediate the vertical transport of gases by producing turbulent eddies across the air–water interface (Eugster et al., 2003).
Table 4The Pearson correlation coefficients between 30Min, Daily and Monthly CO2 flux and difference between water surface and air temperature (ΔT), vapor pressure difference (e) between water surface and the air, wind speed (U), air temperature (Ta), relative humidity (RH), water surface temperature (Ts), photosynthetically active radiation (PAR), net radiation (Rn), and rain, during pre-monsoon, monsoon and post-monsoon periods for the whole study period (2012 to 2015). The significant levels of 0.01 and 0.05 are marked with and ∗, respectively. The correlation coefficients between rain and CO2 flux are estimated only at daily and monthly timescales.
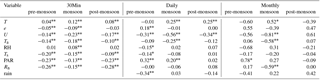
On monthly scale, the major drivers of CO2 flux vary greatly during different periods. PAR is found to be the most significant driver for monthly CO2 flux during the pre-monsoon period. During the monsoon period, the main drivers for monthly CO2 flux (i.e., Rn, Ta and U) are in good accordance with LE. The relationship between Ts and CO2 flux is likely to be attributed to the fact that the variation of Ts could influence the solubility in water (Shao et al., 2015). The e also has a large effect on monthly CO2 flux during both pre-monsoon and post-monsoon periods. A negative correlation coefficient between rain and CO2 flux is observed on daily and monthly scale during the pre-monsoon period. It has been reported that more rain could bring more nutrients into the water body, which ultimately promoted the photosynthesis of the phytoplankton (Shao et al., 2015). However, a positive correlation coefficient between rain and CO2 flux is also observed on monthly scale during the post-monsoon period. The rain could also promote CO2 emission by enhancing the transport of carbon from land/catchment areas to the water system (lateral fluxes), which enhanced the DOC and potentially the pCO2 in the water (Pumpanen et al., 2014).
Overall, because the correlation coefficients between meteorological variables and CO2 flux are comparatively lower on half-hourly scale, large uncertainties exist for the main drivers controlling half-hourly CO2 flux. The main drivers of CO2 flux are more complicated on monthly scale during the three periods, indicating multiple factors may govern CO2 exchange process, including biological and physical processes (Vesala et al., 2006). More similar controlling factors for CO2 flux are observed during pre-monsoon and post-monsoon periods, compared with monsoon period, indicating the large impact of monsoon on carbon exchange processes.
Erhai Lake is a subtropical shallow lake located in the key regions of water-vapor transportation passages, which is influenced by both the South Asian and East Asian summer monsoons. The contrasting atmospheric properties during the monsoon and non-monsoon periods provide an excellent opportunity to examine the effect of monsoon on turbulent exchange processes over the lake surface. The pre-monsoon period is characterized by a higher U and e, with a negative T, while the post-monsoon period is characterized by a lower U and Ta, with a positive T. The air mass during the monsoon period is the warmest and wettest. The monsoon period has a much higher Ts than the other two periods. The southeasterly and westerly winds are dominant during daytime and nighttime, respectively. The lake and land breeze circulation is stronger during the pre-monsoon and post-monsoon periods. The near neutral stratification occupies the major proportion during the three study periods. The negative diurnal T during the pre-monsoon period has contributed to the occurrence of stable stratification, while the positive T has contributed to the occurrence of unstable stratification during monsoon and post-monsoon periods. The monsoon also has an effect on bulk transfer coefficients. The drag coefficient during the monsoon period is lower compared to the other two periods. The Dalton number is larger but the Stanton number is lower during the pre-monsoon period than that during other two periods.
Due to the effect of cloud, the Rn during the monsoon period is lower than pre-monsoon period. The albedo is higher during the post-monsoon period but similar between pre-monsoon and monsoon periods. The diurnal pattern of ΔQ is consistent with Rn, while diurnal Hs and LE are out of phase of Rn, which are consistent with T and e, respectively. The diurnal Hs during the pre-monsoon period remains negative for most times of the day, and changes to be positive for a short time in the morning. Diurnal LE remains relatively high for most times of the day during the monsoon period. The higher Hs and lower LE have resulted in a higher Bowen ratio during the post-monsoon period. LE dominates the energy partitioning of the lake, and LE∕Rn ratio exceeds 1 during the post-monsoon period due to the rapid decrease in Rn. The monthly average Q is positive during pre-monsoon and early monsoon period, and becomes negative during the other periods, indicating that the lake absorbs heat at first and then releases it.
The ΔT remains as the main factor controlling Hs on all temporal scales during the three periods, and the effect of ΔT is increased when timescales are extended from half-hourly to monthly. The factors controlling LE are more consistent from half-hourly to monthly timescales compared to Hs. A significant relationship between U and LE is observed on all temporal scales, and the product of U and e is the second major factor controlling LE during the three periods. The U is also found to have a strong relationship with CO2 flux during the monsoon period. The high wind is expected to cause variations in the mechanical mixing and thus modulate the water surface turbulent and CO2 exchange processes (Zhang and Liu, 2013). During the monsoon period, the Rn plays an important role on monthly variation in Hs and LE. Compared with monsoon period, similar main drivers for Hs are found during the pre-monsoon period and post-monsoon period, which is also found for CO2 flux, indicating the large impact of monsoon on heat and carbon exchange processes over Erhai Lake. On a monthly timescale, the main drivers of CO2 flux are more complicated during the three periods. In future, more studies are needed to investigate the combing effect of biological and physical process on carbon exchange processes over highland shallow lakes.
The data used in this study are available by directly contacting the corresponding author.
HZL designed the measurement campaign over Erhai Lake. YL and LW carried out field measurements. QD and LJX analyzed the data. QD and HZL prepared the paper with input from all co-authors.
The authors declare that they have no conflict of interest.
This work was supported by the National Natural Science Foundation of China (no.
91537212, 41661144018 and 41505007) and the National Key Research and
Development Program of China (2017YFC1502101). We thank the relevant persons
in the Yunnan Provincial Institute of Meteorology and the Dali National Climatic
Observatory for their maintaining the site and providing historical
data.
Edited by: Janne Rinne
Reviewed by: two anonymous referees
Assouline, S., Tyler, S. W., Tanny, J., Cohen, S., Bou-Zeid, E., Parlange, M. B., and Katul, G. G.: Evaporation from three water bodies of different sizes and climates: Measurements and scaling analysis, Adv. Water. Resour., 31, 160–172, 2008.
Cole, J. J. and Caraco, N. F.: Atmospheric exchange of carbon dioxide in a low-wind oligotrophic lake measured by the addition of SF6, Limnol. Oceanogr., 43, 647–656, https://doi.org/10.4319/lo.1998.43.4.0647, 1998.
Cole, J. J., Cole, J. J., Caraco, N. F., and Caraco, N. F.: Carbon in catchments: connecting terrestrial carbon losses with aquatic metabolism, Mar. Freshwater Res., 52, 101–110, 2001.
Croley, T. E.: Verifiable evaporation modeling on the laurentian great-lakes, Water Resour. Res., 25, 781–792, https://doi.org/10.1029/WR025i005p00781, 1989.
Curtarelli, M. P., Alcântara, E. H., Rennó, C. D., and Stech, J. L.: Physical changes within a large tropical hydroelectric reservoir induced by wintertime cold front activity, Hydrol. Earth Syst. Sci., 18, 3079–3093, https://doi.org/10.5194/hess-18-3079-2014, 2014.
Derecki, J. A.: Stability Effects on Great Lakes Evaporation, J. Great Lakes Res., 7, 357–362, 1981.
Downing, J. A., Prairie, Y. T., Cole, J. J., Duarte, C. M., Tranvik, L. J., Striegl, R. G., McDowell, W. H., Kortelainen, P., Caraco, N. F., Melack, J. M., and Middelburg, J. J.: The global abundance and size distribution of lakes, ponds, and impoundments, Limnol. Oceanogr., 51, 2388–2397, https://doi.org/10.4319/lo.2006.51.5.2388, 2006.
Dutra, E., Stepanenko, V. M., Balsamo, G., Viterbo, P., Miranda, P. M. A., Mironov, D., and Schaer, C.: An offline study of the impact of lakes on the performance of the ECMWF surface scheme, Boreal Environ. Res., 15, 100–112, 2010.
Eugster, W., Kling, G., Jonas, T., McFadden, J. P., Wuest, A., MacIntyre, S., and Chapin, F. S.: CO2 exchange between air and water in an Arctic Alaskan and midlatitude Swiss lake: Importance of convective mixing, J. Geophys. Res.-Atmos., 108, D12, https://doi.org/10.1029/2002jd002653, 2003.
Goldbach, A. and Kuttler, W.: Turbulent Heat Fluxes above a Suburban Reservoir: A Case Study from Germany, J. Hydrometeorol., 16, 244–260, https://doi.org/10.1175/JHM-D-13-0159.1, 2015.
Fairall, C. W., Bradley, E. F., Hare, J. E., Grachev, A. A., and Edson, J. B.: Bulk Parameterization of Air–Sea Fluxes: Updates and Verification for the COARE Algorithm, J. Climate, 16, 571–591, https://doi.org/10.1175/1520-0442(2003)016<0571:BPOASF>2.0.CO;2, 2003.
Fan, S. M., Wofsy, S. C., Bakwin, P. S., Jacob, D. J., and Fitzjarrald, D. R.: Atmosphere-biosphere exchange of CO2 and O3 in the Central Amazon Forest, J. Geophys. Res., 95, 16851–16864, https://doi.org/10.1029/JD095iD10p16851, 1990.
Feng, J. W., Liu, H. Z., Sun, J. H., and Wang, L.: The surface energy budget and interannual variation of the annual total evaporation over a highland lake in Southwest China, Theor. Appl. Climatol., 126, 303–312, https://doi.org/10.1007/s00704-015-1585-9, 2015.
Flohn, H.: Large-scale aspects of the “summer monsoon” in South and East Asia, J. Meteor. Soc. Jpn., 75, 180–186, 1957.
Foken, T., Gockede, M., Mauder, M., Mahrt, L., Amiro, B., and Munger, W.: Post-field data quality control, Handbook Of Micrometeorology, A Guide for Surface Flux Measurement And Analysis, 29, 181–208, https://doi.org/10.1007/1-4020-2265-4_9, 2004.
Goldbach, A. and Kuttler, W.: Turbulent Heat Fluxes above a Suburban Reservoir: A Case Study from Germany, J. Hydrometeorol., 16, 244–260, https://doi.org/10.1175/JHM-D-13-0159.1, 2015.
Hsu, H. H., Terng, C. T., and Chen, C. T.: Evolution of large-scale circulation and heating during the first transition of Asian summer monsoon, J. Climate, 12, 793–810, https://doi.org/10.1175/1520-0442(1999)012<0793:eolsca>2.0.co;2, 1999.
Huotari, J., Ojala, A., Peltomaa, E., Nordbo, A., Launiainen, S., Pumpanen, J., Rasilo, T., Hari, P., and Vesala, T.: Long-term direct CO2 flux measurements over a boreal lake: Five years of eddy covariance data, Geophys. Res. Lett., 38, 113–120, https://doi.org/10.1029/2011GL048753, 2011.
Kaimal, J. C., and Finnigan, J. J.: Atmospheric Boundary Layer Flows: Their Structure and Measurement, Oxford University Press, Oxford, UK, 1994.
Kormann, R. and Meixner, F. X.: An analytical footprint model for non-neutral stratification, Bound.-Lay. Meteorol., 99, 207–224, https://doi.org/10.1023/a:1018991015119, 2001.
Lau, K. M. and Yang, S.: Climatology and interannual variability of the southeast Asian summer monsoon, Adv. Atmos. Sci., 14, 18–26, 1997.
Lenters, J. D., Kratz, T. K., and Bowser, C. J.: Effects of climate variability on lake evaporation: Results from a long-term energy budget study of Sparkling Lake, northern Wisconsin (USA), J. Hydrol., 308, 168–195, https://doi.org/10.1016/j.jhydrol.2004.10.028, 2005.
Li, C. F. and Yanai, M.: The onset and interannual variability of the Asian summer monsoon in relation to land sea thermal contrast, J. Climate, 9, 358–375, https://doi.org/10.1175/1520-0442(1996)009<0358:toaivo>2.0.co;2, 1996.
Li, M., Babel, W., Chen, X., Zhang, L., Sun, F., Wang, B., Ma, Y., Hu, Z., and Foken, T.: A 3-year dataset of sensible and latent heat fluxes from the Tibetan Plateau, derived using eddy covariance measurements, Theor. Appl. Climatol., 122, 457–469, 2015.
Li, X.-Y., Ma, Y.-J., Huang, Y.-M., Hu, X., Wu, X.-C., Wang, P., Li, G.-Y., Zhang, S.-Y., Wu, H.-W., Jiang, Z.-Y., Cui, B.-L., and Liu, L.: Evaporation and surface energy budget over the largest high-altitude saline lake on the Qinghai-Tibet Plateau, J. Geophys. Res.-Atmos., 121, 10470–10485, https://doi.org/10.1002/2016jd025027, 2016.
Li, Z., Lyu, S., Ao, Y., Wen, L., Zhao, L., and Wang, S.: Long-term energy flux and radiation balance observations over Lake Ngoring, Tibetan Plateau, Atmos. Res., 155, 13–25, https://doi.org/10.1016/j.atmosres.2014.11.019, 2015.
Li, Z., Lyu, S., Wen, L., Zhao, L., Ao, Y., and Wang, S.: Effect of a cold, dry air incursion on atmospheric boundary layer processes over a high-altitude lake in the Tibetan Plateau, Atmos. Res., 185, 32–43, https://doi.org/10.1016/j.atmosres.2016.10.024, 2017.
Liu, H., Zhang, Y., Liu, S., Jiang, H., Sheng, L., and Williams, Q. L.: Eddy covariance measurements of surface energy budget and evaporation in a cool season over southern open water in Mississippi, J. Geophys. Res.-Atmos., 114, 83–84, https://doi.org/10.1029/2008JD010891, 2009.
Liu, H., Blanken, P. D., Weidinger, T., Nordbo, A., and Vesala, T.: Variability in cold front activities modulating cool-season evaporation from a southern inland water in the USA, Environ. Res. Lett., 6, 024022, https://doi.org/10.1088/1748-9326/6/2/024022, 2011.
Liu, H., Zhang, Q., and Dowler, G.: Environmental Controls on the Surface Energy Budget over a Large Southern Inland Water in the United States: An Analysis of One-Year Eddy Covariance Flux Data, J. Hydrometeorol., 13, 1893–1910, https://doi.org/10.1175/jhm-d-12-020.1, 2012.
Liu, H., Zhang, Q., Katul, G. G., Cole, J. J., Iii, F. S. C., and Macintyre, S.: Large CO2 effluxes at night and during synoptic weather events significantly contribute to CO2 emissions from a reservoir, Environ. Res. Lett., 11, 064001, https://doi.org/10.1088/1748-9326/11/6/064001, 2016.
Liu, H. Z., Feng, J. W., Sun, J. H., Wang, L., and Xu, A. L.: Eddy covariance measurements of water vapor and CO2 fluxes above the Erhai Lake, Sci. China. Earth. Sci., 58, 317–328, https://doi.org/10.1007/s11430-014-4828-1, 2015.
Mammarella, I., Nordbo, A., Rannik, Ü., Haapanala, S., Levula, J., Laakso, H., Ojala, A., Peltola, O., Heiskanen, J., and Pumpanen, J.: Carbon dioxide and energy fluxes over a small boreal lake in Southern Finland, J. Geophys. Res.-Biogeo., 120, 1296–1314, https://doi.org/10.1002/2014JG002873, 2015.
Marie-Noëlle, B., Guy, C., Olivier, T., Dominique, L., and Le, M. P.: Long-term heat exchanges over a Mediterranean lagoon, J. Geophys. Res.-Atmos., 117, D23104, https://doi.org/10.1029/2012JD017857, 2012.
Mauder, M. and Foken, T.: Impact of post-field data processing on eddy covariance flux estimates and energy balance closure, Meteorol. Z., 15, 597–609, https://doi.org/10.1127/0941-2948/2006/0167, 2006.
Mauder, M., Jegede, O. O., Okogbue, E. C., Wimmer, F., and Foken, T.: Surface energy balance measurements at a tropical site in West Africa during the transition from dry to wet season, Theor. Appl. Climatol., 89, 171–183, https://doi.org/10.1007/s00704-006-0252-6, 2007.
McGloin, R., McGowan, H., and McJannet, D.: Effects of diurnal, intra-seasonal and seasonal climate variability on the energy balance of a small subtropical reservoir, Int. J. Climatol., 35, 2308–2325, https://doi.org/10.1002/joc.4147, 2015.
Moncrieff, J., Clement, R., Finnigan, J., and Meyers, T.: Averaging, Detrending, and Filtering of Eddy Covariance Time Series, Handbook of Micrometeorology, 2004.
Nordbo, A., Launiainen, S., Mammarella, I., Lepparanta, M., Huotari, J., Ojala, A., and Vesala, T.: Long-term energy flux measurements and energy balance over a small boreal lake using eddy covariance technique, J. Geophys. Res.-Atmos., 116, D02119, https://doi.org/10.1029/2010jd014542, 2011.
O'Donnell, D. M., Effler, S. W., Strait, C. M., and Leshkevich, G. A.: Optical characterizations and pursuit of optical closure for the western basin of Lake Erie through in situ measurements, J. Great Lakes Res., 36, 736–746, 2010.
Oswald, C. J. and Rouse, W. R.: Thermal characteristics and energy balance of various-size Canadian Shield lakes in the Mackenzie River basin, J. Hydrometeorol., 5, 129–144, https://doi.org/10.1175/1525-7541(2004)005<0129:tcaebo>2.0.co;2, 2004.
Podgrajsek, E., Sahlée, E., Bastviken, D., Holst, J., Lindroth, A., Tranvik, L., and Rutgersson, A.: Comparison of floating chamber and eddy covariance measurements of lake greenhouse gas fluxes, Biogeosciences, 11, 4225–4233, https://doi.org/10.5194/bg-11-4225-2014, 2014.
Pumpanen, J., Linden, A., Miettinen, H., Kolari, P., Ilvesniemi, H., Mammarella, I., Hari, P., Nikinmaa, E., Heinonsalo, J., Back, J., Ojala, A., Berninger, F., and Vesala, T.: Precipitation and net ecosystem exchange are the most important drivers of DOC flux in upland boreal catchments, J. Geophys. Res.-Biogeo., 119, 1861–1878, https://doi.org/10.1002/2014jg002705, 2014.
Riera, J. L., Schindler, J. E., and Kratz, T. K.: Seasonal dynamics of carbon dioxide and methane in two clear-water lakes and two bog lakes in northern Wisconsin, USA, Can. J. Fish. Aquat. Sci., 56, 265–274, https://doi.org/10.1139/cjfas-56-2-265, 1999.
Roth, M., Jansson, C., and Velasco, E.: Multi-year energy balance and carbon dioxide fluxes over a residential neighbourhood in a tropical city, Int. J. Climatol., 37, 2679–2698, https://doi.org/10.1002/joc.4873, 2016.
Rouse, W. R., Oswald, C. J., Binyamin, J., Spence, C. R., Schertzer, W. M., Blanken, P. D., Bussieres, N., and Duguay, C. R.: The role of northern lakes in a regional energy balance, J. Hydrometeorol., 6, 291–305, https://doi.org/10.1175/jhm421.1, 2005.
Rueda, F., Moreno-Ostos, E., and Cruz-Pizarro, L.: Spatial and temporal scales of transport during the cooling phase of the ice-free period in a small high-mountain lake, Aquat. Sci., 69, 115–128, 2007.
Shao, C., Chen, J., Stepien, C. A., Chu, H., Ouyang, Z., Bridgeman, T. B., Czajkowski, K. P., Becker, R. H., and John, R.: Diurnal to annual changes in latent, sensible heat, and CO2 fluxes over a Laurentian Great Lake: A case study in Western Lake Erie, J. Geophys. Res.-Biogeo., 120, 1587–1604, https://doi.org/10.1002/2015JG003025, 2015.
Vachon, D., Prairie, Y. T., and Cole, J. J.: The relationship between near-surface turbulence and gas transfer velocity in freshwater systems and its implications for floating chamber measurements of gas exchange, Limnol. Oceanogr., 55, 1723–1732, https://doi.org/10.4319/lo.2010.55.4.1723, 2010.
Verburg, P. and Antenucci, J. P.: Persistent unstable atmospheric boundary layer enhances sensible and latent heat loss in a tropical great lake: Lake Tanganyika. J. Geophys. Res., 115, D11109, https://doi.org/10.1029/2009JD012839, 2010.
Vesala, T., Huotari, J., Rannik, U., Suni, T., Smolander, S., Sogachev, A., Launiainen, S., and Ojala, A.: Eddy covariance measurements of carbon exchange and latent and sensible heat fluxes over a boreal lake for a full open-water period, J. Geophys. Res.-Atmos., 111, D11101, https://doi.org/10.1029/2005jd006365, 2006.
Vickers, D. and Mahrt, L.: Quality control and flux sampling problems for tower and aircraft data, J. Atmos. Ocean. Tech., 14, 512–526, https://doi.org/10.1175/1520-0426(1997)014<0512:qcafsp>2.0.co;2, 1997.
Webb, E. K., Pearman, G. I., and Leuning, R.: Correction of flux measurements for density effects due to heat and water-vapor transfer, Q. J. Roy. Meteor. Soc., 106, 85–100, https://doi.org/10.1002/qj.49710644707, 1980.
Xiao, W., Liu, S., Wang, W., Yang, D., Xu, J., Cao, C., Li, H., and Lee, X.: Transfer coefficients of momentum, heat and water vapour in the atmospheric surface layer of a large freshwater lake, Bound-Lay. Meteorol., 148, 479–494, https://doi.org/10.1007/s10546-013-9827-9, 2013.
Xu, L., Liu, H., Du, Q., Wang, L., Yang, L., and Sun, J.: Differences of atmospheric boundary layer characteristics between pre-monsoon and monsoon period over the erhai lake, Theor. Appl. Climatol., https://doi.org/10.1007/s00704-018-2386-8, online first, 2018.
Xu, J., Yu, S., Liu, J., Haginoya, S., Ishigooka, Y., Kuwagata, T., Hara, M., and Yasunari, T.: The Implication of Heat and Water Balance Changes in a Lake Basin on the Tibetan Plateau, Hydrol. Res. Lett., 3, 1–5, 2009.
Yu, G., Jiang, Y., Song, G., Tan, W., Zhu, M., and Li, R.: Variation of Microcystis and microcystins coupling nitrogen and phosphorus nutrients in Lake Erhai, a drinking-water source in Southwest Plateau, China, Environ. Sci Poll. R. Int., 21, 9887–9898, 2014.
Yusup, Y. and Liu, H.: Effects of Atmospheric Surface Layer Stability on Turbulent Fluxes of Heat and Water Vapor across the Water–Atmosphere Interface, J. Hydrometeorol., 17, 2835–2850, https://doi.org/10.1175/JHM-D-16-0042.1, 2016.
Zappa, C. J., Asher, W. E., and Jessup, A. T.: Microscale wave breaking and air-water gas transfer, J. Geophys. Res.-Oceans, 106, 9385–9391, https://doi.org/10.1029/2000jc000262, 2001.
Zhang, Q. and Liu, H.: Interannual variability in the surface energy budget and evaporation over a large southern inland water in the United States, J. Geophys. Res.-Atmos., 118, 4290–4302, https://doi.org/10.1002/jgrd.50435, 2013.
Zhang, Q., Zeng, J., and Zhang, L. Y.: Characteristics of land surface thermal-hydrologic processes for different regions over North China during prevailing summer monsoon period, Sci. China. Earth. Sci., 55, 1872–1880, 2012.
Zhou, L., Zou, H., Ma, S., and Li, P.: Observed Impact of the South Asian Summer Monsoon on the Local Meteorology in the Himalayas, Acta. Meteorol. Sin., 26, 205–215, https://doi.org/10.1007/s13351-012-0206-0, 2012.