the Creative Commons Attribution 4.0 License.
the Creative Commons Attribution 4.0 License.
 | 05 Oct 2018
Measurements of NO and NO2 exchange between the atmosphere and Quercus agrifolia
Erin R. Delaria
Megan Vieira
Julie Cremieux
NO2 foliar deposition through the stomata of leaves has been identified as a significant sink of NOx within a forest canopy. In this study, we investigated NO2 and NO exchange between the atmosphere and the leaves of the native California oak tree Quercus agrifolia using a branch enclosure system. NO2 detection was performed with laser-induced fluorescence (LIF), which excludes biases from other reactive nitrogen compounds and has a low detection limit of 5–50 ppt. We performed both light and dark experiments with concentrations between 0.5 and 10 ppb NO2 and NO under constant ambient conditions. Deposition velocities for NO2 during light and dark experiments were 0.123±0.009 and 0.015±0.001 cm s−1, respectively. Much slower deposition was seen for NO, with deposition velocities of 0.012±0.002 and 0.005±0.002 cm s−1 measured during light and dark experiments, respectively. This corresponded to a summed resistance of the stomata and mesophyll of 6.9±0.9 s cm−1 for NO2 and 140±40 s cm−1 for NO. No significant compensation point was detected for NO2 uptake, but compensation points ranging from 0.74 to 3.8 ppb were observed for NO. NO2 and NO deposition velocities reported here are comparable both with previous leaf-level chamber studies and inferences from canopy-level field measurements. In parallel with these laboratory experiments, we have constructed a detailed 1-D atmospheric model to assess the contribution of leaf-level NOx deposition to the total NOx loss and NOx canopy fluxes. Using the leaf uptake rates measured in the laboratory, these modeling studies suggest that loss of NOx to deposition in a California oak woodland competes with the pathways of HNO3 and RONO2 formation, with deposition making up 3 %–22 % of the total NOx loss. Additionally, foliar uptake of NOx at these rates could account for ∼15 %–30 % canopy reduction of soil NOx emissions.
- Article
(1277 KB) - Full-text XML
- BibTeX
- EndNote


Nitrogen oxides () are a group of highly reactive trace gases that control the oxidative capacity of the atmosphere by regulating the amounts of ozone, hydroxyl radicals, volatile organic compounds, and other key atmospheric species (Crutzen, 1979). NOx is also directly toxic in high concentrations, plays a major role in tropospheric ozone production, and serves as a source of , a key nutrient for ecosystems and a component of acid rain. NOx is primarily emitted as nitric oxide (NO) through fossil fuel combustion, biomass burning, lightning, and microbial activity in soils (Seinfeld and Pandis, 2006). NO is rapidly oxidized to nitrogen dioxide (NO2) through reactions with ozone and peroxy radicals, and in the daytime NO2 subsequently photolyzes to re-form NO. The interconversion of NO and NO2 reaches steady state within a few minutes during the daytime (Crutzen, 1979). The effects of NOx on urban chemistry, where anthropogenic emissions dominate the NOx source, have been extensively studied. However, the processes affecting NOx in forested and agricultural regions are less well understood.
In forests and agricultural lands, the major source of NOx is NO emitted as a by-product of microbial denitrification and nitrification (Mckenney et al., 1982; Caranto and Lancaster, 2017). Deposition of NO2 to plant canopies is thought to be an important sink of NOx in forests, substantially reducing the contribution of soil-emitted NOx to the atmospheric NOx budget. Jacob and Wofsy (1990) observed low NOx above the canopy over the Amazon forest during the wet season. Using a 1-D chemical and transport model constrained by observed NOx and ozone, they concluded that a substantial fraction of soil NOx must be absorbed by the canopy. Extrapolation of these ideas to forests with different leaf area indices suggest that 20 %–50 % of the global fraction of soil-emitted NOx is lost to vegetation (Yienger and Levy, 1995; Lerdau et al., 2000). Using the framework of Jacob and Wofsy (1990) and Yienger and Levy (1995), global atmospheric models have been tuned to describe observed atmospheric NOx concentrations and tropospheric ozone production using a canopy reduction factor (CRF). The CRF is an adjustable parameter that accounts for the difference between soil NO emissions and the amount of NOx ventilated through the canopy (Yienger and Levy, 1995; Vinken et al., 2014). However, CRFs are implemented in an unphysical manner where they act only on soil NOx emissions and not on other NOx present in the plant canopy. An improved understanding is needed of the physical and biochemical processes governing the foliar uptake of NOx at the ecosystem and leaf scales.
Many studies have also directly observed the leaf-level uptake of NO2 (Neubert et al., 1993; Rondon and Granat, 1994; Hereid and Monson, 2001; Sparks et al., 2001; Teklemariam and Sparks, 2006; Pape et al., 2009; Chaparro-Suarez et al., 2011; Breuninger et al., 2013). Isotope labeling experiments investigating the mechanism of NO2 uptake have demonstrated that atmospheric NO2 can be absorbed through the stomata of plant leaves, converted to nitrate () and nitrite (), and eventually assimilated into amino acids (Rogers et al., 1979; Okano and Totsuka, 1986; Nussbaum et al., 1993; Weber et al., 1995; Yoneyame et al., 2003). The mechanism of NO2 assimilation is diffusion into the stomata followed by dissolution into the aqueous phase and disproportionation to and in the apoplasm (Lee and Schwartz, 1981a, b). NO2 can also be transformed to nitrate and nitrite through scavenging by antioxidants, most notably ascorbate (Ramge et al., 1993). The influence of ascorbate on foliar uptake was theoretically calculated by Ramge et al. (1993) and experimentally demonstrated by Teklemariam and Sparks (2006). The enzyme nitrate reductase converts to in the cytosol, and is then transported into the plastids where it is further reduced by the enzyme nitrite reductase to ammonium (), the product required for amino acid synthesis (Ammann et al., 1995; Tischner, 2000; Teklemariam and Sparks, 2006). Alternatively, NO2 can deposit directly onto the leaf cuticles or a leaf-surface water film (Burkhardt and Eiden, 1994). However, foliar uptake of NO2 has been demonstrated to be controlled primarily by the stomata, with deposition to the leaf surface representing only a small fraction of the total NO2 flux (Thoene et al., 1991; Gessler et al., 2000; Chaparro-Suarez et al., 2011). Strong correlations have been observed among NO2 concentrations, stomatal conductances, and the NO2 deposition flux, suggesting foliar uptake is mainly controlled by stomatal aperture and internal leaf resistances (Johansson, 1987; Thoene et al., 1991; Rondon et al., 1993; Meixner et al., 1997; Chaparro-Suarez et al., 2011; Breuninger et al., 2013).
Despite the large existing body of research on the leaf-level deposition of NO2 to vegetation, there are still discrepancies present in NO2 exchange rates and the role of mesophilic processes. Many laboratory experiments have failed to measure uptake rates necessary to describe the observed 20 %–50 % reduction of soil-emitted NOx (Hanson and Lindberg, 1991; Breuninger et al., 2013), despite the many modeling studies that have suggested dry deposition makes up most of this reduction (Jacob and Wofsy, 1990; Yienger and Levy, 1995; Ganzeveld et al., 2002a; Geddes and Murphy, 2014). Photolysis gradients and reaction of NOx to form higher nitrogen oxides could account for a large fraction of this reduction in soil NOx, as has been suggested by Min et al. (2012, 2014), but the relative importance of dry deposition processes versus in-canopy chemical transformations is still a matter of considerable uncertainty (Lerdau et al., 2000; Ganzeveld et al., 2002a). Another controversy is the existence of a compensation point – a concentration below which leaves would instead act as a source of NOx. Compensation points of 0.1–3.2 ppb NO2 have been observed in a number of laboratory chamber studies, suggesting trees instead may serve as a large source of NOx in forests (Johansson, 1987; Rondon et al., 1993; Hereid and Monson, 2001; Sparks et al., 2001; Teklemariam and Sparks, 2006). Emission of NO at these low NOx mixing ratios has also been detected in laboratory chamber studies (Wildt et al., 1997; Hereid and Monson, 2001). More recent laboratory studies of leaf level deposition have, however, questioned the existence of a compensation point (Chaparro-Suarez et al., 2011; Breuninger et al., 2013). Most observations of NOx canopy fluxes and atmospheric models predict or assume substantial NOx deposition at concentrations as low as 0.1 ppb, typical of NOx mixing ratios in remote areas (Jacob and Wofsy, 1990; Wang and Leuning, 1998; Lerdau et al., 2000; Sparks et al., 2001; Wolfe and Thornton, 2011; Min et al., 2012; Geddes and Murphy, 2014). However, some modeling studies have suggested that an NO2 compensation point is necessary to describe (Seok et al., 2013) or has only a small effect on canopy fluxes in most regions (Ganzeveld et al., 2002a). More research is thus needed on leaf and canopy-level processes to understand the full complexity of the soil–canopy–atmosphere system.
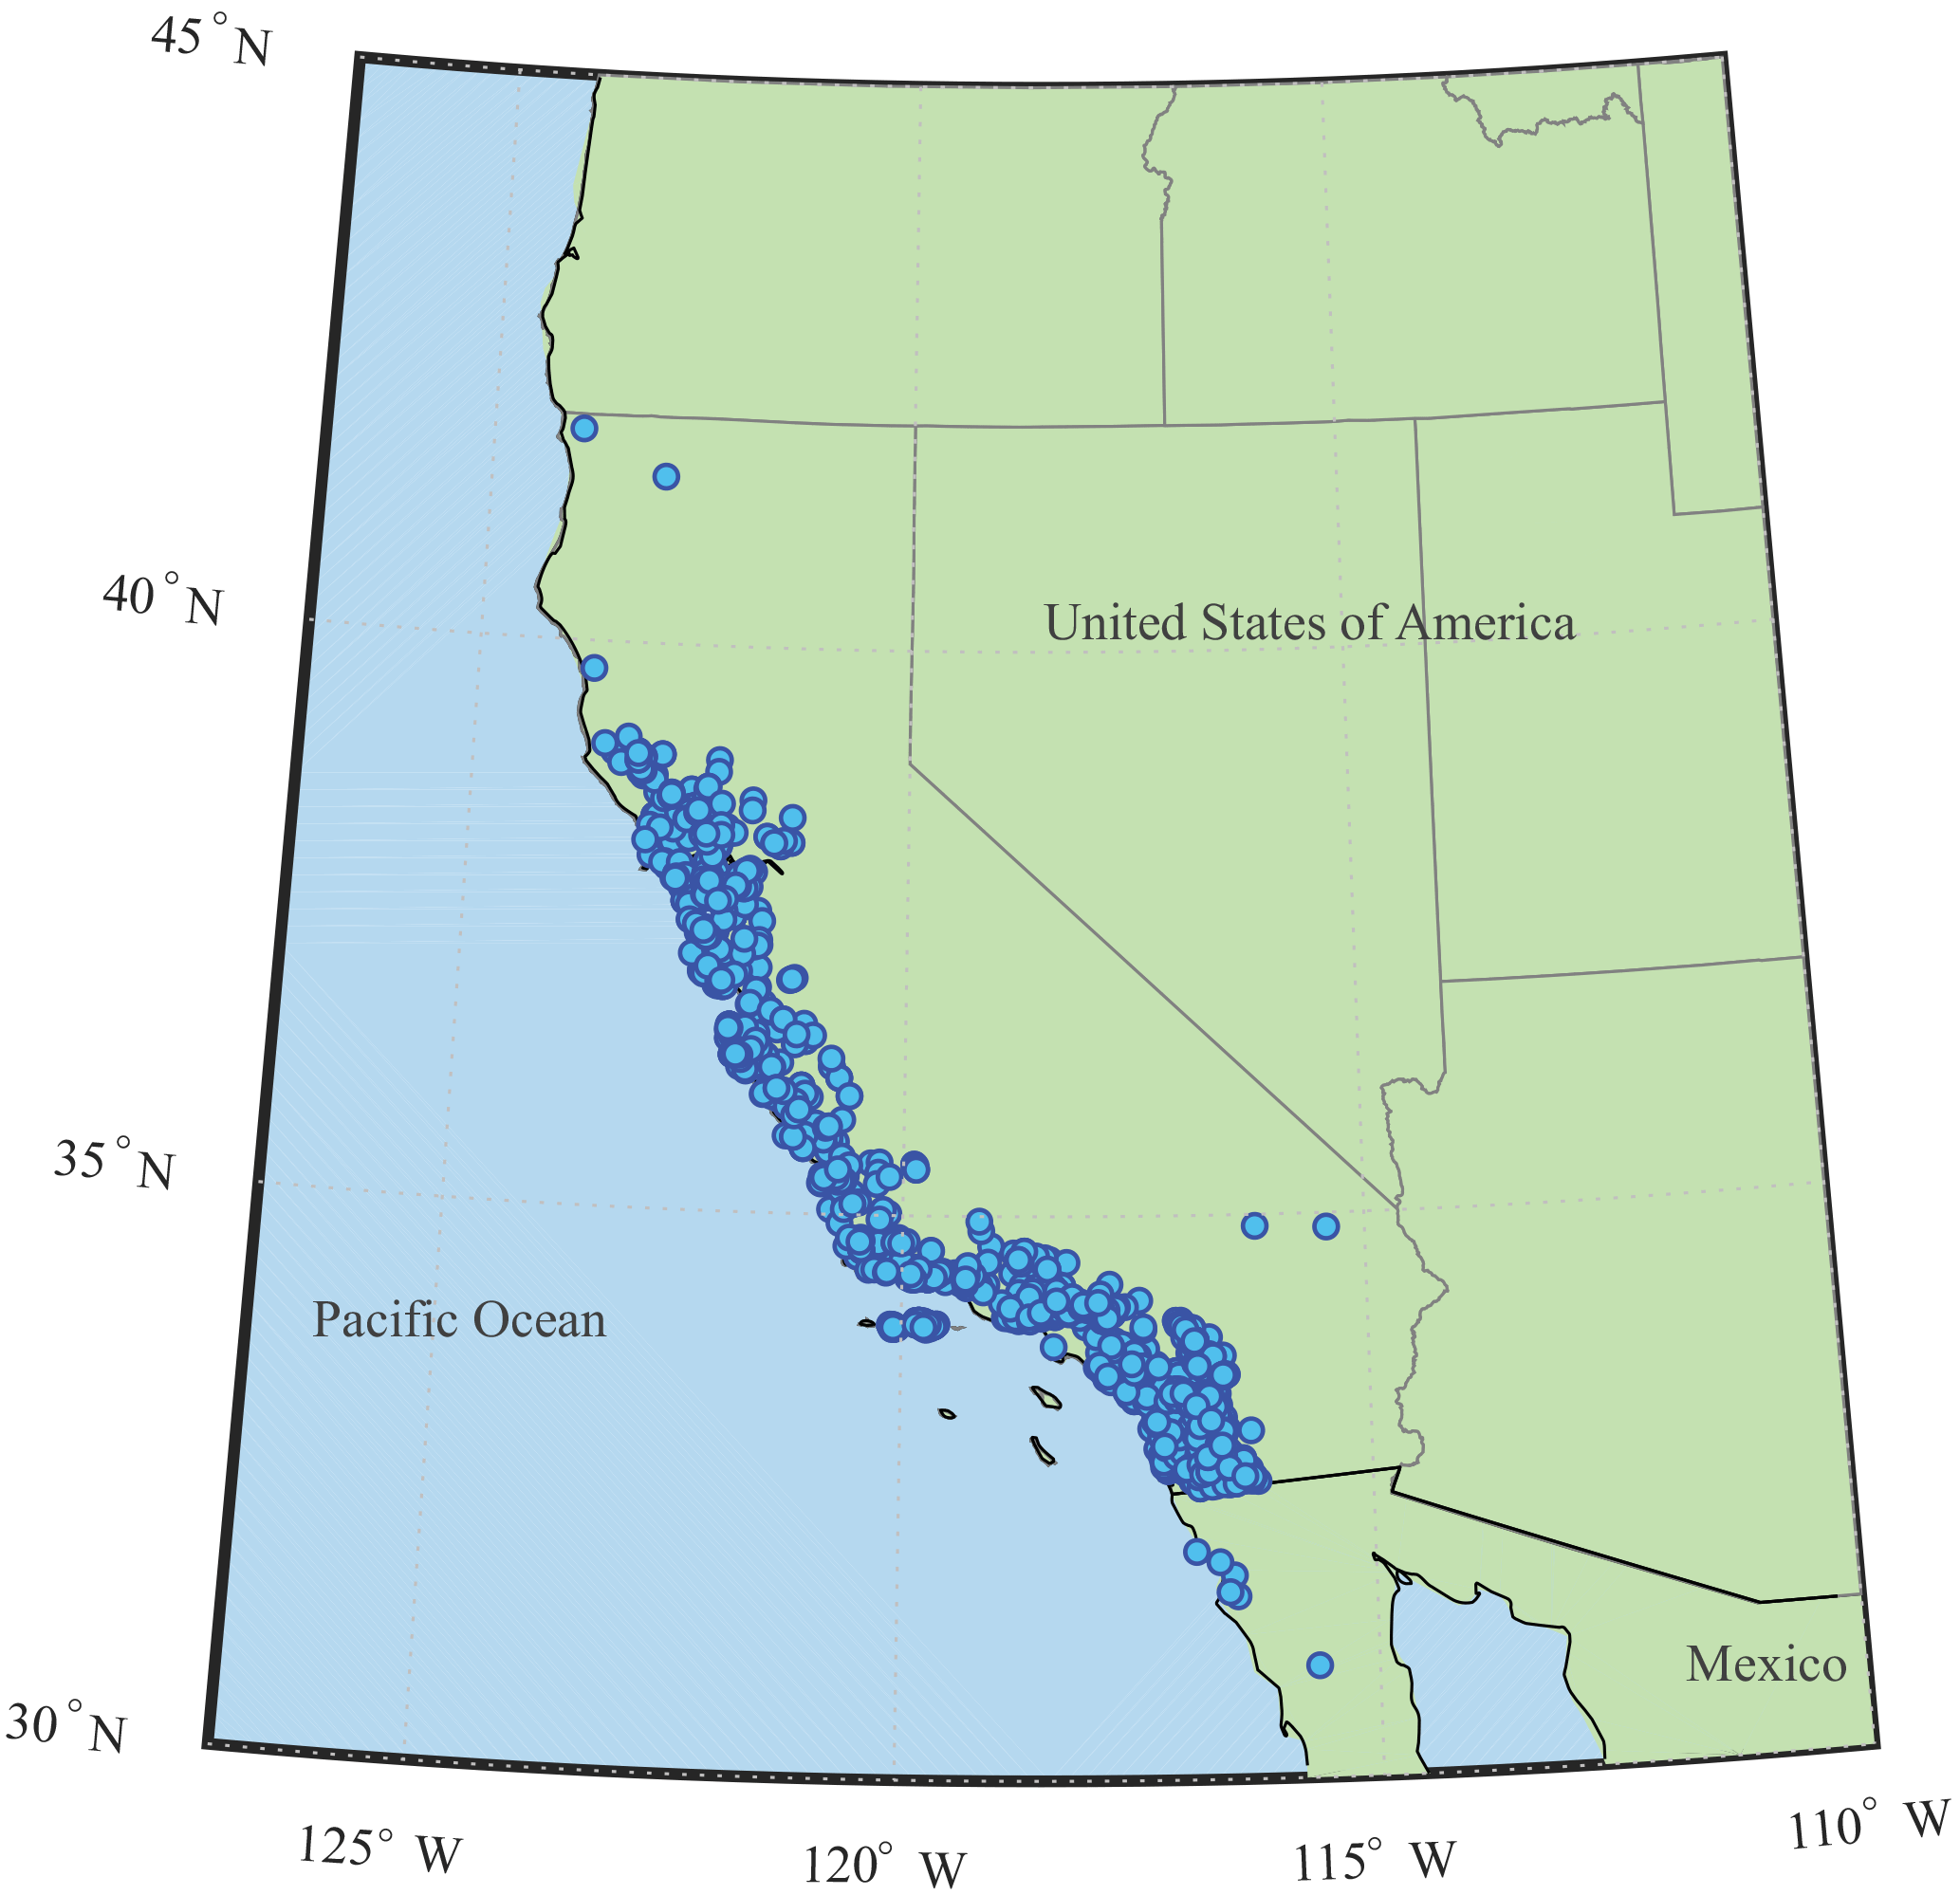
Figure 1Species distribution map of Quercus agrifolia. Each dot represents an observation of Q. agrifolia occurrence. Data provided by the participants of the Consortium of California Herbaria.
To understand the leaf-level processes affecting ecosystem-scale atmosphere–biosphere NOx exchange, we have conducted laboratory experiments measuring NO and NO2 fluxes to the native California tree species Quercus agrifolia (Fig. 1) using a branch enclosure system and direct laser-induced fluorescence (LIF) detection of NO2 (Fig. 2). With the LIF technique we are able to measure NOx exchange fluxes with high specificity and sensitivity at trace NOx mixing ratios relevant to forested environments. We investigated the existence of an NO2 and NO compensation point and the rate of NOx foliar uptake under controlled conditions. To our knowledge this is the first leaf-level uptake experiment that has been performed on a North American tree species.
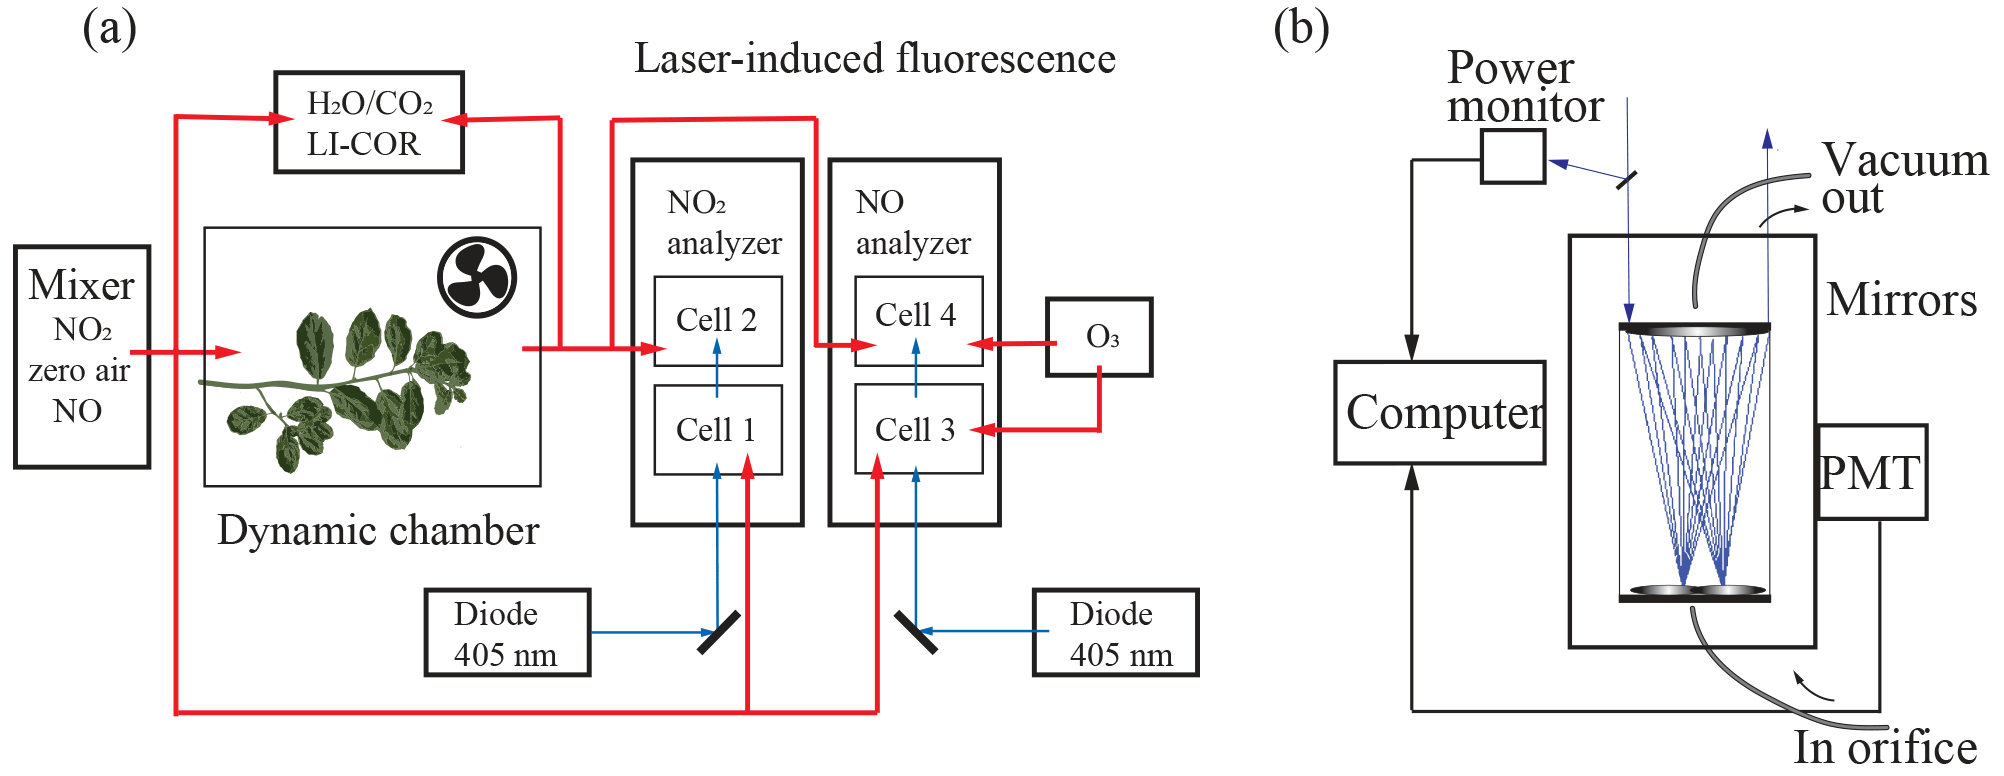
Figure 2Schematic of the experimental dynamic chamber (a) and laser-induced fluorescence detection (b) setups.
2.1 Quercus agrifolia samples
NOx uptake by Quercus agrifolia (coastal live oak) was investigated in the laboratory. Three Quercus agrifolia individuals were purchased from a local native California plant nursery (Native Here Nursery), where the plants were grown from seeds and cuttings collected in Contra Costa County. The tree specimens were grown in a nutrient-rich commercial soil mixture (a mixture of orchard potting soil and EB stone cactus mix) at the Jane Grey Research Greenhouse at the University of California, Berkeley. The trees were 2–3 years old when measurements were taken.
2.2 Laser-induced fluorescence detection
NO2 was measured using LIF. A blue diode laser (Z-Laser ZM18H3) centered at a wavelength of 405 nm was focused into each detection cell and made 20 passes in White multipass optical configuration (Fig. 2b) (Thornton et al., 2000; Fuchs et al., 2009). Upon absorption of a visible photon, NO2 undergoes a transition from the 2A1 ground to the 2B2 excited electronic state. The excited NO2 molecule is either quenched by collision or emits a red-shifted photon as it relaxes back to ground state (e.g., Thornton et al., 2000). These emitted photons were detected using a red-sensitive photomultiplier tube (PMT) (Hamamatsu H7421-50). To minimize collisional quenching, each detection cell was maintained at a pressure of around 0.4 kPa. Excitation at 405 nm was chosen because it is near the region of maximum absorption in the NO2 spectrum and is not subject to interferences from absorption by water vapor or O3 (Matsumoto and Kajii, 2003).
Calibrations were performed every hour by diluting NO (4.97 ppm ± 5 %, Praxair) and NO2 standard gases (5.08 ppm ± 5 %, Praxair) to 1–10 ppb in humidified (RH ∼ 60 %) zero air. The limit of detection (LOD) for the detection cells is described as follows:
where m is the slope of the calibration curve constructed from standard dilutions, b is the PMT signal at 0 ppb NO or NO2, S∕N is the desired signal-to-noise ratio, and t is the time of signal averaging. At a S∕N of 2 and signal averaging over 5 min, the LOD for detection cells 1–4 was 15, 4, 10, and 30 ppt, respectively. NO2 in the incoming and outgoing airstreams was measured simultaneously in the first two detection cells. In the second two detection cells, NO was quantitatively converted to NO2 in the presence of excess ozone, allowing for detection of total NOx (Fig. 2a). Ozone was produced using an ozone generator (Jelight 600), and flow rates of ozone delivered were adjusted to achieve unity conversion of NO to NO2.
2.3 Dynamic chamber system
The NOx flux measurements were performed with a dynamic branch enclosure system, consisting of a thin transparent double-walled Teflon film (FEP) bag (American Durafilm), which transmits 90 % of photosynthetically active radiation. The chamber was illuminated by an LED diode array of 430–475 and 620–670 nm lights (Apollo Horticulture). This light source was selected because it does not emit wavelengths below 420 nm, where NO2 dissociates, preventing loss of NO2 to photodissociation and resultant photochemistry. In order to ensure turbulent mixing and minimal aerodynamic and boundary layer resistances, a Teflon-coated fan was installed inside the inner chamber (Meixner et al., 1997; Pape et al., 2009; Breuninger et al., 2013).
Before experiments with Quercus agrifolia individuals, the deposition to an empty chamber was measured and background subtracted from subsequent branch measurements. The measured loss of NO2 to chamber walls was 5 % of the NO2 mixing ratio flowing into the chamber. This corresponded to a maximum loss of 0.4 ppb at 8 ppb NO2 and minimum loss of 0.05 ppb at 1 ppb NO2. Emission of less than 0.05 ppb NO2 from the Teflon walls was also observed when chamber lights were turned on with 0 ppb NO2 flowing through the system. It is likely that the chamber walls buffer uptake of NO2, but this is a minor effect, as the wall emission observed was a tiny fraction of the measured fluxes.
During measurements, the enclosed branch was exposed to known amounts of either NO2 or NO mixed with zero air. The inner chamber had an inner diameter of 20 cm, a length of 40 cm, and a total volume of 13 L (American Durafilm 200A Teflon FEP). Flow rates into the inner chamber (Q) during experiments were typically 5 L min−1, creating a residence time in the chamber of 3 min. The outer chamber had an inner diameter of 30 cm and a length of 55 cm (American Durafilm 500C20 Teflon FEP). Zero air at a flow rate of 3 L min−1 constantly fumigated the outer bag, serving as a buffer region to ensure the laboratory air, with high mixing ratios of NOx, did not diffuse into the bag enclosing the branch.
The photosynthetic photon flux density (PPFD) was monitored outside the chamber with a LiCor quantum sensor (LiCor LI-190SA). The flux density measured above the chamber was 1190 µmol m−2 s−1, approximately the PPFD for Berkeley, California, at noon during the month of October. This is well above the photon flux required to achieve maximal stomatal aperture for broadleaf evergreen trees (von Caemmerer and Farquhar, 1981; Chaparro-Suarez et al., 2011; Breuninger et al., 2013). We confirmed this assumption by covering the lights with a filter to reduce the intensity by 40 % and monitoring CO2 and H2O exchange. No reduction in the exchange rates of these gases were observed. The relative humidity of air entering the chamber was maintained at 50 %–65 % in all experiments by flowing zero air through a bubbler before mixing with NOx. Measurements of NOx exchange fluxes occurred under a light/dark cycle with a photoperiod of 12 h and a temperature of ∘C. No change in NOx uptake was observed when heating the chamber with the lights off or cooling the chamber with the lights on. We therefore expect no significant temperature effects caused by the 4 ∘C difference in temperature between light and dark periods. We also observed a relative humidity increase in the delivered air of about 2 % with the lights off, but do not expect this increase to produce any significant changes in NOx deposition or plant physiology (von Caemmerer and Farquhar, 1981; Chaparro-Suarez et al., 2011).
Exchange of CO2 and H2O with the leaves were monitored with a LiCor-6262 H2O∕CO2 analyzer operating in differential mode. Flows of 0.1 L min−1 of air entering and exiting the chamber were diverted to the LiCor analyzer to measure the CO2 assimilation and transpiration rates. To measure the CO2 content and relative humidity of air delivered to the chamber, 0.5 L min−1 of the humidified zero air ∕ NOx mixture was diverted to a second external 1.5 L cuvette. The temperature and relative humidity of air entering the chamber were measured with a temperature and relative humidity module in the external cuvette (TE Connectivity HTM2500LF). The CO2 mixing ratios in the external chamber were monitored with a Vaisala CarboCap GMP343 sensor.
2.4 NOx flux densities
The leaf-level exchange flux of NO or NO2 () was calculated according to Eq. (2):
where Q is the flow rate (m3 s−1), A is the enclosed leaf area (m2), C0 is the concentration leaving the chamber, and Ci is the concentration entering the chamber (nmol m−3). The calculated flux is related to a deposition velocity ( by Eq. (3):
where Ccomp is the compensation point, the concentration of NO2 below which the tree would instead act as a source of NOx. The deposition velocities were calculated through weighted least-square regression of calculated fluxes and outlet NOx concentrations (Co). The absolute value of the slope of the regression line was equal to the deposition velocity, with the x intercept representing the compensation point concentration. The precision error in the NOx exchange flux (σF) was calculated through propagation of the error in the inlet ( and outlet ( concentrations (Eq. 4).
and were estimated as the larger of the error in the calibration slopes and the standard deviation of the 5 min signal average. From observations in daily deviations of the flow rate and error in measured leaf area using the ImageJ software (Schneider et al., 2012), we estimate the error in to be a maximum of 0.005 cm s−1. This usually was only a minor contribution to the total error in the NOx exchange flux.
The calculated deposition velocity was used to find the total resistance to deposition, R, via Eq. (5).
The total resistance is described by the canopy stomatal resistance model (Baldocchi et al., 1987) and defined in Eqs. (6)–(7).
where Rleaf is the total leaf resistance and Ra, Rb, Rcut, Rst, and Rm are the aerodynamic, boundary layer, cuticular, stomatal, and mesophilic resistances, respectively. The aerodynamic resistance is characterized by the micrometeorology above a surface and is dependent upon the wind speed and turbulence of air flow. The boundary layer resistance describes the diffusion of a molecule through a shallow boundary of air above a surface and is dependent on microscopic surface properties, diffusivity of the gas species, wind speed, and turbulence of air flow (Baldocchi et al., 1987). Rcut, Rst, and Rm are the resistances associated with deposition to the leaf cuticles or through the stomata, and are dependent upon plant physiology.
The chamber fan, installed to create turbulent mixing, allowed for the assumption that Ra was negligible (Pape et al., 2009; Breuninger et al., 2012). Rb is chamber-specific, and has typically not been measured in previous chamber experiments of NO2 leaf-level deposition (Chaparro-Suarez et al., 2011; Breuninger et al., 2012, 2013). Rb was experimentally measured in this study by placing a tray of activated carbon into the chamber (assumed to have zero surface resistance to deposition of NO2) and calculating the deposition flux of NO2. The leaf components to the total deposition resistance were determined through dark and light experiments. During dark experiments, the stomata were closed (confirmed with measurements of CO2 and H2O exchange), and the deposition observed was assumed to be entirely driven by deposition to the cuticles.
3.1 Determination of the boundary resistance Rb
To estimate the chamber boundary layer resistance and test the assumption that Rb≪Rleaf, a dish of activated carbon, which theoretically has zero chemical resistance to deposition of NO2, was placed inside the chamber. The boundary layer resistance was considered to be the only component of the total resistance to deposition. The deposition velocity of NO2 to activated carbon was measured as 0.52±0.06 cm s−1, corresponding to a boundary layer resistance to NO2 deposition of 1.94±0.02 s cm−1 (Fig. 3). This boundary resistance is approximately double what was measured by Pape et al. (2009) – a reasonable difference given differences in chamber design (Fig. 2). The Rb for NO2 was scaled with the ratio of diffusivities of NO2 and NO in air to obtain the resistance to deposition of NO of 2.59±0.03 s cm−1. However, with a branch enclosed inside the chamber, the effective boundary resistance to deposition will likely be reduced, as the surface roughness and surface area for deposition is increased (Galbally and Roy, 1980; Pape et al., 2009). The boundary resistances presented above thus serve as an upper limit for Rb with vegetation inside the chamber.

Figure 3Flux to a 5.1 cm diameter dish filled with activated charcoal. The chemical surface resistance to deposition is approximately zero, so the deposition velocity for deposition of NO2 to the surface of the charcoal dish is the reciprocal of the boundary layer resistance. The line of best fit is (0.51±0.032)Co, where Co is the concentration of NO2 in the outgoing airstream.
The boundary resistance was also estimated in an additional experiment (not shown) in which a de-ionized water-soaked Whatman no. 1 filter paper was placed inside the chamber and the evaporation of water vapor into the chamber filled with dry zero air was measured. The emission flux of water vapor from the filter paper was calculated in a similar manner to that of NOx deposition flux (Eq. 2). The conductance to water vapor was then calculated via
where is the partial pressure of water vapor inside the chamber, Psat is the saturation vapor pressure at the temperature in the chamber, and gw is the conductance to water vapor. The measured conductance to water vapor was scaled with the ratio of diffusivities of NO2 to water vapor ( and inverted to find the NO2 boundary layer resistance:
The boundary resistance to NO2 deposition by this method was found to be 2 s cm−1, essentially identical to the measurement on the activated-carbon.
3.2 NOx deposition velocity and compensation point concentration
The deposition velocities and compensation points were respectively calculated as the slope and x-axis intercept of the regression line between NOx exchange flux and chamber NOx concentrations (Fig. 4). The detection limit was the dominant source of error in the estimation of the NO exchange flux and compensation point. The large relative uncertainties in NO flux measurements were caused by the much slower deposition of NO compared with that of NO2, inhibiting our ability to observe the very small changes between the NO concentration in the chamber and the incoming airstream (Fig. 4). Additional uncertainty in NO2 flux measurements because of enhanced water vapor quenching of excited-state NO2 should be minimal, as calibrations and measurements were performed at equivalent relative humidities. However, transpiration of the enclosed leaves caused the absolute humidity within chamber to be enhanced by 0.3 %–0.5 % relative to the incoming airstream. We expect this to result in a maximum error in calculated NO2 mixing ratios of 1 %–1.75 % (Thornton et al., 2000), resulting in maximum errors in the calculated fluxes and deposition velocities of 2 % and 4 %, respectively. This 4 % error in the calculated deposition velocity during lights-on experiments is less that the uncertainty of the linear fit (Fig. 4).

Figure 4NO2 (a) and NO (b) fluxes versus the outlet concentrations for all Quercus agrifolia individuals with the chamber lights on (green) and off (blue). The line of best fit is shown in red and was calculated to minimize the weighted residuals in both the x and y axes. The blue dotted lines show where flux and Co are zero. A significantly positive (α=0.5) x intercept occurs for NO, but not NO2 experiments.
Correlation coefficients, deposition velocities, compensation points, and statistical testing of the compensation point for NO2 and NO deposition are shown in Table 1 and Table 2, respectively, and were calculated according to Breuninger et al. (2013). For NO2 experiments, only one dark and one light experiment with Quercus agrifolia 1 were found to have statistically significant (α=0.05) nonzero intersections with the x axis (Table 1). The range of Ccomp measured was −0.02 to 0.300 ppb NO2, with probabilities of Ccomp=0 ranging from 10.3 % to 91.6 % (excluding the two Quercus agrifolia 1 experiments) (Table 1). Conversely, all three Quercus agrifolia individuals during all dark and light NO deposition experiments demonstrated compensation points significantly above zero, ranging from 0.74 to 3.8 ppb NO. The average compensation point was calculated as 0.84±0.32 ppb NO during light experiments and 2.4±1.1 ppb NO during dark experiments (Table 2).
Table 1Parameters of NO2 bivariate linear least-square fitting regression analysis.
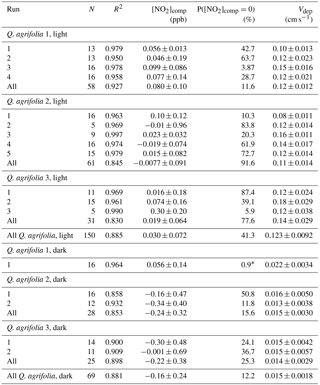
* Significant nonzero compensation point.
Table 2Parameters of NO bivariate linear least-square fitting regression analysis.
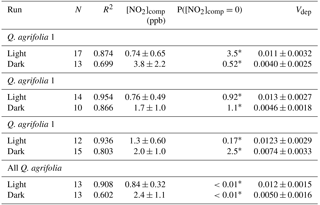
* Significant nonzero compensation point.
Student's t tests (not shown) demonstrated that deposition velocities and compensation points measured during NO and NO2 lights-on and lights-off experiments were not significantly different (to the α=0.05 confidence level) between different Quercus agrifolia individuals. Deposition velocities for NO2 light experiments were between 0.08 and 0.18 cm s−1, with a deposition of 0.123±0.009 cm s−1 calculated from the regression of all light experiments. Dark experiments resulted in deposition velocities between 0.013 and 0.022 cm s−1, with a deposition velocity of 0.015±0.001 cm s−1 calculated from the regression of all dark experiments (Table 1). NO demonstrated much slower deposition, with deposition velocities from all light and dark experiments calculated as 0.012±0.002 and 0.005±0.002 cm s−1, respectively (Table 2). Despite the large compensation point measured for NO, the leaf emission fluxes of NO were a maximum of only 8 pmol m−2 s−1 at 0.1 ppb NO, approximately half of the deposition flux measured for NO2 at 0.1 ppb (Fig. 4). At typical NO2∕NO ratios and gradients measured in forest canopies, the leaf-level NO2 and NO exchange fluxes measured make dry stomatal deposition to Quercus agrifolia a net sink of NOx within the canopy.
3.3 Resistances to leaf-level NOx deposition
The deposition velocity measured from linear regression of NOx exchange fluxes and NOx chamber concentrations is the inverse of the total resistance to deposition (Eq. 6), with Ra assumed to be zero. The total resistance in the chamber is thus
where is the sum of Rm and Rst. The leaf resistance to deposition can then be found by subtracting the boundary layer resistance from the total resistance. Total leaf resistances, Rleaf, were calculated using the boundary layer resistances for NO2 and NO of 1.94±0.02 and 2.59±0.03 s cm−1, respectively. During the dark experiments, Rleaf is equal to Rcut, and the deposition velocity measured was estimated as the inverse of the sum of the boundary and cuticular resistances. After calculation of Rcut from dark experiments, the sum of the stomatal and mesophilic contributions ( to the total leaf resistance was determined. Rb, Rcut, and are shown in Table 3. It should be noted that since the reported Rb is the maximum possible boundary resistance, the reported Rcut and are lower limits. If we were to assume the chamber boundary resistance with the branch enclosed is insignificant (∼0 s cm−1), this would introduce maximum systematic 30 % and 3 % errors to the calculated NO2, and Rcut, respectively (giving an of 9.2±0.9 s cm−1 and an Rcut of 67±8 s cm−1). The errors in the calculated NO resistances would be negligible.
Table 3Summary of deposition resistance parameters of Quercus agrifolia.
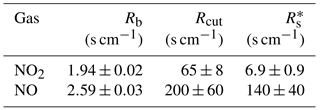
It is possible that the stomata were not entirely closed during dark experiments. Evidence exists that nocturnal stomatal conductance can be large enough to allow for transpiration (Dawson et al., 2007), and low (within the range of uncertainty observed for the LICOR-6262) emission of water vapor during dark experiments was measured. However, even if all the deposition during dark experiments was stomatal, this would cause only a 0.5 s cm−1 reduction in the calculated for NO2 – less than the uncertainty from the error in the measured deposition velocity (∼10 % error). The cuticular resistances reported here during dark experiments are nonetheless atmospherically relevant to nighttime NOx deposition.
4.1 NOx deposition velocities and compensation points
The strong linear dependence between NO2 fluxes and NO2 chamber concentrations that we observe is consistent with previous observations that NO2 exchange is largely driven by NO2 concentration differences between the atmosphere and gaseous phase of the leaf (Rondon and Granat, 1994; Gessler et al., 2000; Hereid and Monson, 2001; Sparks et al., 2001; Teklemariam and Sparks, 2006; Pape et al., 2009; Chaparro-Suarez et al., 2011; Breuninger et al., 2012). Our measurements of NO2 stomatal resistance parameters for Quercus agrifolia represent a stomatal deposition velocity () of 0.14±0.02 cm s−1. This value is similar to the range of 0.1–0.15 cm s−1 that Chapparo-Suarez et al. (2011) found for two European oak tree species, Quercus robur and Quercus ilex. The deposition velocity measured here for Quercus agrifolia is also much larger than 0.007–0.042 cm s−1 range found for Norway spruce (Picea abies) by Breuninger et al. (2012), but surprisingly comparable, given the differences in plant species, to the 0.12 cm s−1 deposition velocity found for maize (Zea mays) by Hereid and Monson (2001). We also find here an NO2 flux at 5 ppb of 0.2 nmol m−1 s−1, similar in magnitude to the 0.1, 0.15–1.5, and 0.18 nmol m−1 s−1 fluxes measured for Fagus sylvatica (Gessler et al., 2000), tropical Panamanian native trees (Sparks et al., 2001), and periwinkle (Catharanthus roseus) (Teklemariam and Sparks, 2006), respectively.
Resistance parameters reported above for NO deposition to Quercus agrifolia represent a stomatal deposition velocity of 0.007±0.002 cm s−1 and cuticular deposition velocity of 0.005±0.001 cm s−1. This observation of very minor NO uptake – at least an order of magnitude less than that of NO2 uptake – is also consistent with previous observations (Hanson and Lindberg, 1991; Hereid and Monson, 2001; Teklemariam and Sparks, 2006). We also detected a statistically significant NO compensation point, with low emissions up to 8 pmol m−2 s−1 observed below 1 ppb. These observations are similar to the 8–14 pmol m−2 s−1 emission fluxes of NO reported by Hereid and Monson (2001) and Teklemariam and Sparks (2006) at low NOx concentrations.
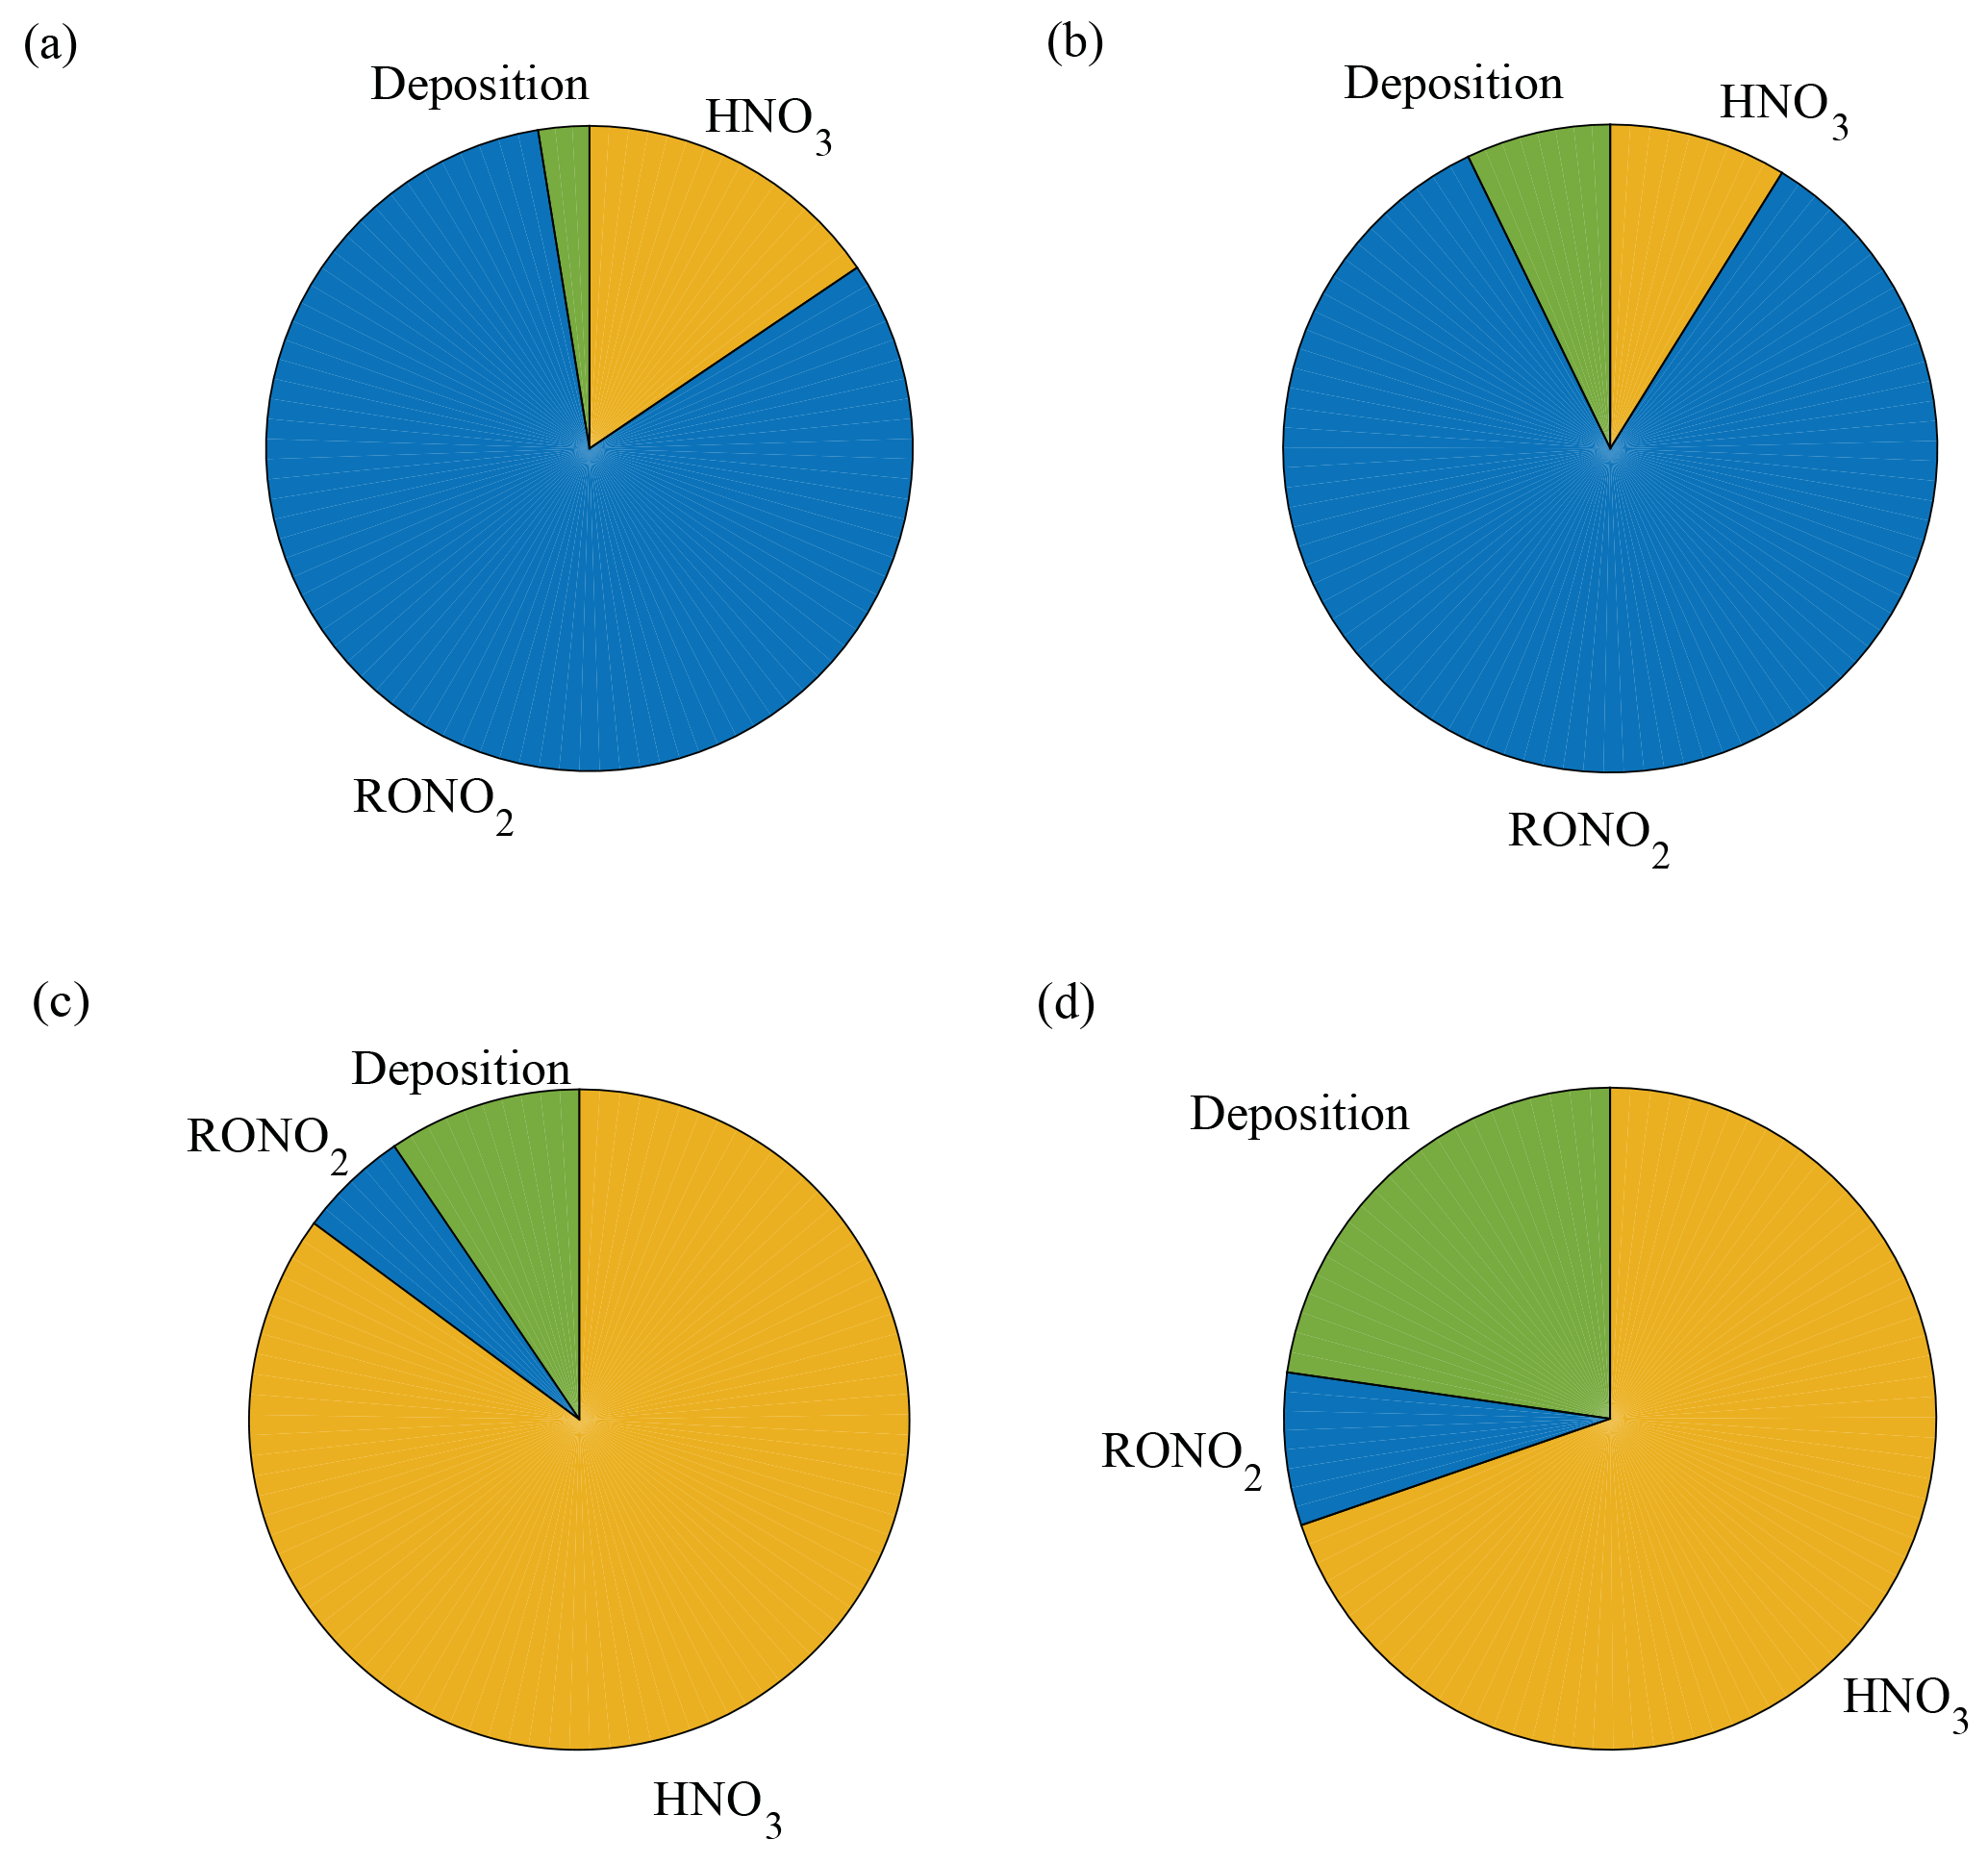
Figure 5Model predictions of the fraction of NOx loss to alkyl nitrate formation, nitric acid formation, and deposition in a Q. agrifolia woodland. The model was run using scenarios with only soil emissions and LAI of 1 m2 m−2 (a), only soil emissions and LAI of 3 m2 m−2 (b), ppb and LAI of 1 m2 m−2 (c), and ppb and LAI of 3 m2 m−2 (d).

Figure 624 h average vertical fluxes of NOx predicted by the 1-D multibox model for a California oak woodland using the leaf resistances measured in this study. Model runs were conducted for low (red) and high (blue) LAI cases and for a no-deposition scenario (green).
No significant NO2 compensation point was found for our measurements of Quercus agrifolia NOx uptake. Many previous studies have reported NO2 compensation points, ranging from 0.1 to 3.0 ppb, implicating trees as a constant source of NOx in forest ecosystems (Gessler et al., 2000; Hereid and Monson, 2001; Sparks et al., 2001; Teklemariam and Sparks, 2006). Our findings of a lack of NO2 compensation point support field observations and modeling studies that have recognized NO2 dry deposition to vegetation as an important NOx loss process in forests (Jacob and Wofsy, 1990; Ganzeveld et al., 2002b; Geddes and Murphy, 2014). Our results also support the works of Chaparro-Suarez et al. (2011) and Breuninger et al. (2013), who did not find evidence of an NO2 compensation point.
The primary difference in our experimental setup, compared to previous dynamic chamber studies that have found an NO2 compensation point, is the use of a direct NO2 measurement technique. Measurements of a significant NO2 compensation point have mostly been obtained using techniques requiring conversion of NO2, followed by chemiluminescence detection of NO (Gessler et al., 2000; Hereid and Monson, 2001; Sparks et al., 2001; Teklemariam and Sparks, 2006). Such methods have utilized either nonspecific photolytic (Gessler et al., 2000; Hereid and Monson, 2001), luminol (Sparks et al., 2001), or catalytic conversion (Teklemariam and Sparks, 2006) techniques, which may have also resulted in the conversion of PAN, HONO, HNO3, and other organic nitrates, as well as interferences from alkene + ozone reactions (Carter et al., 2005; Reed et al., 2016). If any of these interfering compounds are not excluded from the chamber system, outgas from the chamber itself, or form from reactions of biogenic emissions, this would cause an enhancement in the observed NO2 compensation point, and a suppression of observed deposition velocity. Our measurements of NO2 mixing ratios also demonstrate a much higher degree of precision, due largely to a lower detection limit, than comparable experiments with specific photolytic conversion and chemiluminescence measurement of NO2 (Chaparro-Suarez et al., 2011; Breuninger et al., 2012, 2013). Additionally, previous chamber measurements have sometimes employed chamber setups that would let in a substantial amount of UV light, yet did not exclude photochemical reactions between NO2, NO, and O3. Such corrections are excluded here because of our use of chamber lights with only wavelengths above 420 nm. To avoid this issue, other experiments have instead involved a setup including a simultaneously measured blank chamber, which would theoretically allow for correction for any reactions resulting from photolysis of NO2, O2, or O3 (Gessler et al., 2000; Hereid and Monson, 2001). Such corrections might be complicated by secondary chemistry not present in our experiments.
4.2 Implication for canopy NOx loss
Resistance parameters reported above (Table 3) were used in a 1-D seven-layer multibox model representing chemical reactions, vertical transport, and leaf-level processes scaled to the canopy level to assess the impacts of NOx deposition velocities on the NOx lifetime and fluxes. The model is constructed in a manner similar to Wolfe and Thornton (2011) with the following modifications: the model domain consists of seven well-mixed vertical layers extending to a planetary boundary layer height of 1000 m, with the forest canopy represented by the first three layers; NOx cuticular and stomatal resistances are adjustable input parameters; and the chemistry implemented in the model is the simplified reaction mechanism presented in Brown and Cohen (2012). The 1-D model was run for meteorological conditions representing the native habitat of Quercus agrifolia and two different leaf area indices (LAIs), approximately representing the lower and upper limits of LAIs found in California oak woodlands. As shown in Fig. 5a and b, the model predicts NOx deposition to Q. agrifolia accounts for 3 %–7 % of the total NOx loss within the boundary layer if the only source of NOx is emissions from the soil. This represents a total NOx lifetime of 7–7.5 h in the boundary layer, and a lifetime to deposition of 4–11 days in the boundary layer and 0.5–1.2 h below the canopy. Under these scenarios approximately 15–30 % of soil-emitted NOx is removed in the canopy (Fig. 6) – on the lower end of the range of 25 %–80 % reduction observed in field studies (Jacob and Wofsy, 1990; Lerdau et al., 2000; Ganzeveld et al., 2002a; Min et al., 2014).
The coastal regions of California where Q. agrifolia is found frequently experience much higher NOx mixing ratios of 10–50 ppb. This is particularly important for oak woodlands of the San Francisco Bay and Los Angeles areas, where anthropogenic emissions from nearby urban centers are the majority of the NOx source. To account for this extra NOx source, additional model runs were performed with an added term accounting for NOx advection from a more concentrated upwind source (, with advection treated as a simple mixing process:
where kmix=0.3 h−1 and is 10 ppb.
In this case, deposition to Q. agrifolia could account for 10–22 % of the total NOx loss in the boundary layer (Fig. 5c, d), representing a lifetime to deposition of 5–14 days in the boundary layer and a total NOx lifetime of 28–33 h. Deposition in this higher NOx scenario decreased the total NOx lifetime by 3–8 h, compared with a no-deposition case.
This work constitutes the first measurements of NO2 and NO foliar deposition resistance parameters for a North American tree species. We report observations of leaf-level resistances to NO2 and NO deposition, corresponding to total deposition velocities of NO2 and NO of 0.123±0.007 and 0.012±0.002 cm s−1 in the light and 0.015±0.001 and 0.005±0.002 cm s−1 in the dark, respectively. No compensation point was observed for NO2, but compensation points of 0.74–3.8 ppb were recorded for NO. The magnitude of NO emission below the compensation point was significantly less than the magnitude of NO2 uptake in the same concentration range, making Q. agrifolia an overall large net sink of NOx. The observed deposition is large enough to explain canopy reduction factors observed in canopy-level studies, but is at the lower end of estimated global CRFs. The results of the 1-D multibox model demonstrate that the deposition observed accounts for 5 %–20 % of NOx removal with a NOx lifetime to deposition of 0.5–1.2 h beneath the canopy of a California oak woodland. We show that foliar deposition of NOx represents a significant removal mechanism of NOx and can have a large impact on NOx mixing ratios and fluxes in such ecosystems. Further investigations of NO2 deposition to a larger variety of plant species under a range of environmental conditions are needed to accurately understand the global impacts of NO2 deposition across diverse ecosystems.
The data collected in this study can be obtained from the authors upon request. The details and implications of the 1-D multi-box model presented in this publication are being prepared for discussion in an additional paper. Questions relating to this model can be addressed to the authors.
ERD and JC carried out the experiments. ERD performed the data analysis, constructed the 1-D multi-box model, and prepared all figures. MV conceived of the original project idea and constructed the dynamic chamber and laser-induced fluorescence instrument. Modifications to the initial setup were made by ERD. ERD wrote the paper in consultation with RCC. RCC supervised the project.
The authors declare that they have no conflict of interest.
We would like to thank the two reviewers for their constructive comments. We
also wish to gratefully acknowledge financial support from the National
Science Foundation (NSF, AGS-1352972). Additional support was provided by an
NSF Graduate Research Fellowship to Erin R. Delaria.
Edited by: Alex B. Guenther
Reviewed by: Laurens Ganzeveld and one anonymous referee
Ammann, M., Vonballmoos, P., Stalder, M., Suter, M., and Brunold, C.: Uptake and assimilation of atmospheric NO2-N by spruce needles (Picea abies): A field study, Water Air Soil Poll., 85, 1497–1502, https://doi.org/10.1007/Bf00477193, 1995.
Baldocchi, D. D., Hicks, B. B., and Camara, P.: A Canopy Stomatal-Resistance Model for Gaseous Deposition to Vegetated Surfaces, Atmos. Environ., 21, 91–101, https://doi.org/10.1016/0004-6981(87)90274-5, 1987.
Breuninger, C., Oswald, R., Kesselmeier, J., and Meixner, F. X.: The dynamic chamber method: trace gas exchange fluxes (NO, NO2, O3) between plants and the atmosphere in the laboratory and in the field, Atmos. Meas. Tech., 5, 955–989, https://doi.org/10.5194/amt-5-955-2012, 2012.
Breuninger, C., Meixner, F. X., and Kesselmeier, J.: Field investigations of nitrogen dioxide (NO2) exchange between plants and the atmosphere, Atmos. Chem. Phys., 13, 773–790, https://doi.org/10.5194/acp-13-773-2013, 2013.
Browne, E. C. and Cohen, R. C.: Effects of biogenic nitrate chemistry on the NOx lifetime in remote continental regions, Atmos. Chem. Phys., 12, 11917–11932, https://doi.org/10.5194/acp-12-11917-2012, 2012.
Burkhardt, J. and Eiden, R.: Thin Water Films on Coniferous Needles, Atmos. Environ., 28, 2001–2011, https://doi.org/10.1016/1352-2310(94)90469-3, 1994.
Caranto, J. D. and Lancaster, K. M.: Nitric oxide is an obligate bacterial nitrification intermediate produced by hydroxylamine oxidoreductase, P. Natl. Acad. Sci. USA, 114, 8217–8222, https://doi.org/10.1073/pnas.1704504114, 2017.
Carter, W. P. L., Cocker, D. R., Fitz, D. R., Malkina, I. L., Bumiller, K., Sauer, C. G., Pisano, J. T., Bufalino, C., and Song, C.: A new environmental chamber for evaluation of gas-phase chemical mechanisms and secondary aerosol formation, Atmos. Environ., 39, 7768–7788, https://doi.org/10.1016/j.atmosenv.2005.08.040, 2005.
Chaparro-Suarez, I. G., Meixner, F. X., and Kesselmeier, J.: Nitrogen dioxide (NO2) uptake by vegetation controlled by atmospheric concentrations and plant stomatal aperture, Atmos. Environ., 45, 5742–5750, https://doi.org/10.1016/j.atmosenv.2011.07.021, 2011.
Crutzen, P. J.: Role of NO and NO2 in the Chemistry of the Troposphere and Stratosphere, Annu. Rev. Earth Pl. Sc., 7, 443–472, https://doi.org/10.1146/annurev.ea.07.050179.002303, 1979.
Dawson, T. E., Burgess, S. S. O., Tu, K. P., Oliveira, R. S., Santiago, L. S., Fisher, J. B., Simonin, K. A., and Ambrose, A. R.: Nighttime transpiration in woody plants from contrasting ecosystems, Tree Physiol., 27, 561–575, https://doi.org/10.1093/treephys/27.4.561, 2007.
Fuchs, H., Dube, W. P., Lerner, B. M., Wagner, N. L., Williams, E. J., and Brown, S. S.: A Sensitive and Versatile Detector for Atmospheric NO2 and NOx Based on Blue Diode Laser Cavity Ring-Down Spectroscopy, Environ. Sci. Technol., 43, 7831–7836, https://doi.org/10.1021/es902067h, 2009.
Galbally, I. E. and Roy, C. R.: Destruction of Ozone at the Earths Surface, Q. J. Roy. Meteor. Soc., 106, 599–620, https://doi.org/10.1002/qj.49710644915, 1980.
Ganzeveld, L. N., Lelieveld, J., Dentener, F. J., Krol, M. C., Bouwman, A. J., and Roelofs, G. J.: Global soil-biogenic NOx emissions and the role of canopy processes, J. Geophys. Res.-Atmos., 107, 4298, https://doi.org/10.1029/2001jd001289, 2002a.
Ganzeveld, L. N., Lelieveld, J., Dentener, F. J., Krol, M. C., and Roelofs, G. J.: Atmosphere-biosphere trace gas exchanges simulated with a single-column model, J. Geophys. Res.-Atmos., 107, 4297, https://doi.org/10.1029/2001jd000684, 2002b.
Geddes, J. A. and Murphy, J. G.: Observations of reactive nitrogen oxide fluxes by eddy covariance above two midlatitude North American mixed hardwood forests, Atmos. Chem. Phys., 14, 2939–2957, https://doi.org/10.5194/acp-14-2939-2014, 2014.
Gessler, A., Rienks, M., and Rennenberg, H.: NH3 and NO2 fluxes between beech trees and the atmosphere – correlation with climatic and physiological parameters, New. Phytol., 147, 539–560, https://doi.org/10.1046/j.1469-8137.2000.00712.x, 2000.
Hanson, P. J. and Lindberg, S. E.: Dry Deposition of Reactive Nitrogen-Compounds – a Review of Leaf, Canopy and Non-Foliar Measurements, Atmos. Environ. A-Gen., 25, 1615–1634, https://doi.org/10.1016/0960-1686(91)90020-8, 1991.
Hereid, D. P. and Monson, R. K.: Nitrogen oxide fluxes between corn (Zea mays L.) leaves and the atmosphere, Atmos. Environ., 35, 975–983, https://doi.org/10.1016/S1352-2310(00)00342-3, 2001.
Jacob, D. J. and Wofsy, S. C.: Budgets of Reactive Nitrogen, Hydrocarbons, and Ozone over the Amazon-Forest during the Wet Season, J. Geophys. Res.-Atmos., 95, 16737–16754, https://doi.org/10.1029/JD095iD10p16737, 1990.
Johansson, C.: Pine forest: a negligible sink for atmospheric NOx in rural Sweden, Tellus B, 39B, 426–438, 1987.
Lee, Y. N. and Schwartz, S. E.: Evaluation of the Rate of Uptake of Nitrogen-Dioxide by Atmospheric and Surface Liquid Water, J. Geophys. Res.-Oceans, 86, 1971–1983, https://doi.org/10.1029/JC086iC12p11971, 1981a.
Lee, Y. N. and Schwartz, S. E.: Reaction-Kinetics of Nitrogen-Dioxide with Liquid Water at Low Partial-Pressure, J. Phys. Chem.-US, 85, 840–848, https://doi.org/10.1021/j150607a022, 1981b.
Lerdau, M. T., Munger, L. J., and Jacob, D. J.: Atmospheric chemistry – The NO2 flux conundrum, Science, 289, 2291–2293, https://doi.org/10.1126/science.289.5488.2291, 2000.
Matsumoto, J. and Kajii, Y.: Improved analyzer for nitrogen dioxide by laser-induced fluorescence technique, Atmos. Environ., 37, 4847–4851, https://doi.org/10.1016/j.atmosenv.2003.08.023, 2003.
Mckenney, D. J., Shuttleworth, K. F., Vriesacker, J. R., and Findlay, W. I.: Production and Loss of Nitric-Oxide from Denitrification in Anaerobic Brookston Clay, Appl. Environ. Microb., 43, 534–541, 1982.
Meixner, F. X., Fickinger, T., Marufu, L., Serca, D., Nathaus, F. J., Makina, E., Mukurumbira, L., and Andreae, M. O.: Preliminary results on nitric oxide emission from a southern African savanna ecosystem, Nutr. Cycl. Agroecosys., 48, 123–138, 1997.
Min, K.-E., Pusede, S. E., Browne, E. C., LaFranchi, B. W., Wooldridge, P. J., Wolfe, G. M., Harrold, S. A., Thornton, J. A., and Cohen, R. C.: Observations of atmosphere-biosphere exchange of total and speciated peroxynitrates: nitrogen fluxes and biogenic sources of peroxynitrates, Atmos. Chem. Phys., 12, 9763–9773, https://doi.org/10.5194/acp-12-9763-2012, 2012.
Min, K.-E., Pusede, S. E., Browne, E. C., LaFranchi, B. W., and Cohen, R. C.: Eddy covariance fluxes and vertical concentration gradient measurements of NO and NO2 over a ponderosa pine ecosystem: observational evidence for within-canopy chemical removal of NOx, Atmos. Chem. Phys., 14, 5495–5512, https://doi.org/10.5194/acp-14-5495-2014, 2014.
Neubert, A., Kley, D., Wildt, J., Segschneider, H. J., and Forstel, H.: Uptake of NO, NO2 and O3 by Sunflower (Helianthus-Annuus L) and Tobacco Plants (Nicotiana-Tabacum-L) – Dependence on Stomatal Conductivity, Atmos. Environ. A-Gen., 27, 2137–2145, https://doi.org/10.1016/0960-1686(93)90043-X, 1993.
Nussbaum, S., Vonballmoos, P., Gfeller, H., Schlunegger, U. P., Fuhrer, J., Rhodes, D., and Brunold, C.: Incorporation of Atmospheric (NO2)-N-15-Nitrogen into Free Amino-Acids by Norway Spruce Picea-Abies (L) Karst, Oecologia, 94, 408–414, https://doi.org/10.1007/Bf00317117, 1993.
Okano, K. and Totsuka, T.: Absorption of Nitrogen-Dioxide by Sunflower Plants Grown at Various Levels of Nitrate, New Phytol., 102, 551–562, https://doi.org/10.1111/j.1469-8137.1986.tb00831.x, 1986.
Pape, L., Ammann, C., Nyfeler-Brunner, A., Spirig, C., Hens, K., and Meixner, F. X.: An automated dynamic chamber system for surface exchange measurement of non-reactive and reactive trace gases of grassland ecosystems, Biogeosciences, 6, 405–429, https://doi.org/10.5194/bg-6-405-2009, 2009.
Ramge, P., Badeck, F. W., Plochl, M., and Kohlmaier, G. H.: Apoplastic Antioxidants as Decisive Elimination Factors within the Uptake Process of Nitrogen-Dioxide into Leaf Tissues, New Phytol., 125, 771–785, https://doi.org/10.1111/j.1469-8137.1993.tb03927.x, 1993.
Reed, C., Evans, M. J., Di Carlo, P., Lee, J. D., and Carpenter, L. J.: Interferences in photolytic NO2 measurements: explanation for an apparent missing oxidant?, Atmos. Chem. Phys., 16, 4707–4724, https://doi.org/10.5194/acp-16-4707-2016, 2016.
Rogers, H. H., Jeffries, H. E., and Witherspoon, A. M.: Measuring Air Pollutant Uptake by Plants – Nitrogen-Dioxide, J. Environ. Qual., 8, 551–557, https://doi.org/10.2134/jeq1979.00472425000800040022x, 1979.
Rondon, A., Johansson, C., and Granat, L.: Dry Deposition of Nitrogen-Dioxide and Ozone to Coniferous Forests, J. Geophys. Res.-Atmos., 98, 5159–5172, https://doi.org/10.1029/92jd02335, 1993.
Rondon, A. and Granat, L.: Studies on the Dry Deposition of NO2 to Coniferous Species at Low NO2 Concentrations, Tellus B, 46, 339–352, https://doi.org/10.1034/j.1600-0889.1994.t01-4-00001.x, 1994.
Schneider, C. A., Rasband, W. S., and Eliceiri, K. W.: NIH Image to ImageJ: 25 years of image analysis, Nat. Methods, 9, 671–675, https://doi.org/10.1038/nmeth.2089, 2012.
Seinfeld, J. H. and Pandis, S. N.: Atmospheric Chemistry and Physics: From Air Pollution to Global Change, 2nd edn., Wiley, New York, 2006.
Seok, B., Helmig, D., Ganzeveld, L., Williams, M. W., and Vogel, C. S.: Dynamics of nitrogen oxides and ozone above and within a mixed hardwood forest in northern Michigan, Atmos. Chem. Phys., 13, 7301–7320, https://doi.org/10.5194/acp-13-7301-2013, 2013.
Sparks, J. P., Monson, R. K., Sparks, K. L., and Lerdau, M.: Leaf uptake of nitrogen dioxide (NO2) in a tropical wet forest: implications for tropospheric chemistry, Oecologia, 127, 214–221, https://doi.org/10.1007/s004420000594, 2001.
Teklemariam, T. A. and Sparks, J. P.: Leaf fluxes of NO and NO2 in four herbaceous plant species: The role of ascorbic acid, Atmos. Environ., 40, 2235–2244, https://doi.org/10.1016/j.atmosenv.2005.12.010, 2006.
Thoene, B., Schroder, P., Papen, H., Egger, A., and Rennenberg, H.: Absorption of Atmospheric No2 by Spruce (Picea-Abies L Karst) Trees 1, NO2 Influx and Its Correlation with Nitrate Reduction, New Phytol., 117, 575–585, https://doi.org/10.1111/j.1469-8137.1991.tb00962.x, 1991.
Thornton, J. A., Wooldridge, P. J., and Cohen, R. C.: Atmospheric NO2: In situ laser-induced fluorescence detection at parts per trillion mixing ratios, Anal. Chem., 72, 528–539, https://doi.org/10.1021/ac9908905, 2000.
Tischner, R.: Nitrate uptake and reduction in higher and lower plants, Plant Cell Environ., 23, 1005–1024, https://doi.org/10.1046/j.1365-3040.2000.00595.x, 2000.
Vinken, G. C. M., Boersma, K. F., Maasakkers, J. D., Adon, M., and Martin, R. V.: Worldwide biogenic soil NOx emissions inferred from OMI NO2 observations, Atmos. Chem. Phys., 14, 10363–10381, https://doi.org/10.5194/acp-14-10363-2014, 2014.
von Caemmerer, S. and Farquhar, G. D.: Some Relationships between the Biochemistry of Photosynthesis and the Gas-Exchange of Leaves, Planta, 153, 376–387, 1981.
Wang, Y. P. and Leuning, R.: A two-leaf model for canopy conductance, photosynthesis and partitioning of available energy I: Model description and comparison with a multi-layered model, Agr. Forest Meteorol., 91, 89–111, https://doi.org/10.1016/S0168-1923(98)00061-6, 1998.
Weber, P., Nussbaum, S., Fuhrer, J., Gfeller, H., Schlunegger, U. P., Brunold, C., and Rennenberg, H.: Uptake of Atmospheric (NO2)-N-15 and Its Incorporation into Free Amino-Acids in Wheat (Triticum-Aestivum), Physiol. Plantarum, 94, 71–77, https://doi.org/10.1034/j.1399-3054.1995.940111.x, 1995.
Wildt, J., Kley, D., Rockel, A., Rockel, P., and Segschneider, H. J.: Emission of NO from several higher plant species, J. Geophys. Res.-Atmos., 102, 5919–5927, https://doi.org/10.1029/96jd02968, 1997.
Wolfe, G. M. and Thornton, J. A.: The Chemistry of Atmosphere-Forest Exchange (CAFE) Model – Part 1: Model description and characterization, Atmos. Chem. Phys., 11, 77–101, https://doi.org/10.5194/acp-11-77-2011, 2011.
Yienger, J. J. and Levy, H.: Empirical-Model of Global Soil-Biogenic NOx Emissions, J. Geophys. Res.-Atmos., 100, 11447–11464, https://doi.org/10.1029/95jd00370, 1995.
Yoneyame, T., Ito, O., and Engelaar, W. M. H. G.: Uptake, metabolism and distribution of nitrogen in crop plants traced by enriched and natural 15N: Progress over the last 30 years, Phytochem. Rev., 2, 121–132, https://doi.org/10.1023/B:PHYT.0000004198.95836.ad, 2003.