the Creative Commons Attribution 4.0 License.
the Creative Commons Attribution 4.0 License.
 | 02 Oct 2018
Reactive quenching of electronically excited NO2∗ and NO3∗ by H2O as potential sources of atmospheric HOx radicals
Terry J. Dillon
Pulsed laser excitation of NO2 (532–647 nm) or NO3 (623–662 nm) in the presence of H2O was used to initiate the gas-phase reaction → products (Reaction R5) and → products (Reaction R12). No evidence for OH production in Reactions (R5) or (R12) was observed and upper limits for OH production of and were assigned. The upper limit for k5b∕k5 renders this reaction insignificant as a source of OH in the atmosphere and extends the studies (Crowley and Carl, 1997; Carr et al., 2009; Amedro et al., 2011) which demonstrate that the previously reported large OH yield by Li et al. (2008) was erroneous. The upper limit obtained for k12b∕k12 indicates that non-reactive energy transfer is the dominant mechanism for Reaction (R12), though generation of small but significant amounts of atmospheric HOx and HONO cannot be ruled out. In the course of this work, rate coefficients for overall removal of by N2 (Reaction R10) and by H2O (Reaction R12) were determined: cm3 molecule−1 s−1 and cm3 molecule−1 s−1. Our value of k12 is more than a factor of 4 smaller than the single previously reported value.
- Article
(1814 KB) - Full-text XML
- BibTeX
- EndNote


The capacity of the atmosphere to oxidise trace gases released at the Earth's surface is sensitively dependent on the concentration of the hydroxyl radical OH (Lelieveld et al., 2008). Most atmospheric OH is believed to be generated via a combination of primary photolytic processes involving O3 (λ≤370 nm; IUPAC, 2018) (Reactions R1, R2) and HONO (λ: 280–370 nm; IUPAC, 2018), for example, as well as in the reaction of NO with HO2, the latter being formed in the troposphere via the oxidative degradation of organic trace gases.
As a large fraction of the oxidation of organic trace gases is initiated by reaction with OH, the conversion of HO2 back to OH (e.g. via reaction with NO) is often referred to as recycling; the relative importance of direct OH formation and recycling depend on the concentrations of organics and NO. Together, OH and HO2 are referred to as HOx.
Any reaction that can generate OH or HO2 directly or indirectly (e.g. via generation of a short-lived OH precursor such as HONO) thus contributes to atmospheric oxidation capacity. Processes that form HONO (both gas phase and heterogeneous) are therefore of great interest to atmospheric science and have been the subject of many studies (see, e.g. Stemmler et al., 2007; Li et al., 2014; Meusel et al., 2016). Two processes that may potentially generate HOx and HONO are the gas-phase reactions of H2O with electronically excited nitrogen dioxide (NO2 A 2B2 henceforth ) and the electronically excited nitrate radical ( and , henceforth ).
1.1
The potential for this reaction to generate both OH and HONO was first discussed and evaluated by Crowley and Carl (1997), who highlighted a possible role in increasing OH production rates in the weakly illuminated winter troposphere. It was argued that non-dissociative absorption by NO2 (Reaction R4) could lead to formation of OH and HONO in a process (channel R5b of the overall reaction with H2O, R5) that is exothermic for excitation wavelengths across the visible absorption spectrum of NO2, which extends to ≈650 nm.
The rate of OH formation following NO2 excitation in the atmosphere depends on the OH yield (k5b∕k5) and on the relative rates of deactivation by H2O (Reaction R5) and by N2 and O2 (Reaction R6). For details of the NO2 cross sections, quantum yields, quenching rate constants, and associated photophysics for these processes, we refer to our previous publication (Crowley and Carl, 1997).
Crowley and Carl (1997) used 532 nm pulsed-laser excitation of NO2 to determine an upper limit to the OH yield of . Crowley and Carl (1997) also identified routes to O(1D) at shorter wavelengths that involved two-photon excitation of NO2, and which lead indirectly to OH formation via reaction of O(1D) with H2O. Whilst of some utility in the laboratory, such processes that require multiphoton excitation are generally of no consequence for the atmosphere.
More than 10 years later, Li et al. (2008) carried out similar experiments but at longer wavelengths (560–640 nm) and reached very different conclusions, deriving a yield of OH (and thus also HONO) close to , a factor of 14 larger than the upper limit of Crowley and Carl (1997). Calculations of the impact of Reactions (R4)–(R5) using the large yield reported by Li et al. (2008) led to the conclusion that Reaction (R5) is important for air quality under highly polluted conditions; use of the lower yield from Crowley and Carl (1997) resulted in minimal impact (Wennberg and Dabdub, 2008; Ensberg et al., 2010). Subsequent to the work of Li et al. (2008), two further experimental studies (Carr et al., 2009; Amedro et al., 2011) appeared to confirm the conclusions of Crowley and Carl (1997) and suggested that the high yield reported by Li et al. (2008) was an experimental artefact, resulting from multiphoton laser excitation of NO2 in their focussed laser beam (Amedro et al., 2011). However, the experiments of Amedro et al. (2011) at 565 nm and Carr et al. (2009) at 563.5 and 567.5 nm used prepared at wavelengths that covered only a small portion of the 560–630 nm range from Li et al. (2008). The single wavelength (532 nm) used by Crowley and Carl (1997), whilst interrogating the same excited states of NO2, was outside of the range of wavelengths covered by Li et al. (2008). The principal goal of the experiments on Reaction (R5) described in this work was therefore to measure OH yields (k5b / k5) using a range of photoexcitation wavelengths similar to those employed by Li et al. (2008) but avoiding potential complications related to multiphoton excitation.
1.2
The NO3 radical is generated throughout the atmospheric diel cycle via the oxidation of NO2 by O3:
At night, NO3 can acquire mixing ratios of hundreds of parts per trillion by volume. The high reactivity of NO3 towards unsaturated, organic trace gases (especially biogenically emitted ones in forested regions; Liebmann et al., 2018a, b) makes it an important nocturnal oxidant. NO3 is generally considered to be unimportant during the daytime due to rapid photolysis. Rapid photodissociation (Reactions R8a and R8b) following absorption of visible light reduces the daytime NO3 lifetime to only a few seconds and usually limits mixing ratios to less than 1 pptv.
NO3 photophysics has been the subject of many studies, up to 1991 reviewed by Wayne et al. (1991). Briefly, the NO3 absorption spectrum (≈400–665 nm) is broad and diffuse with an extended excited-state lifetime of several hundred microseconds (Nelson et al., 1983) for excitation beyond the photodissociation limit. The extended lifetime results from coupling between ro-vibrational levels of the ground (X2A2) state and the excited (A2E′′ and B2E′′) electronic states, so that excitation into the strongest feature (centred at ≈662 nm) can be considered to populate a manifold of mixed ground and excited electronic states (Carter et al., 1996). For simplicity, we refer to excited state NO3 as .
can dissociate (Reactions R8a, R8b, dominant at excitation wavelengths <630 nm), fluoresce (Reaction R9), and return to the ground state or be quenched in collisions with the main atmospheric bath gases N2, O2, and H2O (Reactions R10–R12). Fluorescence and collisional quenching are important only at wavelengths longer than ≈630 nm.
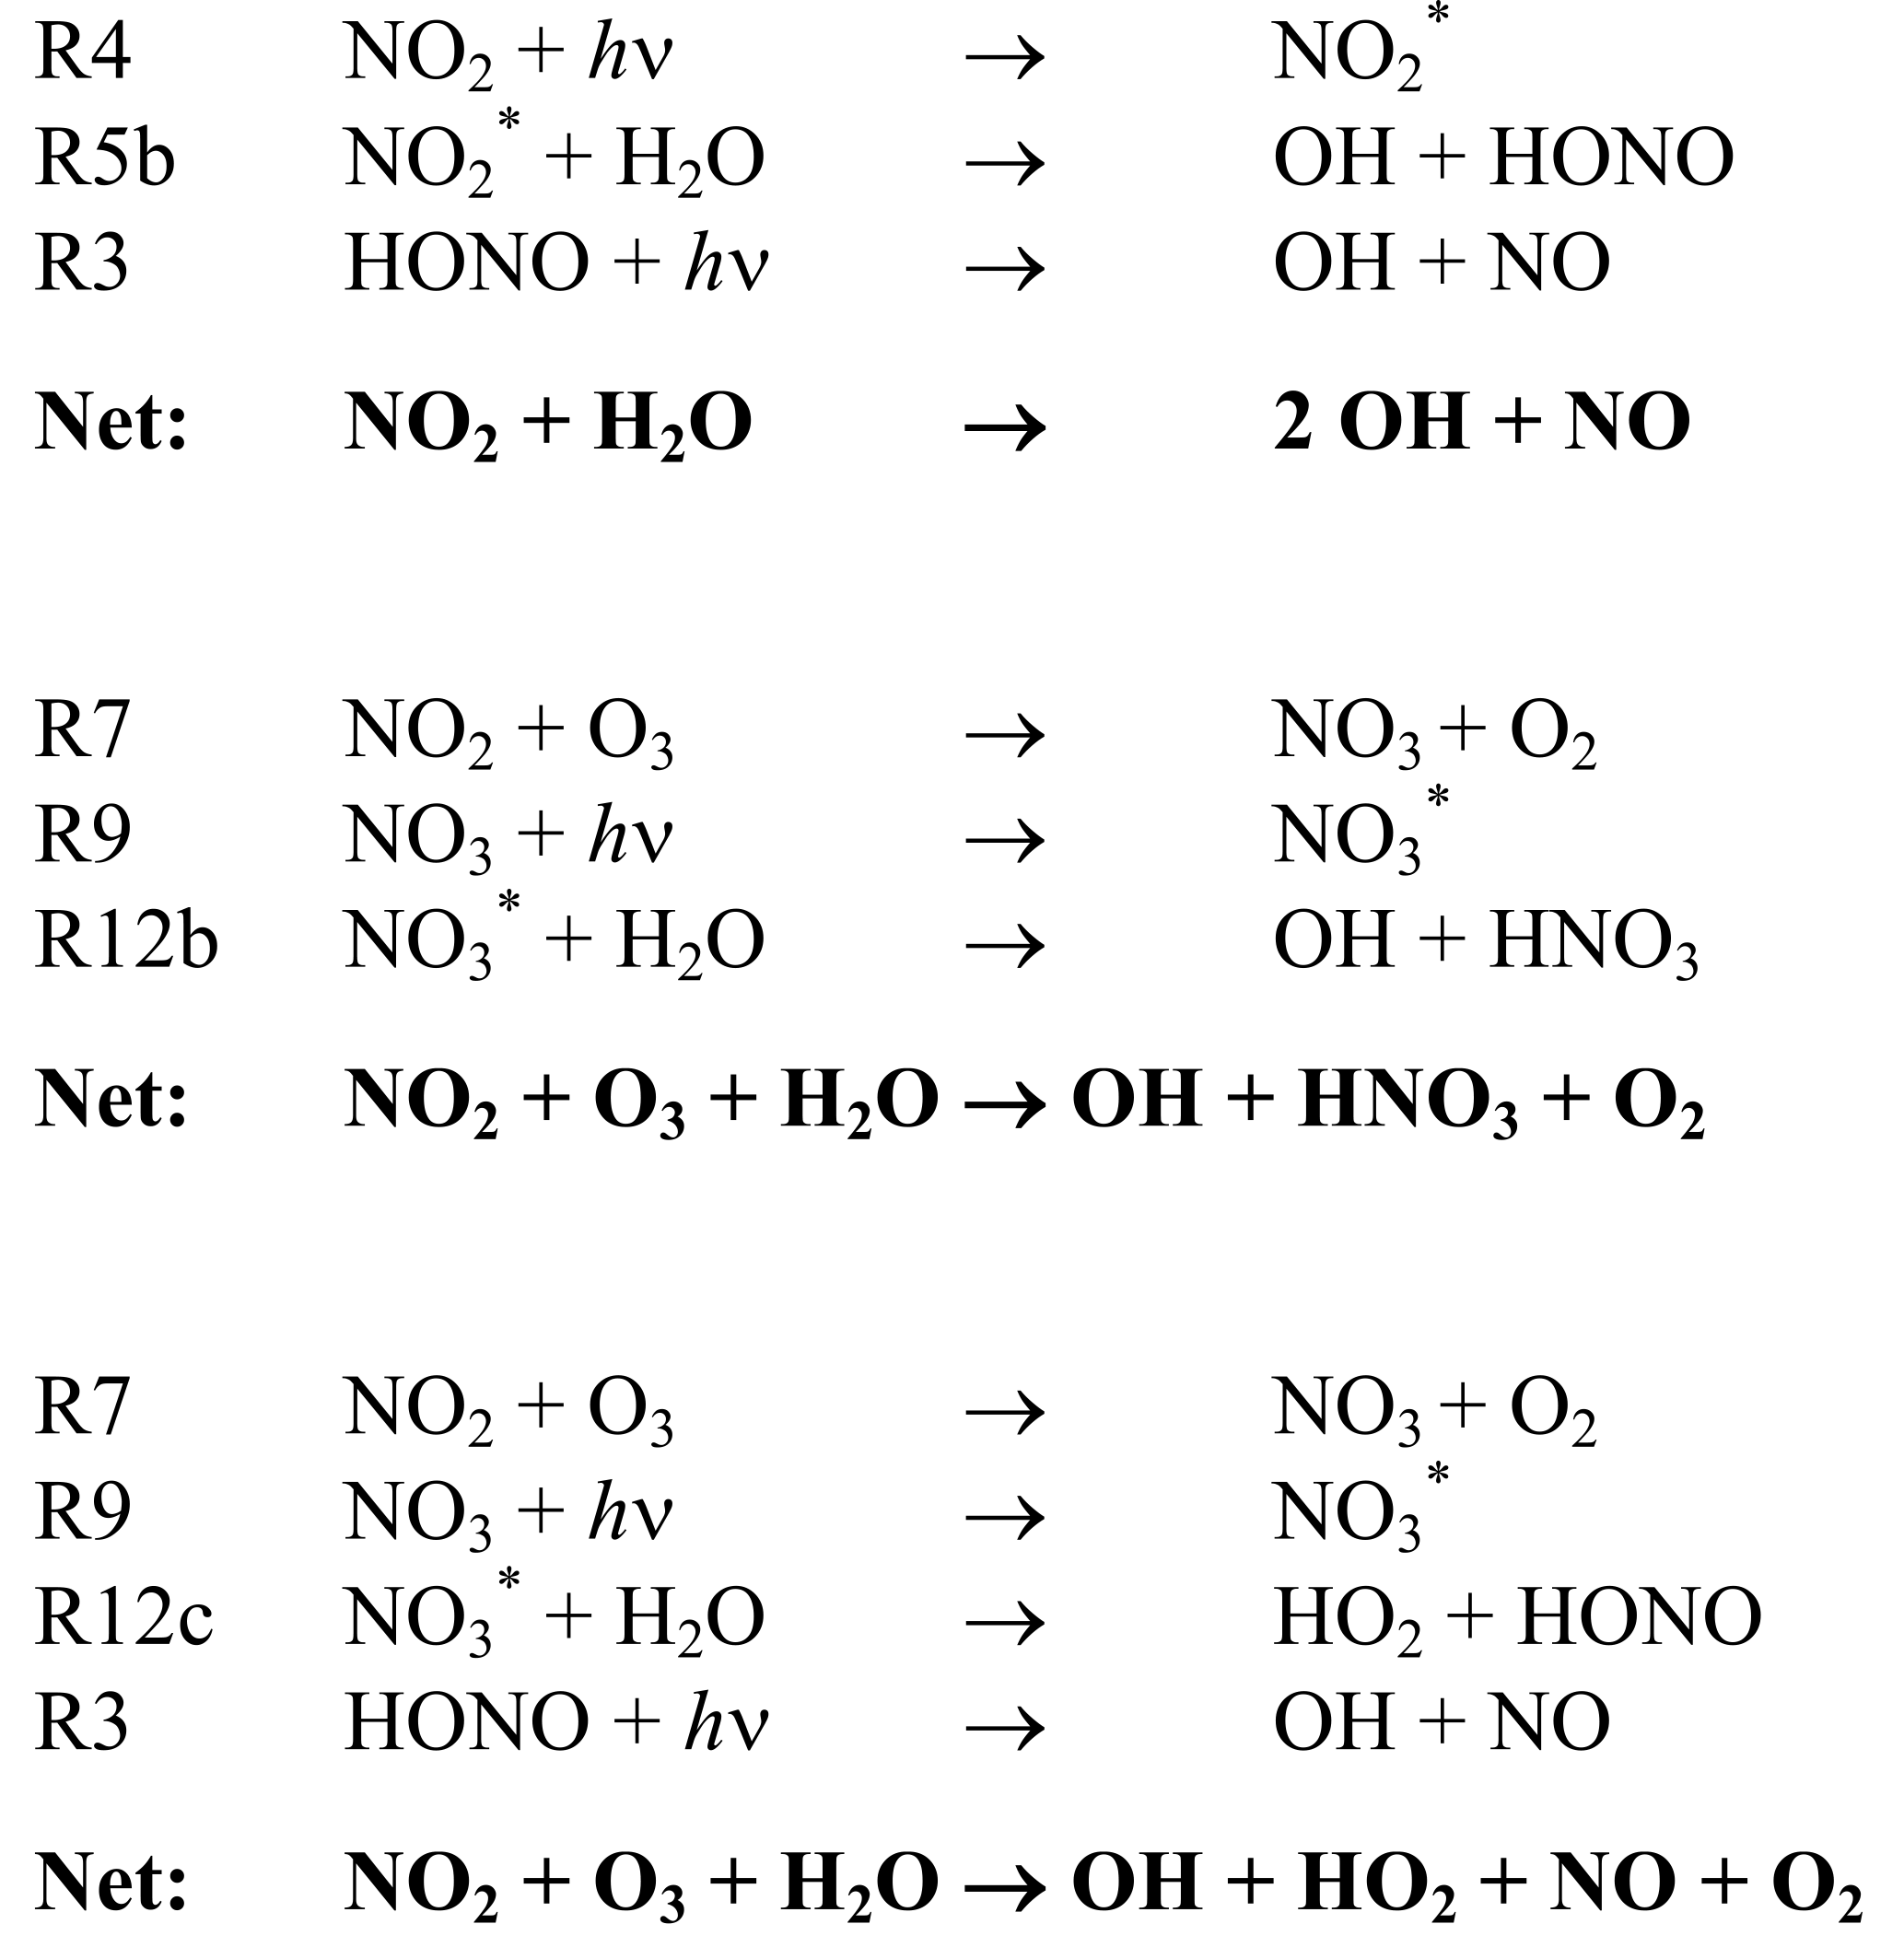
Here # denotes formation of vibrationally hot products following energy transfer from . Absorption of a 662 nm photon (the wavelength of maximum absorption by NO3; see Fig. 1) provides an excitation energy of ≈181 kJ mol−1. Using compilations of enthalpies of formation (Wagman et al., 1982; Davis et al., 1993; Ruscic et al., 2004, 2005, 2006) we calculate that formation of radical products from is exothermic: by 110 kJ mol−1 for OH+HNO3 (Reaction R12b) and by 81 kJ mol−1 for HO2+HONO (Reaction R12c).
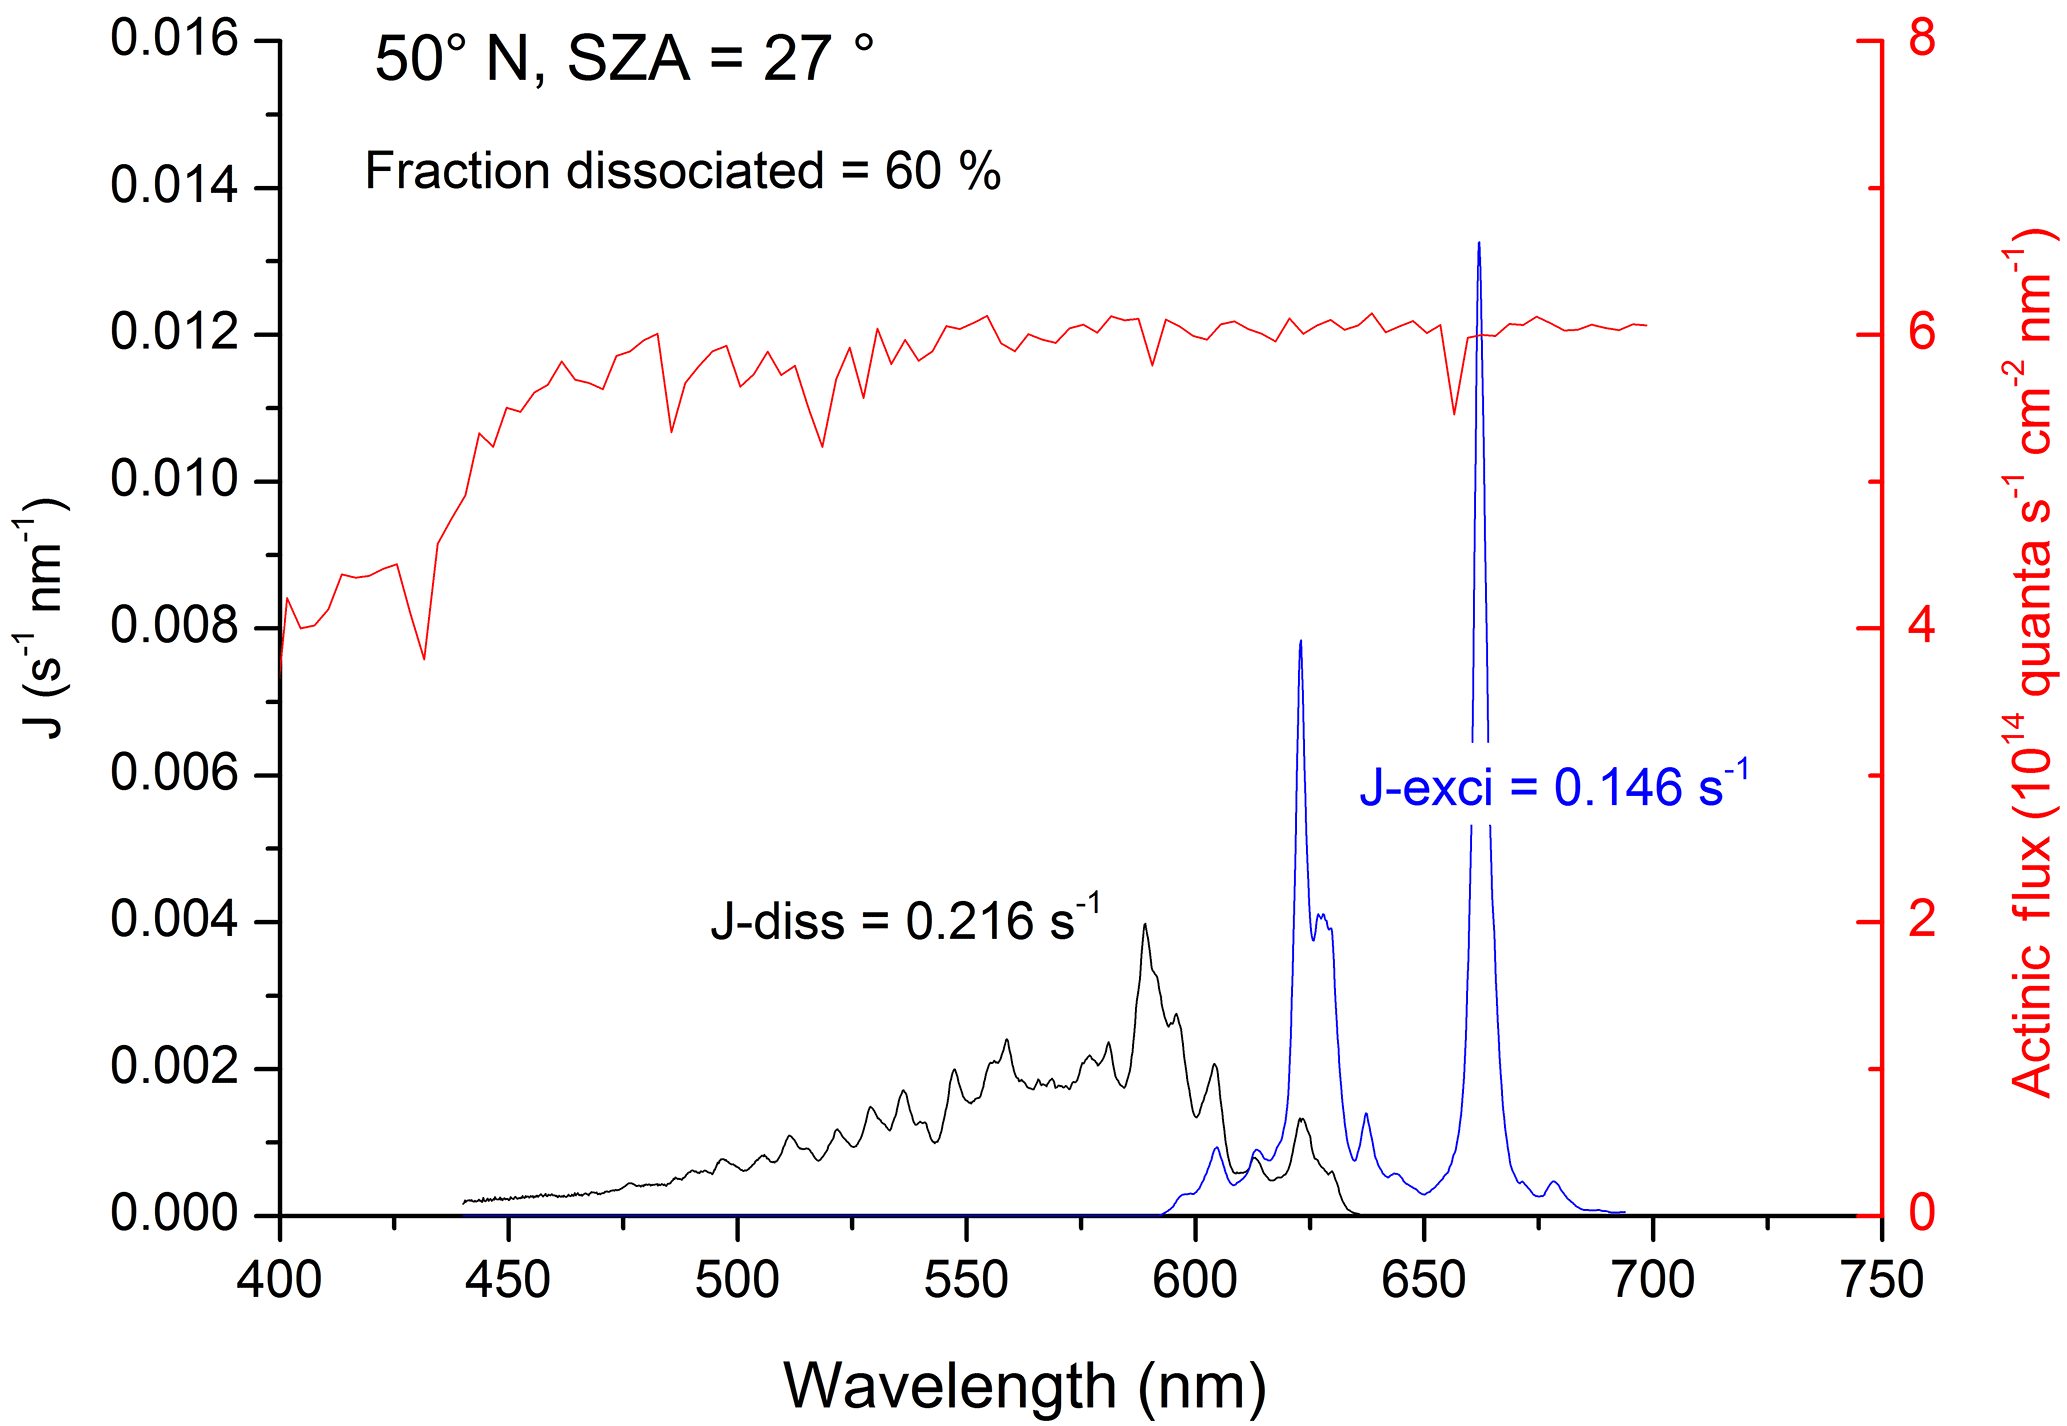
Figure 1Rate constants for dissociative (black line, Jdiss) and non-dissociative (blue line, Jexci) excitation of NO3. The data use solar radiation actinic flux at the surface at 50∘ N and a solar zenith angle (SZA) of 27∘ (red line) as well as the NO3 absorption cross sections and quantum yields. J values (and fraction of NO3 dissociated) were obtained by integration of the excitation rate (quanta s−1 nm−1) over the wavelength range of absorption.
The net result of NO3 formation in Reaction (R7) and photolysis via the main channel, Reaction (R8a), is no change in NOx () or O3. The net effect of formation in Reaction (R7) and photolysis via the minor (20 %) channel (Reaction R8b) is conversion of NO2 to NO (i.e. no net loss of NOx) and conversion of O3 to O2 (loss of odd oxygen). Reaction of with H2O to form OH+HNO3 (Reaction R12b) changes this picture dramatically. As illustrated in Fig. 2, if reacts with H2O to form OH+HNO3 (Reaction R12b), the net effect is conversion of NO2 to HNO3 (i.e. loss of NOx) and conversion of O3 and H2O to OH. This process (Reactions R7, R12b) therefore allows formation of atmospheric OH from O3 in the absence of actinic UV radiation normally required to generate O(1D) from O3 (Reaction R1). If reacts with H2O to form , as in Reaction (R12c), the net effect is conversion of NO2 to NO (no loss of NOx) and formation of two HOx molecules, again bypassing the need for the actinic radiation in the UV wavelength. Using literature values for the wavelength-dependent NO3 absorption cross sections (Yokelson et al., 1994) and photolysis quantum yields (Orlando et al., 1993) as well as actinic flux (calculated using the TUV program (http://cprm.acom.ucar.edu/Models/TUV/Interactive_TUV/, last access: June 2018) for 50∘ N at a zenith angle of 27∘, an overhead O3 column of 300 Du, a surface albedo of 0.1, and an aerosol optical depth of 0.235), we calculate that, averaged over the NO3 absorption spectrum, 60 % of actinic photons absorbed result in dissociation of NO3. The residual 40 % results in formation of , which can then undergo chemical and photophysical transformation. Figure 1 gives an example of the relative rates of photodissociation and (non-dissociative) photoexcitation across the NO3 absorption spectrum.
The relative importance of fluorescence and the collisional deactivation processes depends on the fluorescence lifetime and the rate constants for quenching. Nelson et al. (1983) report two components to the NO3 fluorescence decay they observed following excitation at 661.9 nm, with collision-free fluorescence lifetimes of 27 and 340 µs.
The longer-lived component (accounting for >85 % of the total fluorescence) was quenched by N2 and O2 with rate coefficients of cm3 molecule−1 s−1 and cm3 molecule−1 s−1, respectively. Nelson et al. (1983) did not report a quenching rate coefficient for H2O but determined large quenching coefficients for propane ( cm3 molecule−1 s−1) and nitric acid ( cm3 molecule−1 s−1), presumably resulting from more efficient energy transfer due to higher densities of states in these polyatomic molecules. A substantially larger rate coefficient for quenching of by H2O of cm3 molecule−1 s−1) was reported by Fenter and Rossi (1997). The quenching rate constants are sufficiently large that, at the pressures of N2, O2, and H2O available in the troposphere, relaxation of via fluorescence can be neglected.
The fraction, , of tropospheric that will be quenched by collision with H2O rather than N2 or O2 is given by expression (1):
Using this expression we calculate that, at the Earth's surface (1 bar of pressure) and a temperature of 25 ∘C, can vary between 0.2 and 0.5 for relative humidities between 20 % and 80 %. As mentioned above, daytime concentrations of NO3 are generally low due to rapid photolysis (and reaction with NO), though measurements in polluted environments indicate maximum daytime concentrations of molecule cm−3 (Geyer et al., 2003). The atmospheric production rate of OH via NO3 excitation may be written as
Using an NO3 concentration of 1×10⁸ molecule cm−3 and Jexci=0.15 s−1 (Fig. 1) enables us to calculate an OH production rate (at 80 % relative humidity) of 7.5×10⁶ molecule cm−3 s−1 if all quenching of by H2O is reactive and forms OH. To put this value in context, we note that typical OH production rates from photolysis of O3 are around 2×10⁵ molecule cm−3 s−1, a factor of ≈40 lower. The principal objective of this work was therefore to determine the OH production rate via NO3 photoexcitation and subsequent reaction of with H2O (Reaction R12b). To best constrain these measurements, rate coefficients for total removal (quenching and chemical reaction) of by H2O (k12) and N2 (k10) were determined.
All experiments were conducted in a 500 cm3 jacketed photolysis cell as described previously (Wollenhaupt et al., 2000; Dillon et al., 2006). Laser light entered and exited the reaction vessel via Brewster-angle quartz windows; laser fluence at each wavelength was recorded using a Joule meter located behind the exit window. An excimer laser was used to generate ≈20 ns pulses of light at 193 nm (ArF) or 248 nm (KrF). Dye lasers pumped by Nd:YAG lasers were used to generate pulsed (≈6 ns) tuneable radiation at visible wavelengths.
The pressure and the gas flow rate (300–2000 cm3 (STP) min−1) were regulated to ensure that a fresh gas sample was available for each laser pulse for operation at 10 Hz. The pulsed laser-based schemes for generation of excited NO2 and NO3 are described below, as are the schemes for calibration of the OH signal.
Concentrations of the key reactants and precursors (NO2, HNO3, and H2O) were monitored by UV–visible absorption spectroscopy, reducing potential uncertainties in each of these parameters to ≤10 %. NO2 was measured in situ using a multipass absorption cell positioned upstream of the reactor. Light from a halogen lamp passing through the cell was focused onto the entrance slit of a 0.5 m monochromator. A diode-array detector was used to record NO2 absorption in the visible range of light in the range nm at an instrumental resolution of 0.32 nm, determined from the full width at half maximum (FWHM) of the 436.8 nm Hg emission line. Optical absorption by HNO3 and H2O was determined using a “dual-beam” absorption cell (Hg line at 184.95 nm, l=43.8 nm) located downstream of the photolysis reactor. In experiments in which both HNO3 and H2O were present, they were added sequentially so first the optical density due to a single component was measured before the second was added and the resultant total optical density was monitored.
NO2 concentrations were calculated using a literature reference spectrum (Vandaele et al., 1998). Concentrations of HNO3 and H2O were calculated using cross sections of cm2 molecule−1 (Dulitz et al., 2018) and cm2 molecule−1 (Creasey et al., 2000).
The output from a Nd:YAG pumped dye laser operating with Rhodamine 6G dye was frequency doubled to 282 nm and used to detect OH via excitation the transition close to 282 nm. Laser-induced fluorescence (LIF) was detected by a photomultiplier tube shielded by a combination of a 309 nm (±5 nm) interference filter and BG 26 (glass) filter. Directly following experiments to measure formation of OH in the title reactions, known amounts of OH were generated via pulsed laser photolysis of HNO3 (at 248 nm) or H2O (at 193 nm).
For the experiments on , a small flow of HNO3 diluted in N2 was added to the N2 bath and a series of experiments were conducted that covered a range of laser fluences at 248 nm. The additional flow was compensated for by reducing the main N2 flow so that different concentrations of OH were generated in essentially unchanged conditions of pressure, temperature, [NO2], and [H2O]. When using Reaction (R14) to calibrate the OH signal, the NO2 supply to the experiment was replaced with N2, and 193 nm light was used to dissociate OH from the H2O already present (in unchanged conditions of pressure, temperature, and [H2O]).
Table 1Experimental conditions and results for (Reaction R5).
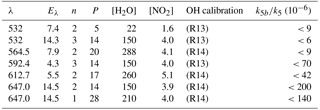
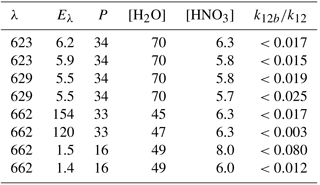
λ: excitation wavelength (nm). Eλ: excitation laser fluence (in 1016 photons pulse−1 cm−2); n: number of repeat experiments; P: bath-gas (N2) pressure (mbar); units of concentration were 1015 molecule cm−3.
The uncertainty associated with conversion of LIF signals into OH concentrations stemmed partially from uncertainties in (measured) [HNO3] and [H2O] but was dominated by uncertainty in the measurement of the laser fluence at the centre of the reactor. Such measurements depended on both the accuracy of the Joule meter and corrections for beam divergence and the assumption of a homogeneous light intensity over the cross section of the laser beam. An overall uncertainty of 40 % was estimated for the conversion of LIF signals to absolute [OH] required for (k5b∕k5) determinations. For determination of k12b∕k12, the self-calibrating chemistry (Reactions R13, R15) results in a smaller contribution of laser fluence uncertainty to the overall uncertainty, which is dominated by assumptions regarding the NO3 profile (see later).
Chemicals used are as follows. NO2 (ABCR 99.99 %) was subject to repeated freeze–pump–thaw cycles at 77 K prior to dilution in N2 and storage in blackened glass bulbs. H2O (Milli-Q de-ionised water) and HNO3 (prepared in house from H2SO4+KNO3) were added to the reactor via bubblers. O3 was generated via electric discharge through O2 in a commercial ozoniser (Anseros). N2O5 was prepared by mixing O3 with NO2 and trapping the resulting N2O5 at 195 K (Wagner et al., 2008). N2 and O2 (Westfalen, 99.999 %) were used as supplied.
3.1 (Reaction R5)
NO2 was excited at a number of different wavelengths: 532 and 567–647 nm; reagent concentrations and conditions for these experiments are given in Table 1. In general, large concentrations of H2O were used to promote reaction of over deactivation by other colliders, notably N2, and to ensure that changes in other reagent concentrations (e.g. for calibration; see above) had a minimal effect on fluorescence quenching or other processes that impact OH-LIF detection sensitivity.
Figure 3 displays the results of an experiment in which NO2 was excited at 532 nm (at t=280 µs) to generate 1013 to 1014 molecule cm−3 of . The delay of 280 µs is the time between the triggering of the flash lamps (at t=0) and the Q-switch of the YAG laser. The solid black triangles were obtained with the OH-excitation laser tuned to 282 nm (on resonance) and indicate a change in signal of ≈200 to 350 µs. This signal does not display the kinetic behaviour of OH in this chemical environment and remains when the OH-excitation laser is tuned off resonance (red triangles). It is also present when the 532 nm light is blocked and we conclude that this weak signal, having neither kinetics nor spectroscopy characteristic of OH, is an artefact with electronic origin, possibly related to the output of the pulse generator used to trigger the laser Q-switch.
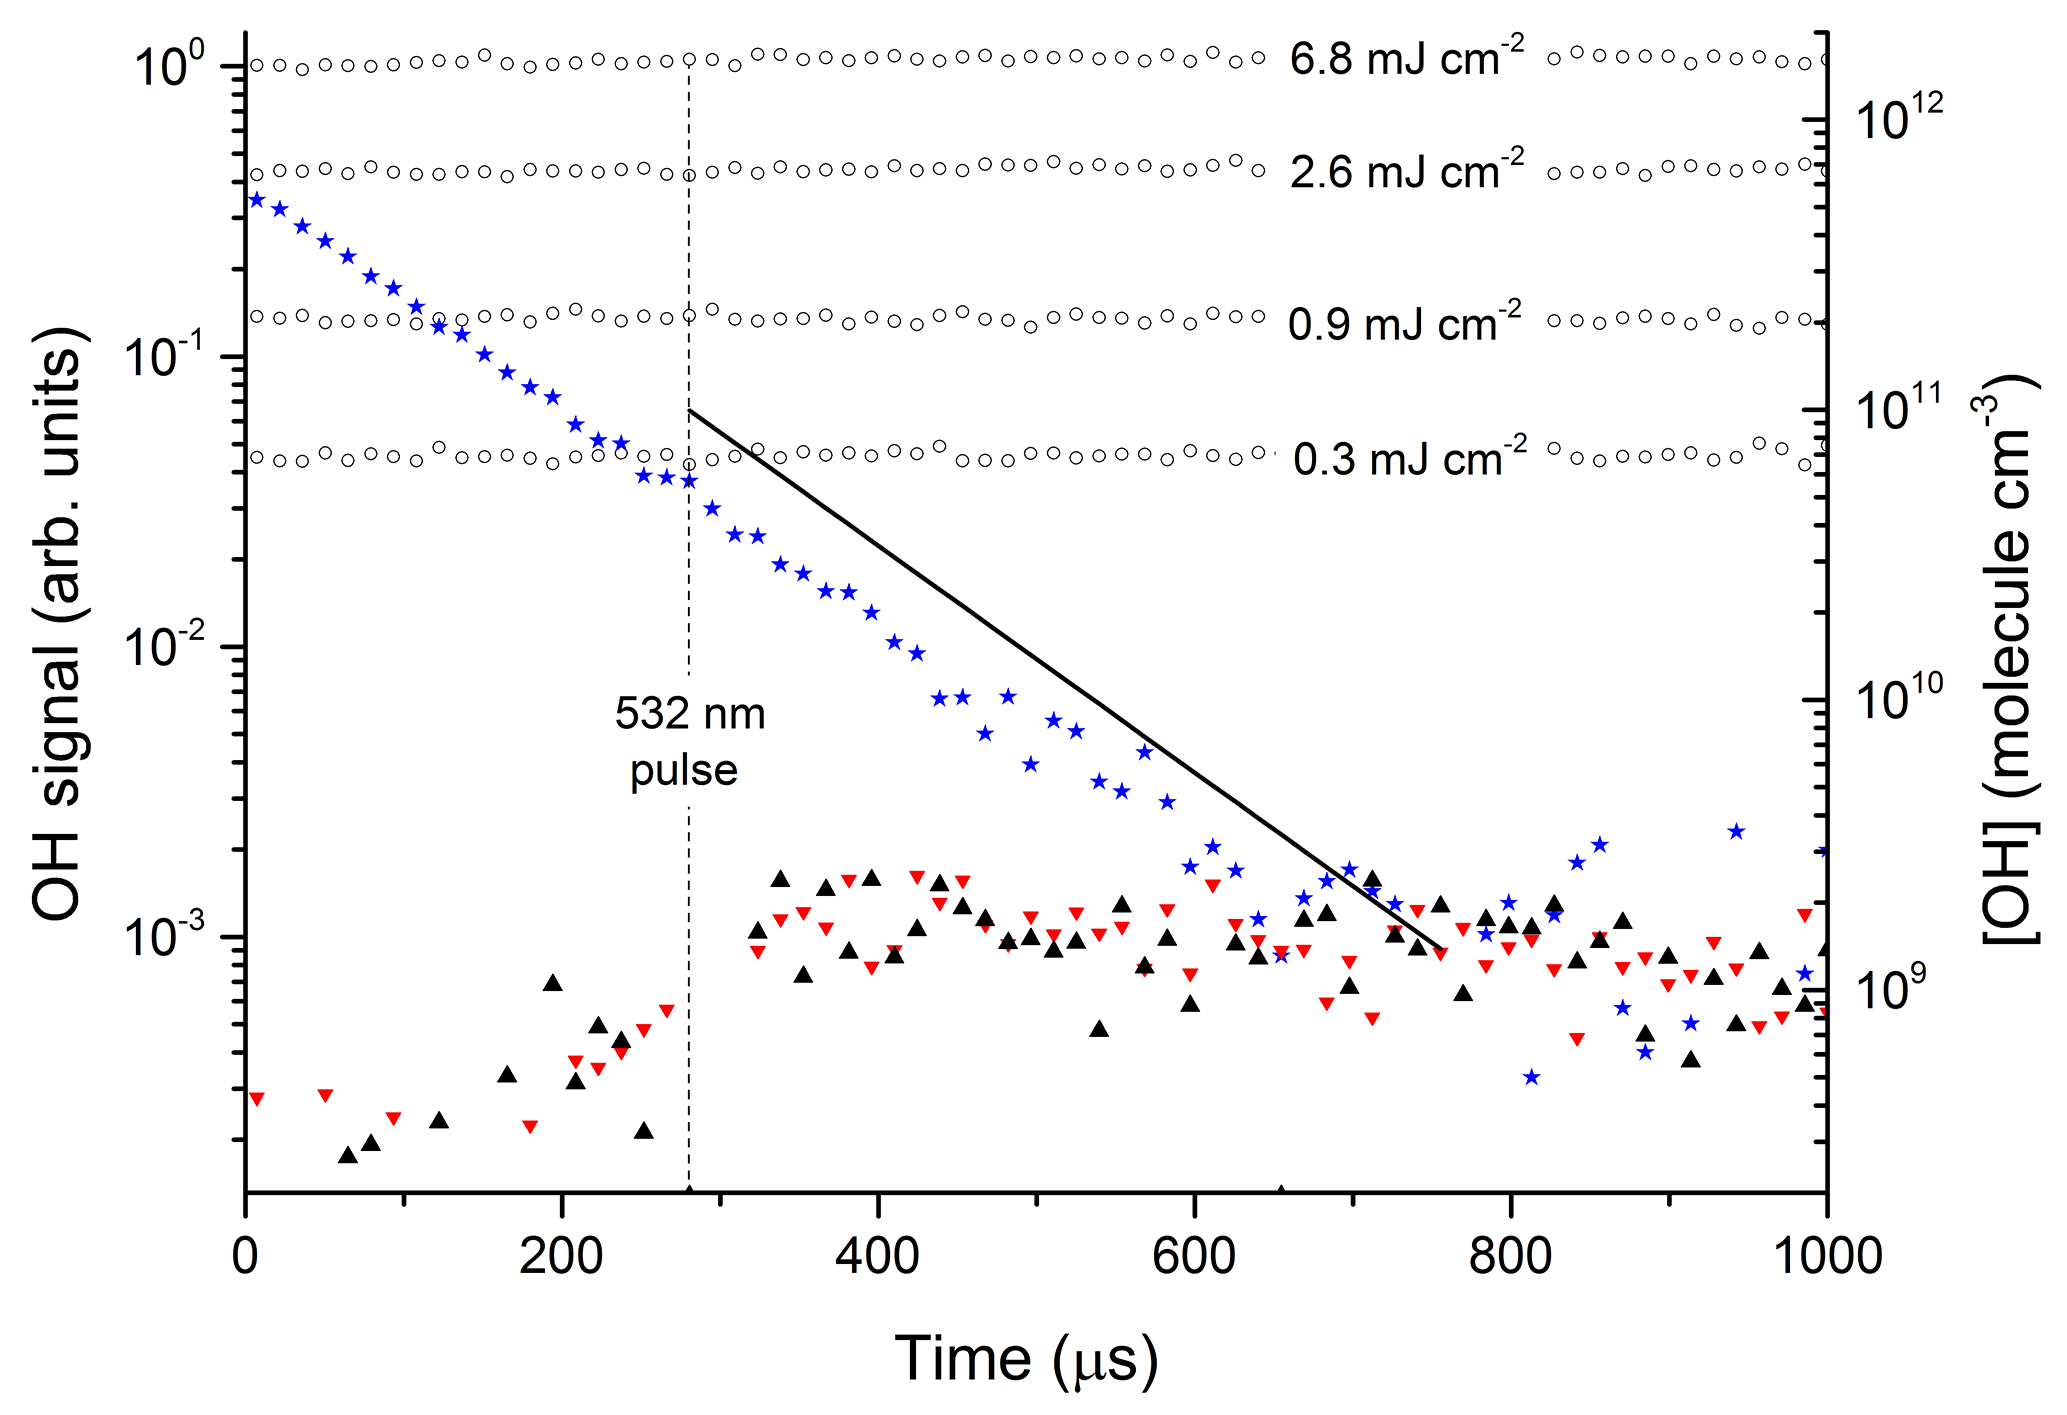
Figure 3Photoexcitation of NO2 at 532 nm. The open circles are OH calibrations obtained by the 193 nm photolysis of 1.5×10¹⁷ molecule cm−3 H2O (in the absence of NO2) at different laser fluences (mJ cm−2). The solid stars are data points from an OH calibration in the presence of NO2. The black triangles are data obtained by photoexcitation of [NO2] = 4.0×10¹⁵ molecule cm−3 using 532 nm (50 mJ cm−2) in the presence of molecule cm−3. The red triangles are the results of an identical experiment, but with the OH-excitation laser tuned away from the OH feature at 282 nm. The solid black line represents the OH signal and concentration expected from the yield of OH from reported by Li et al. (2008).
The data represented by open circles (roughly independent of reaction time) are the results of OH-calibration experiments using the 193 nm photolysis of H2O (1.5×10¹⁷ molecule cm−3) at four laser fluences between 0.3 and 6.8 mJ cm−2 in the absence of NO2. The OH concentration was calculated using a 193 nm cross section for H2O of cm2 molecule−1 (Sander et al., 2011).
The roughly constant OH level over 1000 µs is consistent with the fact that OH does not react with any components of the gas mixture. An experiment at 193 nm using the same OH-generation scheme but in the presence of NO2 is displayed as solid stars. OH now decays exponentially at a rate which is consistent with its loss via reaction with NO2. In this experiment, some OH was also generated by the reaction of O(1D) (formed by the 193 nm photolysis of NO2) with H2O and it was not used for calibration purposes. The signals obtained in the absence of NO2 were converted to OH concentrations (right y axis) using Joule meter readings as described in Sect. 2.1.
The solid black line in Fig. 3 represents the OH signal and concentration expected from our experimental conditions (NO2 concentration, H2O concentration, total pressure, and 532 nm laser fluence) and literature data for NO2 absorption cross sections, deactivation rate constants, and the yield of OH from reported by Li et al. (2008). Within experimental uncertainty (see below) our data are clearly not consistent with the large yield of OH reported by Li et al. (2008). In order to rule out the possibility that this is a result of using different excitation wavelengths, similar experiments were carried out in which we explored different regions of the NO2 absorption spectrum. OH signals were not observed at any wavelength, enabling us to set upper limits to k5b∕k5. The upper limits were calculated from the minimum observable OH signal (assumed to be twice the RMS noise levels on the OH signal) and accounting for uncertainty in parameters such as laser fluence (30 %), NO2 concentration (10 %), and concentration of H2O (10 %).
The results are summarised in Table 1, which lists the experimental conditions in detail and in Fig. 4, in which we also compare to literature determinations of k5b∕k5. The present dataset and those reported by Crowley and Carl (1997), Amedro et al. (2011), and Carr et al. (2009) found OH formation in the reaction between and H2O to be inefficient, with upper limits to k5b∕k5 of between and at all wavelengths investigated. Together, these datasets contradict the yield of reported by Li et al. (2008) for excitation across the wavelength range of 560 to 630 nm. Our dataset, covering three absorption features of the NO2 absorption spectrum within the range reported by Li et al. (2008), also rules out that the poor agreement is due to use of different excitation wavelengths. As discussed by Amedro et al. (2011) the use of focussed laser beams and the resulting multiphoton processes are the most likely explanation for OH formation in the work of Li et al. (2008). The results from this work reduce the maximum yield of OH from the reaction of with H2O to at 532 nm as opposed to measured by Crowley and Carl (1997). The assumption that this value is valid across the non-dissociative part of the absorption spectrum of NO2 enables us to conclude that formation of atmospheric OH (and HONO) via Reaction (R5b) is insignificant.
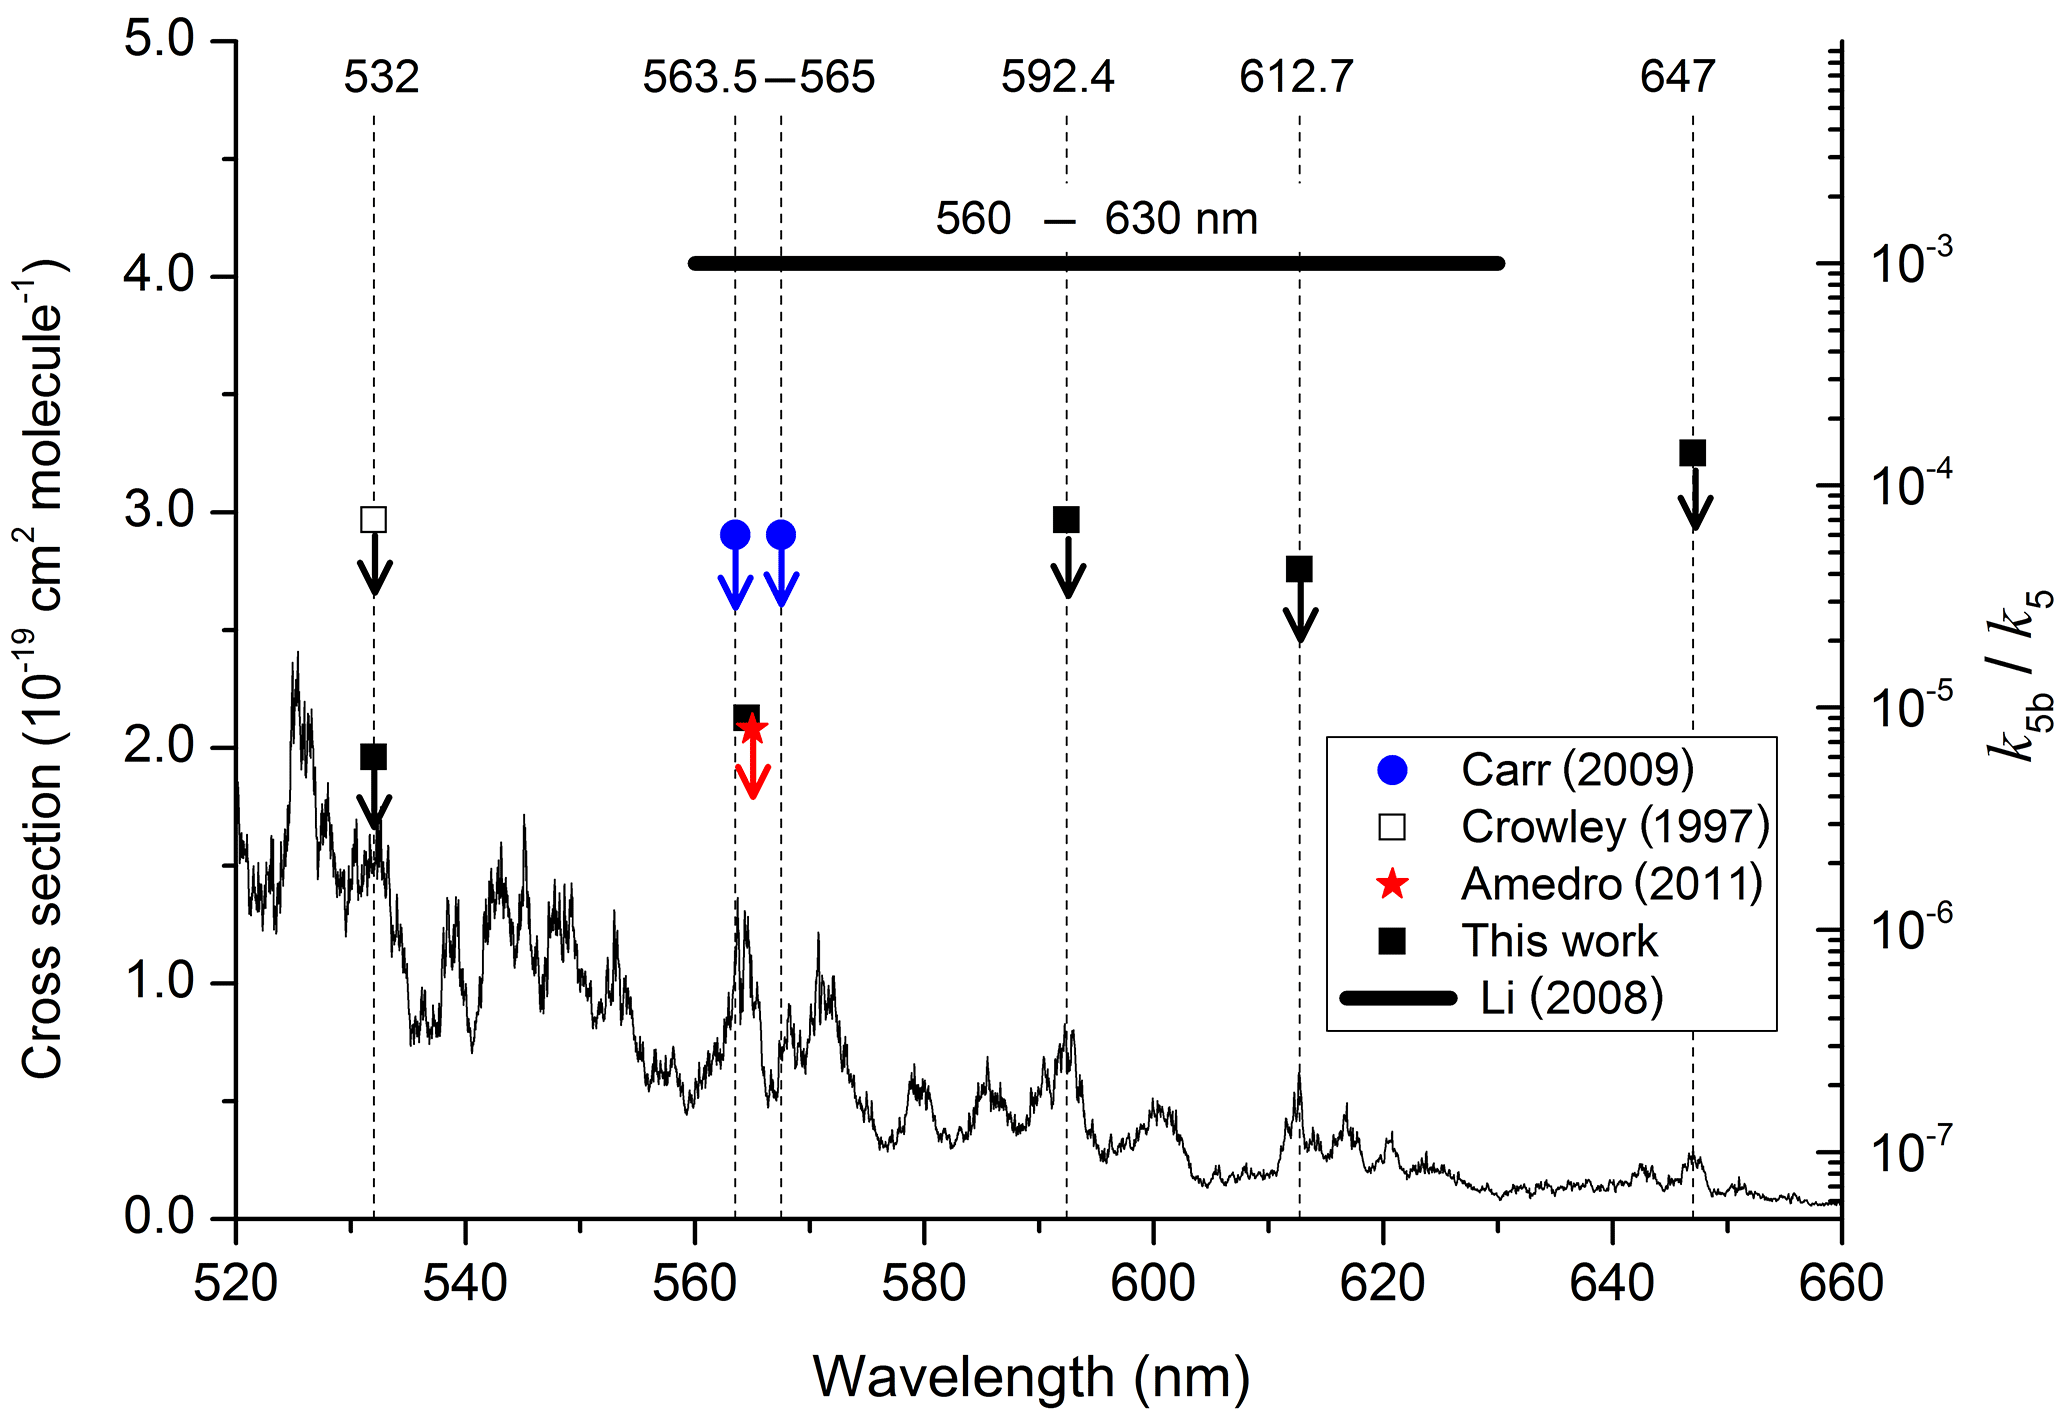
Figure 4Summary of data obtained following photoexcitation of NO2 at various wavelengths. The data from this study, Crowley and Carl (1997), Carr et al. (2009), and Amedro et al. (2011) are all upper limits, indicated by the downward arrows. The NO2 absorption cross sections were taken from Vandaele et al. (1998).
3.2 (Reaction R12)
3.2.1 Generation of NO3
For the experiments to investigate the reaction of with H2O (Reaction R12), NO3 was generated via the reaction of OH with known amounts of HNO3 (Reaction R15).
The rate constant and the yield of NO3 (unity) for Reaction (R15) are well known (Brown et al., 1999, 2001; Carl et al., 2001; Dulitz et al., 2018), enabling the time-dependent NO3 concentration profile to be calculated if the initial amount of OH is known. This initial concentration of OH depends on the 248 nm laser fluence (measured by a Joule meter, uncertainty 30 %) and the HNO3 concentration (measured by optical absorption at 185 nm, uncertainty 10 %). As OH was formed from HNO3 photolysis (Reaction R13) and the OH decay was monitored, these experiments were self-calibrating as long as a sufficient excess of was maintained. In the conditions employed in this work (see Table 2), radical losses via unwanted self-reactions and cross reactions of OH and NO3 were <5 % of the total OH loss rate, which was dominated by Reaction (R15). In experiments to measure the rate constant for quenching by N2 (Reaction R10) and H2O (Reaction R12), NO3 was generated via the 248 nm photolysis of N2O5:
In this scheme of NO3 generation, NO3 is formed instantaneously (in contrast to Reactions R13–R15).
Table 2Experimental conditions and results for (Reaction R12).
λ: excitation wavelength (nm). Eλ: excitation laser fluence (in 1016 photons pulse−1 cm−2); P: bath-gas (N2) pressure (mbar); units of concentration were 1015 molecule cm−3.
3.2.2 Quenching of by N2 and H2O (k10 and k12)
The fate of electronically excited NO3 radicals in the atmosphere is controlled by the relative rate of quenching by H2O and the predominant bath gases N2 and O2, which depends on both the concentration of H2O and the quenching rate coefficients k10, k11, and k12. As the rate constant for quenching of by H2O (k12) has been addressed only briefly in a single study (Fenter and Rossi, 1997) and the value derived ( cm3 molecule−1 s−1) is unexpectedly large, we chose to remeasure k12. In these experiments, NO3 was generated in Reaction (R16) and He was used as the main bath gas, with traces of N2 and H2O added.
An excitation laser pulse at 662 nm was triggered when the NO3 concentration was close to its maximum value (i.e. when >95 % of the primary OH had been consumed by reaction with HNO3) to generate . Time-dependent fluorescence from (λ>690 nm) was detected using a red-sensitive photomultiplier and recorded on a 100 MHz digital oscilloscope. Fluorescence decay constants in the presence of various concentrations of H2O were then used to derive k12. We also conducted a set of experiments using N2 as a quenching molecule to test our experimental methodology by comparison with literature measurements of k10.
NO3 fluorescence profiles from these experiments are displayed in Fig. 5, in which datasets are depicted in which various amounts of N2 (Fig. 5a) and H2O (Fig. 5b) were added to the He bath gas. The fluorescence decay rate constant () derives from the sum of processes that depopulate the excited state and includes fluorescence, inter-system crossing, and quenching by N2, H2O, and N2O5 with rate constants (kf) kISC, kf(N2), kf(H2O), and kf(N2O5), respectively.
In line with previous studies (Nelson et al., 1983), the slow component of the NO3 fluorescence was found to decay mono-exponentially (black and red lines in Fig. 5a and b) and depended on the pressure of N2 or H2O.
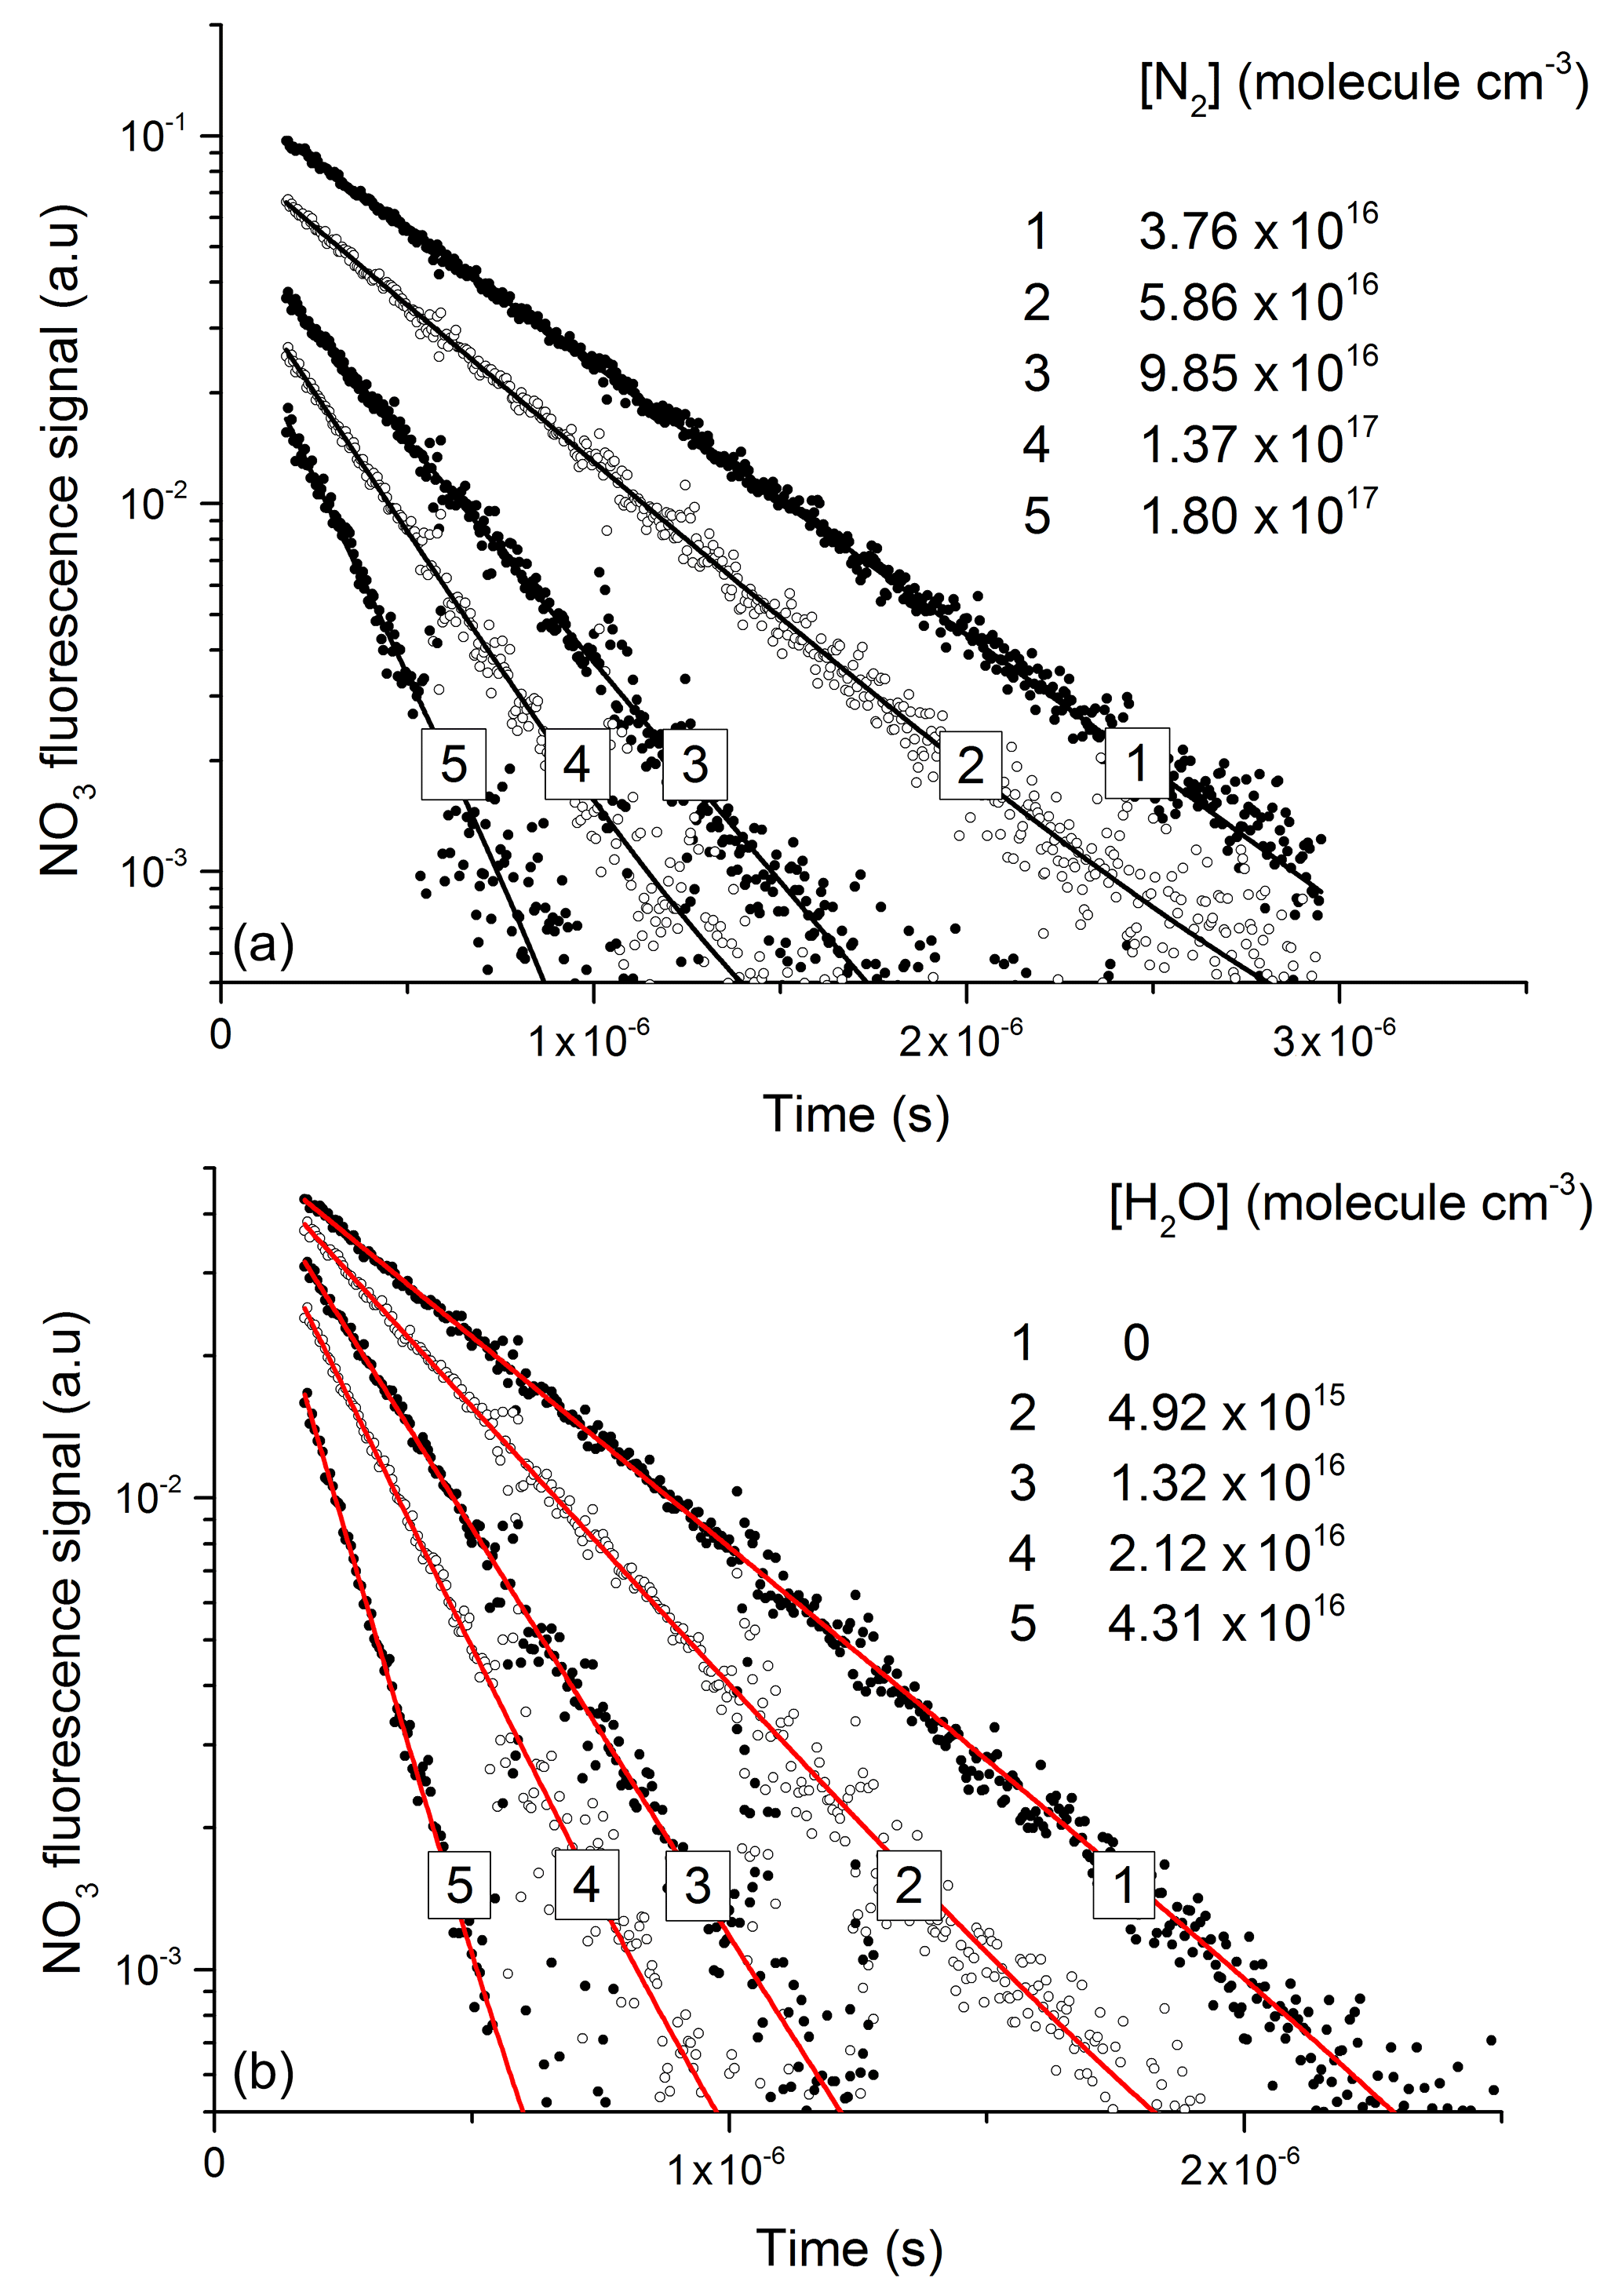
Figure 5Exponential decay of fluorescence from NO3 following photoexcitation at 623 nm in the presence of N2 (a) and H2O (b). An approximate NO3 concentration of 3×10¹² molecule cm−3 was generated via the 248 nm photolysis (Reaction R16) of N2O5 (≈1015 molecule cm−3) in all quenching experiments.
The decay constant () was derived from exponential fits to the data and plotted against the concentration of N2 or H2O (Fig. 6) to obtain (from the slopes) the rate constants k10 and k12 for quenching by N2 and H2O, respectively. Assuming negligible contribution from OH, NO2, and NO3, due to their low concentrations, the y-axis intercepts in Fig. 6 (≈0.5–0.8×10⁶ s−1) are the combined terms , where kq(N2O5) is the unknown rate constant for quenching of by N2O5. As the collision-free lifetime of excited NO3 is several hundred microseconds, the terms kf and kISC contribute insignificantly to the fluorescence decay. The intercept (≈5–8×10⁵ s−1) is consistent with N2O5 concentrations in the range of 1015 molecule cm−3 and a value of kq(N2O5) of the order of 10−10 cm3 molecule−1 s−1.
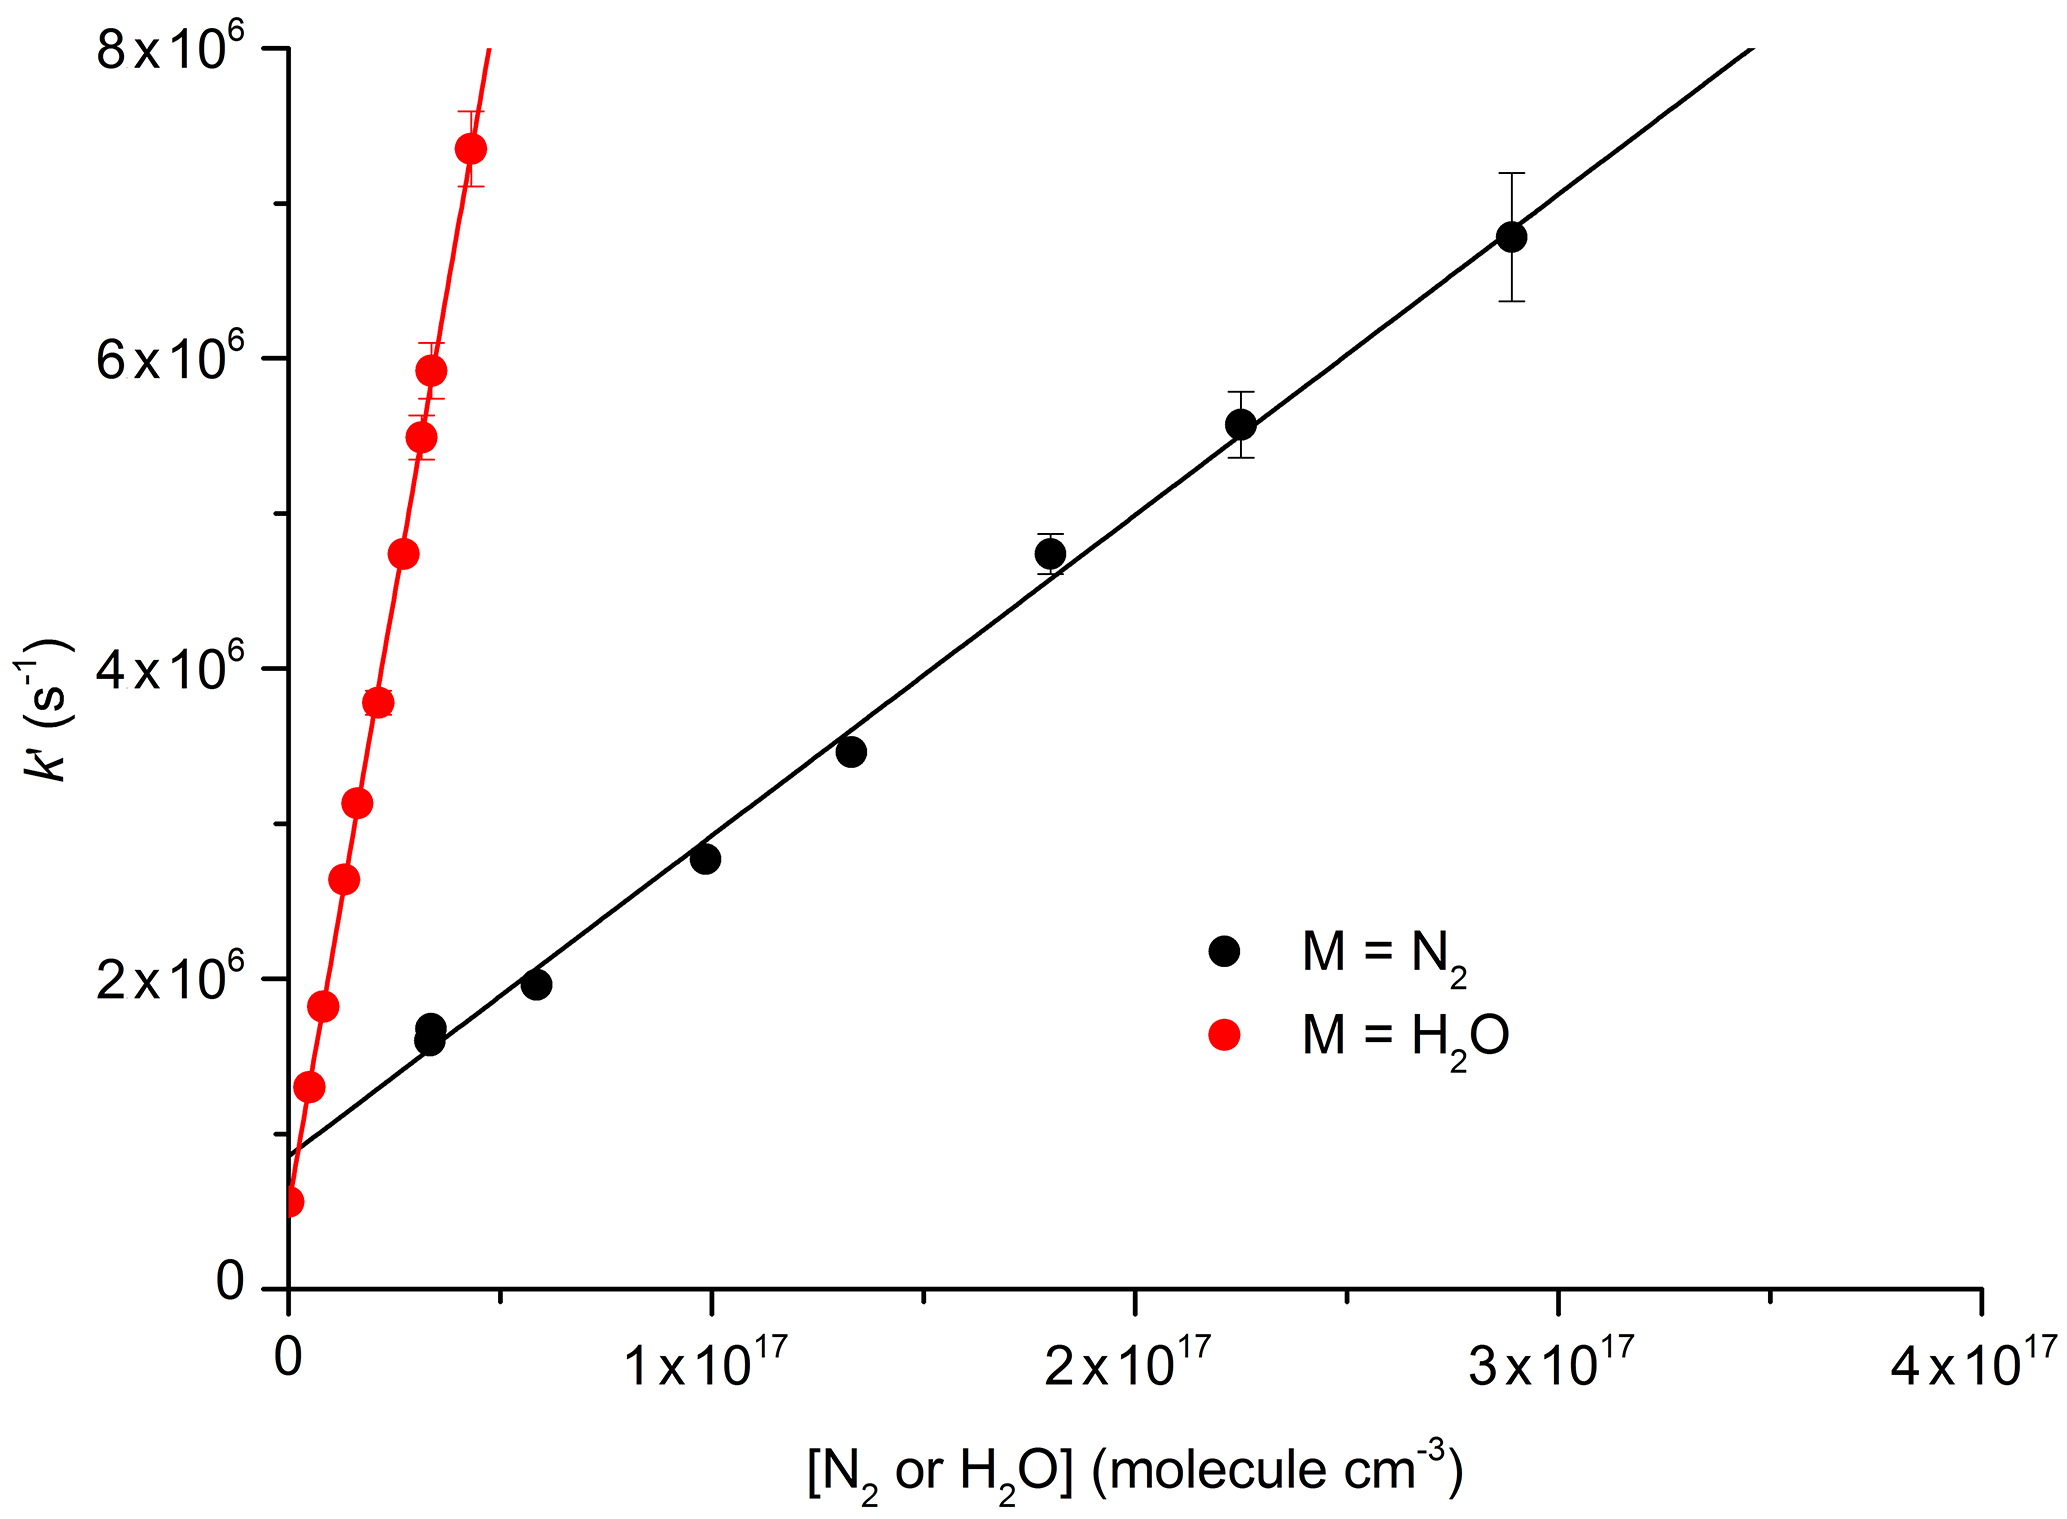
Figure 6Plots for the determination of total quenching rate coefficients for with N2 (Reaction R10) and with H2O (Reaction R12) at 296 K: cm3 molecule−1 s−1; cm3 molecule−1 s−1. The error bars are statistical uncertainty (2σ) from the fits to OH decays as exemplified in Fig. 5.
Our result obtained for N2, cm3 molecule−1 s−1, is in reasonable agreement with the value of cm3 molecule−1 s−1 reported by Nelson et al. (1983). In contrast, our result for quenching by water vapour, cm3 molecule−1 s−1, is more than a factor of 4 lower than that reported by Fenter and Rossi (1997). As both studies used 662 nm excitation of NO3 and similar methods to derive k12, the differences are likely to be related to the measurement of the H2O concentration. As we measured the H2O concentration in situ (optical absorption at 185 nm), the uncertainty of our result is expected to be determined by uncertainty in the absorption cross section of H2O at this wavelength, which, based on good agreement across several measurements (Cantrell et al., 1997; Hofzumahaus et al., 1997; Creasey et al., 2000), we estimate to be <10 %. Fenter and Rossi (1997) relied on flow measurements to derive the concentration of H2O in their experiments. Because of this, we consider our measurement of k10 to be the more accurate one and use this value for further evaluation of our experiments to derive k12b∕k12.
3.2.3 Yield of OH from
Figure 7 displays the results of an experiment using three pulsed lasers. The first (excimer laser at time zero) generated OH from the 248 nm photolysis of HNO3. In this particular experiment the HNO3 concentration (monitored at 185 nm) was 6.3×10¹⁵ molecule cm−3 and a laser fluence of 13 mJ cm−2 was used to generate 2.0×10¹² OH cm−3. This OH monitored by the 282 nm LIF laser out to a reaction time of 10 ms (open circles in Fig. 7) was observed to decay at a rate consistent with its well-characterised reaction with HNO3 k15 (298 K, 30 hPa) = cm3 molecule−1 s−1 (Dulitz et al., 2018). NO3 is the unique product of Reaction (R15) (Brown et al., 2001; Carl et al., 2001). The NO3 profile (dashed line), calculated from initial OH and HNO3 concentrations, is also displayed in Fig. 7. Here we calculate that 97 % of the initial OH will react with HNO3, the balance resulting from diffusion and reaction with NO2. The decay of NO3 at long reaction times is due to NO3 diffusion from the reaction volume so that its concentration at 8.28 ms (when the 662 nm laser is triggered) was reduced by ≈ a factor of 2 compared to the stoichiometric yield of 2×10¹² molecule cm−3 (i.e. when all OH is converted to NO3). The decay of NO3 was calculated from the known diffusion loss constant for OH at this pressure and the relative reduced masses of OH∕N2 and NO3∕N2. A delay of 8.28 ms allowed the primary OH to decay to very low values (i.e. ≈109 molecule cm−3) before triggering the 662 nm excitation laser. The measured laser fluence at 662 nm was then combined with the NO3 concentration at 8.28 ms to calculate the fractional excitation of NO3 (generally about 10 %) and thus the concentration of formed. When using very large laser fluences at 662 nm we calculate that the transition was saturated and then assume equal concentrations of ground and excited-state NO3 directly after the excitation pulse.
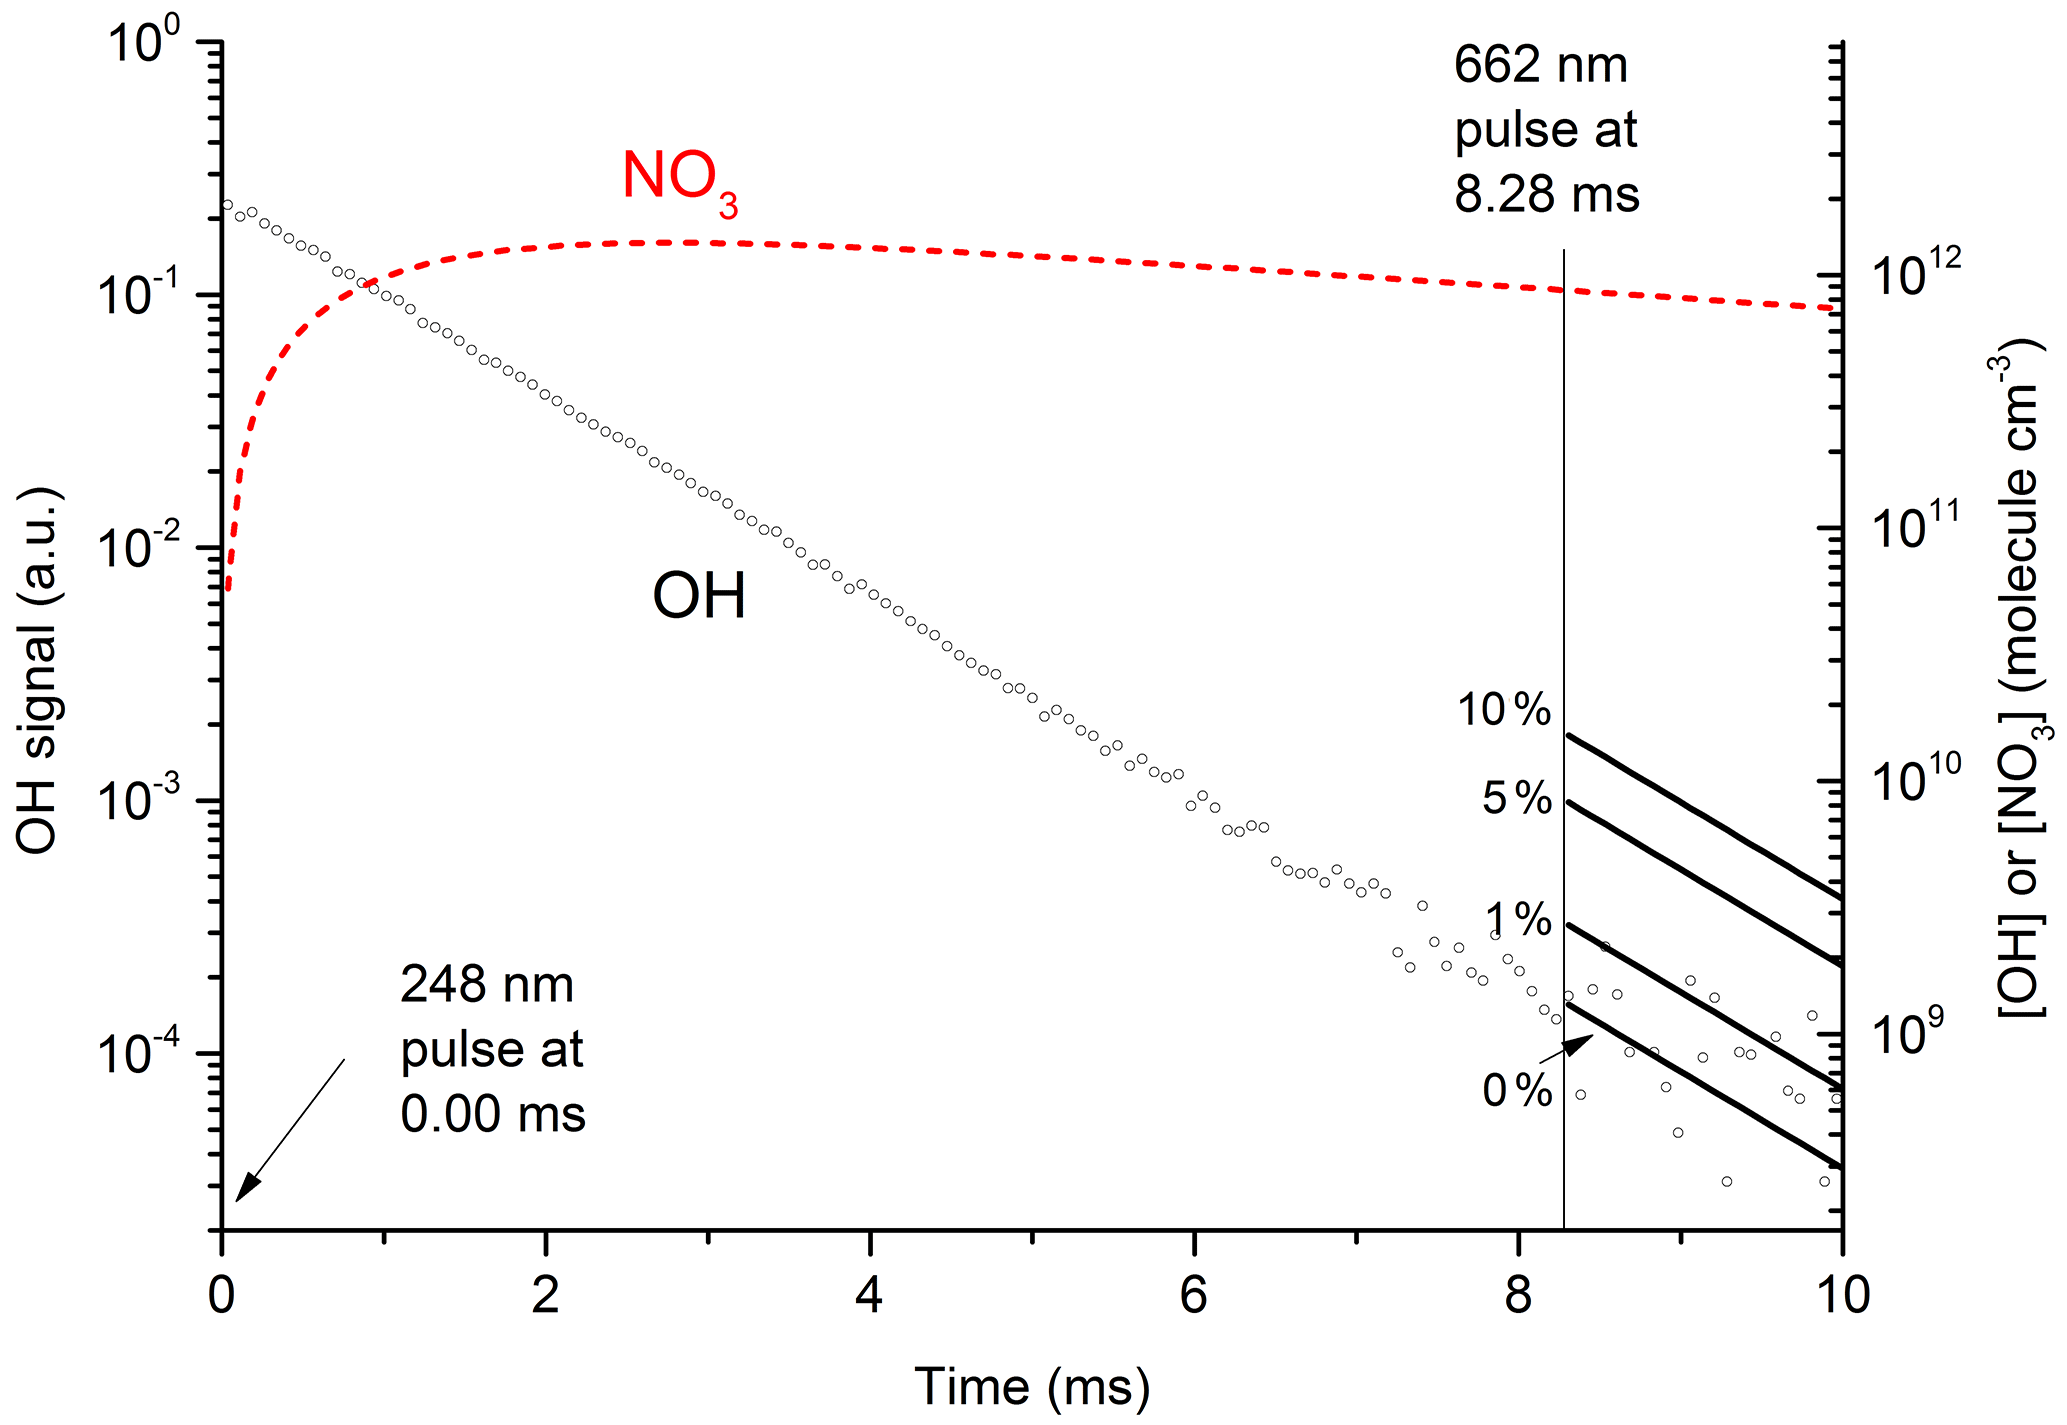
Figure 7Plot of primary OH and expected OH (solid lines after 8.28 ms) from at various values (0 % to 10 %) of k12b∕k12. The initial OH concentration (right y axis) was 2.0×10¹² molecule cm−3. The dashed red line displays the calculated NO3 concentration, which at 8.28 ms (time of 662 nm excitation pulse) was 9×10¹¹ molecule cm−3. In these conditions 50 % of available NO3 was excited to by absorption at 662 nm; 35 % of this proceeded to react with H2O in Reaction (R12), with the balance quenched by N2 or HNO3. The solid lines (t>8.28 ms) represent expected OH signals for values of k12b / k12 between 0 % and 10 %.
The solid lines starting at t=8.28 ms represent the expected OH signal if the value of k12b∕k12 were 0.0, 0.01, 0.05, and 0.1 and were calculated using the rate constants for quenching of by N2 and H2O as derived in this study as well as the concentrations of N2 and H2O.
Clearly, the data from the experiment illustrated in Fig. 7 are consistent with a value of k12b∕k12 that lies between 0 % and 1 %. Similar experiments were repeated for different starting conditions and photoexcitation wavelengths (623, 629, and 662 nm) corresponding to strong absorption features of NO3. No evidence for OH production in Reaction (R12) was observed in any experiment and an upper limit to the yield of OH was obtained from the random noise on the experimental OH-trace data and the expected OH signal. These values are tabulated in Table 2. The major sources of uncertainty in the calculated OH yield are uncertainty in the measurement of laser fluences (30 %) required to calculate the initial OH and concentrations and assumptions related to the (unmeasured) NO3 time profile. NO3 is relatively unreactive in this system as it does not react with HNO3 and only slowly with NO2 (formed in Reaction R13) at these pressures. We calculate that ≈5 % of the NO3 formed is lost via reaction with OH ( cm3 molecule−1 s−1) (Atkinson et al., 2004), its major removal processes being diffusive transport. The diffusive loss rate constant for NO3 in this system was calculated from the known diffusive loss rate constant of OH under the same conditions of pressure and temperature. In the absence of corroborative measurements of the NO3 profile in these experiments, we conservatively assume a factor of 2 uncertainty in the NO3 concentration at the time of the excitation pulse. We thus derive an upper limit of following photoexcitation at 623, 629, and 662 nm. This indicates either that the rapid quenching of by H2O predominantly involves energy transfer rather than reaction or that the products formed in reactive quenching do not include OH.
The results obtained in this work and elsewhere (Crowley and Carl, 1997; Carr et al., 2009; Amedro et al., 2011) clearly demonstrate that the large values of k5b∕k5 reported by Li et al. (2008) were erroneous. In this work we were able to reproduce, extend, and improve upon previous results (i.e. obtain smaller upper limits for k5b∕k5). The extension of the database to a wider range of photoexcitation wavelengths was important since the majority of the data from Li et al. (2008) were obtained at wavelengths red-shifted from those of the other groups. In the modelling study by Wennberg and Dabdub (2008) the largest impacts of Reaction (R5b) on air quality (enhancements in O3 of ≈40 %) were found when using from Li et al. (2008). Small but still significant impact changes in O3 and particle mixing ratios were calculated when using the upper limit of provided by Crowley and Carl (1997). Results from this work, with upper limits to k5b∕k5 an order of magnitude smaller than those available previously, enable us to conclude that the formation of OH in is not an important atmospheric process.
Our upper limit of 3 % to OH formation from the reactive quenching of by H2O can be put in context using Eqs. (1) and (2). We combine our measurements of cm3 molecule−1 s−1 and cm3 molecule−1 s1 with the literature value for k11 ( cm3 molecule−1 s−1; Nelson et al., 1983) to derive at 25 ∘C and a relative humidity of 80 %. Using the same excitation rates and concentrations of NO3 described in Sect. 1.1 and our upper limit of , we derive an OH production rate of OH cm−3 s−1. Whilst this value is ≈2 orders of magnitude lower than that calculated in Sect. 1.1 in which we assumed that all interactions form OH and used the high value of k12 from the literature (Fenter and Rossi, 1997), it is non-negligible compared to OH production rates from photolysis of O3 (see Sect. 1.2) and may still represent an important contribution to OH formation in environments in which OH generation via traditional routes involving absorption of UV radiation is suppressed, for example, at high latitudes in winter.
The low yield of OH most likely results from the dominance of collisional energy transfer over reactive quenching of NO3 by H2O (k12b≪k12). However, we also consider the possibility that the non-observation of OH in our experiments reflects the fact that the preferred products are HONO+HO2 (i.e. k12c>k12b) even though the molecular rearrangements required to form these products are less straightforward than for formation of OH and HNO3 if excited-state NO3 has the same (approximate) D3h symmetry as the ground state and formally contains no O–O bonds. The conversion of HO2 to (detectable) OH via addition of NO was not feasible owing to the rapid reaction of NO with NO3 ( cm3 molecule−1 s−1, cm3 molecule−1 s−1 (Atkinson et al., 2004; IUPAC, 2018).
Given that our experiments were blind to formation of HO2 or HONO, a detailed discussion of the atmospheric role of Reaction (R12c) is not warranted. However, the potential importance of Reaction (R12c) can be illustrated by assuming a 10 % yield of HONO and HO2 () and the same temperature, NO3 concentration, and relative humidity outlined above. With this scenario, we calculate production rates of HO2 and HONO of molecule cm−3 s−1. For HONO, this production rate is comparable to its formation in the gas-phase reaction between OH and NO under low-NOx conditions but lower than the missing production rate of ≈1–5×10⁶ molecule cm−3 s−1 that has been observed in several environments as summarised by Meusel et al. (2016). In terms of HO2 formation, a rate of 2×10⁵ molecule cm−3 s−1 would be comparable to that obtained by the photolysis of ≈0.5 ppbv of HCHO (assuming a J value for HCHO of s−1). In conclusion, whilst our experiments indicate that the reactive quenching of excited NO3 by water vapour is inefficient compared to collisional deactivation, we cannot rule out that this reaction plays a role in HOx or HONO production. Experiments sensitive to HO2 or HONO formation and theoretical calculations could help shed light on this.
The results of our experiments are tabulated in this paper. Workup and interpretation of the underlying laboratory data and signals requires i.a. access to handwritten laboratory notebooks. Such data/information could, in principal, be provided upon request to John N. Crowley or Terry J. Dillon.
JNC instigated the investigations and, together with TJD, wrote the paper. TJD performed the experiments when still working in Mainz.
The authors declare that they have no conflict of interest.
We thank the Deutsche Forschungsgemeinschaft (DFG) for partial financial
support of this research (CR 246/2-1).
The
article processing charges for this open-access
publication
were covered by the Max Planck Society.
Edited
by: Dwayne Heard
Reviewed by: Mark Blitz and two anonymous
referees
Amedro, D., Parker, A. E., Schoemaecker, C., and Fittschen, C.: Direct observation of OH radicals after 565 nm multi-photon excitation of NO2 in the presence of H2O, Chem. Phys. Lett., 513, 12–16, 2011.
Atkinson, R., Baulch, D. L., Cox, R. A., Crowley, J. N., Hampson, R. F., Hynes, R. G., Jenkin, M. E., Rossi, M. J., and Troe, J.: Evaluated kinetic and photochemical data for atmospheric chemistry: Volume I – gas phase reactions of Ox, HOx, NOx and SOx species, Atmos. Chem. Phys., 4, 1461–1738, https://doi.org/10.5194/acp-4-1461-2004, 2004.
Brown, S. S., Talukdar, R. K., and Ravishankara, A. R.: Reconsideration of the rate constant for the reaction of hydroxyl radicals with nitric acid, J. Phys. Chem., 103, 3031–3037, 1999.
Brown, S. S., Burkholder, J. B., Talukdar, R. K., and Ravishankara, A. R.: Reaction of hydroxyl radical with nitric acid: Insights into its mechanism, J. Phys. Chem., 105, 1605–1614, 2001.
Cantrell, C. A., Zimmer, A., and Tyndall, G. S.: Absorption cross sections for water vapor from 183 to 193 nm, Geophys. Res. Lett., 24, 2195–2198, 1997.
Carl, S. A., Ingham, T., Moortgat, G. K., and Crowley, J. N.: OH kinetics and photochemistry of HNO3 in the presence of water vapor, Chem. Phys. Lett., 341, 93–98, 2001.
Carr, S., Heard, D. E., and Blitz, M. A.: Comment on “Atmospheric Hydroxyl Radical Production from Electronically Excited NO2 and H2O”, Science, 324, 336, https://doi.org/10.1126/science.1166669, 2009.
Carter, R. T., Schmidt, K. F., Bitto, H., and Huber, J. R.: A high-resolution study of the NO3 radical produced in a supersonic jet, Chem. Phys. Lett., 257, 297–302, 1996.
Creasey, D. J., Heard, D. E., and Lee, J. D.: Absorption cross-section measurements of water vapour and oxygen at 185 nm. Implications for the calibration of field instruments to measure OH, HO2 and RO2 radicals, Geophys. Res. Lett., 27, 1651–1654, 2000.
Crowley, J. N. and Carl, S. A.: OH formation in the photoexcitation of NO2 beyond the dissociation threshold in the presence of water vapor, J. Phys. Chem., 101, 4178–4184, 1997.
Davis, H. F., Kim, B. S., Johnston, H. S., and Lee, Y. T.: Dissociation-Energy and Photochemistry of NO3, J. Phys. Chem., 97, 2172–2180, 1993.
Dillon, T. J., Horowitz, A., Holscher, D., Crowley, J. N., Vereecken, L., and Peeters, J.: Reaction of HO with hydroxyacetone (HOCH2C(O)CH3): rate coefficients (233–363 K) and mechanism, Phys. Chem. Chem. Phys., 8, 236–246, 2006.
Dulitz, K., Amedro, D., Dillon, T. J., Pozzer, A., and Crowley, J. N.: Temperature-(208–318 K) and pressure-(18–696 Torr) dependent rate coefficients for the reaction between OH and HNO3, Atmos. Chem. Phys., 18, 2381–2394, https://doi.org/10.5194/acp-18-2381-2018, 2018.
Ensberg, J. J., Carreras-Sospedra, M., and Dabdub, D.: Impacts of electronically photo-excited NO2 on air pollution in the South Coast Air Basin of California, Atmos. Chem. Phys., 10, 1171–1181, https://doi.org/10.5194/acp-10-1171-2010, 2010.
Fenter, F. F. and Rossi, M. J.: The heterogeneous reaction of NO3 with ice and sulfuric-acid solutions: Upper limits for the uptake coefficients, J. Phys. Chem., 101, 4110–4117, 1997.
Geyer, A., Alicke, B., Ackermann, R., Martinez, M., Harder, H., Brune, W., di Carlo, P., Williams, E., Jobson, T., Hall, S., Shetter, R., and Stutz, J.: Direct observations of daytime NO3: Implications for urban boundary layer chemistry, J. Geophys. Res.-Atmos., 108, 4368, https://doi.org/10.1029/2002JD002967, 2003.
Hofzumahaus, A., Brauers, T., Aschmutat, U., Brandenburger, U., Dorn, H. P., Hausmann, M., Hessling, M., Holland, F., PlassDulmer, C., Sedlacek, M., Weber, M., and Ehhalt, D. H.: The measurement of tropospheric OH radicals by laser-induced fluorescence spectroscopy during the POPCORN field campaign and Intercomparison of tropospheric OH radical measurements by multiple folded long-path laser absorption and laser induced fluorescence – Reply, Geophys. Res. Lett., 24, 3039–3040, 1997.
IUPAC: Task Group on Atmospheric Chemical Kinetic Data Evaluation, Ammann, M., Cox, R. A., Crowley, J. N., Herrmann, H., Jenkin, M. E., McNeill, V. F., Mellouki, A., Rossi, M. J., Troe, J., and Wallington, T. J., available at: http://iupac.pole-ether.fr/index.html (last access: June 2018), 2018.
Lelieveld, J., Butler, T. M., Crowley, J. N., Dillon, T. J., Fischer, H., Ganzeveld, L., Harder, H., Lawrence, M. G., Martinez, M., Taraborrelli, D., and Williams, J.: Atmospheric oxidation capacity sustained by a tropical forest, Nature, 452, 737–740, 2008.
Li, S. P., Matthews, J., and Sinha, A.: Atmospheric hydroxyl radical production from electronically excited NO2 and H2O, Science, 319, 1657–1660, 2008.
Li, X., Rohrer, F., Hofzumahaus, A., Brauers, T., Haseler, R., Bohn, B., Broch, S., Fuchs, H., Gomm, S., Holland, F., Jager, J., Kaiser, J., Keutsch, F. N., Lohse, I., Lu, K. D., Tillmann, R., Wegener, R., Wolfe, G. M., Mentel, T. F., Kiendler-Scharr, A., and Wahner, A.: Missing Gas-Phase Source of HONO Inferred from Zeppelin Measurements in the Troposphere, Science, 344, 292–296, 2014.
Liebmann, J., Karu, E., Sobanski, N., Schuladen, J., Ehn, M., Schallhart, S., Quéléver, L., Hellen, H., Hakola, H., Hoffmann, T., Williams, J., Fischer, H., Lelieveld, J., and Crowley, J. N.: Direct measurement of NO3 radical reactivity in a boreal forest, Atmos. Chem. Phys., 18, 3799–3815, https://doi.org/10.5194/acp-18-3799-2018, 2018a.
Liebmann, J. M., Muller, J. B. A., Kubistin, D., Claude, A., Holla, R., Plass-Dülmer, C., Lelieveld, J., and Crowley, J. N.: Direct measurements of NO3 reactivity in and above the boundary layer of a mountaintop site: identification of reactive trace gases and comparison with OH reactivity, Atmos. Chem. Phys., 18, 12045–12059, https://doi.org/10.5194/acp-18-12045-2018, 2018b.
Meusel, H., Kuhn, U., Reiffs, A., Mallik, C., Harder, H., Martinez, M., Schuladen, J., Bohn, B., Parchatka, U., Crowley, J. N., Fischer, H., Tomsche, L., Novelli, A., Hoffmann, T., Janssen, R. H. H., Hartogensis, O., Pikridas, M., Vrekoussis, M., Bourtsoukidis, E., Weber, B., Lelieveld, J., Williams, J., Pöschl, U., Cheng, Y., and Su, H.: Daytime formation of nitrous acid at a coastal remote site in Cyprus indicating a common ground source of atmospheric HONO and NO, Atmos. Chem. Phys., 16, 14475–14493, https://doi.org/10.5194/acp-16-14475-2016, 2016.
Nelson, H. H., Pasternack, L., and McDonald, J. R.: Excited-State Dynamics of NO3, J. Chem. Phys., 79, 4279–4284, 1983.
Orlando, J. J., Tyndall, G. S., Moortgat, G. K., and Calvert, J. G.: Quantum Yields for NO3 Photolysis between 570 and 635 Nm, J. Phys. Chem., 97, 10996–11000, 1993.
Ruscic, B., Pinzon, R. E., Morton, M. L., von Laszevski, G., Bittner, S. J., Nijsure, S. G., Amin, K. A., Minkoff, M., and Wagner, A. F.: Introduction to active thermochemical tables: Several “key” enthalpies of formation revisited, J. Phys. Chem. A, 108, 9979–9997, 2004.
Ruscic, B., Boggs, J. E., Burcat, A., Csaszar, A. G., Demaison, J., Janoschek, R., Martin, J. M. L., Morton, M. L., Rossi, M. J., Stanton, J. F., Szalay, P. G., Westmoreland, P. R., Zabel, F., and Berces, T.: IUPAC critical evaluation of thermochemical properties of selected radicals. Part I, J. Phys. Chem. Ref. Data, 34, 573–656, 2005.
Ruscic, B., Pinzon, R. E., Morton, M. L., Srinivasan, N. K., Su, M. C., Sutherland, J. W., and Michael, J. V.: Active thermochemical tables: Accurate enthalpy of formation of hydroperoxyl radical, HO2, J. Phys. Chem. A, 110, 6592–6601, 2006.
Sander, S. P., Abbatt, J., Barker, J. R., Burkholder, J. B., Friedl, R. R., Golden, D. M., Huie, R. E., Kolb, C. E., Kurylo, M. J., Moortgat, G. K., Orkin, V. L., and Wine, P. H.: Chemical Kinetics and Photochemical Data for Use in Atmospheric Studies, Evaluation No. 17, JPL Publication 10-6, Jet Propulsion Laboratory, Pasadena, available at: http://jpldataeval.jpl.nasa.gov (last access: 2 October 2018), 2011.
Stemmler, K., Ndour, M., Elshorbany, Y., Kleffmann, J., D'Anna, B., George, C., Bohn, B., and Ammann, M.: Light induced conversion of nitrogen dioxide into nitrous acid on submicron humic acid aerosol, Atmos. Chem. Phys., 7, 4237–4248, https://doi.org/10.5194/acp-7-4237-2007, 2007.
Vandaele, A. C., Hermans, C., Simon, P. C., Carleer, M., Colin, R., Fally, S., Merienne, M. F., Jenouvrier, A., and Coquart, B.: Measurements of the NO2 absorption cross-section from 42 000 cm−1 to 10 000 cm−1 (238–1000 nm) at 220 K and 294 K, J. Quant. Spectrosc. Ra., 59, 171–184, 1998.
Wagman, D. D., Evans, W. H., Parker, V. B., Schumm, R. H., Halow, I., Bailey, S. M., Churney, K. L., and Nuttall, R. L.: The Nbs Tables of Chemical Thermodynamic Properties – Selected Values for Inorganic and C-1 and C-2 Organic-Substances in Si Units, J. Phys. Chem. Ref. Data, 11, 1–392, 1982.
Wagner, C., Hanisch, F., Holmes, N., de Coninck, H., Schuster, G., and Crowley, J. N.: The interaction of N2O5 with mineral dust: aerosol flow tube and Knudsen reactor studies, Atmos. Chem. Phys., 8, 91–109, https://doi.org/10.5194/acp-8-91-2008, 2008.
Wayne, R. P., Barnes, I., Biggs, P., Burrows, J. P., Canosa-Mas, C. E., Hjorth, J., Le Bras, G., Moortgat, G. K., Perner, D., Poulet, G., Restelli, G., and Sidebottom, H.: The nitrate radical: Physics, chemistry, and the atmosphere, Atmos. Environ. A-Gen., 25, 1–206, 1991.
Wennberg, P. O. and Dabdub, D.: Atmospheric chemistry – Rethinking ozone production, Science, 319, 1624–1625, 2008.
Wollenhaupt, M., Carl, S. A., Horowitz, A., and Crowley, J. N.: Rate coefficients for reaction of OH with acetone between 202 and 395 K, J. Phys. Chem., 104, 2695–2705, 2000.
Yokelson, R. J., Burkholder, J. B., Fox, R. W., Talukdar, R. K., and Ravishankara, A. R.: Temperature-dependence of the NO3 absorption spectrum, J. Phys. Chem., 98, 13144–13150, 1994.