the Creative Commons Attribution 4.0 License.
the Creative Commons Attribution 4.0 License.
 | 01 Feb 2018
Nine-year spatial and temporal evolution of desert dust aerosols over South and East Asia as revealed by CALIOP
Vassilis Amiridis
Eleni Marinou
Aristeidis K. Georgoulias
Stavros Solomos
Stelios Kazadzis
Julien Chimot
Huizheng Che
Georgia Alexandri
Ioannis Binietoglou
Vasiliki Daskalopoulou
Konstantinos A. Kourtidis
Gerrit de Leeuw
Ronald J. van der A
We present a 3-D climatology of the desert dust distribution over South and East Asia derived using CALIPSO (Cloud-Aerosol Lidar and Infrared Pathfinder Satellite Observation) data. To distinguish desert dust from total aerosol load we apply a methodology developed in the framework of EARLINET (European Aerosol Research Lidar Network). The method involves the use of the particle linear depolarization ratio and updated lidar ratio values suitable for Asian dust, applied to multiyear CALIPSO observations (January 2007–December 2015). The resulting dust product provides information on the horizontal and vertical distribution of dust aerosols over South and East Asia along with the seasonal transition of dust transport pathways. Persistent high D_AOD (dust aerosol optical depth) values at 532 nm, of the order of 0.6, are present over the arid and semi-arid desert regions. Dust aerosol transport (range, height and intensity) is subject to high seasonality, with the highest values observed during spring for northern China (Taklimakan and Gobi deserts) and during summer over the Indian subcontinent (Thar Desert). Additionally, we decompose the CALIPSO AOD (aerosol optical depth) into dust and non-dust aerosol components to reveal the non-dust AOD over the highly industrialized and densely populated regions of South and East Asia, where the non-dust aerosols yield AOD values of the order of 0.5. Furthermore, the CALIPSO-based short-term AOD and D_AOD time series and trends between January 2007 and December 2015 are calculated over South and East Asia and over selected subregions. Positive trends are observed over northwest and east China and the Indian subcontinent, whereas over southeast China trends are mostly negative. The calculated AOD trends agree well with the trends derived from Aqua MODIS (Moderate Resolution Imaging Spectroradiometer), although significant differences are observed over specific regions.
- Article
(12658 KB) - Full-text XML
- BibTeX
- EndNote


Airborne mineral dust is a major category of particles in the Earth's atmosphere that influences climate on a local and regional to a global scale (Huang et al., 2006). Dust aerosols have a significant role in climate through the direct radiative effect of absorption and scattering of solar and thermal terrestrial radiation (Ramanathan et al., 2001; Tegen et al., 1996; Huang et al., 2009). Moreover, dust aerosols, depending on the atmospheric conditions and on the dust composition, act either as effective CCN (cloud condensation nuclei) (Hatch et al., 2008) or as IN (ice nuclei) (DeMott et al., 2009; Chou et al., 2011), modifying cloud albedo, coverage and precipitation (Rosenfeld et al., 2008). Hence, the indirect effect of dust on the Earth's climate lies in the modulation of the solar radiation forcing by altering the cloud microphysical and macrophysical properties (Twomey, 1977; Albrecht, 1989; Haywood and Boucher, 2000; Huang et al., 2006). Besides the direct and the indirect effects and the effect on meteorological processes, dust transported over large distances has a significant impact on human health and life expectancy due to the degradation of air quality (Griffin, 2007; Goudie, 2014). In addition to its impact on human life quality, the aeolian transport of dust is crucial for the sustainability of marine and terrestrial ecosystems through the deposition of mineral inputs and nutrients (Martin et al., 1994; Okin et al., 2004; Jickells et al., 2005).
Over Asia, airborne mineral dust is considered a significant atmospheric aerosol contributor. Major Asian dust sources include the deserts of the Arabian Peninsula in southwest Asia and the Middle East, the Thar Desert (Pakistan/India), the sandy Taklimakan region across northwest China, and the vast arid and semi-arid Gobi in north China and southern Mongolia (Fig. 1). The dust aerosol load generated in the Gobi and Taklimakan deserts is estimated to be 800 Tg yr−1 (Zhang et al., 1997). Airborne dust originating from Asian deserts is frequently transported eastward across China (Zhang et al., 2003), over the north Pacific Ocean (Shaw, 1980; Duce et al., 1980) to the western coast of north America (Uno et al., 2001; Huang et al., 2008) and in extreme cases over even longer distances, completing full global circuits (Clarke et al., 2001; Uno et al., 2009).
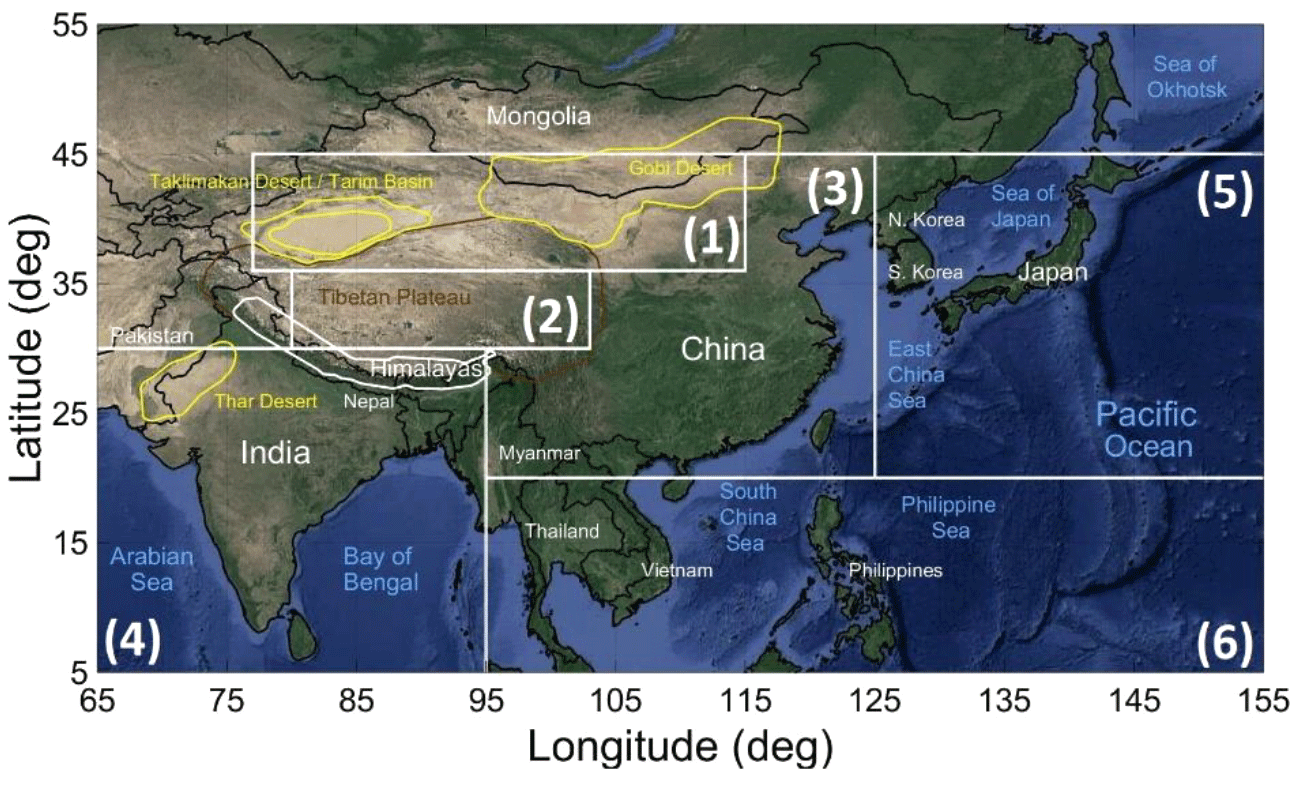
Figure 1Illustration of the study domain, confined to between longitudes 65–155∘ E and latitudes 5–55∘ N. Major dust aerosol sources (yellow colour) are included (Taklimakan, Gobi and Thar deserts). Dashed black lines delineate domains of high surface elevation (Tibetan Plateau, Himalayan Ridge). The grey lines delineate the domains of regional statistics provided in Table 1: (1) Taklimakan and Gobi deserts, (2) Tibetan Plateau, (3) southeast China, (4) Indian Peninsula, (5) North Pacific Ocean, (6) mainland Southeast Asia/Indonesia.
In order to examine the composition, properties and radiative effect of Asian dust, several field campaigns have been conducted. Regional aircraft and ground-based campaigns, such as the Indian Ocean Experiment (INDOEX) (Rasch et al., 2001), the Asian Aerosol Characterization Experiment (ACE-Asia) (Huebert et al., 2003), the Intercontinental Chemical Transport Experiment (INTEX-B) (McKendry et al., 2008), the Aeolian Dust Experiment on Climate Impact (ADEC) (Mikami et al., 2006), the NASA Transport and Chemical Evolution over the Pacific (TRACE-P) (Jacob et al., 2003), and the Pacific Dust Experiment (PACDEX) (Stith et al., 2009) have contributed considerably to our knowledge and understanding of Asian dust. In addition to the field campaigns, extensive measurements on the spatial variability and temporal evolution of dust aerosols are required in order to assess their contribution to climate. To this end, several passive remote-sensing satellite instruments, such as the Advanced Very High Resolution Radiometer (AVHRR) (Husar et al., 1997), the MODerate resolution Imaging Spectroradiometer (MODIS) (Remer et al., 2005) on board both Terra and Aqua platforms, the Total Ozone Mapping Spectrometer (TOMS) on board Nimbus 7 (Prospero et al., 2002), and the Ozone Mapping Instrument (OMI) onboard Aura have been used (Chimot et al., 2017). Although passive satellite sensors provide information on the columnar properties of aerosols with adequate spatial and temporal resolution, they are bound by certain limitations. The major limitation is the lack of information on the vertical distribution of aerosols and clouds, an important parameter for the assessment of the aerosol radiative forcing on climate as well as their contribution as IN and CCN (IPCC, 2013).
The vertical structure of aerosols and clouds is provided through ground-based and satellite-based lidar systems (Liu et al., 2002). Regarding satellite-based lidar observations, CALIOP (Cloud Aerosol Lidar with Orthogonal Polarization) has been providing vertically resolved information on both aerosols and clouds on a global scale since June 2006. CALIOP is the main instrument onboard the NASA∕CNES (Centre National d'Etudes Spatiales) CALIPSO (Cloud-Aerosol Lidar and Infrared Pathfinder Satellite Observations) satellite (Winker et al., 2007). CALIOP measures total attenuated backscatter at 532 and 1064 nm and the linear depolarization ratio at 532 nm. The depolarization ratio is a crucial parameter in the dust aerosol classification (Ansmann et al., 2003; Liu et al., 2008b), since dust particles are strongly depolarizing, as opposed to other aerosol types. Thus, CALIOP is an ideal instrument to detect dust aerosols and study the dust 3-D spatial distribution and temporal evolution (Yang et al., 2012; Amiridis et al., 2013; Marinou et al., 2017).
Over the past decade CALIOP retrievals have been frequently utilized in dust aerosol studies with a focus on South and East Asia. Huang et al. (2007) examined summertime dust plumes appearing over the Tibetan Plateau and found that they originate from the nearby Taklimakan Desert. Liu et al. (2008a) examined the spatial distribution of dust over the Tibetan Plateau and the surrounding areas on a seasonal basis. Huang et al. (2008), using CALIOP, a micropulse lidar and surface meteorological data from the Gansu Meteorological Bureau studied the long-range transport of dust from the Taklimakan and Gobi deserts over east China and the Pacific Ocean during the PACDEX campaign (March to May 2007). They also showed that the dust storms over the Gobi region are more intense but less frequent than the dust storms over the Taklimakan region. The passage of dust from the Taklimakan and Gobi to Japan (covering 1000–1500 km day−1) and consequently over the Pacific Ocean is in addition reported by Uno et al. (2008), using extinction coefficient profiles from CALIOP, a dust transport model and forward trajectory analysis. Huang et al. (2010) used CALIOP dust data along with other A-Train satellite observations to study the climatic effect of dust on the semi-arid areas of northwest China. Ge et al. (2014) combined dust CALIOP data with observations from the Multiangle Imaging Spectroradiometer (MISR) showing that the Taklimakan dust can be injected vertically up to 10 km height above sea level, as a result of the local topography and synoptic conditions. He and Yi (2015) utilized data from CALIOP and ground-based lidar observations over China to examine 13 dust events within the period 2010–2012, while Xu et al. (2016) studied the horizontal, vertical and temporal variability in dust aerosols over China based on CALIOP. More recently, Tan et al. (2016 and 2017) combined CALIPSO, Terra MODIS, OMI data and ground-based dust records and studied the transport processes of five dust storms in spring 2010 from the Taklimakan and Gobi deserts to the Pacific and their impacts on the ocean. Satellite-based observations from CALIPSO have also been utilized to study the effect of dust transport from the Thar Desert to the Indian subcontinent (Gautam, 2009; Das et al., 2013; Kumar et al., 2014).
The aforementioned studies used the standard CALIPSO product and aerosol subtype classification (Omar et al., 2009). Using this classification the studies either did not take into consideration the pure-dust component of polluted-dust aerosol subtype or they defined as “dust” both the dust and polluted-dust aerosol subtypes (hence considering the non-dust component of polluted dust to be dust). In the present study we use a separation methodology developed in the framework of EARLINET (European Aerosol Research Lidar Network), which makes use of the particle linear depolarization ratio and updated lidar ratio values suitable for Asian dust, in order to distinguish the pure-dust component from the dust and polluted-dust aerosol subtypes. In this paper we use this new pure-dust product in order to provide the three-dimensional seasonal distribution and the short-term temporal evolution of dust over South and East Asia, based on 9 years of CALIOP observations (January 2007–December 2015). The domain of the study is confined to between 65–155∘ E and 5–55∘ N (Fig. 1). South and East Asia encompasses three major sources of dust aerosols, namely the deserts of Taklimakan, Gobi and Thar. Regarding the dust aerosol transport, the transport pathways depend greatly on the atmospheric circulation, which in the case of Asia is heavily affected by the Himalaya orographic barrier. The area southwest of the Himalayas (Arabic Peninsula, India, Indian Ocean) is mostly affected by the long-range transport of dust generated by the Arabian Desert and from the arid areas of Somalia and Ethiopia (Prospero et al., 2002). Local dust sources in arid areas of Iran, Iraq and Afghanistan additionally contribute to the regional dust load. By contrast, the areas located to the east of the Himalaya barrier (Mongolia, China, southeast Asian Peninsula, Pacific Ocean) are mostly affected by dust originating from the Gobi and Taklimakan deserts (Prospero et al., 2002). The pure-dust aerosol product can be used to study the horizontal and vertical distribution of dust aerosols over the major sources along with the intercontinental transport, the temporal evolution of dust aerosols and the intensity of the dust events (Marinou et al., 2017).
The paper is organized as follows. Sect. 2 provides a description of CALIOP, the data used and the methodology followed in the study. Section 3 provides the main results. In Sect. 3.1 results on the horizontal distribution of aerosols over South and East Asia (AOD, aerosol optical depth; D_AOD, non-dust AOD) and of the observed dust centre of mass and dust top height over South and East Asia are presented and discussed. The vertical distribution of dust aerosols is presented and discussed in Sects. 3.2–3.3 through the dust climatological and conditional extinction coefficient profiles, while the short-term temporal evolutions of AOD and D_AOD during the study period are examined in Sect. 3.4. Finally, Sect. 4 provides a summary of the study along with the main concluding remarks.
CALIPSO is a sun-synchronous polar orbit satellite with an equatorial crossing time around 13:30 LT and approximately 16 days repetition orbit. CALIPSO, the collaborative NASA and CNES project, joined the A-Train formation of satellites in April 2006 (Winker et al., 2007). CALIOP, the primary instrument onboard CALIPSO, consists of an Nd:YAG elastic backscatter and polarization lidar (Hunt et al., 2009). CALIOP transmits linear polarized light, while a telescope of 1 m diameter collects the backscattered component by the atmosphere. Utilizing the total backscatter signals and the polarization of the backscattered light CALIOP provides almost continuously height-resolved information on the vertical structure of aerosols and clouds (Winker et al., 2009), from the ground up to 30 km height.
Three levels of CALIPSO products are provided by NASA and CNES. The Level-1 (L1) product consists of the raw range-corrected signals at the highest spatio-temporal resolution. The Level-2 (L2) products are high-level quality products. More specifically, the CALIPSO L2 algorithm classifies the detected layers into characteristic classes (Vaughan et al., 2009), namely into clear air, cloud, aerosol, stratospheric, surface, subsurface, totally attenuated or invalid feature types. The classification algorithm (Omar et al., 2009) utilizes the depolarization ratio and the attenuated backscatter signal, the height of the aerosol layer and the characteristics of the Earth's surface along the CALIPSO footprint (desert, ocean, snow/ice) in order to divide the detected atmospheric features types into aerosol subtypes (clean marine, dust, clean continental, polluted continental, polluted dust and smoke). In addition, the CALIPSO L2 algorithm uses specific lidar ratio (LR) values for each classified aerosol type in order to derive the profiles of the extinction coefficient (Young and Vaughan, 2009). The final L2 product is characterized by a 5 km horizontal resolution and vertical resolution of 60 m in the altitude range −0.5–20.2 and 120 m in the altitude range 20.2–30.1 The L2 aerosol extinction product is used to provide the Level 3 (L3) product of CALIPSO, characterized by a grid resolution (Winker et al., 2013).
In the framework of this study we use the CALIPSO L2 optimized profiles (based on the CALIPSO Version 3 dataset), developed as an intermediate product under the collaborative EARLINET-ESA LIVAS (LIdar climatology of Vertical Aerosol Structure) project (Amiridis et al., 2015). This product has a spatial resolution of and is described in detail and compared with AERONET (AErosol RObotic NETwork) in Amiridis el at. (2015). In brief, for this product, several quality control filters are applied in the CALIPSO L2 V3 dataset, following the filtering proposed for the L3 product (Winker et al., 2013). Moreover, in order to ensure the high quality of the aerosol product, in addition to the filters described in Winker et al. (2013), L2 profiles with cloud observations are filtered out from the dataset (Amiridis et al., 2013).
In addition to the CALIPSO L2 optimized profiles, the aerosol observations categorized through the CALIOP classification scheme as dust or polluted dust (Omar et al., 2009) are used in order to retrieve the pure-dust aerosol component. To this end, the particle depolarization ratio of dust is used. During the SAharan Mineral dUst experiMent (SAMUM) 1 and 2 campaigns, Saharan dust particle depolarization ratio values varied between 0.27 and 0.35 at 532 nm (Ansmann et al., 2011). Typical dust particle depolarization ratio values measured with lidars in field campaigns around the globe are consistent with these values, showing little variation independently of the source region (e.g. Sakai et al., 2000; Liu et al., 2008a; Freudenthaler et al., 2009; Groß et al., 2011, 2013, 2015; Burton et al., 2013; Illingworth et al., 2015). According to the methodology proposed by Tesche et al. (2009), the aerosol layers classified as dust or polluted dust and having a depolarization ratio lower than 0.31 are assumed to be a mixture of pure-dust and non-dust aerosol components. The particle depolarization ratio value of the pure-dust component is then calculated by
where δp is the particle depolarization value of the “pure dust component” in the aerosol mixture, β⊥ is the perpendicular component of the backscatter value and βt is the total backscatter of the aerosol layer. The backscatter contribution of the pure-dust component is calculated by
where δ1 (δ2) is a theoretical depolarization value of the dust (non-dust) component. For the non-dust aerosols, we assume particle depolarization ratio values of 0.03±0.02, computed as a mean value of non-dust spherical particles (Omar et al., 2009), considering minor contributions to depolarization by dried marine particles and by anthropogenic particles. Using this methodology, the CALIPSO pure-dust backscatter coefficient profile at 532 nm is calculated.
In order to retrieve the pure-dust extinction coefficient profile at 532 nm the pure-dust backscatter coefficient profile has to be multiplied with the appropriate LR for Asian dust. The LRs observed globally are summarized in the works of Mueller et al. (2007) and Baars et al. (2016). In general, different desserts produce dust of different mineralogy, thus with different properties and different LRs. Typical values of LR of desert dust aerosols vary between 35 and 55 sr. The LR values of desert dust originating from the deserts of the Arabian Peninsula, the Taklimakan region and the vast semi-arid Gobi have been investigated with ground-based lidars (Sakai et al., 2002; Murayama et al., 2004; Ansmann et al., 2005; Tesche et al., 2007; Xie et al., 2008; Haenel et al., 2012; Komppula et al., 2012; Mamouri et al., 2013), airborne instrumentation (Anderson et al., 2003) and during intensive campaigns (Liu et al., 2002; Murayama et al., 2003). Based on the atmospheric circulation over Asia, the dust aerosol transport and the observed LR values, the domain of this study can be divided in two subdomains and two different LRs for pure dust can be assigned in these regions. Southwest of the Himalayas (Arabic Peninsula, India, Indian Ocean) an LR of 40 sr is assigned to pure dust, while east of the Himalayas the value of 47 sr is used. The assigned LR values are used for the retrieval of the pure-dust aerosol extinction coefficient profiles at 532 nm through the backscatter coefficient profiles at 532 nm (Tesche et al., 2009). The discrimination of the pure-dust component from the total aerosol load is a polarization-based technique; therefore, it is possible to provide the global horizontal and vertical distribution of pure-dust only through satellite-based active remote sensing (CALIPSO CALIOP, ISS-CATS (International Space Station – Cloud Aerosol Transport System); McGill et al., 2015).
In this study, based on the aerosol extinction coefficient profiles at 532 nm and on the pure-dust extinction profiles at 532 nm (from here on referred to as dust extinction), the following products are discussed:
-
The seasonal CALIPSO L3 AOD, D_AOD and non-dust aerosol optical depth aggregated in spatial-resolution grids.
-
The seasonal CALIPSO L3 dust profile top height (TH) and dust centre of mass (CoM) aggregated in 1∘ × 1∘ spatial-resolution grids. The dust TH (km) is defined as the height below which 98 % of the D_AOD lies, while the dust CoM height is defined according to Mona et al. (2006), as the backscatter weighted altitude below which 50 % of the D_AOD lies. The CoM is given by the following equation:
where z is the height in the atmosphere, β(z) is the backscatter coefficient of the dust layer at heights z, and zb and zt are the base and top heights of the profile respectively.
-
The seasonal zonal distribution of the climatological and conditional dust extinction coefficient profiles (M m−1).
The climatological dust product is a measure of the average dust load over a geographical domain and is computed acknowledging only the contribution of the dust component in the atmosphere. Technically, this is accomplished by setting the extinction coefficient value of the non-dust aerosols to 0 km−1 when averaging the profiles over a grid. The dust climatological product can be used for studies related to the contribution of dust to the total aerosol load over a period of time. In addition, the climatological dust product can be used in the evaluation of models related to dust transport and to radiative transfer models, in studies of dust-related physical processes (dust transport dynamics, CCN, IN), to investigate the effect of dust aerosols on ecosystems (dust deposition into the oceans), and to determine the dust aerosol load over highly industrialized and densely populated regions.
The conditional dust product is a measure of the average intensity of dust load over a geographical domain and is based explicitly on the dust profiles, hence ignoring completely non-dust aerosols. Technically, this is accomplished by setting the extinction coefficient value of the non-dust aerosols to not-a-number (NaN) when averaging the profiles over a grid. The conditional dust product is related to the intensity of the dust events.
Validation of the pure-dust aerosol product against collocated AERONET observations over northern Africa and Europe show absolute biases between CALIPSO and AERONET AODs of −0.03 (Amiridis et al., 2013). The methodology followed for the calculation of the dust climatological extinction coefficient profiles and the dust conditional coefficient profiles is shown in the flowchart of Fig. 2. In the recent study of Marinou et al. (2017), the climatological and conditional dust products have been used to study the dust distribution above Europe and northern Africa. In this study, the climatological and conditional products are similar to the study of Marinou et al. (2017), with the only difference in the selection of the domain being the LR values (55 sr for the Sahara).
-
Short-term CALIOP time series and trends in AOD and D_AOD for the study domain, based on 9 years of CALIPSO overpasses (January 2007–December 2015). In addition to the CALIPSO∕CALIOP time series and trends, Aqua MODIS trends for the same period (January 2007–December 2015) are included.
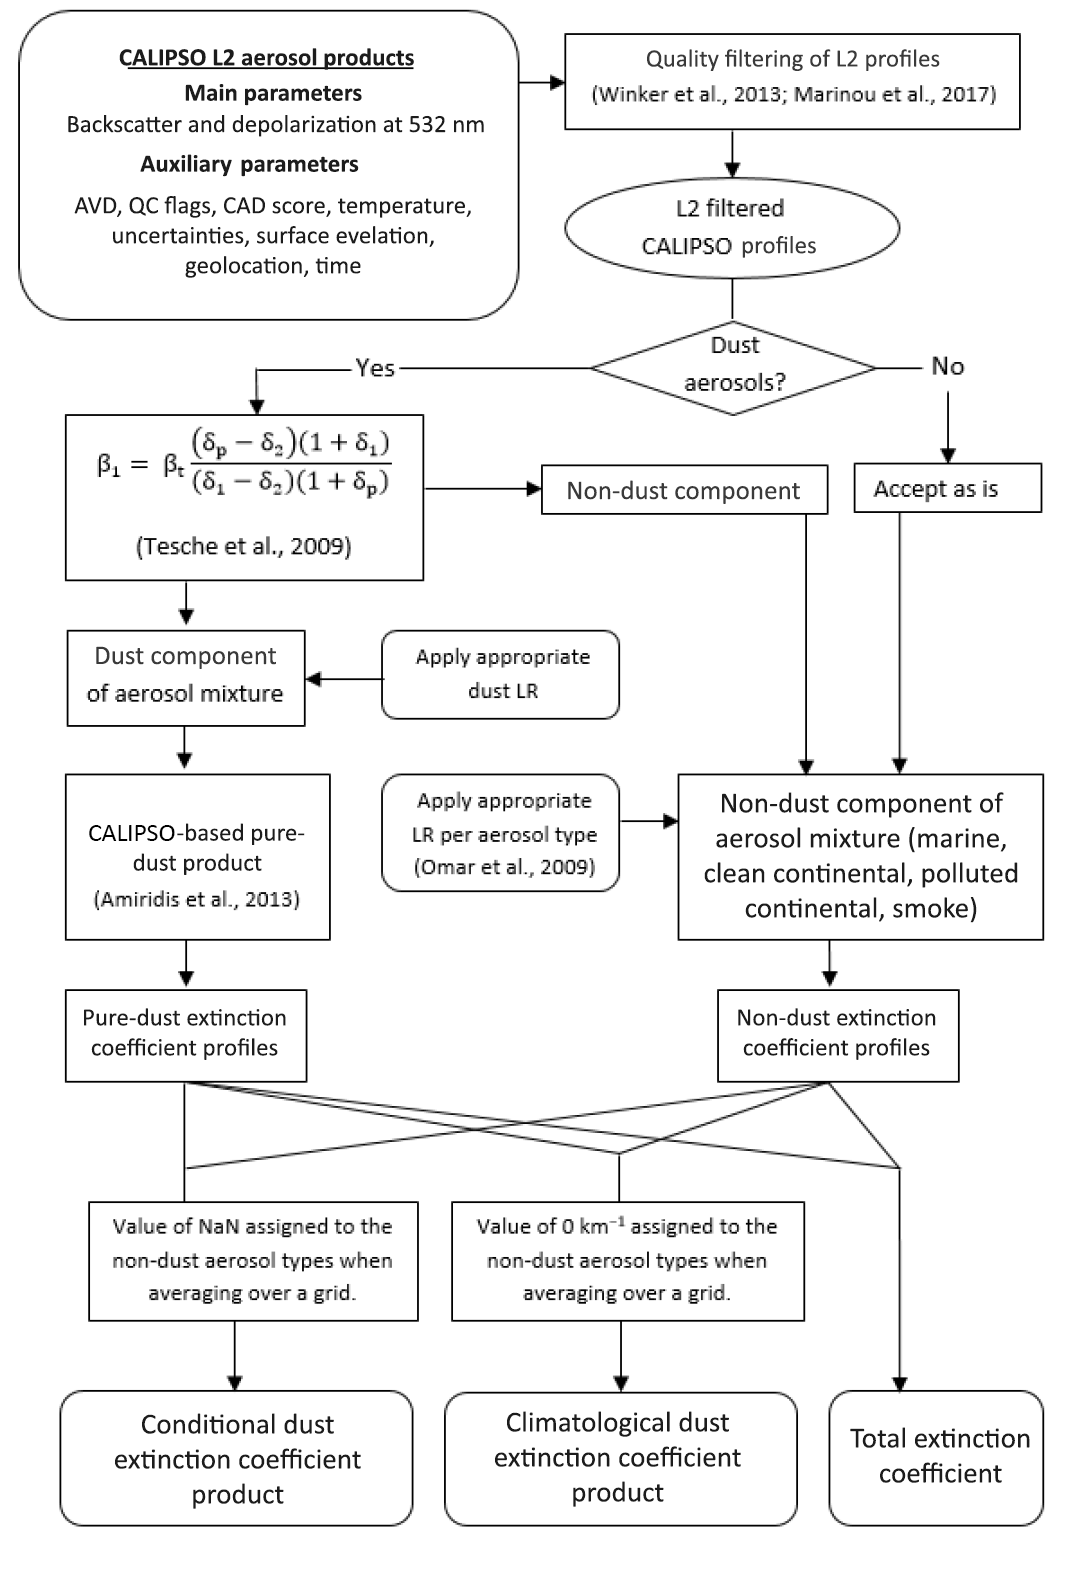
Figure 2Flowchart of the CALIPSO pure-dust, conditional dust extinction coefficient and climatological dust extinction coefficient products.
MODIS onboard the Aqua satellite was launched on 4 May 2002. The sensor has a daytime equator crossing at 13:30 LT (noon). Due to its wide swath (2330 km) it is capable of providing almost global coverage on a daily basis. MODIS measures backscattered radiation in 36 spectral bands, from 0.415 to 14.235 µm, with a spatial resolution of 250, 500 and 1000 m depending on the band. In this work, monthly AOD550 data from the Level-3 Aqua MODIS Collection 6 1∘ × 1∘ gridded dataset (MYD08_M3) are used. The MODIS data were acquired from NASA's Level 1 and Atmosphere Archive and Distribution System (LAADS) (http://ladsweb.nascom.nasa.gov) covering the period from January 2007 to December 2015. AOD550 is retrieved using two algorithms: Dark Target (DT) and Deep Blue (DB). There are two separate DT algorithms, one used for land surfaces and one for water surfaces (Kaufman et al., 1997; Tanré et al., 1997; Remer et al., 2005; Levy et al., 2010, 2013). The DT expected error for Collection 6 is over land and , over ocean relative to the AERONET aerosol optical thickness (τA) (Levy et al., 2013). While DT is used over vegetated surfaces and surfaces covered by dark soil, the DB algorithm is capable of retrieving AOD550 over bright surfaces such as deserts and arid and semi-arid areas (Hsu et al., 2004, 2013). The new DB algorithm which is used for the production of Collection 6 is applicable over all land surfaces (Sayer et al., 2013, 2014; Hsu et al., 2013). For Collection 6 the DB expected error is relative to the MODIS aerosol optical thickness (τM) (Hsu et al., 2013; Sayer et al., 2015). In this work, AOD550 data from the merged (DT and DB) (Levy et al., 2013) datasets are used.
Regarding the uncertainties in the products, CALIOP L2 V3 is characterized by a daytime minimum detectable backscatter of 0.0017±0.0003 , a nighttime minimum detectable backscatter of 0.0008±0.0001 and an AOD of 0.005 in north China (based on the minimum CALIOP 532 nm channel detection sensitivity; Winker et al., 2009). The reported underestimation in the CALIPSO AOD (Kittaka et al., 2011; Rogers et al., 2014; Papagiannopoulos et al., 2016; Tian et al., 2017) is additionally related to the limitation of CALIOP to collect backscatter signals lower than the minimum detectable backscatter from aerosol layers in the free troposphere. The estimation of the uncertainties in the CALIPSO L2 V3 product is based on the assumptions that they are random and uncorrelated (Young, 2010). Under these assumptions the backscatter, depolarization and AOD are characterized by uncertainties of 30–100, 30–160 and 100 % respectively. In addition to the inherited uncertainties in the CALIOP L2 V3 standard product in the AOD and D_AOD optimized products used in the study, uncertainties are introduced due to the selection of LR values suitable for Asian dust. An LR of 47±4 sr is used for dust aerosols emitted from the Taklimakan and Gobi deserts, based on the literature (Liu et al., 2002; Sakai et al., 2002; Anderson et al., 2003; Murayama et al., 2003, 2004; Ansmann et al., 2005; Tesche et al., 2007; Xie et al., 2008; Hänel et al., 2012; Komppula et al., 2012; Mamouri et al., 2013). The LR introduces an uncertainty of approximately 20 % in the D_AOD product. In addition, as has already been mentioned, both aerosol types classified by CALIPSO as dust or polluted dust are a mixture of a dust component and a non-dust component. Thus, another source of uncertainty in the decoupling of the dust component from the total aerosol load is the lack of information regarding the non-dust component in the aerosol mixture, due to the low depolarization ratio values of the non-dust aerosol subtypes (Omar et al., 2009). As already discussed, for the non-dust component a mean value for the different aerosol subtype depolarization ratios of 0.03±0.02 is used. An extended analysis on the way in which uncertainties propagate into the products is presented in Marinou et al. (2017).
3.1 Horizontal distribution of aerosols and dust
In this section we present and discuss the CALIPSO L3 optimized AOD and the D_AOD products. Since the mechanisms of dust generation and transport and the removal processes of aerosols from the atmosphere vary with season in this section, we present and discuss the horizontal distribution of aerosols and dust over South and East Asia per season. The seasons are defined as follows: December–January–February (DJF), March–April–May (MAM), June–July–August (JJA) and September–October–November (SON). Figure 3 shows the spatial distribution of the seasonal mean AOD (Fig. 3a, e, i and m), D_AOD (Fig. 3b, f, j and n) and non-dust AOD computed as the difference between the total AOD and D_AOD (Fig. 3c, g, k and o) and the corresponding percentage of D_AOD to the total AOD (Fig. 3d, h, l and p) at a 1∘ × 1∘ grid resolution and based on 9 years of CALIPSO observations (January 2007–December 2015).
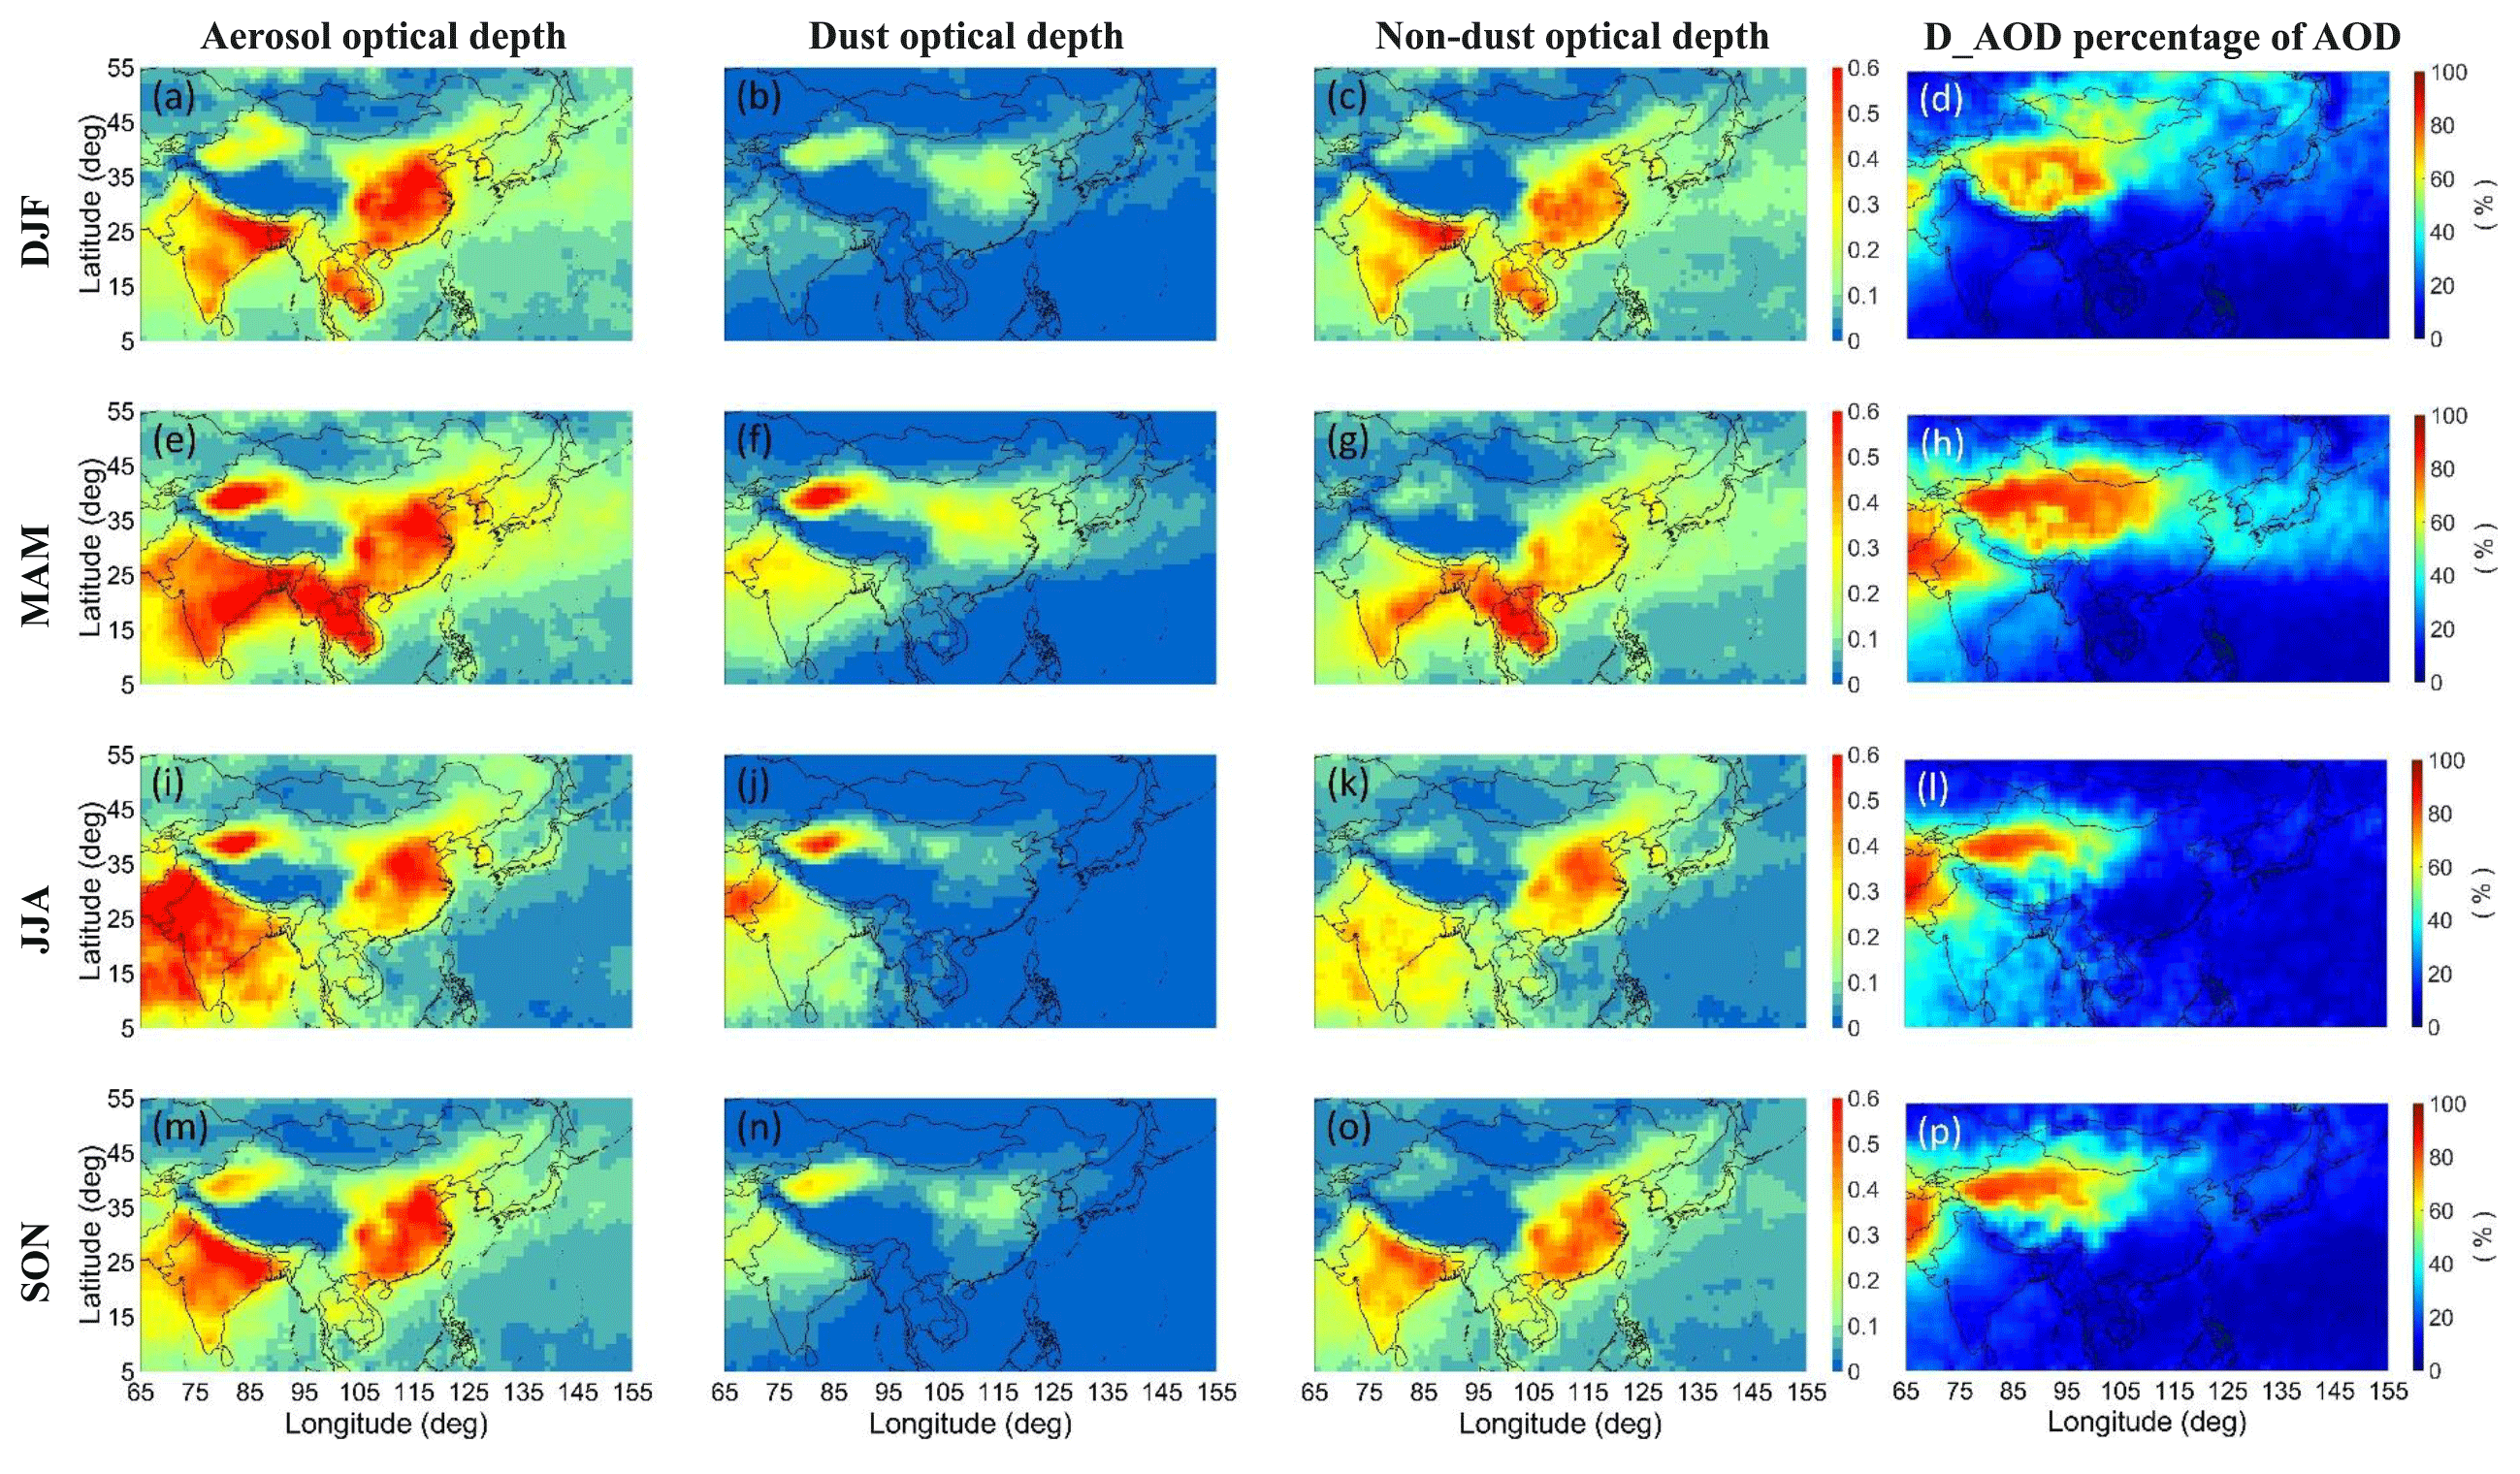
Figure 3Spatial distribution of the seasonal mean CALIPSO AOD, D_AOD, optical depth difference between AOD and D_AOD (non-dust AOD), and the percentage of D_AOD with respect to the total AOD for the domain between 65–155∘ E and 5–55∘ N and for the period January 2007–December 2015.
Regarding the horizontal distribution of AOD and non-dust AOD, similar geographical patterns are evident between all four seasons, although the observed features vary in magnitude. High values of non-dust AOD are consistently observed over the heavily industrialized and densely populated regions of India, Bangladesh and China. Over the Indo-Gangetic Plain and the entire region extending between New Delhi and Kolkata, the observed non-dust AOD values are persistently higher than 0.5 during DJF (Fig. 3a–d), MAM (Fig. 3e–h) and SON (Fig. 3m–p), while during JJA (Fig. 3i–l) the AOD is suppressed (<0.3). The relatively lower AOD values observed during JJA over the Bay of Bengal (0.3) are related to the regional meteorology (monsoons). The high frequency of cloudiness (Fig. 8c and d) results in biased mean AOD values since extreme aerosol events are less frequently captured (Winker et al., 2013). Furthermore the wet deposition rate of aerosols increases during the summer monsoon period of the year (Lau et al., 1988). The countries of mainland Southeast Asia are characterized by inhomogeneities in the observed aerosol load, with larger non-dust AOD values observed during MAM (>0.5) and DJF (>0.3) and lower values during JJA (<0.15) and SON (<0.1). The lower values during these months are attributed to the monsoon season in the area, which runs roughly between June and October. Over maritime southeastern Asia, the AOD values are relatively similar between the different seasons with mean AOD values of Similar features have been shown by Campbell et al. (2013), who investigated the 2-D variability in aerosols over the Indonesia region. Over China similar geographical patterns in the horizontal distribution of aerosols are evident between all four seasons, with larger non-dust AOD values over the major sources of anthropogenic activity such as urban clusters (Beijing, Shanghai, Guangzhou, Chongqing, Wuhan) (Kourtidis et al., 2015) and high D_AOD values over the deserts of Taklimakan and Gobi (Che et al., 2014, 2015).
Regarding the horizontal distribution of dust aerosols over South and East Asia, the main difference is attributed to the high seasonality of dust aerosol generation and transport. Moreover, the activation mechanisms of the desert regions may vary as well (Prospero et al., 2002). Asian dust emission sources in India (Thar Desert) and China (Taklimakan, Gobi) are clearly mapped through the systematic high D_AOD values throughout the year (Fig. 3b, f, j and n). The seasonality of the great Arabian Desert, the Thar Desert, and the arid regions of Ethiopia and Somalia is mainly related to the west Indian monsoon activity (Vinoj et al., 2014) and is mostly evident during the summer months (Fig. 3f). The local dust sources in the arid areas of Iran, Iraq and Afghanistan additionally contribute to the regional dust load. However, the activation mechanism of these sources is mainly related to convective episodes (Karami et al., 2017), and the contribution of these dust events to long-range transport is limited. By contrast with the desert regions of southwest Asia, the maximum activity of the Gobi and Taklimakan deserts is observed during March and May (Husar et al., 2001).
Regarding the transport of dust aerosols, the long-range transport is usually related to the activation of the major deserts (D. Liu et al., 2008). Dust aerosols emitted from the great Arabian Desert, the Thar Desert and Somalia are transported eastwards over India and the Indian Ocean reaching even the west coast of mainland Southeast Asia and Indonesia (Mao et al., 2011). The feature of dust transport over the Indian Peninsula and the Bay of Bengal is more prominent during MAM and JJA (Fig. 3f and j). The transported dust aerosols significantly contribute to the observed aerosol load over India, although the magnitude of the contribution varies with season. Over China, for latitudes north of 35∘ N, a similar pattern with respect to the features of dust contribution to the total aerosol load due to the dust aerosols emitted from the Taklimakan and Gobi deserts are observed. More specifically, a persistent dust aerosol background is evident during all seasons, with a peak during MAM (Fig. 3f). The Asian dust generated from the Gobi and Taklimakan deserts is transported over China, Korea and Japan and across the Pacific Ocean (Liu et al., 2008a). This dust belt is usually confined to between 25 and 45∘ N (Fig. 3d), extends frequently towards the western coast of north America and is most prominent during MAM (Clarke et al., 2001; Uno et al., 2009).
Regions of low AOD and D_AOD values, regardless of the season of the year, are additionally evident. Climatologically, there is little evidence of dust transport over the Himalaya orographic barrier and low AOD over the Tibetan Plateau. This is in line with previous studies, reporting rare events of dust transport over the Himalayas (Huang et al., 2007; Liu et al., 2008a; Yumimoto et al., 2009). The region to the north of Taklimakan, Gobi and Mongolia is also characterized by low values of AOD and D_AOD, except during MAM (Fig. 3f and h). The high dust aerosol load observed to the east of the major dust aerosol source of Taklimakan (D_AOD values greater than 0.3) and the high percentage of D_AOD with respect to the total AOD indicate a strong eastward transport of both dust (Fig. 3f) and anthropogenic aerosols (Fig. 3g). Similarly, the maritime region of the Pacific Ocean south of 25∘ N is also characterized by low AOD and D_AOD values, an observation which is in line with previous studies (Huang et al., 2008; Kellogg and Griffin, 2006).
Figure 4 shows the seasonal geographical distribution of dust occurrences (Fig. 4a, d, g and j), dust CoM (Fig. 4b, e, h and k) and the corresponding dust TH (Fig. 4c, f, i and l). Please note the different height scale of CoM and TH. The dust occurrences are calculated as the number of CALIPSO overpasses with dust observations, compared to the total number of CALIPSO overpasses (percentage). Both the dust CoM and TH are defined as the height in kilometres above ground level (a.g.l.). The dust occurrences, dust CoM and dust TH are provided at a spatial resolution of 1∘ × 1∘ and are based on 9 years of CALIOP observations, between January 2007 and December 2015.
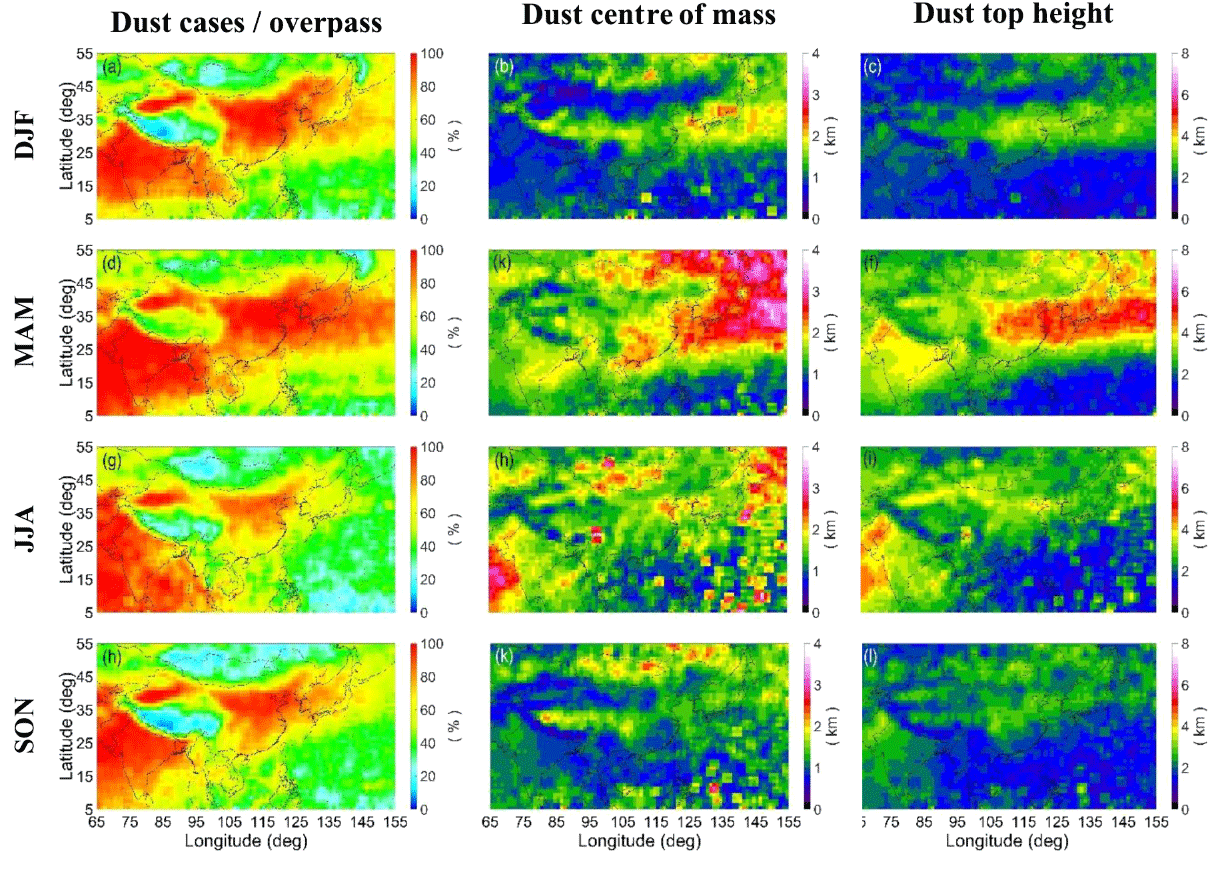
Figure 4Spatial distribution of dust occurrence (%), climatological pure-dust CoM and dust TH in km a.g.l., for each season over the domain between 65–155∘ E and 5–55∘ N for the period January 2007–December 2015.
The distribution of dust occurrences shows that over the extensive desert areas of South and East Asia (Tarim Basin, the Thar Desert, southern Mongolia and Pakistan), the presence of dust is continuously high (over 80 %) throughout the year. In the Taklimakan, Gobi and Thar deserts, similar seasonal features are observed. Based on Fig. 4, the occurrence of dust over these desert regions reaches a maximum during spring (Fig. 4d), while minimum dust activity is observed during winter (Fig. 4a). Lower frequencies of dust occurrence, which still exceed 70 %, are also evident over east China and southeastern India. Conversely, over mainland Southeast Asia and Indonesia, the occurrence of dust is particularly low, especially during summer (Fig. 4g) and autumn (Fig. 4j). More specifically, dust occurrence percentage is between 50 and 60 % over Thailand and Cambodia, 40 to 60 % over Laos and Vietnam, ∼60 % over southeast China, and lower than 40 % over Malaysia and Philippines during summer and autumn. The patterns of dust frequency are in good agreement and consistent with the distribution of dust provided by D. Liu et al. (2008), based on 1 year of CALIPSO overpasses. Another noticeable feature of Fig. 4 is the two distinct pathways which are observed: the trans-Pacific belt between 25 and 45∘ N and a second pathway over the Indian subcontinent towards the Bay of Bengal and the Arabian Sea. The observed values of dust occurrence over the major pathways decrease with increasing distance from the dust source regions. Furthermore, the distribution of dust occurrences shows that the range of dust transport is subject to high seasonality. Over the dust belt of the Pacific Ocean (25–45∘ N), values of dust occurrence vary between 30 % during summer (Fig. 4g) and 90 % during spring (Fig. 4d). To the south of the dust belt and over the Pacific Ocean, persistent low values of dust occurrence, which rarely exceed 30 %, are observed almost all year long. The low dust occurrence over the Pacific Ocean south of 25∘ N agrees with studies based on CALIPSO regarding the long-range transport of Asian dust (Huang et al., 2008; D. Liu et al., 2008).
The distributions of dust CoM and TH show that during DJF (Fig. 4b and c) dust aerosols are, in general, suppressed below 3 km height, with the CoM below 2 km. Maximum values of dust TH during DJF are observed across central and eastern China, with a peak around 3 km a.g.l. During MAM (Fig. 4e and f) a large dust belt is observed, extending from the desert regions of Taklimakan and Gobi to the east across central China and over the Pacific Ocean. Dust is advected from the deserts, which are 1.5–2 (Taklimakan) and 1–1.5 (Gobi). When dust is transported eastward over the Pacific Ocean, the above sea level distance of the layer remains constant, although due to the change of the surface elevation the absolute distance above ground level seems to increase. Thus, the observed differences in CoM and TH between land and ocean and the high values observed over the Pacific Ocean (more pronounced during MAM) are an artefact of the change in the terrain elevation. In addition, a decreasing west-to-east D_AOD gradient is observed over north China, between the dust sources over the Taklimakan and Gobi and the Pacific Ocean (Fig. 3f). The decreasing gradient of TH is less pronounced during MAM when dust aerosols are injected as high as 10 and are transported over longer distances over the Pacific Ocean (Fig. 4f). Over the Indian Peninsula and the Arabian Sea, dust CoM (TH) tends to be observed between 1–2 km (3–4 km) a.g.l., while both dust TH and dust CoM are decreasing toward the southeast and over the Bay of Bengal. The Himalaya Mountains are clearly observed as they act as a physical barrier to the transport of dust aerosols emitted from the great Arabian and Thar deserts towards the Tibetan Plateau. Another noticeable feature of Fig. 4 is that the dust aerosols observed over the Tibetan Plateau during spring are transported from the Taklimakan Desert. During MAM, dust particles emitted from the Taklimakan and Gobi deserts are transported over central China and the Pacific Ocean, while at the same time significant long-range transport of dust aerosols emitted from the Thar Desert is not observed (Fig. 4f). During JJA, however, the pattern reverses, with longer-range transport of dust particles from the Thar Desert over the Indian Peninsula, the Arabian Sea and the Bay of Bengal, while no significant dust transport of dust aerosols emitted from the Taklimakan Desert is evident (Fig. 4i). Dust CoM and TH values are higher over the Indian Peninsula and the source of the Thar Desert than over the Taklimakan and Gobi deserts. The dust TH over the Thar Desert extends to an altitude as high as 5 km a.g.l., while over the Taklimakan and Gobi deserts the corresponding altitude varies around 3.5 km a.g.l. Furthermore during JJA dust aerosols emitted from the deserts to the southwest of the Himalayas are transported over longer distances and injected into higher altitudes. The dust TH over the entire Indian Peninsula during summertime is in general around 3.5 km, gradually decreasing eastwards towards the Bay of Bengal. To the north of the Himalayas, over the Tibetan Plateau and central China large inhomogeneities in dust CoM and TH are observed. The dust belt during MAM is still evident, although the magnitude and extent of the dust transport have clearly decreased. The dust TH during JJA varies over China between 1.5 km in the coastal region and 4 km a.g.l. over central China. The season with the minimum observed dust CoM and TH values throughout the year is SON (Fig. 4k and l), with dust CoM and TH values between 1.5 and 3 km a.g.l. A regional statistics description of the dust product is provided for six regions of interest over the domain of South and East Asia in Table 1: Indian Peninsula (5–30∘ N, 65–95∘ E), Tibetan Plateau (30–36∘ N, 80–103∘ E), Taklimakan and Gobi deserts (36–45∘ N, 77–115∘ E), southeast China, North Pacific Ocean (20–45∘ N, 125–155∘ E), and the mainland Southeast Asia/Indonesia region (5–20∘ N, 95–155∘ E). Figure 1 provides a map of the selected domains while the statistical description of the dataset per domain is provided in Table 1. More specifically, Table 1 provides the mean D_AOD and SD of D_AOD, the maximum observed D_AOD value and the 95th percentile, the mean dust CoM and the SD of CoM in kilometres a.g.l., and the dust mean TH and the SD of dust TH in kilometres a.g.l. Finally the number of profiles where dust or/and polluted-dust aerosol subtypes to the total number of cloud-free profiles is included. The statistical representation of the dataset is provided per domain and per season for the period January 2007–December 2015.
Table 1Domain statistics on mean dust optical depth, max D_AOD/95th percentile, dust CoM and TH (both in km a.g.l.) and number of dust profiles to the total number of cloud-free profiles, based on the period January 2007–December 2015.
3.2 Climatological dust extinction coefficient
In this section we present and discuss the vertical distribution of dust aerosols in the atmosphere over South and East Asia; thus, we present and discuss the vertical dimension of the 3-D dust distribution and transport. The derivation of a pure-dust product from CALIOP is of particular importance particularly for the densely populated areas of India and China where a significant percentage of the overall observed AOD is related to dust. The term climatological refers to the computation process, where the mean pure-dust extinction coefficient value is computed based on the cases where dust aerosols are detected, while the extinction coefficient of non-dust aerosol types is assigned to 0 M m−1. Therefore, the zonal vertical distributions discussed in this section correspond to the horizontal distribution of the D_AOD presented in Sect. 3.1.
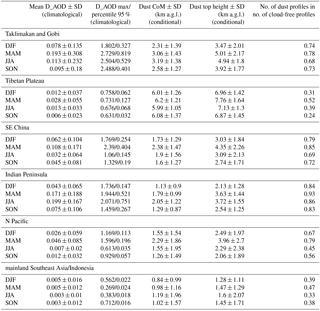
The domain of interest, between 5 and 55∘ N, is divided into five 10∘ longitudinal bands. Based on 9 years of CALIPSO observations (January 2007–December 2015), Fig. 5 shows the vertical distributions of the dust climatological extinction coefficient (M m−1) for the four seasons winter (DJF), spring (MAM), summer (JJA) and autumn (SON). The surface elevation of the area is denoted with black colour in the plots (below the minimum elevation, the contour plots are black). The continuous and dashed lines correspond to the average elevation of the surface level and to the average maximum elevation respectively. A threshold of four dust cases is applied to the computation process of the pure-dust climatological extinction coefficient (arbitrarily selected) in order to avoid presenting extremely rare events at high altitudes at the same time as climatological values close to the surface level.

Figure 5Zonal distribution of the climatological dust extinction coefficient (Mm−1) profiles for the regions with longitude from 65 to 155∘ E and latitudes 45 to 55∘ N (a–d), 35 to 45∘ N (e–h), 25 to 35∘ N (i–l), 15 to 25∘ N (m–p), and 5 to 15∘ N (q–t); profiles are presented as 3-month averages: December–January–February (a, e, i, m, q), March–April–May (b, f, j, n, r), June–July–August (c, j, k, o, s) and September–October–November (d, h, l, p, t). The minimum terrain elevation is denoted with black colour. The black continuous (dashed) line refers to the mean (max) elevation of the surface.
The north of the study domain, i.e. the region between 45 and 55∘ N (Fig. 5a–d), is characterized by relatively low values of dust extinction coefficient. Dust layers are relatively homogeneous and constrained to below 4 The dust climatological extinction coefficient values are in general below 25 M m−1. The highest values in this region, as high as 35 M m−1, are observed during winter over the Manchurian Plain (120–135∘ E) and extend as high as 5 (Fig. 5a).
To the south of this region, the Taklimakan and Gobi deserts (77–115∘ E) are the dominant land characteristics of the domain between 35 and 45∘ N (Fig. 5e–h). Over this belt dust is ubiquitously present close to the surface throughout the year. The Taklimakan Desert consists of a very arid area encompassed by the Tarim Basin. Due to the local topography of the Tarim Basin and the cyclonic systems generated over the Mongolian Plateau (Sun et al., 2001; Gong et al., 2006), the Taklimakan Desert is active throughout the year (Liu et al., 2008a). Over this region, favourable topographic and meteorological conditions form an elevated layer of dust aerosols where climatological dust extinction coefficient values greater than 100 M m−1 are regularly observed. The vast semi-arid region to the east of the Tarim Basin, the Gobi, is considered an additional source of Asian dust. Although the Tarim Basin is the primary source of Asian dust to the north of the Tibetan Plateau, values of climatological dust extinction coefficient as high as 100 M m−1 close to the surface of the Gobi are present throughout the year. During the period between March and May the strong surface winds which develop over the Mongolian Plateau create favourable mechanisms of extreme dust events (Bory et al., 2003; Yu et al., 2008). More specifically, the maximum dust climatological extinction coefficient values over all of South and East Asia are observed over the region of the Taklimakan Desert during spring, reaching values as high as 200 M m−1 (Fig. 5f). Although the dust layer is mostly observed between 1.5 and 4 , during MAM dust aerosol layers are detected as high as 9 km a.s.l. The observed features of dust transport are consistent with the values of dust height reported in the literature (Huang et al., 2008; Eguchi et al., 2009). The elevated dust layers are captured by the strong westerly jet in the upper troposphere and accordingly transported eastwards across the mainland of China (Zhang et al., 2003) and the Pacific Ocean (Duce et al., 1980; Shaw, 1980). This feature is evident throughout the year, although more pronounced during spring. The maximum height of dust transport also varies significantly with season. Moving from the Taklimakan Desert towards the coastline and over the Pacific Ocean, the highest altitude where dust layers are observed decreases from 8 over the Taklimakan Desert to less than 2.5 over the Pacific Ocean. The decrease in the altitude of transport of the dust layers is attributed to both dry and wet deposition processes that remove dust aerosols from the atmosphere (Colarco et al., 2003). This characteristic is evident through the steep decrease across the coastline and over the Yellow Sea and the Pacific Ocean, although during MAM a lofted layer of dust aerosols that yields climatological extinction coefficients up to 25 M m−1 is observed up to 10 (Fig. 5f). Close to the surface, over the densely populated and highly industrialized provinces of eastern China, a persistent dust layer with climatological extinction coefficient values as high as 100 M m−1 is observed throughout the year.
The region between 25 and 35∘ N, hence the area to the south of the dust belt which encompasses the deserts of Taklimakan and Gobi, is the domain of Asia which is heavily affected by the Himalaya orographic barrier and the Tibetan Plateau (Fig. 5i, j, k and l). Dominant sources of dust aerosols in this area are the Thar Desert and the Arabian Peninsula to the west of the Himalayas, while to the south lies the densely populated Indian subcontinent. Over the Thar Desert dust is ubiquitously present throughout the year, although the magnitude of dust activity is characterized by high seasonality. During the dry season, between March and May, an elevated layer of dust aerosols forms in the lower altitudes over Afghanistan, Pakistan and the western part of India (Fig. 5j). Typical values of dust climatological extinction coefficient are around 100 M m−1 and high concentrations of dust are observed close to the surface, although airborne dust is also frequently observed as high as 4 . Significantly higher dust climatological extinction coefficient values, as high as 200 M m−1, are observed over the Thar Desert during the summer season (Fig. 5k). Although the dust layer is primarily observed between the surface and 2.5 km altitude, during JJA elevated layers of dust are detected over the sources at altitudes as high as 7 km. The elevated layer of dust is accordingly transported eastwards, over the highly industrialized and densely populated Indo-Gangetic plains, where dust interacts with locally generated aerosol particles (Middleton, 1986). Due to the gravitational settling and to wet deposition (Colarco et al., 2003), significantly lower values are recorded southeast of the dust sources, over the Indian subcontinent. The observed dust climatological extinction coefficient values range between 50 and 100 M m−1 over the Indo-Gangetic plains and the foothills of the Himalayas. Dust climatological extinction coefficient values of 25 M m−1 indicate the advection and presence of dust aerosols even as high as the Tibetan Plateau and the Himalayas. The observations regarding the vertical structure of dust over this domain support the elevated heat pump hypothesis (Lau et al., 2006) of the accelerating Himalayas warming (Liu and Chen, 2000; Thompson et al., 2003) due to the presence of dust aerosols coupled with black carbon over the Tibetan Plateau. Significantly lower values, between 25 and 75 M m−1 are observed to the east of the Himalayas. The decrease in the dust climatological values over the Tibetan Plateau is less pronounced during MAM when the Taklimakan and Gobi deserts to the north of this domain are characterized by maximum dust activity (Fig. 5j). Additionally, throughout the year, a steep decrease in the dust climatological extinction coefficient close to the coastline and the Pacific Ocean is evident. Over southeast China the values close to the densely populated surface are persistently higher than 45 M m−1, while over the Pacific Ocean the dust climatological extinction coefficient values are decreased to less than 10 M m−1.
The domain between 15 and 25∘ N encompasses the largest part of India and of the countries of mainland Southeast Asia and maritime southeastern Asia (Fig. 5m, n, o and p). This domain is characterized by large inhomogeneities. High values of dust climatological extinction coefficient are observed over India and the Arabian Sea (as high as 100 M m−1), especially during MAM and JJA, and lower values (Fig. 5n and o; below 50 M m−1), during SON and DJF (Fig. 5p and m). Over the Bay of Bengal the dust climatological extinction coefficient values are drastically decreased compared to mainland India, and values around 25 M m−1 are frequently encountered. The steep decrease over the Bay of Bengal during MAM and JJA is most probably caused by wet deposition of dust aerosol particles due to the heavy monsoon rainfall (Lau et al., 2006).
Similar patterns are observed in the domain between 5 and 15∘ N, although the features vary in magnitude (Fig. 5q, r, s and t). Over the Arabian Sea, to the south of 15∘ N, values of dust climatological extinction coefficient between 75 and 100 M m−1 are observed during MAM and JJA (Fig. 5r and s). Over south India during JJA, elevated dust is present at altitudes as high as 5 , while over the Bay of Bengal the monsoon effect is observed through the steep decrease in the dust climatological extinction coefficient values (Fig. 5s), as a result of the wet deposition of aerosols. Values consistently below 25 M m−1 are observed over the Indonesia region throughout the year.
3.3 Conditional dust extinction coefficient
In this section we present and discuss the intensity of the dust events and the purity of dust aerosols in the atmosphere over South and East Asia (three-dimensional). In order to investigate the intensity of the dust events, the dust conditional extinction coefficient parameter is used, as defined in Sect. 2. The vertical distributions of the dust conditional extinction coefficient and the corresponding conditional depolarization ratio are presented in Figs. 6 and 7 respectively. More specifically, Fig. 6 shows the seasonal vertical distribution of the dust conditional extinction coefficient (M m−1) for 9 years of CALIPSO observations (January 2007–December 2015) and for the five zones of 10∘ latitudinal interval between 5 and 55∘ N. The vertical structure of the atmosphere is shown for altitudes higher than the average surface elevation of the CALIPSO orbits during the 9-year period between January 2007 and December 2015. The continuous and dashed lines correspond to the average elevation of the surface level and to the average maximum elevation of the surface level respectively.
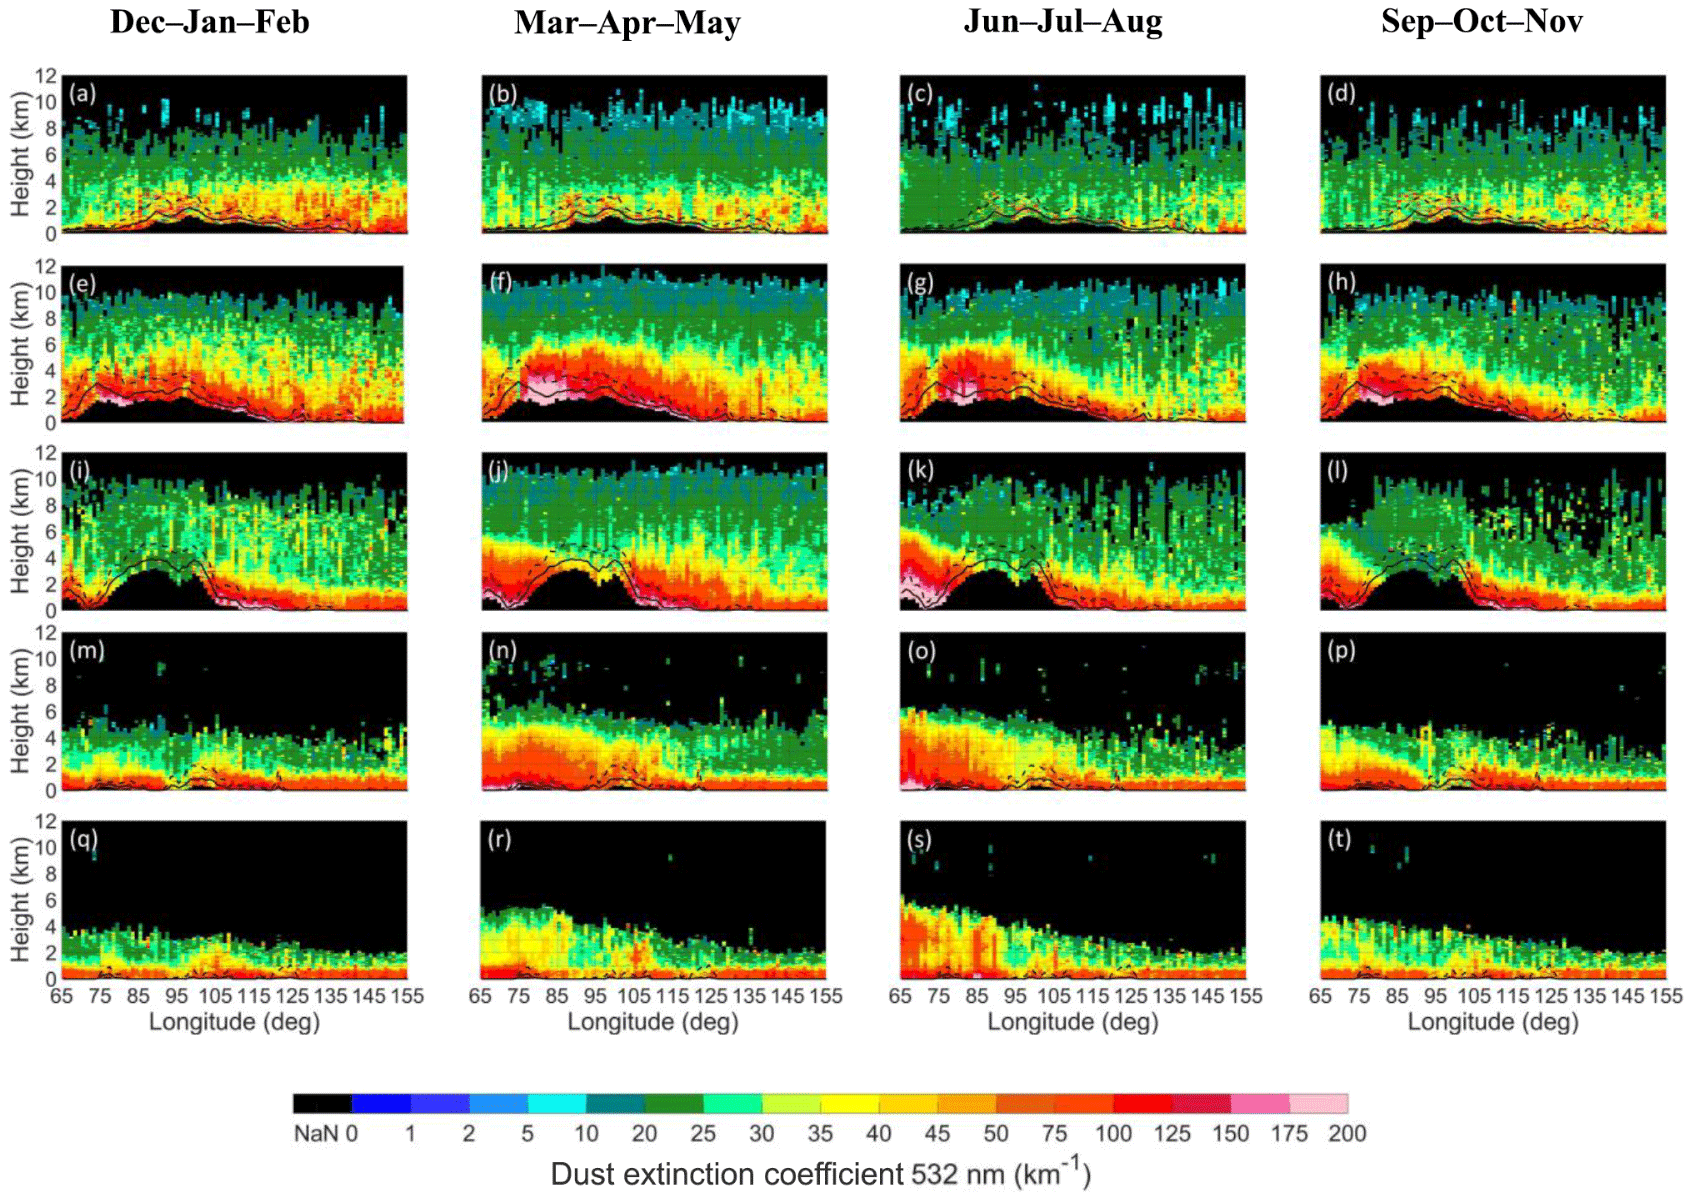
Figure 6Zonal distribution of the conditional dust extinction coefficient (Mm−1) profiles for the regions with longitude from 65 to 155∘ E and latitudes 45 to 55∘ N (a–d), 35 to 45∘ N (e–h), 25 to 35∘ N (i–l), 15 to 25∘ N (m–p), and 5 to 15∘ N (q–t); profiles are presented as 3-month averages: December–January–February (a, e, i, m, q), March–April–May (b, f, j, n, r), June–July–August (c, j, k, o, s) and September–October–November (d, h, l, p, t). The minimum terrain elevation is denoted with black colour. The black continuous (dashed) line refers to the mean (max) elevation of the surface.
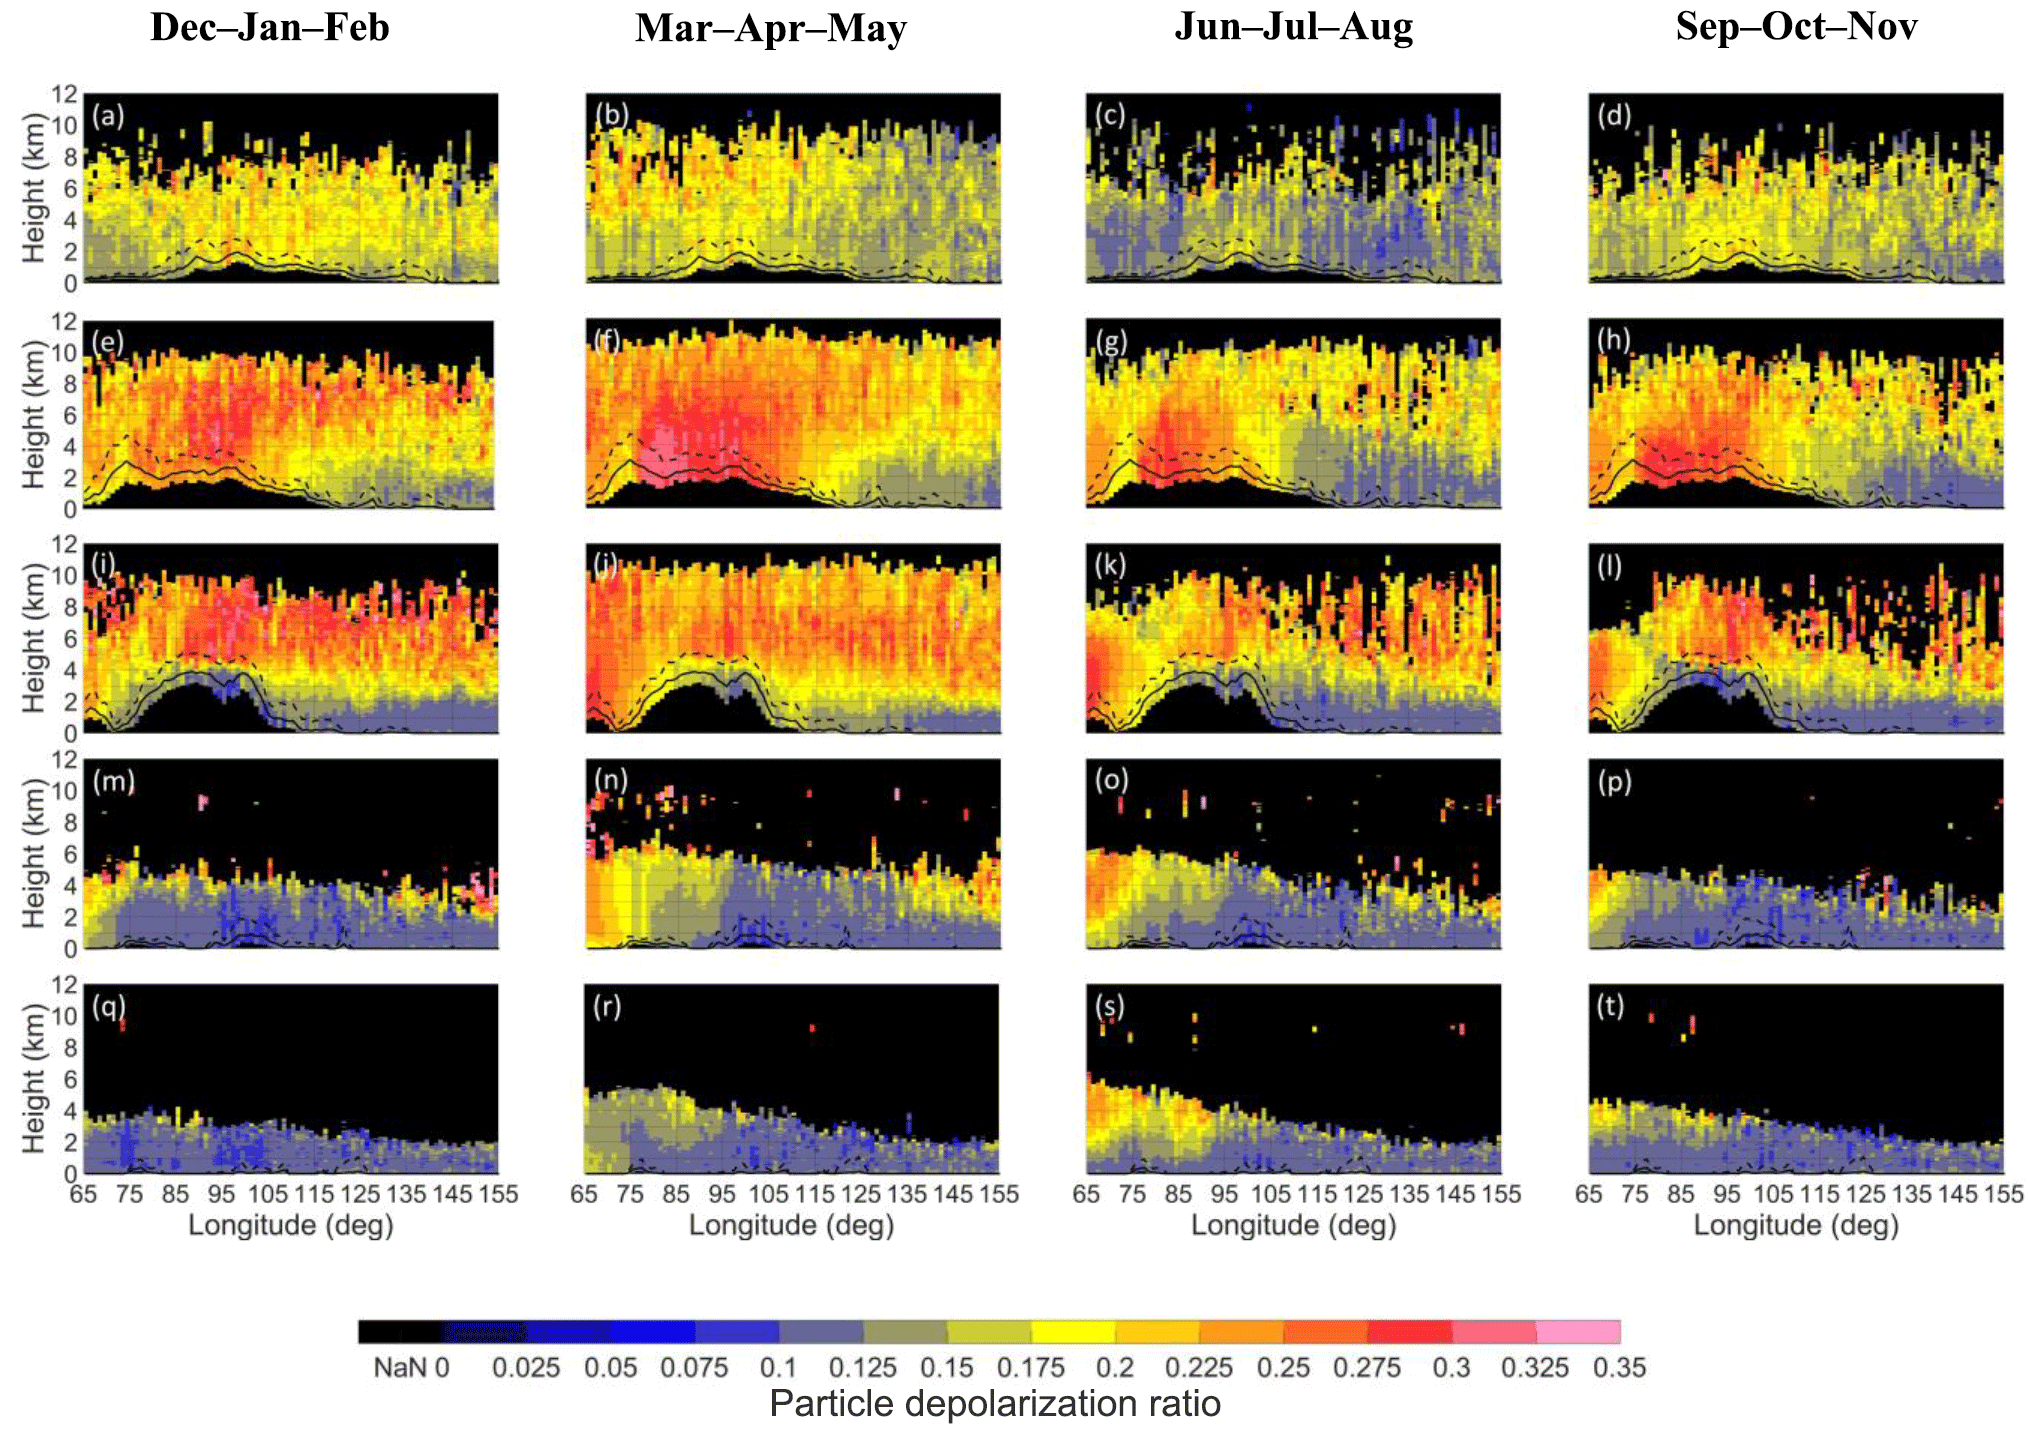
Figure 7Zonal distribution of the conditional dust depolarization ratio profiles for the regions with longitude from 65 to 155∘ E and latitudes 45 to 55∘ N (a–d), 35 to 45∘ N (e–h), 25 to 35∘ N (i–l), 15 to 25∘ N (m–p), and 5 to 15∘ N (q–t); profiles are presented as 3-month averages: December–January–February (a, e, i, m, q), March–April–May (b, f, j, n, r), June–July–August (c, j, k, o, s) and September–October–November (d, h, l, p, t). The minimum terrain elevation is denoted with black colour. The black continuous (dashed) line refers to the mean (max) elevation of the surface.
Distinct sources of dust generation, where dust conditional extinction coefficient values exceed 200 M m−1 are revealed. High values of dust conditional extinction coefficients indicate that the Taklimakan and Gobi deserts are the most dominant sources of dust aerosols to the north of the Tibetan Plateau. To the east of the orographic barrier of the Himalayas, the major source of dust generation is the Thar Desert. In addition to the natural sources, regions of dust emissions related to anthropogenic activities are also evident. As seen in Fig. 6, values that exceed 100 M m−1 are observed throughout the year over the highly industrialized and densely populated regions of southeast China and over the Indian subcontinent. In the northern part of China, however, the near-surface dust emissions to the west of the Tarim Basin most probably represent a mixture of Gobi and anthropogenic dust emissions. These features are consistent with the observation that close to the sources of dust generation, the conditional extinction coefficient values are of the same magnitude as the climatological coefficient values.
Although the spatial and seasonal features between the observed conditional and climatological values are highly consistent, two major differences are evident: (1) the climatological values become significantly lower than the conditional values with increasing distance from the sources of dust; and (2) the conditional values observed in the upper troposphere are significantly higher than the climatological values. The differences are attributed to the difference between the definitions of the dust conditional and climatological products. The dust climatological product is related to the contribution of the dust load to the total aerosol load. By contrast, the dust conditional coefficient product exclusively describes the dust events. As a consequence, areas of rare dust events in general yield low climatological extinction coefficient values. This makes the conditional coefficient value an ideal parameter in order to realistically describe and study the routes of transport of the dust plumes.
To the north and east of the Tibetan Plateau two distinct eastward pathways of dust transport are observed: (1) a northern flow that propagates from the Taklimakan and Gobi towards the Yellow Sea and the Pacific Ocean (Uno et al., 2009) and (2) a southern flow that occurs over central China (Kuhlmann and Quaas, 2010). The northern flow is mostly evident during winter (Fig. 3d), while the southern transport pathway over central China is more prominent during spring (Fig. 3h). Figure 6 provides information on the vertical distribution and depth of the two dust transport pathways. Both transport pathways are observed in the middle and upper troposphere, indicated by dust conditional coefficient values as high as 20 M m−1, observed at an altitude up 10 Another noticeable feature is that the vertical intensity of the transported dust aerosol plumes is subject to high spatial and seasonal variability. Decreasing values of both dust aerosol climatological and conditional values are observed with increasing distance from the dust sources of the Taklimakan and Gobi deserts towards and over the Pacific Ocean.
To the south and west of the Tibetan Plateau dust transport that originates from the Arabian Peninsula and the Thar Desert and propagates towards the Indian subcontinent (Gautam et al., 2009) and the Indian Ocean is observed. The maximum altitude and intensity of the flow of dust aerosols originating from the northwest part of India is subject to high seasonal oscillation. During the period between May and August dust events yield values of dust extinction coefficient as high as 200 M m−1 over the source of the Thar Desert. The layer of dust over the Indian subcontinent during this period exceeds the altitude of 5 , while during the period between September and May the dust aerosols are constrained to lower than 4 Over Indonesia, mainland Southeast Asia and the Bay of Bengal, the dust aerosol layer is well-confined within the first 4 throughout the year, with dust extinction coefficient values up to 30 M m−1 for heights greater than 1 In the first kilometres above sea level, we see relatively high values that regularly exceed 40 M m−1. These values are affected by the selection of the particle depolarization ratio of the non-dust aerosols in our dust-separation methodology (as discussed in the “Data and methodology” Section). In this method, we selected the most dominant value for the depolarization of the non-dust aerosols (optimal for anthropogenic and marine cases). Furthermore, under specific conditions the particle depolarization ratio of dry marine aerosols can exceed these values, reaching up to 0.1, especially close to the top of the marine boundary layer (Haarig et al., 2017). By using the generic non-dust depolarization of 0.03, we have to recognize a bias in the marine boundary layer, extinction values up to 50 % of the mean values of the conditional dust product.
The depolarization ratio is an ideal intensive parameter for the discrimination between spherical and non-spherical aerosols, hence for the classification of dust aerosols (Omar et al., 2009). Values of the particle depolarization ratio at 532 nm that exceed 30 % denote the presence of pure-dust aerosols (Liu et al., 2008b), while lower values that range between 10 and 30 % suggest a mixture of dust with more spherical aerosols (Murayama et al., 2003; Tesche et al., 2009). Therefore, the depolarization ratio is used here as an indicator in order to describe the state of the dust mixture and as a discriminator between pure-dust and polluted-dust cases.
Figure 7 shows the vertical, horizontal and seasonal variability in the average particle depolarization ratio of the cases classified by CALIOP as dust or polluted-dust aerosol subtypes based on 9 years of CALIPSO observations (January 2007–December 2015) and for five zones of 10∘ latitudinal interval, between 5 and 55∘ N. The vertical cross sections of the mean depolarization ratio correspond to the dusty CALIPSO observations (dust and polluted-dust cases) and hence correspond to the dust conditional extinction coefficient parameter described above (Fig. 6). Based on Fig. 7, dust depolarization ratio values between 30 and 35 % are regularly observed over the Taklimakan, Gobi and Thar deserts throughout the year. Intermediate depolarization ratio values, between 25 and 35 %, are observed close to the dust sources, while even lower values, between 10 and 25 %, are evident over the densely populated and highly industrialized regions of southeast China and India and over the remote domains of Indonesia and mainland Southeast Asia.
In general, to the north of the Himalayas, low values of particle depolarization ratio are observed close to the surface, while the particle depolarization ratio increases with increasing height (Fig. 7e–h). The low dust depolarization ratio values observed over the densely populated and highly industrialized regions suggest the occurrence of a mixture of non-spherical aerosols with particles of anthropogenic origin (Heese and Wiegner, 2008). Conversely to the aerosol layers close to the urban or industrial regions, the elevated layers over China and India are characterized by intermediate dust depolarization ratio values, from about 15 to 25 %. The higher values of dust depolarization ratio in the middle and upper troposphere compared to the lower troposphere are consistent with the characteristics of dust transport. More specifically, to the north of the Tibetan Plateau, between 25 and 45∘ N, three ranges of dust depolarization ratio are observed. The air masses below 2 km altitude are characterized by significantly low dust depolarization ratio values, in general below 15 %. The observed low values are most probably the effect of anthropogenic emissions coupled with near-surface dust aerosols. The altitudinal range between 2 and 4 km height is characterized in general by depolarization ratio values greater than 15 %, which, however, rarely exceed the value of 20 %. The third elevated layer, above about 4 km, is characterized by depolarization ratio values greater than 20 %. The dust layers between 2 and 4 km height and above 4 km height have been observed and identified as dust aerosol layers with different origin, from the Gobi and Taklimakan deserts respectively (Kwon et al., 1997; Matsuki et al., 2003).
To the west of the Tibetan Plateau, between 25 and 35∘ N, the Thar Desert is located. Over the Thar Desert the average particle depolarization ratio of cases classified as dust or polluted dust by the CALIPSO classification algorithm yield average depolarization values greater than 25 % throughout the year. Average depolarization values of the dust cases (dust or polluted dust) that exceed 30 % are observed during JJA when Thar dust activity is at its maximum (Fig. 7k). The elevated layer of dust is accordingly transported eastwards, over the highly industrialized and densely populated Indo-Gangetic plains. The interaction of dust aerosols with locally generated aerosol particles (Middleton, 1986) is evident through the decrease in the dust depolarization ratio over the Indian subcontinent. The observed depolarization ratio values range between 15 and 20 % over the Indo-Gangetic plains and the foothills of the Himalayas (Fig. 7i–l). Furthermore, dust depolarization ratio values observed to the west of the Himalayas are typically larger than the values observed over the eastern Himalayas and over the Tibetan Plateau. The observed intermediate values of dust depolarization ratio values at the windward slopes of the Himalayas are consistent with the elevated heat pump hypothesis (Lau et al., 2006), which considers the accelerating Himalayas warming to be the effect of accumulation of dust aerosols coupled with black carbon over the Tibetan Plateau.
The average particle depolarization ratio of cases classified as dust or polluted dust by the CALIPSO classification algorithm over mainland Southeast Asia and Indonesia is significantly different from the corresponding depolarization ratio features observed over China and India (Fig. 7m–t). The dust depolarization values to the south of the Tibetan Plateau and to the east of the Indian subcontinent are in general below 15 %, indicating that the dust aerosols are coupled with natural and anthropogenic emissions.
3.4 Temporal evolution of AOD and D_AOD
In this section, the CALIPSO AOD and D_AOD time series, based on 9 years of overpasses, are presented and discussed. In addition to the CALIPSOCALIOP AOD and D_AOD trends, Aqua MODIS AOD trends for the same period (January 2007–December 2015) are presented. The short-term trends in this paper are calculated through the method originally proposed by Weatherhead et al. (1998). The applied method has been widely used to examine the trends in trace gasses, aerosols and surface solar radiation (e.g. De Smedt et al., 2010; de Meij et al., 2012; Pozzer et al., 2015; Georgoulias et al., 2016; Alexandri et al., 2017). Monthly satellite-based time series are fitted by using a model with a linear trend and a Fourier-based seasonal component for the annual cycle. According to the method, the calculated trend (ω) is statistically significant at the 95 % confidence level if the absolute value of the ratio of ω to its precision (σω) is greater than 2 (). The approach followed here is extensively described in Alexandri et al. (2017).
Figure 8 shows the short-term trends in CALIOPCALIPSO and Aqua MODIS over South and East Asia for the period January 2007–December 2015. Aqua MODIS AOD trends were calculated from the C6 DTDB (Collection 6 Dark Target Deep Blue) merged AOD dataset and are presented in Fig. 8b. For computing the CALIOPCALIPSO AOD trends, the methodology includes additionally a spatial expansion of each grid, in order to increase the accuracy and representativeness of each AOD value in the sequence of the monthly mean CALIOPCALIPSO time series. The mean optical depth value per month is computed based not only on each grid but additionally on the corresponding eight surrounding neighbour grids. Finally the methodology proposed by Weatherhead et al. (1998) is applied to examine the statistical significance of CALIOPCALIPSO AOD (Fig. 8a). On the trend plots the “+” symbol denotes trends statistically significant at the 95 % confidence level. Negative trends are shown in blue, while red colour indicates positive trends. In addition to the short-term trends the mean Aqua cloud fraction (Fig. 8d) and the number of months used in the CALIPSO time series (Fig. 8c) are shown.
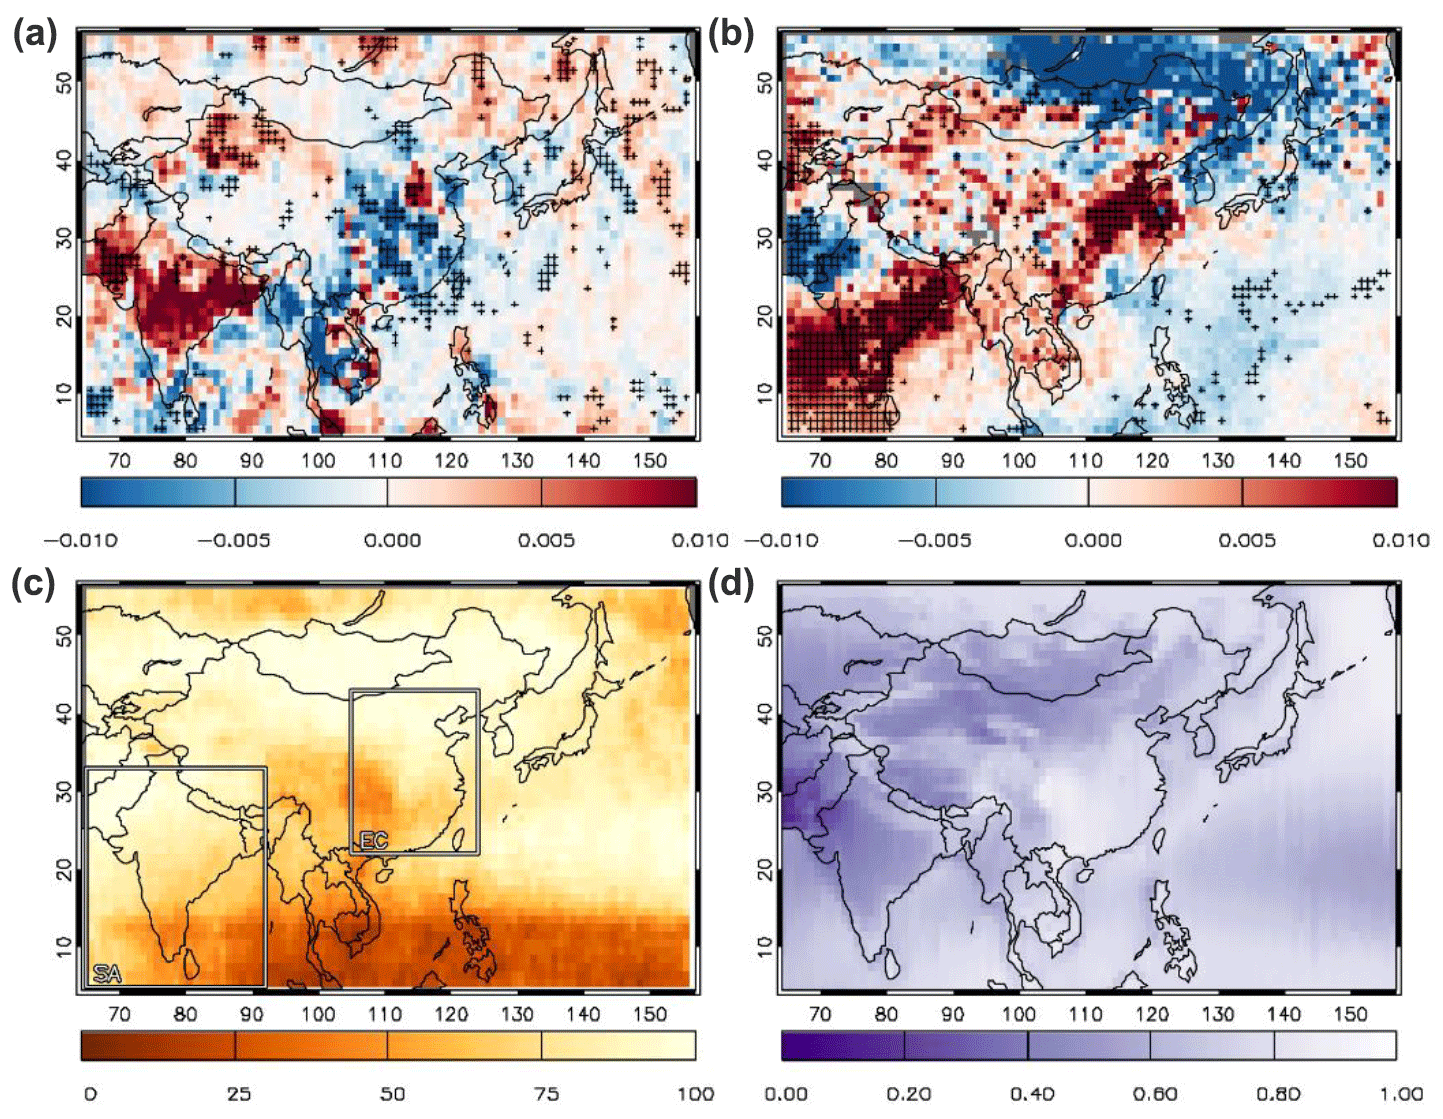
Figure 8Trends in Aqua MODIS and CALIOPCALIPSO AOD at 532 nm over South and East Asia for the period January 2007–December 2015: CALIOPCALIPSO trends in AOD at 532 nm (a) and the number of months used in the CALIOPCALIPSO time series (c); Aqua MODIS C6 AOD at 550 nm trends in DTDB merged datasets (b) and mean cloud fraction (d). Symbol “+” denotes trends statistically significant at the 95 % confidence level.
Regarding China, CALIOP shows significantly positive AOD trends over the northwest and eastern provinces whereas negative statistically significant trends are mostly found over the southeastern provinces. MODIS shows statistically significant positive AOD trends over northwest, central and eastern China, whereas over northeast China AOD trends are mostly positive. More specifically, both CALIOP and MODIS sensors quantitatively agree on a statistically significant increase at the 95 % confidence level over Xinjiang (0.007 yr−1) and Hebei (0.01 yr−1) provinces. Towards central China and the Tibetan Plateau, differences are observed between CALIOP and MODIS. Over the broader Tibetan Plateau, low positive trends are shown by MODIS, while no trends is found by CALIOP. However, the disagreement over the region of the Tibetan Plateau (Tibet; Qinghai, Gansu and Yunnan provinces) is not relevant considering both the absence of statistical significance and the small magnitude of the AOD trends. Larger differences between the MODIS and CALIOP short-term trends are detected over southeast China. MODIS shows a strong significant increase in AOD (0.01 yr−1), whereas significantly decreasing AOD trends are visible by CALIOP (−0.007 yr−1). Over the Indian Peninsula, MODIS and CALIOP trends qualitatively agree over the 9-year period in most regions. Positive AOD trends (0.01 yr−1) are found by both sensors over the broader central and eastern Indian Peninsula, although disagreements are observed over the western regions of India. The AOD trends in CALIOP and MODIS are very similar over land, while over ocean (Arabian Sea, Bay of Bengal), discrepancies are observed. MODIS shows increasing and statistically insignificant AOD trends of the order of 0.002 yr−1 over the Bay of Bengal and strong positive, statistically significant trends over the Arabian Sea (0.01 yr−1). The strongly increasing AOD trend over the Arabian Sea, however, is not corroborated by CALIOP observations. The observed trends from CALIOP and MODIS should be interpreted and compared with caution, since the observed discrepancies between MODIS and CALIOP AOD short-term trends may be attributed to several aspects such as the different measurement principles and sampling of the two sensors, among others. Differences between the two sensors have been reported in the literature (Redemann et al., 2012).
Three domains of interest are selected to perform regional analysis on the CALIPSO AOD and D_AOD time series: South and East Asia (5–55∘ N, 65–155∘ E), eastern China (22–43∘ N, 105–124∘ E), and South Asia (5–33∘ N, 65–91∘ E). Figure 9 shows the linear trends in D_AOD (panels a, c and e) and AOD (panels b, d and f) for the selected domains. The continuous black lines represent the seasonal variability between January 2007 and December 2015, while the dashed (straight) lines depict statistically significant (statistically non-significant) trends. The scatter points in grey denote the monthly mean D_AOD and AOD values over the selected areas, while estimated trends (1 yr−1) and changes in D_AOD and AOD with respect to 2007 (% yr−1) are also shown.
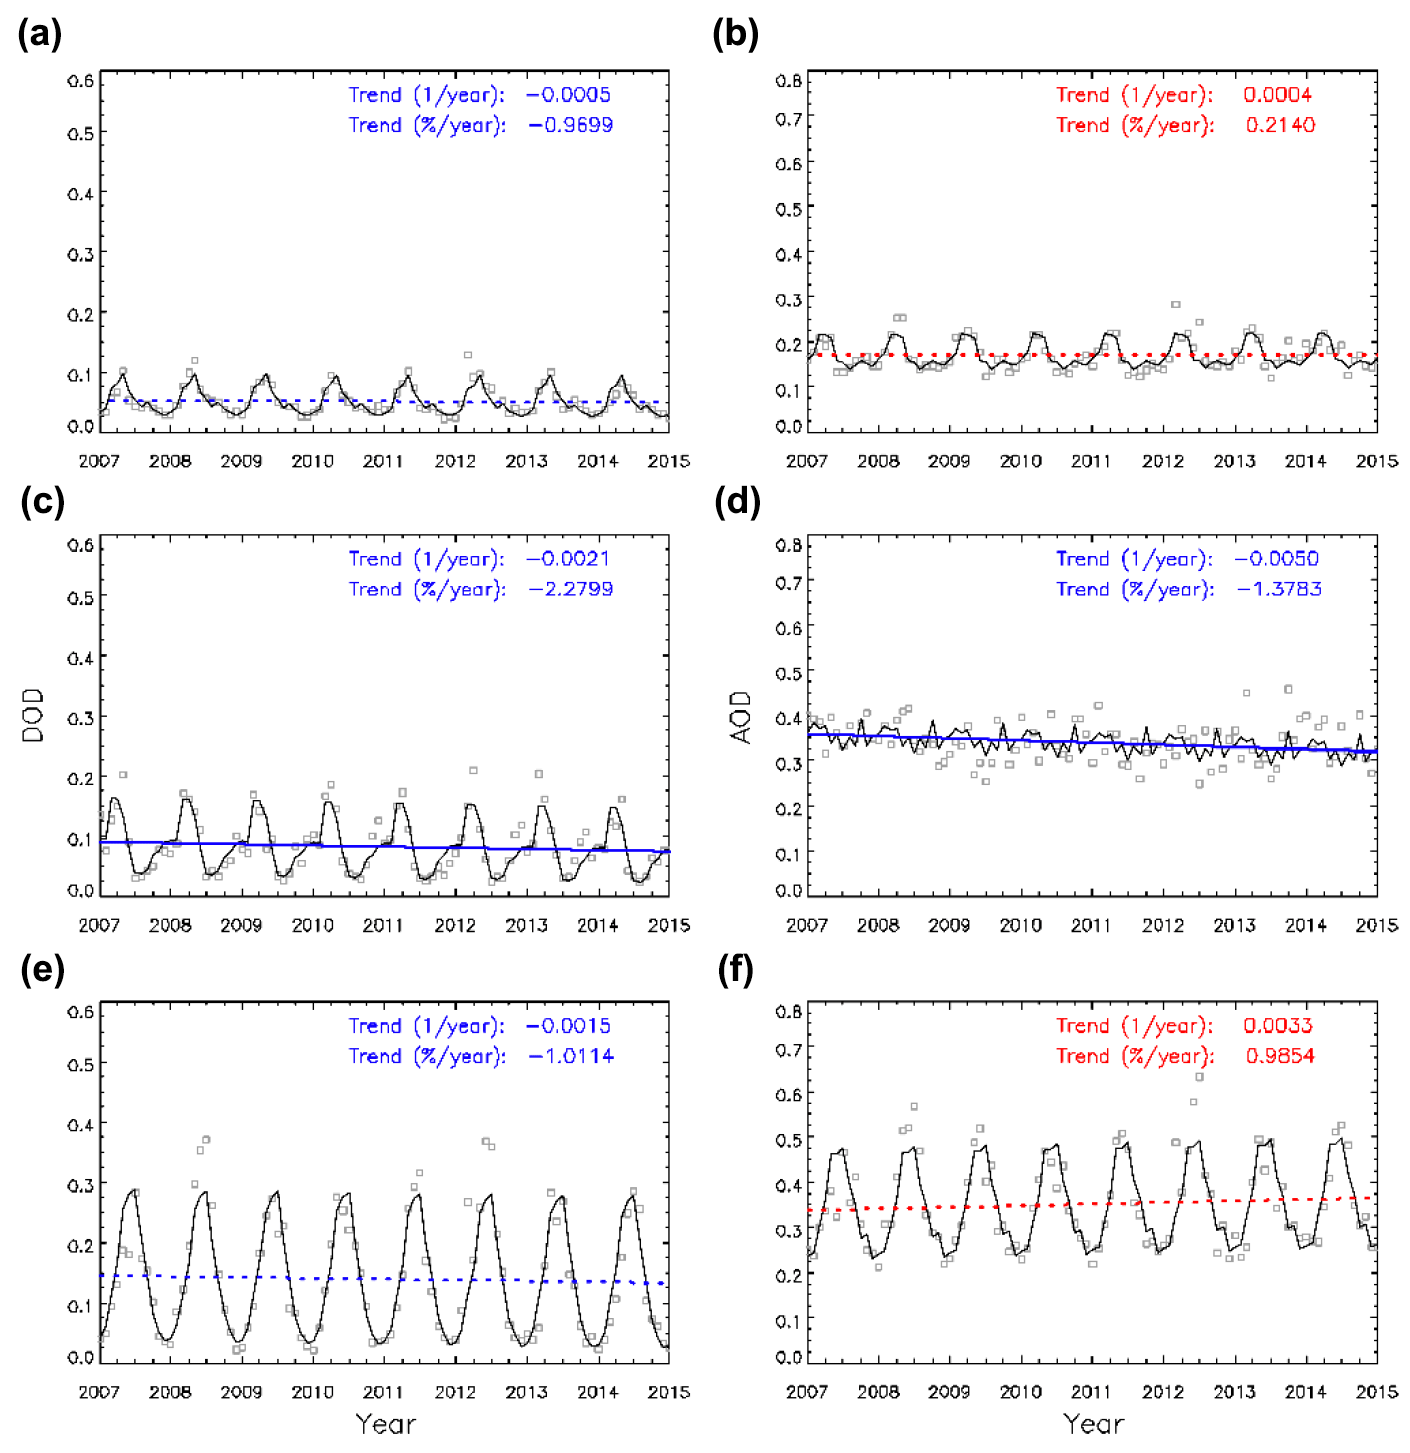
Figure 9Short-term time series of CALIPSO∕CALIOP AOD and D_AOD over South and East Asia (AS), eastern China (EC) and of South Asia (SA) based on observations during the period January 2007–December 2015. The dashed lines show the multi-annual trend line while the continuous black lines depict the seasonal variability. The trends are in units of 1 year−1 and % year−1 relative to 2007.
Focusing on the selected domains, over South and East Asia the D_AOD trend is negative (), while despite the decreasing D_AOD trend, the AOD trend is slightly positive (). Both the D_AOD and AOD trends over South and East Asia, however, are not statistically significant. In contrast to the South and East Asia region, the observed AOD trend over eastern China is statistically significant and negative ( % yr−1). Similar to the AOD, the region of eastern China presents a statistically significant, negative D_AOD trend ( % yr−1). The negative AOD trend observed over eastern China is in line with the air quality regulations and the applied policies promoting the reduction in emissions over China. Van der A et al. (2017) report on the decrease in aerosol precursor gases (SO2, NO2) based on OMI, SCIAMACHY (Scanning Imaging Absorption Spectrometer for Atmospheric Cartography) and GOME-2 (Global Ozone Monitoring Experiment) satellite observations, while Yoon and Pozzer (2014) report on the decrease in biomass-burning-related emissions. The decline in AOD over China is additionally observed by several authors (Kang et al., 2016; Zhang et al., 2017), with the suggested pivot point around 2011 (Zhao et al., 2017). The negative AOD trend over southeastern China is further enhanced due to the negative D_AOD trend, which in turn can be attributed to the positive precipitation trend over southeastern China and the increase in dust aerosol deposition (Pozzer et al., 2015). Focusing on the South Asia region, however, similar behaviour to that over South and East Asia is observed. South Asia is characterized by not statistically significant, decreasing D_AOD trends ( % yr−1). In contrast, due to the increasing emissions of India, which is developing quickly, the observed AOD trend is positive ( % yr−1, not significant).
In this work, CALIPSO is used to provide a multiyear 4-D climatology of desert dust aerosols over South and East Asia at a spatial resolution of 1∘ × 1∘ grids. An optimized dust aerosol product, developed using CALIOP backscatter and a particle depolarization ratio, along with a regional correction on the dust lidar ratio suitable for Asian dust is used. The optimized product is utilized to provide the horizontal and vertical distribution along with the temporal evolution of dust aerosols over a 9-year period (January 2007–December 2015).
Regarding the horizontal distribution of AOD, D_AOD and non-dust AOD, our analysis shows similar patterns between all four seasons, although the magnitude of the observed features varies with season. High values of non-dust AOD are consistently observed over the heavily industrialized and densely populated regions of China and India (non-dust AOD >0.5). In addition to the anthropogenic emissions from the densely populated areas of South and East Asia, the major sources of dust aerosols, namely the Taklimakan, Gobi and Thar deserts are clearly mapped through the systematic high D_AOD values throughout the year. However, the magnitude of the D_AOD observed features is subject to high seasonality, ranging between D_AOD 0.2 during winter and more than 0.6 during spring and summer seasons. The maximum activity of the Gobi and Taklimakan deserts is observed during spring, while the highest activity of the Thar Desert is observed during summer. The seasonality of the dust transport pathways is additionally well-captured. Dust transport over the Indian Peninsula is more pronounced during spring and summer, while over China similar patterns of a persistent dust aerosol background are evident throughout the year, with a peak during spring when the dust transport across the Pacific Ocean is at its maximum.
Regarding the vertical distribution of dust aerosols, the CoM, TH and the mean dust extinction coefficient profiles (climatological and conditional), together with the horizontal distribution, are used to provide the full three-dimensional structure of dust aerosols and the atmospheric dust transport pathways over all of South and East Asia. Based on the synergy of CoM, TH and the CALIPSO dust extinction profiles, two distinct dust transport pathways over South and East Asia are revealed: a trans-Pacific belt between 25 and 45∘ N and a second pathway, extending from the Thar Desert towards the Bay of Bengal and the Arabian Sea. Both zones of dust transport are subject to high seasonality. The highest dust aerosol transport from the Taklimakan Desert towards the Pacific Ocean is observed during spring, while dust aerosol transport from the desert of Thar and across the Indian subcontinent is more pronounced during summer.
Regarding the temporal evolution of AOD and D_AOD between January 2007 and December 2015, the analysis showed statistically significant positive short-term AOD trends over the Indian Peninsula (0.01 yr−1), NW China (0.007 yr−1) and E China (0.01 yr−1), whereas our study shows negative short-term AOD trends over southeast China (−0.007 yr−1). CALIPSO-based positive AOD trends are found over the broader central and eastern Indian Peninsula (0.01 yr−1). The CALIOP observed trends between January 2007 and December 2015 are generally in qualitative agreement with the derived MODIS AOD trends over large domains of South and East Asia, although the short-term trends disagree over specific regions. The CALIOP and MODIS trends, however, are interpreted and compared with caution, since the samples of the datasets are non-uniform.
Observational evidence regarding the vertical distribution of dust layers is of particular interest for modelling studies and consequently for assessing the role of airborne dust on radiation (direct climate effect) and clouds (indirect climate effect). So far, modelling simulations of dust are evaluated through comparisons with column dust observations (e.g. AERONET and MODIS AOD) and only occasionally with lidar or in situ measurements at specific stations. Moreover, the availability of ground measurements (lidar and in situ) is limited near the dust sources. Assimilation of dust in atmospheric models is also problematic since the 2-D initial observational fields need to be assimilated towards the 3-D prognostic model variables. Other characteristics than AOD aerosol properties (e.g. Ångström exponent or aerosol type) are essential for radiative forcing studies as the spectral dependence of AOD impacts the RF (radiative forcing) model results for different aerosol cases (e.g. dust or non-dust cases). Furthermore, studies of transboundary aerosol transport (e.g. China, Korea and Japan) should include a quantification of natural (dust) and anthropogenic aerosol components. In this context, the utilization of the CALIPSO pure-dust profiles derived here will certainly assist both the evaluation and assimilation activities in relevant atmospheric simulations and will provide a better estimation of the climatic impact of dust aerosols.
The CALIPSO data were obtained from the online archive of the ICARE Data and Services center (http://www.icare.univ-lille1.fr/archive; CALIPSO Science Team, 2018; ICARE Data and Service Center, 2016). MODIS data are publicly available on the NASA Giovanni system (https://giovanni.sci.gsfc.nasa.gov/giovanni/; NASA, 2018). The LIVAS database is publicly available at http://lidar.space.noa.gr:8080/livas/ (ESA, 2018). LIVAS EARLINET-optimized pure-dust products are available upon request from Emmanouil Proestakis (proestakis@noa.gr) and Vassilis Amiridis (vamoir@noa.gr).
The authors declare that they have no conflict of interest.
The authors acknowledge support through the following projects and research programs: (1) MarcoPolo under grant agreement no. 606953 from the European Union Seventh Framework Programme (FP7/2007–2013); (2) ESA-ESTEC project LIVAS (contract no. 4000104106/11/NL/FF/fk); (3) ACTRIS-2 under grant agreement no. 654109 from the European Union's Horizon 2020 research and innovation programme; (4) ECARS under grant agreement no. 602014 from the European Union's Horizon 2020 Research and Innovation programme; (5) The European Research Council under the European Community's Horizon 2020 research and innovation framework program/ERC Grant Agreement 725698 (D-TECT).
Proestakis Emmanouil acknowledges support through the Stavros Niarchos Foundation. Proestakis Emmanouil and Eleni Marinou acknowledge support from the A. G. Leventis Foundation scholarship.
The authors acknowledge EARLINET for providing aerosol lidar profiles
available from the World Data Center for Climate (WDCC). We thank the
AERONET PIs and their staff for establishing and maintaining the AERONET
sites used in this investigation. CALIPSO data were obtained from the ICARE
Data Center (http://www.icare.univ-lille1.fr/). CALIPSO data were provided
by NASA. We thank the ICARE Data and Services Center for providing access to
the data used in this study and to their computational centre.
Edited by: Matthias Tesche
Reviewed by: two anonymous referees
Albrecht, B.: Aerosols, cloud microphysics, and fractional cloudiness, Science, 245, 1227–1230, https://doi.org/10.1126/science.245.4923.1227, 1989.
Alexandri, G., Georgoulias, A. K., Meleti, C., Balis, D., Kourtidis, K. A., Sanchez-Lorenzo, A., Trentmann, J., and Zanis, P.: A high resolution satellite view of surface solar radiation over the climatically sensitive region of Eastern Mediterranean, Atmos. Res., 188, 107–121, https://doi.org/10.1016/j.atmosres.2016.12.015, 2017.
Amiridis, V., Wandinger, U., Marinou, E., Giannakaki, E., Tsekeri, A., Basart, S., Kazadzis, S., Gkikas, A., Taylor, M., Baldasano, J., and Ansmann, A.: Optimizing CALIPSO Saharan dust retrievals, Atmos. Chem. Phys., 13, 12089–12106, https://doi.org/10.5194/acp-13-12089-2013, 2013.
Amiridis, V., Marinou, E., Tsekeri, A., Wandinger, U., Schwarz, A., Giannakaki, E., Mamouri, R., Kokkalis, P., Binietoglou, I., Solomos, S., Herekakis, T., Kazadzis, S., Gerasopoulos, E., Proestakis, E., Kottas, M., Balis, D., Papayannis, A., Kontoes, C., Kourtidis, K., Papagiannopoulos, N., Mona, L., Pappalardo, G., Le Rille, O., and Ansmann, A.: LIVAS: a 3-D multi-wavelength aerosol/cloud database based on CALIPSO and EARLINET, Atmos. Chem. Phys., 15, 7127–7153, https://doi.org/10.5194/acp-15-7127-2015, 2015.
Anderson, T. L., Masonis, S. J., Covert, D. S., Ahlquist, N. C., Howell, S. G., Clarke, A. D., and McNaughton, C. S.: Variability of aerosol optical properties derived from in situ aircraft measurements during ACE-Asia, J. Geophys. Res.-Atmos., 108, 8647, https://doi.org/10.1029/2002JD003247, 2003.
Ansmann, A., Bosenberg, J., Chaikovsky, A., Comeron, A., Eckhardt, S., Eixmann, R., Freudenthaler, V., Ginoux, P., Komguem, L., Linne, H., Marquez, M. a. L., Matthias, V., Mattis, I., Mitev, V., Muller, D., Music, S., Nickovic, S., Pelon, J., Sauvage, L., Sobolewsky, P., Srivastava, M. K., Stohl, A., Torres, O., Vaughan, G., Wandinger, U., and Wiegner, M.: Long-range transport of Saharan dust to northern Europe: the 11–16 Oct 2001 outbreak observed with EARLINET, J. Geophys. Res.-Atmos., 108, 4783, https://doi.org/10.1029/2003JD003757, 2003.
Ansmann, A., Engelmann, R., Althausen, D., Wandinger, U., Hu, M., Zhang, Y. H., and He, Q. S.: High aerosol load over the Pearl River Delta, China, observed with Raman lidar and Sun photometer, Geophys. Res. Lett., 32, L13815, https://doi.org/10.1029/2005GL023094, 2005.
Ansmann, A., Petzold, A., Kandler, K., Tegen, I., Wendisch, M., Muller, D., Weinzierl, B., Muller, T., and Heintzenberg, J.: Saharan Mineral Dust Experiments SAMUM-1 and SAMUM-2: what have we learned?, Tellus B, 63, 403–429, https://doi.org/10.1111/j.1600-0889.2011.00555.x, 2011.
Baars, H., Kanitz, T., Engelmann, R., Althausen, D., Heese, B., Komppula, M., Preißler, J., Tesche, M., Ansmann, A., Wandinger, U., Lim, J.-H., Ahn, J. Y., Stachlewska, I. S., Amiridis, V., Marinou, E., Seifert, P., Hofer, J., Skupin, A., Schneider, F., Bohlmann, S., Foth, A., Bley, S., Pfüller, A., Giannakaki, E., Lihavainen, H., Viisanen, Y., Hooda, R. K., Pereira, S. N., Bortoli, D., Wagner, F., Mattis, I., Janicka, L., Markowicz, K. M., Achtert, P., Artaxo, P., Pauliquevis, T., Souza, R. A. F., Sharma, V. P., van Zyl, P. G., Beukes, J. P., Sun, J., Rohwer, E. G., Deng, R., Mamouri, R.-E., and Zamorano, F.: An overview of the first decade of PollyNET: an emerging network of automated Raman-polarization lidars for continuous aerosol profiling, Atmos. Chem. Phys., 16, 5111–5137, https://doi.org/10.5194/acp-16-5111-2016, 2016.
Bory, A. J. M., Biscaye, P. E., and Grousset, F. E.: Two distinct seasonal Asian source regions for mineral dust deposited in Greenland (NorthGRIP), Geophys. Res. Lett., 30, 1167, https://doi.org/10.1029/2002GL016446, 2003.
Burton, S. P., Ferrare, R. A., Vaughan, M. A., Omar, A. H., Rogers, R. R., Hostetler, C. A., and Hair, J. W.: Aerosol classification from airborne HSRL and comparisons with the CALIPSO vertical feature mask, Atmos. Meas. Tech., 6, 1397–1412, https://doi.org/10.5194/amt-6-1397-2013, 2013.
Campbell, J. R., Reid, J. S., Westphal, D. L., Zhang, J., Tackett, J. L., Chew, B. N., Welton, E. J., Shimizu, A., Sugimoto, N., Aoki, K., and Winker, D. M.: Characterizing the vertical profile of aerosol particle extinction and linear depolarization over Southeast Asia and the Maritime Continent: the 2007–2009 view from CALIOP, Atmos. Res., 122, 520–543, https://doi.org/10.1016/j.atmosres.2012.05.007, 2013.
Che, H., Xia, X., Zhu, J., Li, Z., Dubovik, O., Holben, B., Goloub, P., Chen, H., Estelles, V., Cuevas-Agulló, E., Blarel, L., Wang, H., Zhao, H., Zhang, X., Wang, Y., Sun, J., Tao, R., Zhang, X., and Shi, G.: Column aerosol optical properties and aerosol radiative forcing during a serious haze-fog month over North China Plain in 2013 based on ground-based sunphotometer measurements, Atmos. Chem. Phys., 14, 2125–2138, https://doi.org/10.5194/acp-14-2125-2014, 2014.
Che, H., Zhang, X.-Y., Xia, X., Goloub, P., Holben, B., Zhao, H., Wang, Y., Zhang, X.-C., Wang, H., Blarel, L., Damiri, B., Zhang, R., Deng, X., Ma, Y., Wang, T., Geng, F., Qi, B., Zhu, J., Yu, J., Chen, Q., and Shi, G.: Ground-based aerosol climatology of China: aerosol optical depths from the China Aerosol Remote Sensing Network (CARSNET) 2002–2013, Atmos. Chem. Phys., 15, 7619–7652, https://doi.org/10.5194/acp-15-7619-2015, 2015.
Chimot, J., Veefkind, J. P., Vlemmix, T., de Haan, J. F., Amiridis, V., Proestakis, E., Marinou, E., and Levelt, P. F.: An exploratory study on the aerosol height retrieval from OMI measurements of the 477 nm O2–O2 spectral band using a neural network approach, Atmos. Meas. Tech., 10, 783–809, https://doi.org/10.5194/amt-10-783-2017, 2017.
Chou, C., Stetzer, O., Weingartner, E., Jurányi, Z., Kanji, Z. A., and Lohmann, U.: Ice nuclei properties within a Saharan dust event at the Jungfraujoch in the Swiss Alps, Atmos. Chem. Phys., 11, 4725–4738, https://doi.org/10.5194/acp-11-4725-2011, 2011.
Clarke, A. D., Collins, W. G., Rasch, P. J., Kapustin, V. N., Moore, K., Howell, S., and Fuelberg, H. E.: Dust and pollution transport on global scales: aerosol measurements and model predictions, J. Geophys. Res.-Atmos., 106, 32555–32569, https://doi.org/10.1029/2000JD900842, 2001.
Colarco, P. R., Toon, O. B., Reid, J. S., Livingston, J. M., Russell, P. B., Redemann, J., Schmid, B., Maring, H. B., Savoie, D., Welton, E. J., Campbell, J. R., Holben, B. N., and Levy, R.: Saharan dust transport to the Caribbean during PRIDE: 2. Transport, vertical profiles, and deposition in simulations of in situ and remote sensing observations, J. Geophys. Res.-Atmos., 108, 8590, https://doi.org/10.1029/2002JD002659, 2003.
Das, S. K., Chen, J.-P., Venkat Ratnam, M., and Jayaraman, A.: Investigation of radiative effects of the optically thick dust layer over the Indian tropical region, Ann. Geophys., 31, 647–663,https://doi.org/10.5194/angeo-31-647-2013, 2013.
de Meij, A., Pozzer, A., and Lelieveld, J.: Trend analysis in aerosol optical depths and pollutant emission estimates between 2000 and 2009, Atmos. Environ., 51, 75–85, https://doi.org/10.1016/j.atmosenv.2012.01.059, 2012.
DeMott, P. J., Sassen, K., Poellot, M. R., Baumgardner, D., Rogers, D. C., Brooks, S. D., Prenni, A. J., and Kreidenweis, S. M.: African dust aerosols as atmospheric ice nuclei, Geophys. Res. Lett., 36, L07808, https://doi.org/10.1029/2009GL037639, 2009.
De Smedt, I., Stavrakou, T., Muller, J.-F., van der A, R. J., and Van Roozendael, M.: Trend detection in satellite observations of formaldehyde tropospheric columns, Geophys. Res. Lett., 37, L18808, https://doi.org/10.1029/2010GL044245, 2010.
Duce, R., Unni, C., Ray, B., Prospero, J., and Merrill, J.: Long-range atmospheric transport of soil dust from Asia to the Tropical North Pacific – temporal variability, Science, 209, 1522–1524, https://doi.org/10.1126/science.209.4464.1522, 1980.
Eguchi, K., Uno, I., Yumimoto, K., Takemura, T., Shimizu, A., Sugimoto, N., and Liu, Z.: Trans-pacific dust transport: integrated analysis of NASA∕CALIPSO and a global aerosol transport model, Atmos. Chem. Phys., 9, 3137–3145, https://doi.org/10.5194/acp-9-3137-2009, 2009.
ESA: LIVAS database, available at: http://lidar.space.noa.gr:8080/livas/, last access: January 2018.
Freudenthaler, V., Esselborn, M., Wiegner, M., Heese, B., Tesche, M., Ansmann, A., Müller, D., Althausen, D., Wirth, M., Fix, A., Ehret, G., Knippertz, P., Toledano, C., Gasteiger, J., Garhammer, M., and Seefeldner, M.: Depolarization ratio profiling at several wavelengths in pure Saharan dust during SAMUM 2006, Tellus B, 61, 165–179, https://doi.org/10.1111/j.1600-0889.2008.00396.x, 2009.
Gautam, R., Liu, Z., Singh, R. P., and Hsu, N. C.: Two contrasting dust-dominant periods over India observed from MODIS and CALIPSO data, Geophys. Res. Lett., 36, L06813, https://doi.org/10.1029/2008GL036967, 2009.
Ge, J. M., Huang, J. P., Xu, C. P., Qi, Y. L., and Liu, H. Y.: Characteristics of Taklimakan dust emission and distribution: a satellite and reanalysis field perspective, J. Geophys. Res.-Atmos., 119, 11772–11783, https://doi.org/10.1002/2014JD022280, 2014.
Georgoulias, A. K., Alexandri, G., Kourtidis, K. A., Lelieveld, J., Zanis, P., and Amiridis, V.: Differences between the MODIS Collection 6 and 5.1 aerosol datasets over the greater Mediterranean region, Atmos. Environ., 147, 310–319, https://doi.org/10.1016/j.atmosenv.2016.10.014, 2016.
Gong, S. L., Zhang, X. Y., Zhao, T. L., Zhang, X. B., Barrie, L. A., McKendry, I. G., and Zhao, C. S.: A simulated climatology of Asian dust aerosol and its trans-Pacific transport, Part II: Interannual variability and climate connections, J. Climate, 19, 104–122, https://doi.org/10.1175/JCLI3606.1, 2006.
Goudie, A. S.: Desert dust and human health disorders, Environ. Int., 63, 101–113, https://doi.org/10.1016/j.envint.2013.10.011, 2014.
Griffin, D. W.: Atmospheric movement of microorganisms in clouds of desert dust and implications for human health, Clin. Microbiol. Rev., 20, 459–477, https://doi.org/10.1128/CMR.00039-06, 2007.
Groß, S., Tesche, M., Freudenthaler, V., Toledano, C., Wiegner, M., Ansmann, A., Althausen, D., and Seefeldner, M.: Characterization of Saharan dust, marine aerosols and mixtures of biomass burning aerosols and dust by means of multi-wavelength depolarization-and Raman-measurements during SAMUM-2, Tellus B, 63, 706–724, 2011.
Groß, S., Esselborn, M., Weinzierl, B., Wirth, M., Fix, A., and Petzold, A.: Aerosol classification by airborne high spectral resolution lidar observations, Atmos. Chem. Phys., 13, 2487–2505, https://doi.org/10.5194/acp-13-2487-2013, 2013.
Groß, S., Freudenthaler, V., Schepanski, K., Toledano, C., Schäfler, A., Ansmann, A., and Weinzierl, B.: Optical properties of long-range transported Saharan dust over Barbados as measured by dual-wavelength depolarization Raman lidar measurements, Atmos. Chem. Phys., 15, 11067–11080, https://doi.org/10.5194/acp-15-11067-2015, 2015.
Haarig, M., Ansmann, A., Gasteiger, J., Kandler, K., Althausen, D., Baars, H., Radenz, M., and Farrell, D. A.: Dry versus wet marine particle optical properties: RH dependence of depolarization ratio, backscatter, and extinction from multiwavelength lidar measurements during SALTRACE, Atmos. Chem. Phys., 17, 14199–14217, https://doi.org/10.5194/acp-17-14199-2017, 2017.
Haenel, A., Baars, H., Althausen, D., Ansmann, A., Engelmann, R., and Sun, J. Y.: One-year aerosol profiling with EUCAARI Raman lidar at Shangdianzi GAW station: Beijing plume and seasonal variations, J. Geophys. Res.-Atmos., 117, D13201, https://doi.org/10.1029/2012JD017577, 2012.
Hatch, C. D., Gierlus, K. M., Schuttlefield, J. D., and Grassian, V. H.: Water adsorption and cloud condensation nuclei activity of calcite and calcite coated with model humic and fulvic acids, Atmos. Environ., 42, 5672–5684, https://doi.org/10.1016/j.atmosenv.2008.03.005, 2008.
Haywood, J. and Boucher, O.: Estimates of the direct and indirect radiative forcing due to tropospheric aerosols: a review, Rev. Geophys., 38, 513–543, https://doi.org/10.1029/1999RG000078, 2000.
He, Y. and Yi, F.: Dust aerosols detected using a ground-based polarization Lidar and CALIPSO over Wuhan (30.5∘ N, 114.4∘ E), China, Adv. Meteorol., 2015, 536762, https://doi.org/10.1155/2015/536762, 2015.
Heese, B. and Wiegner, M.: Vertical aerosol profiles from Raman polarization lidar observations during the dry season AMMA field campaign, J. Geophys. Res.-Atmos., 113, D00C11, https://doi.org/10.1029/2007JD009487, 2008.
Hsu, N. C., Tsay, S. C., King, M. D., and Herman, J. R.: Aerosol properties over bright-reflecting source regions, IEEE T. Geosci. Remote, 42, 557–569, https://doi.org/10.1109/TGRS.2004.824067, 2004.
Hsu, N. C., Jeong, M.-J., Bettenhausen, C., Sayer, A. M., Hansell, R., Seftor, C. S., Huang, J., and Tsay, S.-C.: Enhanced Deep Blue aerosol retrieval algorithm: the second generation, J. Geophys. Res.-Atmos., 118, 9296–9315, https://doi.org/10.1002/jgrd.50712, 2013.
Huang, J., Lin. B., Minnis, P., Wang, T., Wang, X., Hu, Y., Yi, Y., and Ayers, J. K.: Satellite-based assessment of possible dust aerosols semi-direct effect on cloud water path over East Asia, Geophys. Res. Lett., 33, L19802, https://doi.org/10.1029/2006GL026561, 2006.
Huang, J. P., Minnis, P., Lin, B., Wang, T. H., Yi, Y. H., Hu, Y. X., Sun-Mack, S., and Ayers, K.: Possible influences of Asian dust aerosols on cloud properties and radiative forcing observed from MODIS and CERES, Geophys. Res. Lett., 33, L06824, https://doi.org/10.1029/2005GL024724, 2006.
Huang, J., Lin. B., Minnis, P., Wang, T., Wang, X., Hu, Y., Yi, Y., and Ayers, J. K.: Satellite-based assessment of possible dust aerosols semi-direct effect on cloud water path over East Asia, Geophys. Res. Lett., 33, L19802, https://doi.org/10.1029/2006GL026561, 2006.
Huang, J., Minnis, P., Yi, Y., Tang, Q., Wang, X., Hu, Y., Liu, Z., Ayers, K., Trepte, C., and Winker, D.: Summer dust aerosols detected from CALIPSO over the Tibetan Plateau, Geophys. Res. Lett., 34, L18805, https://doi.org/10.1029/2007GL029938, 2007.
Huang, J., Minnis, P., Chen, B., Huang, Z., Liu, Z., Zhao, Q., Yi, Y., and Ayers, J. K.: Long-range transport and vertical structure of Asian dust from CALIPSO and surface measurements during PACDEX, J. Geophys. Res.-Atmos., 113, D23212, https://doi.org/10.1029/2008JD010620, 2008.
Huang, J., Fu, Q., Su, J., Tang, Q., Minnis, P., Hu, Y., Yi, Y., and Zhao, Q.: Taklimakan dust aerosol radiative heating derived from CALIPSO observations using the Fu-Liou radiation model with CERES constraints, Atmos. Chem. Phys., 9, 4011–4021, https://doi.org/10.5194/acp-9-4011-2009, 2009.
Huang, J., Minnis, P., Yan, H., Yi, Y., Chen, B., Zhang, L., and Ayers, J. K.: Dust aerosol effect on semi-arid climate over Northwest China detected from A-Train satellite measurements, Atmos. Chem. Phys., 10, 6863–6872, https://doi.org/10.5194/acp-10-6863-2010, 2010.
Huebert, B. J., Bates, T., Russell, P. B., Shi, G. Y., Kim, Y. J., Kawamura, K., Carmichael, G., and Nakajima, T.: An overview of ACE-Asia: strategies for quantifying the relationships between Asian aerosols and their climatic impacts, J. Geophys. Res.-Atmos., 108, 8633, https://doi.org/10.1029/2003JD003550, 2003.
Hunt, W. H., Winker, D. M., Vaughan, M. A., Powell, K. A., Lucker, P. L., and Weimer, C.: CALIPSO Lidar description and performance assessment, J. Atmos. Ocean. Tech., 26, 1214–1228, https://doi.org/10.1175/2009JTECHA1223.1, 2009.
Husar, R. B., Prospero, J. M., and Stowe, L. L.: Characterization of tropospheric aerosols over the oceans with the NOAA advanced very high resolution radiometer optical thickness operational product, J. Geophys. Res.-Atmos., 102, 16889–16909, https://doi.org/10.1029/96JD04009, 1997.
Husar, R. B., Tratt, D. M., Schichtel, B. A., Falke, S. R., Li, F., Jaffe, D., Gasso, S., Gill, T., Laulainen, N. S., Lu, F., Reheis, M. C., Chun, Y., Westphal, D., Holben, B. N., Gueymard, C., McKendry, I., Kuring, N., Feldman, G. C., McClain, C., Frouin, R. J., Merrill, J., DuBois, D., Vignola, F., Murayama, T., Nickovic, S., Wilson, W. E., Sassen, K., Sugimoto, N., and Malm, W. C.: Asian dust events of Apr 1998, J. Geophys. Res.-Atmos., 106, 18317–18330, https://doi.org/10.1029/2000JD900788, 2001.
ICARE Data and Services Center: CALIPSO data, available at: http://www.icare.univ-lille1.fr/archive (last access: January 2018), 2016.
Illingworth, A. J., Barker, H. W., Beljaars, A., Ceccaldi, M., Chepfer, H., Clerbaux, N., Cole, J., Delanoë, J., Domenech, C., Donovan, D. P., Fukuda, S., Hirakata, M., Hogan, R. J., Huenerbein, A., Kollias, P., Nakajima, T., Nakajima, T.-Y., Nishizawa, T., Ohno, Y., Okamoto, H., Oki, R., Sato, K., Satoh, M., Sephard, M. W., Velázquez-Blázquez, A., Wandinger, U., Wehr, T., and van Zadelhoff, G.-J.: The EarthCARE Satellite: the next step forward in global measurements of clouds, aerosols, precipitation, and radiation, B. Am. Meteorol. Soc., 96, 1311–1332, https://doi.org/10.1175/BAMS-D-12-00227.1, 2015.
IPCC 2013: Climate Change 2013: The Physical Science Basis, Contribution of Working Group I to the Fifth Assessment Report of the Intergovernmental Panel on Climate Change, edited by: Stocker, T. F., Qin, D., Plattner, G.-K., Tignor, M., Allen, S. K., Boschung, J., Nauels, A., Xia, Y., Bex, V., and Midgley, P. M., Cambridge University Press, Cambridge, UK and New York, NY, USA, 1535 pp., available at: https://www.ipcc.ch/pdf/assessment-report/ar5/wg1/WG1AR5_Frontmatter_FINAL.pdf, 2013.
Jacob, D. J., Crawford, J. H., Kleb, M. M., Connors, V. S., Bendura, R. J., Raper, J. L., Sachse, G. W., Gille, J. C., Emmons, L., and Heald, C. L.: Transport and Chemical Evolution over the Pacific (TRACE-P) aircraft mission: design, execution, and first results, J. Geophys. Res.-Atmos., 108, 1–19, https://doi.org/10.1029/2002JD003276, 2003.
Jickells, T., An, Z., Andersen, K., Baker, A., Bergametti, G., Brooks, N., Cao, J., Boyd, P., Duce, R., Hunter, K., Kawahata, H., Kubilay, N., laRoche, J., Liss, P., Mahowald, N., Prospero, J., Ridgwell, A., Tegen, I., and Torres, R.: Global iron connections between desert dust, ocean biogeochemistry, and climate, Science, 308, 67–71, https://doi.org/10.1126/science.1105959, 2005.
Kang, N., Kumar, K. R., Hu, K., Yu, X., and Yin, Y.: Long-term (2002–2014) evolution and trend in Collection 5.1 Level-2 aerosol products derived from the MODIS and MISR sensors over the Chinese Yangtze River Delta, Atmos. Res., 181, 29–43, https://doi.org/10.1016/j.atmosres.2016.06.008, 2016.
Karami, S., Ranjbar, A., Mohebalhojeh, A. R., and Moradi, M.: A rare case of haboob in Tehran: observational and numerical study, Atmos. Res., 185, 169–185, https://doi.org/10.1016/j.atmosres.2016.10.010, 2017.
Kaufman, Y. J., Tanre, D., Remer, L. A., Vermote, E. F., Chu, A., and Holben, B. N.: Operational remote sensing of tropospheric aerosol over land from EOS moderate resolution imaging spectroradiometer, J. Geophys. Res.-Atmos., 102, 17051–17067, https://doi.org/10.1029/96JD03988, 1997.
Kellogg, C. A. and Griffin, D. W.: Aerobiology and the global transport of desert dust, Trends Ecol. Evol., 21, 638–644, https://doi.org/10.1016/j.tree.2006.07.004, 2006.
Kittaka, C., Winker, D. M., Vaughan, M. A., Omar, A., and Remer, L. A.: Intercomparison of column aerosol optical depths from CALIPSO and MODIS-Aqua, Atmos. Meas. Tech., 4, 131–141, https://doi.org/10.5194/amt-4-131-2011, 2011.
Komppula, M., Mielonen, T., Arola, A., Korhonen, K., Lihavainen, H., Hyvärinen, A.-P., Baars, H., Engelmann, R., Althausen, D., Ansmann, A., Müller, D., Panwar, T. S., Hooda, R. K., Sharma, V. P., Kerminen, V.-M., Lehtinen, K. E. J., and Viisanen, Y.: Technical Note: One year of Raman-lidar measurements in Gual Pahari EUCAARI site close to New Delhi in India – Seasonal characteristics of the aerosol vertical structure, Atmos. Chem. Phys., 12, 4513–4524, https://doi.org/10.5194/acp-12-4513-2012, 2012.
Kourtidis, K., Stathopoulos, S., Georgoulias, A. K., Alexandri, G., and Rapsomanikis, S.: A study of the impact of synoptic weather conditions and water vapor on aerosol–cloud relationships over major urban clusters of China, Atmos. Chem. Phys., 15, 10955–10964, https://doi.org/10.5194/acp-15-10955-2015, 2015.
Kuhlmann, J. and Quaas, J.: How can aerosols affect the Asian summer monsoon? Assessment during three consecutive pre-monsoon seasons from CALIPSO satellite data, Atmos. Chem. Phys., 10, 4673–4688, https://doi.org/10.5194/acp-10-4673-2010, 2010.
Kumar, R., Barth, M. C., Pfister, G. G., Naja, M., and Brasseur, G. P.: WRF-Chem simulations of a typical pre-monsoon dust storm in northern India: influences on aerosol optical properties and radiation budget, Atmos. Chem. Phys., 14, 2431–2446, https://doi.org/10.5194/acp-14-2431-2014, 2014.
Kwon, S. A., Iwasaka, Y., Shibata, T., and Sakai, T.: Vertical distribution of atmospheric particles and water vapor densities in the free troposphere: lidar measurement in spring and summer in Nagoya, Japan, Atmos. Environ., 31, 1459–1465, https://doi.org/10.1016/S1352-2310(96)00310-X, 1997.
Lau, K., Yang, G., and Shen, S.: Seasonal and intraseasonal climatology of summer monsoon rainfall over East-Asia, Mon. Weather Rev., 116, 18–37, https://doi.org/10.1175/1520-0493(1988)116<0018:SAICOS>2.0.CO;2, 1988.
Lau, K.-M. and Kim, K.-M.: Observational relationships between aerosol and Asian monsoon rainfall, and circulation, Geophys. Res. Lett., 33, L21810, https://doi.org/10.1029/2006GL027546, 2006.
Levy, R. C., Remer, L. A., Kleidman, R. G., Mattoo, S., Ichoku, C., Kahn, R., and Eck, T. F.: Global evaluation of the Collection 5 MODIS dark-target aerosol products over land, Atmos. Chem. Phys., 10, 10399–10420, https://doi.org/10.5194/acp-10-10399-2010, 2010.
Levy, R. C., Mattoo, S., Munchak, L. A., Remer, L. A., Sayer, A. M., Patadia, F., and Hsu, N. C.: The Collection 6 MODIS aerosol products over land and ocean, Atmos. Meas. Tech., 6, 2989–3034, https://doi.org/10.5194/amt-6-2989-2013, 2013.
Liu, X. D. and Chen, B. D.: Climatic warming in the Tibetan Plateau during recent decades, Int. J. Climatol., 20, 1729–1742, https://doi.org/10.1002/1097-0088(20001130)20:14<1729::AID-JOC556>3.0.CO;2-Y, 2000.
Liu, Z. Y., Sugimoto, N., and Murayama, T.: Extinction-to-backscatter ratio of Asian dust observed with high-spectral-resolution lidar and Raman lidar, Appl. Optics, 41, 2760–2767, https://doi.org/10.1364/AO.41.002760, 2002.
Liu, D., Wang, Z., Liu, Z., Winker, D., and Trepte, C.: A height resolved global view of dust aerosols from the first year CALIPSO lidar measurements, J. Geophys. Res.-Atmos., 113, D16214, https://doi.org/10.1029/2007JD009776, 2008.
Liu, Z., Liu, D., Huang, J., Vaughan, M., Uno, I., Sugimoto, N., Kittaka, C., Trepte, C., Wang, Z., Hostetler, C., and Winker, D.: Airborne dust distributions over the Tibetan Plateau and surrounding areas derived from the first year of CALIPSO lidar observations, Atmos. Chem. Phys., 8, 5045–5060, https://doi.org/10.5194/acp-8-5045-2008, 2008a.
Liu, Z., Omar, A., Vaughan, M., Hair, J., Kittaka, C., Hu, Y., Powell, K., Trepte, C., Winker, D., Hostetler, C., Ferrare, R., and Pierce, R.: CALIPSO lidar observations of the optical properties of Saharan dust: a case study of long-range transport, J. Geophys. Res.-Atmos., 113, D07207, https://doi.org/10.1029/2007JD008878, 2008b.
Mamouri, R. E., Ansmann, A., Nisantzi, A., Kokkalis, P., Schwarz, A., and Hadjimitsis, D.: Low Arabian dust extinction-to-backscatter ratio, Geophys. Res. Lett., 40, 4762–4766, https://doi.org/10.1002/grl.50898, 2013.
Mao, R., Ho, C.-H., Shao, Y., Gong, D.-Y., and Kim, J.: Influence of arctic oscillation on dust activity over northeast Asia, Atmos. Environ., 45, 326–337, https://doi.org/10.1016/j.atmosenv.2010.10.020, 2011.
Marinou, E., Amiridis, V., Binietoglou, I., Tsikerdekis, A., Solomos, S., Proestakis, E., Konsta, D., Papagiannopoulos, N., Tsekeri, A., Vlastou, G., Zanis, P., Balis, D., Wandinger, U., and Ansmann, A.: Three-dimensional evolution of Saharan dust transport towards Europe based on a 9 year EARLINET-optimized CALIPSO dataset, Atmos. Chem. Phys., 17, 5893–5919, https://doi.org/10.5194/acp-17-5893-2017, 2017.
Martin, J., Coale, K., Johnson, K., Fitzwater, S., Gordon, R., Tanner, S., Hunter, C., Elrod, V., Nowicki, J., Coley, T., Barber, R., Lindley, S., Watson, A., Vanscoy, K., Law, C., Liddicoat, M., Ling, R., Stanton, T., Stockel, J., Collins, C., Anderson, A., Bidigare, R., Ondrusek, M., Latasa, M., Millero, F., Lee, K., Yao, W., Zhang, J., Friederich, G., Sakamoto, C., Chavez, F., Buck, K., Kolber, Z., Greene, R., Falkowski, P., Chisholm, S., Hoge, F., Swift, R., Yungel, J., Turner, S., Nightingale, P., Hatton, A., Liss, P., and Tindale, N.: Testing the iron hypothesis in ecosystems of the Equatorial Pacific-Ocean, Nature, 371, 123–129, https://doi.org/10.1038/371123a0, 1994.
Matsuki, A., Iwasaka, Y., Osada, K., Matsunaga, K., Kido, M., Inomata, Y., Trochkine, D., Nishita, C., Nezuka, T., Sakai, T., Zhang, D. Z., and Kwon, S. A.: Seasonal Dependence of the Long-Range Transport and Vertical Distribution of Free Tropospheric Aerosols over East Asia: On the Basis of Aircraft and Lidar Measurements and Isentropic Trajectory Analysis, J. Geophys. Res.-Atmos., 108, 8663, https://doi.org/10.1029/2002JD003266, 2003.
McGill, M. J., Yorks, J. E., Scott, V. S., Kupchock, A. W., and Selmer, P. A.: The Cloud Aerosol Transport System (CATS): a technology demonstration on the International Space Station, Proc. SPIE, 96120A, https://doi.org/10.1117/12.2190841, 2015.
McKendry, I. G., Macdonald, A. M., Leaitch, W. R., van Donkelaar, A., Zhang, Q., Duck, T., and Martin, R. V.: Trans-Pacific dust events observed at Whistler, British Columbia during INTEX-B, Atmos. Chem. Phys., 8, 6297–6307, https://doi.org/10.5194/acp-8-6297-2008, 2008.
Middleton, N.: A geography of dust storms in Southwest Asia, J. Climatol., 6, 183–196, 1986.
Mikami, M., Shi, G. Y., Uno, I., Yabuki, S., Iwasaka, Y., Yasui, M., Aoki, T., Tanaka, T. Y., Kurosaki, Y., Masuda, K., Uchiyama, A., Matsuki, A., Sakai, T., Takemi, T., Nakawo, M., Seino, N., Ishizuka, M., Satake, S., Fujita, K., Hara, Y., Kai, K., Kanayama, S., Hayashi, M., Du, M., Kanai, Y., Yamada, Y., Zhang, X. Y., Shen, Z., Zhou, H., Abe, O., Nagai, T., Tsutsumi, Y., Chiba, M., and Suzuki, J.: Aeolian dust experiment on climate impact: an overview of Japan-China joint project ADEC, Global Planet. Change, 52, 142–172, https://doi.org/10.1016/j.gloplacha.2006.03.001, 2006.
Mona, L., Amodeo, A., Pandolfi, M., and Pappalardo, G.: Saharan dust intrusions in the Mediterranean area: three years of Raman lidar measurements, J. Geophys. Res.-Atmos., 111, d16203, https://doi.org/10.1029/2005JD006569, 2006.
Mueller, D., Ansmann, A., Mattis, I., Tesche, M., Wandinger, U., Althausen, D., and Pisani, G.: Aerosol-Type-Dependent Lidar Ratios Observed with Raman Lidar, J. Geophys. Res.-Atmos., 112, D16202, https://doi.org/10.1029/2006JD008292, 2007.
Murayama, T., Masonis, S. J., Redemann, J., Anderson, T. L., Schmid, B., Livingston, J. M., Russell, P. B., Huebert, B., Howell, S. G., McNaughton, C. S., Clarke, A., Abo, M., Shimizu, A., Sugimoto, N., Yabuki, M., Kuze, H., Fukagawa, S., Maxwell-Meier, K., Weber, R. J., Orsini, D. A., Blomquist, B., Bandy, A., and Thornton, D.: An intercomparison of lidar-derived aerosol optical properties with airborne measurements near Tokyo during ACE-Asia, J. Geophys. Res.-Atmos., 108, 8651, https://doi.org/10.1029/2002JD003259, 2003.
Murayama, T., Muller, D., Wada, K., Shimizu, A., Sekiguchi, M., and Tsukamoto, T.: Characterization of Asian dust and Siberian smoke with multiwavelength Raman lidar over Tokyo, Japan in spring 2003, Geophys. Res. Lett., 31, L23103, https://doi.org/10.1029/2004GL021105, 2004.
NASA: MODIS data, available at: https://giovanni.sci.gsfc.nasa.gov/giovanni/, last access: January 2018.
Okin, G. S., Mahowald, N., Chadwick, O. A., and Artaxo, P.: Impact of desert dust on the biogeochemistry of phosphorus in terrestrial ecosystems, Global Biogeochem. Cy., 18, GB2005, https://doi.org/10.1029/2003GB002145, 2004.
Omar, A. H., Winker, D. M., Kittaka, C., Vaughan, M. A., Liu, Z., Hu, Y., Trepte, C. R., Rogers, R. R., Ferrare, R. A., Lee, K.-P., Kuehn, R. E., and Hostetler, C. A.: The CALIPSO automated aerosol classification and Lidar ratio selection algorithm, J. Atmos. Ocean. Tech., 26, 1994–2014, https://doi.org/10.1175/2009JTECHA1231.1, 2009.
Papagiannopoulos, N., Mona, L., Alados-Arboledas, L., Amiridis, V., Baars, H., Binietoglou, I., Bortoli, D., D'Amico, G., Giunta, A., Guerrero-Rascado, J. L., Schwarz, A., Pereira, S., Spinelli, N., Wandinger, U., Wang, X., and Pappalardo, G.: CALIPSO climatological products: evaluation and suggestions from EARLINET, Atmos. Chem. Phys., 16, 2341–2357, https://doi.org/10.5194/acp-16-2341-2016, 2016.
Pozzer, A., de Meij, A., Yoon, J., Tost, H., Georgoulias, A. K., and Astitha, M.: AOD trends during 2001–2010 from observations and model simulations, Atmos. Chem. Phys., 15, 5521–5535, https://doi.org/10.5194/acp-15-5521-2015, 2015.
Prospero, J. M., Ginoux, P., Torres, O., Nicholson, S. E., and Gill, T. E.: Environmental characterization of global sources of atmospheric soil dust identified with the Nimbus 7 Total Ozone Mapping Spectrometer (TOMS) absorbing aerosol product, Rev. Geophys., 40, 1002, https://doi.org/10.1029/2000RG000095, 2002.
Ramanathan, V., Crutzen, P. J., Kiehl, J. T., and Rosenfeld, D.: Atmosphere – aerosols, climate, and the hydrological cycle, Science, 294, 2119–2124, https://doi.org/10.1126/science.1064034, 2001.
Rasch, P. J., Collins, W. D., and Eaton, B. E.: Understanding the Indian Ocean Experiment (INDOEX) aerosol distributions with an aerosol assimilation, J. Geophys. Res.-Atmos., 106, 7337–7355, https://doi.org/10.1029/2000JD900508, 2001.
Redemann, J., Vaughan, M. A., Zhang, Q., Shinozuka, Y., Russell, P. B., Livingston, J. M., Kacenelenbogen, M., and Remer, L. A.: The comparison of MODIS-Aqua (C5) and CALIOP (V2 & V3) aerosol optical depth, Atmos. Chem. Phys., 12, 3025–3043, https://doi.org/10.5194/acp-12-3025-2012, 2012.
Remer, L. A., Kaufman, Y. J., Tanre, D., Mattoo, S., Chu, D. A., Martins, J. V., Li, R. R., Ichoku, C., Levy, R. C., Kleidman, R. G., Eck, T. F., Vermote, E., and Holben, B. N.: The MODIS aerosol algorithm, products, and validation, J. Atmos. Sci., 62, 947–973, https://doi.org/10.1175/JAS3385.1, 2005.
Rogers, R. R., Vaughan, M. A., Hostetler, C. A., Burton, S. P., Ferrare, R. A., Young, S. A., Hair, J. W., Obland, M. D., Harper, D. B., Cook, A. L., and Winker, D. M.: Looking through the haze: evaluating the CALIPSO level 2 aerosol optical depth using airborne high spectral resolution lidar data, Atmos. Meas. Tech., 7, 4317–4340, https://doi.org/10.5194/amt-7-4317-2014, 2014.
Rosenfeld, D., Lohmann, U., Raga, G. B., O'Dowd, C. D., Kulmala, M., Fuzzi, S., Reissell, A., and Andreae, M. O.: Flood or drought: how do aerosols affect precipitation?, Science, 321, 1309–1313, https://doi.org/10.1126/science.1160606, 2008.
Sakai, T., Shibata, T., Kwon, S- A., Kim, Y.-S., Tamura, K., and Iwasaka, Y.: Free tropospheric aerosol backscatter, depolarization ratio, and relative humidity measured with the Raman lidar at Nagoya in 1994–1997: contributions of aerosols from the Asian continent and the pacific ocean, Atmos. Environ., 34, 431–442, https://doi.org/10.1016/S1352-2310(99)00328-3, 2000.
Sakai, T., Shibata, T., Iwasaka, Y., Nagai, T., Nakazato, M., Matsumura, T., Ichiki, A., Kim, Y. S., Tamura, K., Troshkin, D., and Hamdi, S.: Case study of Raman lidar measurements of Asian dust events in 2000 and 2001 at Nagoya and Tsukuba, Japan, Atmos. Environ., 36, 5479–5489, https://doi.org/10.1016/S1352-2310(02)00664-7, 2002.
Sayer, A. M., Hsu, N. C., Bettenhausen, C., and Jeong, M.-J.: Validation and uncertainty estimates for MODIS Collection 6 “Deep Blue” aerosol data, J. Geophys. Res.-Atmos., 118, 7864–7872, https://doi.org/10.1002/jgrd.50600, 2013.
Sayer, A. M., Munchak, L. A., Hsu, N. C., Levy, R. C., Bettenhausen, C., and Jeong, M.-J.: MODIS Collection 6 aerosol products: comparison between Aqua's e-Deep Blue, dark target, and “merged” data sets, and usage recommendations, J. Geophys. Res.-Atmos., 119, 13965–13989, https://doi.org/10.1002/2014JD022453, 2014.
Sayer, A. M., Hsu, N. C., Bettenhausen, C., Jeong, M.-J., and Meister, G.: Effect of MODIS Terra radiometric calibration improvements on Collection 6 Deep Blue aerosol products: validation and Terra/Aqua consistency, J. Geophys. Res.-Atmos., 120, https://doi.org/10.1002/2015JD023878, 2015.
Shaw, G.: Transport of Asian desert aerosol to the Hawaiian-Islands, J. Appl. Meteorol., 19, 1254–1259, https://doi.org/10.1175/1520-0450(1980)019<1254:TOADAT>2.0.CO;2, 1980.
Stith, J. L., Ramanathan, V., Cooper, W. A., Roberts, G. C., DeMott, P. J., Carmichael, G., Hatch, C. D., Adhikary, B., Twohy, C. H., Rogers, D. C., Baumgardner, D., Prenni, A. J., Campos, T., Gao, R., Anderson, J., and Feng, Y.: An overview of aircraft observations from the Pacific Dust Experiment campaign, J. Geophys. Res.-Atmos., 114, D05207, https://doi.org/10.1029/2008JD010924, 2009.
Sun, J. M., Zhang, M. Y., and Liu, T. S.: Spatial and temporal characteristics of dust storms in China and its surrounding regions, 1960–1999: Relations to source area and climate, J. Geophys. Res.-Atmos., 106, 10325–10333, https://doi.org/10.1029/2000JD900665, 2001.
Tan, S., Li, J., Gao, H., Wang, H., Che, H., and Chen, B.: Satellite-observed transport of dust to the East China Sea and the North Pacific Subtropical Gyre: contribution of dust to the increase in chlorophyll during spring 2010, Atmosphere, 7, 152, https://doi.org/10.3390/atmos7110152, 2016.
Tan, S.-C., Li, J., Che, H., Chen, B., and Wang, H.: Transport of East Asian dust storms to the marginal seas of China and the southern North Pacific in spring 2010, Atmos. Environ., 148, 316–328, https://doi.org/10.1016/j.atmosenv.2016.10.054, 2017.
Tanre, D., Kaufman, Y. J., Herman, M., and Mattoo, S.: Remote Sensing of Aerosol Properties over Oceans Using the MODIS/EOS Spectral Radiances, J. Geophys. Res.-Atmos., 102, 16971–1688, https://doi.org/10.1029/96JD03437, 1997.
Tegen, I., Lacis, A. A., and Fung, I.: The influence on climate forcing of mineral aerosols from disturbed soils, Nature, 380, 419–422, https://doi.org/10.1038/380419a0, 1996.
Tesche, M., Ansmann, A., Mueller, D., Althausen, D., Engelmann, R., Hu, M., and Zhang, Y.: Particle backscatter, extinction, and lidar ratio profiling with Raman lidar in south and north China, Appl. Optics, 46, 6302–6308, https://doi.org/10.1364/AO.46.006302, 2007.
Tesche, M., Ansmann, A., Mueller, D., Althausen, D., Engelmann, R., Freudenthaler, V., and Gross, S.: Vertically resolved separation of dust and smoke over Cape Verde using multiwavelength Raman and polarization lidars during Saharan Mineral Dust Experiment 2008, J. Geophys. Res.-Atmos., 114, D13202, https://doi.org/10.1029/2009JD011862, 2009.
Thompson, L. G., Mosley-Thompson, E., Davis, M. E., Lin, P. N., Henderson, K., and Mashiotta, T. A.: Tropical glacier and ice core evidence of climate change on annual to millennial time scales, Climatic Change, 59, 137–155, https://doi.org/10.1023/A:1024472313775, 2003.
Tian, P., Cao, X., Zhang, L., Sun, N., Sun, L., Logan, T., Shi, J., Wang, Y., Ji, Y., Lin, Y., Huang, Z., Zhou, T., Shi, Y., and Zhang, R.: Aerosol vertical distribution and optical properties over China from long-term satellite and ground-based remote sensing, Atmos. Chem. Phys., 17, 2509–2523, https://doi.org/10.5194/acp-17-2509-2017, 2017.
Twomey, S.: The influence of pollution on the shortwave albedo of clouds, J. Atmos. Sci., 34, 1149–1152, 1977.
Uno, I., Amano, H., Emori, S., Kinoshita, K., Matsui, I., and Sugimoto, N.: Trans-Pacific yellow sand transport observed in Apr 1998: a numerical simulation, J. Geophys. Res.-Atmos., 106, 18331–18344, https://doi.org/10.1029/2000JD900748, 2001.
Uno, I., Yumimoto, K., Shimizu, A., Hara, Y., Sugimoto, N., Wang, Z., Liu, Z., and Winker, D. M.: 3-D structure of Asian dust transport revealed by CALIPSO lidar and a 4-DVAR dust model, Geophys. Res. Lett., 35, L06803, https://doi.org/10.1029/2007GL032329, 2008.
Uno, I., Eguchi, K., Yumimoto, K., Takemura, T., Shimizu, A., Uematsu, M., Liu, Z., Wang, Z., Hara, Y., and Sugimoto, N.: Asian dust transported one full circuit around the globe, Nat. Geosci., 2, 557–560, https://doi.org/10.1038/NGEO583, 2009.
van der A, R. J., Mijling, B., Ding, J., Koukouli, M. E., Liu, F., Li, Q., Mao, H., and Theys, N.: Cleaning up the air: effectiveness of air quality policy for SO2 and NOx emissions in China, Atmos. Chem. Phys., 17, 1775–1789, https://doi.org/10.5194/acp-17-1775-2017, 2017.
Vaughan, M. A., Powell, K. A., Kuehn, R. E., Young, S. A., Winker, D. M., Hostetler, C. A., Hunt, W. H., Liu, Z., McGill, M. J., and Getzewich, B. J.: Fully automated detection of cloud and aerosol layers in the CALIPSO Lidar measurements, J. Atmos. Ocean. Tech., 26, 2034–2050, https://doi.org/10.1175/2009JTECHA1228.1, 2009.
Vinoj, V., Rasch, P. J., Wang, H., Yoon, J.-H., Ma, P.-L., Landu, K., and Singh, B.: Short-term modulation of Indian summer monsoon rainfall by West Asian dust, Nat. Geosci., 7, 308–313, https://doi.org/10.1038/ngeo2107, 2014.
Weatherhead, E. C., Reinsel, G. C., Tiao, G. C., Meng, X. L., Choi, D. S., Cheang, W. K., Keller, T., DeLuisi, J., Wuebbles, D. J., Kerr, J. B., Miller, A. J., Oltmans, S. J., and Frederick, J. E.: Factors Affecting the Detection of Trends: Statistical Considerations and Applications to Environmental Data, J. Geophys. Res.-Atmos., 103, 17149–17161, https://doi.org/10.1029/98JD00995, 1998.
Winker, D. M., Hunt, W. H., and McGill, M. J.: Initial performance assessment of CALIOP, Geophys. Res. Lett., 34, L19803, https://doi.org/10.1029/2007GL030135, 2007.
Winker, D. M., Vaughan, M. A., Omar, A., Hu, Y., Powell, K. A., Liu, Z., Hunt, W. H., and Young, S. A.: Overview of the CALIPSO mission and CALIOP data processing algorithms, J. Atmos. Ocean. Tech., 26, 2310–2323, https://doi.org/10.1175/2009JTECHA1281.1, 2009.
Winker, D. M., Tackett, J. L., Getzewich, B. J., Liu, Z., Vaughan, M. A., and Rogers, R. R.: The global 3-D distribution of tropospheric aerosols as characterized by CALIOP, Atmos. Chem. Phys., 13, 3345–3361, https://doi.org/10.5194/acp-13-3345-2013, 2013.
Xie, C., Nishizawa, T., Sugimoto, N., Matsui, I., and Wang, Z.: Characteristics of aerosol optical properties in pollution and Asian dust episodes over Beijing, China, Appl. Optics, 47, 4945–4951, https://doi.org/10.1364/AO.47.004945, 2008.
Xu, H., Zheng, F., and Zhang, W.: Variability in dust observed over China using a-train CALIOP instrument, Adv. Meteorol., 2016, 1246590, https://doi.org/10.1155/2016/1246590, 2016.
Yang, W., Marshak, A., Várnai, T., Kalashnikova, O. V., and Kostinski, A. B.: CALIPSO observations of transatlantic dust: vertical stratification and effect of clouds, Atmos. Chem. Phys., 12, 11339–11354, https://doi.org/10.5194/acp-12-11339-2012, 2012.
Yoon, J. and Pozzer, A.: Model-simulated trend of surface carbon monoxide for the 2001–2010 decade, Atmos. Chem. Phys., 14, 10465–10482, https://doi.org/10.5194/acp-14-10465-2014, 2014.
Young, S. and Vaughan, M.: The retrieval of profiles of particulate extinction from Cloud Aerosol Lidar Infrared Pathfinder Satellite, Observations (CALIPSO) data: algorithm description, J. Atmos. Ocean. Tech., 26, 1105–1119, https://doi.org/10.1175/2008JTECHA1221.1, 2009.
Young, S.: CALIOP V3 Extinction Uncertainty: Uncertainty Analysis for Particulate Backscatter, Extinction and Optical Depth Retrievals reported in the CALIPSO Level 2, Version 3 Data Release, available at: https://eosweb.larc.nasa.gov/sites/default/files/project/calipso/CALIOP_Version3_Extinction_Error_Analysis.pdf, last access: 1 March 2017, 2010.
Yu, H., Remer, L. A., Chin, M., Bian, H., Kleidman, R. G., and Diehl, T.: A satellite-based assessment of transpacific transport of pollution aerosol, J. Geophys. Res.-Atmos., 113, D14S12, https://doi.org/10.1029/2007JD009349, 2008.
Yumimoto, K., Eguchi, K., Uno, I., Takemura, T., Liu, Z., Shimizu, A., and Sugimoto, N.: An elevated large-scale dust veil from the Taklimakan Desert: Intercontinental transport and three-dimensional structure as captured by CALIPSO and regional and global models, Atmos. Chem. Phys., 9, 8545–8558, https://doi.org/10.5194/acp-9-8545-2009, 2009.
Zhang, X. Y., Arimoto, R., and An, Z. S.: Dust emission from Chinese desert sources linked to variations in atmospheric circulation, J. Geophys. Res.-Atmos., 102, 28041–28047, https://doi.org/10.1029/97JD02300, 1997.
Zhang, X. Y., Gong, S. L., Shen, Z. X., Mei, F. M., Xi, X. X., Liu, L. C., Zhou, Z. J., Wang, D., Wang, Y. Q., and Cheng, Y.: Characterization of soil dust aerosol in China and its transport and distribution during 2001 ACE-Asia: 1. network observations, J. Geophys. Res.-Atmos., 108, 4261, https://doi.org/10.1029/2002JD002632, 2003.
Zhang, J., Reid, J. S., Alfaro-Contreras, R., and Xian, P.: Has China been exporting less particulate air pollution over the past decade?, Geophys. Res. Lett., 44, 2941–2948, https://doi.org/10.1002/2017GL072617, 2017.
Zhao, B., Jiang, J. H., Gu, Y., Diner, D., Worden, J., Liou, K.-N., Su, H., Xing, J., Garay, M., and Huang, L.: Decadal-scale trends in regional aerosol particle properties and their linkage to emission changes, Environ. Res. Lett., 12, 054021, https://doi.org/10.1088/1748-9326/aa6cb2, 2017.