the Creative Commons Attribution 4.0 License.
the Creative Commons Attribution 4.0 License.
 | 05 Jan 2018
Mercury fluxes over an Australian alpine grassland and observation of nocturnal atmospheric mercury depletion events
Dean Howard
Grant C. Edwards
Aerodynamic gradient measurements of the air–surface exchange of gaseous elemental mercury (GEM) were undertaken over a 40 ha alpine grassland in Australia's Snowy Mountains region across a 3-week period during the late austral summer. Bi-directional GEM fluxes were observed throughout the study, with overall mean value of 0.2 ± 14.5 ng m−2 h−1 and mean nocturnal fluxes of −1.5 ± 7.8 ng m−2 h−1 compared to diurnal fluxes of 1.8 ± 18.6 ng m−2 h−1. Deposition velocities ranged from −2.2 to 2.9 cm s−1, whilst ambient GEM concentrations throughout the study were 0.59 ± 0.10 ng m−3. Cumulative GEM fluxes correlated well with 24 h running mean soil temperatures, and one precipitation event was shown to have a positive impact on diurnal emission fluxes. The underlying vegetation had largely senesced and showed little stomatal control on fluxes. Nocturnal atmospheric mercury depletion events (NAMDEs) were observed concomitant with O3 depletion and dew formation under shallow, stable nocturnal boundary layers. A mass balance box model was able to reproduce ambient GEM concentration patterns during NAMDE and non-NAMDE nights without invoking chemical oxidation of GEM throughout the column, indicating a significant role of surface processes controlling deposition in these events. Surface deposition was enhanced under NAMDE nights, though uptake to dew likely represents less than one-fifth of this enhanced deposition. Instead, enhancement of the surface GEM gradient as a result of oxidation at the surface in the presence of dew is hypothesised to be responsible for a large portion of GEM depletion during these particular events. GEM emission pulses following nights with significant deposition provide evidence for the prompt recycling of 17 % of deposited mercury, with the remaining portion retained in surface sinks. The long-term impacts of any sinks are however likely to be minimal, as cumulative GEM flux across the study period was close to zero.
- Article
(1696 KB) - Full-text XML
- BibTeX
- EndNote


International support for a legally binding agreement on the control of mercury in the environment, beginning in 2003, recently culminated in the 2013 United Nations Environmental Programme (UNEP) Minamata Convention on Mercury (Kessler, 2013). This convention includes provisions for emissions reductions; technology sharing; public awareness; and enhanced mercury monitoring in human populations, wildlife and the environment. Such monitoring is essential in assessing the efficacy of emissions reduction measures and improving the understanding of the dynamics of the global mercury cycle (Selin, 2009). These dynamics – including methylation, oxidation/reduction, dry/wet deposition and emission/re-emission – all have implications for the transport and environmental legacy of previously emitted mercury (Pirrone et al., 2010). The burden of this legacy is likely to be felt to varying degrees by all nations as, due to its long atmospheric lifetime, mercury is known to be distributed across hemispheric scales (Lin and Pehkonen, 1999; Holmes et al., 2010), and environmental reactions to changes in atmospheric loading may take place on the order of years to centuries (Meili et al., 2003; Lindberg et al., 2007). These concerns point to the necessity of an enhanced research effort to better understand the complexities of mercury biogeochmical cycling (Jaffe et al., 2014).
Although atmospheric mercury is known to be transported across hemispheric scales, it is understood that it can undergo deposition to, and rapid re-emission from, terrestrial surfaces – a process referred to as prompt recycling (Selin et al., 2008; Selin, 2009). The impact of this process has been estimated to contribute 256–1400 Mg a−1 to worldwide emission of mercury from terrestrial surfaces, based on 20 % prompt re-emission of deposited mercury (Selin et al., 2008; Kikuchi et al., 2013; Simone et al., 2014). Evidence for this process came from isotopic measurements (Hintelmann et al., 2002; Graydon et al., 2006), where newly deposited mercury was found to be more susceptible to re-emission to the atmosphere on a scale of days to months. Data from the Mercury Experiment to Assess Atmospheric Loadings in Canada and the US (METAALICUS) study suggest between 5 and 40 % of mercury newly deposited over terrestrial surfaces is promptly recycled (Hintelmann et al., 2002; Amyot et al., 2004; Selin et al., 2008). Further evidence has since been compiled during observations taken during atmospheric mercury depletion events (AMDEs), which are characterised by the rapid oxidation of gaseous elemental mercury (GEM) to the more reactive gaseous oxidised mercury (GOM) and subsequent deposition to the surface (Steffen et al., 2008, and references within). Flux studies by Lahoutifard et al. (2005) and Kirk et al. (2006) suggested net GEM emission from the surface following AMDEs, though others have seen very little subsequent GEM emission, or even net deposition to the surface (Brooks et al., 2006; Steffen et al., 2008). Further evidence for prompt recycling using surface GEM flux measurements is difficult to establish, as it is generally not possible to distinguish between mercury emitted from long-term stores and mercury re-emitted following atmospheric deposition (Gustin et al., 2006).
Despite the global nature of atmospheric mercury pollution both long-term monitoring and air–surface exchange research of this powerful neurotoxicant are weighted heavily towards industrialised countries in the Northern Hemisphere (United Nations Environmental Programme, 2013; Agnan et al., 2016). There is a lack of atmospheric mercury data taken within the Southern Hemisphere and in particular for Australia. Modelling efforts by Nelson et al. (2012) suggest that anthropogenic mercury emissions throughout Australia are around 10 to 20 Mg a−1, compared with 95 to 285 Mg a−1 emitted/re-emitted from natural sources. As patterns of wet and dry deposition of mercury are known to exhibit regional variability due to anthropogenic emissions (Pirrone et al., 2010), Australia provides a valuable opportunity for atmospheric mercury biogeochemical research as it is relatively unimpacted by anthropogenic sources. Atmospheric dry-deposition rates across remote regions of Australia were estimated by Nelson et al. (2009) to range between 20 and 70 µg m−2 a−1, based on background GEM pool concentrations of 1.2 ng m−3. Available empiricisms for such modelling efforts however are derived from Northern Hemisphere observations that may not apply to Australia's unique ecosystems (Nelson et al., 2009, 2012; Edwards and Howard, 2013). Furthermore, recent evidence has shown that background atmospheric GEM pool concentrations in the Southern Hemisphere are considerably lower than those in the Northern Hemisphere (Slemr et al., 2015), which may mean that delivery of atmospheric mercury to ecosystems in the Southern Hemisphere is currently overestimated. A recent review of mercury air–surface exchange research by Agnan et al. (2016) found only one Australian mercury flux study (Edwards and Howard, 2013) and showed there was a general lack of flux data taken over vegetated surfaces globally.
This study was undertaken over a grassland in the Snowy Mountains region of Australia's alpine country, during the austral summer. The site was chosen as it is the location of an ongoing OzFlux greenhouse gas net ecosystem exchange site. The micrometeorological aerodynamic gradient method was employed to obtain a high-time-resolution flux time series that did not disturb the natural ecosystem studied. This study furthers our understanding of Australian mercury cycling by providing additional background ambient and air–surface exchange data, and a comparison with similar existing flux datasets undertaken in alpine regions elsewhere. Further, we provide additional data on the process of prompt recycling observed during this study.
2.1 Site description
This study took place on Nimmo Plains (36∘12′57′′ S 148∘33′10′′ E, elevation 1340 m a.s.l.) in Australia's Snowy Mountains region, bordering the eastern boundary of Kosciuszko National Park. Measurements were taken between 28 January and 18 February (DOY 28 to 49). Nimmo Plains is a ∼ 40 ha region of reasonably level terrain (within 20 m elevation change) and the site of an ongoing OzFlux ecosystem research site. Vegetation immediately within the Kosciuszko National Park consists of dry sclerophyll forests that extend for a distance of at least 5 km. On the plain, vegetation consists predominantly of grasses of various Poa spp. that had largely senesced prior to this study. These grasses had been trampled and grazed by cattle to an average height of approximately 2 cm prior to the study taking place. Rainfall over the preceding 3 months (NDJ) was in the lowest 20th percentile since 1907, resulting in dry conditions. The plain is located 23 km to the north and 51 km west of the towns of Jindabyne (918 m a.s.l.; 2011 population: 1727) and Cooma (800 m a.s.l.; 2011 population: 6301) (Australian Bureau of Statistics, 2012). There are no known significant natural or anthropogenic mercury sources in the region.
2.2 Substrate characterisation
Substrates were characterised using samples taken in each of the four cardinal directions at distances 10, 30 and 50 m from the flux sampling tower. Surface vegetation, along with soils at depths of 0 to 2, 5 to 10 and 10 to 20 cm were sampled using clean equipment and stored in double-sealed plastic bags. Vegetation and soil samples were dried at 105 ∘C for 24 h, and soil samples were sieved into 2 to 19 mm (granules), 63 µm to 2 mm (sand) and < 63 µm (silt/clay) size fractions. Total mercury (THg) contents of soil and vegetation samples were determined in triplicate using a DMA-80 direct mercury analyser (Milestone Inc., Shelton, CT, USA) and US EPA Method 7473. Instrument precision was verified to within 5 % using five repetitions of 100 µL of a 100 ppb Hg standard between each run of 60 replicates. Accepted sample boat blank concentrations were < 0.002 ng THg. Soil organic carbon (SOC) and soil inorganic carbon (SIC) contents were determined according to the loss-on-ignition method described by Nelson and Sommers (1996). SIC values were multiplied by a correction factor of 1.36 under the assumption that it existed predominantly as carbonate (Bengtsson and Enell, 1986). Soil pH was determined using a 1 : 5 soil ∕ water suspension and CyberScan pH 300 (Eutech Instruments, Vernon Hills, IL, USA).
2.3 Flux instrumentation and methods
Eddy covariance flux measurements of sensible and latent heat, carbon dioxide (CO2) and momentum were taken at a height of 2.42 m using a CSAT-3 sonic anemometer (Campbell Scientific, Logan, UT, USA) and LI-7200 closed-path, infrared gas analyser (Li-Cor Biosciences, Lincoln, NE, USA). Samples were collected at 20 Hz using data capture software developed in-house using LabVIEW (National Instruments, Austin, TX, USA). Post-processing of eddy covariance fluxes and quality control were undertaken using Li-Cor EddyPro 5.2.1. The convention of positive values representing fluxes upward from the surface is used herein. The planar fit method of Wilczak et al. (2001) was applied across the entire dataset in order to rotate sonic anemometer data into mean wind coordinates, and ogive analyses were prepared across the longest continuous measurement period (5.4 days) according to Foken et al. (2006) in order to determine an appropriate flux averaging period. Quality control flags were calculated for each averaging period using the scheme of Foken et al. (2004), and fluxes given a flag 2 were discarded from further analyses. Additionally, flux values beyond the mean ±3 standard deviations were deemed outliers and removed. Tests for significance were performed using Student's two-sample t test, and use of the ± symbol hereafter signifies 1 standard deviation. Unless otherwise stated, significance is assessed at p<0.05.
GEM fluxes were determined using the method and assumptions outlined in Edwards et al. (2005). Flux calculations were undertaken according to Eq. (1), where C(zi) represents GEM concentration at height zi, u* friction velocity, k=0.40 the von Kármán constant, d the zero-plane displacement height and ψ(zi) the integrated universal similarity functions as given by Businger et al. (1971).
GEM gradients were constructed from samples taken at two heights (z1=0.48 m and z2=0.73 m) and quantified using a Tekran 2537B (Tekran Instruments, Knoxville, TN, USA), with detection limit of 0.01 ng m−3 and reference volumes reported at 1 atm and 0 ∘C. Density corrections due to water vapour were undertaken according to Lee (2000). Sample air was drawn from the sample inlets through a 0.2 µm polytetrafluoroethylene (PTFE) filter and a single PTFE tube of length 14 m by a PTFE pump drawing at 10 L min−1. The 2537B sub-sampled from this flow through an additional 0.2 µm PTFE filter. Switching of sampling between the intakes took place every 10 min (2 × 2537B samples) and was achieved using a PTFE solenoid valve controlled by the LabVIEW software. The random error in the gradient induced by the cumulative electronic and sampling delays following each switch of the solenoid was calculated to be 3 %. Calibration of the 2537B was undertaken 19 times throughout the study using the internal mercury permeation source. Verification of the permeation source was undertaken in the lab before and after the study using manual injection of mercury vapour to within 2 %.
2.4 Ancillary data
In addition to GEM fluxes, ambient GEM (at 3.1 m height) was quantified with a Tekran 2537A sampling at 1 L min−1 through an unheated 5 m PTFE tube and 2 × 0.2 µm PTFE filters. Calibration of the 2537A was undertaken every 23 h using the internal mercury permeation source, verified in the same manner as the 2537B. Comparison of the two 2537 instruments in the lab showed good agreement (< 4 % systematic difference) across a range of concentrations spanning 0 to 12 ng m−3. Ambient ozone (O3) was sampled at the same height using a Thermo Scientific 49i (Thermo Fisher Scientific, Waltham, MA, USA) sampling through a separate, unheated 5 m PTFE tube. Incoming and outgoing solar and terrestrial radiation were measured with a Campbell Scientific CNR1 net radiometer positioned at 1.5 m. Soil temperature was measured 2 cm beneath the surface with two Campbell Scientific TCAV temperature-averaging probes and soil volumetric water content at a depth of 5 cm with a Campbell Scientific CS615. Soil and radiation data were collected and stored using a Campbell Scientific CR3000 data logger.
Back trajectories and mixed-layer heights (MLHs) were modelled using NOAA's Single Particle Lagrangian Integrated Trajectory Model (HYSPLIT; Draxler, 1999; Draxler and Hess, 1998; Stein et al., 2015) with GDAS 0.5∘ data as inputs. Aerodynamic (ga) and bulk canopy (gc) conductances were calculated using Eqs. (2) and (2), by rearranging the Penman–Monteith equation (Monteith and Unsworth, 1990) in the same manner as Converse et al. (2010).
Here Δ is the slope of the vapour pressure curve at temperature T, γ the psychrometric constant, Rn net radiation, G soil heat flux, λE latent heat flux, ρa air density, cp specific heat of air at constant pressure, Da vapour pressure deficit and z0 the roughness length; the subscripts m and v represent momentum and water vapour, respectively.
We followed the method of Converse et al. (2014) and modelled dew depth on the basis of the surface energy balance methodology described in Jacobs et al. (2006). For each time step i of length Δt, the depth of dew (Di+1) was calculated using
where E is the dew flux density calculated from Eqs. (4)–(7) in Jacobs et al. (2006), derived from the surface energy balance using Penman's substitution. Surface temperatures were calculated from CNR1 outgoing longwave-radiation data using the Stefan–Boltzmann equation and an emissivity of 0.95 (Oke, 1987).
A simple box model was employed in order to investigate the influence of observed nocturnal GEM deposition. This model took MLH from HYSPLIT outputs H and imposed a constant entrainment velocity w=0.005 m s−1 between the mixed layer and free troposphere. No chemical production or destruction of GEM was incorporated in the model, as this would have led to speculation regarding unknown concentrations of important oxidative and reductive species. The model was started for each day at sundown (net shortwave < 20 W m−2), and the GEM concentration in the free-tropospheric Cft was set as the observed mean GEM concentration across the previous hour. The modelled GEM concentration C was then calculated using Eq. (3).
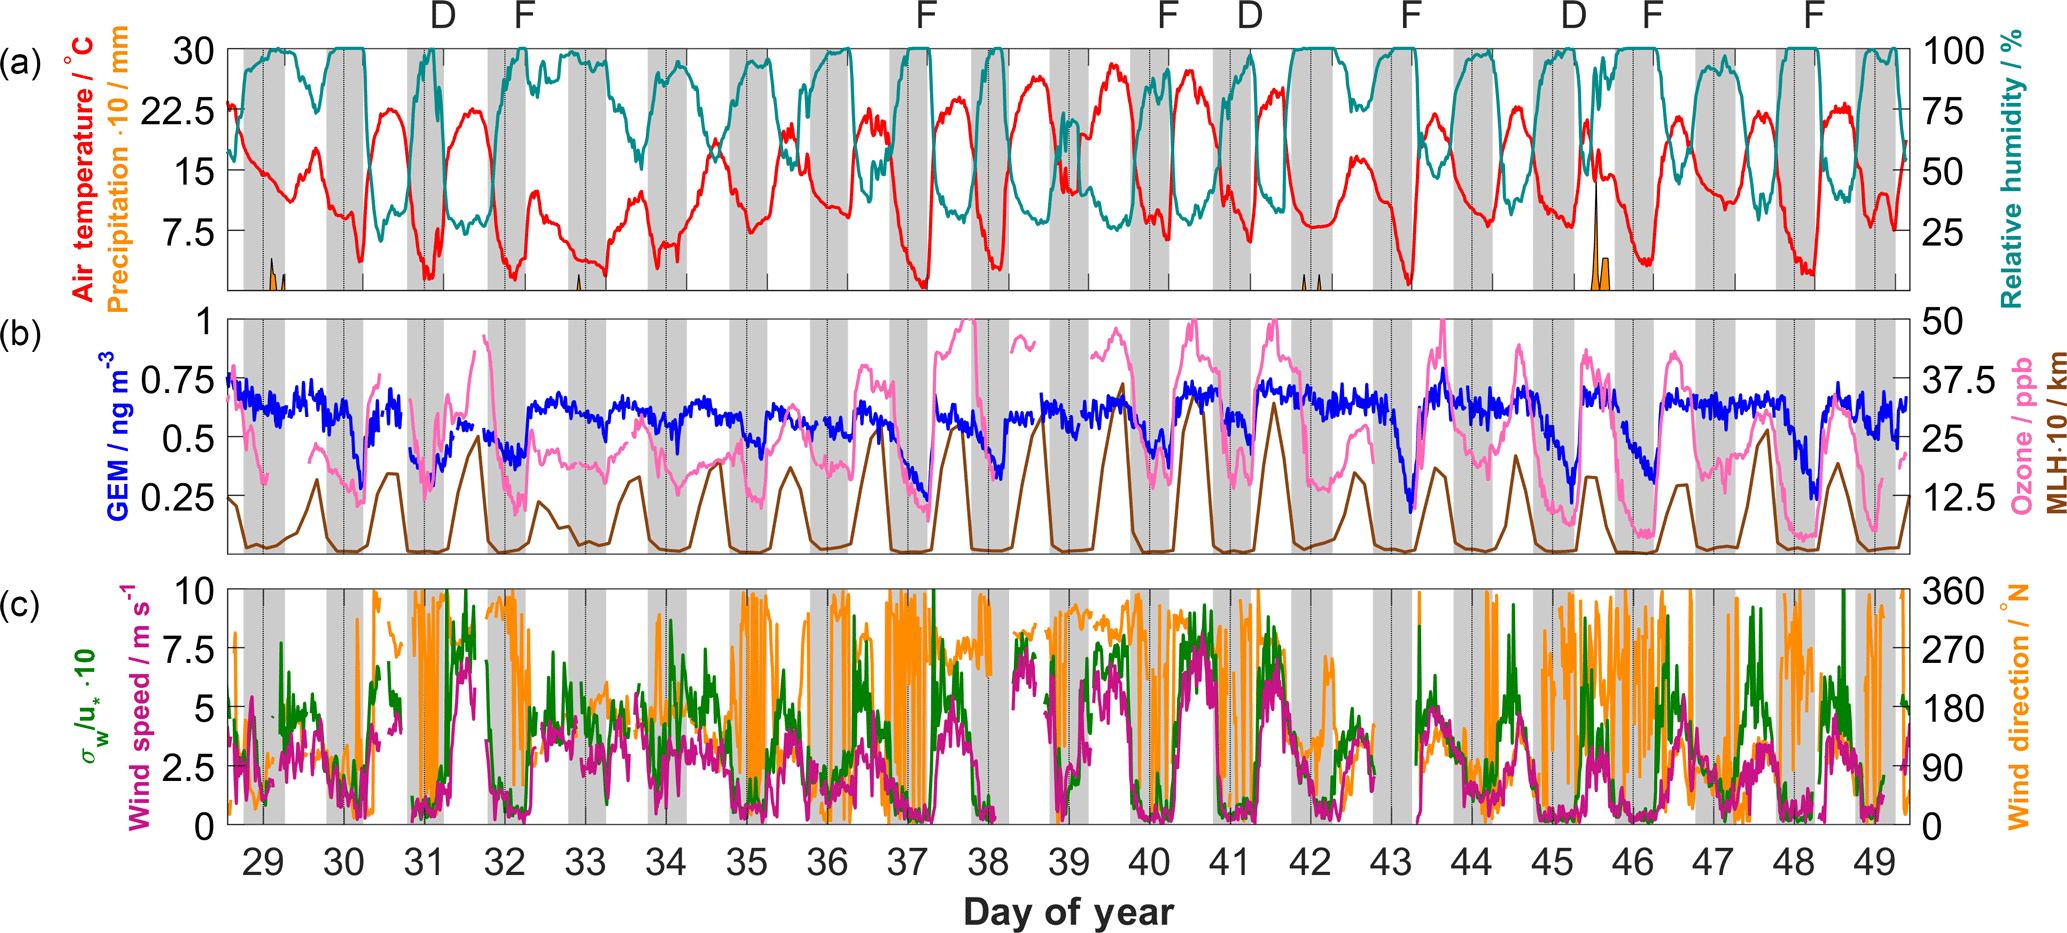
Figure 160 min averaged meteorological variables and ambient GEM/O3 during the campaign. Colours for each variable match those on the axis label. Shading represents nocturnal periods (net shortwave < 20 W m−2). Observations of dew and fog are denoted above the upper panel by “D” and “F”, respectively.
3.1 Observations and trends
3.1.1 Site characterisation
Substrate sampling confirmed background (< 100 µg kg−1; Gustin et al., 2006) THg levels, with vegetation shown to have average concentrations of 18 ± 3 µg kg−1 (n=12). THg content in the soil was found to be 48 ± 9 µg kg−1 (n=36) and did not vary significantly with depth or size fraction. Soils were predominantly sandy, with silt and clay making up 7 % of mass below 2 mm, and mildly acidic (pH = 4.9). No soil material was found to have a diameter greater than 19 mm. SIC was spatially uniform both horizontally and vertically (6 ± 1 %, n=36), whereas SOC varied with depth, from 15 ± 2 % (n=12) in the upper 2 cm to 8 ± 1 % (n=12) in the 10–20 cm layer. Fibrous root matter was observed to extend to a depth of around 10 cm.
3.1.2 Meteorological observations
Weather over the study period was dominated by high-pressure systems, punctuated by weak troughs that brought patchy cloud and minor showers (Fig. 1). Temperatures ranged between 2 and 28 ∘C, with an average overnight minimum of 6 ∘C and average daily maximum of 22 ∘C. Winds were primarily from the higher, forested Kosciuszko range to the west, peaking at 8 m s−1, though nights were predominantly calm and stable. Following the calmest of these nights, fog events were witnessed and/or dew was observed. As no instrumental measurements of either fog or dew took place, such events were manually noted with the first observations of the day, taken at sunrise. These observations are noted in Fig. 1. Nights following which both dew modelling and observations at sunrise confirmed the existence of dew are hereby termed “dew nights” (n=8), and those where the existence of dew may or may not have been indicated from modelling but manual observations could not corroborate this are hereby “non-dew nights” (n=10). Measurements had failed during two of the nights, and therefore there were insufficient data to undertake dew modelling.
3.1.3 GEM concentrations
GEM concentrations throughout the study were 0.59 ± 0.10 ng m−3. Diurnal GEM concentrations were slightly higher than the mean and less variable at 0.63 ± 0.08 ng m−3. Nocturnal GEM concentrations were 0.54 ± 0.10 ng m−3. Wind direction and HYSPLIT analyses showed that there was no influence from significant GEM sources. These values are lower than annual mean sea-level measurements recently reported across the Southern Hemisphere (Slemr et al., 2015; Howard et al., 2017). Analysis of the systematic uncertainty of the 2537 system by Slemr et al. (2015) suggests this can be on the order of 0.1 ng m−3. With this uncertainty taken into consideration, GEM concentrations observed over the study were significantly (p < 0.0001) lower than for all four sites operating in the same year (Cape Point, Amsterdam Island, Cape Grim, Troll; Slemr et al., 2015). This comparison is only against annual means for these sites and cannot account for any seasonal or regional variation. More recent observations of ambient GEM in Sydney (33∘45′55′′ S, 151∘07′04′′ E; elevation: 59 m) over the period February–September 2015 gave a mean value of 0.64 ng m−3 (Sawyer, 2016).
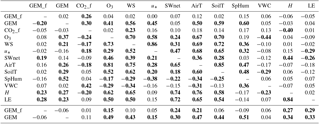
Linear correlation with environmental correlates using all available data was generally stronger for ambient GEM than for GEM fluxes (Table 1). The strongest significant relationship was with specific humidity (r=0.51), followed by O3 (r=0.49) and air temperature (r=0.47). For diurnal data, correlation was maintained with specific humidity (r=0.52), though it decreased for O3 (r=0.37) and air temperature (r=0.26). Peak diurnal O3 followed a similar trend to peak MLH (Fig. 1b), whilst diurnal GEM changed very little, further confirming the absence of local sources. For nocturnal data, correlation with both O3 (r=0.41) and air temperature (r=0.50) were higher than for diurnal data. Nocturnal wind speed was also significantly correlated (r=0.56), as was specific humidity (r=0.60). Each of these variables showed significant decreases on some nights, though not on others. These decreases will be discussed further in Sect. 3.3.
Table 1Correlations between hourly averaged flux and measured environmental variables. The top right triangle represents nocturnal data (n=102); the bottom left triangle represents diurnal data (n=128). The bottom two rows represent correlations using all data (n=230). Bold type represents significance at p<0.05. Abbreviations are as follows: GEM_f: GEM flux (ng m−2 h−1); CO2_f: CO2 flux (µmol m−2 h−1); WS: wind speed (m s−1); u*: friction velocity (m s−1); SWnet: net shortwave radiation (W m−2); AirT: air temperature (∘C); SoilT: soil temperature (∘C); SpHum: specific humidity (kg kg−1); VWC: volumetric water content (m3 m−3); H: sensible heat flux (W m−2); LE: latent heat flux (W m−2).
3.2 GEM fluxes
3.2.1 Quality control
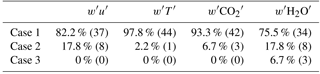
Ogive analyses on wind, temperature, CO2 and H2O showed that most scalar fluxes were convergent within 20 min and that low-frequency contributions at this site had little influence on fluxes, up to 150 min (Table 2). Though each scalar has its own unique sources and sinks (Foken et al., 2006), these results were taken to suggest that low-frequency contributions to GEM fluxes at this site were also minimal. The averaging period was set at 60 min, as this gave some smoothing to both flux and environmental data, allowing for greater comparison between the two that was not achievable using 20 min averaging. No further averaging or smoothing of GEM flux data was applied. Following the application of quality control protocols, GEM flux values were obtained for 87 % of the study period; 39 % of flux values fell below the theoretical detection limit (Eq. 8, Edwards et al., 2005). These were not removed as doing so would have resulted in an artificial increase of the observed mean (see also Fritsche et al., 2008a; Converse et al., 2010).
Table 2Results from ogive analyses. Definitions of cases are given in Foken et al. (2006) and here describe comparisons between 20 and 150 min covariance averaging.
3.2.2 Overview
Bi-directional GEM fluxes were observed during the study and were normally distributed with a mean of 0.2 ± 14.5 ng m−2 h−1 (Fig. 2). The range of GEM fluxes was between −52.9 and 54.7 ng m−2 h−1, with generally greater magnitudes throughout the day than at night. Mean nocturnal fluxes were significantly different to diurnal fluxes, at −1.5 ± 7.8 ng m−2 h−1 compared to 1.8 ± 18.6 ng m−2 h−1. Over the entirety of the study, the net cumulative GEM flux was close to zero (Fig. 3a) as net deposition to the surface seen in the first 7 days was balanced by net emission throughout the remaining period. Low biological productivity in the underlying vegetation, suggested by manual observations, was confirmed by observed CO2 fluxes that were largely positive with net cumulative CO2 flux across the period of 1.7 mol m−2 (Fig. 3a). Both GEM and CO2 fluxes were bi-directional and showed high variability on sub-diel timescales (Fig. 3b). The mean GEM deposition velocity calculated using all data was 0.0 ± 0.7 cm s−1 (positive values indicate deposition to the surface) and ranged from −2.2 to 2.9 cm s−1. Mean nocturnal and diurnal deposition velocities were opposite in sign (direction), though not significantly different at 0.1 ± 0.4 cm s−1 and −0.1 ± 0.9 cm s−1, respectively.
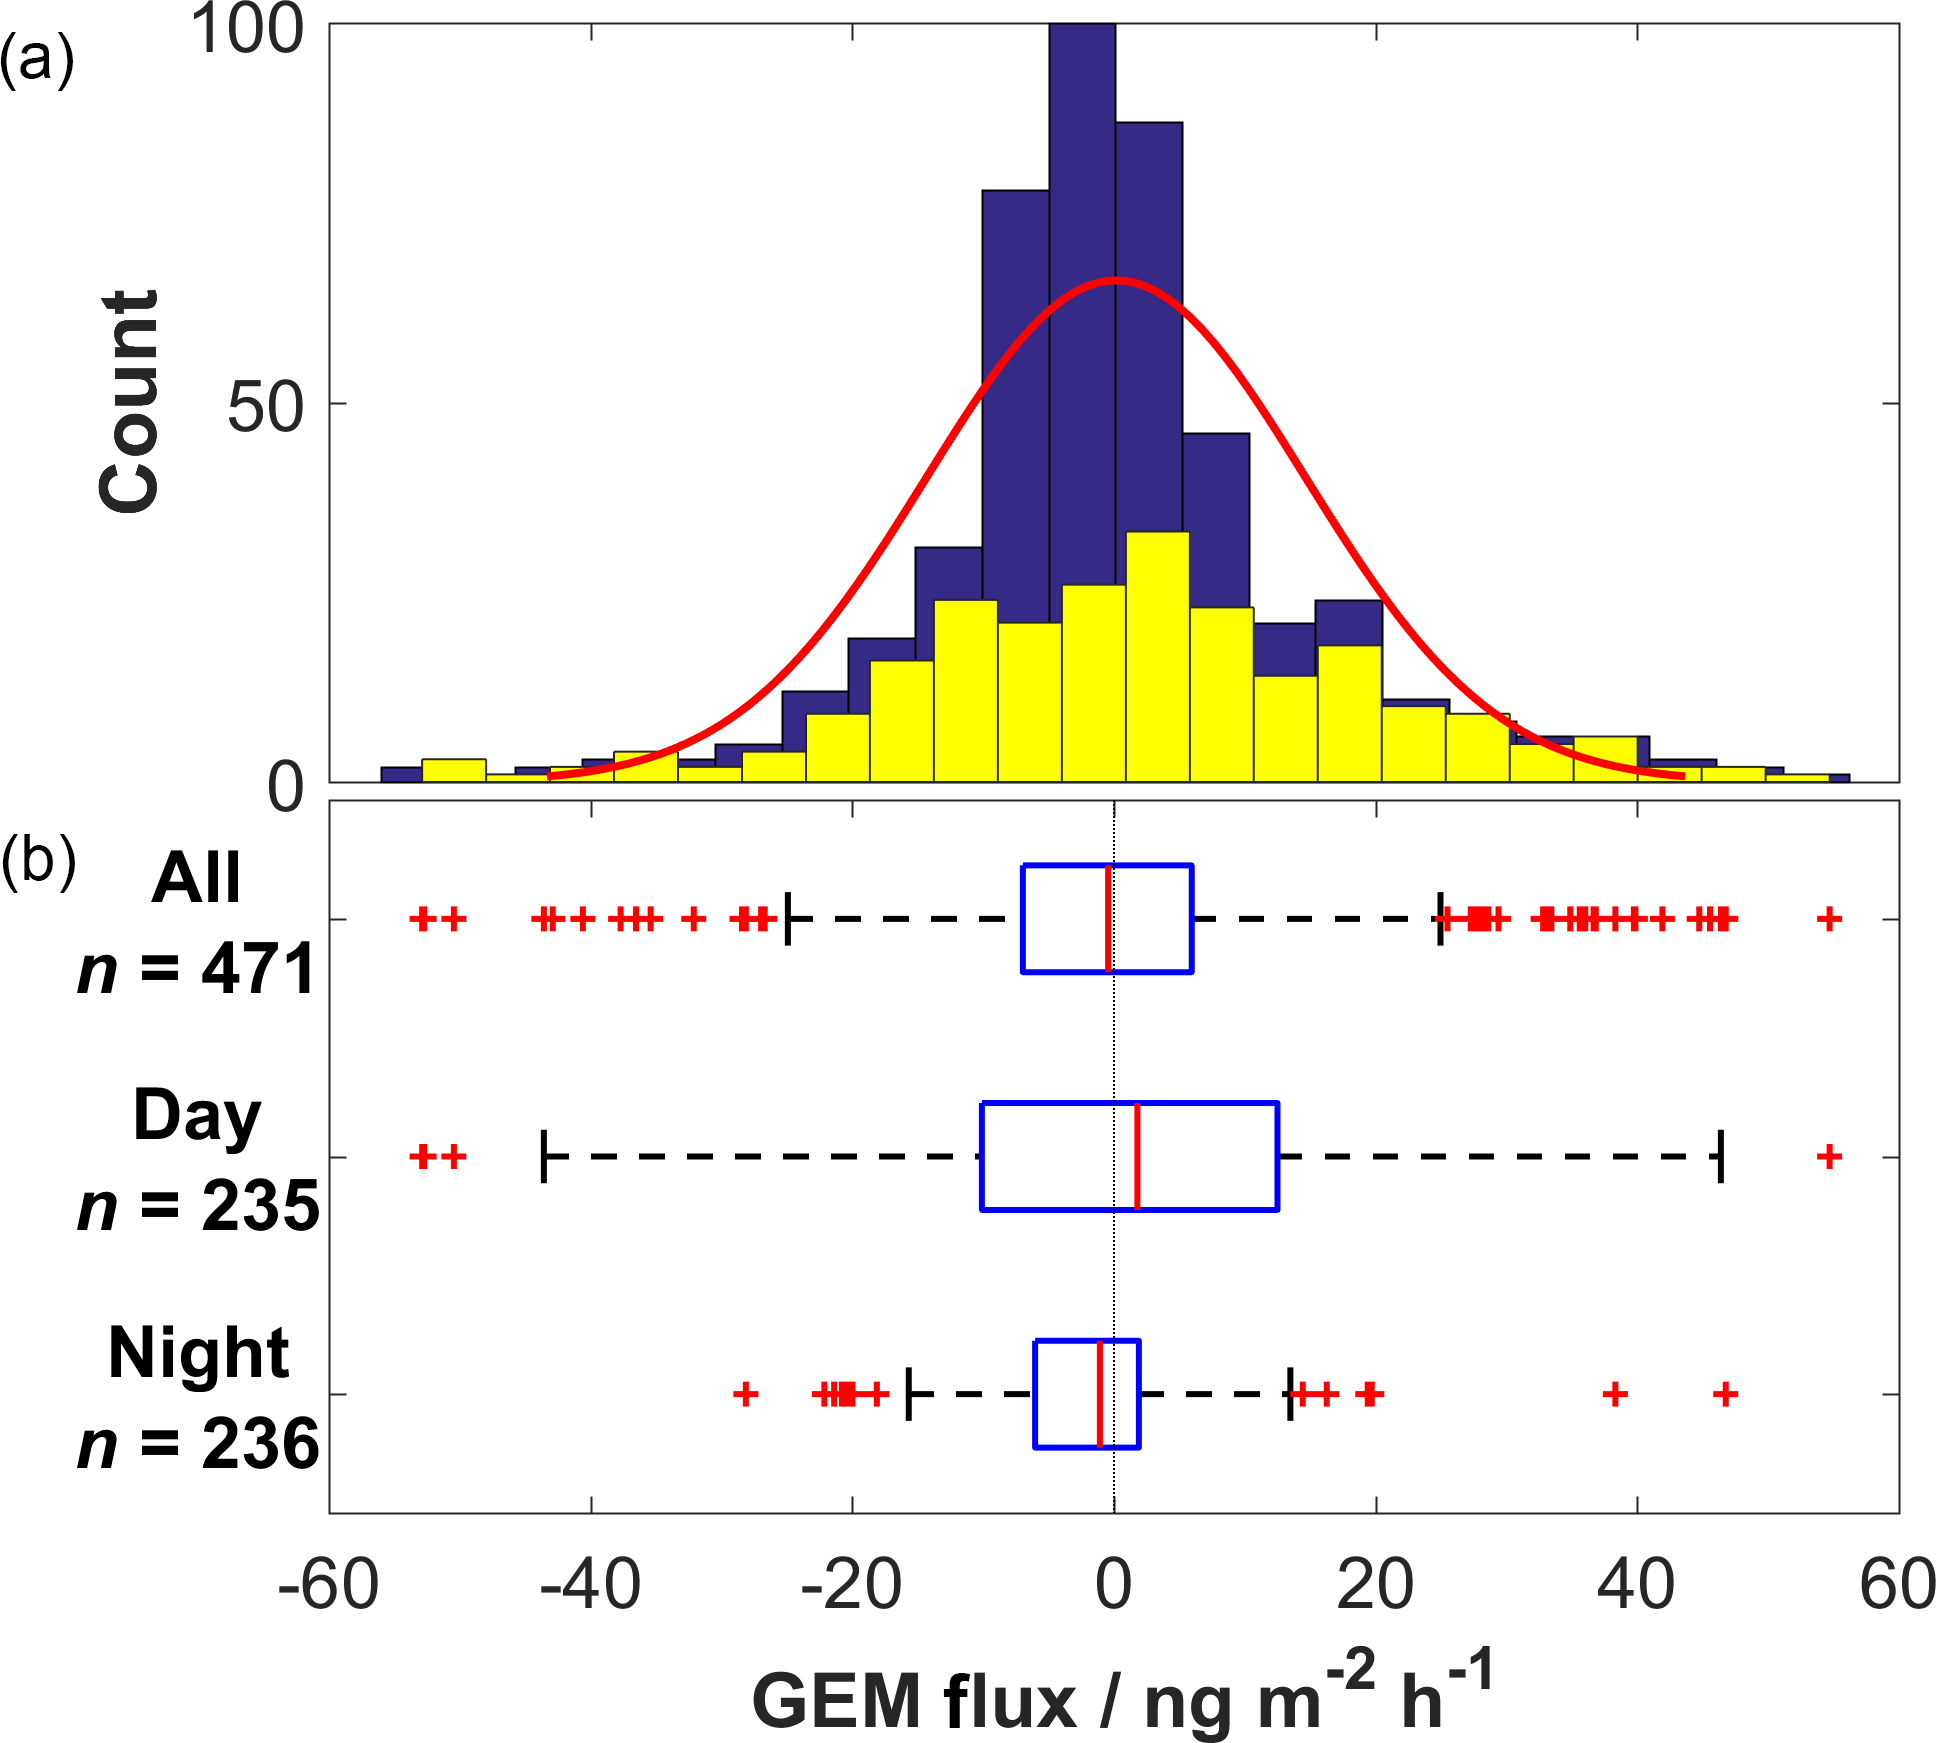
Figure 2(a) Histogram of GEM flux values. Yellow bars represent diurnal data; blue bars represent nocturnal data. Red line is Gaussian fit to all data. (b) Box plots for all, diurnal and nocturnal GEM flux data. Red lines represent medians, blue boxes inter-quartile range (IQR), whiskers 1.5 ⋅ IQR and red crosses outliers.
Table 3Mean GEM, GEM flux and deposition velocity values (± 1 standard deviation, range in parentheses) for various studies undertaken over background THg substrate in sub-alpine grasslands during summer periods. Values taken from a Obrist et al. (2006), b Fritsche et al. (2008b) and c Converse et al. (2010). Values obtained using d modified Bowen ratio method and 30 min averaging, e aerodynamic gradient and 30 min averaging, f aerodynamic gradient and 20 min averaging, g aerodynamic gradient and 60 min averaging.
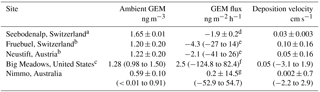
3.2.3 Comparison with other flux studies
Patterns of net diurnal emission and nocturnal deposition were reported by Fritsche et al. (2008b) and Converse et al. (2010) for summertime periods over subalpine grasslands in Fruebuel, Switzerland, and Big Meadows, USA (Table 3). The range of flux values observed here is larger than those reported by Fritsche et al. (2008b) yet lower than those reported by Converse et al. (2010). Determining the significance of these differences however is difficult, as flux averaging periods differed across each of the studies, as well as application of temporal smoothing. The mean deposition velocity is within the range of uncertainty of those reported at Fruebuel and Neustift, Austria (Fritsche et al., 2008b). Greater variation in deposition velocities was seen here, albeit with a similar range to those seen at Big Meadows (Converse et al., 2010). The mean deposition velocity was significantly lower than that reported for Seebodenalp, Switzerland (Obrist et al., 2006).
Comparability of deposition velocities was maintained despite a mean ambient GEM concentration between 50 and 64 % lower than those reported at the Northern Hemisphere sites. It is not reported in these papers whether the underlying vegetation had senesced, and so the relative control on fluxes by vegetation may differ across sites. Converse et al. (2010) concluded that there was no relationship between their observed GEM fluxes and stomatal conductance. Seasonal studies by these authors (Fritsche et al., 2008a; Converse et al., 2010) as well as modelling studies such as Hartman et al. (2009) have shown increased deposition of GEM to the surface during vegetation growing seasons, and we therefore expect that deposition velocities at Nimmo would similarly change throughout the year as biological activity increases. Further discussion of deposition velocities across different ecosystems is given in Zhang et al. (2009). The agreement between deposition velocities obtained here and elsewhere over similar conditions provides evidence towards the robustness of such an approach to estimating GEM deposition.
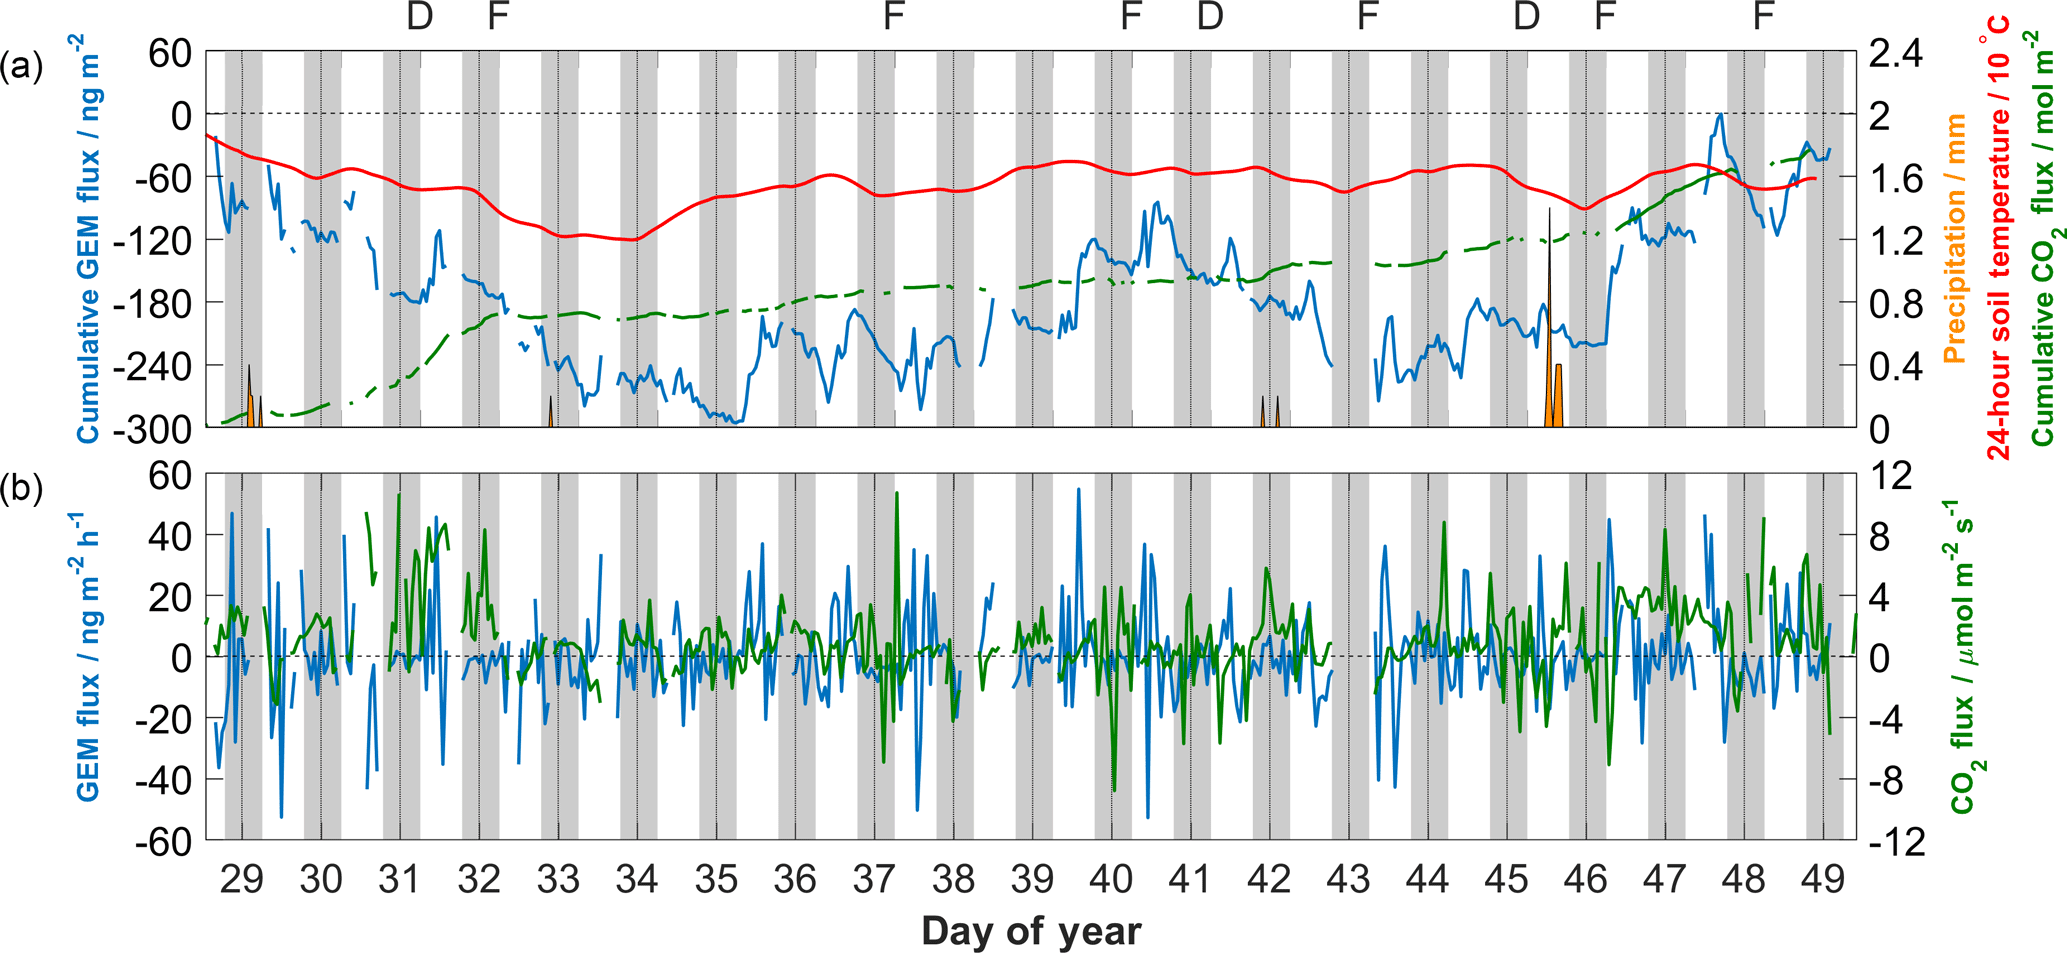
Figure 3(a) Cumulative GEM and CO2 fluxes across the study period, along with precipitation and 24 h running means of soil temperature at 2 cm depth. Colours match those of axis labels. Observations of dew and fog are denoted above by “D” and “F”, respectively. (b) 60 min GEM and CO2 fluxes over the study period.
3.2.4 Environmental correlates
Factors that have been identified as controls on GEM surface exchange in the literature include soil moisture (Gustin et al., 2006), precipitation (Song and Van Heyst, 2005), radiation (Carpi and Lindberg, 1997; Choi and Holsen, 2009), temperature (Gustin et al., 1997; Choi and Holsen, 2009), vegetation (Hanson et al., 1995; Stamenkovic and Gustin, 2009) and GEM/oxidant concentrations (Engle et al., 2005; Zhang et al., 2008). Linear correlations between GEM fluxes and environmental data were generally weak (Table 1). The strongest significant relationship using all available data was with latent heat flux (r=0.29), followed closely by sensible heat flux (r=0.27), net solar radiation (r=0.24) and air temperature (r=0.21). A similar result was seen for diurnal data, whilst for nocturnal data the only significant correlation was with CO2 flux (r=0.26).
Soil volumetric water content (VWC) was low (< 0.07; wilting point: 0.08) for most of the study and had no significant linear relationship with GEM fluxes. The precipitation event on DOY 45 was the only to impact VWC, raising it from 0.06 to 0.08. The two largest maximum diurnal cumulative GEM emissions (cumulative GEM flux from sunrise to peak value) of 128.2 and 112.1 ng m−2 occurred on the days following this event (Fig. 3a), as VWC receded down to 0.07. This is consistent with the laboratory results of Gustin and Stamenkovic (2005), who hypothesised that evaporation of soil water helps mobilise mercury adsorbed to soil matter upwards to the air–surface interface. In their study, a pulse of GEM emission was observed immediately after precipitation events, attributed to expulsion of soil GEM from within the pore space. Such an immediate pulse was not observed during DOY 45, likely due to the small amount of precipitation in this event and its minimal impact on the already-dry soil.
Solar radiation and temperature have been independently shown to influence GEM fluxes from soils via photo-reduction and volatilisation of stored mercury (Lindberg et al., 2007; Zhang et al., 2009), though their inherent interconnectedness makes it difficult to resolve relative influence in the field. Kikuchi et al. (2013) showed that inclusion of surface air temperature in parameterisations of soil GEM emissions gave closer reproduction of seasonal observations than with radiation alone. Shading by overlying vegetation may also reduce the influence of solar radiation on soil GEM emission (Carpi and Lindberg, 1998). Linear correlation between GEM flux and net radiation was similar to that with air temperature, though GEM flux showed low correlation with soil temperature. The low linear correlation between GEM flux and soil temperature compared to scalar fluxes of heat may suggest that turbulent atmospheric processes (quasi-laminar and turbulent diffusion), rather than in-soil processes, represent the larger influence on GEM fluxes. Zhu et al. (2015) found stronger relationships between aerodynamic variables and GEM fluxes when measured by micrometeorological methods than when measured with flux chambers, suggesting the choice of measurement may influence these relationships. Edwards and Howard (2013) however similarly observed stronger relationships with atmospheric variables and GEM fluxes measured using dynamic flux chambers over bare background THg soil. The stronger relationship with air temperature than with soil temperature only held across sub-diel timescales; comparing cumulative GEM flux to 24 h averaged temperature data (Fig. 3a) resulted in a much stronger correlation with soil temperature (r=0.62, p < 0.0001, n=443) than with air temperature (r=0.36, p < 0.0001, n=443).
Median diel composite CO2 fluxes were almost consistently positive both during the day and at night (Fig. 4b), excepting a notable period between 1 and 3 h after sunrise during which median net CO2 release switched to uptake before reverting back to release. Overnight GEM fluxes were close to zero with little variance relative to daytime (Fig. 4a); however during the day two peaks of GEM emission can be seen, the largest coinciding with solar noon, whilst the smaller peak occurred shortly after sunrise and coincides with an increase in bulk canopy conductance of water vapour. The cessation of this early pulse coincides with the switch to CO2 uptake that may be related to uptake of GEM by the underlying vegetation. However, the correlation between the timing of the early GEM pulse and the brief increase in bulk canopy conductance suggests that this pulse is likely related to evaporation of dew. The bimodal pattern of GEM fluxes has been observed previously by others (e.g. Lindberg et al., 1998; Fritsche et al., 2008b; Bash and Miller, 2008; Zhu et al., 2015) and attributed to co-deposition of mercury with dew overnight, with subsequent re-volatilisation of GEM as the dew is evaporated from the surface. The linear correlation of GEM fluxes with latent heat fluxes in this study similarly provides evidence for this explanation of the bimodal GEM flux pattern.
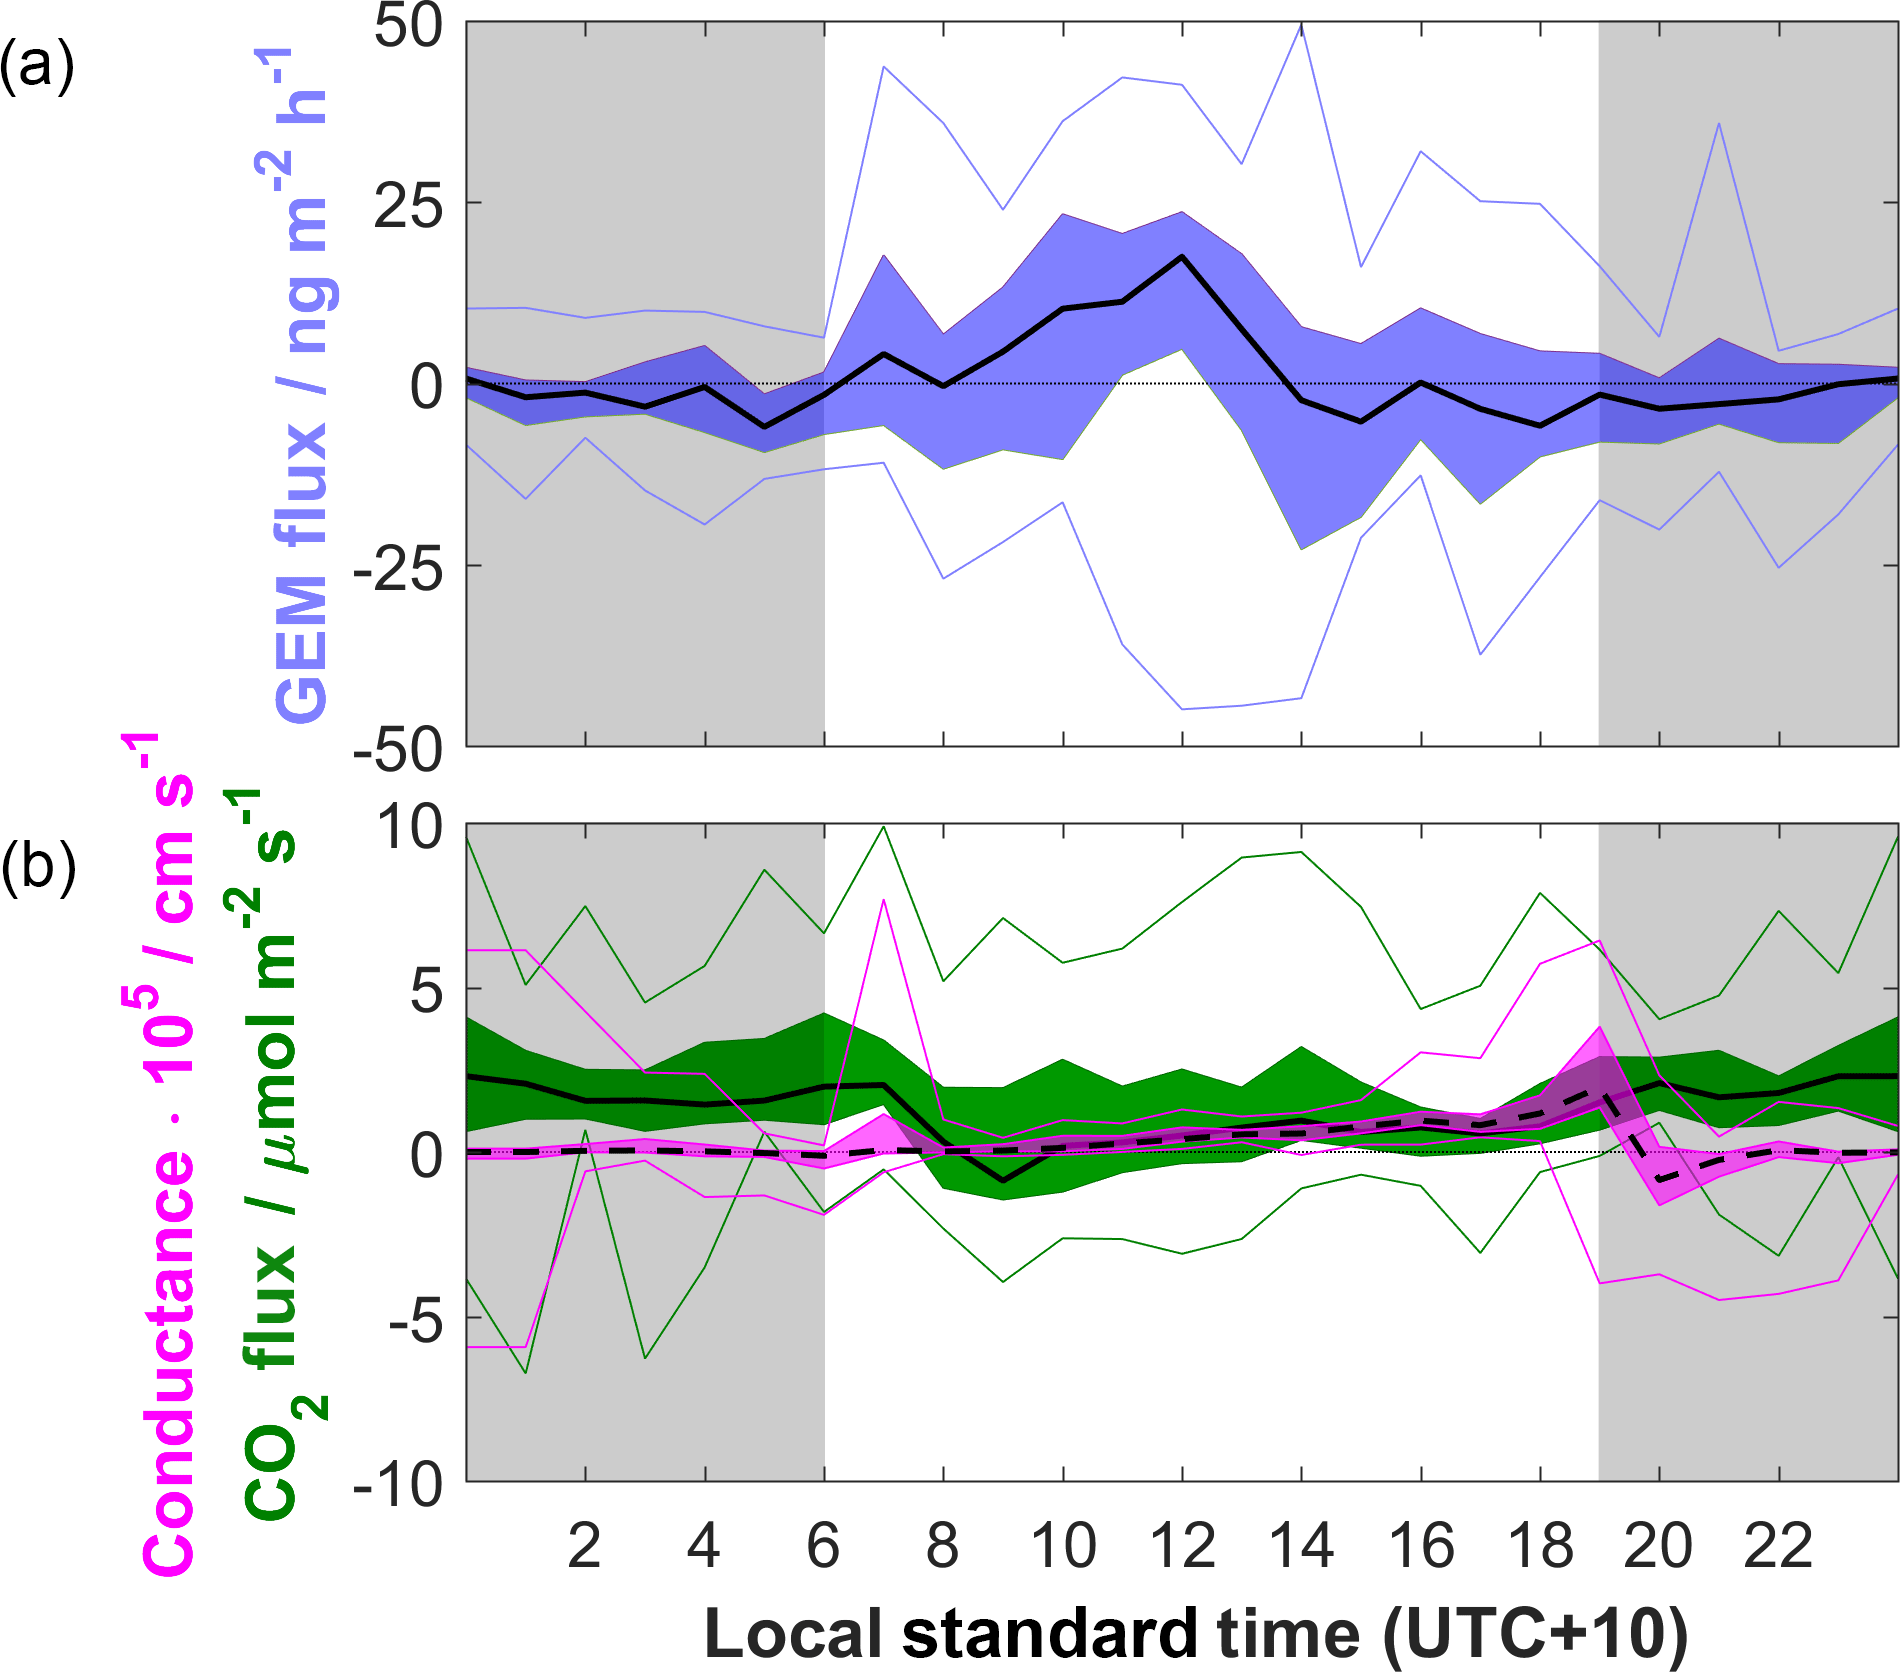
Figure 4(a) Diel composite of GEM flux values. Black line represents median values, blue shading inter-quartile range (IQR), and blue lines 5th and 95th percentiles. Grey shading represents nocturnal periods. (b) As above for CO2 fluxes (solid black line, green shading) and bulk canopy conductance for water vapour (broken black line, magenta shading).
3.3 Nocturnal atmospheric mercury depletion events
Both GEM and O3 concentrations, as well as air temperature and wind speed, were intermittently observed to show significant decreases (Fig. 1b), twice to below instrument detection limits for GEM. These nocturnal atmospheric mercury depletion events (NAMDEs) occurred exclusively overnight, with concentrations returning to pre-depletion levels after sunrise. Depletion was most pronounced during the calm, stable dew nights. Patterns of depletion differ for GEM and O3, with O3 exhibiting initially rapid depletion followed by slower removal, mirroring decreases in atmospheric turbulence (linear correlation with for dew nights; r=0.86, p < 0.0001, n=86). GEM concentrations show a more linear rate of depletion through to sunrise, when both GEM and O3 levels increase with the turbulent breakup of the nocturnal boundary layer. These differences in patterns are particularly pronounced on DOY 45, 46 and 48 and are similar in character to the depletion events reported by Mao et al. (2008). Similar nocturnal depletion events have been reported elsewhere (e.g. Engle et al., 2010; Peleg et al., 2015; Fu et al., 2016; Howard et al., 2017) and differ from the better-known polar AMDEs (Steffen et al., 2008, and reference within), as the former take place in the absence of sunlight and photolytic reactions. HYSPLIT trajectories showed no distinct source pattern for NAMDE nights, suggesting that the observed phenomena are due to local interactions and not the result of long-range transport of depleted air masses such as those observed by Gauchard et al. (2005), Mastromonaco et al. (2016) and Moore et al. (2014).
Nocturnal composites of cumulative GEM flux, ambient GEM and modelled ambient GEM/dew were composed to further explore NAMDEs, demarcating between dew and non-dew nights. Figure 5 confirms that depletion of GEM occurred exclusively during dew nights, highlighting dew or fog as a potential sink of GEM. Field studies of mercury concentrations in fog water (e.g. Ritchie et al., 2006; Weiss-Penzias et al., 2012) are rare, though concentrations up to 435 ng L−1 have been reported (Ritchie et al., 2006). When estimating conservatively using this concentration and a fog droplet density of 0.05 g m−3, only 0.02 ng m−3 of GEM depletion can be explained by fog uptake. Field measurements of mercury in dew are also limited, though they have generally shown that it represents only a small sink for atmospheric mercury. Malcolm and Keeler (2002), from the first such measurements, calculated values of mercury deposition that ranged between 1.2 and 9.6 ng m−2 per dew event. THg concentrations similar to those from Malcolm and Keeler have since been reported by Engle et al. (2010) and Converse et al. (2014). Engle et al. (2010) reported GEM depletion events coincident with their dew mercury measurements and concluded, based on a mass balance approach, that mercury uptake to dew could explain < 1 % of observed depletion. From the combined dew measurements of Malcolm and Keeler (2002), Engle et al. (2010) and Converse et al. (2014) a reasonable estimate of dew mercury concentration is 6.3 ± 4.9 ng L−1 (n=27). Applying this concentration to the median modelled dew depth (0.13 mm) gives a cumulative nocturnal deposition to dew of 0.82 ng m−2.
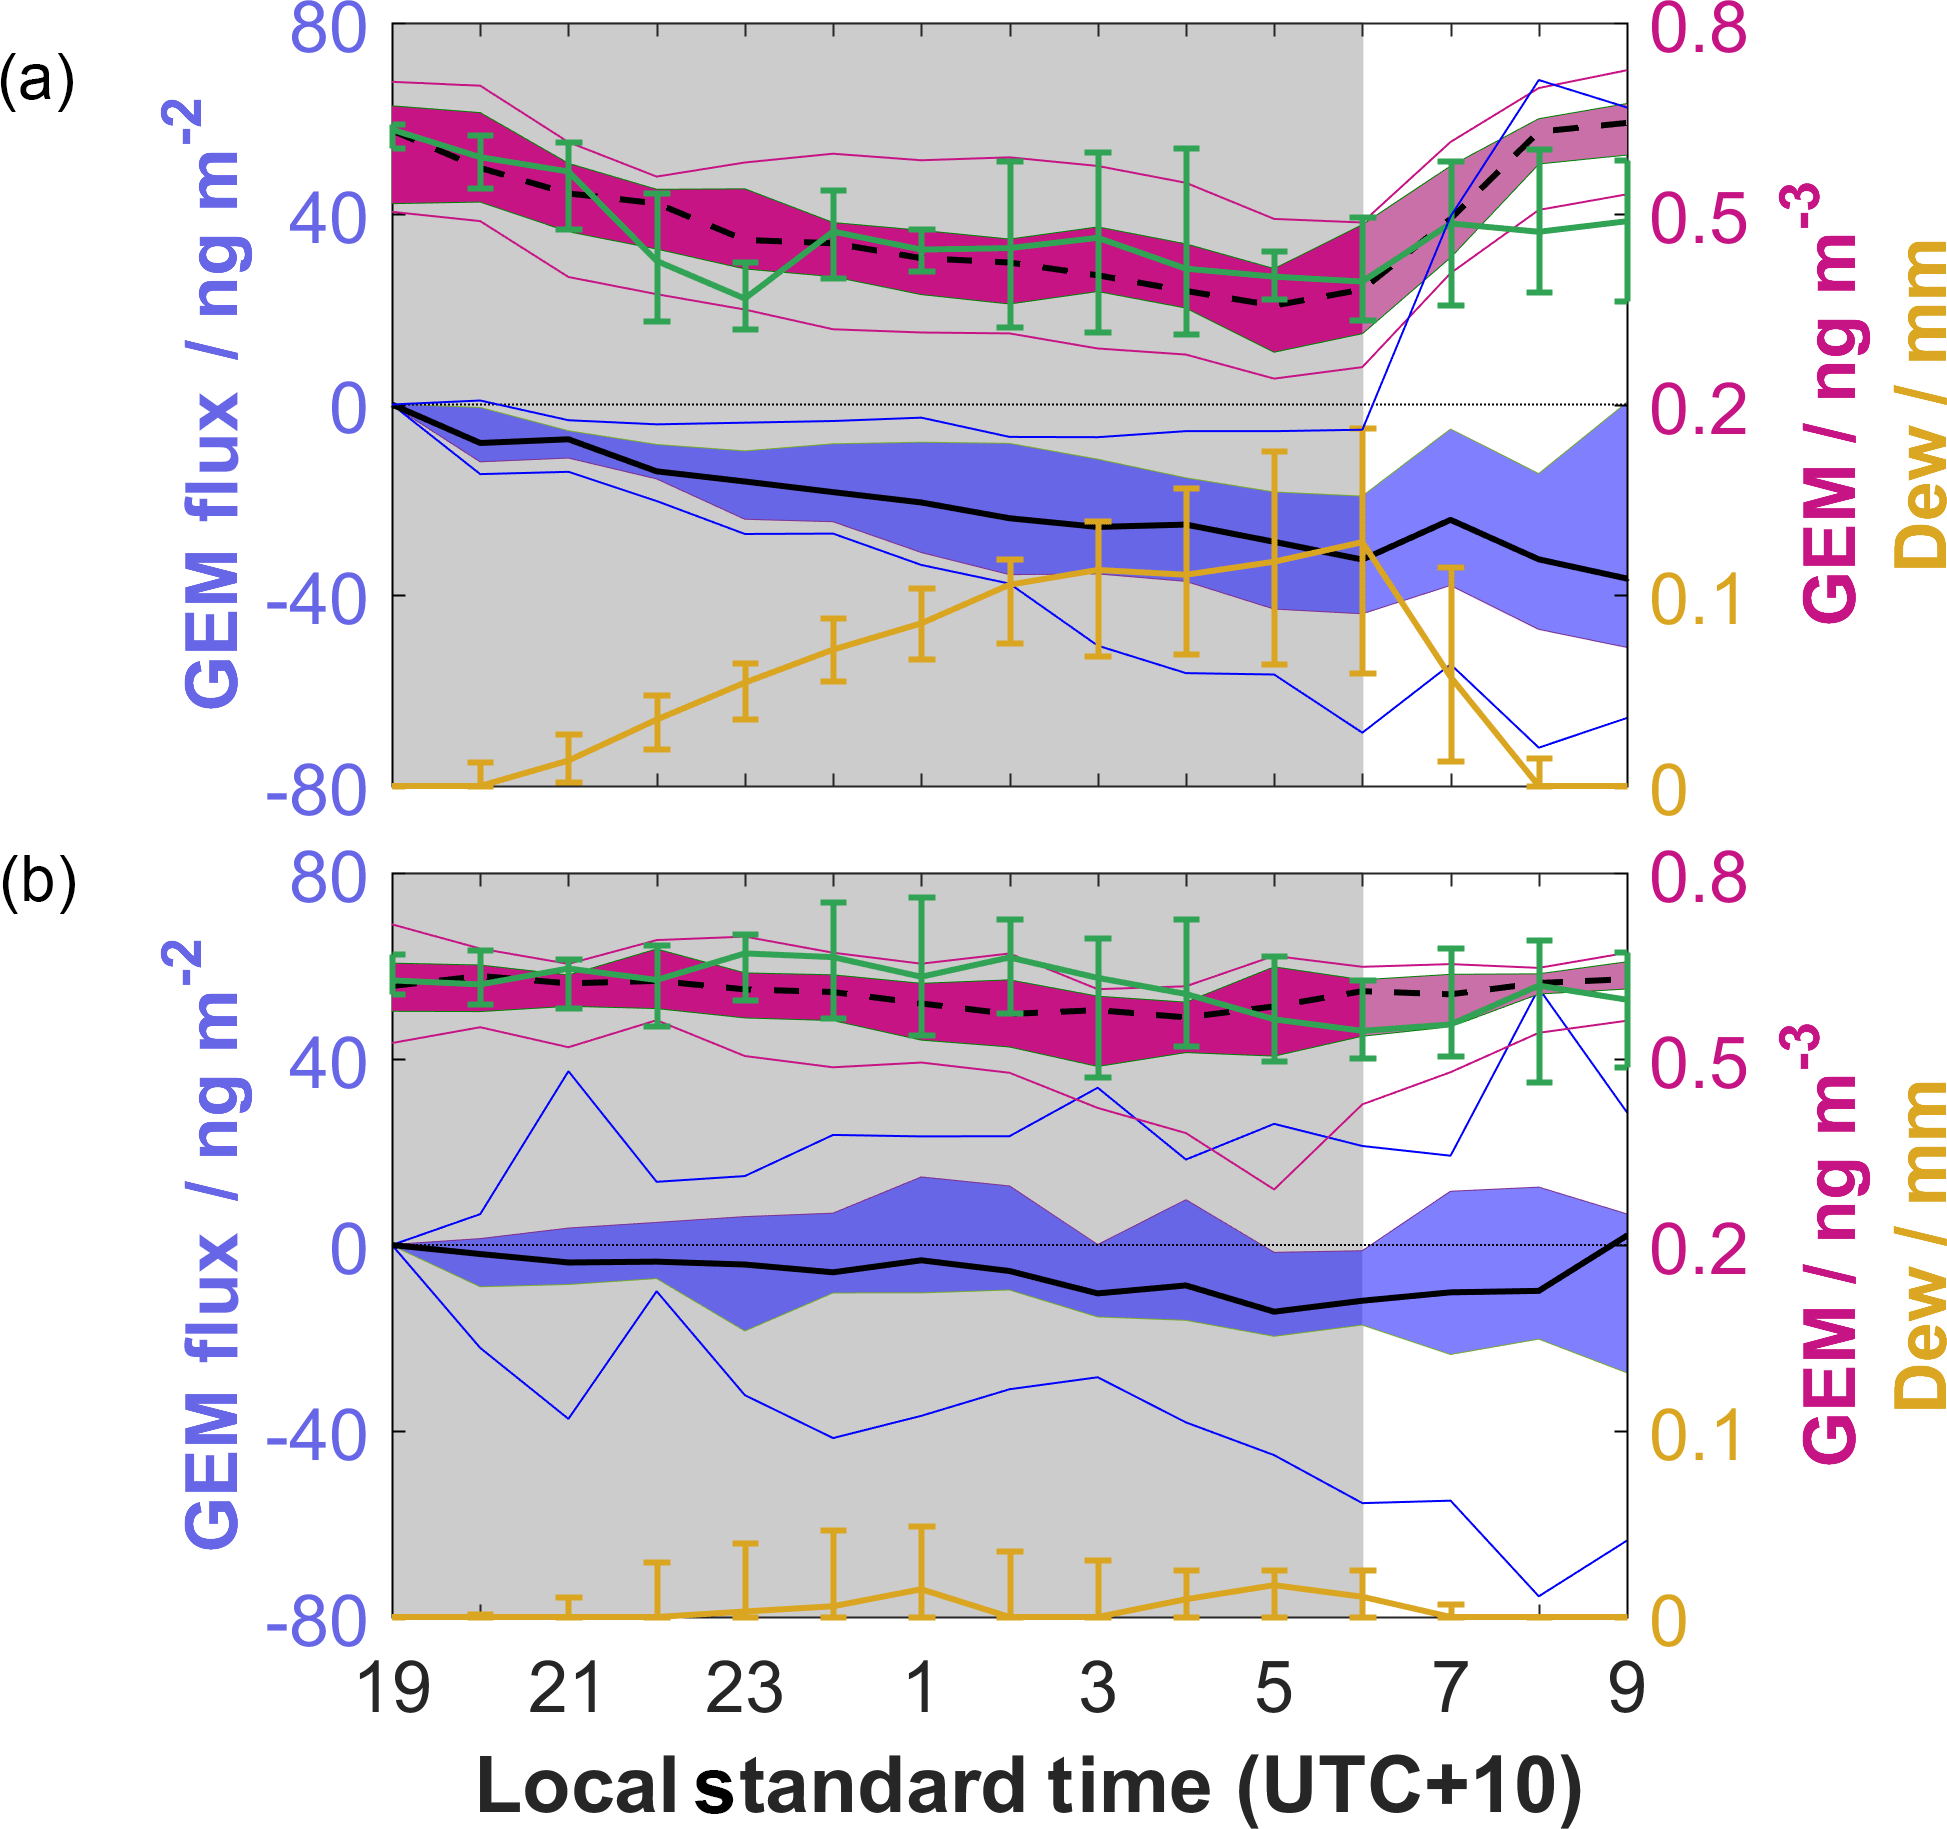
Figure 5(a) Nocturnal composites for dew nights. Solid black line represents median cumulative GEM flux, blue shading inter-quartile range (IQR), and blue lines 5th and 95th percentile. Black broken line represents ambient GEM, magenta shading IQR, and magenta lines 5th and 95th percentile. Green line and error bars represent median modelled ambient GEM and IQR. Yellow lines and error bars represent median modelled dew depth and IQR. Note the change in scaling on the right axis. (b) As above but for non-dew nights.
Peleg et al. (2015) observed nocturnal depletion of GEM, concurrent with measurements of GOM and nitrate (NO3). They showed evidence of NO3 assisting in the oxidation of GEM to GOM overnight, noting a strong correlation between NO3 and GOM, and weak correlations between GOM and other measured variables such as O3 and wind speed. Mao et al. (2008), in chemical modelling of their observed depletion events, attributed 80 % of chemical oxidation of GEM to NO3, whilst also considering oxidation by O3 and OH. The presence of cattle prior to the study may have provided an additional source of NO3 at the surface (Schlegel et al., 2017), though without measurements of nitrogen species this remains speculative. Further, this source would be available during both dew and non-dew nights and cannot alone explain differences in the composite ambient GEM patterns. Higher relative humidity during dew nights relative to non-dew nights (Fig. 1) is likely to have a limiting influence on oxidation of GEM by NO3 due to enhanced depletion of the radical (Geyer et al., 2001; Vrekoussis et al., 2004); Peleg et al. (2015) noted a significant anti-correlation between relative humidity and NO3, as well as between relative humidity and GOM. They also highlighted possible evidence of GEM oxidation by O3, albeit only at levels above 47 ppb, higher than the nocturnal concentrations observed here. Mao et al. (2008) note that O3 oxidation represented the largest uncertainty in their modelling estimates, with differences in oxidation of 86 % attributable to varying rate constants from the literature.
In the absence of adequate measurements of potentially important chemical species, a simple box model was utilised in order to explore the relative influence of observed surface deposition (Eq. 3). The outputs from this model show that patterns of depletion and non-depletion can largely be explained by surface deposition, though these outputs are strongly dependent on the modelled mixed-layer height, which represents the largest uncertainty in the model. The median height during dew nights (50 m) was 58 % lower than for non-dew (120 m), consistent with surface stability measurements. Mao et al. (2008), in their modelling efforts, estimated that dry deposition to the surface could account for 70 % of their observed depletion events, whilst Fu et al. (2016) investigated GEM depletion for a range of surface deposition and turbulent diffusivity values under a boundary layer of height 100 m. They showed that a deposition flux of 7.3 ng m−2 h−1 and turbulent diffusivity of 0.1 to 1 cm s−1 could reduce GEM concentrations within a stable boundary layer from 1.56 to 0 ng m−2. Turbulent diffusivity values during dew nights were similar to those seen by Fu et al. (2016) (median 2 cm s−1), whilst deposition fluxes were generally smaller (median 3.1 ng m−2 h−1). Free-tropospheric GEM concentrations however were also considerably smaller, as were modelled boundary layer heights.
GEM fluxes were significantly different between dew and non-dew nights, with the former showing consistent net deposition, whilst the latter showed fluxes not different from zero. The median cumulative nocturnal GEM flux for dew nights was 22.6 ng m−2 lower than for non-dew. Care must be taken here, as under low-turbulence conditions atmospheric gradients may be enhanced, leading to an overestimation of surface fluxes (Obrist et al., 2006). This however is the case for both dew and non-dew nights, where the integral turbulence characteristic is consistently < 1. This result points to an additional GEM sink at the surface that is present during dew nights only. The most likely candidate is chemical oxidation of GEM to the more reactive GOM, much as in the case of AMDEs, as both the solubility and deposition velocity of this form of mercury are higher than for GEM (Lindberg et al., 2007; Zhang et al., 2009). We hypothesise, based on the greater observed GEM deposition and results of the box model, that any oxidation is taking place largely at the surface, leading to an enhanced GEM gradient. Complex surface chemistry may be taking place in the presence of high humidity and liquid water, such as the enhanced oxidation of GEM by O3 observed by Snider et al. (2008). Other oxidation pathways are also possible, and we therefore recommend consideration of the chemical processes taking place at the surface in future investigations.
Once in oxidised form, mercury can be more readily taken into dew (Munthe, 1992; Pleuel and Munthe, 1995; Malcolm and Keeler, 2002), soil (Andersson, 1979; Zhang et al., 2009) or vegetation via foliar uptake (Lindberg and Stratton, 1998; Stamenkovic and Gustin, 2009), where it can become associated with cuticular membranes (Mason et al., 1995). In their isotopic investigations, Hintelmann et al. (2002) observed that 66 % of wet-deposited mercury was bound within vegetation, suggesting this may be a significant sink of GOM formed near the surface. Figure 5 shows that, following the significant deposition during dew nights, an emission pulse is observed shortly after sunrise. This initial pulse, with median value of 3.9 ng m−2, represents 17 % of total nocturnal deposition. This pulse is not observed following non-dew nights, showing that the bimodal shape of GEM fluxes discussed in Sect. 3.2.4 is not the regular diel pattern. Instead, this suggests that co-deposition of mercury with dew overnight does play a role in the initial emission pulse as suggested by others; however the estimated 0.82 ng m−2 co-deposition represents only 4 % of total mercury deposition. As such, we further hypothesise that the majority of this morning GEM emission pulse is due to prompt recycling of mercury, likely volatilised from GOM created near the surface and deposited overnight. This percentage of promptly recycled mercury is within the range observed by Hintelmann et al. (2002) and Amyot et al. (2004), with the remaining deposited mercury likely stored in vegetation and soils. The long-term impact of any additional sink is however likely to be minimal, as evidenced by the near-zero cumulative GEM flux over the study period.
GEM flux measurements were undertaken over a mid-latitude alpine grassland region of Australia during a 3-week period in the late austral summer. The micrometeorological aerodynamic gradient method was employed, providing high-time-resolution fluxes and facilitating evaluation of controlling factors. Both deposition and emission fluxes were observed, with a cumulative flux close to zero over the study period. Nocturnal GEM fluxes were −1.5 ± 7.8 ng m−2 h−1 compared to diurnal fluxes of 1.8 ± 18.6 ng m−2 h−1; this equated to deposition velocities of 0.1 ± 0.4 cm s−1 and −0.1 ± 0.9 cm s−1, respectively. These deposition velocities are mostly within the range of uncertainty of others reported for alpine grasslands during summer periods in Europe and North America. This is an important result towards justification of applying known deposition velocities over similar surfaces in global atmospheric mercury models, as background atmospheric mercury pool concentrations in the Southern Hemisphere are now understood to be lower than previously believed. Worldwide, air–surface GEM exchange studies across multiple seasons are rare yet required in order to reduce uncertainty in chemical transport model parameters and resolve the importance of terrestrial systems as sources or sinks of atmospheric elemental mercury.
Direct linear correlations between GEM fluxes and other environmental parameters were generally weak, with measures of temperature, radiation and heat fluxes (both sensible and latent) showing the strongest relationships. Soil temperature did not prove to be strongly related to raw GEM flux values; however it showed a moderately strong relationship when averaged over a running 24 h period and compared to cumulative GEM flux. Soil moisture was below the wilting point for the majority of the study and had little observable impact on GEM fluxes; however during the drying period following one precipitation event diurnal GEM emission fluxes were enhanced. The vegetation at the site had largely senesced and showed little overall stomatal control on GEM fluxes. A bimodal pattern of diurnal GEM emission was observed, the larger peak of which coincided with solar noon, whilst the smaller coincided with a brief increase in bulk canopy conductance of water vapour shortly after sunrise. Correlation between GEM and latent heat fluxes suggests that the latter pulse is attributable to release of co-deposited mercury as GEM during evaporation of dew.
Nocturnal atmospheric mercury depletion events are also reported here, concomitant with depletion of O3 and formation of dew, under calm, stable boundary layers. Modelling of dew depth confirmed manual observations that showed dew formation during NAMDEs only and that uptake of mercury to dew represents only 4 % of nocturnal mercury deposition. Other researchers have also reported NAMDEs with no definitive explanation; however there is evidence to suggest that surface deposition plays a large role. Here we investigated the role of surface deposition using observed flux data in a simple mass balance box model. This model reproduced ambient GEM patterns for nights both with and without observed depletion, though with high uncertainty in the modelled boundary layer heights. GEM deposition fluxes were also enhanced during NAMDEs, leading us to hypothesise an enhancement of the near-surface GEM gradient due to oxidation of GEM to GOM and subsequent deposition. Early-morning GEM emission pulses representing 17 % of nocturnal mercury deposition were observed following NAMDEs only. We further hypothesise that this pulse is due to prompt recycling of mercury deposited during these nights, with the remaining deposited mercury retained in vegetation and soil. As cumulative GEM fluxes over the 3-week period were close to zero, the influence of any additional sink would extend over reasonably short time periods. The growing literature on mercury emission and deposition behaviour is building greater evidence towards prompt recycling behaviour of GEM in the global mercury cycle, with significant impacts on our understanding of the legacy of anthropogenic perturbations to this cycle.
Data are available upon request from the corresponding author.
The authors declare that they have no conflict of interest.
The authors would like to thank Robert Simpson and Mark Adams for providing
soil and precipitation data, and Mark Cohen for his assistance with HYSPLIT
modelling.
Edited by: Aurélien
Dommergue
Reviewed by: two anonymous referees
Agnan, Y., Dantec, T. L., Moore, C. W., Edwards, G. C., and Obrist, D.: New constraints on terrestrial surface–atmosphere fluxes of gaseous elemental mercury using a global database, Environ. Sci. Technol., 50, 507–524, https://doi.org/10.1021/acs.est.5b04013, 2016. a, b
Amyot, M., Southworth, G., Lindberg, S. E., Hintelmann, H., Lalonde, J. D., Ogrinc, N., Poulain, A. J., and Sandilands, K. A.: Formation and evasion of dissolved gaseous mercury in large enclosures amended with 200HgCl2, Atmos. Environ., 38, 4279–4289, https://doi.org/10.1016/j.atmosenv.2004.05.002, 2004. a, b
Andersson, A.: Mercury in soils, in: The Biogeochemistry of Mercury in the Envrionment, edited by: Nriagu, J., 79–112, Elsevier/North-Holland Biomedical Press, New York, NY, USA, 1979. a
Australian Bureau of Statistics (ABS): 2011 Census QuickStats, available at: http://www.censusdata.abs.gov.au/census_services/getproduct/census/2011/quickstat/UCL115086 (last access: 26 November 2016), 2012. a
Bash, J. O. and Miller, D. R.: A Relaxed Eddy Accumulation System for Measuring Surface Fluxes of Total Gaseous Mercury, J. Atmos. Ocean. Tech., 25, 244–257, https://doi.org/10.1175/2007JTECHA908.1, 2008. a
Bengtsson, L. and Enell, M.: Chemical analysis, in: Handbook of Holocene Palaeoecology and Palaeohydrology, edited by: Berglund, B., 423–451, John Wiley & Sons Ltd., Chichester, UK, 1986. a
Brooks, S. B., Saiz-Lopez, A., Skov, H., Lindberg, S. E., Plane, J. M., and Goodsite, M. E.: The mass balance of mercury in the springtime arctic environment, Geophys. Res. Lett., 33, L13812, https://doi.org/10.1029/2005GL025525, 2006. a
Businger, J., Wyngaard, J., Izumi, Y., and Bradley, E.: Flux-Profile Relationships in the Atmospheric Surface Layer, J. Atmos. Sci., 28, 181–189, https://doi.org/10.1175/1520-0469(1971)028<0181:FPRITA>2.0.CO;2, 1971. a
Carpi, A. and Lindberg, S. E.: Sunlight-Mediated Emission of Elemental Mercury from Soil Amended with Municipal Sewage Sludge, Environ. Sci. Technol., 31, 2085–2091, https://doi.org/10.1021/es960910+, 1997. a
Carpi, A. and Lindberg, S. E.: Application of a teflon™ dynamic flux chamber for quantifying soil mercury flux: Tests and results over background soil, Atmos. Environ., 32, 873–882, https://doi.org/10.1016/S1352-2310(97)00133-7, 1998. a
Choi, H.-D. and Holsen, T. M.: Gaseous mercury emissions from unsterilized and sterilized soils: The effect of temperature and UV radiation, Environ. Pollut., 157, 1673–1678, https://doi.org/10.1016/j.envpol.2008.12.014, 2009. a, b
Converse, A. D., Riscassi, A. L., and Scanlon, T. M.: Seasonal variability in gaseous mercury fluxes measured in a high-elevation meadow, Atmos. Environ., 44, 2176–2185, https://doi.org/10.1016/j.atmosenv.2010.03.024, 2010. a, b, c, d, e, f, g, h
Converse, A. D., Riscassi, A. L., and Scanlon, T. M.: Seasonal contribution of dewfall to mercury deposition determined using a micrometeorological technique and dew chemistry, J. Geophys. Res.-Atmos., 119, 284–292, https://doi.org/10.1002/2013JD020491, 2014. a, b, c
Draxler, R. R.: HYSPLIT4 user's guide, Tech. Rep. ERL ARL-230, NOAA Air Resources Laboratory, Silver Spring, MD, USA, 1999. a
Draxler, R. R. and Hess, G.: Description of the HYSPLIT_4 modeling system, Tech. Rep. ERL ARL-224, NOAA Air Resources Laboratory, Silver Spring, MD, USA, 1998. a
Edwards, G., Rasmussen, P., Schroeder, W., Wallace, D., Halfpenny-Mitchell, L., Dias, G., Kemp, R., and Ausma, S.: Development and evaluation of a sampling system to determine gaseous Mercury fluxes using an aerodynamic micrometeorological gradient method, J. Geophys. Res.-Atmos., 110, D10306, https://doi.org/10.1029/2004JD005187, 2005. a, b
Edwards, G. C. and Howard, D. A.: Air-surface exchange measurements of gaseous elemental mercury over naturally enriched and background terrestrial landscapes in Australia, Atmos. Chem. Phys., 13, 5325–5336, https://doi.org/10.5194/acp-13-5325-2013, 2013. a, b, c
Engle, M. A., Gustin, M. S., Lindberg, S. E., Gertler, A. W., and Ariya, P. A.: The influence of ozone on atmospheric emissions of gaseous elemental mercury and reactive gaseous mercury from substrates, Atmos. Environ., 39, 7506–7517, https://doi.org/10.1016/j.atmosenv.2005.07.069, 2005. a
Engle, M. A., Tate, M. T., Krabbenhoft, D. P., Schauer, J. J., Kolker, A., Shanley, J. B., and Bothner, M. H.: Comparison of atmospheric mercury speciation and deposition at nine sites across central and eastern North America, J. Geophys. Res.-Atmos., 115, D18306, https://doi.org/10.1029/2010JD014064, 2010. a, b, c, d
Foken, T., Göockede, M., Mauder, M., Mahrt, L., Amiro, B., and Munger, W.: Post-Field Data Quality Control, in: Handbook of micrometeorology, edited by: Lee, X., Massman, W., and Law, B., 181–208, Springer, Berlin, Germany, 2004. a
Foken, T., Wimmer, F., Mauder, M., Thomas, C., and Liebethal, C.: Some aspects of the energy balance closure problem, Atmos. Chem. Phys., 6, 4395–4402, https://doi.org/10.5194/acp-6-4395-2006, 2006. a, b, c
Fritsche, J., Obrist, D., Zeeman, M., Conen, F., Eugster, W., and Alewella, C.: Elemental mercury fluxes over a sub-alpine grassland determined with two micrometeorological methods, Atmos. Environ., 42, 2922–2933, https://doi.org/10.1016/j.atmosenv.2007.12.055, 2008a. a, b
Fritsche, J., Wohlfahrt, G., Ammann, C., Zeeman, M., Hammerle, A., Obrist, D., and Alewell, C.: Summertime elemental mercury exchange of temperate grasslands on an ecosystem-scale, Atmos. Chem. Phys., 8, 7709–7722, https://doi.org/10.5194/acp-8-7709-2008, 2008b. a, b, c, d, e
Fu, X., Zhu, W., Zhang, H., Sommar, J., Yu, B., Yang, X., Wang, X., Lin, C.-J., and Feng, X.: Depletion of atmospheric gaseous elemental mercury by plant uptake at Mt. Changbai, Northeast China, Atmos. Chem. Phys., 16, 12861–12873, https://doi.org/10.5194/acp-16-12861-2016, 2016. a, b, c
Gauchard, P.-A., Ferrari, C. P., Dommergue, A., Poissant, L., Pilote, M., Guehenneux, G., Boutron, C. F., and Baussand, P.: Atmospheric particle evolution during a nighttime atmospheric mercury depletion event in sub-Arctic at Kuujjuarapik/Whapmagoostui, Québec, Canada, Sci. Total Environ., 336, 215–224, https://doi.org/10.1016/j.scitotenv.2004.05.022, 2005. a
Geyer, A., Alicke, B., Konrad, S., Schmitz, T., Stutz, J., and Platt, U.: Chemistry and oxidation capacity of the nitrate radical in the continental boundary layer near Berlin, J. Geophys. Res.-Atmos., 106, 8013–8025, https://doi.org/10.1029/2000JD900681, 2001. a
Graydon, J. A., Louis, V. L. S., Lindberg, S. E., Hintelmann, H., and Krabbenhoft, D. P.: Investigation of Mercury Exchange between Forest Canopy Vegetation and the Atmosphere Using a New Dynamic Chamber, Environ. Sci. Technol., 40, 4680–4688, https://doi.org/10.1021/es0604616, 2006. a
Gustin, M. S. and Stamenkovic, J.: Effect of Watering and Soil Moisture on Mercury Emissions from Soils, Biogeochemistry, 76, 215–232, https://doi.org/10.1007/s10533-005-4566-8, 2005. a
Gustin, M. S., Taylor Jr., G. E., and Maxey, R. A.: Effect of temperature and air movement on the flux of elemental mercury from substrate to the atmosphere, J. Geophys. Res.-Atmos., 102, 3891–3898, https://doi.org/10.1029/96JD02742, 1997. a
Gustin, M. S., Engle, M., Ericksen, J., Lyman, S., Stamenkovic, J., and Xin, M.: Mercury exchange between the atmosphere and low mercury containing substrates, Appl. Geochem., 21, 1913–1923, https://doi.org/10.1016/j.apgeochem.2006.08.007, 2006. a, b, c
Hanson, P. J., Lindberg, S. E., Tabberer, T. A., Owens, J. G., and Kim, K. H.: Foliar exchange of mercury vapor: Evidence for a compensation point, Water Air Soil Poll., 80, 373–382, https://doi.org/10.1007/BF01189687, 1995. a
Hartman, J. S., Weisberg, P. J., Pillai, R., Ericksen, J. A., Kuiken, T., Lindberg, S. E., Zhang, H., Rytuba, J. J., and Gustin, M. S.: Application of a Rule-Based Model to Estimate Mercury Exchange for Three Background Biomes in the Continental United States, Environ. Sci. Technol., 43, 4989–4994, https://doi.org/10.1021/es900075q, 2009. a
Hintelmann, H., Harris, R., Heyes, A., Hurley, J. P., Kelly, C. A., Krabbenhoft, D. P., Lindberg, S., Rudd, J. W., Scott, K. J., and St.Louis, V. L.: Reactivity and Mobility of New and Old Mercury Deposition in a Boreal Forest Ecosystem during the First Year of the METAALICUS Study, Environ. Sci. Technol., 36, 5034–5040, https://doi.org/10.1021/es025572t, 2002. a, b, c, d
Holmes, C. D., Jacob, D. J., Corbitt, E. S., Mao, J., Yang, X., Talbot, R., and Slemr, F.: Global atmospheric model for mercury including oxidation by bromine atoms, Atmos. Chem. Phys., 10, 12037–12057, https://doi.org/10.5194/acp-10-12037-2010, 2010. a
Howard, D., Nelson, P. F., Edwards, G. C., Morrison, A. L., Fisher, J. A., Ward, J., Harnwell, J., van der Schoot, M., Atkinson, B., Chambers, S. D., Griffiths, A. D., Werczynski, S., and Williams, A. G.: Atmospheric mercury in the Southern Hemisphere tropics: seasonal and diurnal variations and influence of inter-hemispheric transport, Atmos. Chem. Phys., 17, 11623–11636, https://doi.org/10.5194/acp-17-11623-2017, 2017. a, b
Jacobs, A. F., Heusinkveld, B. G., Wichink Kruit, R. J., and Berkowicz, S. M.: Contribution of dew to the water budget of a grassland area in the Netherlands, Water Resour. Res., 42, W03415, https://doi.org/10.1029/2005WR004055, 2006. a, b
Jaffe, D. A., Lyman, S., Amos, H. M., Gustin, M. S., Huang, J., Selin, N. E., Levin, L., ter Schure, A., Mason, R. P., Talbot, R., Rutter, A., Finley, B., Jaeglé, L., Shah, V., McClure, C., Ambrose, J., Gratz, L., Lindberg, S., Weiss-Penzias, P., Sheu, G.-R., Feddersen, D., Horvat, M., Dastoor, A., Hynes, A. J., Mao, H., Sonke, J. E., Slemr, F., Fisher, J. A., Ebinghaus, R., Zhang, Y., and Edwards, G.: Progress on Understanding Atmospheric Mercury Hampered by Uncertain Measurements, Environ. Sci. Technol., 48, 7204–7206, https://doi.org/10.1021/es5026432, 2014. a
Kessler, R.: The Minamata Convention on Mercury: a first step toward protecting future generations, Environ. Health Persp., 121, 304–309, https://doi.org/10.1289/ehp.121-A304, 2013. a
Kikuchi, T., Ikemoto, H., Takahashi, K., Hasome, H., and Ueda, H.: Parameterizing Soil Emission and Atmospheric Oxidation-Reduction in a Model of the Global Biogeochemical Cycle of Mercury, Environ. Sci. Technol., 47, 12266–12274, https://doi.org/10.1021/es401105h, 2013. a, b
Kirk, J. L., St. Louis, V. L., and Sharp, M. J.: Rapid Reduction and Reemission of Mercury Deposited into Snowpacks during Atmospheric Mercury Depletion Events at Churchill, Manitoba, Canada, Environ. Sci. Technol., 40, 7590–7596, https://doi.org/10.1021/es061299+, 2006. a
Lahoutifard, N., Sparling, M., and Lean, D.: Total and methyl mercury patterns in Arctic snow during springtime at Resolute, Nunavut, Canada, Atmos. Environ., 39, 7597–7606, https://doi.org/10.1016/j.atmosenv.2005.07.071, 2005. a
Lee, X.: Water vapor density effect on measurements of trace gas mixing ratio and flux with a massflow controller, J. Geophys. Res.-Atmos., 105, 17807–17810, https://doi.org/10.1029/2000JD900210, 2000. a
Lin, C.-J. and Pehkonen, S. O.: The chemistry of atmospheric mercury: a review, Atmos. Environ., 33, 2067–2079, https://doi.org/10.1016/S1352-2310(98)00387-2, 1999. a
Lindberg, S., Hanson, P., Meyers, T., and Kim, K.-H.: Air/surface exchange of mercury vapor over forests—the need for a reassessment of continental biogenic emissions, Atmos. Environ., 32, 895–908, https://doi.org/10.1016/S1352-2310(97)00173-8, 1998. a
Lindberg, S., Bullock, R., Ebinghaus, R., Engstrom, D., Fenh, X., Fitzgerald, W., Pirrone, N., Prestbo, E., and Seigneur, C.: A Synthesis of Progress and Uncertainties in Attributing the Sources of Mercury in Deposition, AMBIO, 36, 19–33, https://doi.org/10.1579/0044-7447(2007)36[19:ASOPAU]2.0.CO;2, 2007. a, b, c
Lindberg, S. E. and Stratton, W. J.: Atmospheric Mercury Speciation: Concentrations and Behavior of Reactive Gaseous Mercury in Ambient Air, Environ. Sci. Technol., 32, 49–57, https://doi.org/10.1021/es970546u, 1998. a
Malcolm, E. G. and Keeler, G. J.: Measurements of Mercury in Dew: Atmospheric Removal of Mercury Species to a Wetted Surface, Environ. Sci. Technol., 36, 2815–2821, https://doi.org/10.1021/es011174z, 2002. a, b, c
Mao, H., Talbot, R. W., Sigler, J. M., Sive, B. C., and Hegarty, J. D.: Seasonal and diurnal variations of Hg0 over New England, Atmos. Chem. Phys., 8, 1403–1421, https://doi.org/10.5194/acp-8-1403-2008, 2008. a, b, c, d
Mason, R. P., Reinfelder, J. R., and Morel, F. M. M.: Bioaccumulation of mercury and methylmercury, Water Air Soil Poll., 80, 915–921, https://doi.org/10.1007/BF01189744, 1995. a
Mastromonaco, M. N., Gårdfeldt, K., Jourdain, B., Abrahamsson, K., Granfors, A., Ahnoff, M., Dommergue, A., Méjeand, G., and Jacobi, H.-W.: Antarctic winter mercury and ozone depletion events over sea ice, Atmos. Environ., 129, 125–132, https://doi.org/10.1016/j.atmosenv.2016.01.023, 2016. a
Meili, M., Bishop, K., Bringmark, L., Johansson, K., Munthe, J., Sverdrup, H., and de Vries, W.: Critical levels of atmospheric pollution: criteria and concepts for operational modelling of mercury in forest and lake ecosystems, Sci. Total Environ., 304, 83–106, https://doi.org/10.1016/S0048-9697(02)00559-4, 2003. a
Monteith, J. L. and Unsworth, M. H.: Principles of Environmental Physics, 2nd Edn., Edward Arnold, London, UK, 1990. a
Moore, C. W., Obrist, D., Steffen, A., Staebler, R. M., Douglas, T. A., Richter, A., and Nghiem, S. V.: Convective forcing of mercury and ozone in the Arctic boundary layer induced by leads in sea ice, Nature, 506, 81–84, https://doi.org/10.1038/nature12924, 2014. a
Munthe, J.: The aqueous oxidation of elemental mercury by ozone, Atmos. Environ. A-Gen., 26, 1461–1468, https://doi.org/10.1016/0960-1686(92)90131-4, 1992. a
Nelson, D. and Sommers, L.: Total carbon, organic carbon, and organic matter, in: Methods of Soil Analysis. Part 3: Chemical Methods, edited by: Sparks, D., Page, A., Helmke, P., Loeppert, R., Soltanpour, P., Tabatabai, M., Johnston, C., and Sumner, M., 961–1010, Soil Science Society of America, Inc., American Society of Agronomy, Inc., Madison, WI, USA, 1996. a
Nelson, P. F., Nguyen, H., Morrison, A. L., Malfroy, H., Cope, M. E., Hibberd, M. F., Lee, S., McGregor, J. L., and Meyer, M.: Mercury sources, transportation and fate in Australia, Report, Department of Environment, Water, Heritage & the Arts, Canberra, Australia, 2009. a, b
Nelson, P. F., Morrison, A. L., Malfroy, H. J., Cope, M., Lee, S., Hibberd, M. L., Meyer, C., and McGregor, J.: Atmospheric mercury emissions in Australia from anthropogenic, natural and recycled sources, Atmos. Environ., 62, 291–302, https://doi.org/10.1016/j.atmosenv.2012.07.067, 2012. a, b
Obrist, D., Conen, F., Vogt, R., Siegwolf, R., and Alewell, C.: Estimation of Hg0 exchange between ecosystems and the atmosphere using 222Rn and Hg0 concentration changes in the stable nocturnal boundary layer, Atmos. Environ., 40, 856–866, https://doi.org/10.1016/j.atmosenv.2005.10.012, 2006. a, b, c
Oke, T.: Boundary Layer Climates, 2nd Edn., Routledge, New York, NY, USA, 1987. a
Peleg, M., Tas, E., Obrist, D., Matveev, V., Moore, C., Gabay, M., and Luria, M.: Observational Evidence for Involvement of Nitrate Radicals in Nighttime Oxidation of Mercury, Environ. Sci. Technol., 49, 14008–14018, https://doi.org/10.1021/acs.est.5b03894, 2015. a, b, c
Pirrone, N., Hedgecock, I., Cinnirella, S., and Sprovieri, F.: Overview of major processes and mechanisms affecting the mercury cycle on different spatial and temporal scales, in: EPJ Web of Conferences, Vol. 9, 3–33, EDP Sciences, Les Ulis, France, 2010. a, b
Pleuel, K. and Munthe, J.: Modelling the atmospheric mercury cycle-chemistry in fog droplets, Atmos. Environ., 29, 1441–1457, https://doi.org/10.1016/1352-2310(94)00323-D, 1995. a
Ritchie, C. D., Richards, W., and Arp, P. A.: Mercury in fog on the Bay of Fundy (Canada), Atmos. Environ., 40, 6321–6328, https://doi.org/10.1016/j.atmosenv.2006.05.057, 2006. a, b
Sawyer, D.: Gaseous Oxidised Mercury Compounds Captured by Membrane Technologies at Two Australian Sites, Master thesis, Macquarie University, 49 pp., 2016. a
Schlegel, A. J., Assefa, Y., Bond, H., Haag, L. A., and Stone, L. R.: Changes in soil nutrients after 10 years of cattle manure and swine effluent application, Soil Tillage Res., 172, 48–58, https://doi.org/10.1016/j.still.2017.05.004, 2017. a
Selin, N. E.: Global biogeochemical cycling of mercury: A review, Annu. Rev. Env. Resour., 34, 43–63, https://doi.org/10.1146/annurev.environ.051308.084314, 2009. a, b
Selin, N. E., Jacob, D. J., Yantosca, R. M., Strode, S., Jaeglé, L., and Sunderland, E. M.: Global 3-D land-ocean-atmosphere model for mercury: Present-day versus preindustrial cycles and anthropogenic enrichment factors for deposition, Global Biogeochem. Cy., 22, GB2011, https://doi.org/10.1029/2007GB003040, 2008. a, b, c
Simone, F. D., Gencarelli, C. N., Hedgecock, I. M., and Pirrone, N.: Global atmospheric cycle of mercury: a model study on the impact of oxidation mechanisms, Environ. Sci. Pollut. R., 21, 4110–4123, https://doi.org/10.1007/s11356-013-2451-x, 2014. a
Slemr, F., Angot, H., Dommergue, A., Magand, O., Barret, M., Weigelt, A., Ebinghaus, R., Brunke, E.-G., Pfaffhuber, K. A., Edwards, G., Howard, D., Powell, J., Keywood, M., and Wang, F.: Comparison of mercury concentrations measured at several sites in the Southern Hemisphere, Atmos. Chem. Phys., 15, 3125–3133, https://doi.org/10.5194/acp-15-3125-2015, 2015. a, b, c, d
Snider, G., Raofie, F., and Ariya, P. A.: Effects of relative humidity and CO(g) on the O3-initiated oxidation reaction of Hg0(g): kinetic & product studies, Phys. Chem. Chem. Phys., 10, 5616–5623, https://doi.org/10.1039/B801226A, 2008. a
Song, X. and Van Heyst, B.: Volatilization of mercury from soils in response to simulated precipitation, Atmos. Environ., 39, 7494–7505, https://doi.org/10.1016/j.atmosenv.2005.07.064, 2005. a
Stamenkovic, J. and Gustin, M. S.: Nonstomatal versus Stomatal Uptake of Atmospheric Mercury, Environ. Sci. Technol., 43, 1367–1372, https://doi.org/10.1021/es801583a, 2009. a, b
Steffen, A., Douglas, T., Amyot, M., Ariya, P., Aspmo, K., Berg, T., Bottenheim, J., Brooks, S., Cobbett, F., Dastoor, A., Dommergue, A., Ebinghaus, R., Ferrari, C., Gardfeldt, K., Goodsite, M. E., Lean, D., Poulain, A. J., Scherz, C., Skov, H., Sommar, J., and Temme, C.: A synthesis of atmospheric mercury depletion event chemistry in the atmosphere and snow, Atmos. Chem. Phys., 8, 1445–1482, https://doi.org/10.5194/acp-8-1445-2008, 2008. a, b, c
Stein, A., Draxler, R., Rolph, G., Stunder, B., Cohen, M., and Ngan, F.: NOAA's HYSPLIT Atmospheric Transport and Dispersion Modeling System, B. Am. Meteorol. Soc., 96, 2059–2077, https://doi.org/10.1175/BAMS-D-14-00110.1, 2015. a
United Nations Environment Programme (UNEP): Sources, Emissions, Releases and Environmental Transport, UNEP Chemicals Branch, Geneva, Switzerland, 32 pp., 2013. a
Vrekoussis, M., Kanakidou, M., Mihalopoulos, N., Crutzen, P. J., Lelieveld, J., Perner, D., Berresheim, H., and Baboukas, E.: Role of the NO3 radicals in oxidation processes in the eastern Mediterranean troposphere during the MINOS campaign, Atmos. Chem. Phys., 4, 169–182, https://doi.org/10.5194/acp-4-169-2004, 2004. a
Weiss-Penzias, P. S., Ortiz Jr., C., Acosta, R. P., Heim, W., Ryan, J. P., Fernandez, D., Collett Jr., J. L., and Flegal, A. R.: Total and monomethyl mercury in fog water from the central California coast, Geophys. Res. Lett., 39, L03804, https://doi.org/10.1029/2011GL050324, 2012. a
Wilczak, J. M., Oncley, S. P., and Stage, S. A.: Sonic Anemometer Tilt Correction Algorithms, Bound.-Lay. Meteorol., 99, 127–150, https://doi.org/10.1023/A:1018966204465, 2001. a
Zhang, H., Lindberg, S. E., and Kuiken, T.: Mysterious diel cycles of mercury emission from soils held in the dark at constant temperature, Atmos. Environ., 42, 5424–5433, https://doi.org/10.1016/j.atmosenv.2008.02.037, 2008. a
Zhang, L., Wright, L. P., and Blanchard, P.: A review of current knowledge concerning dry deposition of atmospheric mercury, Atmos. Environ., 43, 5853–5864, https://doi.org/10.1016/j.atmosenv.2009.08.019, 2009. a, b, c, d
Zhu, W., Sommar, J., Lin, C.-J., and Feng, X.: Mercury vapor air–surface exchange measured by collocated micrometeorological and enclosure methods – Part II: Bias and uncertainty analysis, Atmos. Chem. Phys., 15, 5359–5376, https://doi.org/10.5194/acp-15-5359-2015, 2015. a, b