the Creative Commons Attribution 4.0 License.
the Creative Commons Attribution 4.0 License.
 | 04 Sep 2018
On the spectral depolarisation and lidar ratio of mineral dust provided in the AERONET version 3 inversion product
Sung-Kyun Shin
Matthias Tesche
Kwanchul Kim
Maria Kezoudi
Boyan Tatarov
Detlef Müller
Youngmin Noh
Knowledge of the particle lidar ratio (Sλ) and the particle linear depolarisation ratio (δλ) for different aerosol types allows for aerosol typing and aerosol-type separation in lidar measurements. Reference values generally originate from dedicated lidar observations but might also be obtained from the inversion of AErosol RObotic NETwork (AERONET) sun/sky radiometer measurements. This study investigates the consistency of spectral Sλ and δλ provided in the recently released AERONET version 3 inversion product for observations of undiluted mineral dust in the vicinity of the following major deserts: Gobi, Sahara, Arabian, Great Basin, and Great Victoria. Pure dust conditions are identified by an Ångström exponent <0.4 and a fine-mode fraction <0.1.
The values of spectral Sλ are found to vary for the different source regions but generally show an increase with decreasing wavelength. The feature correlates to AERONET, retrieving an increase in the imaginary part of the refractive index with decreasing wavelength. The smallest values of Sλ=35–45 sr are found for mineral dust from the Great Basin desert, while the highest values of 50–70 sr have been inferred from AERONET observations of Saharan dust. Values of Sλ at 675, 870, and 1020 nm seem to be in reasonable agreement with available lidar observations, while those at 440 nm are up to 10 sr higher than the lidar reference. The spectrum of δλ shows a maximum of 0.26–0.31 at 1020 nm and decreasing values as wavelength decreases. AERONET-derived δλ values at 870 and 1020 nm are in line with the lidar reference, while values of 0.19–0.24 at 440 nm are smaller than the independent lidar observations by a difference of 0.03 to 0.08. This general behaviour is consistent with earlier studies based on AERONET version 2 products.
- Article
(3159 KB) - Full-text XML
- BibTeX
- EndNote


Atmospheric particles interact with the climate system directly by scattering and absorbing radiation and indirectly by affecting cloud formation and evolution (IPCC, 2013). In order to quantify the radiative forcing of aerosols on regional and global climate, it is essential to properly estimate the effect of the different aerosol types (IPCC, 2013). Mineral dust is one of the most important aerosol types and is estimated to account for about one-third of the global aerosol loading and aerosol optical depth (AOD) (Kinne et al., 2006). Mineral dust affects atmospheric dynamics and chemistry, and exacerbates air quality, visibility, and public health over a broad range of temporal and spatial scales (Jickells et al., 2005; Morman and Plumlee, 2013). These effects of mineral dust strongly depend on its size, as well as optical, microphysical, and chemical properties. These properties change when dust is mixed with other aerosol types (Ginoux et al., 2012), whose contributions to a dusty mixture need to be quantified in order to assess their individual effects.
The extinction-to-backscatter (lidar) ratio () and the particle linear depolarisation ratio () as measured by polarisation-sensitive Raman or high spectral resolution lidar can be used for aerosol classification and for identification of the presence of mineral dust particles in the atmosphere (Müller et al., 2007; Burton et al., 2012, 2013; Groß et al., 2013). The lidar ratio provides insight into the size and absorption of aerosol particles. It is about 20 sr for cloud droplets, increases to values of 40 to 60 sr for mineral dust, and can be as high as 80 sr for continental pollution (Müller et al., 2007). The particle linear depolarisation ratio is an indicator of particle shape, and measurements of this parameter for undiluted dust plumes show values of –0.35. Smaller values indicate a mixture of non-spherical dust with weakly depolarising particles such as biomass-burning smoke or anthropogenic pollution (Freudenthaler et al., 2009; Tesche et al., 2009b; Burton et al., 2014, 2015; Shin et al., 2015). Knowledge of therefore allows for the retrieval of the contribution of mineral dust to a mixed dust plume by assuming that spherical and non-spherical particles are externally mixed (Shimizu et al., 2004; Tesche et al., 2009b). However, this approach relies on knowing for different aerosol types in their pure (i.e. undiluted) form. High-quality lidar measurements of undiluted aerosol plumes are the best source for reliable reference values. While such measurements have been conducted for Saharan and Asian dust (though not for extended periods of time that allow for statistical insight), they are scarce or non-existent for other source regions.
Radiometer measurements within the AErosol RObotic NETwork (AERONET, Holben et al., 1998) can provide an alternative for obtaining insight into and for different source regions. AERONET runs automated instruments for direct sun and sky radiation measurements at hundreds of sites. Its unified retrieval provides spectral aerosol optical properties and employs a spheroid light scattering model (Dubovik et al., 2006) to obtain aerosol microphysical properties such as the particle size distribution and the complex refractive index. Values of for Saharan and Asian dust as calculated from AERONET data have been presented by Müller et al. (2010, 2012) and Noh et al. (2017), respectively. These studies found that AERONET-derived dust depolarisation ratios () at shorter wavelengths are generally smaller than the ones measured with depolarisation lidar, while those at 1020 nm resemble lidar-derived values at 1064 nm (though few observations are currently available at this wavelength), and thus, could be used to estimate the contribution of mineral dust to mixed aerosol plumes. AERONET-derived lidar ratios for Saharan dust as presented by Müller et al. (2010, 2012) were found to be consistently larger than direct measurements with lidar. Müller et al. (2010, 2012) also present a comparison of AERONET-derived for Saharan dust to independent lidar observations and show that the values obtained from using the AERONET version 2 inversion are generally larger than the reference values – with reaching unrealistically high values of more than 80 sr. Schuster et al. (2012) combined AERONET measurements with CALIPSO observations to map S532 for dust from sources in northern Africa and on the Arabian peninsula. They found that S decreases from 55 sr at the Atlantic coast to 40 sr in the Middle East – which is in agreement with Raman lidar observations of Saharan (Tesche et al., 2009a, 2011) and Arabian dust (Mamouri and Ansmann, 2013) and is the result of latitudinal changes in the iron content of the dust.
The recently released version 3 of the AERONET retrieval provides and at 440, 675, 870, and 1020 nm as standard inversion products. To the best of our knowledge, this is the first study in which AERONET version 3 lidar and depolarisation ratios representative of undiluted mineral dust from different deserts are put into the context of available lidar observations. Section 2 introduces the methodology used in this study. In Sect. 3, we present and discuss our results. A summary of the findings is presented in Sect. 4.
2.1 Theoretical background
Polarisation-sensitive Raman and high spectral resolution lidars are capable of direct measurements of the extinction-to-backscatter (lidar) ratio from the particle backscatter coefficient and the particle extinction coefficient as
as well as of the particle linear depolarisation ratio from measurements of the backscatter coefficient in dedicated depolarisation channels as
The latter parameter requires measurement of the return signal in the plane of polarisation perpendicular to that of the emitted polarised laser light and careful calibration of the measurement of the lidar receiver (Freudenthaler et al., 2009; Freudenthaler, 2016; Mattis et al., 2009).
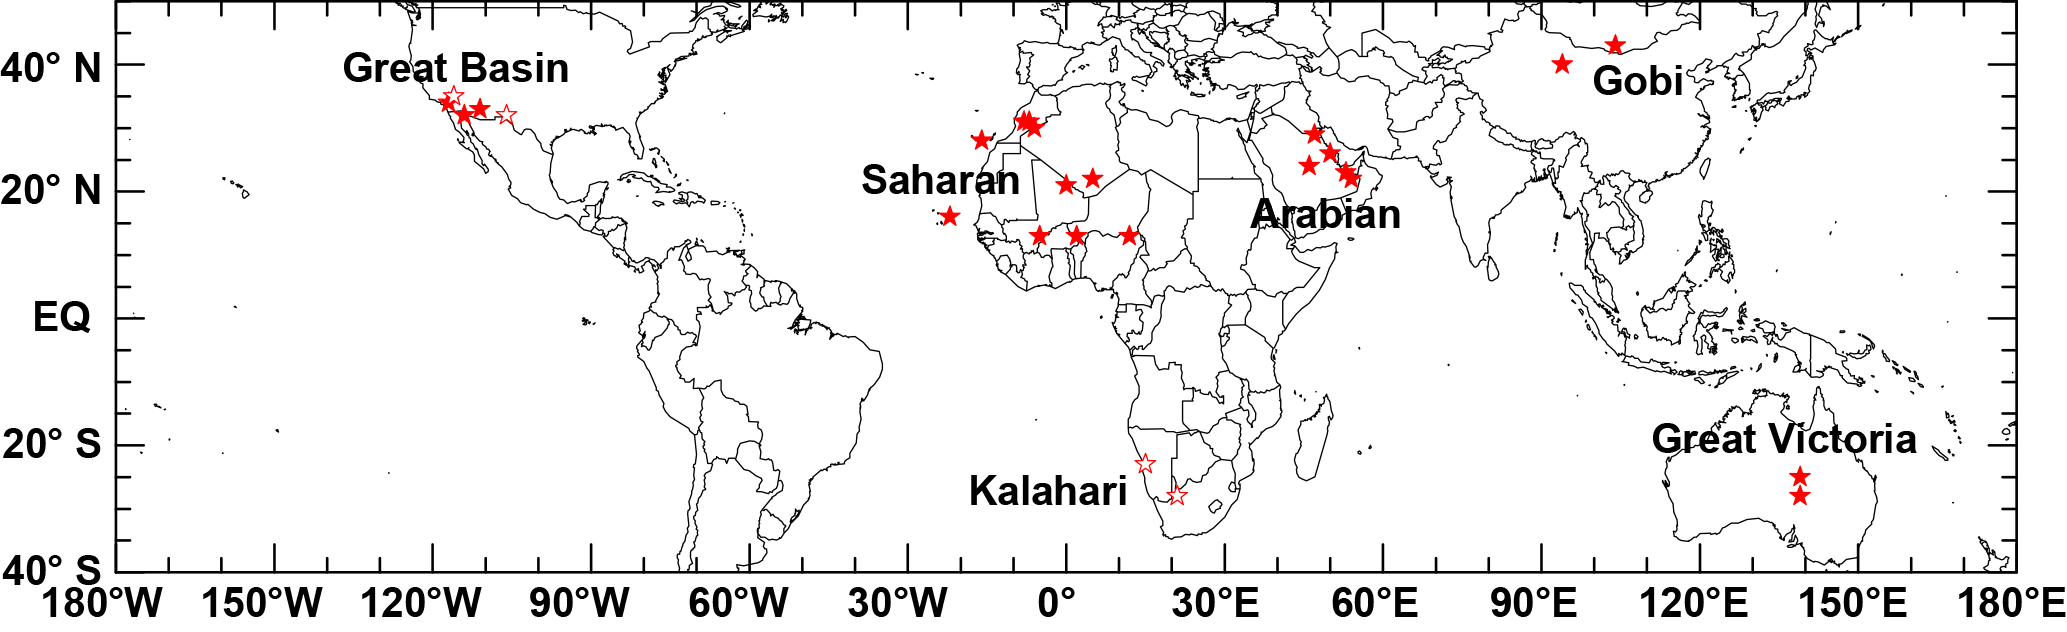
Figure 1Map of the AERONET sites considered in this study. Open symbols mark sites for which the requirement for pure dust conditions has not been fulfilled.
AERONET sun/sky radiometers measure direct solar radiation and sky radiation. The measured data are automatically analysed using the AERONET inversion algorithm (Dubovik et al., 2006). The retrieved aerosol products are available from the AERONET database (https://aeronet.gsfc.nasa.gov/, last access: 31 August 2018). The recently released version 3 of the AERONET retrieval added spectral particle linear depolarisation ratios and lidar ratios to the list of standard inversion products such as the particle size distribution, the complex refractive index, and the single-scattering albedo of the observed particles.
For each observation, the elements and of the Müller scattering matrix (Bohren and Huffman, 1983) are computed from the particle size distribution and the refractive index that have been inferred from the AERONET inversion product. The element is proportional to the flux of scattered light in the case of unpolarised incident light, while strongly depends on the angular and spectral distribution of the radiative intensity (Bohren and Huffman, 1983) as measured with AERONET's instruments (Dubovik et al., 2006). From the element at the scattering angle of 180∘ and the concurrently inferred single-scattering albedo (ωλ), the lidar ratio can be computed as
The calculation of the particle linear depolarisation ratio requires knowledge of the elements and at a scattering angle of 180∘:
The comparison of and as measured by lidar and inferred from AERONET observations therefore allows for an assessment of the AERONET light-scattering model. Such studies have been presented by Müller et al. (2010, 2012) for observations of fresh Saharan dust during the Saharan Mineral Dust Experiment (SAMUM-1) in Morocco. All parameters discussed in the following are wavelength-dependent and refer to mineral dust particles. To improve readability the corresponding indices will be omitted from here on.
2.2 Data selection
The AERONET sites considered in this study are located near or within the Gobi, Saharan, Arabian, Great Basin, Great Victoria, and Kalahari deserts. Figure 1 shows that a total of 28 AERONET sites have been considered as representative of mineral dust due to their location close to the Gobi desert (Dalanzadgad (43∘ N, 104∘ E), Dunhuang (40∘ N, 94∘ E), and Dunhuang_LZU (40∘ N, 94∘ E)); Arabian desert (Hamim (22∘ N, 54∘ E), Mezaira (23∘ N, 53∘ E), Solar_Village (24∘ N, 46∘ E), Bahrain (26∘ N, 50∘ E), and Shagaya_Park (29∘ N, 47∘ E)); Saharan desert (IER_Cinzana (13∘ N, 5∘ W), Capo_Verde (16∘ N, 22∘ W), DMN_Maine_Soroa (13∘ N, 12∘ E), Banizoumbou (13∘ N, 2∘ E), Bord_Badji_Mokhtar (21∘ N, 0∘ E), Tamanrasset_INM (22∘ N, 5∘ E), Izana (28∘ N, 16∘ W), Ouarzazate (30∘ N, 6∘ W), Oukaïmeden (31∘ N, 7∘ W), Ras_El_Ain (31∘ N, 7∘ W), and Saada (31∘ N, 8∘ W)); Kalahari (Gobabeb (23∘ S, 15∘ E) and Uprington (28∘ S, 21∘ E)); Great Basin (Yuma (32∘ N, 114∘ W), Maricopa (33∘ N, 111∘ W), White_Sands (32∘ N, 106∘ W), Roger_Dry_Lake (34∘ N, 117∘ W), and Goldstone (35∘ N, 116∘ W)); and Great Victoria (Tinga_Tingana (28∘ S, 139∘ E) and Birdsville (25∘ S, 139∘ E)). We consider all level 2.0 observations that were available in February 2018, i.e., time series lasting until the end of 2016 to the middle of 2017 for most stations.
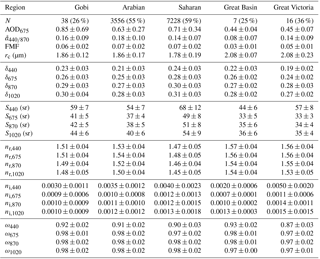
Table 1Mean values and standard deviation of the AERONET-derived δ, S, refractive index (), and single-scattering albedo (ω) at 440, 675, 870, and 1020 nm together with the number of pure dust cases (N) and their ratio with respect to all available version 3 level 2.0 inversion outputs, as well as the average AOD675, Ångström exponent (å440∕870), fine-mode fraction (FMF), and coarse-mode effective radius (rc) for those cases. Note that the requirement for pure dust conditions was not met at the sites representing the Kalahari desert.
AERONET inversions are only performed for observations with an AOD larger than 0.4 at 440 nm (Dubovik et al., 2006). The available AERONET level 2.0 version 3 inversion products for the sites listed above have been filtered to ensure that the obtained values of S and δ are representative of pure dust conditions (i.e. undiluted dust plumes). Such conditions are reflected by a weak spectral dependence of AOD and a minor contribution of fine-mode particles to the volume size distribution. To account for these features, we only consider observations with a 440/870 nm Ångström exponent (å440∕870) smaller than 0.4 and a fine-mode fraction (FMF) of the volume size distribution of less than 0.10 (Schuster et al., 2006).
The total number of available cases in the AERONET level 2.0 version 3 inversion product used in this study are 147 (Gobi), 6435 (Arabian desert), 12 324 (Sahara), 88 (Kalahari), 28 (Great Basin), and 44 (Great Victoria). The requirement for pure dust conditions for the investigation of AERONET-derived lidar parameters decreased the number of suitable cases to 38 (26 %), 3556 (55 %), 7228 (59 %), 0 (0 %), 7 (25 %), and 16 (36 %), respectively. The ratio of pure dust cases to the total observations is highest for the Saharan desert. Not a single pure dust case remained for the Kalahari desert and that region could not be considered for further study. The absolute number of pure dust cases is also low for the Great Basin and Great Victory deserts, and thus, findings for these regions need to be handled with care. However, lidar observations for dust from these source regions are also scarce which is why the AERONET-derived values might provide a valuable reference for future studies or the analysis of measurements with elastic backscatter lidars which require an a priori estimate of S for the retrieval of backscatter and extinction coefficient profiles.
Table 1 presents the results of our analysis of AERONET version 3 products with respect to pure mineral dust conditions in the form of mean values and standard deviation of the particle linear depolarisation ratio, the lidar ratio, the complex refractive index, and the single-scattering albedo at four wavelengths and for the considered regions. The first lines of Table 1 furthermore provide the mean values of AOD at 675 nm, å440∕870, and the coarse-mode effective radius found for the different regions as well as the number of available pure dust cases and the ratio of pure dust to total observations.
3.1 Particle linear depolarisation ratio
Figure 2 shows the AERONET-derived frequency distributions of δ at 440, 675, 880, and 1020 nm for the Gobi, Arabian, and Saharan deserts. The absolute number of cases for the other regions was found to be too low to obtain reasonable distributions (see Table 1). The values of spectral δ vary between 0.15 and 0.36 with slight variations for the considered regions. The maximum of the δ distribution decreases as the wavelength decreases and is highest for the Saharan desert. The Gobi and Saharan deserts show similar frequency distributions, while that for the Arabian desert is shifted to slightly lower values. In comparison to the AERONET/lidar study of δ for Saharan dust of Müller et al. (2012), the AERONET version 3 distribution shows an overall improvement by moving to larger, more realistic values. Nevertheless, δ for lower wavelengths is likely still too low as will be discussed in more detail below.
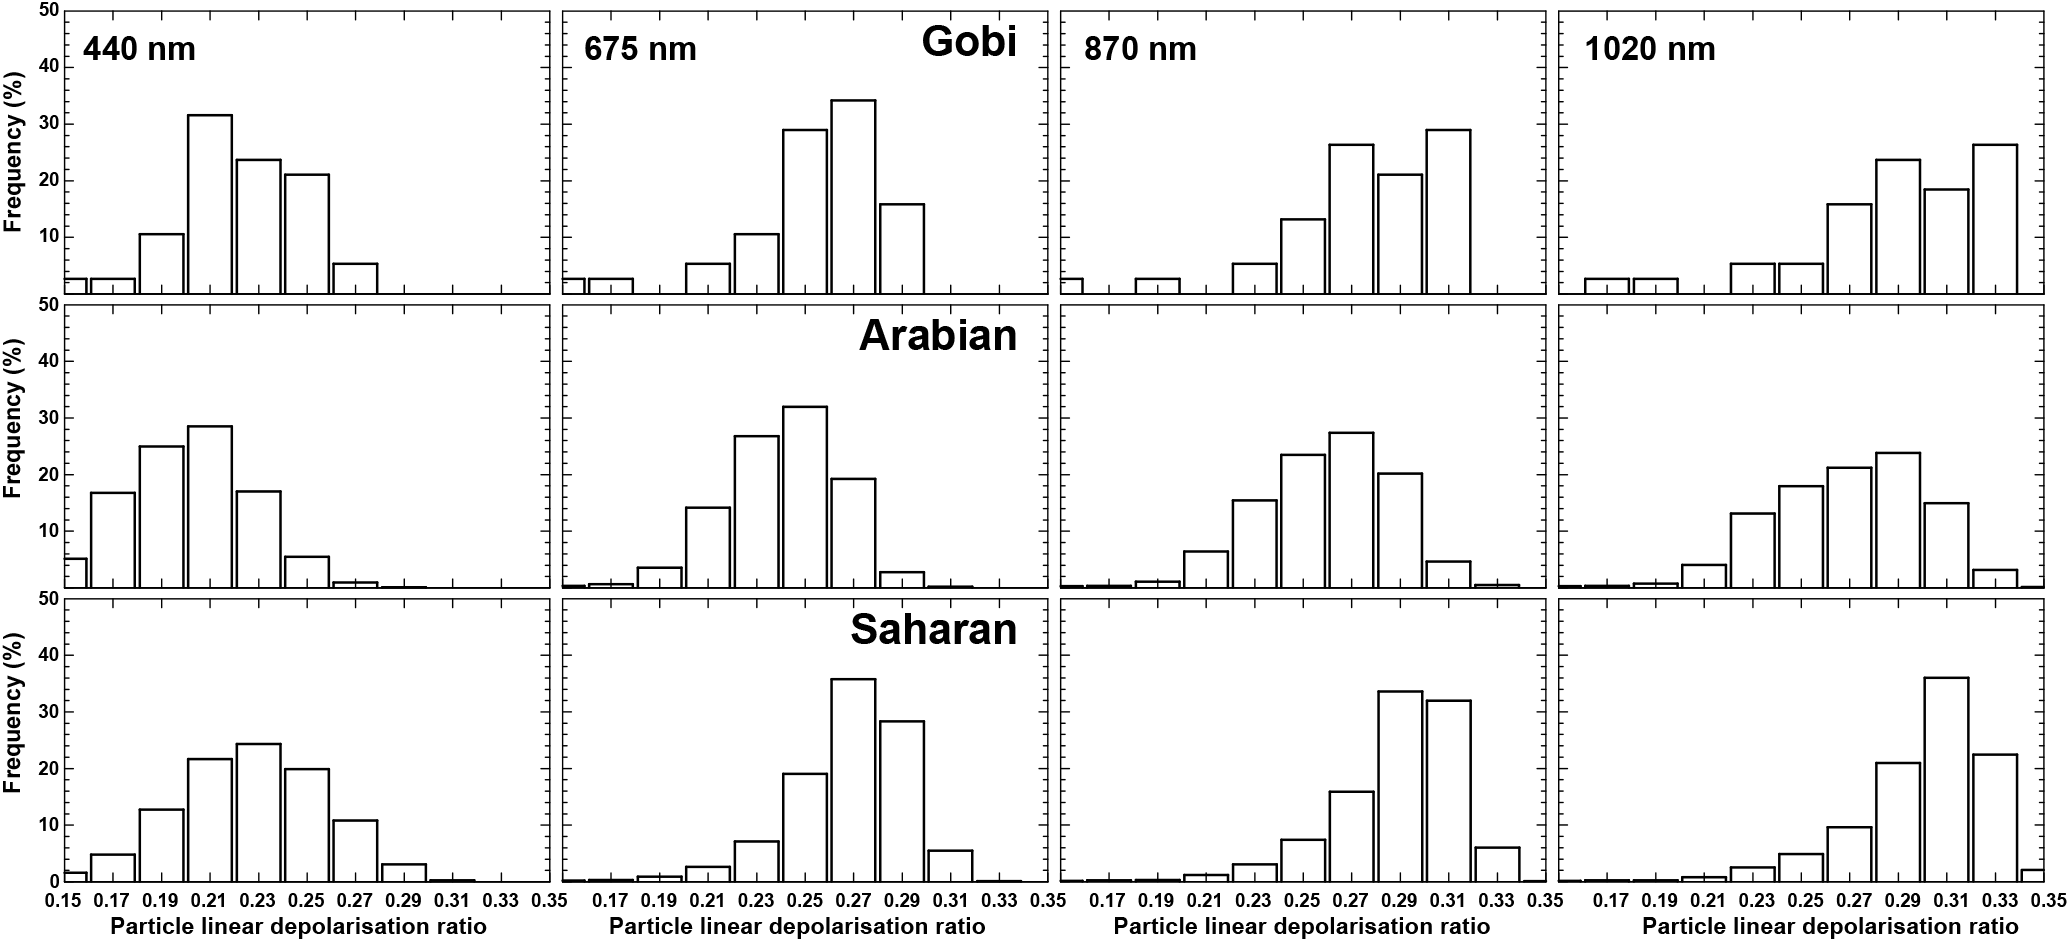
Figure 2Frequency distribution of δ for pure dust conditions. Rows refer to the Gobi, Arabian, and Saharan deserts, while columns refer to the wavelengths of 440, 675, 870, and 1020 nm, respectively. Due to the low number of pure dust cases, Great Basin (N=7) and Great Victoria (N=16) are not shown. Statistics for all regions are provided in Table 1.
Figure 3 compares the spectral variation of the mean AERONET-derived δ to spectral depolarisation lidar measurements reported in the literature. A more detailed overview of published values of δ is provided in Table 2. Lidar measurements of δ are generally performed at 355 or 532 nm. So far, triple-wavelength measurements of δ have only been presented in the studies of Freudenthaler et al. (2009), Burton et al. (2015), and Haarig et al. (2017). The AERONET-derived values for different regions in Fig. 3 peak between 0.27 and 0.31 at 1020 nm and decrease steadily to 0.19 to 0.24 at 440 nm. Lidar measurements show that the spectral dependence of δ differs with origin and age of the observed dust plume. Burton et al. (2015) found a maximum of δ1064=0.38 and lower values of 0.37 and 0.24 at 532 and 355 nm, respectively, for local North American dust. In contrast with this, Saharan dust which has aged during transport shows a peak of 0.30 at 532 nm with smaller δ values of 0.27 and 0.25 at 1064 and 355 nm, respectively (Burton et al., 2015). Haarig et al. (2017) reported a similar pattern in the spectral variation of δ for aged Saharan dust with a clear maximum of 0.28 at 532 nm and lower values of 0.25 at 355 nm and 0.23 at 1064 nm. The values for fresh Saharan dust observed by Freudenthaler et al. (2009) are almost identical to those of long-range-transported Saharan dust by Burton et al. (2015). All four scenarios agree on a δ355 of about 0.25.
Cottle et al. (2013)Hofer et al. (2017)Sugimoto and Lee (2006)Shin et al. (2015)Mamouri and Ansmann (2013)Freudenthaler et al. (2009)Veselovskii et al. (2016)Preißler et al. (2011)Wiegner et al. (2011)Haarig et al. (2017)Burton et al. (2015)Burton et al. (2015)Burton et al. (2015)Burton et al. (2015)Table 2Literature values on lidar observations of the particle linear depolarisation ratio δ for mineral dust from different source regions. The first column gives the location of the measurements. Note that coincident measurements at three wavelengths are reported only by Burton et al. (2015), Freudenthaler et al. (2009), and Haarig et al. (2017).
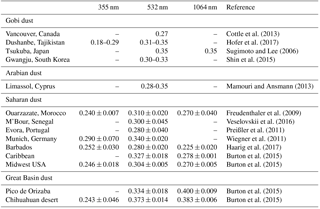

Figure 3Spectral variation of δ as derived from AERONET observations for pure dust (open symbols) compared to published values from triple-wavelength lidar observations (solid symbols) of fresh Saharan dust close to the source (Freudenthaler et al., 2009), transported Saharan dust and local North American dust (Burton et al., 2015), and aged Saharan dust after one week of transport (Haarig et al., 2017). The gray line and symbols present the AERONET-derived δ from the comparison study for Saharan dust of Müller et al. (2010).
Further findings of δ from the literature are summarised in Table 2. Lidar observations of δ are most commonly performed at 532 nm, though there is an increasing number of observations at 355 nm. The literature gives values at 532 nm in the range from 0.30 to 0.35 for Asian dust (Sugimoto and Lee, 2006; Shin et al., 2015; Hofer et al., 2017) and slightly lower values for aged Asian dust after intercontinental transport (Cottle et al., 2013). A much broader range of values from 0.18 to 0.29 has been reported at 355 nm for observations of central Asian dust (Hofer et al., 2017). A δ532 of 0.31±0.02 has been reported for pure and aged Saharan dust by Freudenthaler et al. (2009), Veselovskii et al. (2016), and Haarig et al. (2017), respectively. However, the range of values of δ532 for transported Saharan dust extends from 0.28 (Preißler et al., 2011) to 0.34 (Wiegner et al., 2011), while observations during intense dust episodes at M'Bour, Senegal, showed values of 0.35±0.05 (Veselovskii et al., 2016). Values of between 0.28 and 0.35 have been found at 532 nm for Arabian dust over Cyprus (Mamouri and Ansmann, 2017). Measurements at other regions of the globe are scarce and often restricted to aircraft campaigns. For instance, Burton et al. (2015) provide values of 0.33 to 0.37 at 532 nm for freshly emitted North American dust in the Great Basin region.
While AERONET-derived δ is only available at 440, 675, 880, and 1020 nm compared to the lidar wavelengths of 355, 532, and 1064 nm, Fig. 3 shows that its spectral variation does not resemble the one derived from lidar measurements for pure and aged mineral dust – a feature that has already been identified by Müller et al. (2010, 2012). It has to be noted that light-scattering simulations of lidar parameters using spheroids have their limitations as their solution space only overlaps with that of actual atmospheric measurements if low values of the real part of the refractive index are assumed (Wiegner et al., 2009). In addition, Gasteiger et al. (2011) have shown that lidar measurements of δ for pure mineral dust are best reproduced if the number of particles with aspect ratios below 1.4 is kept small and if irregular particle shapes are used rather than spheroids. However, the spectral resolution of the AERONET observations – with a blind spot at the important lidar wavelength of 532 nm – does not allow for a fair comparison to the literature values presented above. The AERONET-derived values at the longer wavelengths of 870 and 1020 nm fall well within the envelope of the lidar observations as already noted by Noh et al. (2017). This suggests that δ870 or δ1020 might be used to derive the contribution of mineral dust to mixed dust plumes analogous to Tesche et al. (2009b) and Burton et al. (2014).
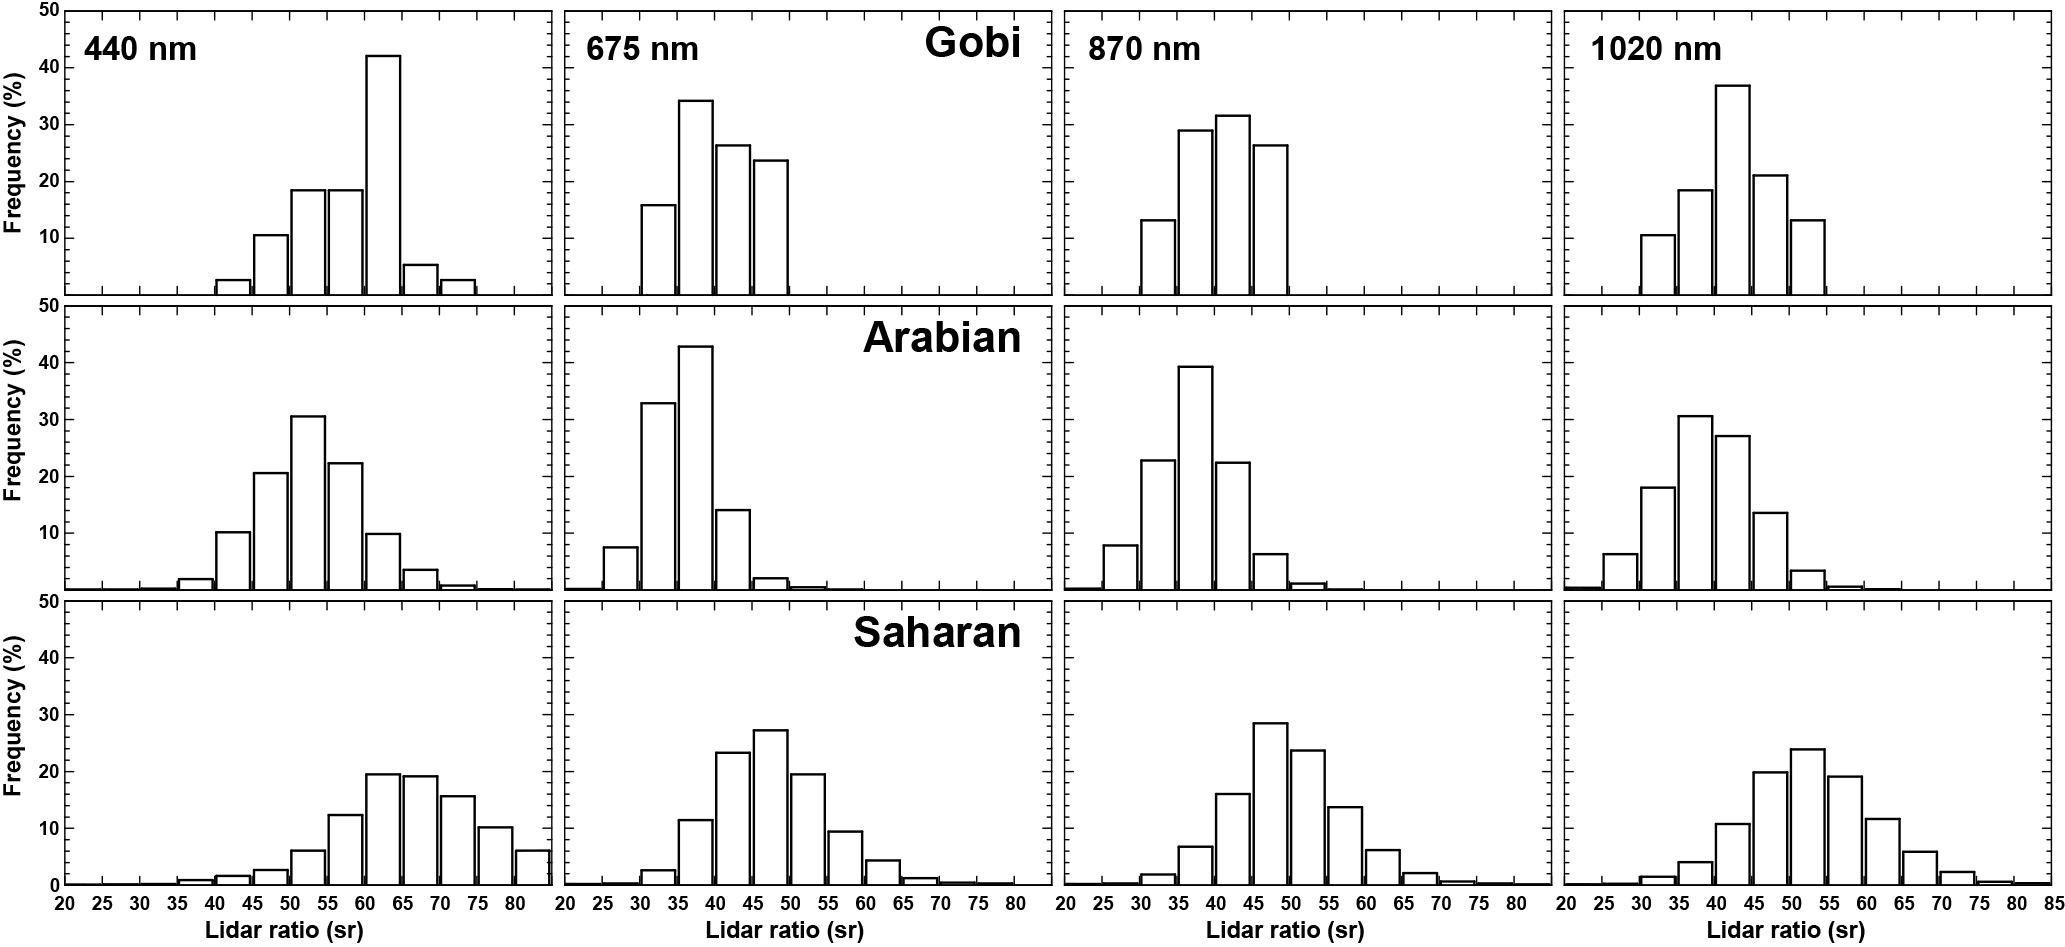
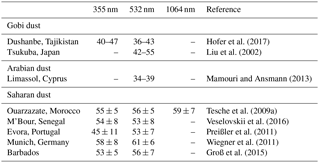
Table 3Literature values on lidar observations of lidar ratio S (sr) for mineral dust from different source regions.
3.2 Lidar ratio
The AERONET-derived frequency distributions of S at 440, 675, 880, and 1020 nm for the Gobi, Arabian, and Saharan deserts are presented in Fig. 4. The distributions for the Gobi and Arabian deserts are rather narrow compared to those for Saharan dust. All three regions show a clear shift to larger values at 440 nm as well as a broadening of the distribution. In contrast to the frequency distributions of δ presented in Fig. 2, the lidar ratio shows a stronger regional variation. The difference in the lidar ratio for Saharan and Arabian dust at 532 nm has previously been obtained from combining AERONET and spaceborne Cloud-Aerosol Lidar with Orthogonal Polarisation (CALIOP) observations (Schuster et al., 2012) as well as from Raman lidar measurements (Mamouri and Ansmann, 2013; Nisantzi et al., 2015). A closer look at the spectral variation of the AERONET-derived S is provided in Fig. 5 and Table 1. Two features are instantly apparent: Saharan dust shows the highest values of S at any considered wavelength, and the values at 440 nm are highest for any considered region. Furthermore, the lowest values are found for the Great Basin and Great Victoria deserts, followed by the Arabian and Gobi deserts. Figure 5 also contains the AERONET-based values presented by Müller et al. (2010), the findings of the modelling study of Gasteiger et al. (2011), and lidar observations of fresh and aged Saharan dust at 355 and 532 nm (Tesche et al., 2009a, 2011; Groß et al., 2015). Further context to the literature on dust lidar ratios as measured with lidar at 355 and 532 nm is provided in Table 3. While the table refers to mean values presented in the respective papers, the range of observed S at 355 nm extends to the high values shown in Table 1 and Fig. 5. For instance, Veselovskii et al. (2016) report that about 10 % of lidar ratios observed at 355 nm show values between 65 and 75 sr. Note that measurements of the lidar ratio of mineral dust at larger wavelengths are not available to date. The comparison to reference lidar measurements in Fig. 5 and Table 3 reveal that the focus of observations has so far been on dust from the Sahara as the world's largest dust source. However, mean values for fresh and aged Saharan dust still vary in a range of as much as 8 sr at both 355 and 532 nm. While observations of Arabian and Asian dust are becoming more common, there are no literature values for the Great Basin and Great Victoria deserts. Consequently, the AERONET-derived lidar ratios presented here might provide a reference for future lidar observations of mineral dust from these regions.
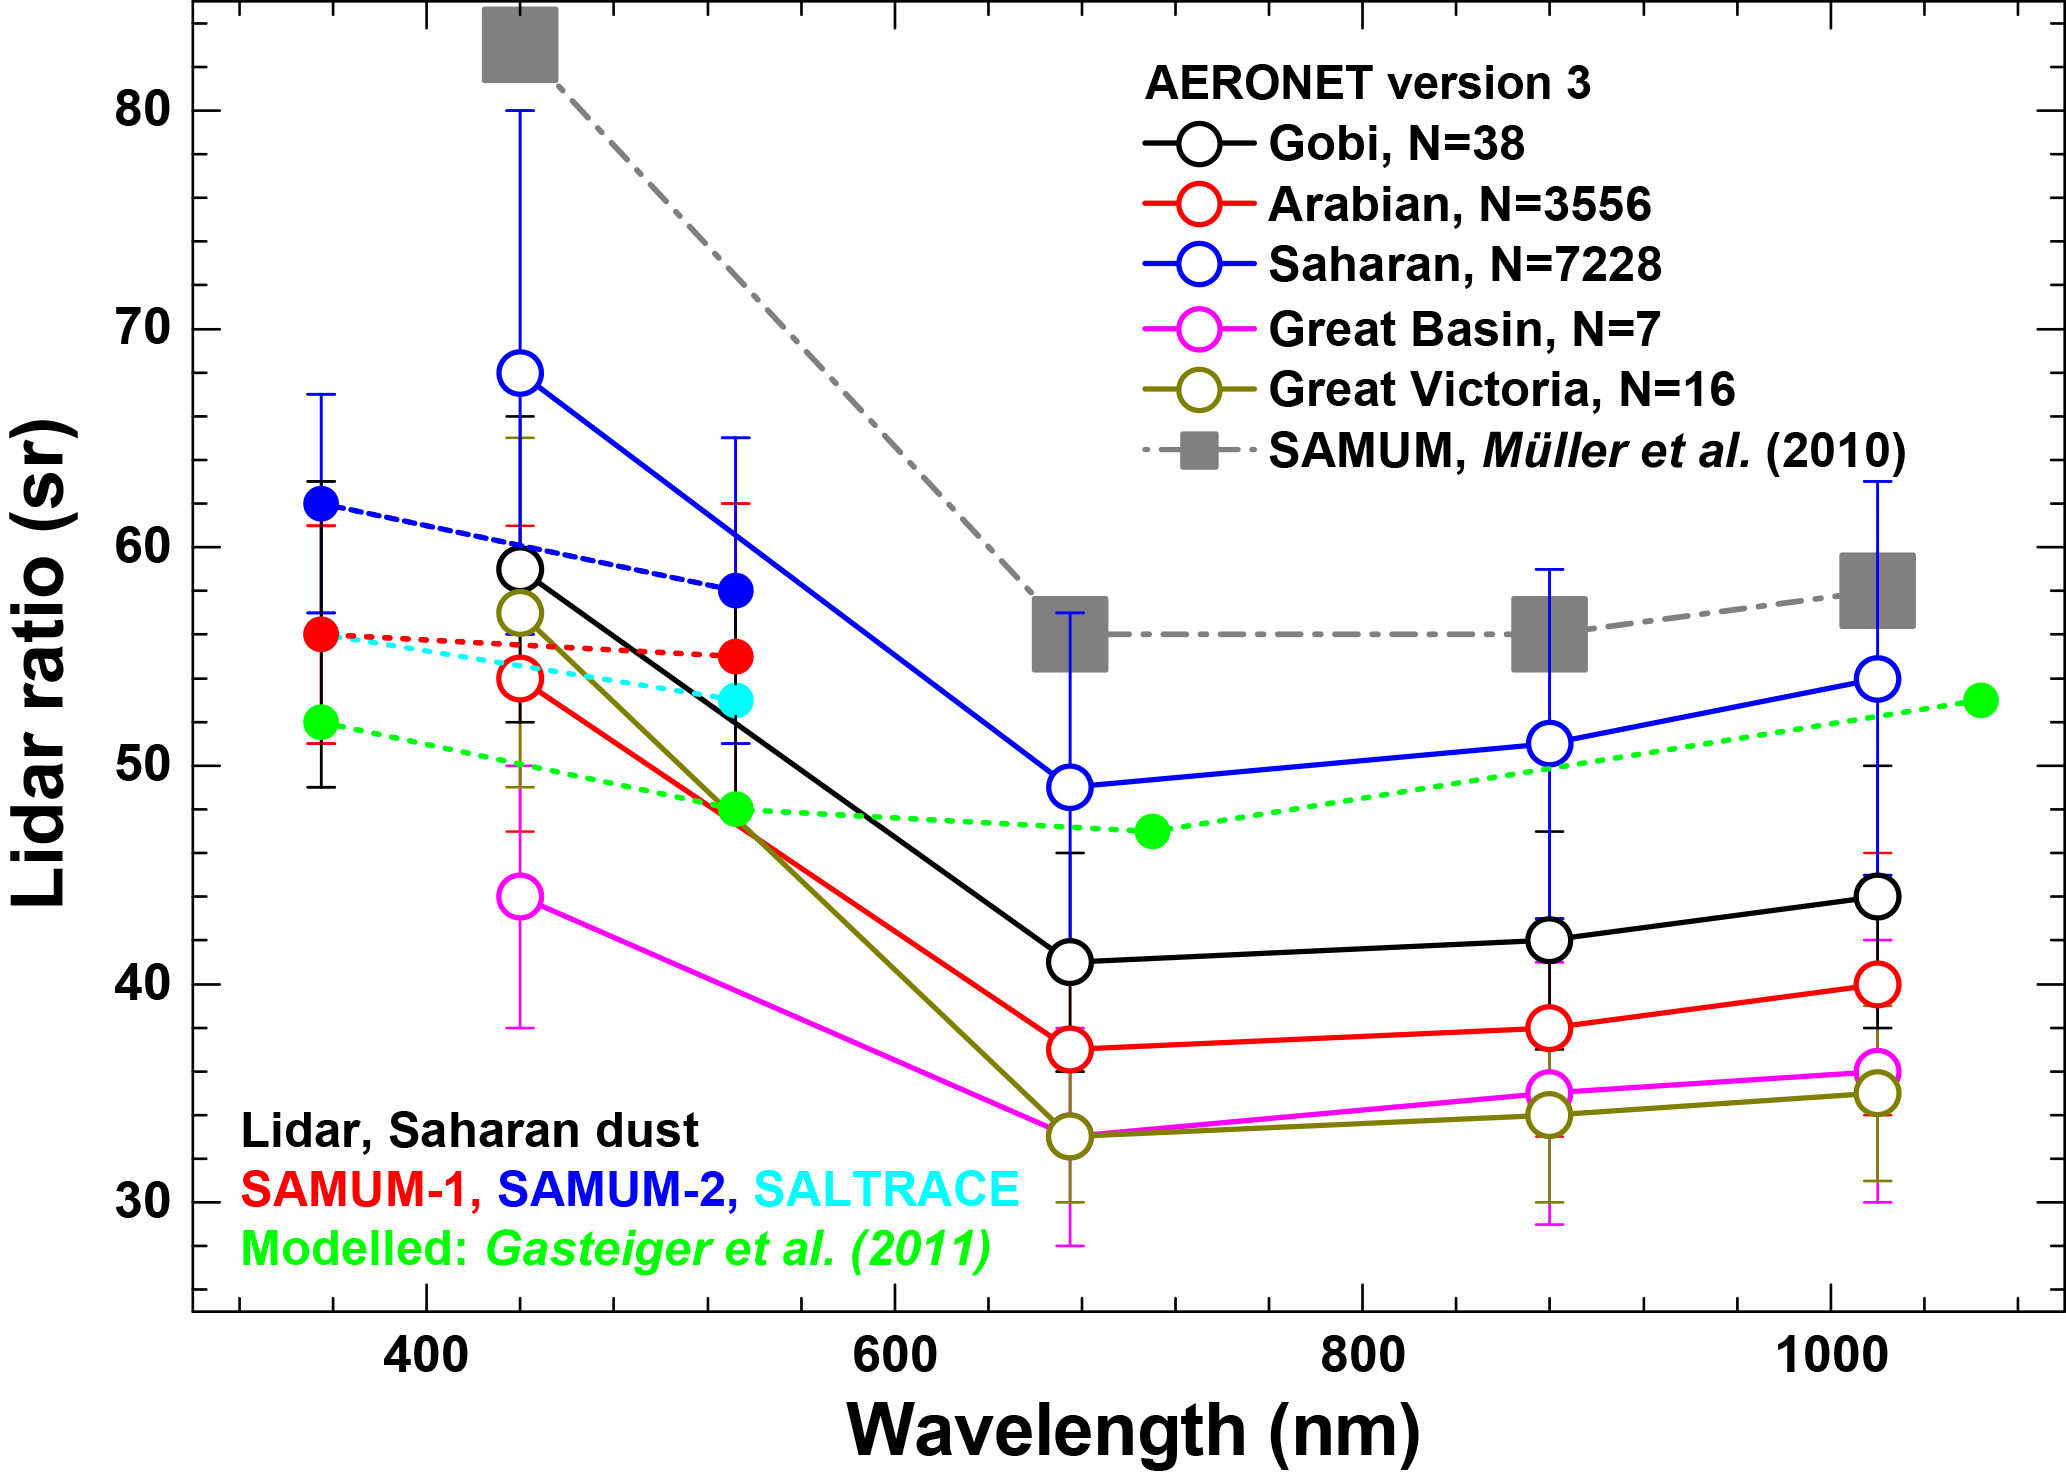
Figure 5Spectral variation of S as derived from AERONET observations for pure dust (open symbols) compared to published values (solid symbols) from two-wavelength lidar observations of Saharan dust during its transport over the Atlantic (SAMUM-1, Tesche et al., 2009a; SAMUM-2, Tesche et al., 2011; SALTRACE, Groß et al., 2015) and the results of light-scattering modelling (Gasteiger et al., 2011). The gray line and symbols present the AERONET-derived S from the comparison study for Saharan dust of Müller et al. (2010).
The closure studies for Saharan dust presented in Müller et al. (2010, 2012) provide an extensive discussion of the limitations of AERONET-derived lidar ratios – which are related mostly to the challenge of properly inferring the imaginary part of the complex refractive index. Compared to these studies, however, Fig. 5 reveals that the AERONET version 3 lidar ratios for Saharan dust moved much closer to the lidar observations at 532 nm as well as to model simulations that apply particle shapes of greater complexity than AERONET's spheroid model (Dubovik et al., 2006; Gasteiger et al., 2011). It therefore seems that AERONET-derived values at 675, 870, and 1020 nm are rather reliable. Lidar ratios at 440 nm on the other hand are likely to exceed the actual values, though no longer as extremely as shown by Müller et al. (2010). Further discussion on the likely source of this overestimation is provided in the next section.
3.3 Regional differences in dust mineralogy
Table 1 also presents the spectral complex refractive index and single-scattering albedo for the considered regions. Real parts of the refractive index were found nearly independent of wavelength and vary between 1.45 for Saharan dust and 1.57 for Great Basin dust. The imaginary parts of desert dust as obtained from AERONET version 3 data in this study range between 0.0010 at 675 to 1020 nm to 0.004 at 440 nm. Only the short wavelength shows increased values of the complex refractive index, leading to the increase in the lidar ratio presented in Fig. 5. Particularly high values are found from observations representative of Saharan and Great Victoria dust. The resulting spectral variation of the complex refractive index with a sharp drop from 440 to 675 nm seems unrealistic when compared to the in situ measurements presented in the closure studies of Müller et al. (2010, 2012). Observations with in situ instruments show that the spectral slope of the imaginary part is not nearly as steep as the spectral slope inferred from the AERONET inversion. A single-scattering albedo of 0.97 or 0.98 is found at all wavelengths apart from 440 nm for which it drops to 0.87 to 0.93 depending on the different desert regions.
Journet et al. (2014)Journet et al. (2014)Journet et al. (2014)Journet et al. (2014)Sokolik and Toon (1999)Sokolik and Toon (1999)Jeong (2008)Jeong and Achterberg (2014)Jeong and Achterberg (2014)Qin and Mitchell (2009)Muhs (2004)Muhs (2004)Table 4Literature values on the contribution (in %) of clay, quartz, and iron to mineral dust from different source regions. The table refers to kaolinite (Kao), illite (Ill), smectite (Sme), chlorite (Chl), vermiculite (Ver), calcite (Cal), quartz (Qua), goethite (Goe), hematite (Hem), and feldspars (Fel).
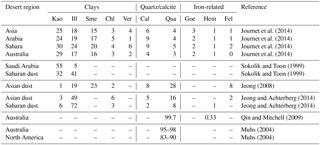
The variation of the lidar ratio of mineral dust from the Saharan and Arabian deserts has been shown by Schuster et al. (2012) and Nisantzi et al. (2015). These differences are the result of regional changes in the mineralogical composition of the dust particles. In general, mineral dust consists of, to varying degrees, e.g. kaolinite, illite, smectite, vermiculite, calcite, quartz, chlorite, goethite, feldspars, and hematite, whose properties regarding light scattering and absorbance differ considerably. For instance, quartz has strong light-absorption bands in the infrared (IR) atmospheric window, while its absorption properties are negligible at ultraviolet (UV) and visible wavelengths. Clays such as illite, kaolinite, and montmorillonite absorb light at solar wavelengths and feature an imaginary part of the refractive index that increases towards shorter wavelengths. Hematite is also known as a strongly light-absorbing material in the UV and visible wavelength regions. In contrast, calcite and gypsum show almost no absorption throughout the UV and visible spectra, but have strong light absorption in the IR (Sokolik and Toon, 1999).
Consequently, the light-absorption properties of mineral dust are determined by the relative abundance of the different mineral types. The proportions of each mineral compound differ for different source regions. An overview of the regional change in the composition of mineral dust from the source regions considered in this study as available in the literature is provided in Table 4. Clay minerals (e.g. kaolinite, illite, smectite) are most abundant in dust from the Sahara, with contributions of 73 % to 81 % (Sokolik and Toon, 1999; Jeong and Achterberg, 2014; Journet et al., 2014). In contrast, smaller clay fractions of 45 % to 66 % were found for source regions of Asian and Arabian dust (Sokolik and Toon, 1999; Jeong, 2008; Jeong and Achterberg, 2014; Journet et al., 2014). As shown in Schuster et al. (2012), the larger values of the lidar ratio we have obtained for Saharan dust (see Table 1 and Fig. 5) are the result of a higher proportion of clay in the mineral composition, and thus, an increase in the imaginary part of the complex refractive index compared to less clay-rich dust. On the other hand, dust from Australian deserts consists mostly of quartz, with a fraction of 95 % to 99.7 % (Muhs, 2004; Qin and Mitchell, 2009). This provides a reasonable explanation for the lower lidar ratios we have obtained for dust from the Great Victoria desert. Dust from the different source regions considered in this study contains some amount of iron oxide minerals (e.g. goethite and hematite), which are major light absorbers in the short wavelength region. While the strong increase of the imaginary part of the complex refractive index at 440 nm (and the resulting decrease of the single-scattering albedo and increase of the lidar ratio with respect to the longer wavelengths) might not be realistic with regard to its amount (Müller et al., 2010, 2012), the general feature is caused by the spectral light-absorbing characteristics of the iron-related mineral in the dust.
In this study we investigated the spectral particle linear depolarisation ratio δ and the particle lidar ratio S as provided in the recently released version 3 of the AERONET inversion. To select observations representative of pure mineral dust conditions, only AERONET data with a 440/870 nm Ångström exponent below 0.4 and a fine-mode fraction below 0.10 have been selected in this study. AERONET stations considered here were chosen according to their location and are assumed to represent observations of mineral dust from the Gobi, Arabian, Saharan, Great Basin, and Great Victoria deserts. No suitable AERONET cases could be found for the Kalahari desert.
AERONET version 3 data show a spectral dependence of δ, with a maximum between 0.27 and 0.31 at 1020 nm for the different source regions and lower values for smaller wavelengths. The minimum values range between 0.19 and 0.24 at 440 nm. AERONET-derived δ values are generally within the range of independent lidar observations of mineral dust, though they are provided at wavelengths different from those used by advanced depolarisation lidars. The AERONET findings of spectral S show a much stronger regional variation than those of δ. This is because the lidar ratio depends on the complex refractive index (which is determined by mineral composition), while the depolarisation ratio is more dependent on particle morphology. The lowest values of S are found for mineral dust from the Great Basin and Great Victoria deserts. Note that these two regions provided the smallest sample sizes of this study, and thus, should be handled with care. Most values of S for Arabian dust and Saharan dust are in agreement with the lidar literature – though findings at 440 nm are likely to be somewhat too large when compared to lidar measurements at 355 and 532 nm. Apart from 440 nm, the spectral variation inferred using AERONET's spheroid model resembles that obtained from more complex particle models. To investigate the potential effects of changes in particle size on δ and S, we have obtained the mean size distributions for those intervals in the histograms of Figs. 2 and 4, respectively, that contribute more than 5 % to the total data (not shown). We found virtually no difference in the shape of the mean size distributions at different wavelengths, source regions, or intervals of δ and S, which is likely the result of our initial constraints for selecting the data suitable for representing pure dust conditions.
The particle linear depolarisation ratio and the lidar ratio are intensive aerosol parameters that allow for aerosol classification and aerosol-type separation. However, for the latter methodology to be reliable, reference values of δ for pure mineral dust and other undiluted aerosol types need to be known for different source regions. Our analysis of AERONET-derived dust-related δ and S shows that both parameters depend on the source region – though to different degrees. We conclude that AERONET measurements at longer wavelengths can provide reference values of δ and S for pure dust conditions in regions where direct measurements with advanced depolarisation Raman or high spectral resolution lidar are either not available at all or the number of observations is not yet large enough to obtain statistically robust results. In addition, the inferred spectral dependence of δ suggests a pathway for obtaining the columnar contribution of mineral dust and other aerosol types to mixed dust plumes from AERONET-derived δ, analogous to its application in the analysis of depolarisation lidar observations.
The data used in this work are freely available through the AERONET portal at https://aeronet.gsfc.nasa.gov/ (last access: 31 August 2018).
SKS, KK, and YN had the idea for this study. SKS and MT performed the data analysis and prepared the figures. All authors contributed to the discussion of the findings and the preparation of the manuscript.
The authors declare that they have no conflict of interest.
We thank the PIs of the AERONET sites used in this study for maintaining
their instruments and providing their data to the community. We would also like to
thank AERONET for their continuous efforts in providing high-quality
measurements and derivative products. All data used in this work can be
accessed through the AERONET home page at https://aeronet.gsfc.nasa.gov/ (last
access: 31 August 2018). Sung-Kyun Shin was
supported by the Basic Science Research Program of the National Research
Foundation of Korea funded by the Ministry of Education under grant
NRF-2017R1A6A3A03005398. This work has also been supported by the Korea
Meteorological Administration Research and Development program under grant
KMI (2018-04010).
Edited by: Armin
Sorooshian
Reviewed by: three anonymous referees
Bohren, C. and Huffman, D.: Absorbing and scattering of light by small particles, Wiley, Weinheim, https://doi.org/10.1002/9783527618156, 1983. a, b
Burton, S. P., Ferrare, R. A., Hostetler, C. A., Hair, J. W., Rogers, R. R., Obland, M. D., Butler, C. F., Cook, A. L., Harper, D. B., and Froyd, K. D.: Aerosol classification using airborne High Spectral Resolution Lidar measurements – methodology and examples, Atmos. Meas. Tech., 5, 73–98, https://doi.org/10.5194/amt-5-73-2012, 2012. a
Burton, S. P., Ferrare, R. A., Vaughan, M. A., Omar, A. H., Rogers, R. R., Hostetler, C. A., and Hair, J. W.: Aerosol classification from airborne HSRL and comparisons with the CALIPSO vertical feature mask, Atmos. Meas. Tech., 6, 1397–1412, https://doi.org/10.5194/amt-6-1397-2013, 2013. a
Burton, S. P., Vaughan, M. A., Ferrare, R. A., and Hostetler, C. A.: Separating mixtures of aerosol types in airborne High Spectral Resolution Lidar data, Atmos. Meas. Tech., 7, 419–436, https://doi.org/10.5194/amt-7-419-2014, 2014. a, b
Burton, S. P., Hair, J. W., Kahnert, M., Ferrare, R. A., Hostetler, C. A., Cook, A. L., Harper, D. B., Berkoff, T. A., Seaman, S. T., Collins, J. E., Fenn, M. A., and Rogers, R. R.: Observations of the spectral dependence of linear particle depolarization ratio of aerosols using NASA Langley airborne High Spectral Resolution Lidar, Atmos. Chem. Phys., 15, 13453–13473, https://doi.org/10.5194/acp-15-13453-2015, 2015. a, b, c, d, e, f, g, h, i, j, k, l
Cottle, P., Strawbridge, K., McKendry, I., O'Neill, N., and Saha, A.: A pervasive and persistent Asian dust event over North America during spring 2010: lidar and sunphotometer observations, Atmos. Chem. Phys., 13, 4515–4527, https://doi.org/10.5194/acp-13-4515-2013, 2013. a, b
Dubovik, O., Sinyuk, A., Lapyonok, T., Holben, B. N., Mishchenko, M., Yang, P., Eck, T. F., Volten, H., Muñoz, O., and Veihelmann, B.: Application of spheroid models to account for aerosol particle nonsphericity in remote sensing of desert dust, J. Geophys. Res.-Atmos., 111, D11208, https://doi.org/10.1029/2005JD006619, 2006. a, b, c, d, e
Freudenthaler, V.: About the effects of polarising optics on lidar signals and the Δ90 calibration, Atmos. Meas. Tech., 9, 4181–4255, https://doi.org/10.5194/amt-9-4181-2016, 2016. a
Freudenthaler, V., Esselborn, M., Wiegner, M., Heese, B., Tesche, M., Ansmann, A., Müller, D., Althausen, D., Wirth, M., and Fix, A.: Depolarization ratio profiling at several wavelengths in pure Saharan dust during SAMUM 2006, Tellus B, 61, 165–179, https://doi.org/10.1111/j.1600-0889.2008.00396.x, 2009. a, b, c, d, e, f, g, h
Gasteiger, J., Wiegner, M., Groß, S., Freudenthaler, V., Toledano, C., Tesche, M., and Kandler, K.: Modelling lidar-relevant optical properties of complex mineral dust aerosols, Tellus B, 63, 725–741, https://doi.org/10.1111/j.1600-0889.2011.00559.x, 2011. a, b, c, d
Ginoux, P., Clarisse, L., Clerbaux, C., Coheur, P.-F., Dubovik, O., Hsu, N. C., and Van Damme, M.: Mixing of dust and NH3 observed globally over anthropogenic dust sources, Atmos. Chem. Phys., 12, 7351–7363, https://doi.org/10.5194/acp-12-7351-2012, 2012. a
Groß, S., Esselborn, M., Weinzierl, B., Wirth, M., Fix, A., and Petzold, A.: Aerosol classification by airborne high spectral resolution lidar observations, Atmos. Chem. Phys., 13, 2487–2505, https://doi.org/10.5194/acp-13-2487-2013, 2013. a
Groß, S., Freudenthaler, V., Schepanski, K., Toledano, C., Schäfler, A., Ansmann, A., and Weinzierl, B.: Optical properties of long-range transported Saharan dust over Barbados as measured by dual-wavelength depolarization Raman lidar measurements, Atmos. Chem. Phys., 15, 11067–11080, https://doi.org/10.5194/acp-15-11067-2015, 2015. a, b, c
Haarig, M., Ansmann, A., Althausen, D., Klepel, A., Groß, S., Freudenthaler, V., Toledano, C., Mamouri, R.-E., Farrell, D. A., Prescod, D. A., Marinou, E., Burton, S. P., Gasteiger, J., Engelmann, R., and Baars, H.: Triple-wavelength depolarization-ratio profiling of Saharan dust over Barbados during SALTRACE in 2013 and 2014, Atmos. Chem. Phys., 17, 10767–10794, https://doi.org/10.5194/acp-17-10767-2017, 2017. a, b, c, d, e, f
Hofer, J., Althausen, D., Abdullaev, S. F., Makhmudov, A. N., Nazarov, B. I., Schettler, G., Engelmann, R., Baars, H., Fomba, K. W., Müller, K., Heinold, B., Kandler, K., and Ansmann, A.: Long-term profiling of mineral dust and pollution aerosol with multiwavelength polarization Raman lidar at the Central Asian site of Dushanbe, Tajikistan: case studies, Atmos. Chem. Phys., 17, 14559–14577, https://doi.org/10.5194/acp-17-14559-2017, 2017. a, b, c, d
Holben, B. N., Eck, T. F., Slutsker, I., Tanré, D., Buis, J., Setzer, A., Vermote, E., Reagan, J., Kaufman, Y. J., and Nakajima, T.: AERONET – A federated instrument network and data archive for aerosol characterization, Remote Sens. Environ., 66, 1–16, https://doi.org/10.1016/S0034-4257(98)00031-5, 1998. a
IPCC: Climate Change 2013: The Physical Science Basis. Contribution of Working Group I to the Fifth Assessment Report of the Intergovernmental Panel on Climate Change, Cambridge University Press, Cambridge, UK and New York, NY, USA, 1535 pp., 2013. a, b
Jeong, G. Y.: Bulk and single-particle mineralogy of Asian dust and a comparison with its source soils, J. Geophys. Res.-Atmos., 113, D02208, https://doi.org/10.1029/2007JD008606, 2008. a, b
Jeong, G. Y. and Achterberg, E. P.: Chemistry and mineralogy of clay minerals in Asian and Saharan dusts and the implications for iron supply to the oceans, Atmos. Chem. Phys., 14, 12415–12428, https://doi.org/10.5194/acp-14-12415-2014, 2014. a, b, c, d
Jickells, T., An, Z., Andersen, K. K., Baker, A., Bergametti, G., Brooks, N., Cao, J., Boyd, P., Duce, R., and Hunter, K.: Global iron connections between desert dust, ocean biogeochemistry, and climate, Science, 308, 67–71, https://doi.org/10.1126/science.1105959, 2005. a
Journet, E., Balkanski, Y., and Harrison, S. P.: A new data set of soil mineralogy for dust-cycle modeling, Atmos. Chem. Phys., 14, 3801–3816, https://doi.org/10.5194/acp-14-3801-2014, 2014. a, b, c, d, e, f
Kinne, S., Schulz, M., Textor, C., Guibert, S., Balkanski, Y., Bauer, S. E., Berntsen, T., Berglen, T. F., Boucher, O., Chin, M., Collins, W., Dentener, F., Diehl, T., Easter, R., Feichter, J., Fillmore, D., Ghan, S., Ginoux, P., Gong, S., Grini, A., Hendricks, J., Herzog, M., Horowitz, L., Isaksen, I., Iversen, T., Kirkevåg, A., Kloster, S., Koch, D., Kristjansson, J. E., Krol, M., Lauer, A., Lamarque, J. F., Lesins, G., Liu, X., Lohmann, U., Montanaro, V., Myhre, G., Penner, J., Pitari, G., Reddy, S., Seland, O., Stier, P., Takemura, T., and Tie, X.: An AeroCom initial assessment – optical properties in aerosol component modules of global models, Atmos. Chem. Phys., 6, 1815–1834, https://doi.org/10.5194/acp-6-1815-2006, 2006. a
Liu, Z., Sugimoto, N., and Murayama, T.: Extinction-to-backscatter ratio of Asian dust observed with high-spectral-resolution lidar and Raman lidar, Appl. Optics, 41, 2760–2767, https://doi.org/10.1364/AO.41.002760, 2002. a
Mamouri, R. E., Ansmann, A., Nisantzi, A., Kokkalis, P., Schwarz, A., and Hadjimitsis, D.: Low Arabian dust extinction-to-backscatter ratio, Geophys. Res. Lett., 40, 4762–4766, https://doi.org/10.1002/grl.50898, 2013. a, b, c, d
Mamouri, R.-E. and Ansmann, A.: Potential of polarization/Raman lidar to separate fine dust, coarse dust, maritime, and anthropogenic aerosol profiles, Atmos. Meas. Tech., 10, 3403–3427, https://doi.org/10.5194/amt-10-3403-2017, 2017. a
Mattis, I., Tesche, M., Grein, M., Freudenthaler, V., and Müller, D.: Systematic error of lidar profiles caused by a polarization-dependent receiver transmission: quantification and error correction scheme, Appl. Optics, 48, 2742–2751, 2009. a
Morman, S. A. and Plumlee, G. S.: The role of airborne mineral dusts in human disease, Aeolian Res., 9, 203–212, https://doi.org/10.1016/j.aeolia.2012.12.001, 2013. a
Muhs, D. R.: Mineralogical maturity in dunefields of North America, Africa and Australia, Geomorphology, 59, 247–269, https://doi.org/10.1016/j.geomorph.2003.07.020, 2004. a, b, c
Müller, D., Ansmann, A., Mattis, I., Tesche, M., Wandinger, U., Althausen, D., and Pisani, G.: Aerosol-type-dependent lidar ratios observed with Raman lidar, J. Geophys. Res., 112, D16202, https://doi.org/10.1029/2006JD008292, 2007. a, b
Müller, D., Weinzierl, B., Petzold, A., Kandler, K., Ansmann, A., Müller, T., Tesche, M., Freudenthaler, V., Esselborn, M., and Heese, B.: Mineral dust observed with AERONET Sun photometer, Raman lidar, and in situ instruments during SAMUM 2006: Shape-independent particle properties, J. Geophys. Res.-Atmos., 115, D07202, https://doi.org/10.1029/2009JD012520, 2010. a, b, c, d, e, f, g, h, i, j, k, l
Müller, D., Lee, K. H., Gasteiger, J., Tesche, M., Weinzierl, B., Kandler, K., Müller, T., Toledano, C., Otto, S., and Althausen, D.: Comparison of optical and microphysical properties of pure Saharan mineral dust observed with AERONET Sun photometer, Raman lidar, and in situ instruments during SAMUM 2006, J. Geophys. Res.-Atmos., 117, D07211, https://doi.org/10.1029/2011JD016825, 2012. a, b, c, d, e, f, g, h, i
Nisantzi, A., Mamouri, R. E., Ansmann, A., Schuster, G. L., and Hadjimitsis, D. G.: Middle East versus Saharan dust extinction-to-backscatter ratios, Atmos. Chem. Phys., 15, 7071–7084, https://doi.org/10.5194/acp-15-7071-2015, 2015. a, b
Noh, Y., Müller, D., Lee, K., Kim, K., Lee, K., Shimizu, A., Sano, I., and Park, C. B.: Depolarization ratios retrieved by AERONET sun–sky radiometer data and comparison to depolarization ratios measured with lidar, Atmos. Chem. Phys., 17, 6271–6290, https://doi.org/10.5194/acp-17-6271-2017, 2017. a, b
Preißler, J., Wagner, F., Pereira, S. N., and Guerrero-Rascado, J. L.: Multi-instrumental observation of an exceptionally strong Saharan dust outbreak over Portugal, J. Geophys. Res.-Atmos., 116, D24204, https://doi.org/10.1029/2011JD016527, 2011. a, b, c
Qin, Y. and Mitchell, R. M.: Characterisation of episodic aerosol types over the Australian continent, Atmos. Chem. Phys., 9, 1943–1956, https://doi.org/10.5194/acp-9-1943-2009, 2009. a, b
Schuster, G. L., Dubovik, O., and Holben, B. N.: Angstrom exponent and bimodal aerosol size distributions, J. Geophys. Res.-Atmos., 111, D07207, https://doi.org/10.1029/2005JD006328, 2006. a
Schuster, G. L., Vaughan, M., MacDonnell, D., Su, W., Winker, D., Dubovik, O., Lapyonok, T., and Trepte, C.: Comparison of CALIPSO aerosol optical depth retrievals to AERONET measurements, and a climatology for the lidar ratio of dust, Atmos. Chem. Phys., 12, 7431–7452, https://doi.org/10.5194/acp-12-7431-2012, 2012. a, b, c, d
Shimizu, A., Sugimoto, N., Matsui, I., Arao, K., Uno, I., Murayama, T., Kagawa, N., Aoki, K., Uchiyama, A., and Yamazaki, A.: Continuous observations of Asian dust and other aerosols by polarization lidars in China and Japan during ACE-Asia, J. Geophys. Res.-Atmos., 109, D19S17, https://doi.org/10.1029/2002JD003253, 2004. a
Shin, S.-K., Müller, D., Lee, C., Lee, K. H., Shin, D., Kim, Y. J., and Noh, Y. M.: Vertical variation of optical properties of mixed Asian dust/pollution plumes according to pathway of air mass transport over East Asia, Atmos. Chem. Phys., 15, 6707–6720, https://doi.org/10.5194/acp-15-6707-2015, 2015. a, b, c
Sokolik, I. N. and Toon, O. B.: Incorporation of mineralogical composition into models of the radiative properties of mineral aerosol from UV to IR wavelengths, J. Geophys. Res.-Atmos., 104, 9423–9444, https://doi.org/10.1029/1998JD200048, 1999. a, b, c, d, e
Sugimoto, N. and Lee, C. H.: Characteristics of dust aerosols inferred from lidar depolarization measurements at two wavelengths, Appl. Optics, 45, 7468–7474, https://doi.org/10.1364/AO.45.007468, 2006. a, b
Tesche, M., Ansmann, A., Müller, D., Althausen, D., Mattis, I., Heese, B., Freudenthaler, V.,Wiegner, M., Esselborn, M., Pisani, G., and Knippertz, P.: Vertical profiling of Saharan dust with Raman lidars and airborne HSRL in southern Morocco during SAMUM, Tellus B, 61, 144–164, https://doi.org/10.1111/j.1600-0889.2008.00390.x, 2009a. a, b, c, d
Tesche, M., Ansmann, A., Müller, D., Althausen, D., Engelmann, R., Freudenthaler, V., and Groß, S.: Vertically resolved separation of dust and smoke over Cape Verde using multiwavelength Raman and polarization lidars during Saharan Mineral Dust Experiment 2008, J. Geophys. Res.-Atmos., 114, D13202, https://doi.org/10.1029/2009JD011862, 2009b. a, b, c
Tesche, M., Groß, S., Ansmann, A., Müller, D., Althausen, D., Freudenthaler, V., and Esselborn, M.: Profiling of Saharan dust and biomass-burning smoke with multiwavelength polarization Raman lidar at Cape Verde, Tellus B, 63, 649–676, https://doi.org/10.1111/j.1600-0889.2011.00548.x, 2011. a, b, c
Veselovskii, I., Goloub, P., Podvin, T., Bovchaliuk, V., Derimian, Y., Augustin, P., Fourmentin, M., Tanre, D., Korenskiy, M., Whiteman, D. N., Diallo, A., Ndiaye, T., Kolgotin, A., and Dubovik, O.: Retrieval of optical and physical properties of African dust from multiwavelength Raman lidar measurements during the SHADOW campaign in Senegal, Atmos. Chem. Phys., 16, 7013–7028, https://doi.org/10.5194/acp-16-7013-2016, 2016. a, b, c, d, e
Wiegner, M., Gasteiger, J., Kandler, K., Weinzierl, B., Rasp, K., Esselborn, M., Freudenthaler, V., Heese, B., Toledano, C., Tesche, M., and Althausen, D.: Numerical simulations of optical properties of Saharan dust aerosols with emphasis on lidar applications, Tellus B, 61, 180–194, https://doi.org/10.1111/j.1600-0889.2008.00381.x, 2009. a
Wiegner, M., Groß, S., Freudenthaler, V., Schnell, F., and Gasteiger, J.: The May/June 2008 Saharan dust event over Munich: Intensive aerosol parameters from lidar measurements, J. Geophys. Res.-Atmos., 116, D23213, https://doi.org/10.1029/2011JD016619, 2011. a, b, c