the Creative Commons Attribution 3.0 License.
the Creative Commons Attribution 3.0 License.
The early summertime Saharan heat low: sensitivity of the radiation budget and atmospheric heating to water vapour and dust aerosol
Netsanet K. Alamirew
Martin C. Todd
Claire L. Ryder
John H. Marsham
The Saharan heat low (SHL) is a key component of the west African climate system and an important driver of the west African monsoon across a range of timescales of variability. The physical mechanisms driving the variability in the SHL remain uncertain, although water vapour has been implicated as of primary importance. Here, we quantify the independent effects of variability in dust and water vapour on the radiation budget and atmospheric heating of the region using a radiative transfer model configured with observational input data from the Fennec field campaign at the location of Bordj Badji Mokhtar (BBM) in southern Algeria (21.4∘ N, 0.9∘ E), close to the SHL core for June 2011. Overall, we find dust aerosol and water vapour to be of similar importance in driving variability in the top-of-atmosphere (TOA) radiation budget and therefore the column-integrated heating over the SHL (∼ 7 W m−2 per standard deviation of dust aerosol optical depth – AOD). As such, we infer that SHL intensity is likely to be similarly enhanced by the effects of dust and water vapour surge events. However, the details of the processes differ. Dust generates substantial radiative cooling at the surface (∼ 11 W m−2 per standard deviation of dust AOD), presumably leading to reduced sensible heat flux in the boundary layer, which is more than compensated by direct radiative heating from shortwave (SW) absorption by dust in the dusty boundary layer. In contrast, water vapour invokes a radiative warming at the surface of ∼ 6 W m−2 per standard deviation of column-integrated water vapour in kg m−2. Net effects involve a pronounced net atmospheric radiative convergence with heating rates on average of 0.5 K day−1 and up to 6 K day−1 during synoptic/mesoscale dust events from monsoon surges and convective cold-pool outflows (“haboobs”). On this basis, we make inferences on the processes driving variability in the SHL associated with radiative and advective heating/cooling. Depending on the synoptic context over the region, processes driving variability involve both independent effects of water vapour and dust and compensating events in which dust and water vapour are co-varying. Forecast models typically have biases of up to 2 kg m−2 in column-integrated water vapour (equivalent to a change in 2.6 W m−2 TOA net flux) and typically lack variability in dust and thus are expected to poorly represent these couplings. An improved representation of dust and water vapour and quantification of associated radiative impact in models is thus imperative to further understand the SHL and related climate processes.
- Article
(6349 KB) - Full-text XML
-
Supplement
(565 KB) - BibTeX
- EndNote


During boreal summer, the Saharan heat low (SHL), a low-level thermal low, extends over a vast sector of the central Sahara, covering much of northern Mauritania, Mali, Niger, and southern Algeria (Fig. 1). The area of low surface pressure is characterised by extremes of high surface temperature (Lavaysse et al., 2009; Messager et al., 2010) and a deep boundary layer (BL) (Marsham et al., 2013b), and is co-located with a global maximum in seasonal dust aerosol loading (Knippertz and Todd, 2012).
It is increasingly recognised that the SHL is a key component of the west African climate system and an important driver of the west African monsoon across a range of timescales of variability (e.g. Chauvin et al., 2010; Couvreux et al., 2010; Lafore et al., 2010; Martin and Thorncroft, 2014; Martin et al., 2014; Parker et al., 2005; Peyrille and Lafore, 2007; Sultan and Janicot, 2003; Thorncroft and Blackburn, 1999; Xue et al., 2010). Notably, the intensification of the SHL in recent decades has been linked to the recovery of the Sahelian rainfall from the multi-decadal drought of the 1970–1990s, partly through a water vapour positive feedback process, in which radiative warming from increasing water vapour strengthens the SHL, which enhances the moist low-level monsoon flow, driving greater water vapour transport into the SHL and further warming (Dong and Sutton, 2015; Evan et al., 2015b; Lavaysse et al., 2016) with an implied enhanced west African monsoon.
The SHL results from a complex interplay of heating processes within the Saharan BL, from the conversion of large radiative surpluses at the surface into sensible heat flux, cooling from horizontal temperature advection (itself a function of the strength of the pressure gradient into the SHL core), and radiative cooling and adiabatic warming via subsidence in the upper BL (Alamirew et al., 2018). The SHL intensity is therefore likely to be modulated by radiative effects of variability in surface albedo, dust aerosol, water vapour, and clouds which feed back onto the circulation, and thus advective cooling, water vapour transport, and the processes governing dust emission and transport. In addition, the SHL is also modulated by external dynamical controls on advective cooling from both tropical (Knippertz and Todd, 2012) and extratropical sources (Chauvin et al., 2010).
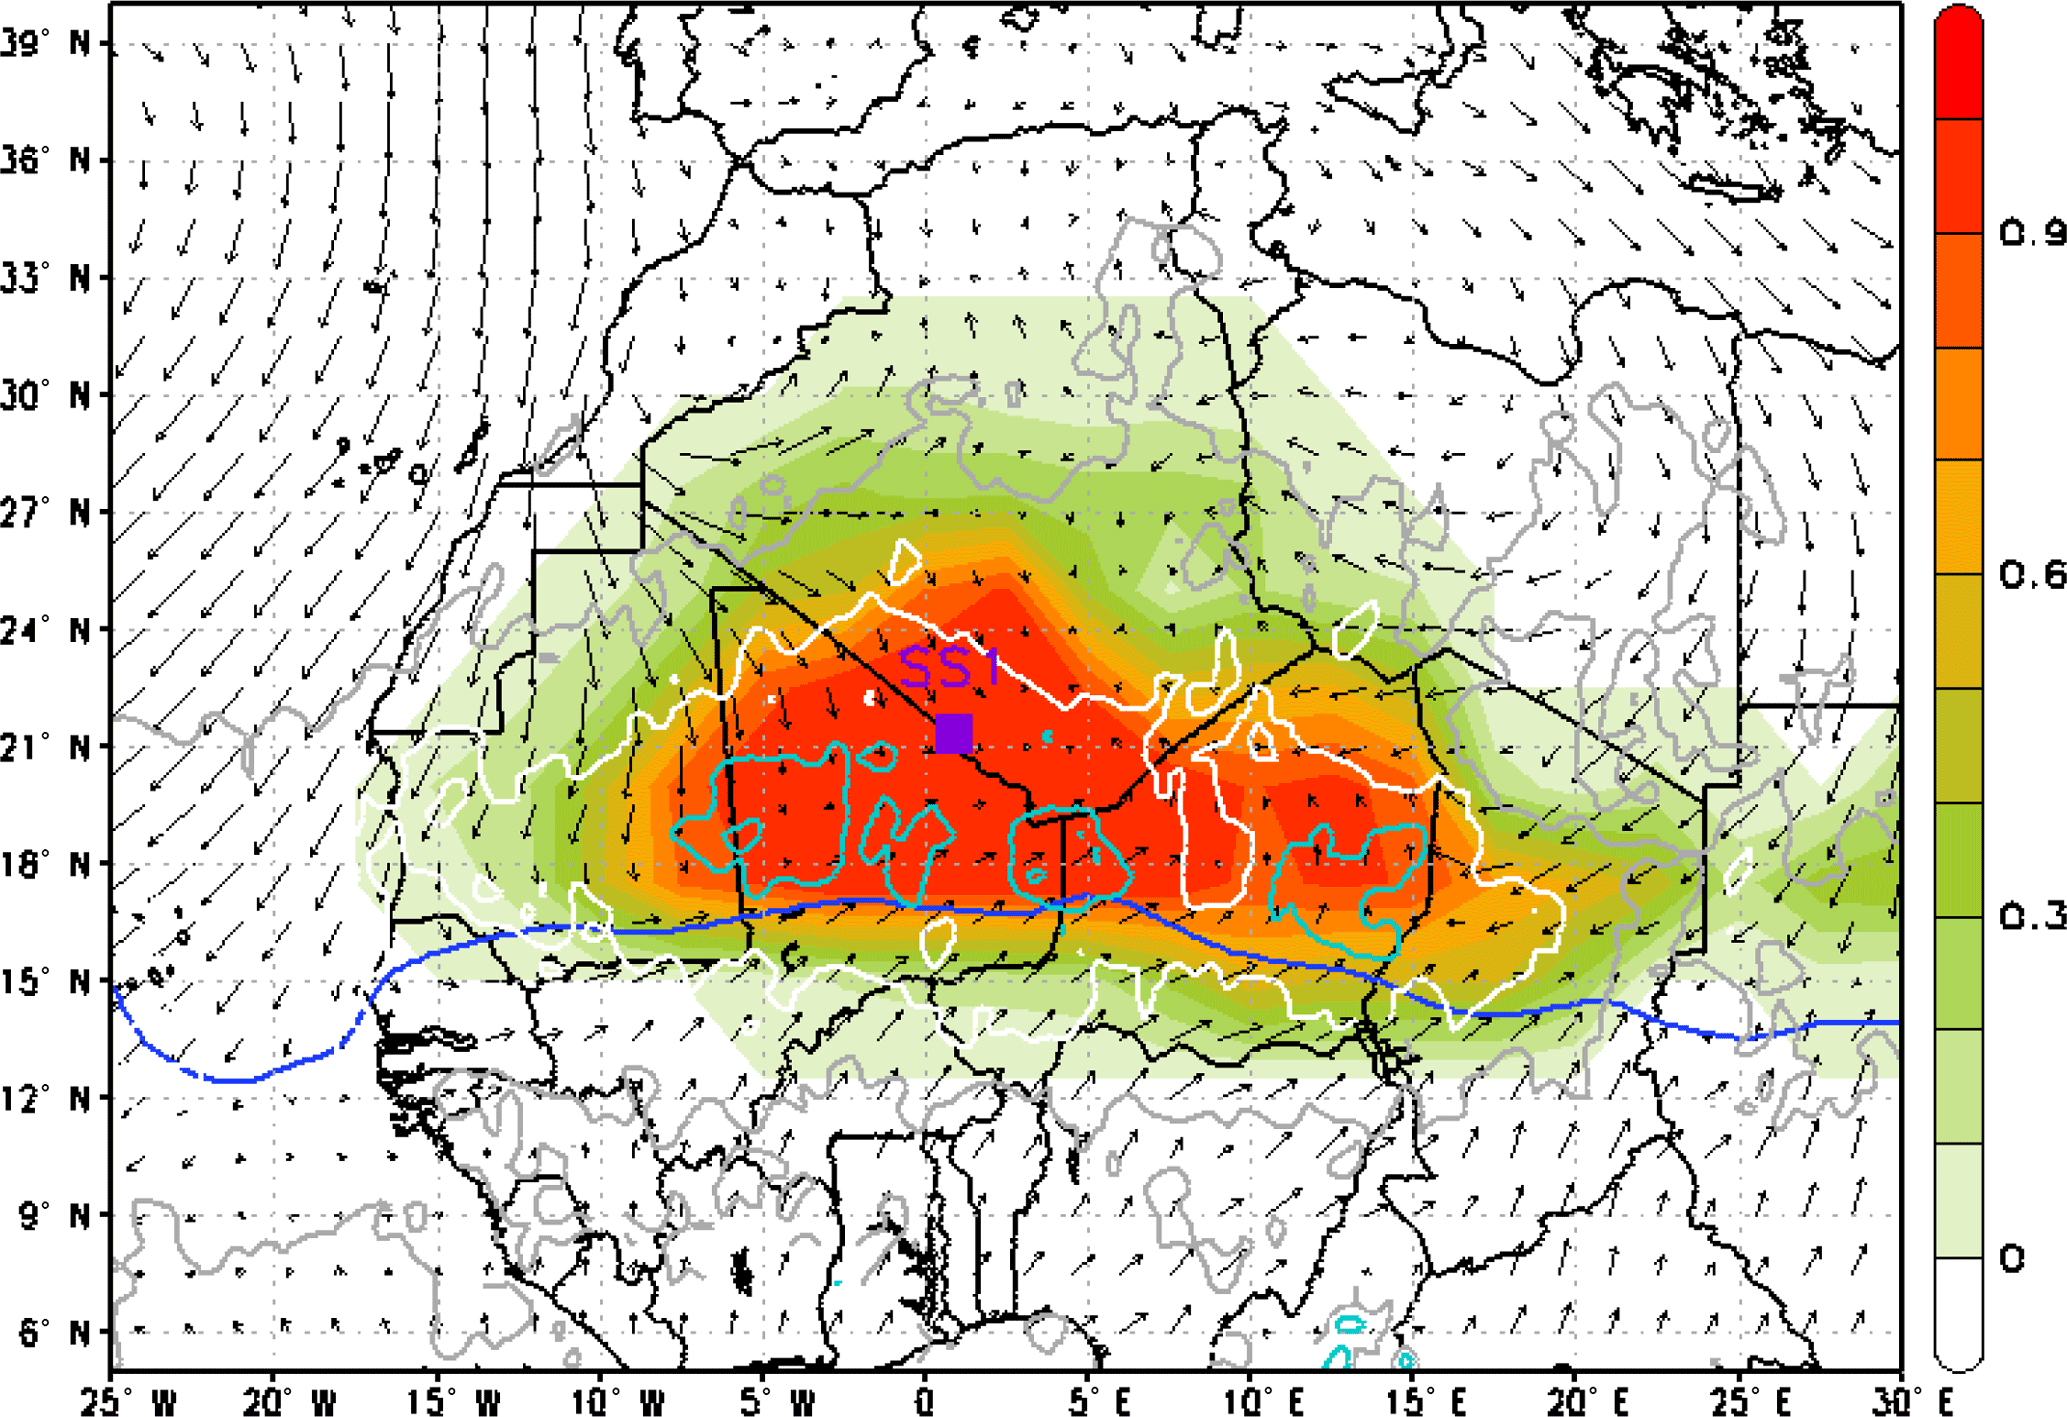
Figure 1Climatological state of the Saharan heat low region (mean of June, 1979–2013): SHL location, low-level circulation, and dust load. Shaded: the mean position of heat low region (occurrence frequency of 90 % of low-level atmospheric thickness); arrows: mean 925 hPa wind; blue line: the mean position of the intertropical discontinuity from ERA-Interim reanalysis data and aerosol optical depth (AOD) from Multi-angle Imaging Spectroradiometer (MISR) satellite data (contour intervals are 0.4, 0.6, and 0.8 for grey, white, and cyan lines). The purple rectangle denotes the location of the Fennec supersite 1 (SS1).
Previous studies have quantified direct radiative effects (DREs) of dust aerosol at the top of atmosphere (TOA) and the surface from in situ observations and satellite data (Ansell et al., 2014; Banks and Brindley, 2013; Yang et al., 2009), whilst Marsham et al. (2016), hereafter M16, extend this empirically to consider water vapour variations and implicitly clouds as well as dust. However, there remain important gaps in our understanding. First, there are substantial uncertainties in the magnitudes of radiative fluxes (and other heat budget terms) across both the various reanalyses and observations. Second, separating the radiative effects of water vapour from both associated clouds and dust aerosol is challenging from observations, given the strong co-variability of dust and total column water vapour (TCWV) anomalies in the Sahara associated with monsoon surges and resulting convective cold-pool events (“haboobs”) which transport water vapour and dust into the central Sahara (Garcia-Carreras et al., 2013; Marsham et al., 2008, 2013b). As such, there is a need to quantify more fully the DRE of dust and water vapour, both independently and together, over the Sahara. This information is necessary to resolve the processes that govern the fundamental structure and maintenance and variability of the SHL. Addressing these research gaps is hindered by the acute shortage of routine observations in the region and large discrepancies between models and reanalyses (Evan et al., 2015a; Roberts et al., 2015).
This paper seeks to address these gaps in our understanding of radiative processes within the SHL during early summer. Specifically, its aim is to quantify the separate roles of water vapour and dust aerosol in controlling the top of the atmosphere, surface, and the vertical profile of the atmospheric column radiative budget. This will be achieved through radiative transfer (RT) model simulations using uniquely detailed observations of atmospheric conditions over the SHL region during early summer, including those from the main supersite of the recent Fennec field campaign (Marsham et al., 2013b). Best estimates and associated uncertainty are established through a set of RT model experiments testing the sensitivity of radiative flux and atmospheric heating rates to water vapour and dust variability and to uncertainty in a set of controlling variables. In this way, we can inform interpretation of hypotheses on drivers of SHL variability and its wider impact on the regional climate. A description of the radiative transfer code is given in Sect. 2, followed by a list of input data used to run the RT model in Sect. 3. The different experiments used towards the optimal model configuration are presented in Sect. 4. Results of the mean state and sensitivity RT runs for water vapour and dust are given in Sect. 4. The paper is concluded by presenting the summary and conclusion of our results in Sect. 5.
The research questions are addressed through simulations from a column stand-alone RT model. Such models are commonly used for detailing the combined and unique radiative impact of dust aerosol and water vapour (Osborne et al., 2011; Osipov et al., 2015; Otto et al., 2007, 2009, 2011; Slingo et al., 2006). RT models typically comprise a radiative transfer core and a pre-processor to configure the necessary information on the radiatively active atmospheric constituents and surface characteristics. Typically, these include meteorological and gas component profiles, aerosol optical properties and profiles, and surface optical properties.
Here, we use the Suite Of Community Radiative Transfer codes based on Edwards and Slingo (SOCRATES; Edwards and Slingo, 1996; Randles et al., 2013) model configured with observed and idealised profiles of water vapour and dust aerosol, as described below. SOCRATES is a flexible RT model, operated here in two streams of stand-alone radiative transfer code, which calculates the longwave and shortwave radiative fluxes and heating rates throughout the atmosphere given the atmospheric and surface properties of that column, the solar zenith for the location, date, and time. Radiative flux calculations are made for parallel plane atmosphere with spectral resolution ranging over the shortwave and longwave from 0.2 to 10 µm divided into six bands and 3.3 to 10 000 µm divided into nine bands, respectively. Column atmospheric and surface characteristics required to run the RT model are described in Sect. 3.2 and 3.3. A detailed description of the model is given in Randles et al. (2013).
3.1 Observed top-of-atmosphere and surface radiation measurements
We use satellite retrievals of TOA radiation from two sources. The first source is EUMETSAT Geostationary Earth Radiation Budget (GERB) (Harries et al., 2005) level-2 products of averaged rectified geolocated (ARG) fluxes at approximately 17 min time resolution and 50 km spatial (at nadir) resolution, with spectral ranges from 0.32 to 4 µm in the shortwave and 4 to 100 µm in the longwave. The second source is the Clouds and the Earth's Radiant Energy System (CERES) (Wielicki, 1996) instrument, which has channels that measure total radiance (0.4–200 µm) and shortwave radiance (0.4–4.5 µm). Since there is no longwave-only channel on CERES, daytime longwave radiances are determined from the difference between the total and shortwave channel radiances. We use two CERES products: (i) the monthly mean energy balanced and filled (EBAF) product at 1∘ resolution and (ii) the CERES level-3 SSF1deg_Hour TERRA footprint instantaneous gridded data (CERES Footprint), twice daily with 1∘ resolution.
For our high-resolution, pixel-based analysis focused on a single location, Bordj Badji Mokhtar (BBM), cloud screening is notoriously challenging. For GERB data, we apply the EUMETSAT cloud mask to derive clear-sky and all-sky conditions, and for CERES data, we use both all-sky and clear-sky products. MODIS cloud parameters are used to derive CERES cloud-free fluxes. However, analysis of GERB all-sky minus clear-sky fluxes at BBM suggests unrealistically small cloud DRE (∼ 2 W m−2 in longwave flux), which indicates that the cloud mask is not robust. We therefore choose only to use GERB all-sky fluxes and limit the clear-sky-only analysis to the CERES products. For “validation” of the “optimum” model configuration (see Sect. 4), we favour comparison with GERB (all-sky) because the time period of the CERES monthly product is not exactly compatible with the RT simulations of 8–30 June, whilst the CERES footprint data have observations twice daily.
Surface measurements of shortwave and longwave upwelling and downwelling radiation are obtained from Kipp and Zonen CNR4 radiometers, situated at 2 m height, deployed at BBM during the Fennec campaign (Marsham et al., 2013b).
3.2 Atmospheric profile and surface characteristics
Input data which are required to run the RT model for the model are meteorological fields (temperature, specific humidity), cloud mixing ratio and fraction, active radiative gases vertical profile mixing ratios, and surface optical properties (skin temperature, surface pressure, broadband albedo, and emissivity). To include the effect of aerosols in RT simulations, optical properties and the vertical profile mass mixing ratio of the desired aerosol should be provided.
We specify these inputs as accurately as possible using observations from the recent Fennec field campaign, which obtained unique data from within the SHL region during June 2011 (Ryder et al., 2015). We use observations from ground-based instruments deployed at the Fennec supersite at BBM (Marsham et al., 2013b) and various aircraft flights (see Ryder et al., 2015 for an overview) complemented with fields from the European Centre for Medium-Range Weather Forecasts (ECMWF) ERA-Interim reanalysis (ERA-I) (Dee et al., 2011) and Modern-Era Retrospective analysis for Research and Application (MERRA) (Rienecker et al., 2011) reanalysis, where direct observations are inadequate.
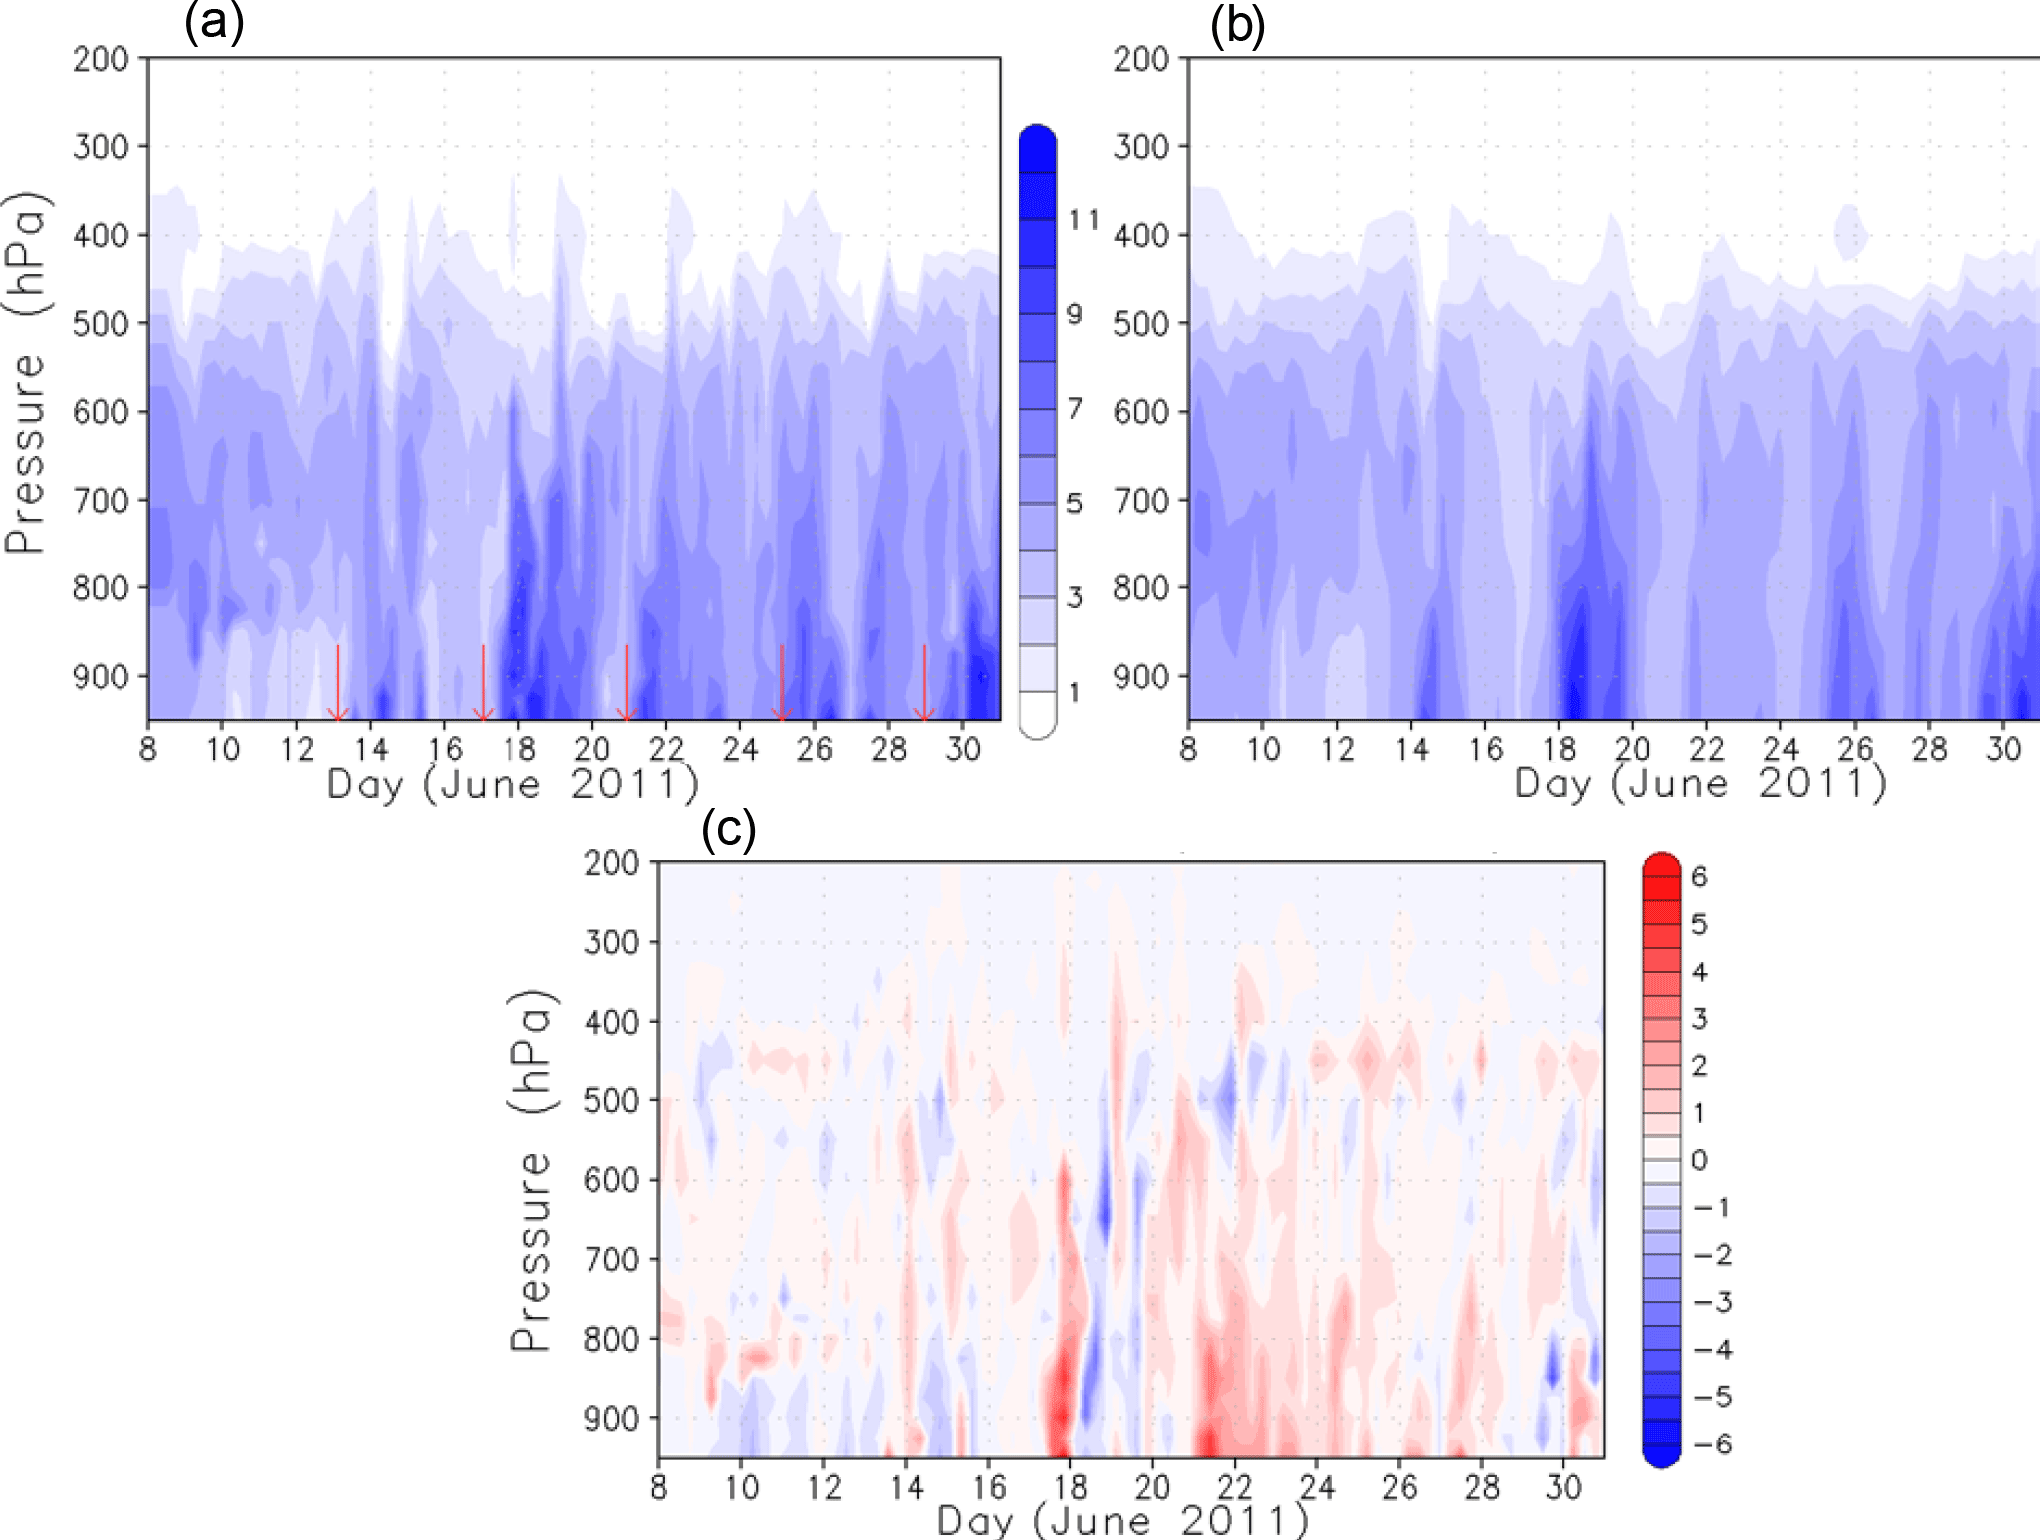
Figure 2Vertical profile specific humidity (g kg−1): (a) Fennec radiosonde measurements, (b) ERA-Interim, and (c) difference between panels (a) and (b). Red arrows in panel (a) denote times of major haboob events.
Profiles of temperature and water vapour (Fig. 2) are obtained from radiosonde measurements at BBM for 8–30 June 2011. The temporal resolution of radiosonde measurements varied from 3 to 6 h over the study period. A distinction can be made between the cooler, drier, less dusty Saharan “maritime” phase from around 8 to 12 June to a hotter, moister, dustier “heat low” phase from around 13 to 30 June (Fig. 2a), during which time both synoptic-scale monsoon surges and mesoscale convective cold-pool events transported both water vapour and dust into the heart of the SHL (see Ryder et al., 2015; Todd et al., 2013 for full details). For comparison, profiles of water vapour from ERA-I reanalysis are shown in Fig. 2b. Despite the good agreement between measurement and model outputs, ERA-I underestimates specific humidity in the lowest level by ∼ 4.9 % (MERRA by 5.5 %). The possible reasons for the remaining error between observation and reanalysis products could be due to differences in model core dynamics and assimilation procedures. Note that the error in reanalysis at BBM is relatively small because the Fennec radiosonde data were assimilated. In the subsequent absence of such observational data, we expect reanalysis errors to be greater given the known problems of reanalysis model representation of mesoscale convective processes in the region (Garcia-Carreras et al., 2013; Roberts et al., 2015; Todd et al., 2013). Such mesoscale convective “cold-pool” outflow haboobs are known to make a significant contribution to moisture advection in addition to being the dominant dust emission process (Marsham et al., 2013b; Trzeciak et al., 2017). Red arrows in Fig. 2a denote major haboob events.
Profiles of trace gases required for the radiative transfer model (CO2, O2, N2O, O3, and CH4) are taken from the standard tropical atmosphere (Anderson et al., 1986). Temperature and water vapour profiles beyond the upper maximum height of the radiosonde data (approximately 20 km) are also taken from the standard tropical atmosphere. This is unlikely to affect RT model results significantly since there is little day-to-day variability in the uppermost part of the atmosphere.
Acquiring observations of the vertical structure of clouds of sufficient quality for radiative transfer calculations is always challenging. Here, we use the ERA-I and MERRA outputs of cloud fraction, liquid, and ice water mixing ratios. Clouds are treated to have maximum overlap in a column where ice and water are mixed homogeneously. During the Fennec period, clouds were characterised by shallow cumulus or altocumulus near the top of the PBL and occasional deep convection. It is likely that the relatively coarse vertical and horizontal resolution of both reanalysis models will have considerable bias and we recognise that this is likely to underestimate the true cloud-related uncertainty. For example, M16 suggest that ERA-I underestimates cloud fraction by a factor of 2.5.
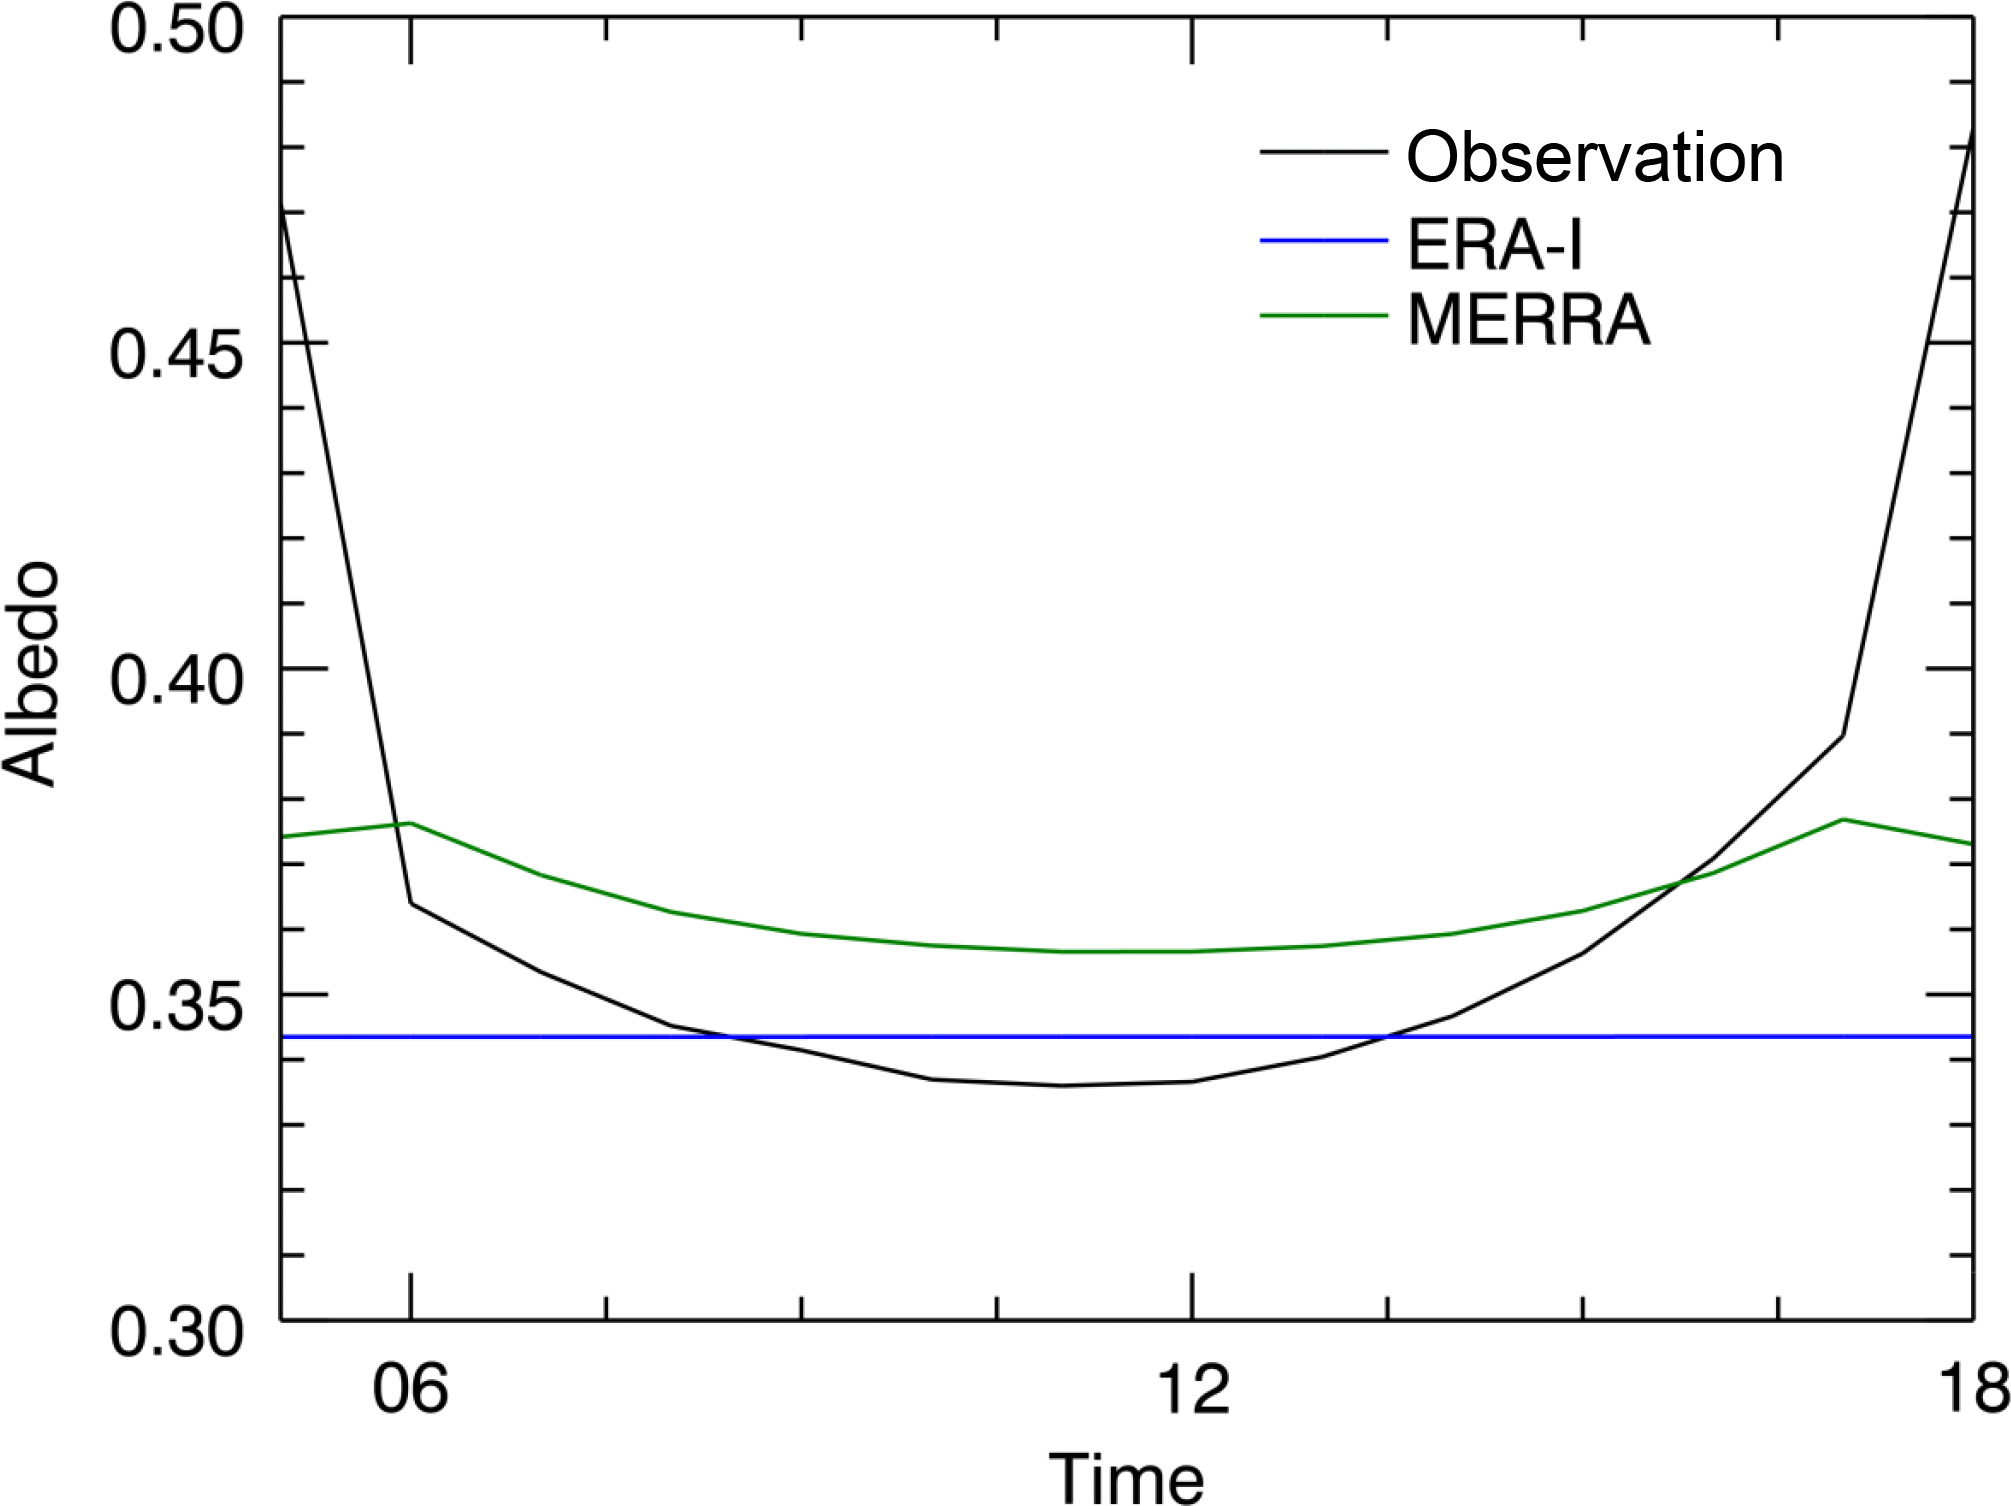
We calculate surface albedo from the surface observations of shortwave flux at BBM for the days when good measurement is available (see Fig. 3). During the days where measurements were not good, we use the diurnal average surface albedo of all other days. The mean surface albedo at BBM is 0.36 and shows a strong diurnal cycle, varying with solar zenith angle giving maximum surface shortwave reflection during the morning and evening hours, i.e. when the Sun is at high solar zenith angles. This has an impact on the diurnal cycle of dust radiative effect (Ansell et al., 2014; Banks et al., 2014; Osipov et al., 2015). Fennec does not provide measurements of skin temperature, and thus we look for the best alternative approximations from ERA-I and MERRA. For comparison, we also use the skin temperature product from CERES level-3 SSF1deg_Hour TERRA footprint data. Figure 4 shows time series of skin temperature and 2 m air temperature from observation and reanalysis.
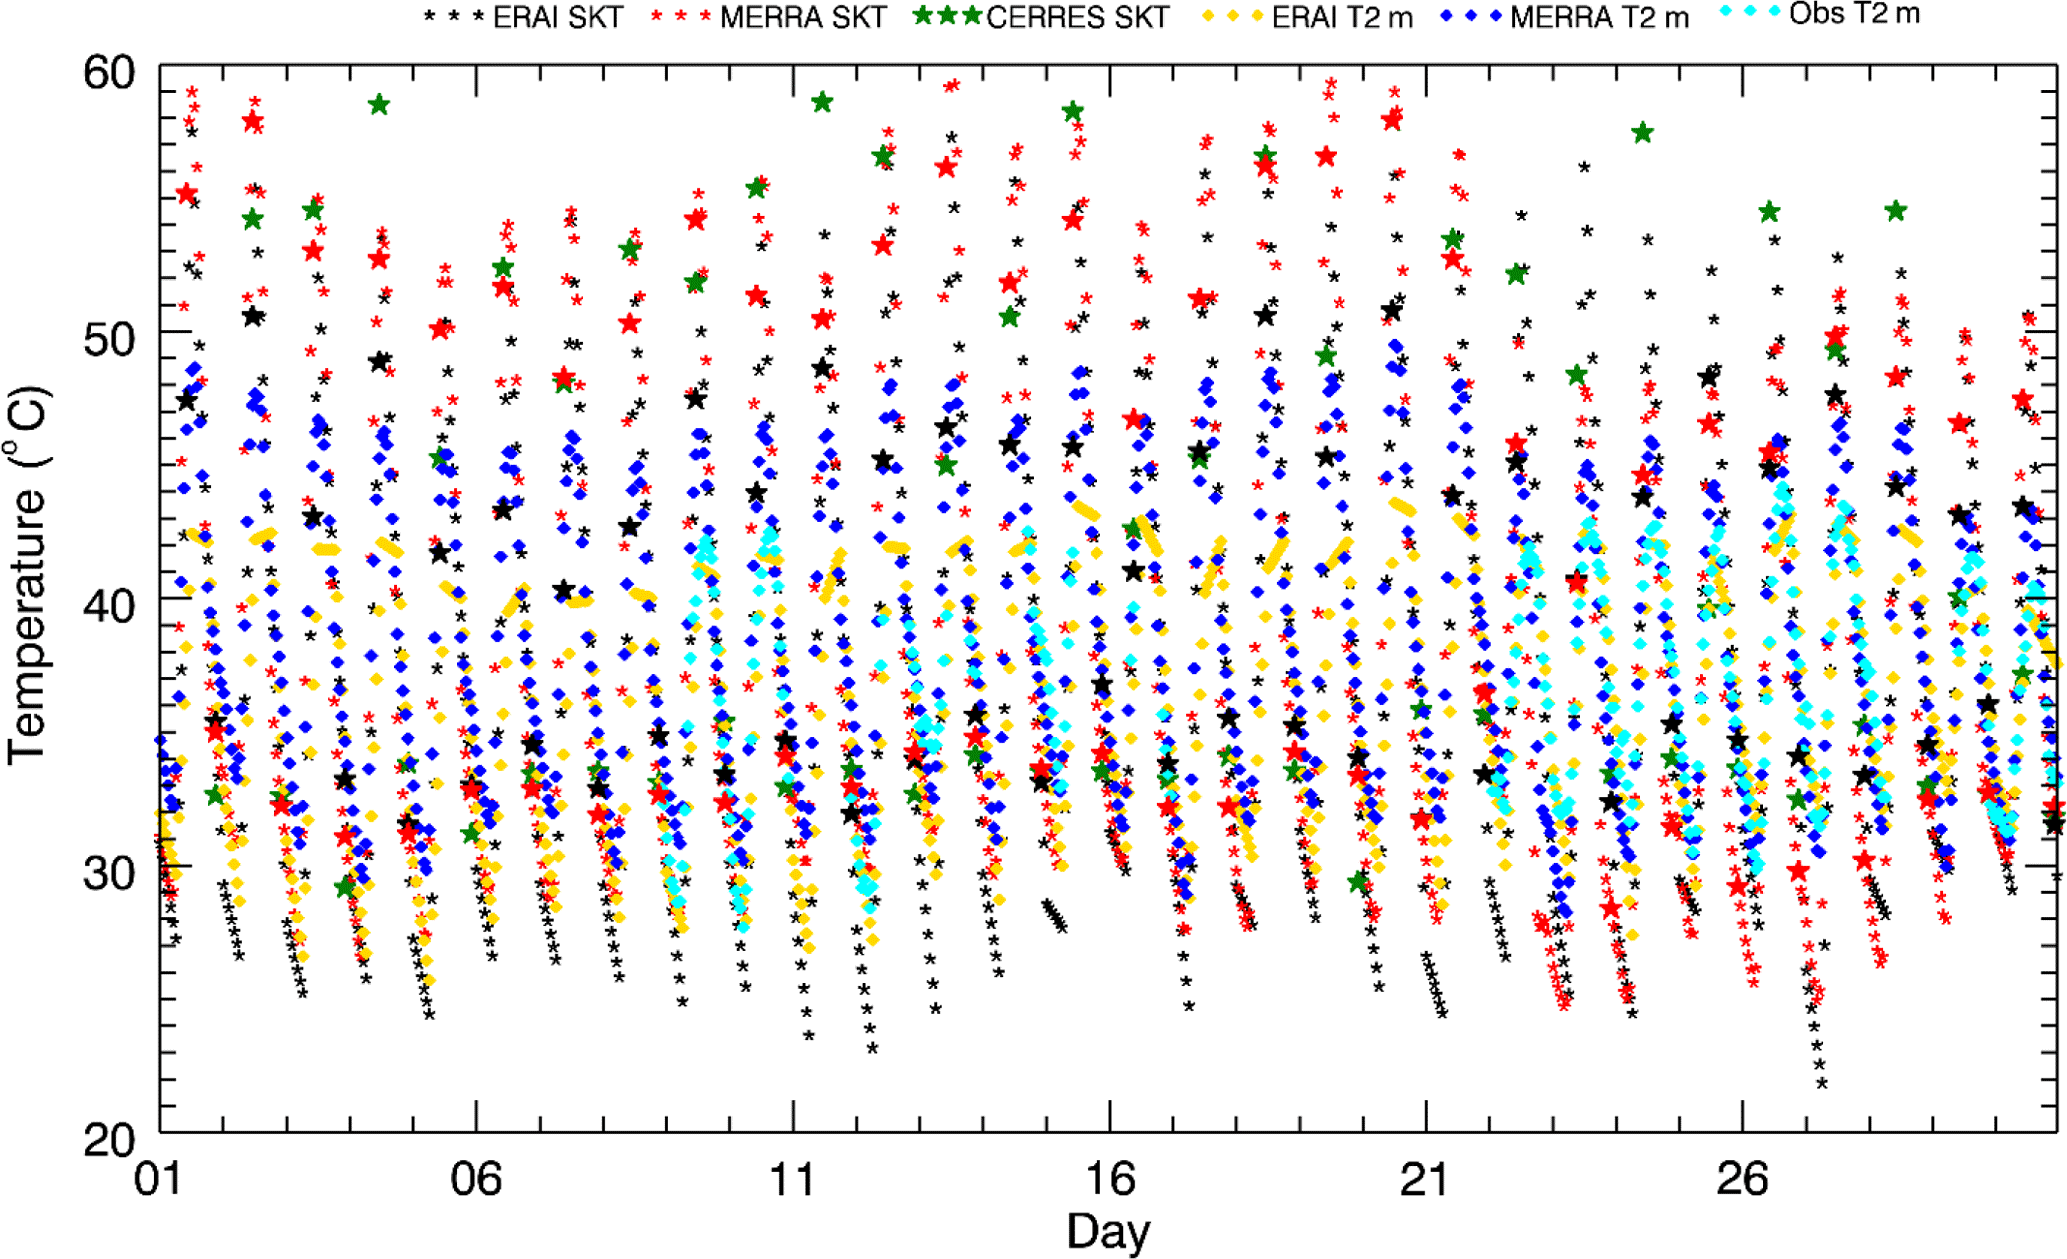
Figure 4Surface skin temperature (SKT) (stars) and 2 m air temperature (diamonds) at BBM. The bigger black and red stars denote ERA-I and MERRA skin temperature at the time steps when there are CERES observations.
3.3 Dust optical properties and extinction profile
Dust radiative effect is known to be influenced by size distribution (Otto et al., 2009; Ryder et al., 2013a, b), which remains uncertain over the Sahara. We test the RT model sensitivity to two different and highly contrasting dust size distributions (i) derived using AErosol RObotic NETwork (AERONET) sun photometer inversions from Cabo Verde, representative of transported dust (Dubovik et al., 2002), referred to as Dubovik hereafter, and (ii) measured directly from aircraft observations during the Fennec campaign (Ryder et al., 2013b) referred to as Fennec-Ryder hereafter, which include a pronounced coarse mode with effective diameter in the range between 2.3 and 19.4 µm, contrasting with the much finer size distribution of Dubovik from AERONET. In both cases, the dust size distributions and same measured refractive index (Ryder et al., 2013b) are used as inputs to Mie code in the RT pre-processor from which the optical properties of dust are calculated, specifically the single scattering albedo (ω or SSA), mass extinction coefficient (known as MEC or Kext units m2 kg−1), and asymmetry parameter (g), for the relevant spectral bands applied in the RT model. Figure 5 displays the wavelength dependence of optical properties for both Dubovik and Fennec-Ryder dust size distributions. The continuous lines are the spectrally resolved optical properties and the horizontal lines are the band-averaged data which are used in the RT code. Further information on the optical properties for the two dust distributions is provided in the Supplement (Sect. S1).
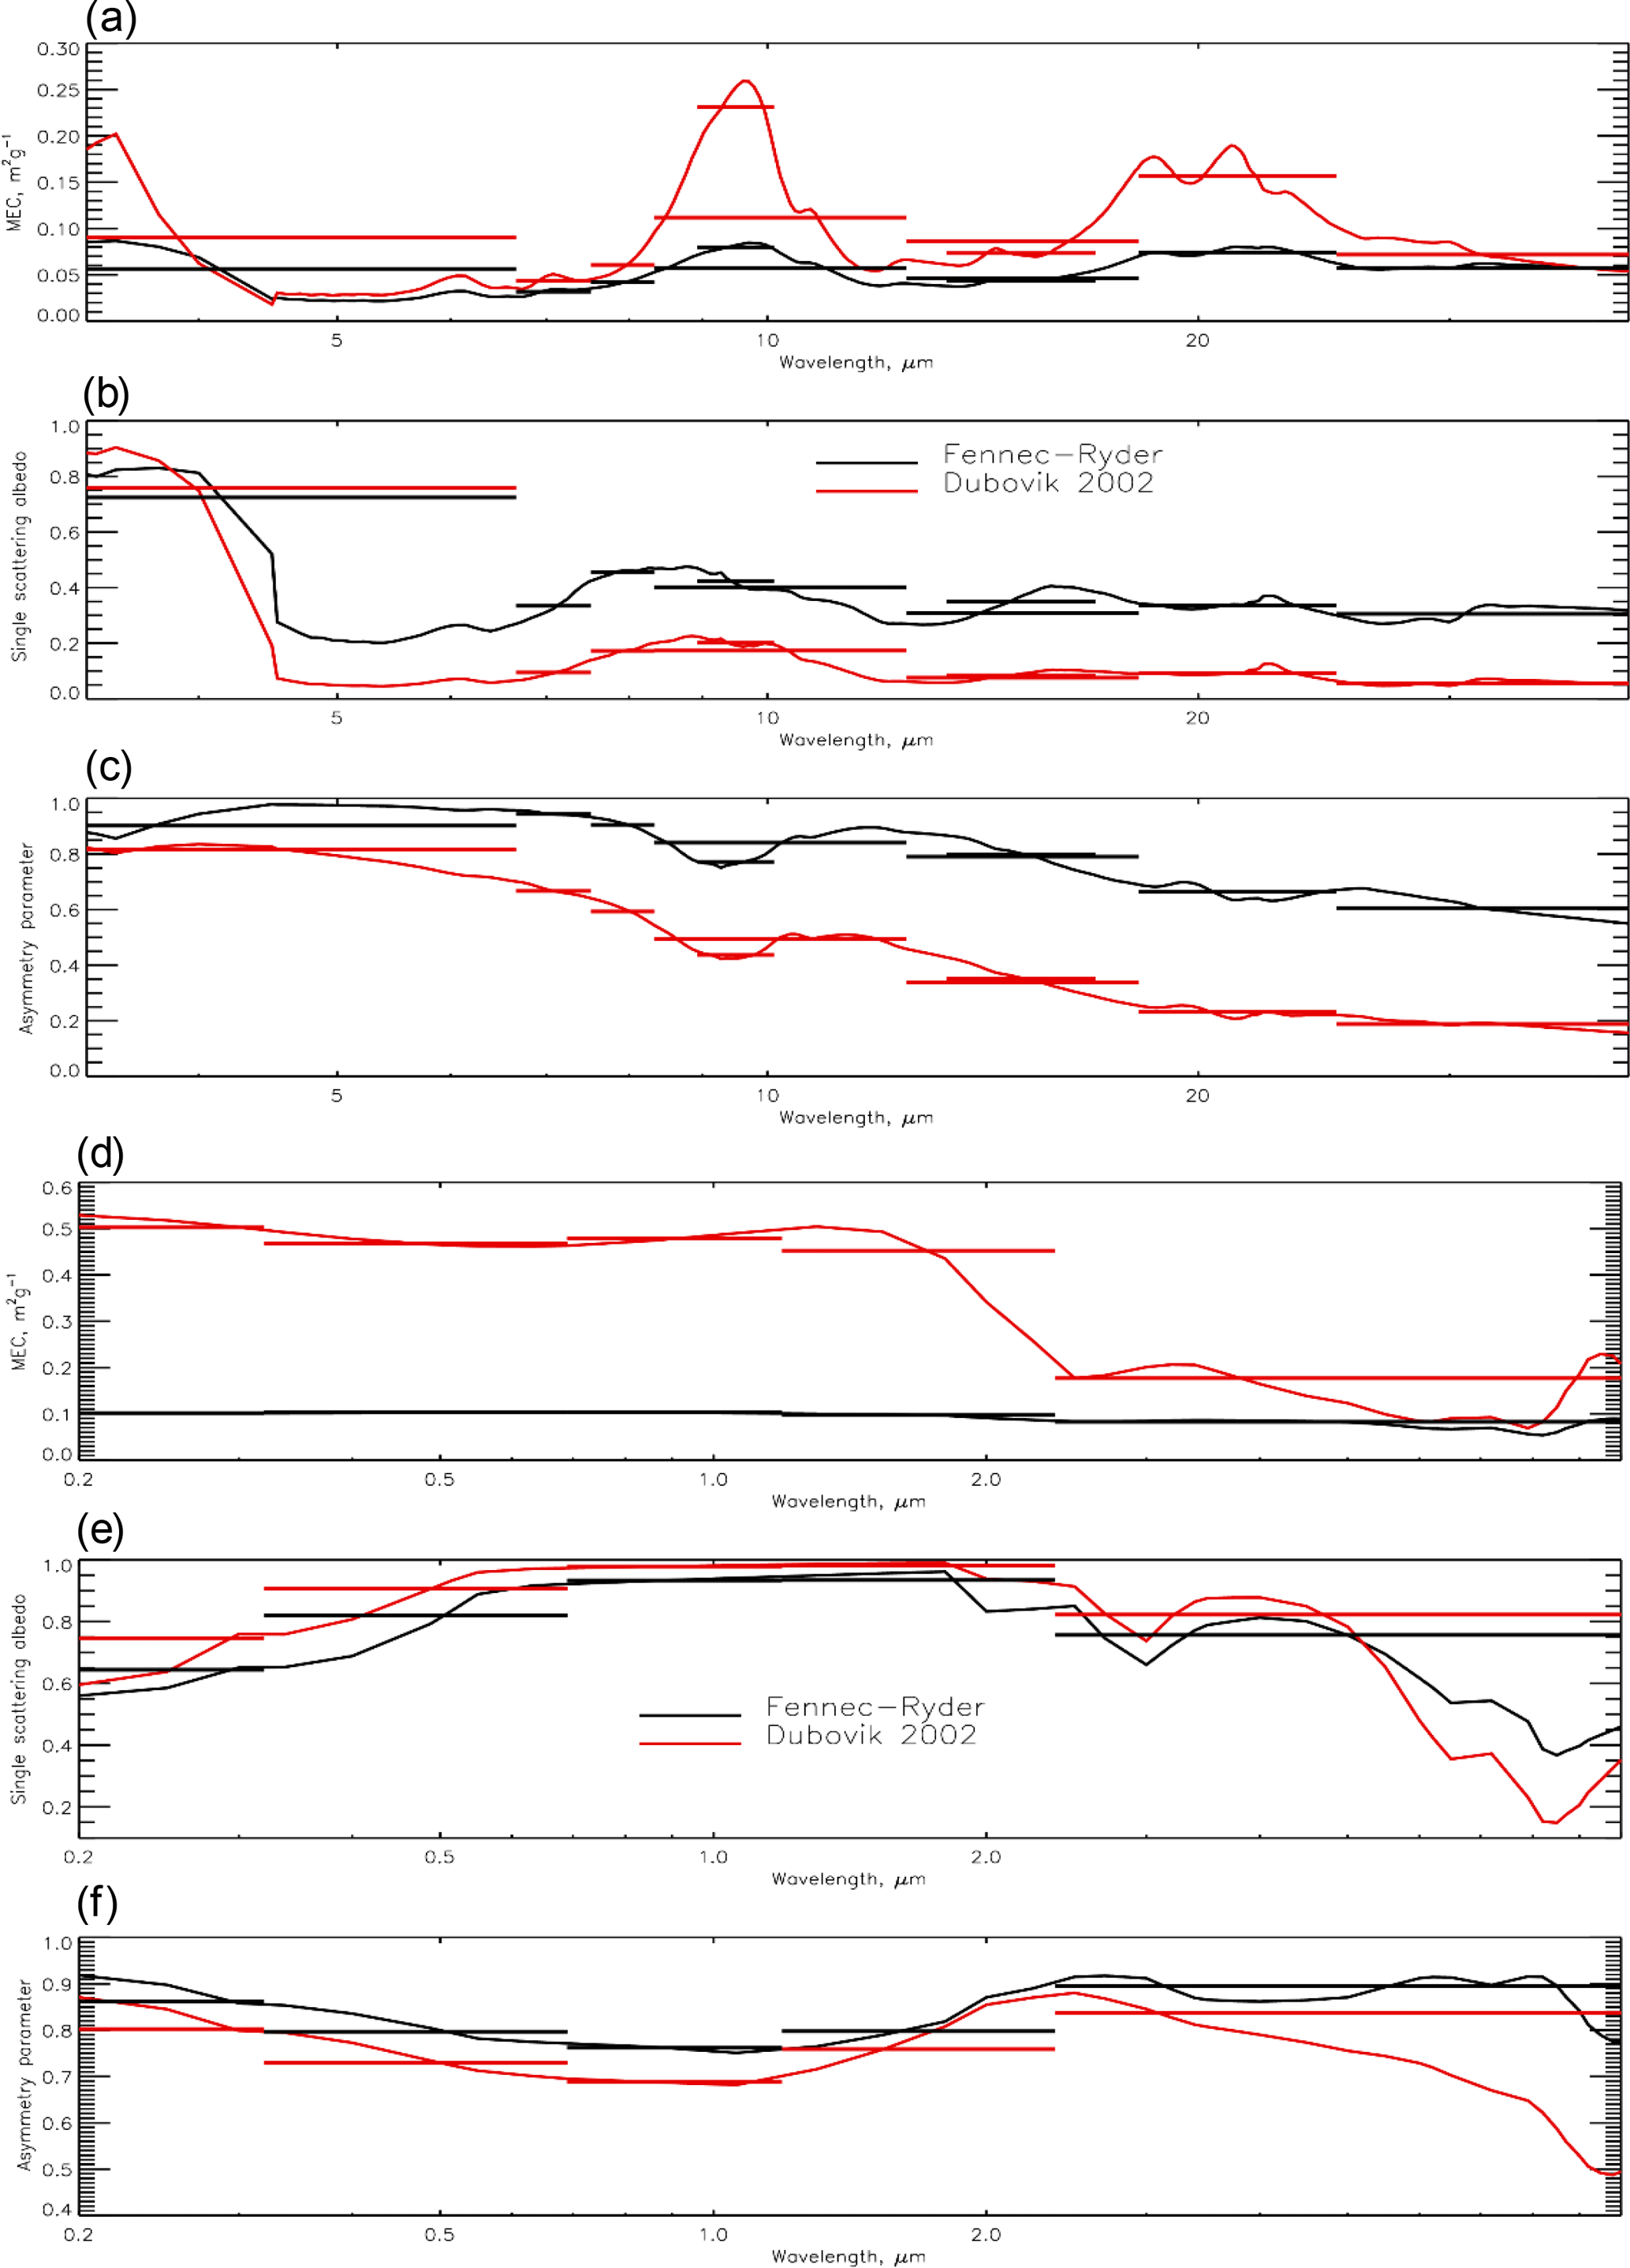
Figure 5Wavelength dependence of optical properties of dust particle for longwave (a, b, c) and shortwave (d, e, f). (a, d) Mass extinction coefficient, (b, e) single scattering albedo, and (c, f) asymmetry parameter. The continuous lines are the spectrally resolved optical properties, and the horizontal lines are the band-averaged data that are used in the RT code.
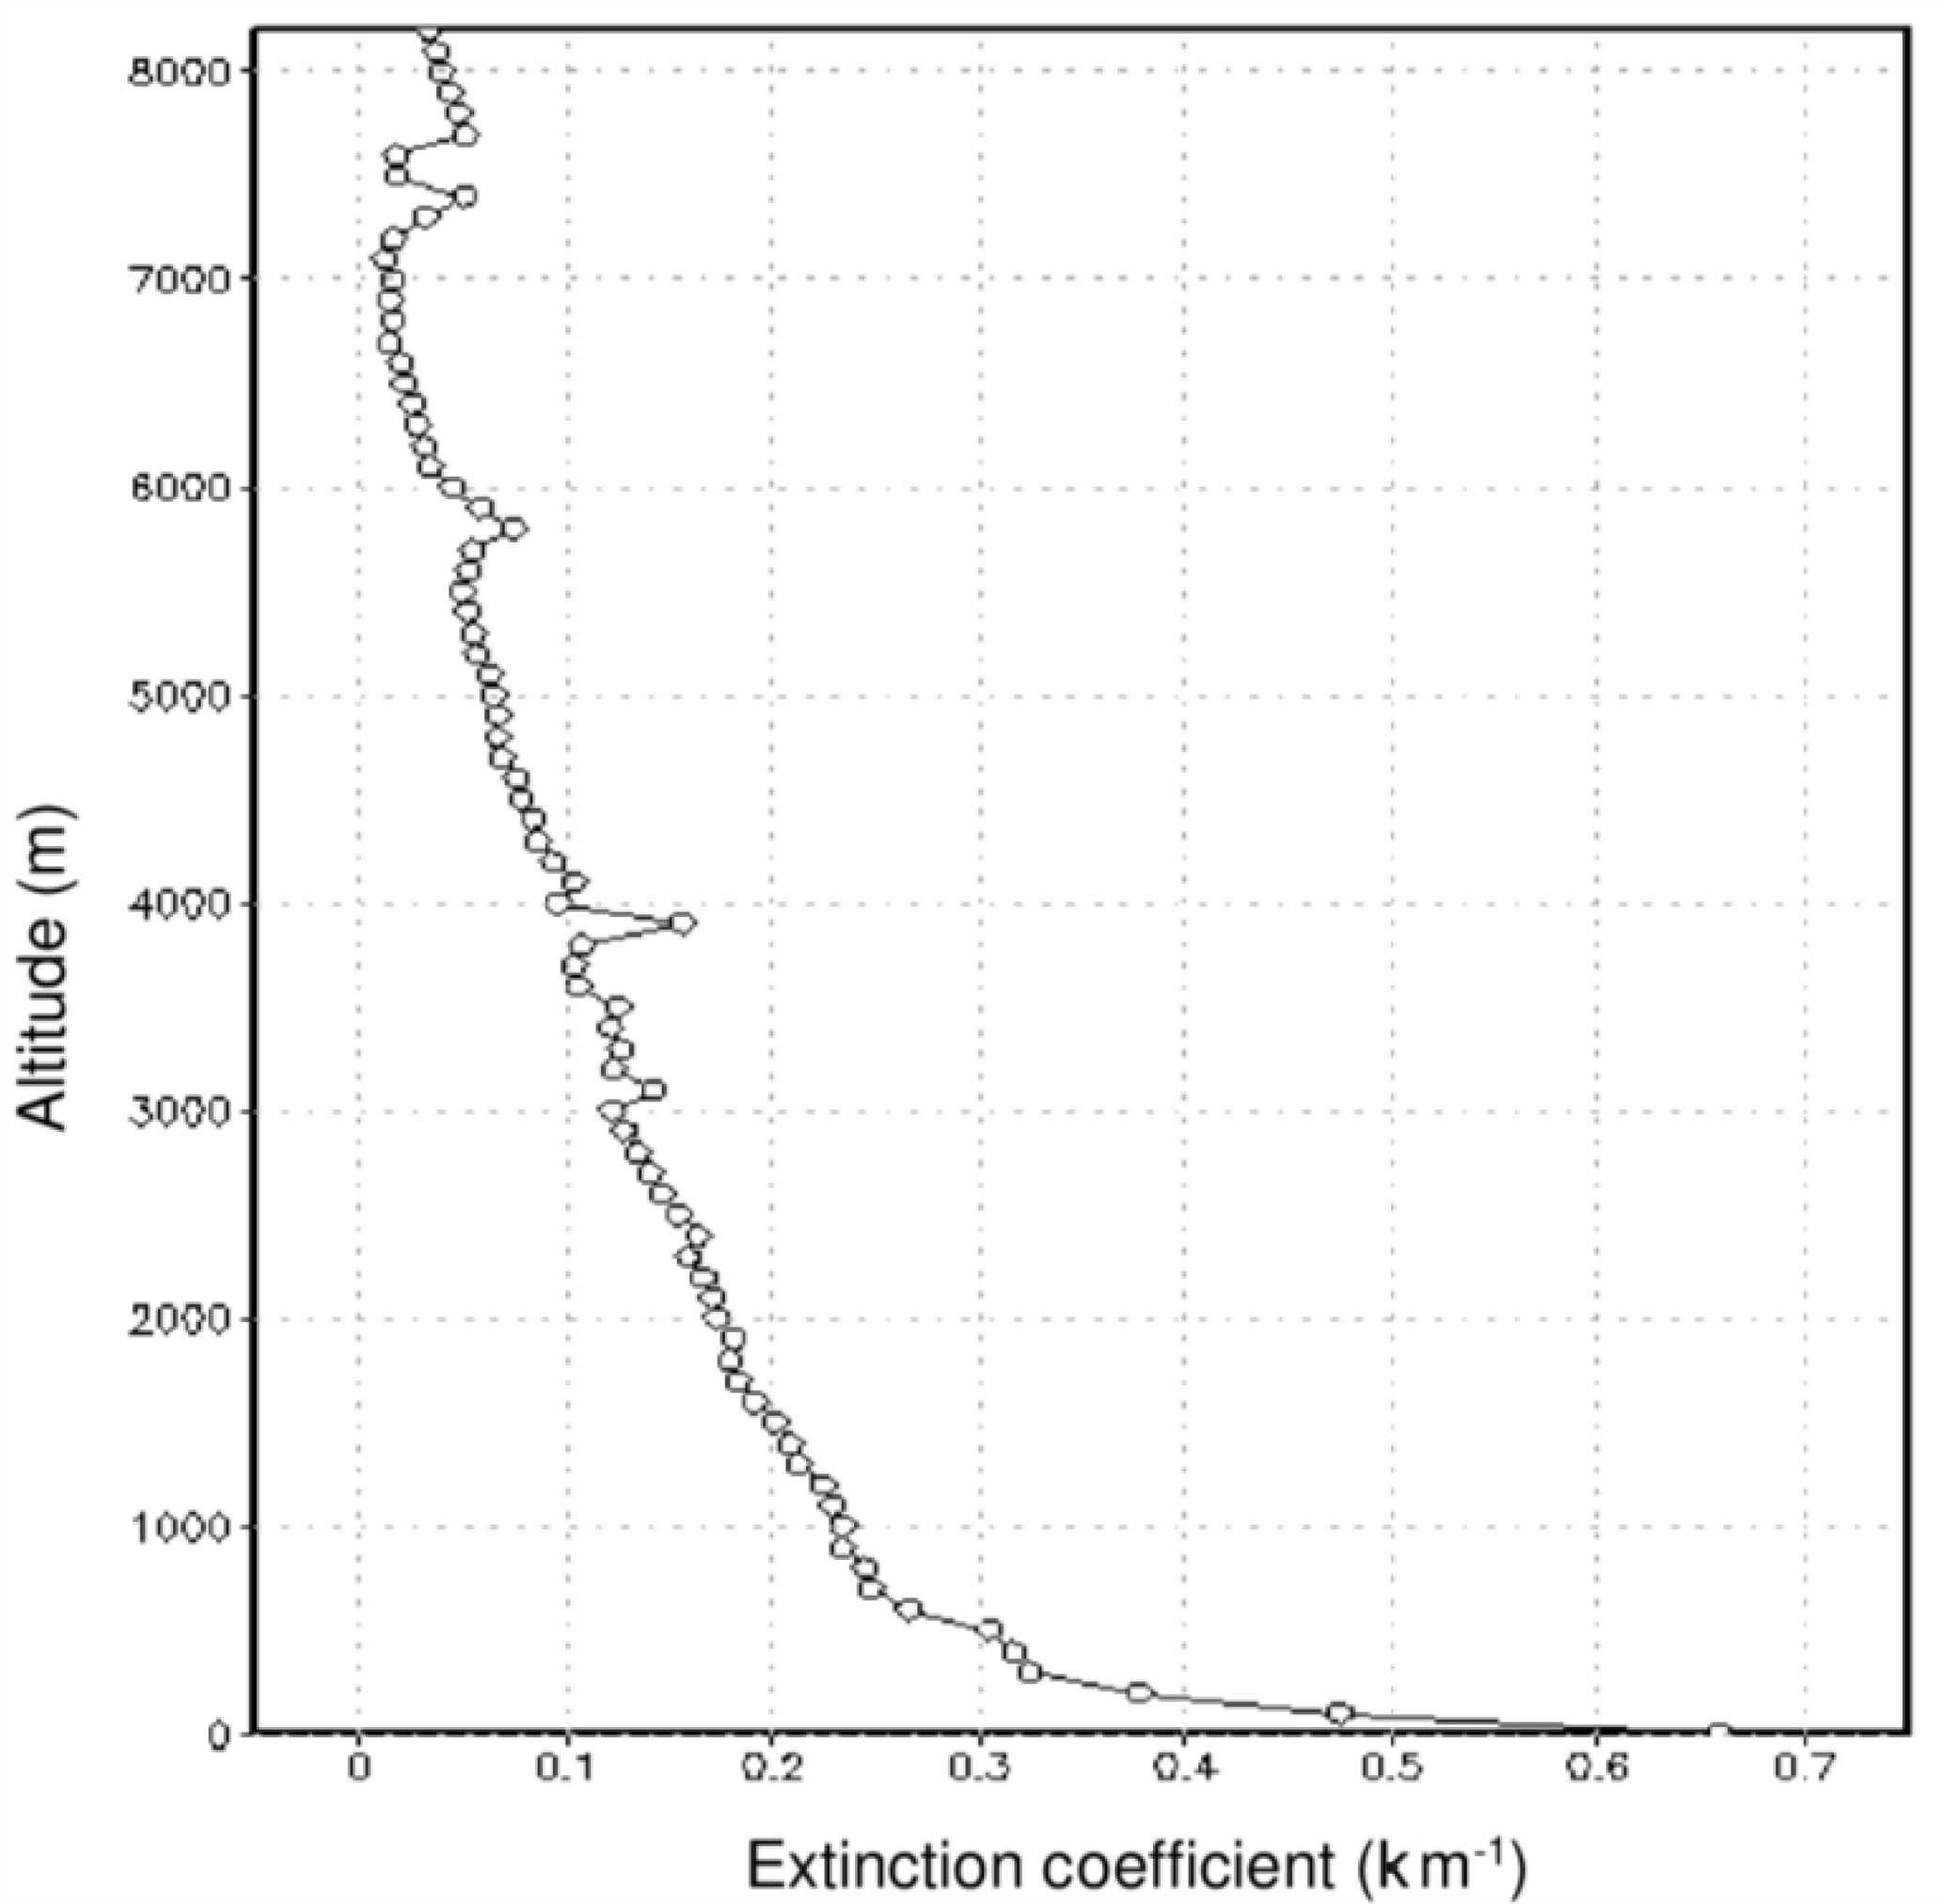
No observations of the vertical profile of dust loading at BBM are available from the Fennec instrumentation. Since the model requires the vertical distribution of mass mixing ratio of dust as an input, we use the long-term mean extinction coefficient profiles for dust aerosol derived from the Cloud-Aerosol Lidar with Orthogonal Polarization (CALIOP) (Liu et al., 2009; Winker et al., 2009) satellite instrument. Data from all individual CALIOP satellite orbits over the 2006–2014 period were quality controlled and screened to retain dust-aerosol-only observations using the method described in Todd and Cavazos-Guerra (2016), which provides sampling for robust characterisation of aerosol distribution in three dimensions (Ridley et al., 2012; Todd and Cavazos-Guerra, 2016; Winker et al., 2009). The long-term mean extinction coefficient profile at BBM (Fig. 6) shows a regular decrease of extinction through the aerosol layer which extends up to about 5 km at the top of the planetary boundary layer, which is also seen in Fennec airborne measurements from 2011 (Ryder et al., 2013a).
This extinction profile is scaled at each model time step to yield the observed column-integrated aerosol optical depth (AOD) from the BBM AERONET sun photometer. We then use the mass extinction coefficient (in m2 kg−1) to convert dust extinction coefficient (in m−1) to dust mass mixing ratio (kg ∕ kg) as required by the model (e.g. Greed et al., 2008). Mass extinction coefficient is calculated from Mie code (see Fig. 5).
AOD data used to scale the mean extinction coefficient profiles are taken from retrievals from the AERONET (Holben et al., 1998) instrument at BBM, using level-2 data which are cloud screened and quality assured. We compared AERONET AOD with estimates of AOD from the Spinning Enhanced Visible and Infrared Imager (SEVIRI) instrument on the Meteosat-9 satellite (derived from the 550 nm channel using the algorithm of Banks and Brindley, 2013) over the June 2011 study period (Fig. 7). The more frequent dust events during the latter half of the month (heat low phase) compared to the earlier heat maritime phase is apparent, with dust events frequently associated with high water vapour indicative of convective cold-pool haboob dust events (see Fig. 2a). The estimates of mean AOD agree to within 20 % and there is a strong correlation between the two estimates of 0.7, despite some dust events apparent in SEVIRI but not AERONET, e.g. 13 and 29 June. This is mainly due to AERONET masking dust as clouds particularly in cases when dust and clouds coexist.
Nighttime dust emission is common during summer in the SHL region, although we expect the dust shortwave daytime radiative effect to be dominant (Banks et al., 2014). Estimation of AOD at night is problematic for most passive instruments and we use the following method: estimate AOD from observations of scattering from the nephelometer instrument deployed near the surface at BBM (Rocha-Lima et al., 2018), based on the regression of scattering to column-integrated AOD during coincident daytime observations. The nephelometer-based estimates of AOD will account for nighttime emission of dust due to haboobs (Marsham et al., 2013b) but since haboobs tend to occupy a shallower layer than the better-mixed daytime dust, this will tend to overestimate AODs estimated at night. However, this will not have a significant effect on the overall result, since at night there is only longwave forcing which is small compared to shortwave forcing.
3.4 RT model experiments
We undertake two types of RT experiments in this study:
- i.
The first type is model “configuration mode”, through which we test the sensitivity of simulated radiative fluxes to uncertainty in as many of the input variables as possible (see Sect. S2 in the Supplement). The description and results of all sensitivity experiments to the choice of different input data are provided in the Supplement (Sect. S3 and Table S1). Here, we present the results of the sensitivity experiments to dust size distribution since it is an important part of the paper. Sensitivity to the two contrasting dust size distributions is pronounced. As expected, results using Fennec-Ryder dust show much stronger absorption in the shortwave is compared with the Dubovik dust distribution, and the resulting TOA net shortwave flux is higher by 25 W m−2 in the former. These shortwave fluxes using the Fennec-Ryder distribution are not consistent with the GERB/CERES satellite observations (nor with previous estimates of shortwave DRE derived from satellites, e.g. Yang et al., 2009; Ansell et al., 2014) and we use dust optical properties generated using Dubovik size distribution in the optimum configuration. Recent work suggests that the dust optical properties at BBM in June 2011 were significantly less absorbing than both those measured by the aircraft further west during Fennec and the Dubovik representation (less absorbing, smaller sized) with SSA values of 0.99 (Rocha-Lima et al., 2018). Therefore, optical properties generated using Dubovik size distribution and measured refractive index represent intermediate values in terms of shortwave (SW) absorption.
Given that we do not have accurate data for all the input required to run the RT model, it is not unexpected to get some uncertainty in our results. However, we have chosen the inputs in such a way that the calculated fluxes are as close as possible to observation. This will result in an acceptably configured model for the experimental analysis presented next.
- ii.
The second type of experiment is model “experiment mode”, through which we address the research questions, specifically to quantify the combined and separate DREs of water vapour and dust. To this end, we undertook a number of experiments summarised in Table 1, with results described in Sect. 4. For all the experiments, RT calculations are made for each day using the atmospheric profiles at hourly time steps over the diurnal cycle, and the mean flux and heating rates are derived by averaging outputs at each time step. For this purpose, all input data are linearly interpolated to a 1 h temporal resolution.
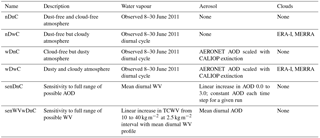
For experiments with (“w”) and without (“n”) dust (“D”), we simulate the 8–30 June 2011 period. For sensitivity (“sen”) experiments, we simulate linearly increased levels of dust AOD and water vapour. We use runs both with clouds (“C”) and with no clouds (nC). For the dust sensitivity experiment (“senDnC”), AOD is increased linearly over the range from 0 (dust-free) to 3 (extremely dusty), while keeping the mean value of water vapour constant. For the water vapour sensitivity experiment (“senWVwDnC”), the mean diurnal profile of water vapour is used but is scaled so that the column-integrated water vapour (CIWV) increases from 10 to 40 kg m−2 and the mean AOD is used in each case. The DRE for dust is derived by (i) subtracting TOA and surface fluxes of experiment wDnC from nDnC and (ii) linear regression of the flux dependence on the range of dust AOD from the dust sensitivity experiments (senDnC), in which a single diurnal cycle is simulated. The impact of water vapour is determined by (i) composites of dry versus humid days from the nDnC experiment and (ii) linear regression of the flux dependence on the range of water vapour from water vapour sensitivity experiments (senWVwDnC). The results of DRE of dust and water vapour are presented in Sect. 4.2.
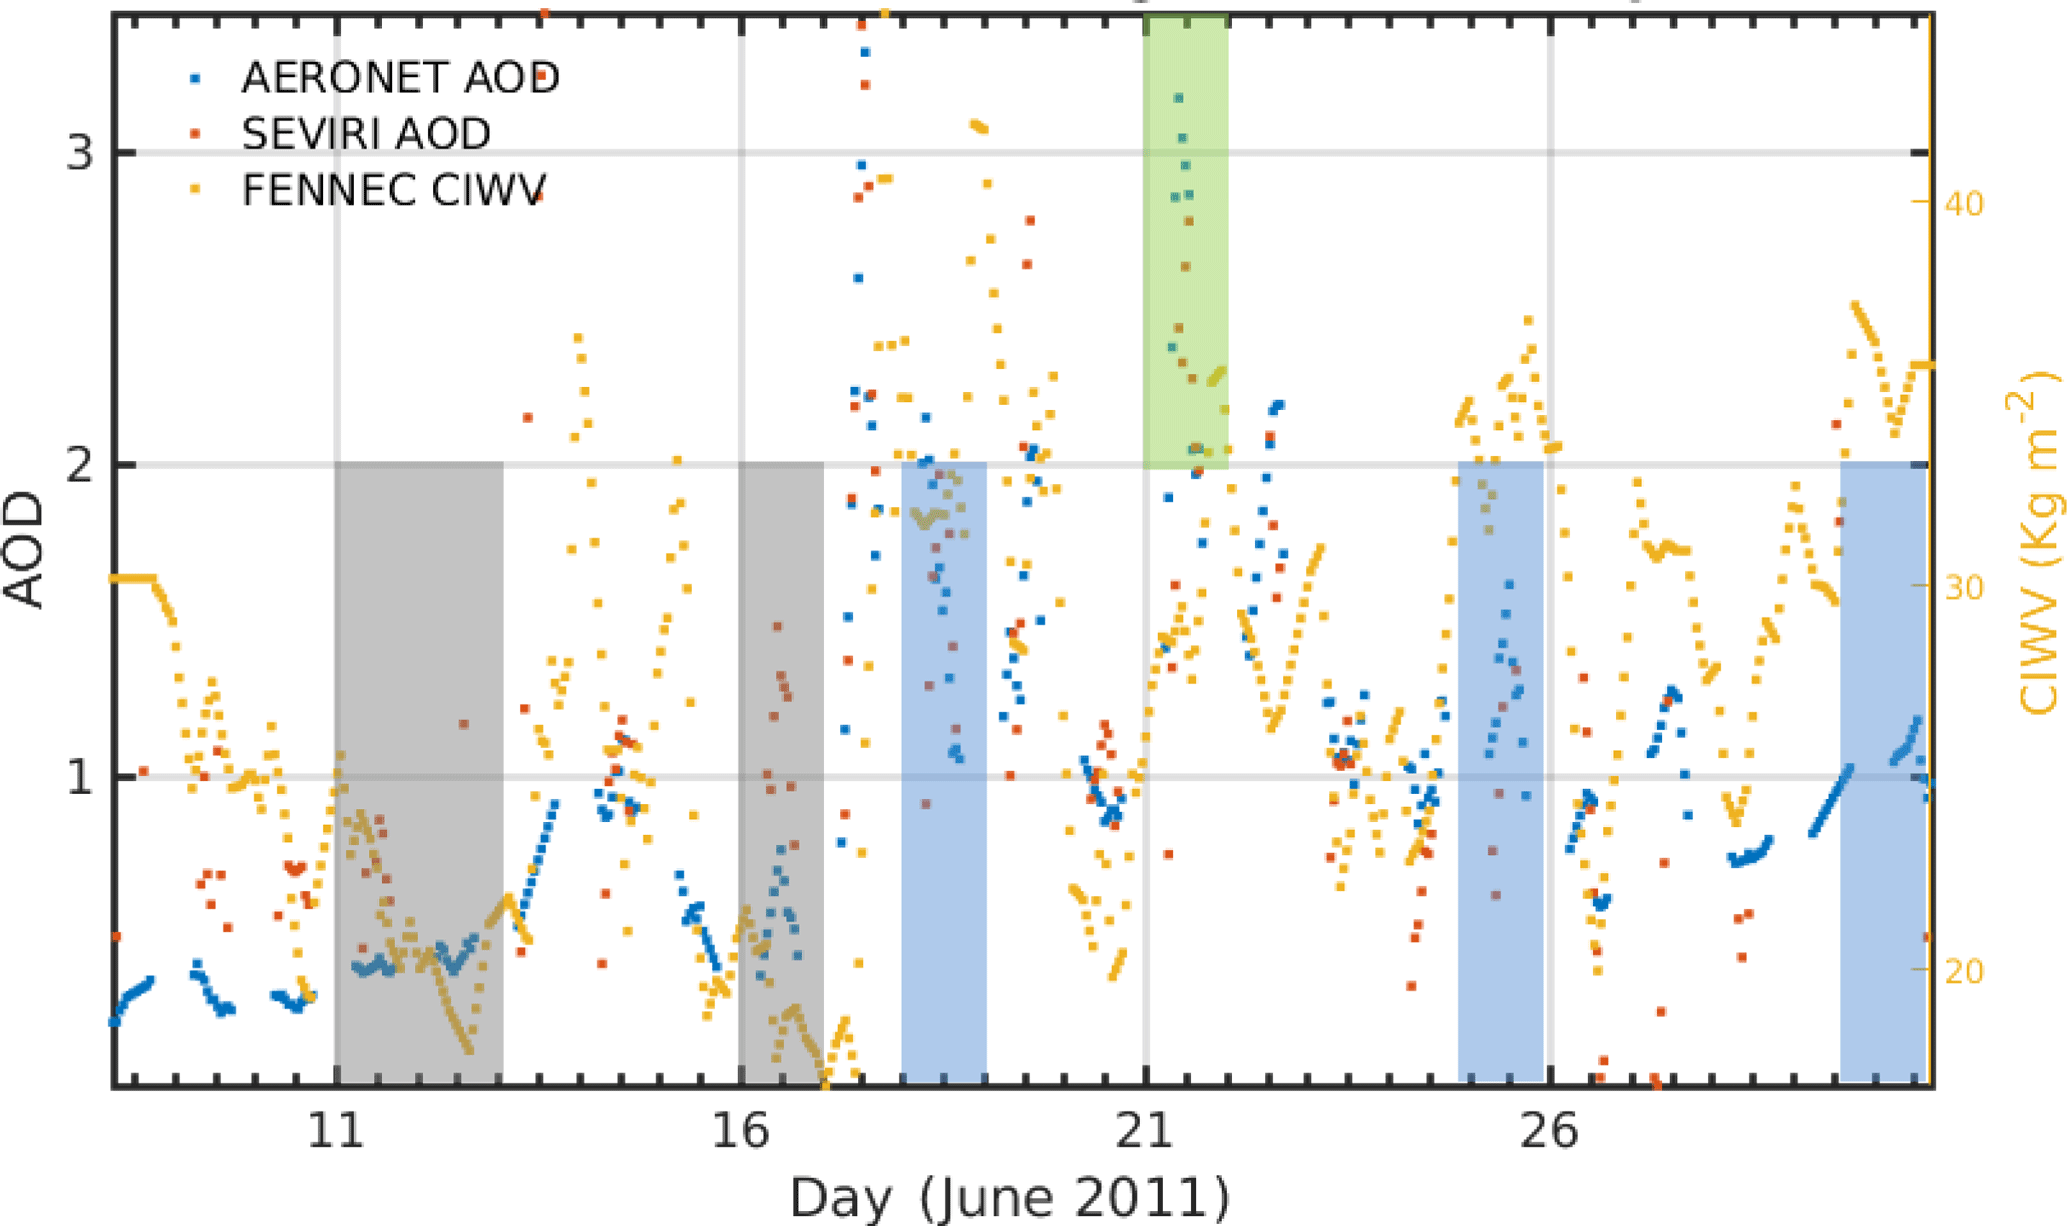
Figure 7AOD from AERONET and SEVIRI, and column-integrated water vapour from Fennec observations. Grey shades show the driest days (11, 12, and 16), blue shades show the most humid days (18, 25, and 30), and green shades show a major haboob event that occurred on the 21 June 2011 which resulted in large dust emission.
Table 1Description of the RT “experiment mode”. Names of different experiments acronyms are defined as “n” for without, “w” for with, “D” for dust, “C” for clouds, “WV” for water vapour, and “sen” for sensitivity.
4.1 RT model validation
Prior to testing the main research questions related to the relative roles of dust and water vapour in radiative heating, the RT model was configured based on the “configuration mode” sensitivity analyses (described in Sect. S2 in the Supplement) and comparison with observed TOA fluxes from the CERES-EBAF monthly mean product (clear sky in the case of all sensitivity analyses except the cloud sensitivity, which we compare to CERES-EBAF all sky). The results of sensitivity experiments for the various input parameters are presented in the Supplement of this paper (Sect. S3) and the list of selected input parameters for further experiments is shown in Table S1 (column 4).
The RT model with the above choices of input data is considered to be the “optimum” configuration, and we validate TOA and surface fluxes with respect to satellite and surface observations, respectively (Tables 2 and 3) for the most “realistic” experiment (wDwC). The sign convention used here and in the remainder of the paper is that downward flux is considered as positive while upward radiation is negative.
Table 2Mean 8–30 June 2011 TOA radiative flux at BBM (definitions of acronyms of model experiments are given in Table 1). Values are in W m−2. The sign convention is that downward flux is considered positive while upward flux is negative. In the sixth column, italic (bold) fonts indicate model results overestimated (underestimated) compared with observation.
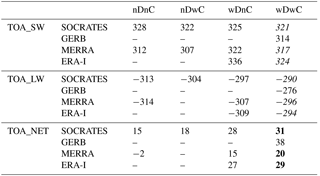
Table 3Same as Table 2 but for surface radiative flux and observations from the Fennec instrument.
The simulated TOA net shortwave flux is 321 W m−2, compared with 314 W m−2 in GERB. It is −290 W m−2 for net longwave, with −276 W m−2 in GERB, giving 31 W m−2 for net radiation, compared with 38 W m−2 in GERB; i.e. there is more shortwave heating in the model, with more longwave cooling, giving less net TOA heating. These RT model shortwave/longwave/net (SW/LW/N) biases of W m−2, although larger than many of the sensitivity ranges for the input data uncertainties (Table 1), are within the estimated error of the GERB measurements (∼ 15 W m−2; Ansell et al., 2014). It is difficult to identify the most important sources of this bias although errors in the reanalysis skin temperature and ERA-I cloud representation included in the wDwC experiment are likely candidates. The DRE of clouds provides a useful comparison and could be considered to be an estimate of the upper limit of cloud-related biases. Cloud DRE (Table 2) is estimated from the difference in fluxes at TOA between wDnC and wDwC to be W m−2 and from CERES-EBAF to be W m−2. These results of cloud DRE indicate that the optimum configuration flux biases are within the uncertainties of both observations and cloud effects. Despite the fact we used a set of input data resulting in simulation of radiative flux closest to observation and thus reduced resulting error, it is necessary to note there still exist uncertainties raising the error in the flux calculations. For example, uncertainty in dust size distribution could result in 25 W m−2 bias, and a small fractional difference in surface albedo could bring an error of 16 W m−2 in TOA shortwave flux (Table S1).
At the surface, there is a relatively wider disparity between simulated and observed fluxes (Table 3). The net shortwave simulated flux, 187 W m−2, is 7 W m−2 more than measured surface shortwave flux. Net longwave flux is −103 W m−2 compared with that of measurement (−78 W m−2), the net effect being more cooling at the surface in the model than measurement by 25 W m−2. We can again give a comparison of cloud-related biases between our result and the CERES-EBAF product. Cloud SW/LW/N DRE at the surface is estimated as W m−2 from the wDwC–wDnC experiments and W m−2 from CERES-EBAF, such that the shortwave bias at least could be explained by clouds but not all the longwave or net radiation bias. The remaining error could be attributable to measurement-related errors and uncertainties to other variables such as surface emissivity, skin temperature, and surface albedo. For instance, in our sensitivity experiments, we found bias in net surface longwave flux by 6 W m−2 (Table S1) due to a difference of mean skin temperature of 1 K between ERA-I and MERRA data. Further, we found uncertainty in emissivity by 0.05 resulting in 5 W m−2 changes in surface longwave flux. Note also that the difference in time-averaging periods between the CERES-EBAF data covering all of June 2011 and the RT experiments wDwC–wDnC covering 8–30 June could possibly contribute to part of the differences in the above figures.
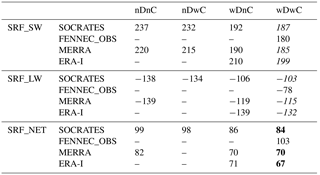
RT model bias in the longwave is larger than that in the shortwave at both TOA and the surface. The mean diurnal cycle of flux bias (Fig. 8) shows that modelled outgoing longwave flux is overestimated at nighttime. Different factors could be attributed to this difference. Surface skin temperature used in this work is interpolated to 1 h (Fig. 4), which could lead to errors in the longwave flux. Satellite observations (see Marsham et al., 2013b) reveal both shallow cumulus clouds at the top of the PBL during late afternoon and occasional moist convection preferentially at night, which may be missed in models given the poor representation of moist convection. This could also contribute to the difference between observed and calculated longwave flux associated with under-representation of clouds in the model.
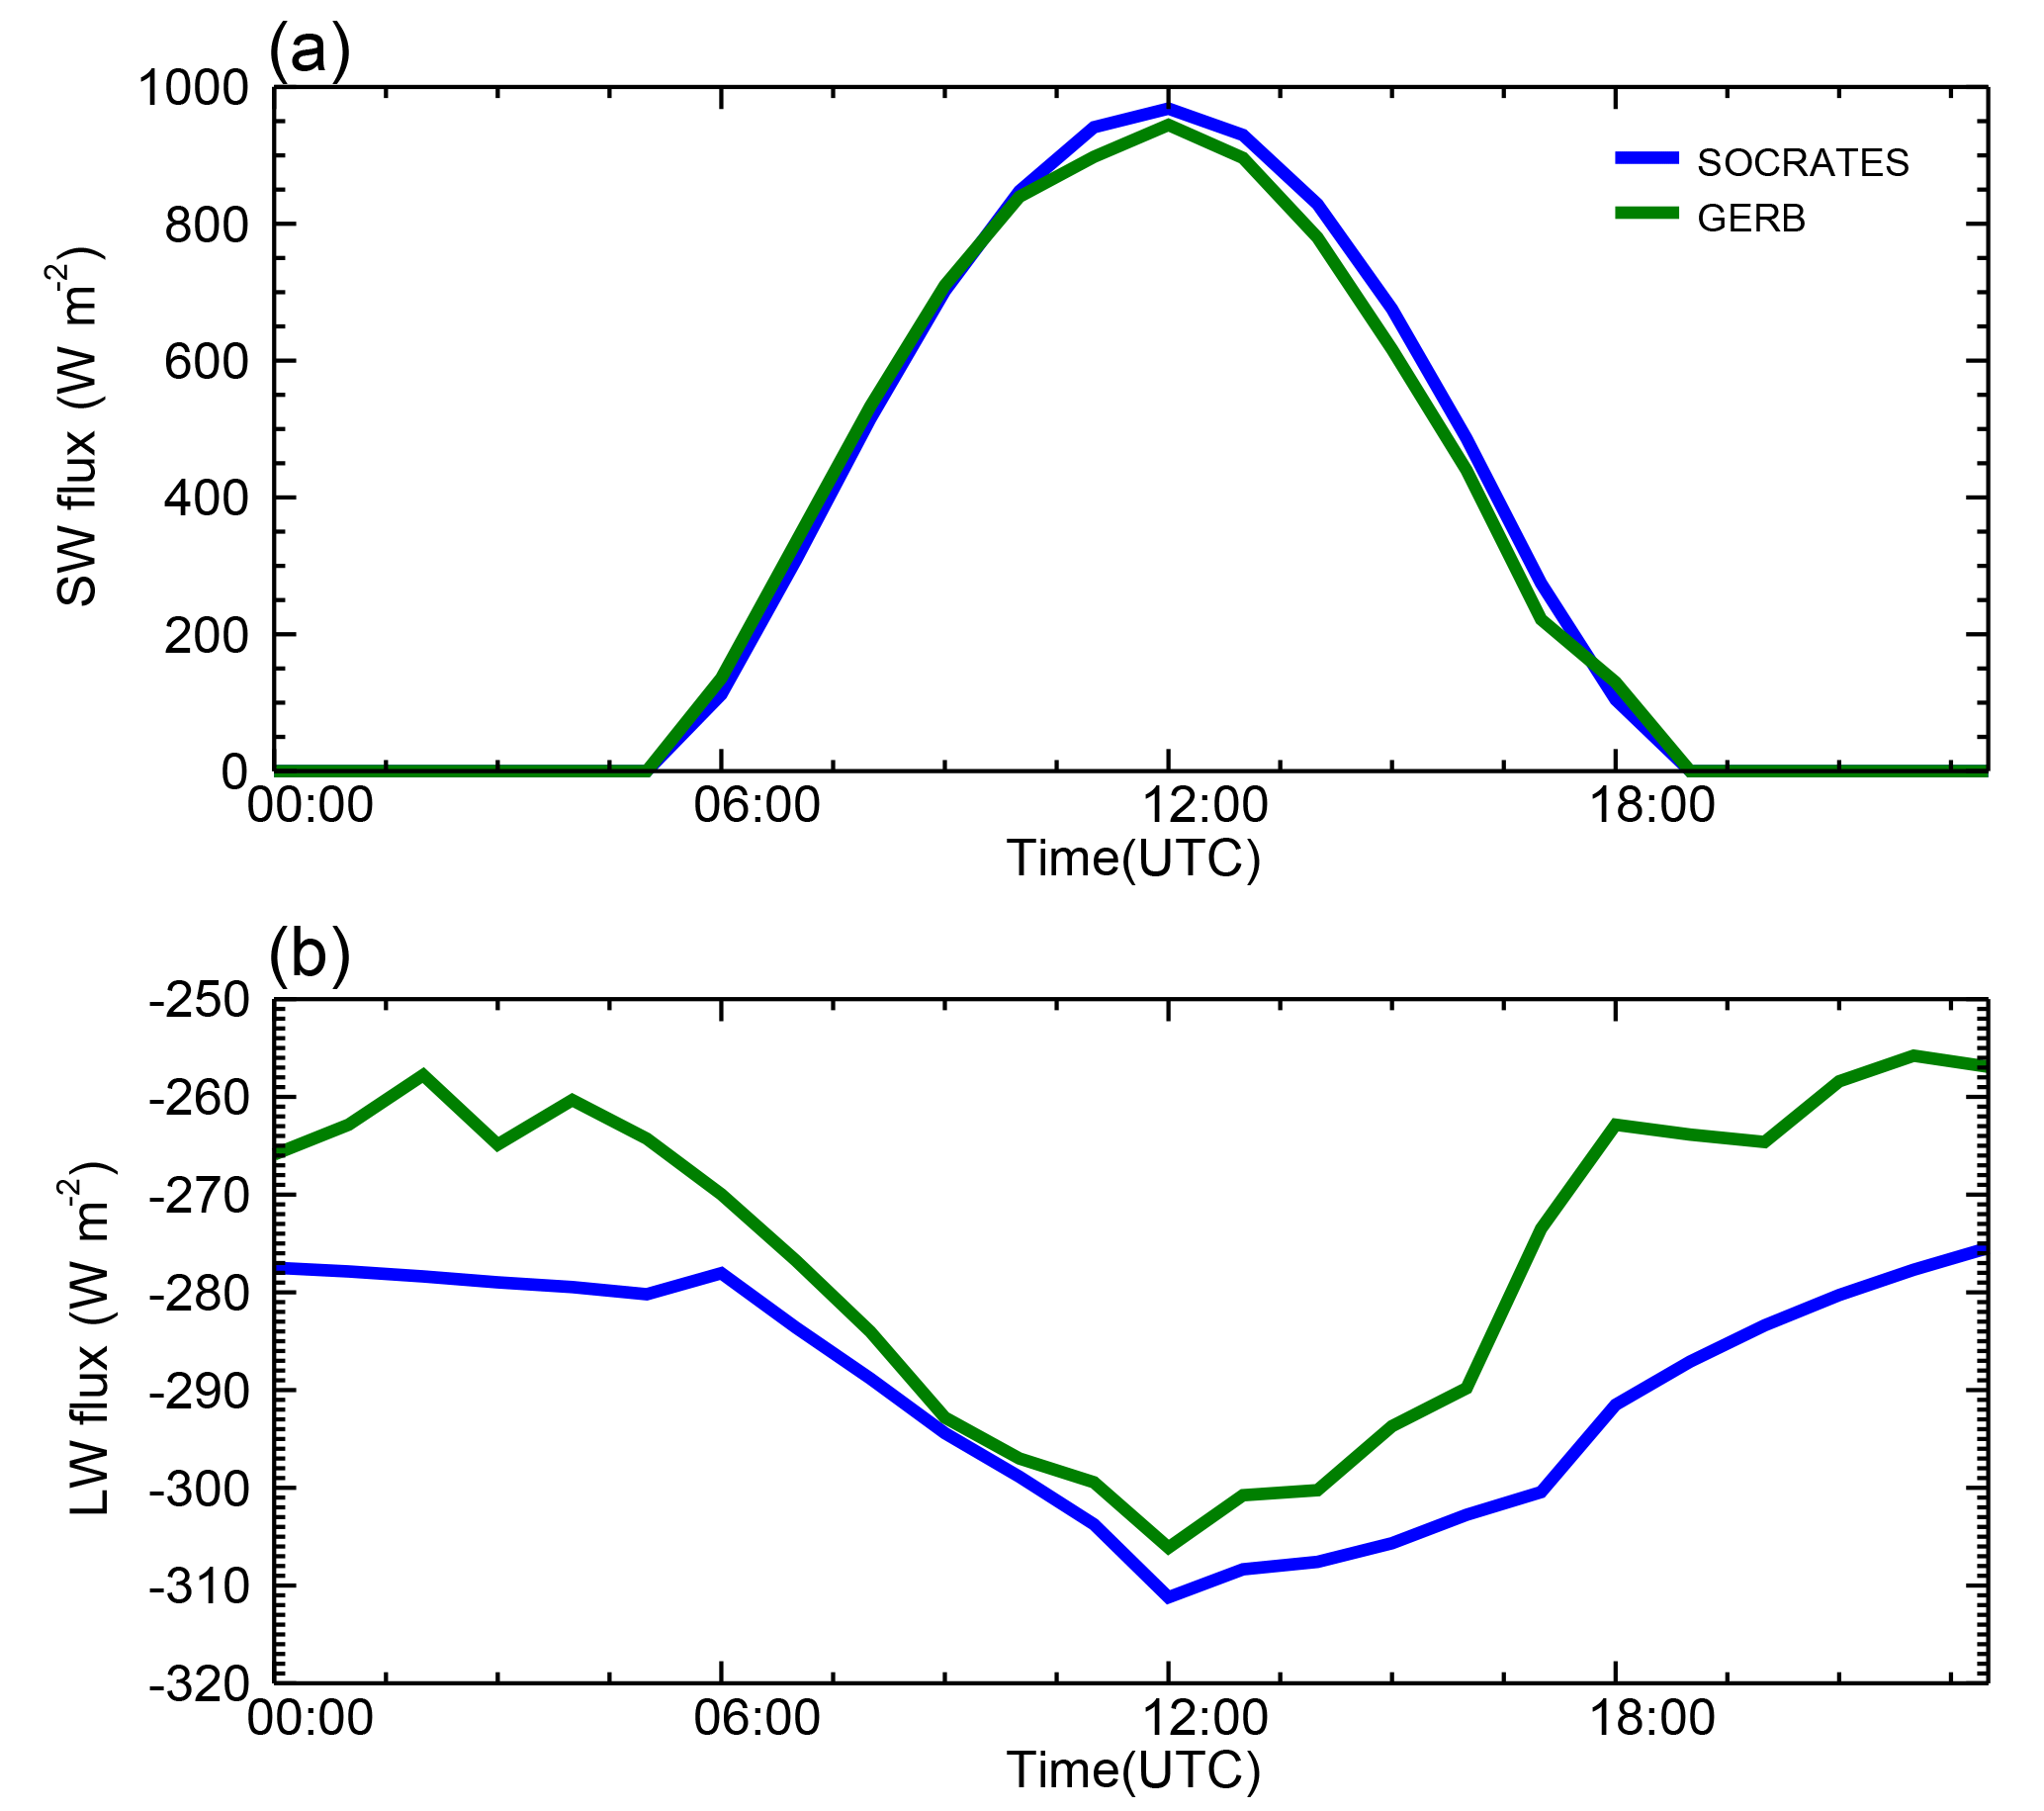
Figure 8Mean diurnal cycle of TOA flux: (a) shortwave and (b) longwave. SOCRATES results are from the wDwC experiment.
The RT simulation wDwC captures well the day-to-day variability in radiative fluxes at TOA and the surface (Fig. 9) including the effect of the major synoptic and mesoscale dust/water vapour events, e.g. the haboob event of 21 June. However, in the longwave, there are significant RT model errors during nighttime on 17 and 18 June, which are cases of high dust load following haboob events. Analysis of satellite imagery shows this anomalous high GERB longwave flux to be coincident with convective cloud development, presumably resulting from the moistening of the Saharan atmosphere, which the RT model, dependent on the reanalysis cloud field, cannot capture. This coincidence of dust and clouds is particularly challenging for both GERB cloud screening (which fails in this instance – hence our use of all-sky observations) and for the RT simulations themselves. A stronger anomalous flux from the diurnal mean in GERB measurements compared with wDwC results and CERES measurements for the wDwC simulation and observation can be clearly seen in Fig. S2a and b.
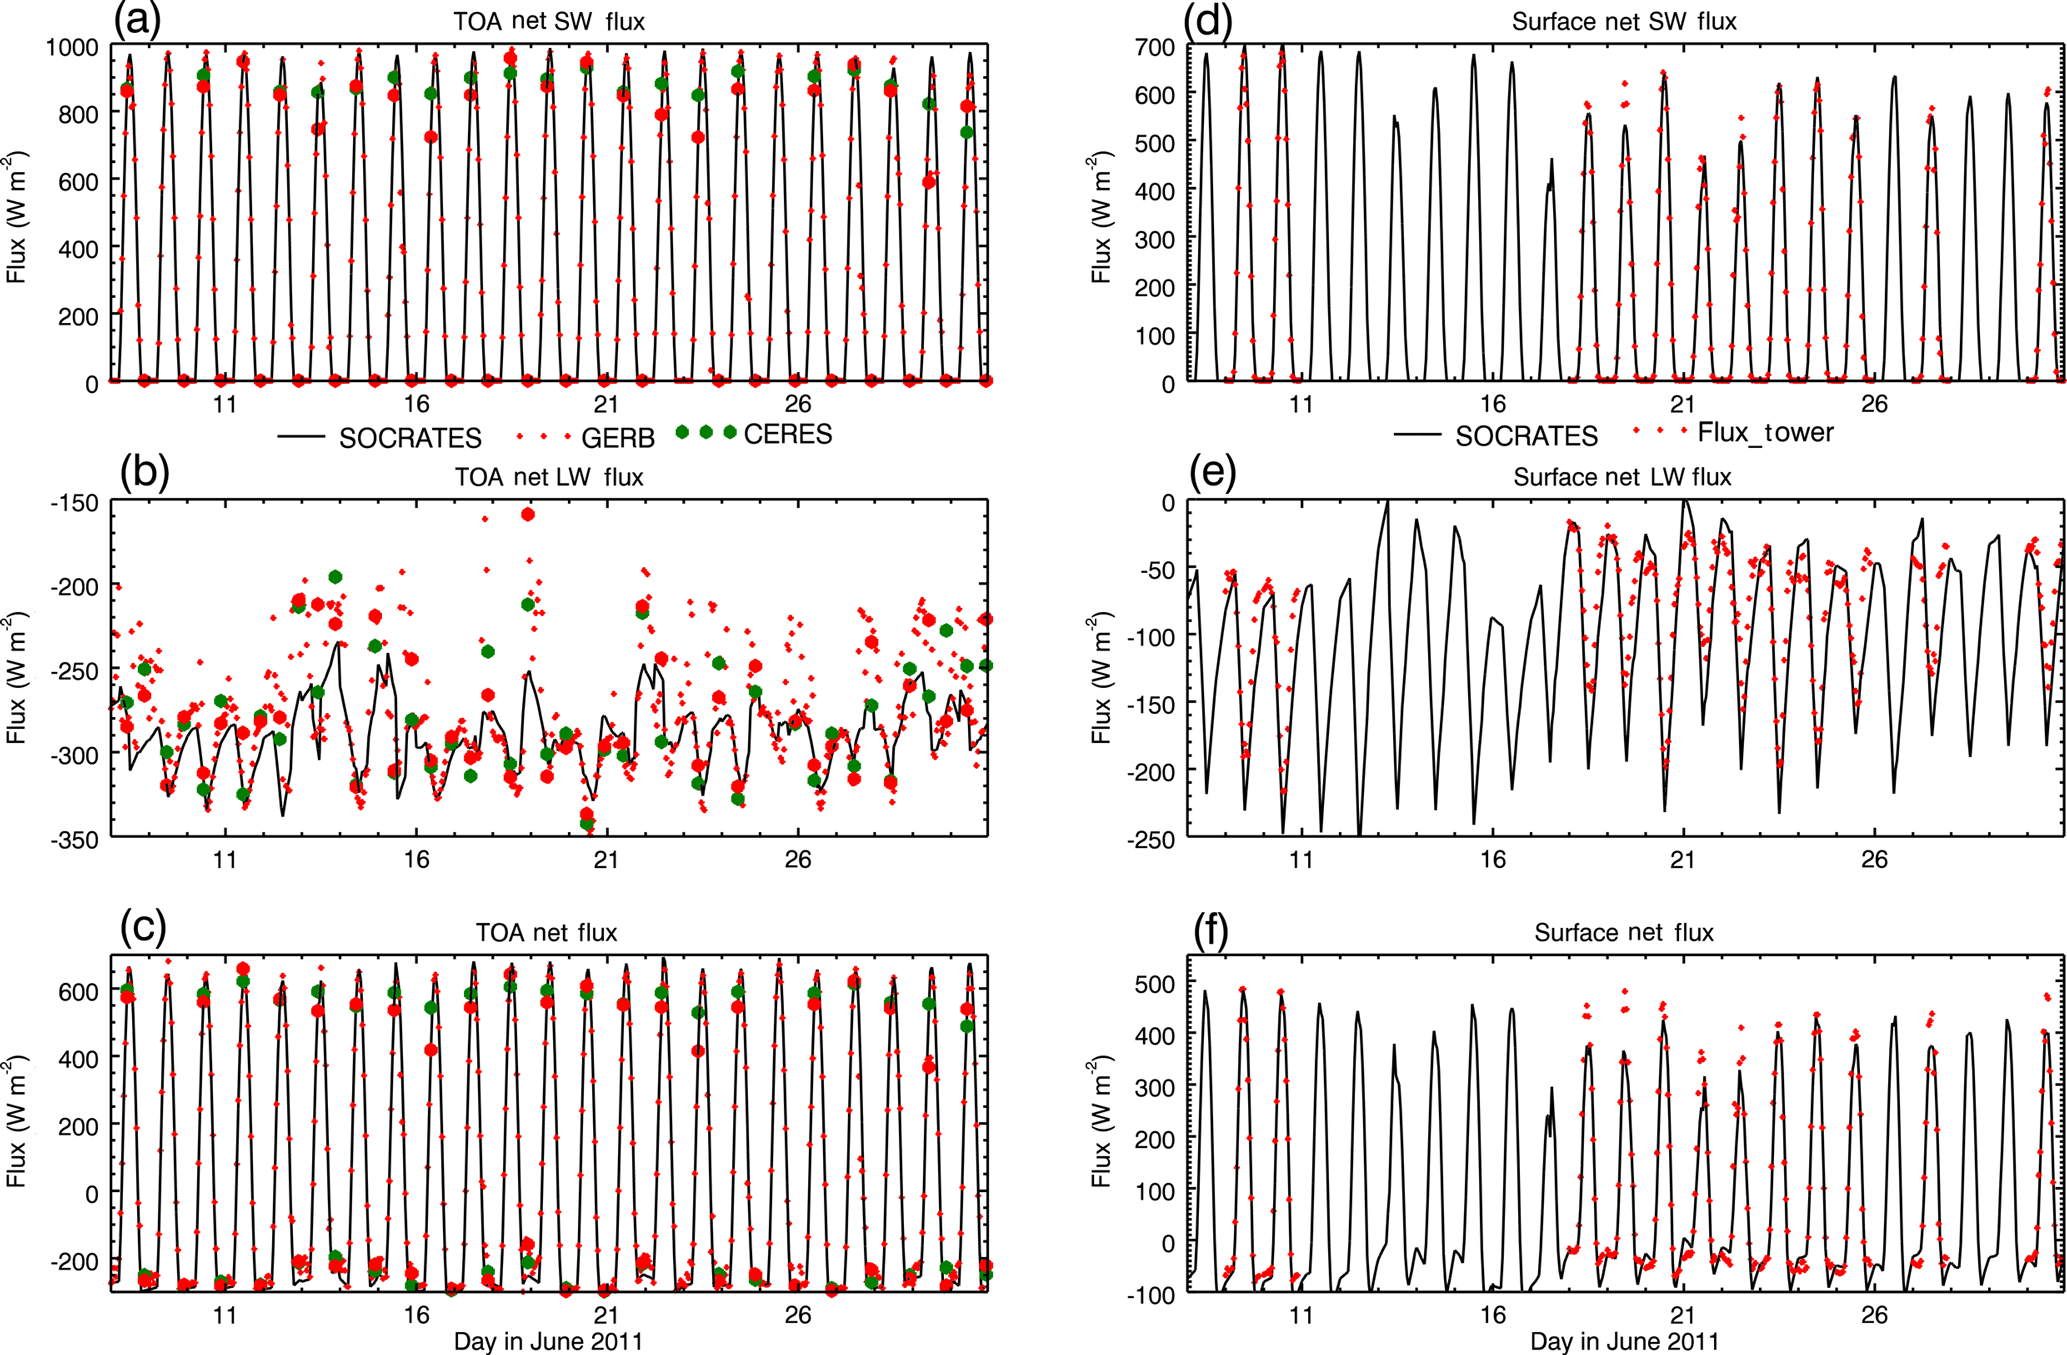
Figure 9Time series of radiative flux at BBM. TOA longwave (a), shortwave (b), and net (c). Surface shortwave (d), longwave (e), and net (f). The bigger red dots denote GERB measurements corresponding to CERES time steps.
We can evaluate our model wDnC experiment results against clear-sky CERES footprint data in which the root mean squared errors (RMSEs) are 17 and 12 W m−2 for TOA shortwave and longwave fluxes, respectively. The equivalent figures for the model versus GERB (cloud screened using the CERES footprint cloud mask product) at the same times are 22 and 12 W m−2. These are comparable to and consistent with (i) the individual instrumental errors of CERES/GERB, (ii) the inter-sensor uncertainties (CERES versus GERB RMSE of 22 and 6 W m−2 for shortwave and longwave), and (iii) previous similar studies (e.g. Osipov et al., 2015).
In summary, RT-simulated flux errors of the “optimum” configuration are comparable to observational uncertainties and those errors introduced by uncertainties in input fields. On this basis, we suggest the RT configuration is acceptable for further analysis on the direct radiative effect of dust and water vapour.
4.2 The radiative flux and heating effects of dust and water vapour
First, we consider the TOA and surface mean radiative budgets. In the absence of dust and clouds, the Saharan atmosphere during June 2011 at BBM shows a positive radiation budget at the surface of 99 W m−2 in which shortwave heating of 237 W m−2 is offset by longwave cooling of −138 W m−2 (Table 3). At TOA, the shortwave flux of 328 W m−2 is not quite offset by longwave losses of 313 W m−2 (Table 2), leading to a net positive radiation balance of 15 W m−2 making the SHL a weak net radiation sink. This strong (weak) radiation surplus at the surface (TOA) leads to the atmosphere having a net cooling of 83 W m−2 (i.e. radiative divergence), presumably maintained by the transfer of sensible heat from the surface into the atmosphere through turbulent heat transfer (Alamirew et al., 2018).
Both dust and water vapour are known to play an important role in controlling the radiative budget and heating rate of surface and the atmosphere over Sahara. Variability in these two active radiative components is strongly correlated due to the physical processes that govern transport of water vapour and dust emission into the SHL region (Marsham et al., 2013b; M16) such that it is challenging to quantify their separate radiative effects from observations alone. Our RT simulations below address this research gap.
4.2.1 Dust
Here, we determine the DRE of dust using two sets of experiments described in Table 1. First, we compare the simulations of radiative fluxes and heating during June 2011 between the wDnC and nDnC experiments (Figs. 10, 11, 12, and 13 and Table 2). Secondly, we derive the sensitivity of radiative fluxes and heating rates to a wide range of dust AOD using the sensitivity experiments (Fig. 11). We then compare our estimates of dust DRE to those from previous studies.
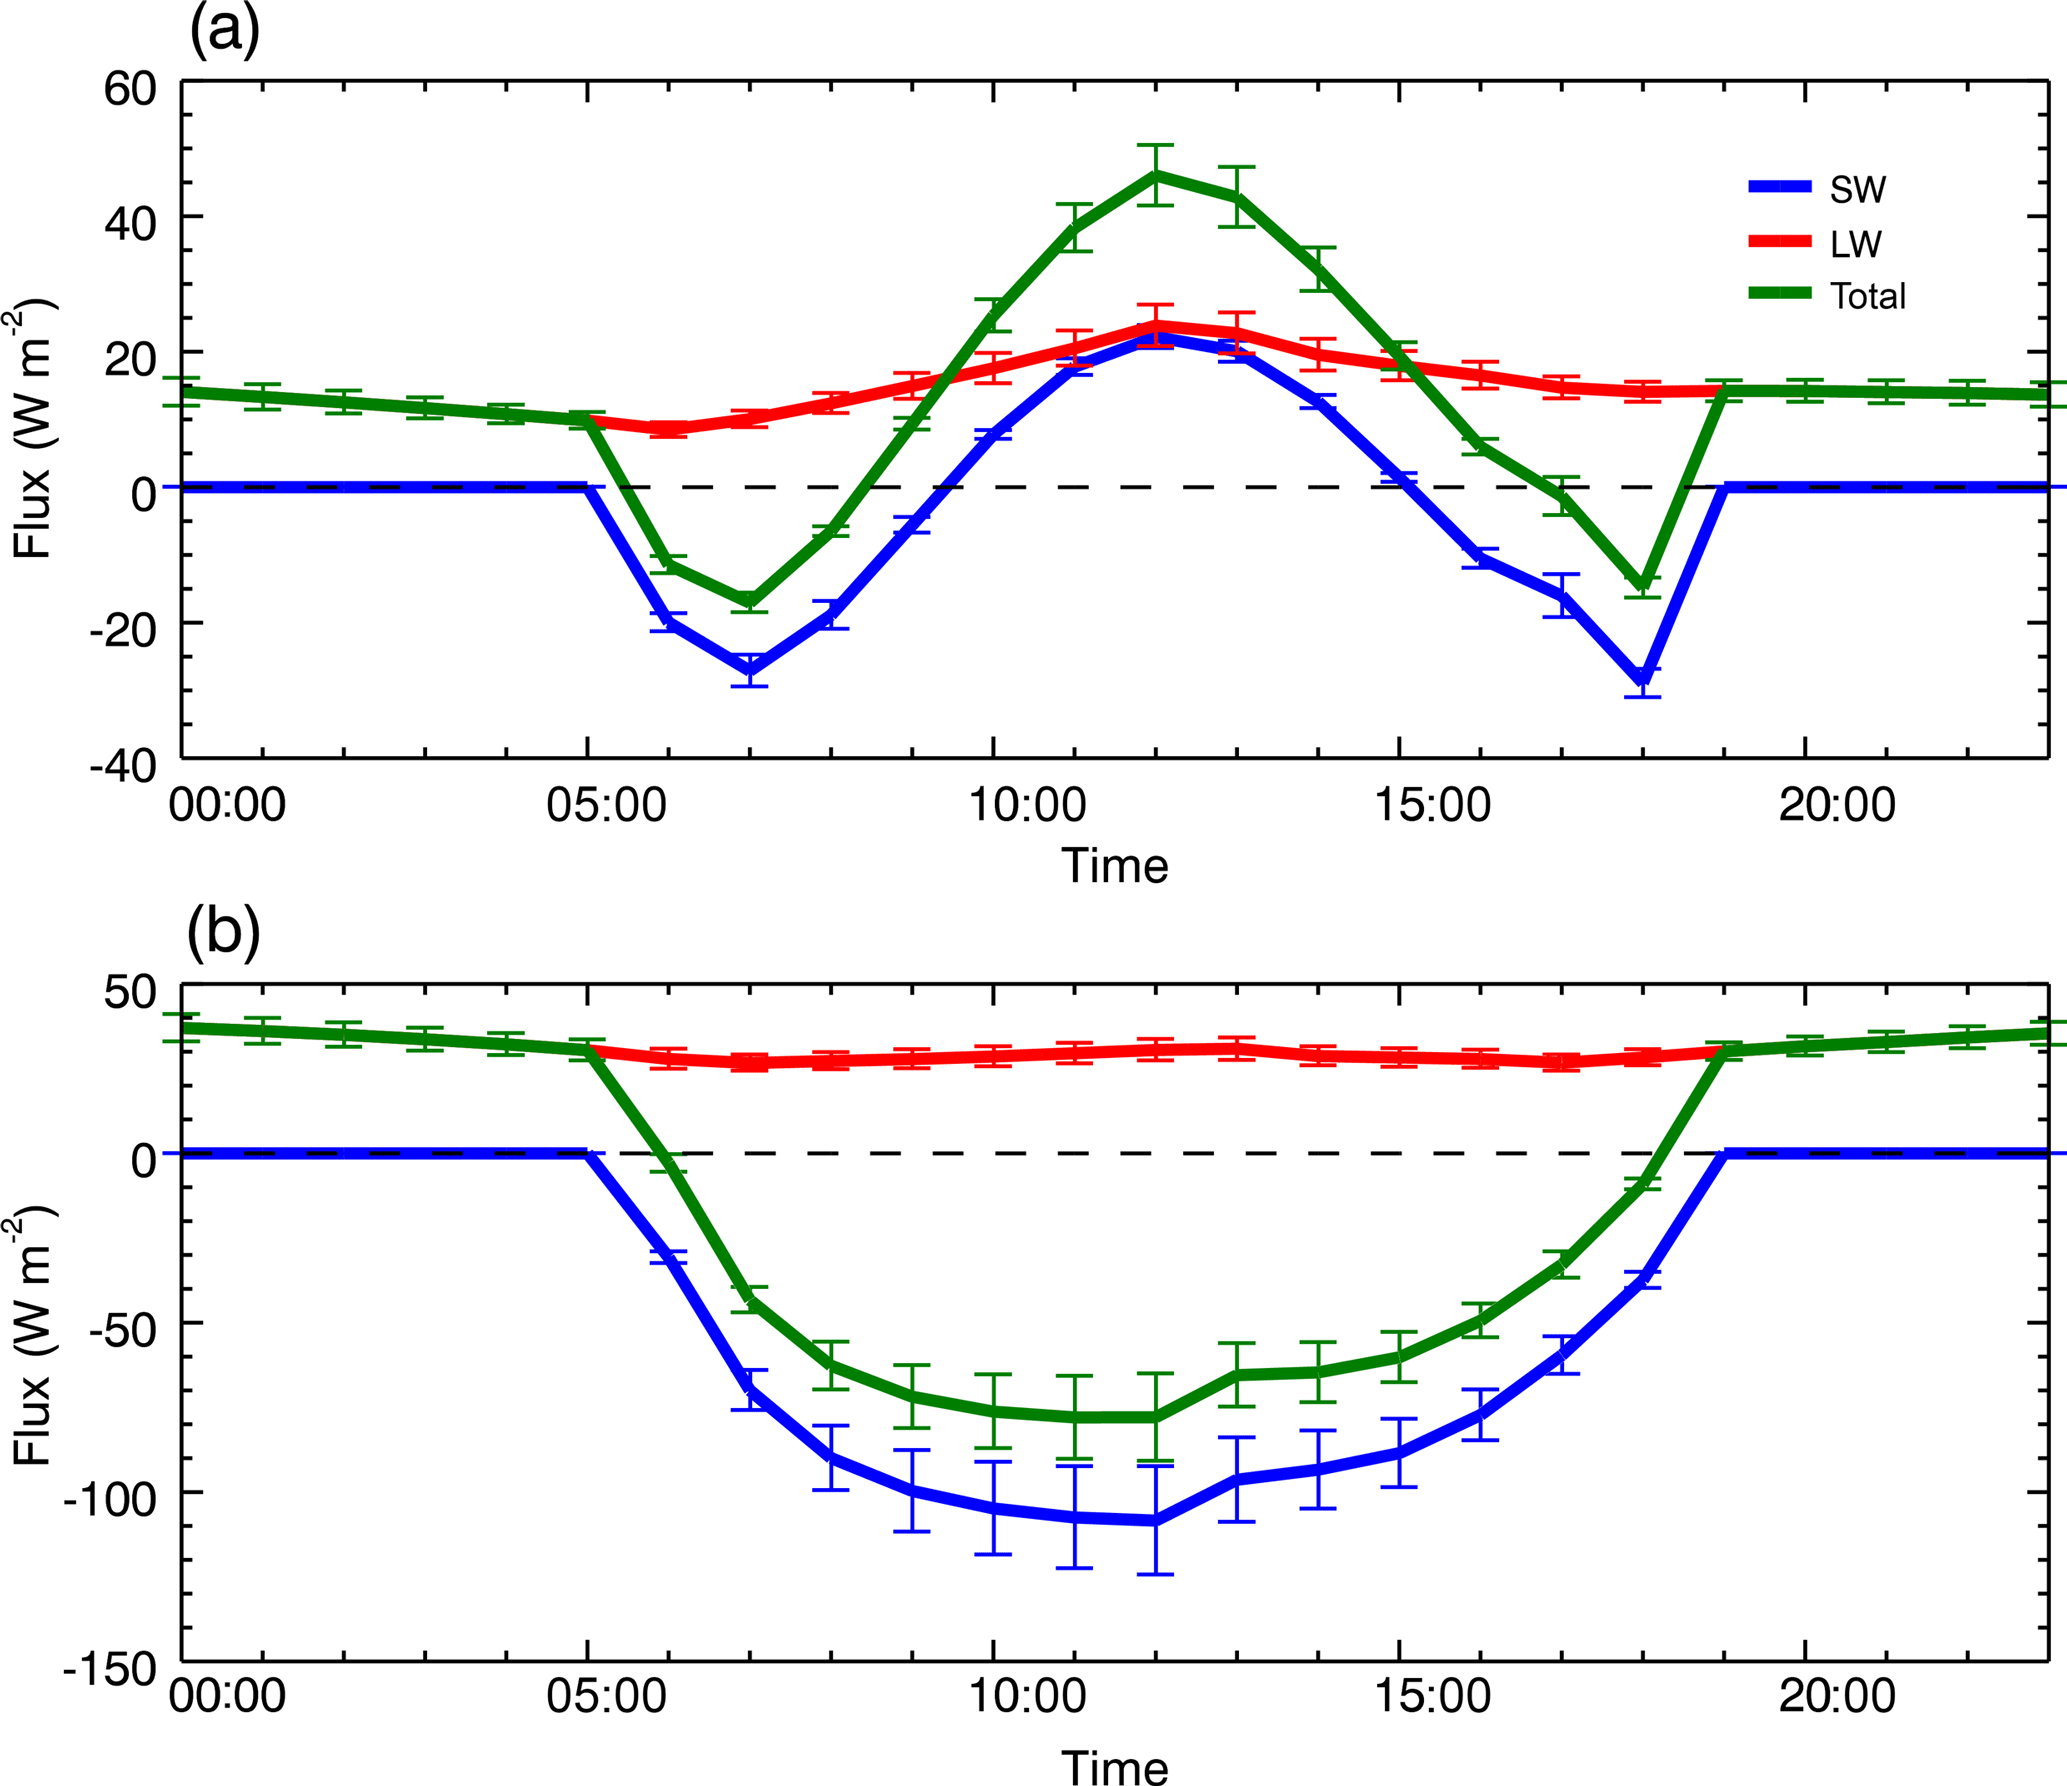
Figure 10Mean diurnal direct radiative effect of dust averaged for 8–30 June 2011: (a) TOA and (b) surface. The bars show the standard error over the diurnal cycle.
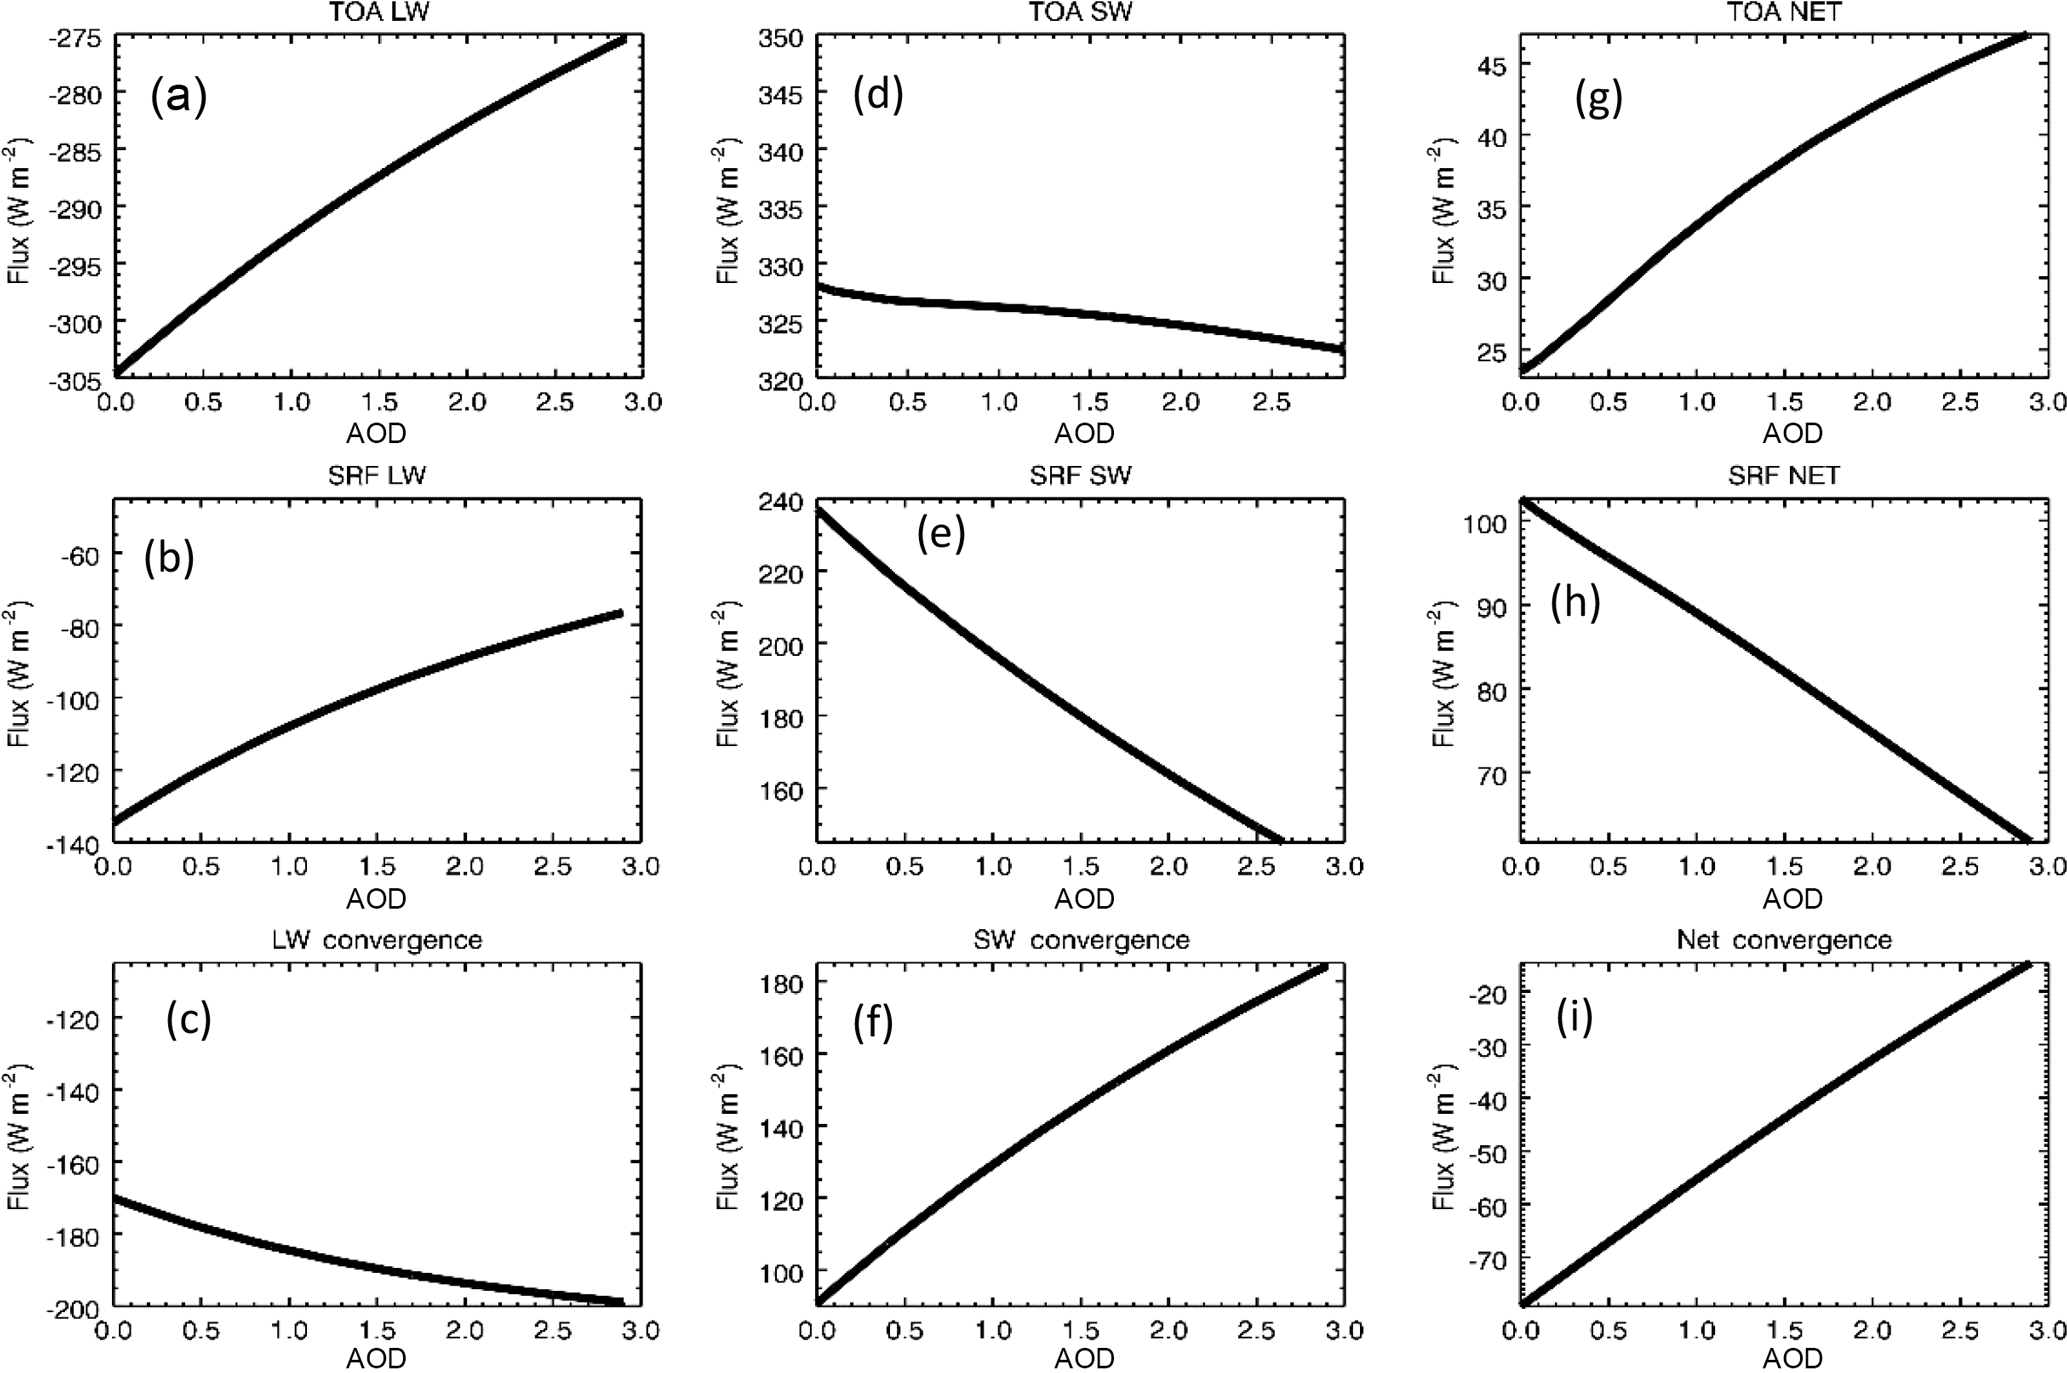
Figure 11Radiative budget as a function of dust AOD. Top row: TOA longwave (a), shortwave (b), and net (c). Second row: surface longwave (a), shortwave (b), and net (c). Third row: atmospheric radiative convergence of longwave (g), shortwave (g), and net (i).
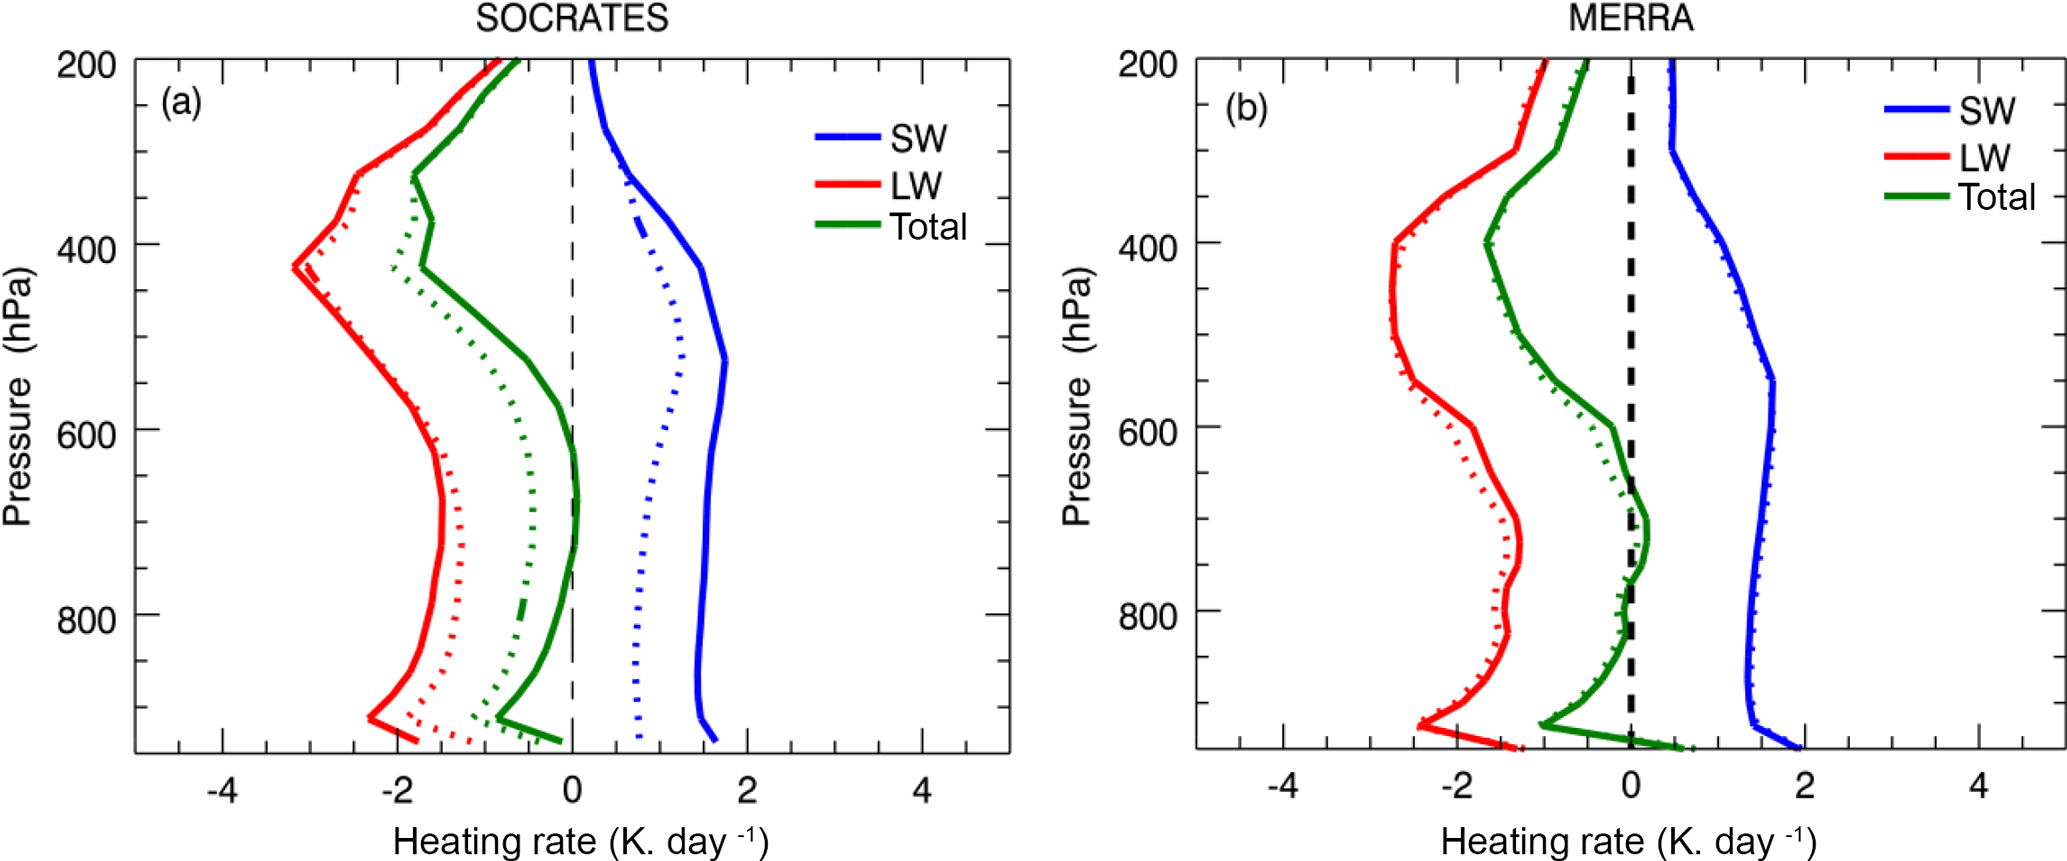
Figure 12Mean radiative heating rate profile for 8–30 June 2011 at BBM. (a) Results from nDnC (dashed lines) and wDnC (solid lines) using the Fennec profile and (b) MERRA model output for all-sky (solid lines) and clear-sky (dashed lines) conditions.

Figure 13Shortwave radiative heating rates (K day−1) of dust in the atmosphere (wDnC minus nDnC).
The mean SW/LW/N DRE of dust at TOA for June 2011 estimated from wDnC minus nDnC is W m−2, confirming the net warming effect of dust over the Sahara. This warming comes primarily in the longwave with a peak at ∼ 24 W m−2 close to midday (Fig. 10a). The net shortwave DRE is small, consistent with other estimates (Huang et al., 2014; Yang et al., 2009). However, it has a pronounced diurnal structure driven by a semi-diurnal cycle in the shortwave with a cooling effect of up to −29 W m−2 after dawn until 10:00 LT and after ∼ 16:00 LT until sunset, and a warming effect of up to ∼ 22 W m−2 around midday (Fig. 10a). The diurnal cycle of dust DRE is not strongly dependent on the amount of dust loading in the atmosphere but controlled by solar zenith angle and surface albedo (Ansell et al., 2014; Banks et al., 2014). The phase function also exerts a control on the diurnal cycle of the DRE as its value increases the backscatter fraction of SW radiation at large solar zenith angles. For comparison, the equivalent TOA SW/LW/N DREs of dust for MERRA reanalysis are W m−2, suggesting that although MERRA has a good estimate of net DRE the apparent shortwave warming effect is not in agreement with observations and the longwave warming is underestimated.
At the surface, the SW/LW/N DRE of dust is estimated to be W m−2 for SW/LW/N (Table 3). The net cooling is driven by the shortwave which peaks at ∼ −108 W m−2 around noon (Fig. 10b), partly compensated by a longwave heating effect of 32 W m−2. The MERRA reanalysis DRE at the surface is 12 W m−2, again showing a good estimate of net effects but underestimating the shortwave and longwave components. The time series of shortwave DRE of dust (see Fig. S3a in the Supplement) at TOA further confirms the diurnal cycle discussed above: a midday warming, and early morning and late afternoon cooling. The impact of big dust events (e.g. 17 and 21 June) can be clearly seen on the time series of longwave DRE of dust (Fig. S3b).
The results of sensitivity experiments “senDnC” are shown in Fig. 11 and the DRE per unit AOD and per unit standard deviation in AOD is presented in Table 4, assuming a linear relationship between flux and AOD with regressions provided at 95 % confidence interval. We find the net TOA shortwave flux to be only weakly sensitive to dust AOD (Fig. 11d at W m−2 per AOD). This is due to the competing dust effect of increasing surface albedo, which decreases net TOA shortwave and absorption by dust, which increases TOA net shortwave by reducing the upwelling shortwave radiation. Our estimates of shortwave dust DRE are less than half the sensitivity reported at BBM by M16 but consistent with the Sahara-wide estimates from satellites of Yang et al. (2009) and those of Ansell et al. (2014). Dust in the atmosphere acts to reduce the outgoing longwave flux by 10.0 ± 0.4 W m−2 per unit increase in AOD (Fig. 11a), warming the surface, consistent with the observations at BBM of M16 (11 W m−2 per AOD increase) and within the Sahara-wide range of Yang et al. (2009).
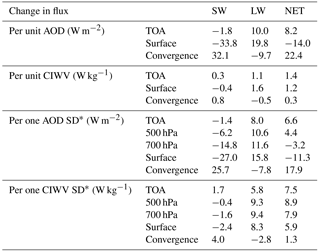
Table 4Sensitivity of radiative flux to dust AOD and CIWV at selected altitudes. SD∗ indicates standard deviation (0.8 for AOD and 5.5 g kg−1 for water vapour). Mean AOD is 1.2 and mean column-integrated water vapour is 27.8 kg m−2.
At the surface, dust has the opposite effect in the shortwave and longwave, with shortwave having stronger cooling effect: for every unit increase in AOD, there is a shortwave reduction (Fig. 11e, Table 6) of 33.8 ± 1.3 W m−2 compared to the increase in longwave (Fig. 11b), with 19.7 ± 1.4 W m−2 the net effect (Fig. 11h) being cooling of −14.1 ± 0.1 W m−2 per AOD increase.
Dust drives radiative convergence in the atmosphere, i.e. the difference in TOA minus surface flux, which acts to warm the atmosphere. This occurs through greater shortwave absorption, at a rate of 32.1 ± 1.4 W m−2 per AOD (Fig. 11f), offset partially by longwave cooling the atmosphere at −9.7 ± 1.0 W m−2 per unit AOD increase, leading to a net warming effect of 22.4 ± 0.4 W m−2 per unit change in AOD. Overall, the RT estimates of TOA and surface DRE in the shortwave and longwave and the atmospheric radiative convergence are within a few W m−2 of those of M16 derived from observations.
We convert the radiative fluxes to actual heating rates (Fig. 12a). In the absence of dust (nDnC experiment), the PBL is heated in the shortwave mainly from absorption by O2 and water vapour peaking up to ∼ 1.3 K day−1 at 450 hPa (the water vapour effect is shown in Fig. 14). Strong longwave cooling throughout the troposphere (up to ∼ −3 K day−1 at ∼ 450 hPa) due to emission from water vapour and other greenhouse gases exceeds this shortwave heating, leading to tropospheric radiative cooling of ∼ −0.6 K day−1 throughout the PBL. This is consistent with the radiative heating estimate of Alamirew et al. (2018) derived as a residual of the heat budget. In the lowest near-surface layer (below 925 hPa), there is less longwave cooling due to strong radiative flux from the hot desert surfaces in the SHL. Dust acts to modify the vertical structure of this radiative heating/cooling considerably. Absorption of shortwave radiation leads to a strong warming effect in the shortwave (especially in the dusty PBL up to ∼ 0.75 K day−1 below ∼ 700 hPa, where dust loadings are the highest), offset only partially by enhanced longwave cooling (up to ∼ −0.25 K day−1) resulting in a net warming of the atmosphere by up to ∼ 0.5 K day−1 at ∼ 700 hPa, such that the dusty troposphere above ∼ 600 hPa has near-zero cooling. For comparison, we consider that the MERRA reanalysis product mean heating rate (Fig. 12b), which includes both clouds and climatological dust, is in close agreement with those of the wDwC experiment. However, MERRA does not capture the day-to-day variability in shortwave heating from dust and will not therefore be able to simulate the responses of the SHL atmosphere to variability at these timescales. Further weather/climate model simulations are required to determine the effect this has on the regional circulation and the behaviour of the SHL.
Day-to-day variability in the dominant shortwave net heating rate (Fig. 13) is pronounced and shows the impact of the synoptic/mesoscale dust events on the SHL atmosphere. During large dust events (e.g. 17 and 21 June), there is strong shortwave heating up to 6 K day−1 around midday hours. This will be coincident with reduced surface net radiation and sensible heat flux. Together, these processes will act to reduce the vertical temperature gradient, stabilise the atmosphere, reduce dry convection, and reduce the depth of the PBL.
4.2.2 Water vapour
To estimate the heating rate profiles due to water vapour, we selected from the nDnC simulation the three driest days (11, 12, and 16 June) with mean column-integrated water vapour of 20.2 kg m−2 and three most humid days (18, 25, and 30 June) with mean column-integrated water vapour of 34.7 kg m−2. The mean heating rate profiles for the two contrasting atmospheric conditions are shown in Fig. 14. High humidity drives an increase in the shortwave heating rate up to 0.5 K day−1 peaking near the surface. This atmospheric warming is counteracted by a slightly bigger cooling in the longwave. Thus, there is a net atmospheric cooling up to −0.25 K day−1 and strong heating up to 2.5 K day−1 near the surface as a result of the increase in moisture. The atmospheric cooling in the longwave causes surface warming, which is suggested to be linked with the intensification of the Saharan heat low region (Evan et al., 2015b). The reversed heating rate profiles in the layer between 500 and 400 hPa are because the mean moisture profile in this layer is larger during the dry days, and vice versa (Fig. 2).

Figure 14Atmospheric heating rate profile for selected dry days (11, 12, and 16 June; dashed lines) and moist days (18, 19, and 25 June; solid lines).
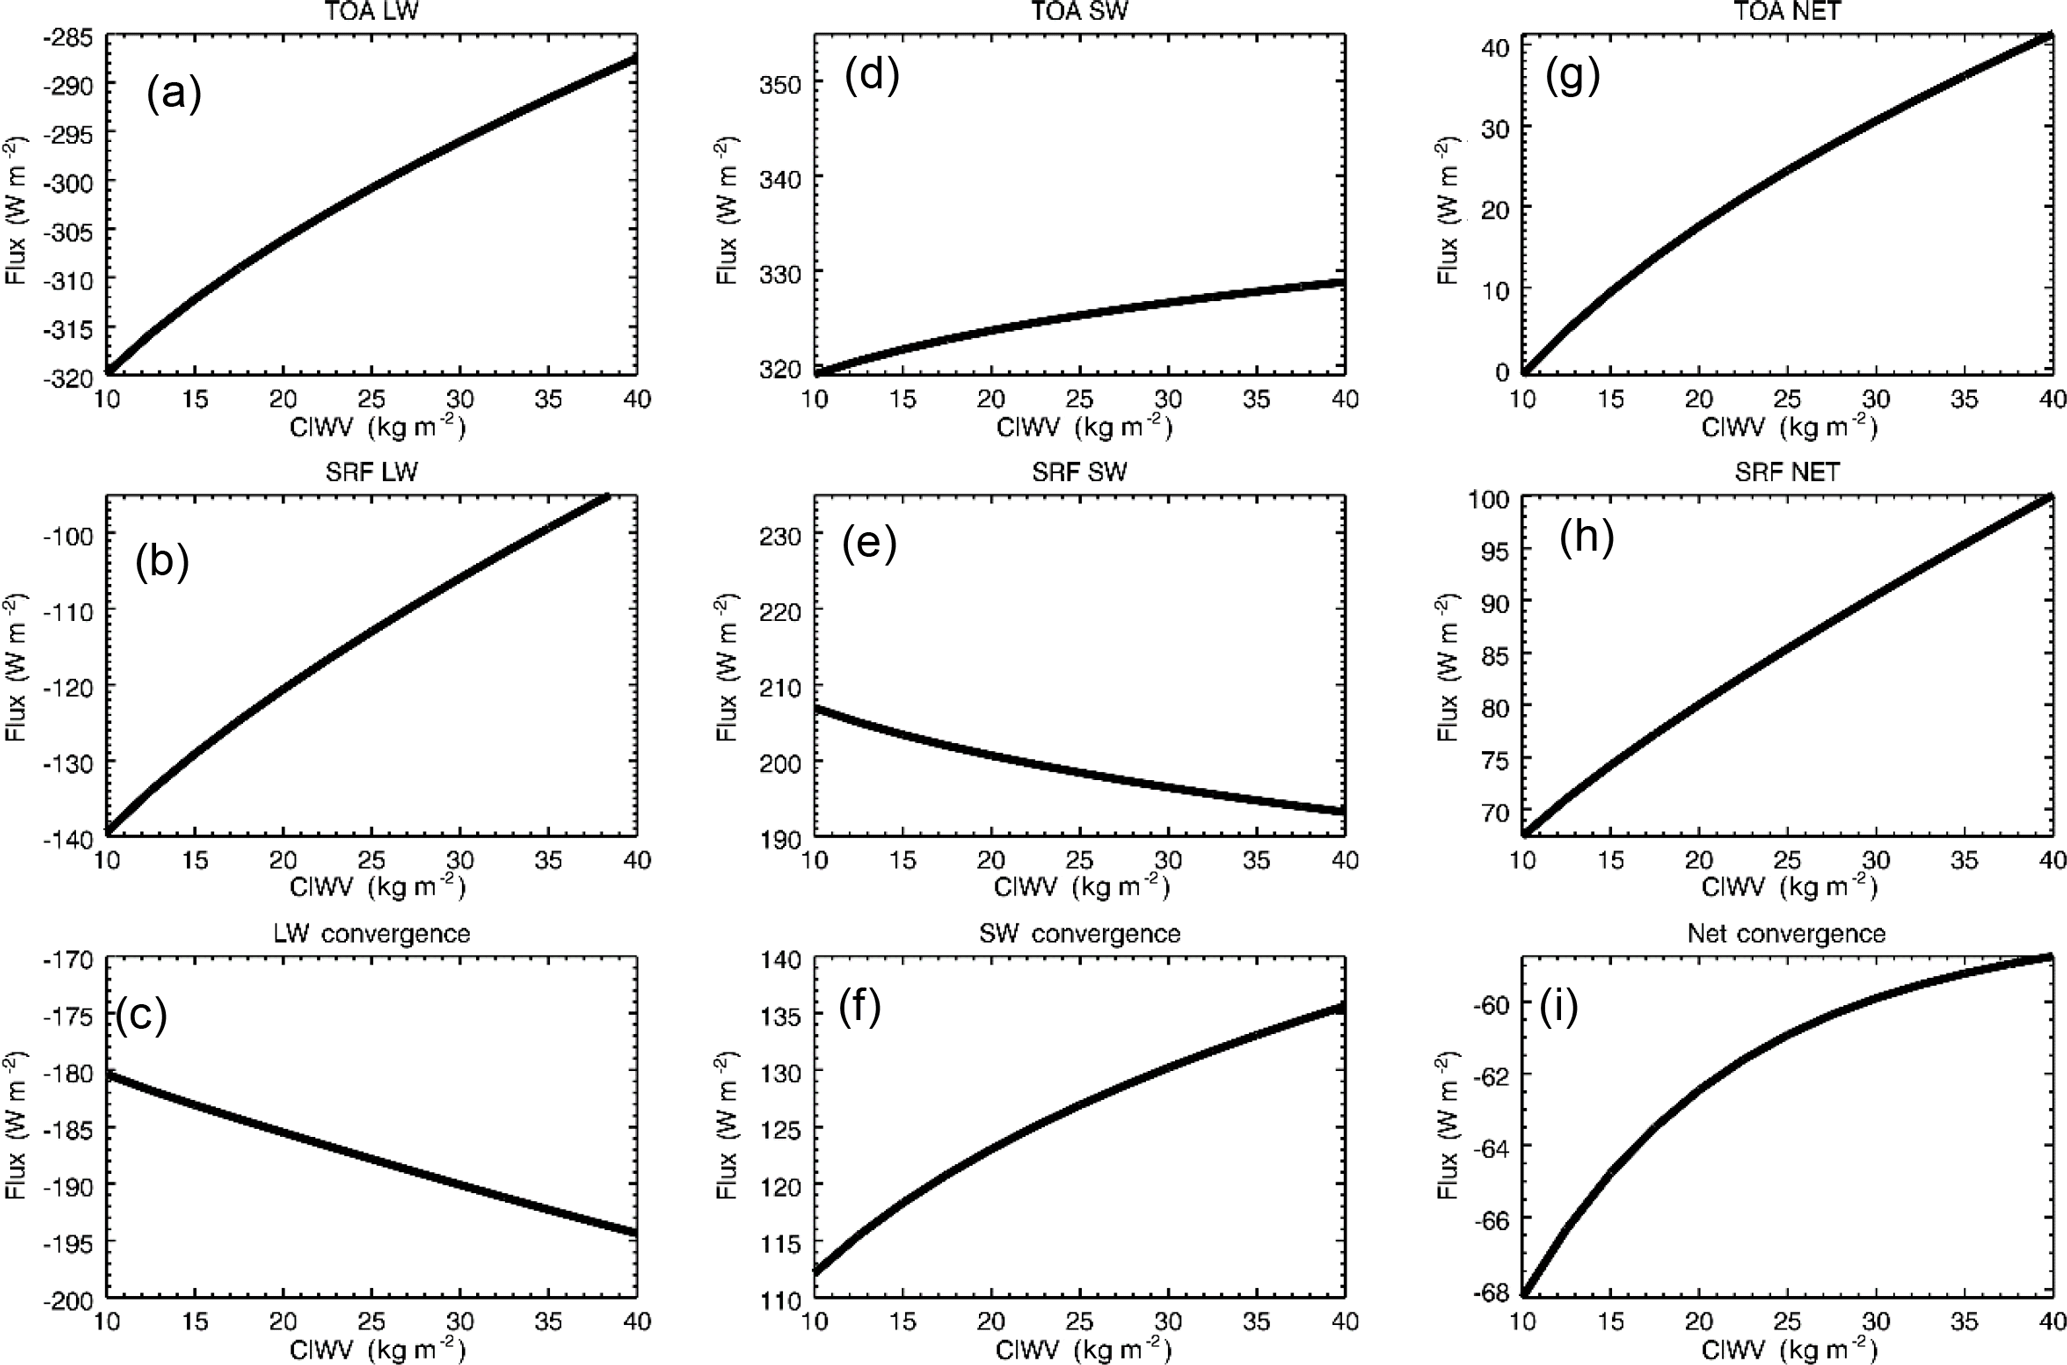
Results from the water vapour sensitivity experiments (senWVwDnC) are presented in Fig. 15 and the linear dependence on fluxes per unit water vapour in Table 4. We again present the regression values to 95 % confidence level. The outgoing longwave radiation (Fig. 15a) decreases with increasing of water vapour at a rate of 1.1 ± 0.7 W kg−1 which is associated with the greenhouse effect of water vapour. This is about a third of that derived by M16 (3 W kg−1). Their result includes the effect of water vapour and associated dust and clouds while our result considers sensitivity of radiative flux to changes in water vapour only. The sensitivity of TOA shortwave flux due to water vapour (Fig. 15d) is 0.3 ± 0.3 W kg−1 which warms the atmosphere and in contrast cools the surface due to the reduction of the shortwave reaching the Earth. M16 showed a reduction in the TOA shortwave radiation with increasing water vapour of −0.98 W kg−1, which is contrary to what we find in our results. However, this could be related with the impact of clouds on shortwave radiation which will reduce TOA net shortwave radiation. The net flux at TOA increases by to 1.4 W m−2 for a unit change in CIWV, resulting in a net warming of the TOA.
The net flux reaching the surface (Fig. 15h) is increased at a rate of 1.1 ± 0.4 W kg−1 which is the counteracting effect of a dominant increase in longwave radiation re-emitted downwards from the atmosphere (1.5 ± 0.8 W kg−1) and a smaller reduction in downwelling solar radiation (−0.4 ± 0.4 W kg−1). The warming effect of water vapour at both the surface and the TOA means that net atmospheric convergence changes relatively little with water vapour (Fig. 15i) at 0.3 ± 0.6 W kg−1 which is a result of −0.5 ± 0.1 W kg−1 in the longwave (Fig. 15c) and 0.8 ± 0.7 W kg−1 in the shortwave (Fig. 15f). In comparison to the observational analysis of M16, we see some important differences; notably, we see a greater surface net warming effect of water vapour and as a result negligible, not positive, atmospheric radiation convergence. Nevertheless, our estimate of the sensitivity of surface longwave radiation to changes in CIWV of 1.1 W kg−1 is at the lower end of the range (1.0–3.6 W kg−1) estimated by Evan et al. (2015b), from observations and RT simulations, suggesting the role of water vapour in driving longer-term interannual to decadal heating of the SHL may not be as pronounced as previously suggested.
4.2.3 The relative effects of dust versus water vapour
From the sensitivity experiments, we can quantify the DRE of dust and water vapour at TOA and the surface per unit change in AOD dust and kilograms of water vapour, respectively (Table 4). By scaling this to the observed standard deviation in each variable observed during the Fennec observation period, we provide estimates of the relative importance of dust and water vapour to the day-to-day variability in the radiation budget over the SHL.
The resulting normalised dust SW/LW/net DRE per AOD at TOA and the surface is and W m−2, respectively, where these figures provide a useful way of presenting the variability of dust and water vapour on their radiative effects. The equivalent values for water vapour are and W m−2. As such, the radiative effects of dust and water vapour at TOA are of similar magnitude to the net warming of ∼ 7 W m−2 per unit variability. Dust and water vapour exert similar control on the total heating of the Earth–atmosphere system. This contrasts with M16, who report water effects (from vapour and clouds) as ∼ 3 times more powerful than dust. This is an important finding of this paper, signifying the role of dust particularly in controlling the variability of radiative flux and therefore heat budget of the region.
At the surface, radiative flux is controlled much more strongly by dust than water vapour and with opposite sign: net cooling of −11 W m−2 and warming of 6 W m−2 per unit variability, respectively. M16 found near-zero warming from water (vapour and clouds). In our study, the net effect of TOA versus the surface is strong atmospheric warming of 18 W m−2 per unit variability from dust and negligible warming (1 W m−2 per unit variability) from water vapour. In contrast, M16 find almost equal warming from dust and water vapour (of 11–12 W m−2 per unit variability). Although this radiative-transfer-based analysis of the role of water vapour does not include clouds, which are implicitly included in M16, we suggest that the co-variability of dust and water vapour hinders calculation of their independent effects in the observational analysis of M16.
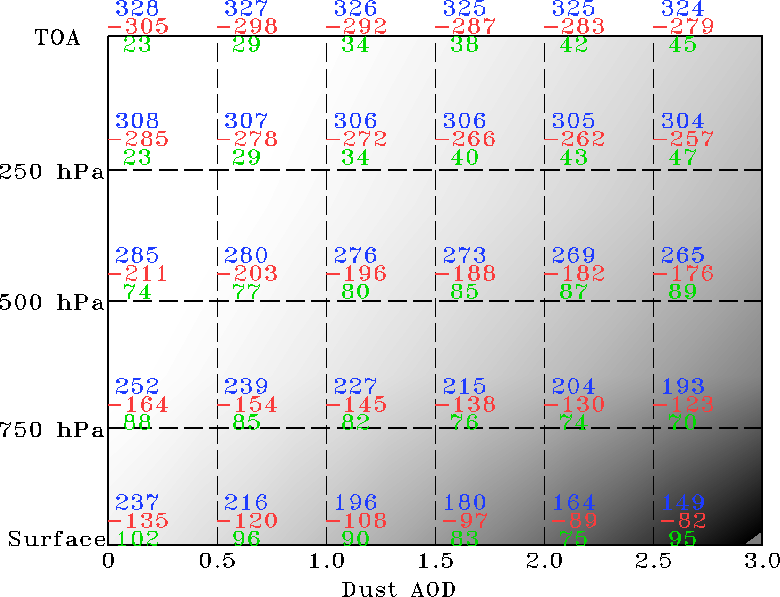
Figure 16Sensitivity of radiative flux (W m−2) to changes in dust AOD. The numbers at each pressure level are downward shortwave (blue), longwave (red), and net (green) fluxes. The grey shade represents dust and water vapour amount in the atmosphere.
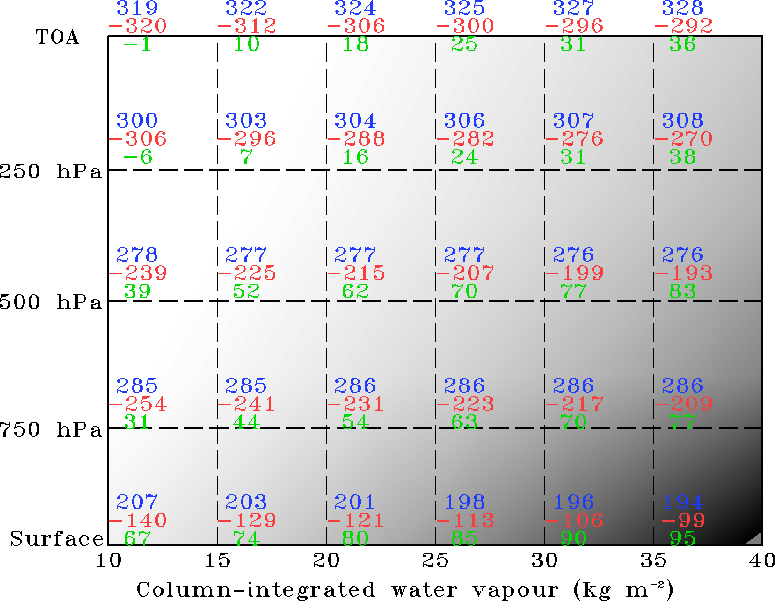
In summary, we find that dust and water vapour exert a similarly large control on TOA net radiation, and therefore total column heating, and by implication to the first order, a similar control on surface pressure in the SHL. However, the vertical structure of radiative heating from dust is far more complex than that from water vapour. The schematic (Figs. 16 and 17) illustrates the sensitivity of dust and water vapour, respectively, at different pressure levels. The grey shading in Fig. 16 (Fig. 17) represents amount of dust (water vapour) which gives AOD (CIWV) values shown on the horizontal axis when vertically summed. Dust imposes a strong net cooling at the surface from the SW which declines to zero at ∼ 700 hPa, where SW cooling and LW warming balance, with net warming above this (Table 4). In contrast, water vapour imposes a LW heating effect that varies relatively little from the surface to TOA. As such, dust is likely to have stronger impact on the structure and processes of the SHL atmosphere than does water vapour.
The summertime Saharan heat low feature is of considerable importance to the wider regional climate over west Africa but remains poorly understood. To the first order, the SHL is created by strong sensible heat flux from the surface radiative surplus which heats the deep Saharan boundary layer, which is near balance with advective cooling from the low-level convergence circulation. However, radiative heating is modulated by water vapour and dust whose variations, at least at short timescales, are correlated. Here, we aim to quantify the independent radiative effects of dust and water vapour, and the vertical profile of atmospheric heating rates, using an RT model. The model is configured for the location at BBM, close to the heart of the SHL, using inputs from Fennec field campaign for June 2011. First, sensitivity to uncertainty in RT model input fields is assessed. We find that dust size distribution is the most important source of uncertainty in this case, through its impact on single scattering albedo. The RT model when suitably configured has radiative flux biases at TOA that are within observational uncertainties and input uncertainties. The subsequent RT experiments show the following:
-
On average, the SHL has a large positive radiative surplus at the surface of 83 W m−2 and a small surplus at TOA of 31 W m−2, with a net atmospheric radiative divergence of 52 W m−2 presumably approximately balanced by the transfer of sensible heat.
-
The effect of dust is pronounced:
- i.
During June 2011, dust had a positive DRE at TOA of 8 W m−2 per unit AOD (7 W m−2 per unit AOD variability) almost entirely in the longwave, as the effects of shortwave absorption with respect to surface albedo largely balance, acting to warm the Earth–atmosphere system as a whole, with magnitude consistent with previous studies (Banks et al., 2014; M16; Yang et al., 2009).
- ii.
Dust has a strong negative DRE at the surface of −14 W m−2 per unit AOD (−11 W m−2 per unit AOD variability) largely due to reduced shortwave flux from atmospheric absorption.
- iii.
The net effect of this negative surface DRE and positive TOA DRE is considerable atmospheric radiative convergence of 22 W m−2 per unit AOD (18 W m−2 per unit AOD variability) largely from shortwave absorption. This directly heats the PBL below ∼ 500 hPa by ∼ 0.6 K day−1.
- iv.
Dust loading is variable, and the heating effect of episodic synoptic and mesoscale dust events can be up to 6 K day−1.
- i.
-
The effect of water vapour is weaker than dust at the surface and includes
- i.
a positive radiative effect at TOA of 1.4 W m−2 per unit column-integrated water vapour (8 W m−2 per unit water vapour variability) which is almost entirely a longwave greenhouse effect;
- ii.
a weak positive radiative effect at the surface of 1.2 W m−2 per unit column-integrated water vapour (6 W m−2 per unit water vapour variability) almost entirely from longwave radiation re-emitted downwards; and
- iii.
positive radiative effects at the surface and TOA, and thus a negligible impact on atmospheric radiative convergence.
- i.
A key finding here is that, in contrast to previous analysis, dust and water vapour are roughly equally important at TOA in controlling day-to-day variability in heating the Earth–atmosphere system as a whole (in contrast to M16 who identify water and associated clouds as the key drivers), but that dust variability dominates variations in surface and atmospheric radiative heating. The biggest single net radiative effect in this study is the atmospheric radiative convergence from dust. The impact of dust may therefore be greater than previously believed. Recent studies have proposed a water vapour positive feedback mechanism driving decadal variations in SHL intensity, implicated in the recent recovery of Sahelian rainfall (Evan et al., 2015b). Our results are consistent with this but strongly suggest that variability in dust loading should be considered in explaining variability and change in the SHL, reinforcing the need for high-quality long-term aerosol observations. Additionally, dust size distributions, shape, and chemical composition are spatially and temporally variable, and the vertical profile of dust will vary with meteorological conditions, thus introducing more variability and uncertainty than has been explored in this study. These variations potentially increase the controls of dust on the radiation budget even further than quantified here.
Therefore, water vapour events in themselves act to heat at TOA and at the surface, and presumably intensify the SHL. In contrast, dust events cool the surface but warm the lower troposphere as a whole, such that the net effect at the top of the Saharan residual layer (about 5 km) is a warming which will intensify the SHL. Various climate model experiments also demonstrate this effect (Mulcahy et al., 2014). We can then consider the effects of variability in SHL associated with monsoon surges and haboobs in which dust and water vapour increases are often coincident. Through radiative processes, such events act to (i) warm the whole troposphere almost equally through dust and the water vapour longwave effect and (ii) strongly cool the surface from the dust shortwave effect and more weakly warm the surface through water vapour longwave effects. Although these counteracting effects mean the net surface radiative flux reduction is actually quite small, the diurnal effects are pronounced, with the dust shortwave apparent in daytime and the water vapour effect dominant at night, which will act to reduce the sensible heat flux into the atmosphere, limiting the vertical development of the SHL PBL. Substantial radiative heating from dust occurs in the PBL up to 6 K day−1 through dust shortwave absorption. This will act to stabilise the PBL with implications for dry and moist convection, although Trzeciak et al. (2017) suggest that moistening may often counter this. Such events typically involve an additional advective cooling which can be substantial up to 2–5 K day−1 for monsoon surges (Couvreux et al., 2010) but is restricted to the lowest layers (∼ 1 km from the surface).
Couvreux et al. (2010) suggested a negative feedback process within the SHL–monsoon systems that may govern preferred 3- to 5-day timescale of variability in the SHL and monsoon pulses. Strong net radiative heating at the surface intensifies the SHL, enhancing monsoon surges which then, through low-level advective cooling, act to weaken the SHL before solar heating restores the SHL. Our results add potentially important details regarding the radiative role of dust and water vapour that may modify this conceptual understanding. First, the net effect on surface radiation of dust and water vapour together is to further cool the surface and weaken the SHL, in addition to the advective cooling. Second, this weakening of the SHL is offset because the magnitude of dust radiative heating in the lowest layers is comparable to that of advective cooling so that net effect may be small or even positive, but with the dust radiative heating extending throughout the entire PBL above, rather than just in the lowest 1 km or so. Third, the timescale of re-establishment of the SHL through surface heating and sensible heat flux may be influenced by the rate of dust deposition and export, which, depending on the synoptic context may be 1–2 days, though sometimes dust remains suspended in the SHL for days to weeks. The net effect of these often competing processes on the SHL will depend on the precise nature of water vapour, dust, and temperature advection during such monsoon surge events. As such, SHL variability will represent a complex interplay of factors rather than a feedback through a single mechanism. There is a clear need for much better spatially extensive and detailed observations of all these variables. Given the limited temporal and spatial coverage of our study, such inferences are necessarily speculative and a full and rigorous analysis of SHL variability in response to advective and radiative drivers would require further analysis.
We can therefore envisage an inherent tendency for pulsing in the SHL in which an intensifying SHL will lead towards monsoon surges, which act through near-surface/low-level radiative and advective cooling to weaken the SHL and through dust radiative heating to stabilise the PBL, until dust deposition and export allow rewarming of the surface to reinvigorate the SHL.
Given the radiative effects described above, the dynamical effects of dust variability on the low-level convergence and mid-level divergence circulations will be greater than those of water vapour and require further model experiments to resolve. Whilst reanalysis models represent well the average radiative and heating effect of dust and water vapour, they do not capture dust and water vapour variability well and the subsequent dynamical effects on the larger-scale circulation.
The unique observations of the Fennec aircraft campaign suggested that fresh dust is much coarser than previously believed (Ryder et al., 2013b), with corresponding higher absorption, and this has significant impacts on the radiation budget (Kok et al., 2017). Our RT model simulations results suggest that such a dominant coarse mode is not consistent with TOA radiative flux observations at BBM. However, if dust is coarser, then we assume here that the radiative effects of dust would be even stronger. Further observations on dust size distribution and optical properties are a priority requirement. In addition, further work should consider in much greater detail the radiative effects of clouds based on detailed observations rather than the rather coarse estimates from reanalysis used here.
Our results showing the complex interplay of dust and water vapour on surface and PBL radiative heating stress the need for improved modelling of these processes over the SHL region to improve predictions, including those for the west African monsoon across timescales (e.g. Evan et al., 2015). Most models currently struggle in regard to short-term variability in water vapour (Birch et al., 2014; Garcia-Carreras et al., 2013; Marsham et al., 2013a; Roberts et al., 2015), clouds (Roehrig et al., 2013; Stein et al., 2015) and dust (Evan et al., 2014), with many dust errors coming from moist convection (Heinold et al., 2013; Marsham et al., 2011). Forecast models typically have mean biases of up to 2 kg m−2 in column-integrated water vapour (equivalent to change in 2.6 W m−2 TOA net flux) and lack variability in dust, and thus are expected to poorly represent these couplings. A focus on improved representation of advection of water vapour, clouds, and convection in models should be a priority.
This paper has provided insight into the separate and combined roles of water vapour and dust in controlling the variability of the summertime radiative flux and heating rate over the SHL region. We recognise that generalising across all the SHL region for all summer months is problematic from one particular point and the short period of our study. Furthermore, there still remains uncertainty in the input dataset which includes surface characteristics and clouds. It is therefore necessary to have a more comprehensive dataset to reduce these uncertainties and thus improve quantitative results. Further research is thus necessary to confirm the results of our limited study, spanning a longer period of time and bigger domain.
The datasets used in this study are publicly available at the following websites.
-
AERONET: https://aeronet.gsfc.nasa.gov/
-
FENNEC and GERB: http://data.ceda.ac.uk/
-
MERRA: https://disc.sci.gsfc.nasa.gov/datasets?keywords= MERRA
-
Radiative transfer code used in this study is available at https://code.metoffice.gov.uk/trac/home
Additional materials including outputs produced in this study are available upon request from the corresponding author, Netsanet Alamirew (n.alamirew@sussex.ac.uk or netsanet.kassa@gmail.com).
The supplement related to this article is available online at: https://doi.org/10.5194/acp-18-1241-2018-supplement.
The authors declare that they have no conflict of interest.
This article is part of the special issue “Anthropogenic dust and its climate impact”. It does not belong to a conference.
This research was funded through the Peter Carpenter African Climate
scholarship, further supported by UK NERC consortium grant NE/G01826X/1. We
would like to acknowledge data provided from NERC-funded Fennec project.
Helen Brindley has given us constructive suggestions that were important to
complete this research. We thank Jamie Banks for providing processed GERB
TOA radiation data and Adriana Rocha-Lima for providing nephelometer-measured
dust optical property data. We would like to thank Azzendine
Saci, Abdelkader Ouladichir, Bouzianne Ouchene, Mohammed Salah-Ferroudj,
Benyakoub Abderrahmane, Mohammmed Limam, Diali Sidali (ONM), and Richard
Washington (University of Oxford) for their contributions to setting up
running the Fennec supersite, and everyone at ONM Algeria for their
patience and hospitality during Fennec. We would like to thank the AERONET
PHOTONS team for their assistance with the Cimel sun photometer. The authors
also would like to thank Eleanor Highwood for facilitating access to the
computational cluster at the Department of Meteorology at the University of
Reading.
Edited by: Jianping Huang
Reviewed by: three anonymous referees
Alamirew, N. K., Todd M., Washington R., and Wang, Y.: The Heat and Moisture budget over the Saharan Heat Low, in review, 2018.
Anderson, G. P., Clough, S. A., Kneizys, F. X., Chetwyn, J. H., and Shettle, E. P.: Atmospheric constituent profiles (0–120 km), Technical Report AFGL-TR-86-0110, AFGL (OPI), Hanscom AFB, MA, 01736, 1986.
Ansell, C., Brindley, H. E., Pradhan, Y., and Saunders, R.: Mineral dust aerosol net direct radiative effect during GERBILS field campaign period derived from SEVIRI and GERB, J. Geophys. Res.-Atmos., 119, 4070–4086, 2014.
Banks, J. R. and Brindley, H. E.: Evaluation of MSG-SEVIRI mineral dust retrieval products over North Africa and the Middle East, Remote Sens. Environ., 128, 58–73, 2013.
Banks, J. R., Brindley, H. E., Hobby, M., and Marsham, J. H.: The daytime cycle in dust aerosol direct radiative effects observed in the central Sahara during the Fennec campaign in June 2011, J. Geophys. Res.-Atmos., 119, 13861–13876, 2014.
Birch, C. E., Marsham, J. H., Parker, D. J., and Taylor, C. M.: The scale dependence and structure of convergence fields preceding the initiation of deep convection, Geophys. Res. Lett., 41, 4769–4776, 2014.
Chauvin, F., Roehrig, R., and Lafore, J. P.: Intraseasonal Variability of the Saharan Heat Low and Its Link with Midlatitudes, J. Climate, 23, 2544–2561, 2010.
Couvreux, F., Guichard, F., Bock, O., Campistron, B., Lafore, J. P., and Redelsperger, J. L.: Synoptic variability of the monsoon flux over West Africa prior to the onset, Q. J. Roy. Meteor. Soc., 136, 159–173, 2010.
Dee, D. P., Uppala, S. M., Simmons, A. J., Berrisford, P., Poli, P., Kobayashi, S., Andrae, U., Balmaseda, M. A., Balsamo, G., Bauer, P., Bechtold, P., Beljaars, A. C. M., van de Berg, L., Bidlot, J., Bormann, N., Delsol, C., Dragani, R., Fuentes, M., Geer, A. J., Haimberger, L., Healy, S. B., Hersbach, H., Holm, E. V., Isaksen, L., Kallberg, P., Kohler, M., Matricardi, M., McNally, A. P., Monge-Sanz, B. M., Morcrette, J. J., Park, B. K., Peubey, C., de Rosnay, P., Tavolato, C., Thepaut, J. N., and Vitart, F.: The ERA-Interim reanalysis: configuration and performance of the data assimilation system, Q. J. Roy. Meteor. Soc., 137, 553–597, 2011.
Dong, B. W. and Sutton, R.: Dominant role of greenhouse-gas forcing in the recovery of Sahel rainfall, Nat. Clim. Change, 5, 757–U173, 2015.
Dubovik, O., Holben, B., Eck, T. F., Smirnov, A., Kaufman, Y. J., King, M. D., Tanre, D., and Slutsker, I.: Variability of absorption and optical properties of key aerosol types observed in worldwide locations, J. Atmos. Sci., 59, 590–608, 2002.
Edwards, J. M. and Slingo, A.: Studies with a flexible new radiation code .1. Choosing a configuration for a large-scale model, Q. J. Roy. Meteor. Soc., 122, 689–719, 1996.
Evan, A. T., Flamant, C., Fiedler, S., and Doherty, O.: An analysis of aeolian dust in climate models, Geophys. Res. Lett., 41, 5996–6001, 2014.
Evan, A. T., Fiedler, S., Zhao, C., Menut, L., Schepanski, K., Flamant, C., and Doherty, O.: Derivation of an observation-based map of North African dust emission, Aeolian Res., 16, 153–162, 2015a.
Evan, A. T., Flamant, C., Lavaysse, C., Kocha, C., and Saci, A.: Water Vapor-Forced Greenhouse Warming over the Sahara Desert and the Recent Recovery from the Sahelian Drought, J. Climate, 28, 108–123, 2015b.
Garcia-Carreras, L., Marsham, J. H., Parker, D. J., Bain, C. L., Milton, S., Saci, A., Salah-Ferroudj, M., Ouchene, B., and Washington, R.: The impact of convective cold pool outflows on model biases in the Sahara, Geophys. Res. Lett., 40, 1647–1652, 2013.
Greed, G., Haywood, J. M., Milton, S., Keil, A., Christopher, S., Gupta, P., and Highwood, E. J.: Aerosol optical depths over North Africa: 2. Modeling and model validation, J. Geophys. Res.-Atmos., 113, D00C05, https://doi.org/10.1029/2007JD009457, 2008.
Harries, J. E., Russell, J. E., Hanafin, J. A., Brindley, H., Futyan, J., Rufus, J., Kellock, S., Matthews, G., Wrigley, R., Last, A., Mueller, J., Mossavati, R., Ashmall, J., Sawyer, E., Parker, D., Caldwell, M., Allan, P. M., Smith, A., Bates, M. J., Coan, B., Stewart, B. C., Lepine, D. R., Cornwall, L. A., Corney, D. R., Ricketts, M. J., Drummond, D., Smart, D., Cutler, R., Dewitte, S., Clerbaux, N., Gonzalez, L., Ipe, A., Bertrand, C., Joukoff, A., Crommelynck, D., Nelms, N., Llewellyn-Jones, D. T., Butcher, G., Smith, G. L., Szewczyk, Z. P., Mlynczak, P. E., Slingo, A., Allan, R. P., and Ringer, M. A.: The geostationary Earth Radiation Budget Project, B. Am. Meteorol. Soc., 86, 945–960, https://doi.org/10.1175/BAMS-86-7-945, 2005.
Heinold, B., Knippertz, P., Marsham, J. H., Fiedler, S., Dixon, N. S., Schepanski, K., Laurent, B., and Tegen, I.: The role of deep convection and nocturnal low-level jets for dust emission in summertime West Africa: Estimates from convection-permitting simulations, J. Geophys. Res.-Atmos., 118, 4385–4400, 2013.
Holben, B. N., Eck, T. F., Slutsker, I., Tanre, D., Buis, J. P., Setzer, A., Vermote, E., Reagan, J. A., Kaufman, Y. J., Nakajima, T., Lavenu, F., Jankowiak, I., and Smirnov, A.: AERONET – A federated instrument network and data archive for aerosol characterization, Remote Sens. Environ., 66, 1–16, 1998.
Huang, J. P., Wang, T. H., Wang, W. C., Li, Z. Q., and Yan, H. R.: Climate effects of dust aerosols over East Asian arid and semiarid regions, J. Geophys. Res.-Atmos., 119, 11398–11416, 2014.
Knippertz, P. and Todd, M. C.: Mineral Dust Aerosols over the Sahara: Meteorological Controls on Emission and Transport and Implications for Modeling, Rev. Geophys., 50, RG1007, https://doi.org/10.1029/2011RG000362, 2012.
Kok, J. F., Ridley, D. A., Zhou, Q., Miller, R. L., Zhao, C., Heald, C. L., and Haustein, K.: Smaller desert dust cooling effect estimated from analysis of dust size and abundance, Nat. Geosci., 10, 274, https://doi.org/10.1038/ngeo2912, 2017.
Lafore, J. P., Flamant, C., Giraud, V., Guichard, F., Knippertz, P., Mahfouf, J. F., Mascart, P., and Williams, E. R.: Introduction to the AMMA Special Issue on “Advances in understanding atmospheric processes over West Africa through the AMMA field campaign”, Q. J. Roy. Meteor. Soc., 136, 2–7, 2010.
Lavaysse, C., Flamant, C., Janicot, S., Parker, D. J., Lafore, J. P., Sultan, B., and Pelon, J.: Seasonal evolution of the West African heat low: a climatological perspective, Clim. Dynam., 33, 313–330, 2009.
Lavaysse, C., Flamant, C., Evan, A., Janicot, S., and Gaetani, M.: Recent climatological trend of the Saharan heat low and its impact on the West African climate, Clim. Dynam., 47, 3479–3498, https://doi.org/10.1007/s00382-015-2847-z, 2016.
Liu, Z. Y., Vaughan, M., Winker, D., Kittaka, C., Getzewich, B., Kuehn, R., Omar, A., Powell, K., Trepte, C., and Hostetler, C.: The CALIPSO Lidar Cloud and Aerosol Discrimination: Version 2 Algorithm and Initial Assessment of Performance, J. Atmos. Ocean. Tech., 26, 1198–1213, 2009.
Marsham, J. H., Parker, D. J., Grams, C. M., Taylor, C. M., and Haywood, J. M.: Uplift of Saharan dust south of the intertropical discontinuity, J. Geophys. Res.-Atmos., 113, D21102, https://doi.org/10.1029/2008JD009844, 2008.
Marsham, J. H., Knippertz, P., Dixon, N. S., Parker, D. J., and Lister, G. M. S.: The importance of the representation of deep convection for modeled dust-generating winds over West Africa during summer, Geophys. Res. Lett., 38, L16803, https://doi.org/10.1029/2011GL048368, 2011.
Marsham, J. H., Dixon, N. S., Garcia-Carreras, L., Lister, G. M. S., Parker, D. J., Knippertz, P., and Birch, C. E.: The role of moist convection in the West African monsoon system: Insights from continental-scale convection-permitting simulations, Geophys. Res. Lett., 40, 1843–1849, 2013a.
Marsham, J. H., Hobby, M., Allen, C. J. T., Banks, J. R., Bart, M., Brooks, B. J., Cavazos-Guerra, C., Engelstaedter, S., Gascoyne, M., Lima, A. R., Martins, J. V., McQuaid, J. B., O'Leary, A., Ouchene, B., Ouladichir, A., Parker, D. J., Saci, A., Salah-Ferroudj, M., Todd, M. C., and Washington, R.: Meteorology and dust in the central Sahara: Observations from Fennec supersite-1 during the June 2011 Intensive Observation Period, J. Geophys. Res.-Atmos., 118, 4069–4089, 2013b.
Marsham, J. H., Parker, D. J., Todd, M. C., Banks, J. R., Brindley, H. E., Garcia-Carreras, L., Roberts, A. J., and Ryder, C. L.: The contrasting roles of water and dust in controlling daily variations in radiative heating of the summertime Saharan heat low, Atmos. Chem. Phys., 16, 3563–3575, https://doi.org/10.5194/acp-16-3563-2016, 2016.
Martin, E. R. and Thorncroft, C.: Sahel rainfall in multimodel CMIP5 decadal hindcasts, Geophys. Res. Lett., 41, 2169–2175, 2014.
Martin, E. R., Thorncroft, C., and Booth, B. B. B.: The Multidecadal Atlantic SST-Sahel Rainfall Teleconnection in CMIP5 Simulations, J. Climate, 27, 784–806, 2014.
Messager, C., Parker, D. J., Reitebuch, O., Agusti-Panareda, A., Taylor, C. M., and Cuesta, J.: Structure and dynamics of the Saharan atmospheric boundary layer during the West African monsoon onset: Observations and analyses from the research flights of 14 and 17 July 2006, Q. J. Roy. Meteor. Soc., 136, 107–124, 2010.
Mulcahy, J. P., Walters, D. N., Bellouin, N., and Milton, S. F.: Impacts of increasing the aerosol complexity in the Met Office global numerical weather prediction model, Atmos. Chem. Phys., 14, 4749–4778, https://doi.org/10.5194/acp-14-4749-2014, 2014.
Osborne, S. R., Baran, A. J., Johnson, B. T., Haywood, J. M., Hesse, E., and Newman, S.: Short-wave and long-wave radiative properties of Saharan dust aerosol, Q. J. Roy. Meteor. Soc., 137, 1149–1167, 2011.
Osipov, S., Stenchikov, G., Brindley, H., and Banks, J.: Diurnal cycle of the dust instantaneous direct radiative forcing over the Arabian Peninsula, Atmos. Chem. Phys., 15, 9537–9553, https://doi.org/10.5194/acp-15-9537-2015, 2015.
Otto, S., de Reus, M., Trautmann, T., Thomas, A., Wendisch, M., and Borrmann, S.: Atmospheric radiative effects of an in situ measured Saharan dust plume and the role of large particles, Atmos. Chem. Phys., 7, 4887–4903, https://doi.org/10.5194/acp-7-4887-2007, 2007.
Otto, S., Bierwirth, E., Weinzierl, B., Kandler, K., Esselborn, M., Tesche, M., Schladitz, A., Wendisch, M., and Trautmann, T.: Solar radiative effects of a Saharan dust plume observed during SAMUM assuming spheroidal model particles, Tellus B, 61, 270–296, 2009.
Otto, S., Trautmann, T., and Wendisch, M.: On realistic size equivalence and shape of spheroidal Saharan mineral dust particles applied in solar and thermal radiative transfer calculations, Atmos. Chem. Phys., 11, 4469–4490, https://doi.org/10.5194/acp-11-4469-2011, 2011.
Parker, D. J., Burton, R. R., Diongue-Niang, A., Ellis, R. J., Felton, M., Taylor, C. M., Thorncroft, C. D., Bessemoulin, P., and Tompkins, A. M.: The diurnal cycle of the West African monsoon circulation, Q. J. Roy. Meteor. Soc., 131, 2839–2860, 2005.
Peyrille, P. and Lafore, J. P.: An idealized two-dimensional framework to study the West African monsoon. Part II: Large-scale advection and the diurnal cycle, J. Atmos. Sci., 64, 2783–2803, 2007.
Randles, C. A., Kinne, S., Myhre, G., Schulz, M., Stier, P., Fischer, J., Doppler, L., Highwood, E., Ryder, C., Harris, B., Huttunen, J., Ma, Y., Pinker, R. T., Mayer, B., Neubauer, D., Hitzenberger, R., Oreopoulos, L., Lee, D., Pitari, G., Di Genova, G., Quaas, J., Rose, F. G., Kato, S., Rumbold, S. T., Vardavas, I., Hatzianastassiou, N., Matsoukas, C., Yu, H., Zhang, F., Zhang, H., and Lu, P.: Intercomparison of shortwave radiative transfer schemes in global aerosol modeling: results from the AeroCom Radiative Transfer Experiment, Atmos. Chem. Phys., 13, 2347–2379, https://doi.org/10.5194/acp-13-2347-2013, 2013.
Ridley, D. A., Heald, C. L., and Ford, B.: North African dust export and deposition: A satellite and model perspective, J. Geophys. Res.-Atmos., 117, D02202, https://doi.org/10.1029/2011JD016794, 2012.
Rienecker, M. M., Suarez, M. J., Gelaro, R., Todling, R., Bacmeister, J., Liu, E., Bosilovich, M. G., Schubert, S. D., Takacs, L., Kim, G. K., Bloom, S., Chen, J. Y., Collins, D., Conaty, A., Da Silva, A., Gu, W., Joiner, J., Koster, R. D., Lucchesi, R., Molod, A., Owens, T., Pawson, S., Pegion, P., Redder, C. R., Reichle, R., Robertson, F. R., Ruddick, A. G., Sienkiewicz, M., and Woollen, J.: MERRA: NASA's Modern-Era Retrospective Analysis for Research and Applications, J. Climate, 24, 3624–3648, 2011.
Roberts, A. J., Marsham, J. H., and Knippertz, P.: Disagreements in Low-Level Moisture between (Re)Analyses over Summertime West Africa, Mon. Weather Rev., 143, 1193–1211, 2015.
Rocha-Lima, A., Martins, J. V., Remer, L. A., Todd, M., Marsham, J. H., Engelstaedter, S., Ryder, C. L., Cavazos-Guerra, C., Artaxo, P., Colarco, P., and Washington, R.: A detailed characterization of the Saharan dust collected during the Fennec Campaign in 2011: in situ ground-based and laboratory measurements, Atmos. Chem. Phys. Discuss., https://doi.org/10.5194/acp-2017-279, in review, 2017.
Roehrig, R., Bouniol, D., Guichard, F., Hourdin, F., and Redelsperger, J. L.: The Present and Future of the West African Monsoon: A Process-Oriented Assessment of CMIP5 Simulations along the AMMA Transect, J. Climate, 26, 6471–6505, 2013.
Ryder, C. L., Highwood, E. J., Lai, T. M., Sodemann, H., and Marsham, J. H.: Impact of atmospheric transport on the evolution of microphysical and optical properties of Saharan dust, Geophys. Res. Lett., 40, 2433–2438, 2013a.
Ryder, C. L., Highwood, E. J., Rosenberg, P. D., Trembath, J., Brooke, J. K., Bart, M., Dean, A., Crosier, J., Dorsey, J., Brindley, H., Banks, J., Marsham, J. H., McQuaid, J. B., Sodemann, H., and Washington, R.: Optical properties of Saharan dust aerosol and contribution from the coarse mode as measured during the Fennec 2011 aircraft campaign, Atmos. Chem. Phys., 13, 303–325, https://doi.org/10.5194/acp-13-303-2013, 2013b.
Ryder, C. L., McQuaid, J. B., Flamant, C., Rosenberg, P. D., Washington, R., Brindley, H. E., Highwood, E. J., Marsham, J. H., Parker, D. J., Todd, M. C., Banks, J. R., Brooke, J. K., Engelstaedter, S., Estelles, V., Formenti, P., Garcia-Carreras, L., Kocha, C., Marenco, F., Sodemann, H., Allen, C. J. T., Bourdon, A., Bart, M., Cavazos-Guerra, C., Chevaillier, S., Crosier, J., Darbyshire, E., Dean, A. R., Dorsey, J. R., Kent, J., O'Sullivan, D., Schepanski, K., Szpek, K., Trembath, J., and Woolley, A.: Advances in understanding mineral dust and boundary layer processes over the Sahara from Fennec aircraft observations, Atmos. Chem. Phys., 15, 8479–8520, https://doi.org/10.5194/acp-15-8479-2015, 2015.
Slingo, A., Ackerman, T. P., Allan, R. P., Kassianov, E. I., McFarlane, S. A., Robinson, G. J., Barnard, J. C., Miller, M. A., Harries, J. E., Russell, J. E., and Dewitte, S.: Observations of the impact of a major Saharan dust storm on the atmospheric radiation balance, Geophys. Res. Lett., 33, L24817, https://doi.org/10.1029/2006GL027869, 2006.
Stein, T. H. M., Parker, D. J., Hogan, R. J., Birch, C. E., Holloway, C. E., Lister, G. M. S., Marsham, J. H., and Woolnough, S. J.: The representation of the West African monsoon vertical cloud structure in the Met Office Unified Model: an evaluation with CloudSat, Q. J. Roy. Meteor. Soc., 141, 3312–3324, 2015.
Sultan, B. and Janicot, S.: The West African monsoon dynamics. Part II: The “preonset” and “onset” of the summer monsoon, J. Climate, 16, 3407–3427, 2003.
Thorncroft, C. D. and Blackburn, M.: Maintenance of the African easterly jet, Q. J. Roy. Meteor. Soc., 125, 763–786, 1999.
Todd, M. C. and Cavazos-Guerra, C.: Dust aerosol emission over the Sahara during summertime from Cloud-Aerosol Lidar with Orthogonal Polarization (CALIOP) observations, Atmos. Environ., 128, 147–157, 2016.
Todd, M. C., Allen, C. J. T., Bart, M., Bechir, M., Bentefouet, J., Brooks, B. J., Cavazos-Guerra, C., Clovis, T., Deyane, S., Dieh, M., Engelstaedter, S., Flamant, C., Garcia-Carreras, L., Gandega, A., Gascoyne, M., Hobby, M., Kocha, C., Lavaysse, C., Marsham, J. H., Martins, J. V., McQuaid, J. B., Ngamini, J. B., Parker, D. J., Podvin, T., Rocha-Lima, A., Traore, S., Wang, Y., and Washington, R.: Meteorological and dust aerosol conditions over the western Saharan region observed at Fennec Supersite-2 during the intensive observation period in June 2011, J. Geophys. Res.-Atmos., 118, 8426–8447, 2013.
Trzeciak, T. M., Garcia-Carreras, L., and Marsham, J. H.: Cross-Saharan transport of water vapor via recycled cold pool outflows from moist convection, Geophys. Res. Lett., 44, 1554–1563, 2017.
Wielicki, B. A.: Clouds and the Earth's radiant energy system (CERES): An earth observing system experiment (vol 77, pg 860, 1996), B. Am. Meteorol. Soc., 77, 1590–1590, 1996.
Winker, D. M., Vaughan, M. A., Omar, A., Hu, Y. X., Powell, K. A., Liu, Z. Y., Hunt, W. H., and Young, S. A.: Overview of the CALIPSO Mission and CALIOP Data Processing Algorithms, J. Atmos. Ocean. Tech., 26, 2310–2323, 2009.
Xue, Y. K., De Sales, F., Lau, W. K. M., Boone, A., Feng, J. M., Dirmeyer, P., Guo, Z. C., Kim, K. M., Kitoh, A., Kumar, V., Poccard-Leclercq, I., Mahowald, N., Moufouma-Okia, W., Pegion, P., Rowell, D. P., Schemm, J., Schubert, S. D., Sealy, A., Thiaw, W. M., Vintzileos, A., Williams, S. F., and Wu, M. L. C.: Intercomparison and analyses of the climatology of the West African Monsoon in the West African Monsoon Modeling and Evaluation project (WAMME) first model intercomparison experiment, Clim. Dynam., 35, 3–27, 2010.
Yang, E. S., Gupta, P., and Christopher, S. A.: Net radiative effect of dust aerosols from satellite measurements over Sahara, Geophys. Res. Lett., 36, L18812, https://doi.org/10.1029/2009GL039801, 2009.