the Creative Commons Attribution 4.0 License.
the Creative Commons Attribution 4.0 License.
 | 27 Aug 2018
Wintertime photochemistry in Beijing: observations of ROx radical concentrations in the North China Plain during the BEST-ONE campaign
Zhaofeng Tan
Franz Rohrer
Xuefei Ma
Birger Bohn
Sebastian Broch
Huabin Dong
Hendrik Fuchs
Georgios I. Gkatzelis
Andreas Hofzumahaus
Frank Holland
Yuhan Liu
Anna Novelli
Min Shao
Haichao Wang
Yusheng Wu
Limin Zeng
Astrid Kiendler-Scharr
Andreas Wahner
Yuanhang Zhang
The first wintertime in situ measurements of hydroxyl (OH), hydroperoxy (HO2) and organic peroxy (RO2) radicals (ROx in combination with observations of total reactivity of OH radicals, kOH in Beijing are presented. The field campaign “Beijing winter finE particle STudy – Oxidation, Nucleation and light Extinctions” (BEST-ONE) was conducted at the suburban site Huairou near Beijing from January to March 2016. It aimed to understand oxidative capacity during wintertime and to elucidate the secondary pollutants' formation mechanism in the North China Plain (NCP). OH radical concentrations at noontime ranged from in severely polluted air ( to in relatively clean air (. These values are nearly 2-fold larger than OH concentrations observed in previous winter campaigns in Birmingham, Tokyo, and New York City. During this campaign, the total primary production rate of ROx radicals was dominated by the photolysis of nitrous acid accounting for 46 % of the identified primary production pathways for ROx radicals. Other important radical sources were alkene ozonolysis (28 %) and photolysis of oxygenated organic compounds (24 %). A box model was used to simulate the OH, HO2 and RO2 concentrations based on the observations of their long-lived precursors. The model was capable of reproducing the observed diurnal variation of the OH and peroxy radicals during clean days with a factor of 1.5. However, it largely underestimated HO2 and RO2 concentrations by factors up to 5 during pollution episodes. The HO2 and RO2 observed-to-modeled ratios increased with increasing NO concentrations, indicating a deficit in our understanding of the gas-phase chemistry in the high NOx regime. The OH concentrations observed in the presence of large OH reactivities indicate that atmospheric trace gas oxidation by photochemical processes can be highly effective even during wintertime, thereby facilitating the vigorous formation of secondary pollutants.
- Article
(7945 KB) - Full-text XML
-
Supplement
(364 KB) - BibTeX
- EndNote


Air quality improvement has become a hot topic in China from citizens to government. Therefore, a series of air pollution control provisions have been implemented by the Chinese government in the last 15 years to improve the air quality in China since early 2000. As a result, emissions and concentrations of primary pollutants (sulfur dioxide, nitrogen oxide, and coarse particles) have been showing a fast decreasing trend nation wide in recent years (Kan et al., 2012). However, secondary pollution characterized by high concentrations of ozone and fine particles (PM2.5) has now become the major concern. In particular, severe pollution events (haze) frequently happened in winter of the last few years, with very poor visibility and extremely high concentrations of PM2.5, secondary aerosol, and its precursors (Sun et al., 2006; Yang et al., 2011; Guo et al., 2014; Zhao et al., 2013).
The OH radical is the major atmospheric oxidizing agent during the daytime, converting primary pollutants to secondary ones. OH radicals initiate the oxidation of pollutants, e.g., CO, non-methane hydrocarbons (NMHCs), producing peroxy radicals (HO2+RO2), which can regenerate OH by their reaction with NO. Within this ROx cycling, primary pollutants are converted to secondary pollutants, e.g., to CO2, H2SO4, HNO3, and oxygenated organic compounds (OVOCs), some of which are important precursors for aerosol. In addition, NO is oxidized to NO2 in the reaction with peroxy radicals leading to net ozone production and NO regeneration via further photolysis. The efficient coupling of the ROx and the NOx cycles facilitates the fast degradation of primary pollutants with the disadvantage of the formation of secondary pollutants. In wintertime, the radical chemistry is less active than in summertime because the solar radiation is weaker due to the higher solar zenith angle. For example, one of the important OH primary sources, photolysis of ozone, is strongly reduced by the smaller photolysis rate and the lower water vapor abundances at low temperatures during wintertime. Global models predict OH concentrations to be on average only in northern China in January, 1 order of magnitude lower than what is predicted for summertime for the lower troposphere in northern China (Lelieveld et al., 2016). Previous field measurement also observed relative low OH concentrations ( of diurnal maximum) for urban and suburban locations in winter (Heard et al., 2004; Ren et al., 2006; Kanaya et al., 2007). The significant difference between summer and winter OH concentrations indicates the radical chemistry only plays a minor role in winter. Especially during particle pollution events, the dimming effect of aerosol will further attenuate the solar radiation and thus lower the radical chemistry activity. However, composition analysis showed the contribution of secondary components to the aerosol increase during pollution events in the NCP (Guo et al., 2014; Zhao et al., 2013; Huang et al., 2014), which suggests that oxidation plays an important role in aerosol formation. However, a rigorous test of the current understanding of radical chemistry by direct in situ measurements of ambient OH concentration is missing during wintertime in China. Therefore, the role of radicals in air pollution is unclear for wintertime, especially during heavy pollution episodes in China.
Only a handful field campaigns have been carried out in northern China to elucidate key processes of tropospheric radical chemistry (Hofzumahaus et al., 2009). In the summer of 2006, a comprehensive campaign took place at a suburban site in Beijing (Yufa), 40 km south of the center of the city (Lu et al., 2013). High concentrations of OH radicals were observed. In addition, the measured OH reactivity showed a high concentration of reactive trace gases. The combination of high OH concentration and high OH reactivity resulted in a fast formation of secondary pollutants. Box model calculations could not reproduce the ambient OH concentrations for the low NOx regime (Lu et al., 2013). In the summer of 2014, another field campaign was conducted at a rural site in the center of the NCP (Wangdu) to study the formation of secondary pollutants (Tan et al., 2017; Fuchs et al., 2017b). Also, for this environment, there is a tendency of underestimating OH for conditions when NO was less than 300 pptv. Additionally, a missing peroxy radical source was found for the high NOx regime showing a severe underestimation of local ozone production (Tan et al., 2017).
To reveal the cause of heavy air pollution episodes and the link between radical chemistry and air pollution during wintertime, a field campaign “Beijing winter finE particle STudy – Oxidation, Nucleation and light Extinctions” (BEST-ONE) was carried out at the suburban site (Huairou) in the Beijing area from January to March 2016. For the first time, concentrations of OH, HO2, and RO2 radicals, and of the reactivity of OH, kOH, were simultaneously measured in China during wintertime in addition to numerous measurements of other trace gas concentrations and aerosol properties. In this study, the ambient radical concentrations are analyzed for different chemical conditions by calculating the budget of radicals and by comparing measurements to model calculations.
2.1 Location
The BEST-ONE campaign took place at the suburban site Huairou (40.41∘ N, 116.68∘ E), 60 km northeast from the center of Beijing. Instruments were set up on the campus of the University of the Chinese Academy of Sciences (UCAS) as shown in Fig. 1. Beijing is located on the northwest edge of the NCP and is confined by the Yan Mountains from the northeast to the west. The topography of Beijing facilitates the accumulation of pollutants if southern winds carry emissions from the NCP region. The measurement site was located in a valley of the Yan Mountains, acting as an intermediary of air mass transportation from downtown Beijing. As shown in Fig. S1 in the Supplement, the concentrations of CO, NO2, SO2, and PM2.5 observed at the site showed good correlations with the measurements conducted in the city center (12 EPA stations). This demonstrates that the measurement site is a representative for conditions in the city of Beijing. In contrast, a previous field campaign that included OH–HO2–RO2 radical measurements was performed at a rural site in Wangdu in summer 2014 (Tan et al., 2017). The Wangdu site was located in the middle of the North China Plain, about 200 km southwest of Beijing. The site was mainly influenced by regional transportation of air pollutants from anthropogenic emissions (Fuchs et al., 2017b). A road with moderate traffic and a small village were located east of the university campus. Thus, local anthropogenic activities might have influenced the measurement site, especially during traffic rush hours and cooking hours.
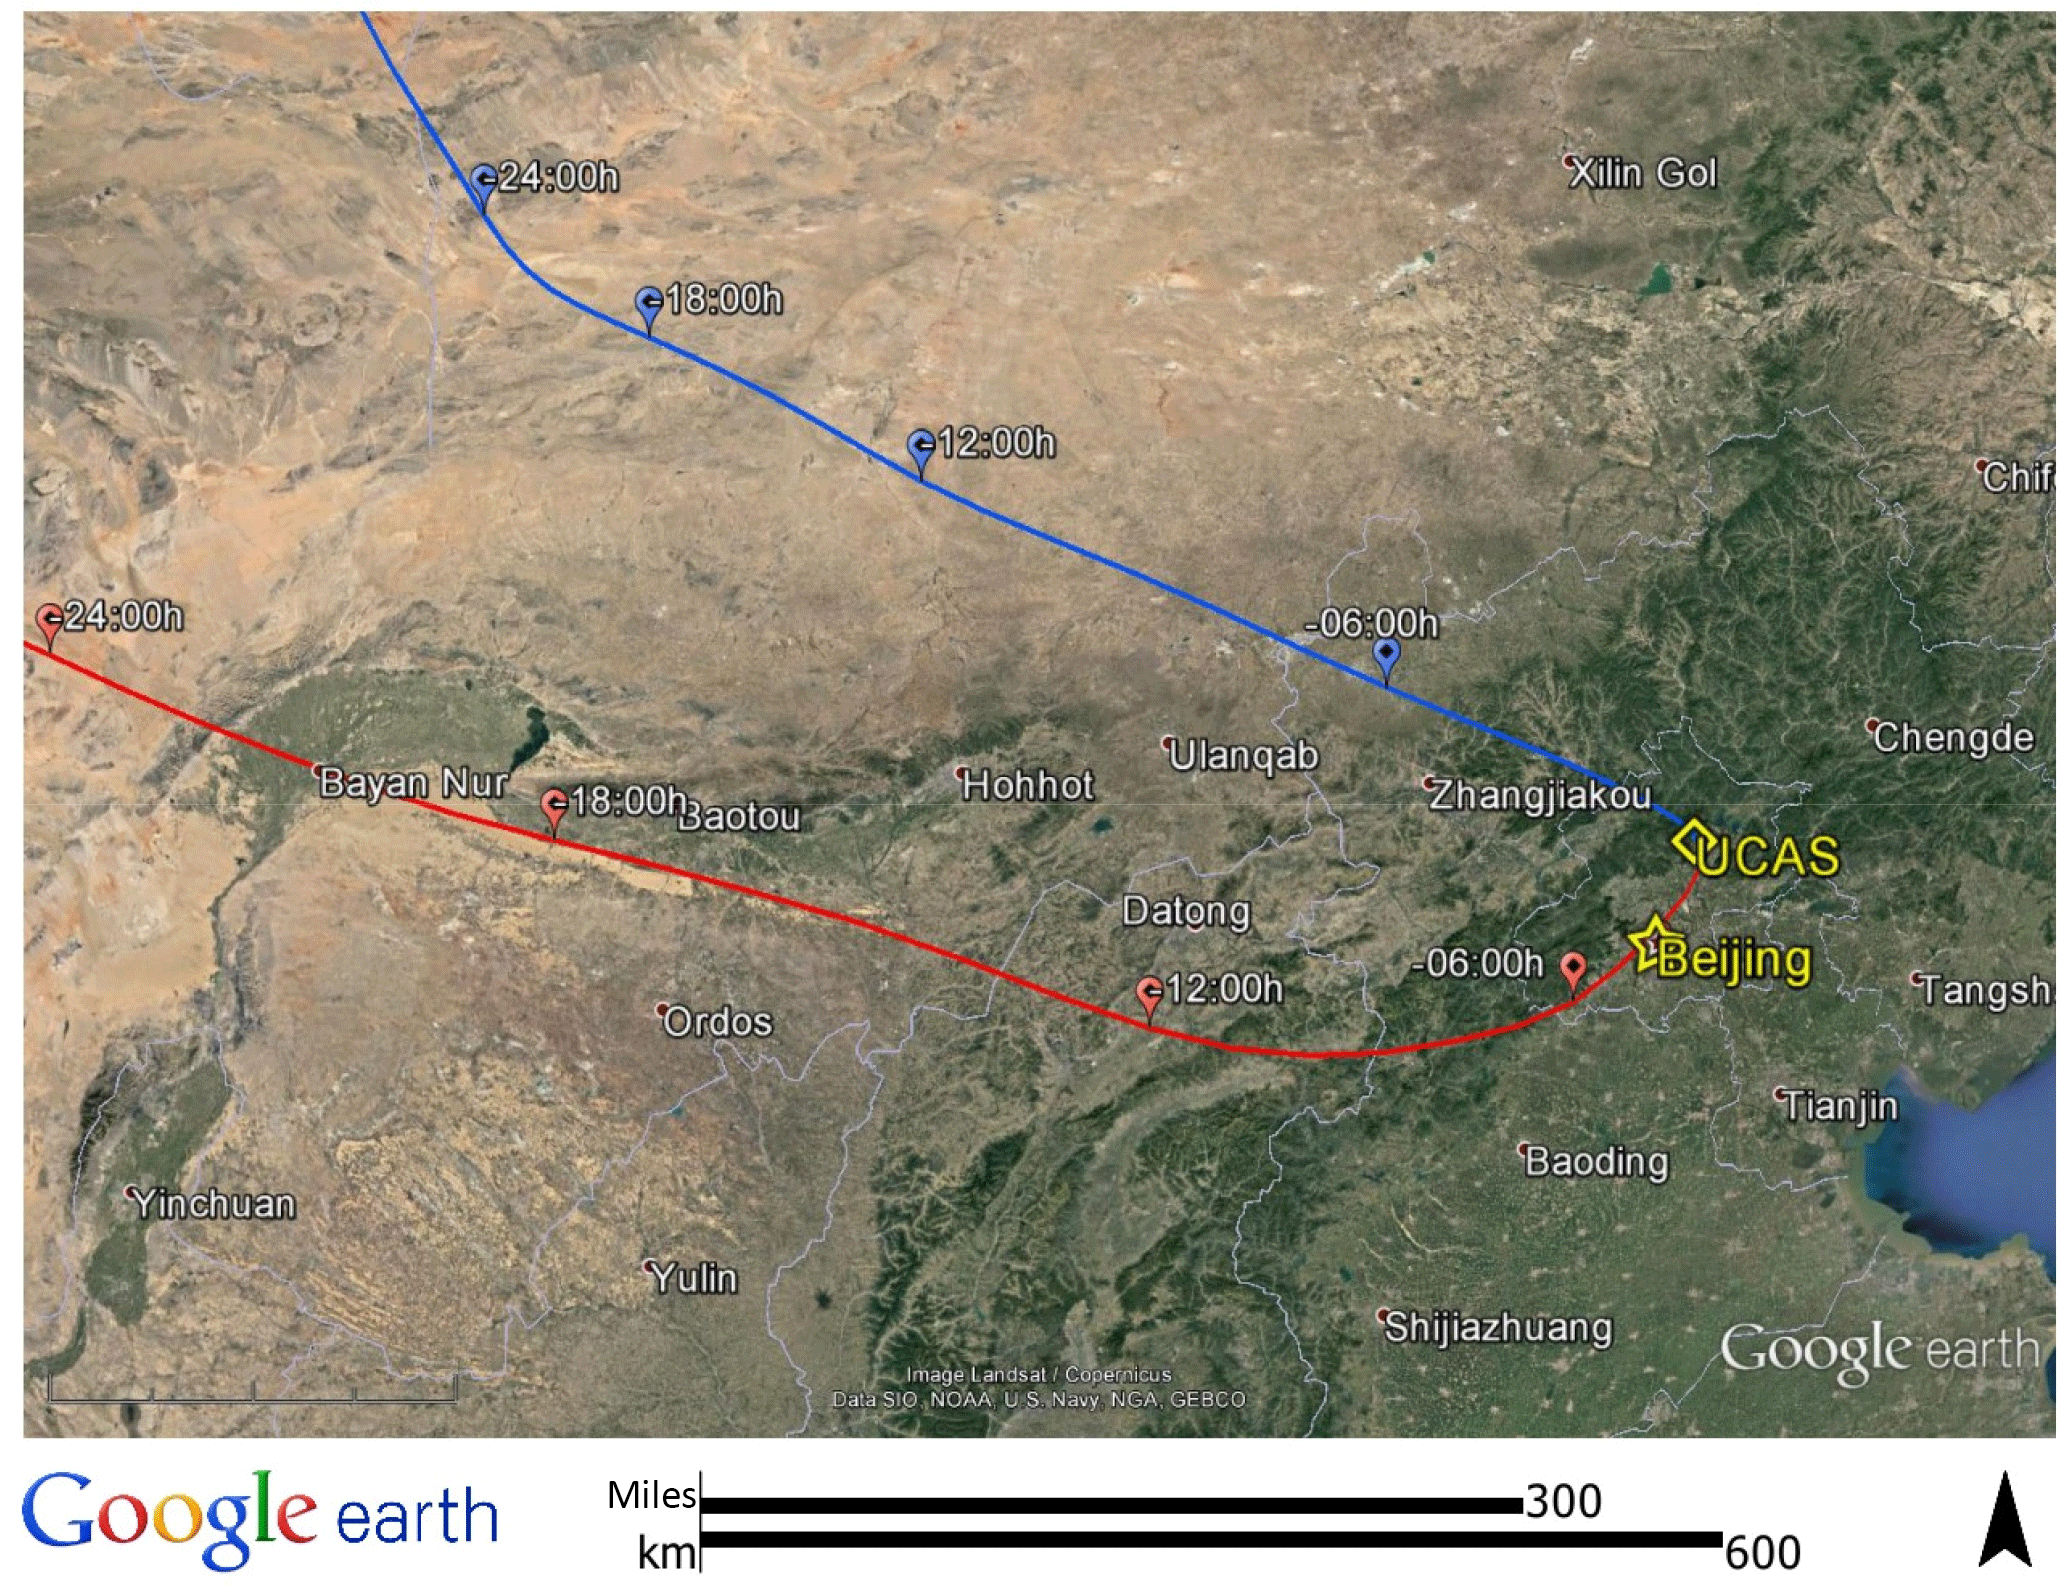
Figure 1NOAA Hybrid Single-Particle Lagrangian Integrated Trajectory (HYSPLIT) back-trajectory analysis of air masses arriving at the field site. Two typical back trajectories were chosen to show cases for clean and pollution episodes. For the clean case, the example presents 08:00 CNST on 25 February, denoted by the blue line. For the pollution case, an example for 08:00 CNST 3 March is shown by the red line.
Most instruments were placed on the top floor of a 20 m high building with their inlet lines going through the ceiling. All inlet lines were set at the same height as close as possible to each other to guarantee to sample of the same air masses. The sampling height for all inlet lines was 1.7 m above the surface of the building.
2.2 Instrumentation
2.2.1 OH, HO2, and RO2 measurements
OH was measured by a laser-induced fluorescence (LIF) system. HO2 and RO2 concentrations were detected as OH after chemical conversion by adding excess NO in another two separated cells. Detailed information on this instrument can be found in the paper by Tan et al. (2017) and the references therein. Only a brief description of the radical instrument is presented here.
Ambient air was drawn into a low-pressure cell (4 hPa) through a nozzle with 0.4 mm diameter pinhole at a rate of 1 standard liter per minute (SLM) to measure OH concentrations. The OH radicals were excited by a pulsed laser at 308 nm (repetition rate: 8.5 kHz; pulse duration at full width half maximum (FWHM): 25 ns, laser power: 20 mW). Subsequent fluorescence photons were collected by a lens system and detected by a multiple channel plate detector (Photek, PMT 325).
HO2 was converted to OH by NO addition below the sample nozzle in a second fluorescence cell that had otherwise the same design as the OH cell. To obtain the concentration of HO2, the contribution of OH to the HO2 measurements in the HO2 cell is subtracted using the measurements from the OH cell after accounting for the different sensitivities in the two cells. It is known that the measurement of HO2 by chemical conversion can be disturbed by interference from specific RO2 radicals (Fuchs et al., 2011; Whalley et al., 2013; Lew et al., 2018). The best way to reduce the interference is to decrease the NO mixing ratio in the HO2 cell (Fuchs et al., 2011; Whalley et al., 2013, 2018; Tan et al., 2017). In this study, the NO addition was reduced to minimize the RO2 interference without losing too much of the HO2 conversion. The NO concentration was switched every 2 min between the additions of 0.5 standard milliliters per minute (sccm) and of 2 sccm from a mixture of 1 % NO in N2. This yields a nominal mixing ratio of 2.5 and 10 ppmv of NO in a sample flow of 1 SLM and an N2-sheath flow of 1 SLM resulting in the HO2 conversion efficiencies being 4 % and 18 %, respectively. No significant difference was found for the two HO2 data sets showing that the HO2 measurements were interference free. Since the data interpretation in this study is in 5 min time resolution, both HO2 measurements are averaged for 5 min time intervals. The accuracy and precision refer to the 5 min averaged data set (Table 1). RO2 measurements with the LIF instrument require the conversion of RO2 to OH. This was done in two steps. In a reaction flow tube (pressure 25 hPa, volume 2.8 L, sample flow 7.5 SLM), high concentrations of CO (1100 ppm) and NO (0.7 ppmv) were added to convert ROx to HO2 (Fuchs et al., 2008). CO was added to suppress the conversion from HO2 to OH to avoid wall losses of OH radicals in the reactor. The HO2 radicals were transferred to the fluorescence cell through a nozzle pinhole with a diameter of 4.0 mm. The fluorescence cell was operated at 4 hPa like the other fluorescence cells. The HO2 radicals were finally converted to OH radicals using a flow of 5 sccm of pure NO yielding a nominal mixing ratio of 1100 ppm NO within a sample flow of 3.5 SLM and an N2-sheath flow of 1 SLM. The measurements from the other two fluorescence cells were used to calculate the contributions from OH and HO2 and subtracted to retrieve the RO2 measurements. The instruments were calibrated about every 3 days using a calibration source which generated quantifiable ROx radical concentrations (Holland et al., 2003; Fuchs et al., 2008). No significant trend was found for all determined sensitivities during the campaign. Thus, averaged sensitivities were used to derive the observed radical concentrations. The accuracies include the uncertainty of the calibration source (10 %, 1σ) and the 1σ standard deviation of the variability of individual calibration sensitivities (OH: 10 %, HO2: 13 %, RO2: 11 %). The accuracies are calculated from Gaussian error propagation of 14 %, 17 %, and 23 % for OH, HO2, and RO2, respectively.
Table 1Measured species and performance of the instruments.
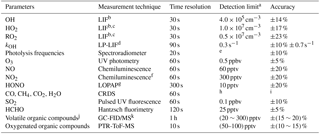
a Signal-to-noise ratio =1. b Laser-induced fluorescence. c Chemical conversion via NO reaction before detection. d Laser photolysis – laser-induced fluorescence. e Process-specific, 5 orders of magnitude lower than maximum at noon. f Photolytic conversion to NO before detection, home-built converter. g Long-path absorption photometry. h Species-specific, for CO: 1 ppbv; CH4: 1 ppbv; CO2: 25 ppbv; H2O: 0.1 % (absolute water vapor content). i Species-specific, for CO: ±1 ppbv; CH4: ±1 ppbv; CO2: ±25 ppbv; H2O: ±5 %. j VOCs including C2–C11 alkanes, C2–C6 alkenes, and C6–C10 aromatics. k Gas chromatography equipped with a mass spectrometer and a flame ionization detector.
2.2.2 Investigation of possible OH interferences by chemical modulation experiments
The LIF technique used in this and previous work discriminates OH fluorescence signals from non-resonant background signals by periodically switching the laser wavelength between positions on and off resonance with respect to an OH radical absorption line (Hofzumahaus et al., 1996). This method cannot discriminate between OH sampled in ambient air and OH produced artificially in the detection cell. A long-known interference is the laser photolysis of ozone for which the ambient OH measurements are routinely corrected (e.g., Holland et al., 2003). This ozone interference is close to the detection limit of the current instrument. Another recently discovered interference is produced by NO3 radicals, which may cause detectable OH signals if NO3 exceeds 10 pptv at night (Fuchs et al., 2016). Recently, it has been observed that artificial OH is produced in some LIF OH instruments presumably from oxidation products of biogenic VOCs (Mao et al., 2012; Novelli et al., 2014; Rickly and Stevens, 2018). Following the concept proposed by Mao et al. (2012), we applied a prototype chemical-modulation reactor (CMR) in a campaign at Wangdu, China, in summer 2014, in order to test whether the OH LIF measurements were influenced by unknown artifacts. Unexplained OH signals equivalent to were found with a systematic 1σ error of , which was less than 10 % of the ambient OH concentrations during the daytime (Tan et al., 2017).
In the present study, an improved CMR device was used for some selected time periods during clean and polluted air conditions. The device consisted of a Teflon tube with an inner diameter of 1.0 cm and a length of 8.3 cm (Fig. S2). About 20 slpm of ambient air was drawn through the tube by a blower, of which 1 slpm was sampled into the OH detection cell. In the current design, two small stainless-steel tubes (outer diameter 1/16 inches) were arranged at the entrance of the Teflon tube opposite to each other (compared to one injector in the previous version described in Tan et al., 2017). This change of the injector system design could improve the mixing of ambient air with the injected propane. Either propane diluted with nitrogen or pure nitrogen was mixed into the ambient air flow by these injectors. The propane serves as an OH scavenger, which removes ambient OH with a scavenging efficiency (ε) of 0.9 before the sampled air enters the LIF detection cell. Ambient OH signals (SCM) were determined from the signals obtained either with the addition of propane (Sprop) or pure nitrogen (SN2):
The SCM signals were then converted to OH concentrations. The required calibration and the determination of ε were performed by means of the OH calibration source before and after each chemical modulation experiment, showing a stable performance of the instrumental setup for all experiments.
For comparison, OH concentrations were calculated from the signal SWM which was obtained by wavelength modulation and corrected for the known ozone interference (SO3). The ozone photolysis is a known interference in the OH measurement using wavelength modulation (Holland et al., 2003). This interference was characterized in laboratory experiments and subtracted in OHWM. The background signal determined in the chemical modulation contains the information about interferences including that from ozone. This signal is consistent with the correction applied to the OHWM detection scheme. This can be seen, for example, in the good agreement between OHWM and OHCM during nighttime, when the ozone interference was a large fraction of the uncorrected OHWM signal. The laser wavelength was switched between on-resonance (Son) and off-resonance (Soff) modes, while the CMR was operated with pure nitrogen.
In total, four chemical modulation experiments were performed during this campaign: from 9 to 10 January, from 13 to 14 January, from 25 to 26 January, and from 29 February to 2 March. The OH instrument was switched between wavelength and chemical modulation methods on a regular basis every 2 min. In Fig. 2a, the OH measurements with wavelength modulation and chemical modulation from 13 to 14 January are shown as an example. The deviation between the two methods is not significant and is caused most likely by the noise of the OH determination. The same result is found in the other three experiments. The good agreement between the two OH measurement methods is also shown in the correlation plot (Fig. 2b). The regression is done using a bivariate regression weighted by the measurement errors of both signals. The slope of this correlation is close to unity (1.1) for the various encountered chemical conditions. A small intercept ( smaller than the detection limit) is found indicating that no significant bias in the low concentration range, e.g., for nighttime measurements. Therefore, it was concluded that the OH radical measurements performed with the Peking University laser-induced fluorescence (PKU-LIF) instrument during this study were not influenced by a significant interference for conditions encountered during the chemical modulation experiments that were representative of the entire campaign.
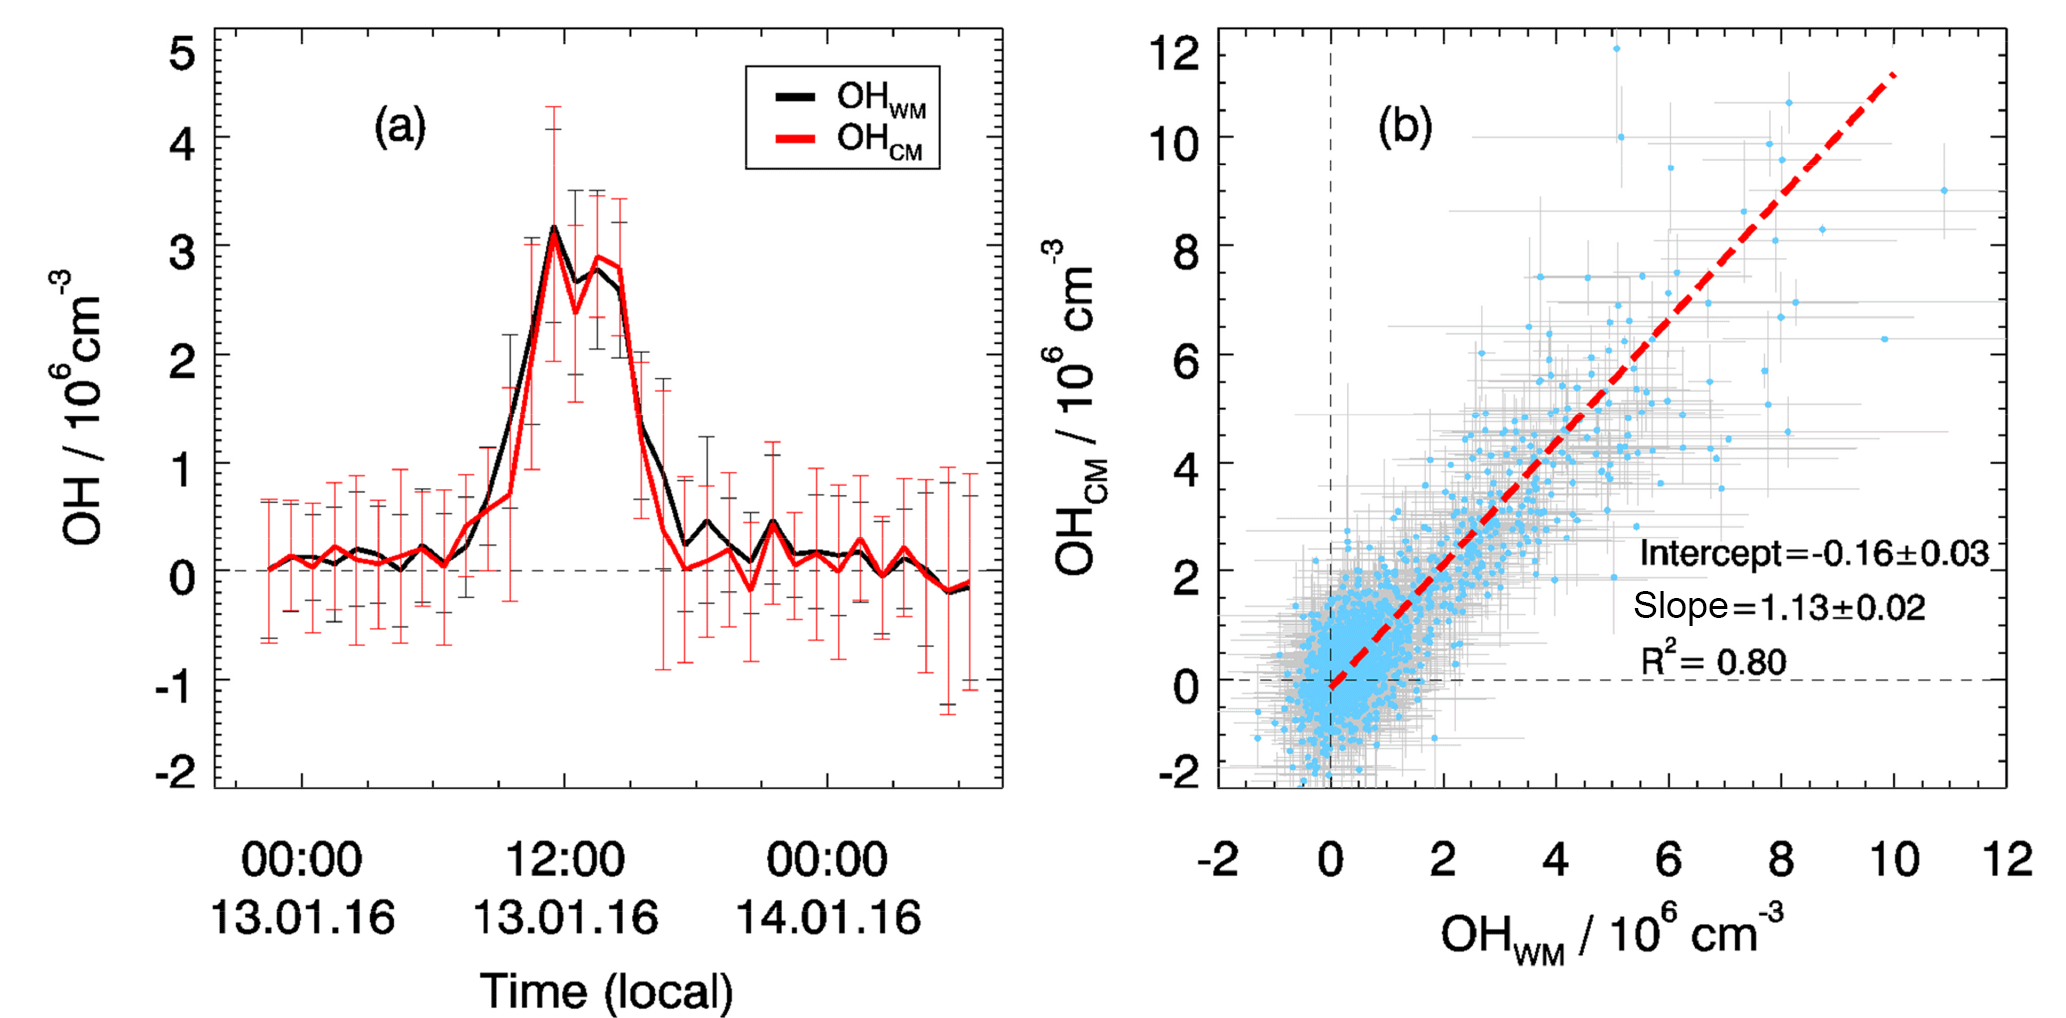
Figure 2Comparison of OH measurements using wavelength modulation (OHWM) and a chemical modulation reactor (OHCM). (a) An example of chemical modulation test measurement from 13 to 14 January. Hourly averaged results are shown where the vertical bars denote variability. (b) Correlation plot between OHWM and OHCM for all chemical modulation experiments. Data points show 5 min averaged results with horizontal and vertical lines showing 1σ variability.
2.2.3 Trace gas measurements
The instrumentation used in the present study was similar to the previous campaign in Wangdu (Tan et al., 2017). The gas-phase measurements are listed in Table 1 together with the respective instrument performance information. Total OH reactivity (kOH) is defined as the pseudo-first-order rate coefficient for OH loss calculated as the sum of all sink terms due to OH radical reactants Xi, depending on their bimolecular ambient concentrations [Xi] and their rate coefficients with OH. The observed kOH values utilized within this study were measured with an instrument based on laser photolysis – laser-induced fluorescence (LP-LIF) (Lou et al., 2010; Fuchs et al., 2017a,b). The loss of OH in the instrument resulted in a zero loss rate of (3.0±0.3) s−1. This was tested by sampling pure synthetic air without OH reactants. The zero decay value was subtracted from decay times measured during ambient sampling. During the BEST-ONE campaign, the limit of detection was 0.6 s−1 (2σ) at a time resolution of 90 s. In the presence of ambient NO higher than 20 ppbv, which was observed from time to time during the BEST-ONE campaign, bi-exponential OH decays were observed resulting from OH recycling by the reaction of HO2 with NO. It is still possible to obtain a reliable kOH measurement by assigning the faster decay time to the OH reactivity but with an overall accuracy of compared to for ambient NO concentrations <20 ppbv (Fuchs et al., 2017a). The kOH instrument itself was located in the laboratory below the roof of the building. Therefore, it can be assumed that the determined kOH values relate to a room temperature of 20 ∘C, not to ambient temperature. Sensitivity studies taking either ambient temperature or room temperature for the calculation of OH reactivity from measured OH reactant concentrations (see below) indicate that the effect of temperature differences on reaction rate constants resulted in changes in the OH reactivity of typically less than 1 % (maximum values 5 %) for conditions of this campaign.
The HONO data set used in the following model calculations is the average of the data from the Forschungszentrum Jülich long-path absorption photometry (FZJ-LOPAP) and PKU-LOPAP instruments. In general, the measurements from the two LOPAP instruments showed good agreement in the diurnal variation with a correlation coefficient of 0.96. However, the regression slope between FZJ-LOPAP and PKU-LOPAP was 0.618. A cross calibration by exchanging calibration standards during the campaign showed good agreement between the two instruments. The reason for the measurement discrepancy for ambient air remains unclear. The discrepancy between the two instruments is therefore considered as the uncertainty of the HONO measurements (±20 %, Table 1) which is larger than the usual calibration error (10 %).
NO was measured by a commercial instrument using the chemiluminescence technique (Thermo Electron model 42i NO–NO2–NOx analyzer). For NO2, a custom-built photolytic converter with a strong UV-LED at 395 nm (residence time 1 s, temperature controlled sample air to 35 ∘C, quartz surfaces when in contact with the illuminated sample air, conversion efficiency >95 %) was used to convert NO2. Ozone was measured by UV absorption (Thermo Electron model 49i). CO, CO2, CH4, and water vapor content were measured by a commercial instrument using the infrared cavity ring-down technique (Picarro model G2401). SO2 measurements were performed by a commercial instrument using pulsed UV fluorescence (Thermo Electron model 43i-TLE).
VOC measurements were performed by a gas chromatograph (GC) equipped with a mass spectrometer (MS) and a flame ionization detector (FID). The air sample was drawn into two parallel channels using a custom-built cooling device for enrichment before analysis that did not use liquid nitrogen but rather a sophisticated Peltier chiller (Wang et al., 2014). The GC-MS/FID instrument could provide measurements of C2–C11 alkanes, C2–C6 alkenes, and C6–C10 aromatics. In addition, formaldehyde (HCHO) was measured by a Hantzsch instrument (Aerolaser GmbH model AL4021). Other oxygenated VOCs were measured by a proton transfer reaction time-of-flight mass spectrometer (PTR-ToF-MS), including methyl vinyl ketone and methacrolein, acetaldehyde, and acetone.
The surface and mass concentrations of aerosols were also measured, as well as the chemical composition and optical properties, which will be presented and discussed in separate publications.
2.3 The 0-D model
A box model based on the Regional Atmospheric Chemical Mechanism version 2 (RACM2) updated with the newly proposed isoprene mechanism (Goliff et al., 2013; Peeters et al., 2014) was used to simulate the concentrations of the short-lived OH, HO2, and RO2 radicals. Measurements of photolysis frequencies, long-lived trace gases (NO, NO2, O3, HONO, CO, CH4, C2–C12 VOCs), and meteorological parameters were used to constrain the model by observations. The model was operated in a time-dependence mode with 5 min time resolution for which measurements used as constraints updated the model values. The 2-day spin-up time was used to initiate the model. Secondary species were not constrained but generated numerically by the model. A constant artificial loss rate that corresponds to an atmospheric lifetime of 24 h was used for all unconstrained species to represent the effect of unspecified physical losses such as deposition, convection, and horizontal transportation. Sensitivity tests showed that the response of the calculated ROx concentrations to changes of this artificial loss rate by a factor of 2 was less than 5 %. The validity of the approach was tested by comparing the model results to parameters which were measured during the campaign but was not used as a model constraint. The comparison for oxygenated VOCs (e.g., acetaldehyde) and PAN (Peroxyacetyl Nitrate) showed agreement within 20 % and 24 %, respectively. Furthermore, kOH and formaldehyde gave agreement within 10 %, indicating that the model approach was able to describe the long-lived oxidation products reasonably well. The uncertainty of the model calculations is derived from the uncertainties in the measurements used as model constraints and the reaction rate constants. Taking into account the 1σ uncertainties of both measurements and kinetic rate constants, a series of tests based on Monte Carlo simulations shows that the uncertainty of the model calculations is approximately 40 % (Tan et al., 2017).
3.1 Chemical and meteorological conditions
The observed trace gas concentrations were highly variable depending on the particular meteorological conditions. In Fig. 1, the Hybrid Single-Particle Lagrangian Integrated Trajectory (HYSPLIT) back-trajectory analysis (Stein et al., 2015) shows two typical air mass transportation pathways. The dominating wind direction in Beijing during wintertime is northwest from the Siberian tundra or from the Mongolian desert. The back-trajectory analysis shows that the air parcels arriving in the city of Beijing either came directly from these remote regions, bringing clean air to the UCAS site, or first reached the Beijing downtown region and then turned to the UCAS site, loaded with pollutants from the Beijing city region. As presented in Fig. 3, the CO concentration, a proxy for anthropogenic pollution, shows a distinct variation from day to day. The chemical conditions could be classified into three groups, namely background, clean, and polluted, respectively, based on observed kOH, CO, and PM2.5. The measured OH reactivity was used to separate polluted from clean periods by a threshold value of (daily average). This corresponds also to CO mixing ratios higher than 1 ppmv and PM2.5 higher than 50 µg m−3 since these parameters were highly correlated. The difference between the background and clean episodes is whether there is a diurnal variation in the CO and kOH, and PM2.5. Only 3 days (22 and 23 January and 23 February) were classified as background conditions, during which strong northern winds (wind speed up to 10 m s−1) were observed. The strong wind enhanced the dilution of pollutants coming from the Beijing region and prevented the buildup of a stable nocturnal surface layer. As shown in Fig. 4, the mean diurnal profiles of CO, NO2, HONO, and O3 were flat over most of the day. For the majority of the campaign, the wind velocity was relatively small, as reflected by the local wind speed measurements (less than 2 m s−1). Hence, although the air masses originated over the Mongolian desert or the Siberian tundra, the observations at the UCAS site were slightly influenced by local emission from the nearby village and from close-by car traffic. The time periods for these relatively clean episodes are listed in Table 2.

Figure 3Time series of measured photolysis frequencies (j(O1D), j(NO2)), ambient temperature (T), particle mass concentrations with aerodynamic diameter below 2.5 µm (PM2.5), and concentrations of absolute water vapor (H2O), CO, O3, Ox (), NO, NO2, SO2, and HONO. The grey areas denote nighttime. The labels in the first row denote the classification for background (B, green), clean (C, blue), and polluted (P, red) episodes.
The pollution episodes happened on 15, 16, 20, 21, 27, 28, 29 January, 21 February, and 1 to 4 March. The back-trajectory analysis shows that for those days the air masses were at least partly influenced by the Beijing city area which is located south of the UCAS site. In addition, the relative humidity increased from 28 % for the clean episodes to 44 % for the pollution episodes for daytime averaged conditions, suggesting that the site was influenced by humidified air from the south. The concentrations of trace gases and particle matter increased noticeably during the pollution episodes (Table 2).
Table 2Comparison of observed parameters for different episodes (24 h average values with 1σ standard deviations of ambient variabilities).
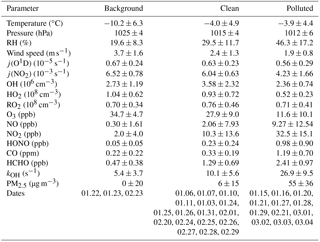
j(O1D), (NO2), HO2, and RO2 concentrations are noontime averaged values () peak values of 1 h averages.
The dissimilarities between different episodes can be easily illustrated using the mean diurnal profiles (Fig. 4). Solar radiation, indicated by the measured photolysis frequencies, e.g., j(O1D), was comparable during the background and the clean episodes but reduced by about 20 %−30 % during the pollution episodes (Table 2). NO concentrations were below 1 ppbv during the background episodes. The diurnal peak of NO (4 ppbv) appeared at 09:00 CNST during the clean episodes. During the polluted episodes, NO concentrations increased significantly to reach a maximum of 15 ppbv around sunrise. O3 remained nearly constant at 38 ppbv at all times during daytime of the background episodes, which can be regarded as a continental wintertime O3 background concentration. During clean episodes, the wind velocity was reduced, so that local NO emissions could accumulate and titrate away the ozone, especially during nighttime when vertical mixing was reduced. NO2 showed an anti-correlation with O3 because of this interconversion. Besides the titration effect, there were deposition processes and non-photochemical reactions which additionally diminished the concentration of ozone (and of NO2) in the shallow surface layer during night hours. However, the maximum O3 concentrations during afternoon hours, when vertical mixing inhibited the accumulation of the local NO emissions, were comparable to those observed during the background episodes (Fig. 4). These processes led to a slow reduction of the near-surface ozone concentration starting at sunset, to a minimum just at sunrise, and to a fast recovery within the next 2–3 h. This increase of O3 in the morning hours during the clean episodes was at least partly a result of entrainment of background O3 from the residual layer.
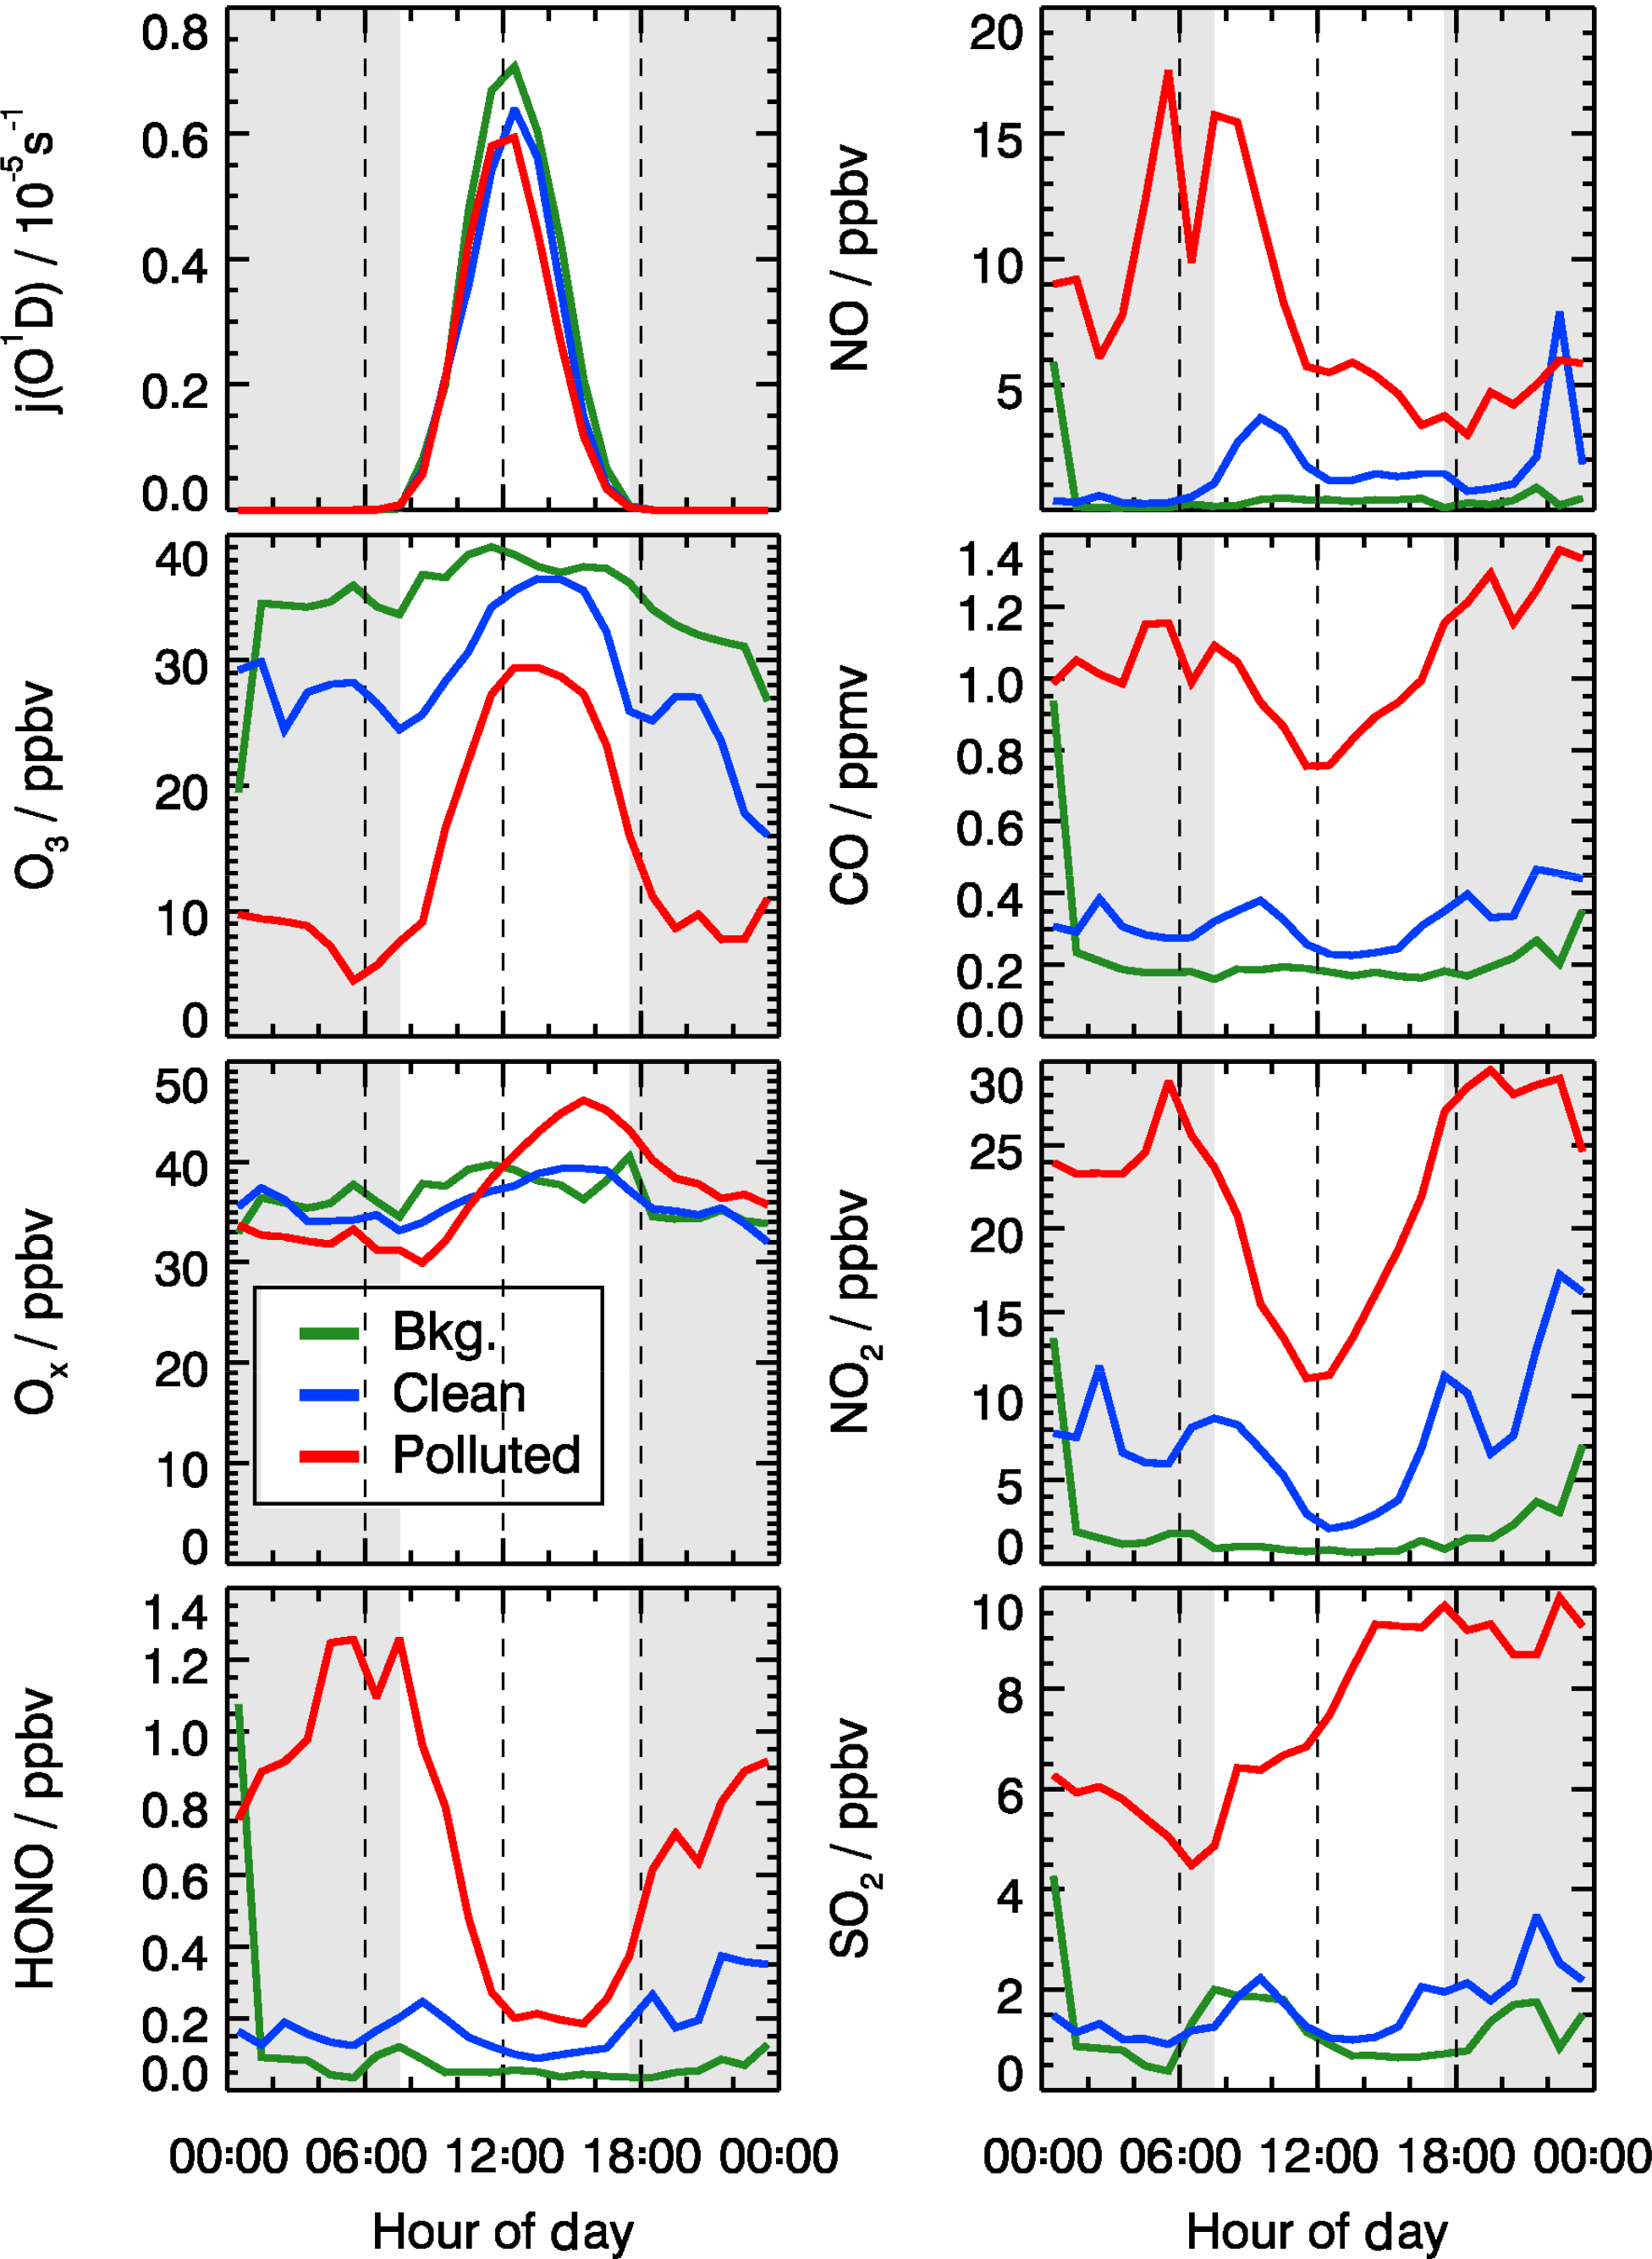
Figure 4Mean diurnal profiles of measured photolysis frequencies (j(O1D) and concentrations of NO, CO, O3, Ox (), NO2, HONO, and SO2 for background (green), clean (blue), and polluted (red) episodes. The grey areas denote nighttime.
During the pollution episodes, the ozone concentrations showed a distinct diurnal variation due to a strong titration by NO. The concentration of NO2 was high at night but decreased after sunrise, which could be due to the poor dilution conditions at night and fast photolysis after sunrise. Ox is the sum of NO2 and O3, which is considered as a more conservative metric than O3 because it is not affected by the interruption of fresh NO emission, especially in urban environments (Kley et al., 1994; Kleinman et al., 2002). Ox increased from 30 ppbv at 07:00 CNST to 50 ppbv at 16:00 CNST during the pollution episodes. After sunset, Ox started to decrease due to physical losses, like deposition and transportation of O3 and NO2, or chemical conversion to N2O5. The fast increase in Ox concentrations during daytime was a specific feature for the pollution episodes, which indicated the strong photochemistry happening during the haze events.
SO2 is a tracer for regional air pollution originating from coal combustion, e.g., power plants and residential heating. For background and clean episodes, SO2 exhibited low concentrations around 1 ppbv. It increased from 5 ppbv at sunrise to 10 ppbv at 16:00 CNST during the pollution episodes. The large increase of SO2 concentrations during pollution episodes which showed a distinct diel increase could be related to the pollutants' accumulation process.
Typically, HONO accumulated during the night (most probably from heterogeneous reactions of NO2 on humid surfaces) and started to decrease after sunrise due to fast photolysis. This was observed during clean or polluted episodes when the measured HONO showed a distinct diurnal minimum during the afternoon and started to increase between sunset and sunrise up to values around 1 ppbv during the night. In contrast, the averaged HONO concentrations were about 0.05 ppbv without obvious diurnal variation for background conditions (Table 2).
3.2 Comparisons between measured and calculated OH, HO2, RO2 radical concentrations, and OH reactivity
Figure 5 shows the measured and modeled OH, HO2, and RO2 radical concentrations and OH reactivity. The largest OH concentration appeared around noontime with large day-to-day variability. The daily maximum varied in the range 1×10⁶ to . The highest OH concentrations were observed during the second half of the campaign (27 and 28 February) when the temperature was above the freezing point and the photolysis frequencies for the short wavelength region, e.g., j(O1D), were higher than in January (Fig. 3).
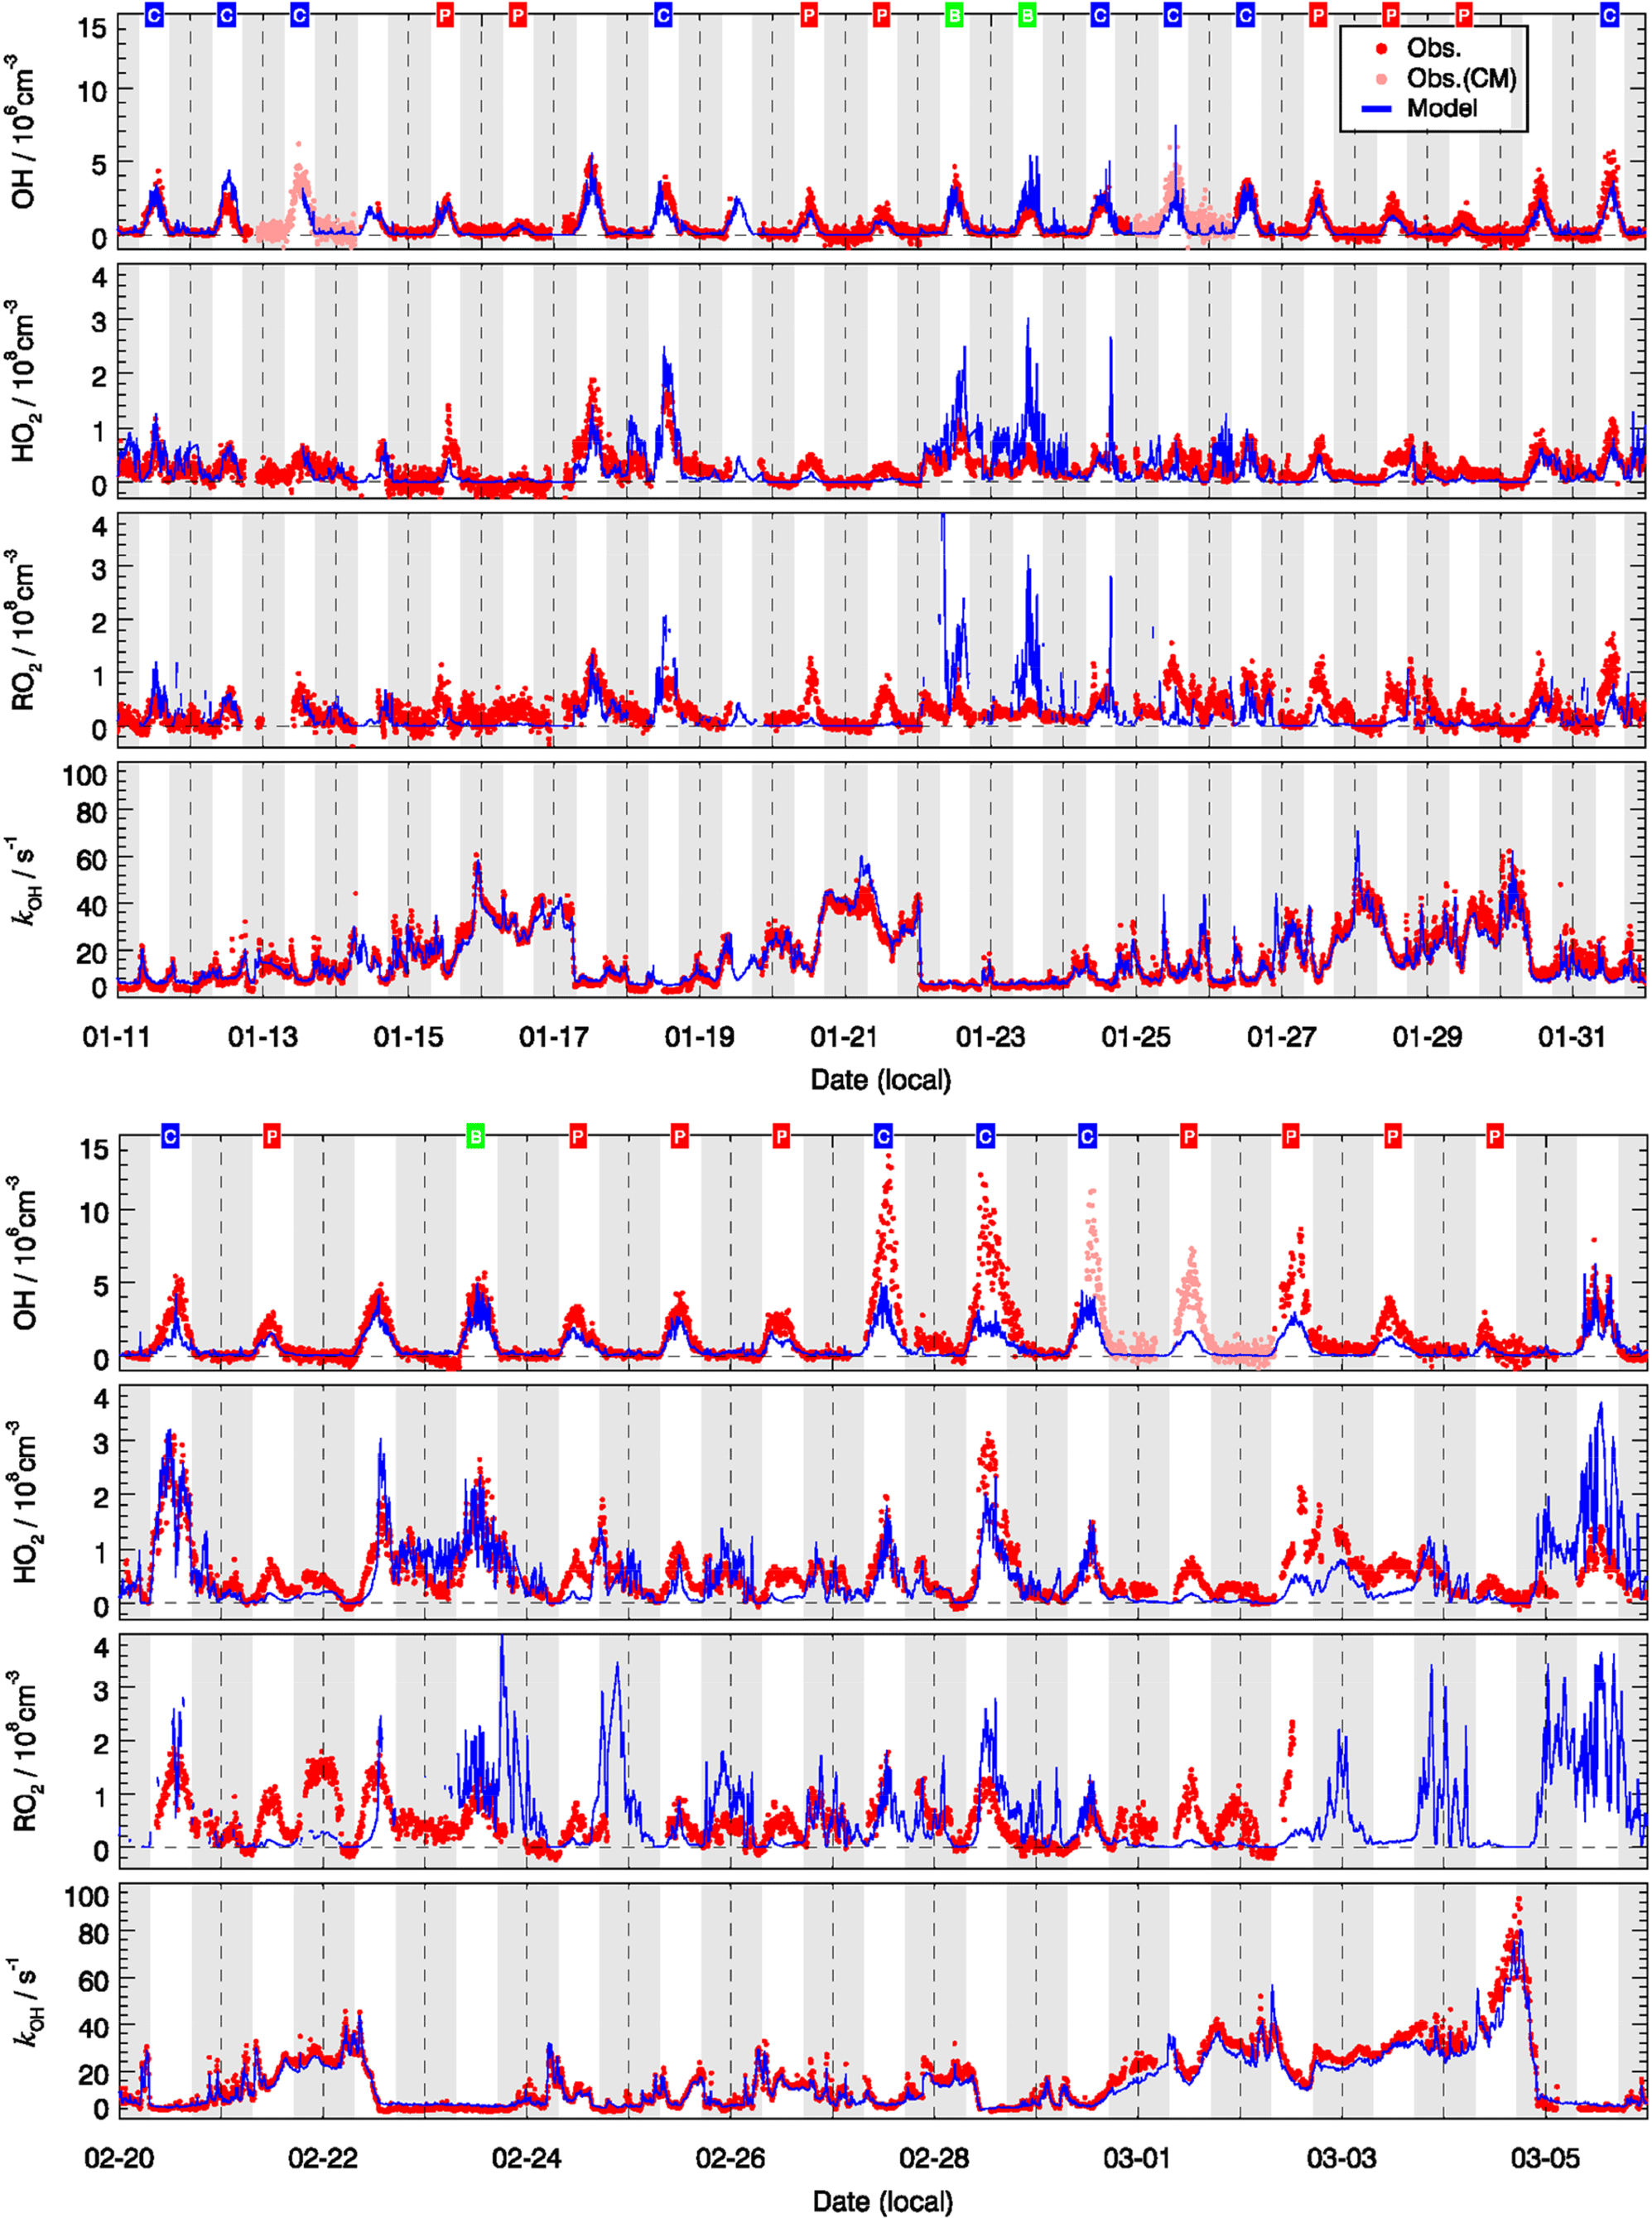
Figure 5Time series of observed (red) and modeled (blue) OH, HO2, the sum of RO2, and of kOH. The OH measurements were achieved by wavelength modulation and chemical modulation (CM is an abbreviation for chemical modulation; see text in Sect. 2.2.1). The grey areas denote nighttime. The labels in the first row denote the classification for background (B, green), clean (C, blue), and polluted (P, red) episodes.
In general, the model could reproduce the observed OH concentrations within 30 %. It is important to notice that the good agreement between measured and modeled OH concentrations was mainly due to the availability of observed HONO concentrations. A sensitivity test showed that the calculated OH radical concentrations were reduced by 43 % if the model was not constrained to the HONO measurements. This underlines that the currently known gas-phase formation of HONO from the reaction of OH with NO is not sufficient to sustain the high HONO concentrations observed during this winter campaign. The result agrees with numerous field and laboratory studies which have reported additional daytime sources of HONO (e.g., Kleffmann et al., 2005), for example, from the heterogeneous conversion of nitrogen species (nitrates, nitric acid, NOx) at surfaces and soil emissions (see overview in Meusel et al., 2018, and references therein). The present study demonstrates that at least some of the additional HONO sources are also effective at cold conditions and play an important role for the wintertime oxidation of pollutants in urban atmospheres. It also confirms the need for in situ HONO measurements during field studies focusing on the investigation of atmospheric radical chemistry (Alicke et al., 2003; Su et al., 2011; Lu et al., 2012; Kim et al., 2014).
The overall correlation between observed OH concentrations and photolysis frequencies is shown in Fig. 6. Both observed and modeled OH concentrations show a good correlation with j(O1D) and with j(NO2) with the coefficient of determination R2 being larger than 0.7, which can be expected in summer when the radical chemistry is initiated mainly by photolysis processes including ozone photolysis. However, j(O1D) increased by a factor of 2 from the start to the end of the campaign while j(NO2) remained nearly constant (Fig. 3). The correlation between calculated OH and j(NO2) is more compact and linear than that between OH and j(O1D), reflected in a slightly higher correlation coefficient (Fig. 6). In the model, the OH concentrations tend to depend strongly on j(NO2). This can be explained by HONO photolysis being the dominant primary source of OH radicals (see Sect. 4.1) and the well-known linear correlation between j(NO2) and j(HONO) (Kraus and Hofzumahaus, 1998). The OH observations do not show such a difference; j(O1D) and j(NO2) both exhibit the same good correlation coefficient.
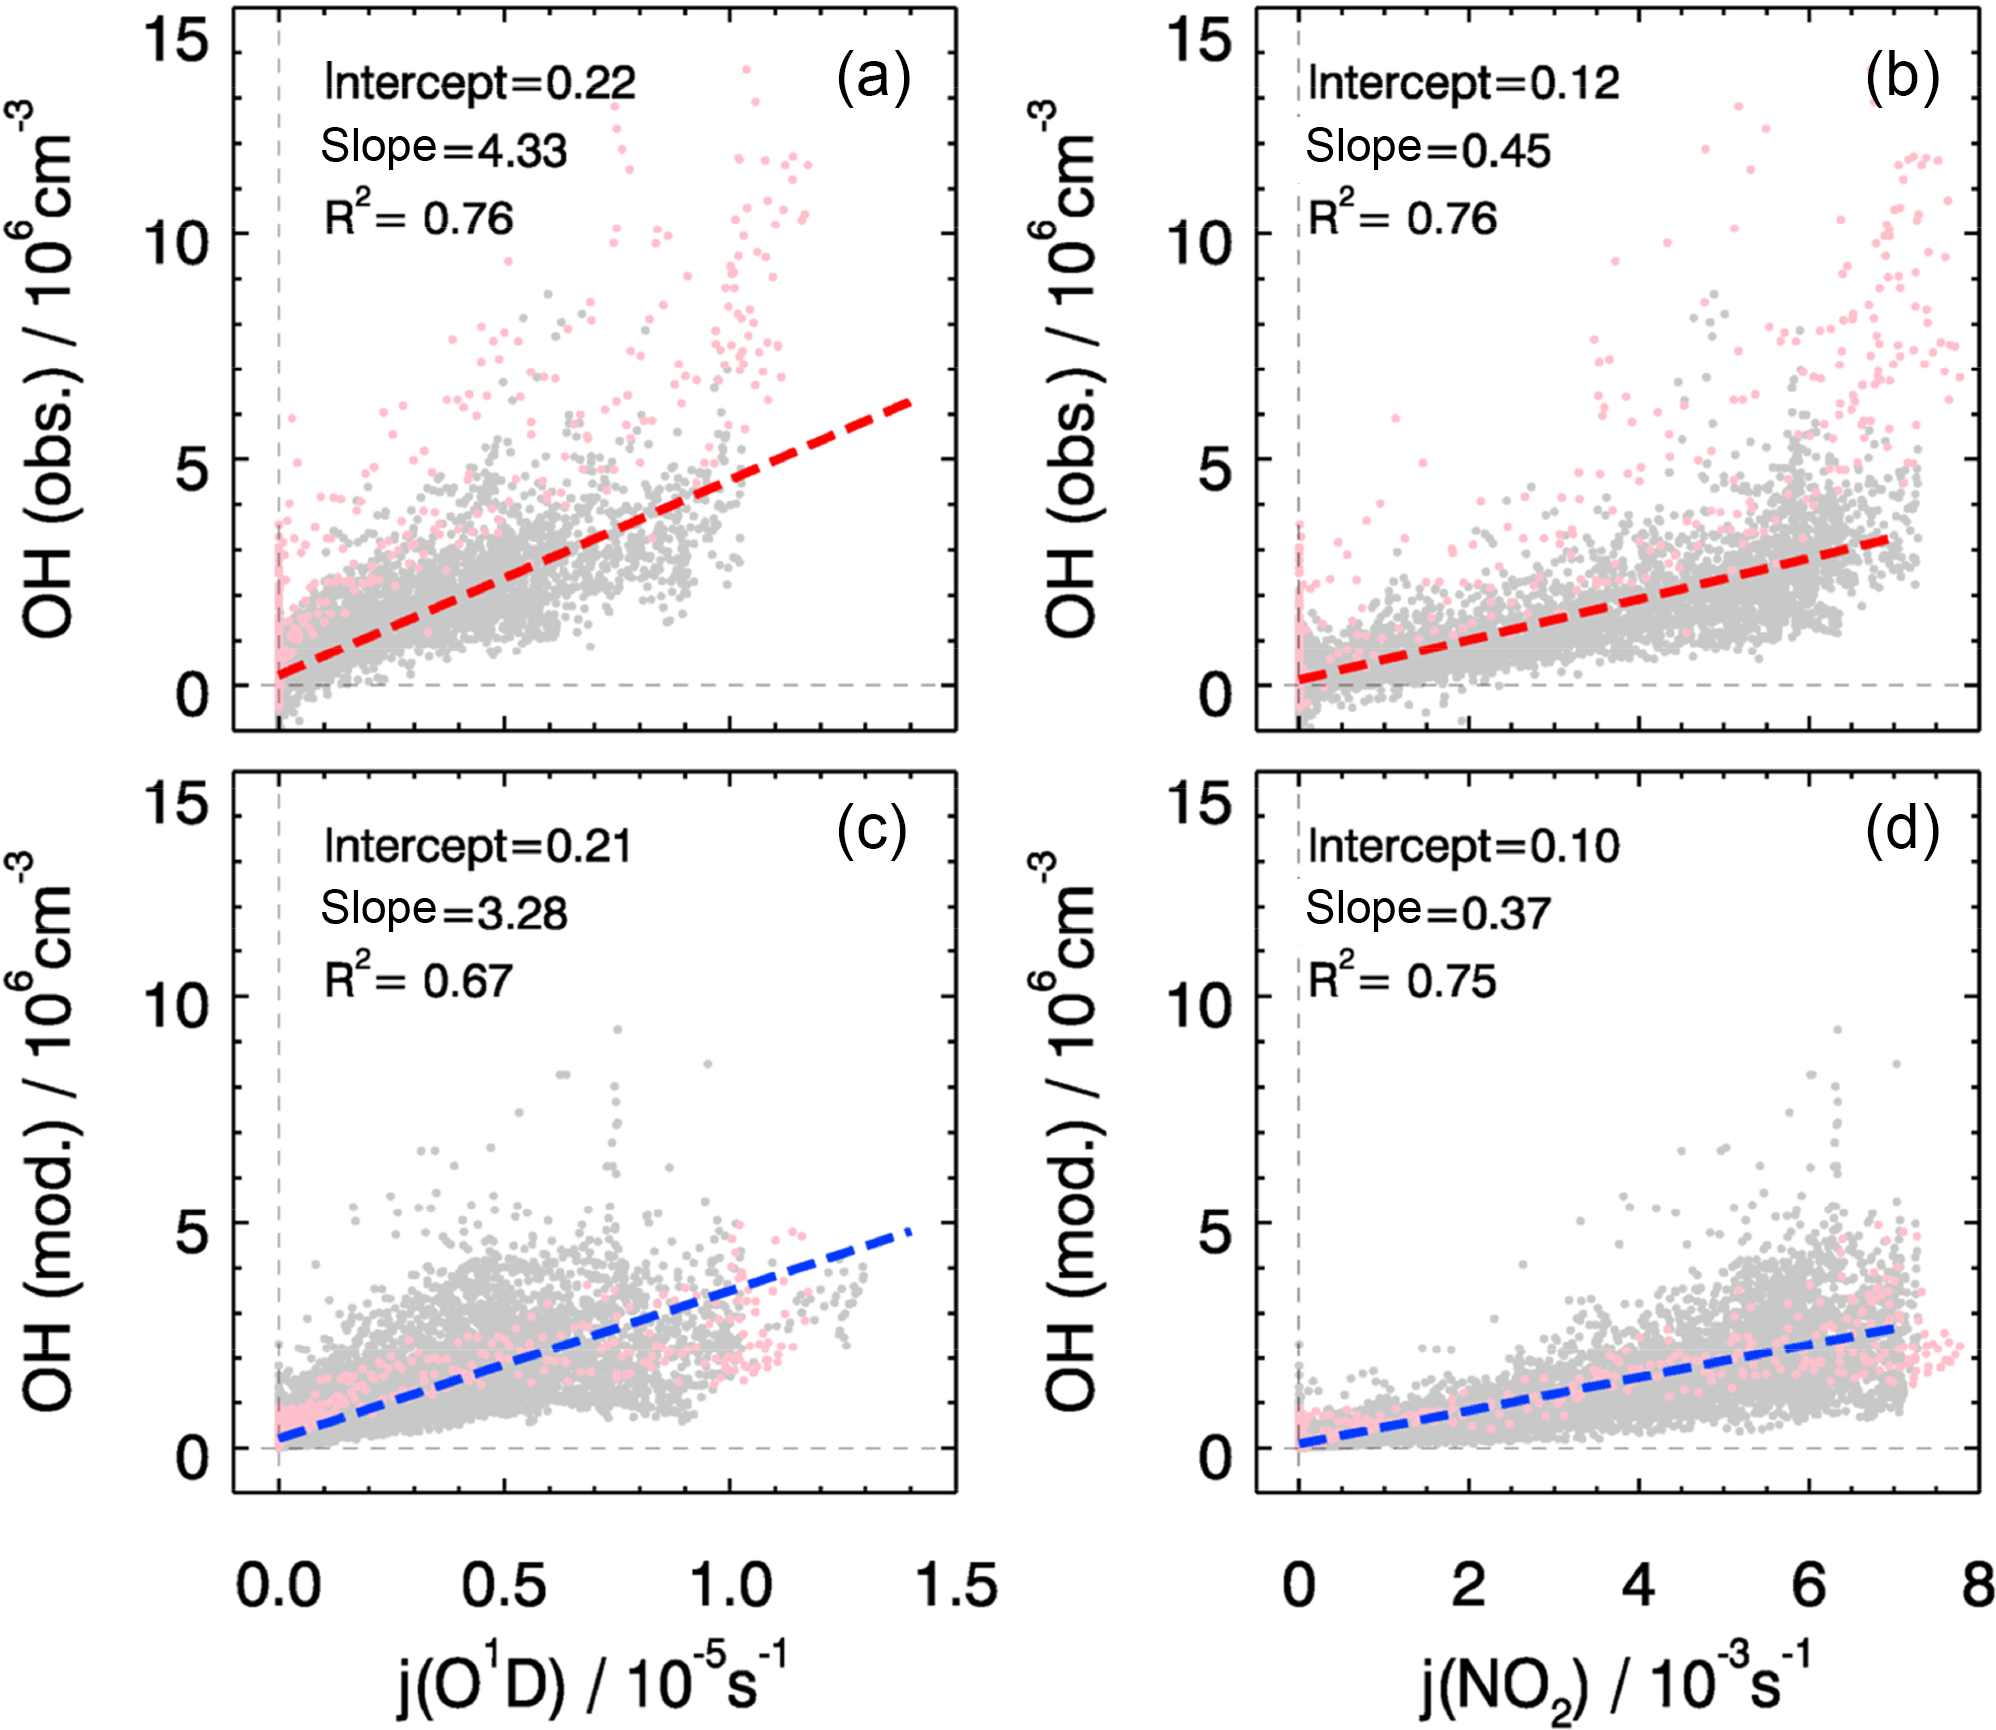
Figure 6The correlation between observed (a, b) and modeled (c, d) OH concentrations and photolysis frequencies of j(O1D) (a, c) and j(NO2) (b, d). The pink dots denote the results obtained on 27 and 28 February, which are not included in the correlation analysis. The units of the slope and the intercept are 1011 cm−3 s−1 and 106 cm−3, respectively.
Despite the general agreement, the model systematically underestimates OH concentrations for 2 days (27 and 28 February) by a factor of 2 (Fig. 5). The OH reactivity was relatively small on these days (<10 s−1). A model sensitivity run with an additional primary OH source of 0.25 ppbv h−1 shows that the modeled OH concentrations would increase by 50 %, which would be enough to close the gap between measured and modeled OH for these 2 days. However, the possibility of an instrument failure of the PKU-LIF during these 2 days cannot be excluded. An indication may be that the data points on these 2 days do not follow the generally very good OH–j(O1D) correlation (Fig. 6). Therefore, we excluded these 2 days from the analysis.
The daytime averaged peroxy radical concentrations are smaller by a factor of 5 compared to summertime at the rural site of Wangdu in the North China Plain (Tan et al., 2017). The strong reduction in radical concentrations is due to the attenuated solar radiation and thus smaller primary radical sources. In addition, NOx concentrations during the BEST-ONE campaign were larger, resulting in a faster peroxy radical loss and thus shorter lifetimes.
For the background episodes, the calculated RO2 data are not shown in Fig. 7 because the observed NO concentrations were close to the limit of detection of the NO instrument (60 pptv), and thus the model was highly sensitive to the fluctuations of the NO measurements around zero (Fig. 5). The observed RO2 radical concentrations do not show a significant difference between background, clean, and pollution episodes, while a large difference can be observed for the calculated RO2 concentrations (Fig. 7). In fact, the observed radical concentrations are rather comparable in all episodes, while the model predicts a suppression of radical concentrations in the polluted episodes. This is most obviously seen for HO2 and RO2. The comparisons between observed and modeled OH, HO2, and RO2 concentrations for clean and polluted episodes are shown in Fig. S3. Both the calculated OH and HO2 radical concentrations were lower than observed during polluted days. Overall, during clean days, the model can reproduce the observed OH, HO2, and RO2 radical concentrations with an observed-to-modeled ratio of 1.31, 1.03, and 0.98 for daytime conditions, respectively (Fig. S3). The nighttime RO2 radicals are often overestimated by the model calculations by up to a factor of 10, which could be the result of a NO measurement below the detection limit. The observed NO concentrations were often below the limit of detection of the NOx instrument (60 pptv), which did not allow precise measurements due to the fluctuation of the background signal. In addition, it also led to large variability in the modeled NO3 and resulted in overprediction in the nighttime RO2 (Tan et al., 2017). On the other hand, a small bias in the NO measurement could lead to an unrealistically long lifetime of RO2 radicals in the model. A model sensitivity run showed that RO2 concentrations could be significantly reduced if the constrained NO concentrations in the model were increased by 20 pptv, which is within the precision of the instrument. A loss of NO inside the inlet line of the instrument would already be enough to explain this effect that was within the limit of detection.
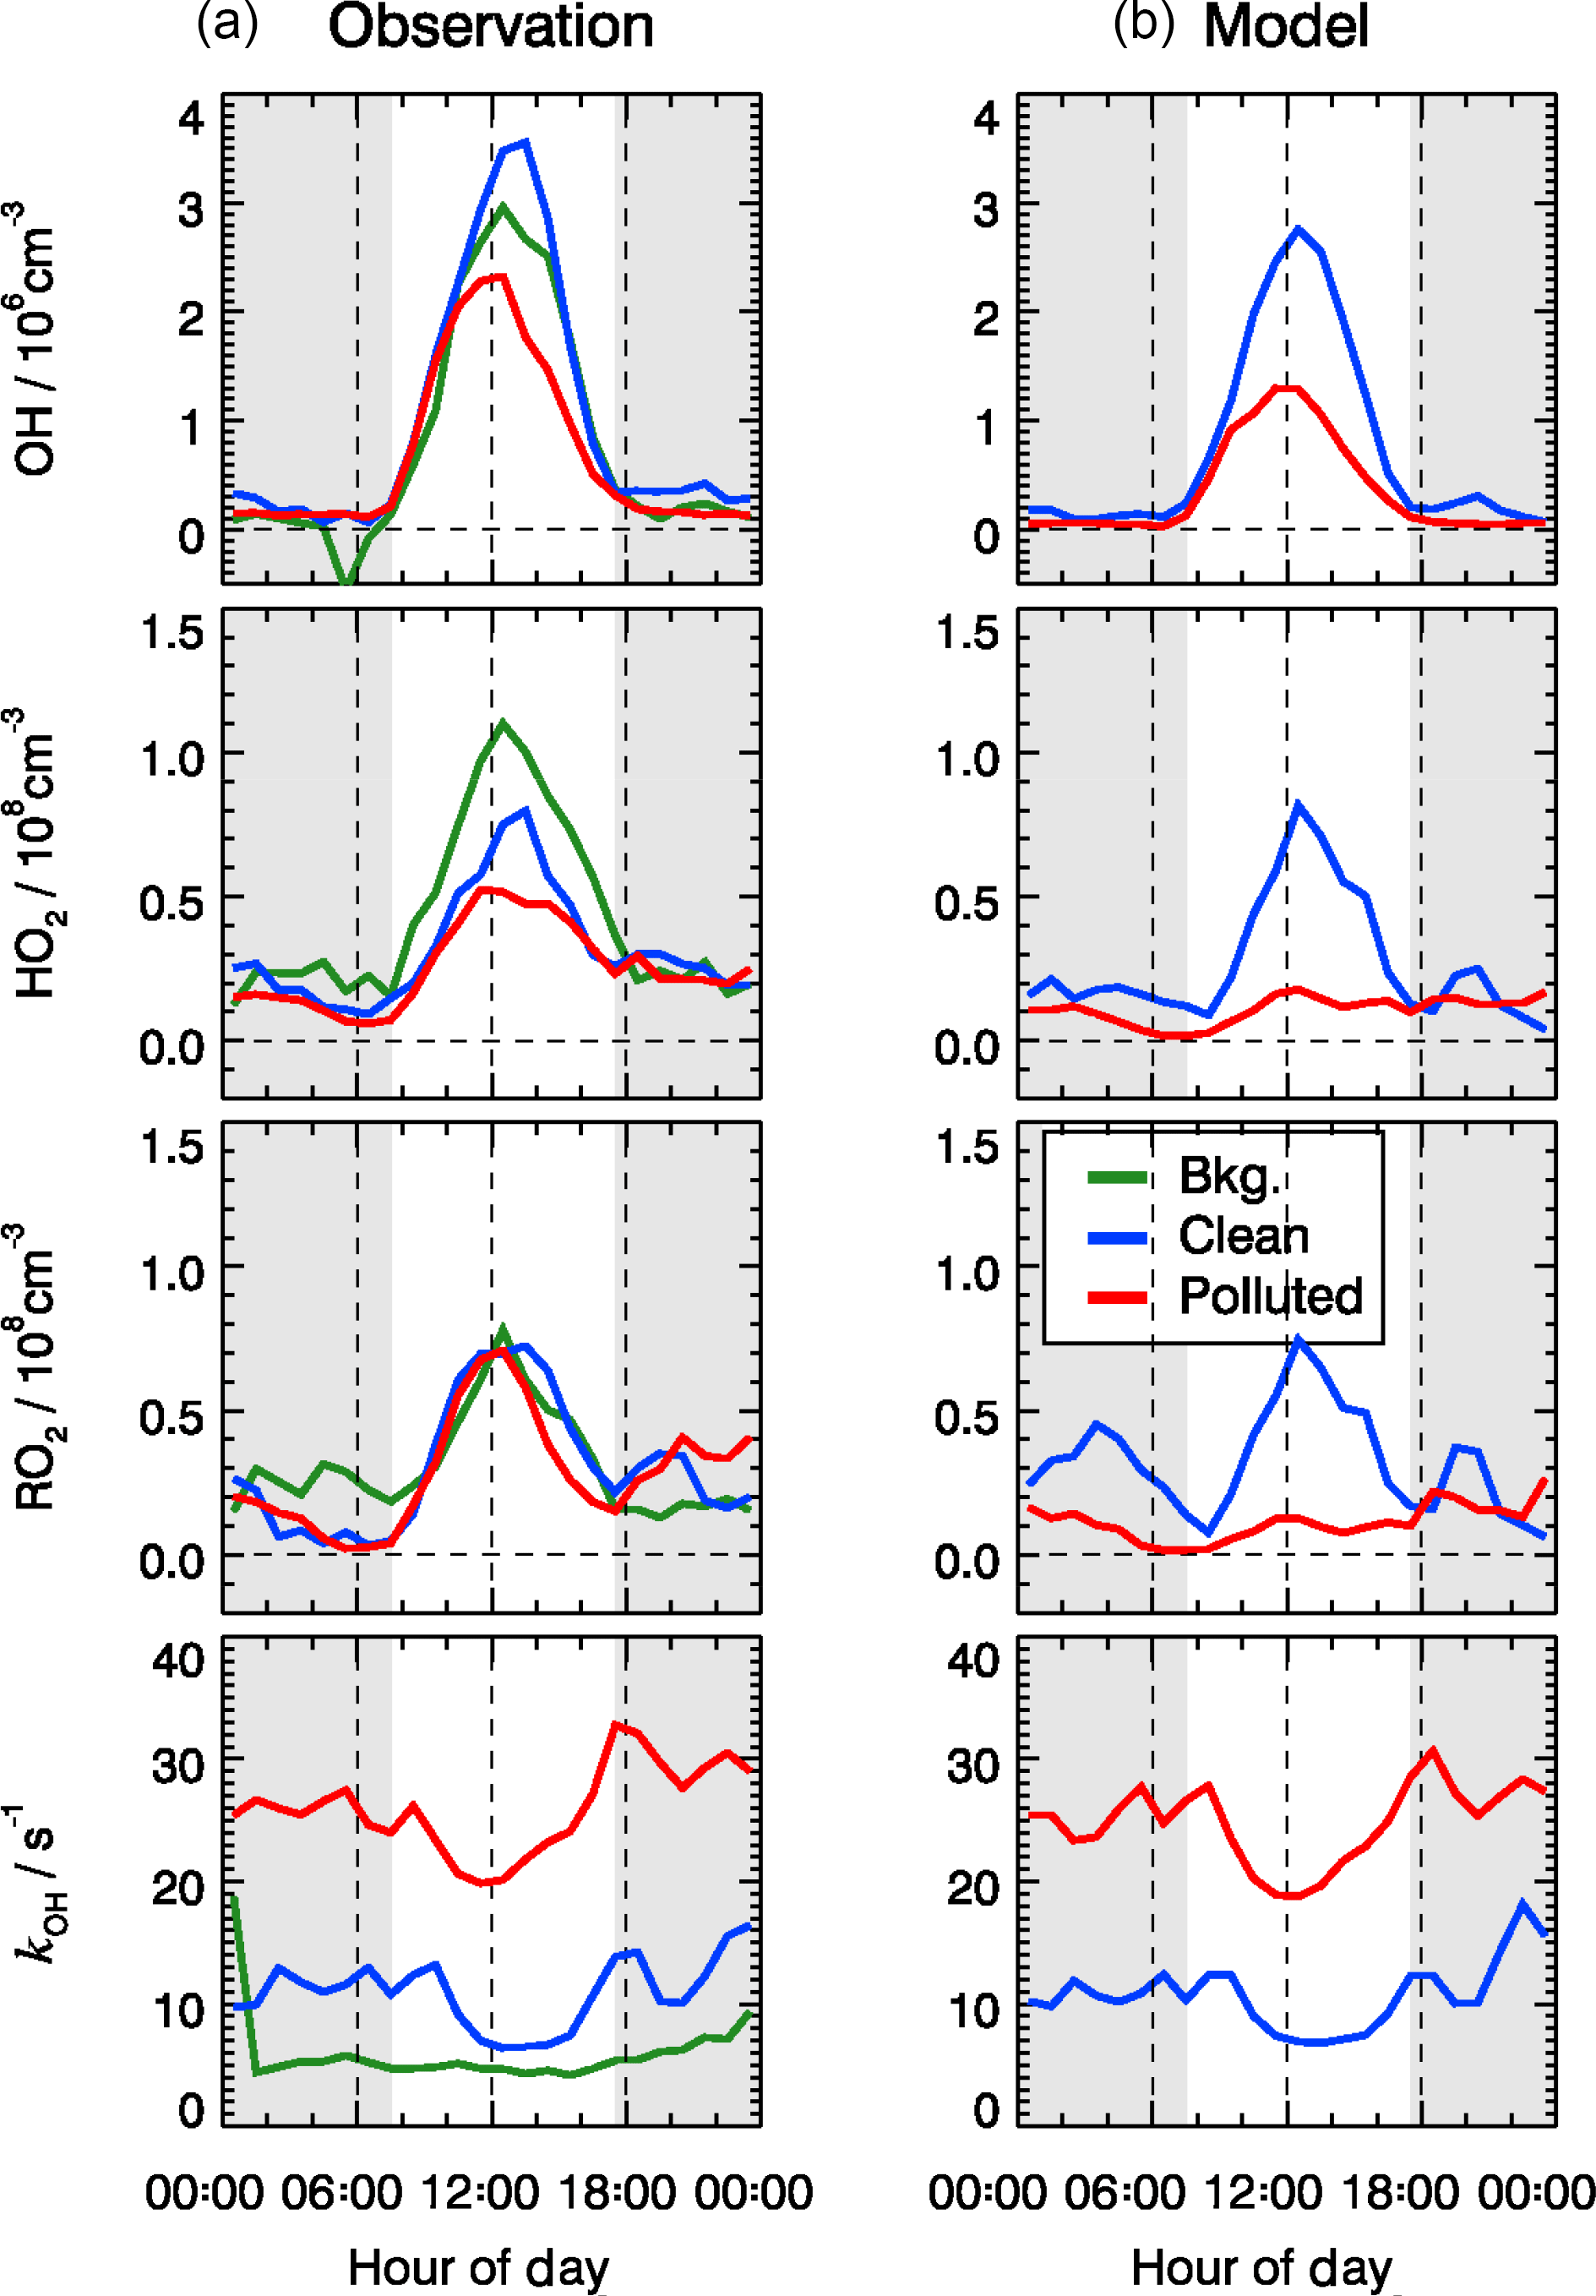
Figure 7Mean diurnal profiles of observed (a) and modeled (b) OH, HO2, RO2, and kOH for three different chemical and meteorological conditions. The categories for background, clean, and polluted episodes are the same as in Table 2, and similar to those applied to Figs. 9 and 12. The grey areas denote nighttime.
The model underestimates the observed OH concentrations by a factor of 1.8 during polluted days, and the peroxy radical concentrations are significantly underestimated by up to a factor of 5 (Fig. 7). A detailed analysis of these days is given in Sect. 4.2. A chemical model based on the Master Chemical Mechanism (MCM) 3.3.1 also predicts similar results as RACM2, suggesting that such underestimation is not a result of the “family approach” for organic molecules used in RACM2.
The model was able to reproduce the directly observed OH reactivity within 10 % during all episodes (Fig. 7). This calculation includes the reactivity from observed VOCs (about 73–83 % of the observed kOH) and the estimated contributions from OVOCs calculated by the model (17–27 %). The speciation of the total OH reactivity showed that the major OH reactants were NOx and CO. On average, CO and NOx contributed 23 % and 37 % to the total OH reactivity, respectively. A total of 18 % of the observed reactivity can be attributed to measured VOC species. In comparison, the model-generated species contributed 22 % to the total reactivity. For the polluted episodes, the average OH reactivity increased from 10 to 26 s−1 with a significant increase in the relative contributions from the inorganic compounds (from 52 % to 63 %).
4.1 Sources and sinks of ROx radicals
As shown in Fig. 8, the radical chain reactions were mainly initiated by photolysis processes. HONO photolysis was the most important radical primary source. It contributed up to 46 % (averaged rate 0.26 ppbv h−1) of the total primary production rate of radicals for daytime conditions. During the BEST-ONE campaign, the production rates of radicals varied slightly between different episodes (Fig. 9). The production rates were highest during the polluted episodes compared to the background and clean episodes. The major difference was due to the contribution from HONO photolysis, which accounted for the major source in all cases contributing 25 % (0.10 ppbv h−1), 40 % (0.21 ppbv h−1), and 55 % (0.37 ppbv h−1) of diurnally averaged rates of 0.10, 0.21, and 0.37 ppb h−1 for background, clean, and polluted episodes, respectively. Alkene ozonolysis was the major radical source of nighttime and the second largest primary radical source during the day (28 %, 0.16 ppbv h−1). The relative importance of the ozonolysis of alkenes was slightly larger during the background (39 %) and clean (33 %) episodes. The ozone photolysis was almost negligible for our wintertime BEST-ONE campaign. At high solar zenith angles, short wavelength radiation (<320 nm) is suppressed due to the strong attenuation by the longer pathway through the ozone layer in the stratosphere. In addition, the water vapor mixing ratio at the low winter temperatures decreases to below 0.3 %, 1 order of magnitude lower than during summertime. Formaldehyde photolysis contributed on average 17 % to the total ROx primary production. The photolysis of carbonyl compounds calculated by the model also made a noticeable portion of the total primary production of radicals, about 7 % (Fig. 8).
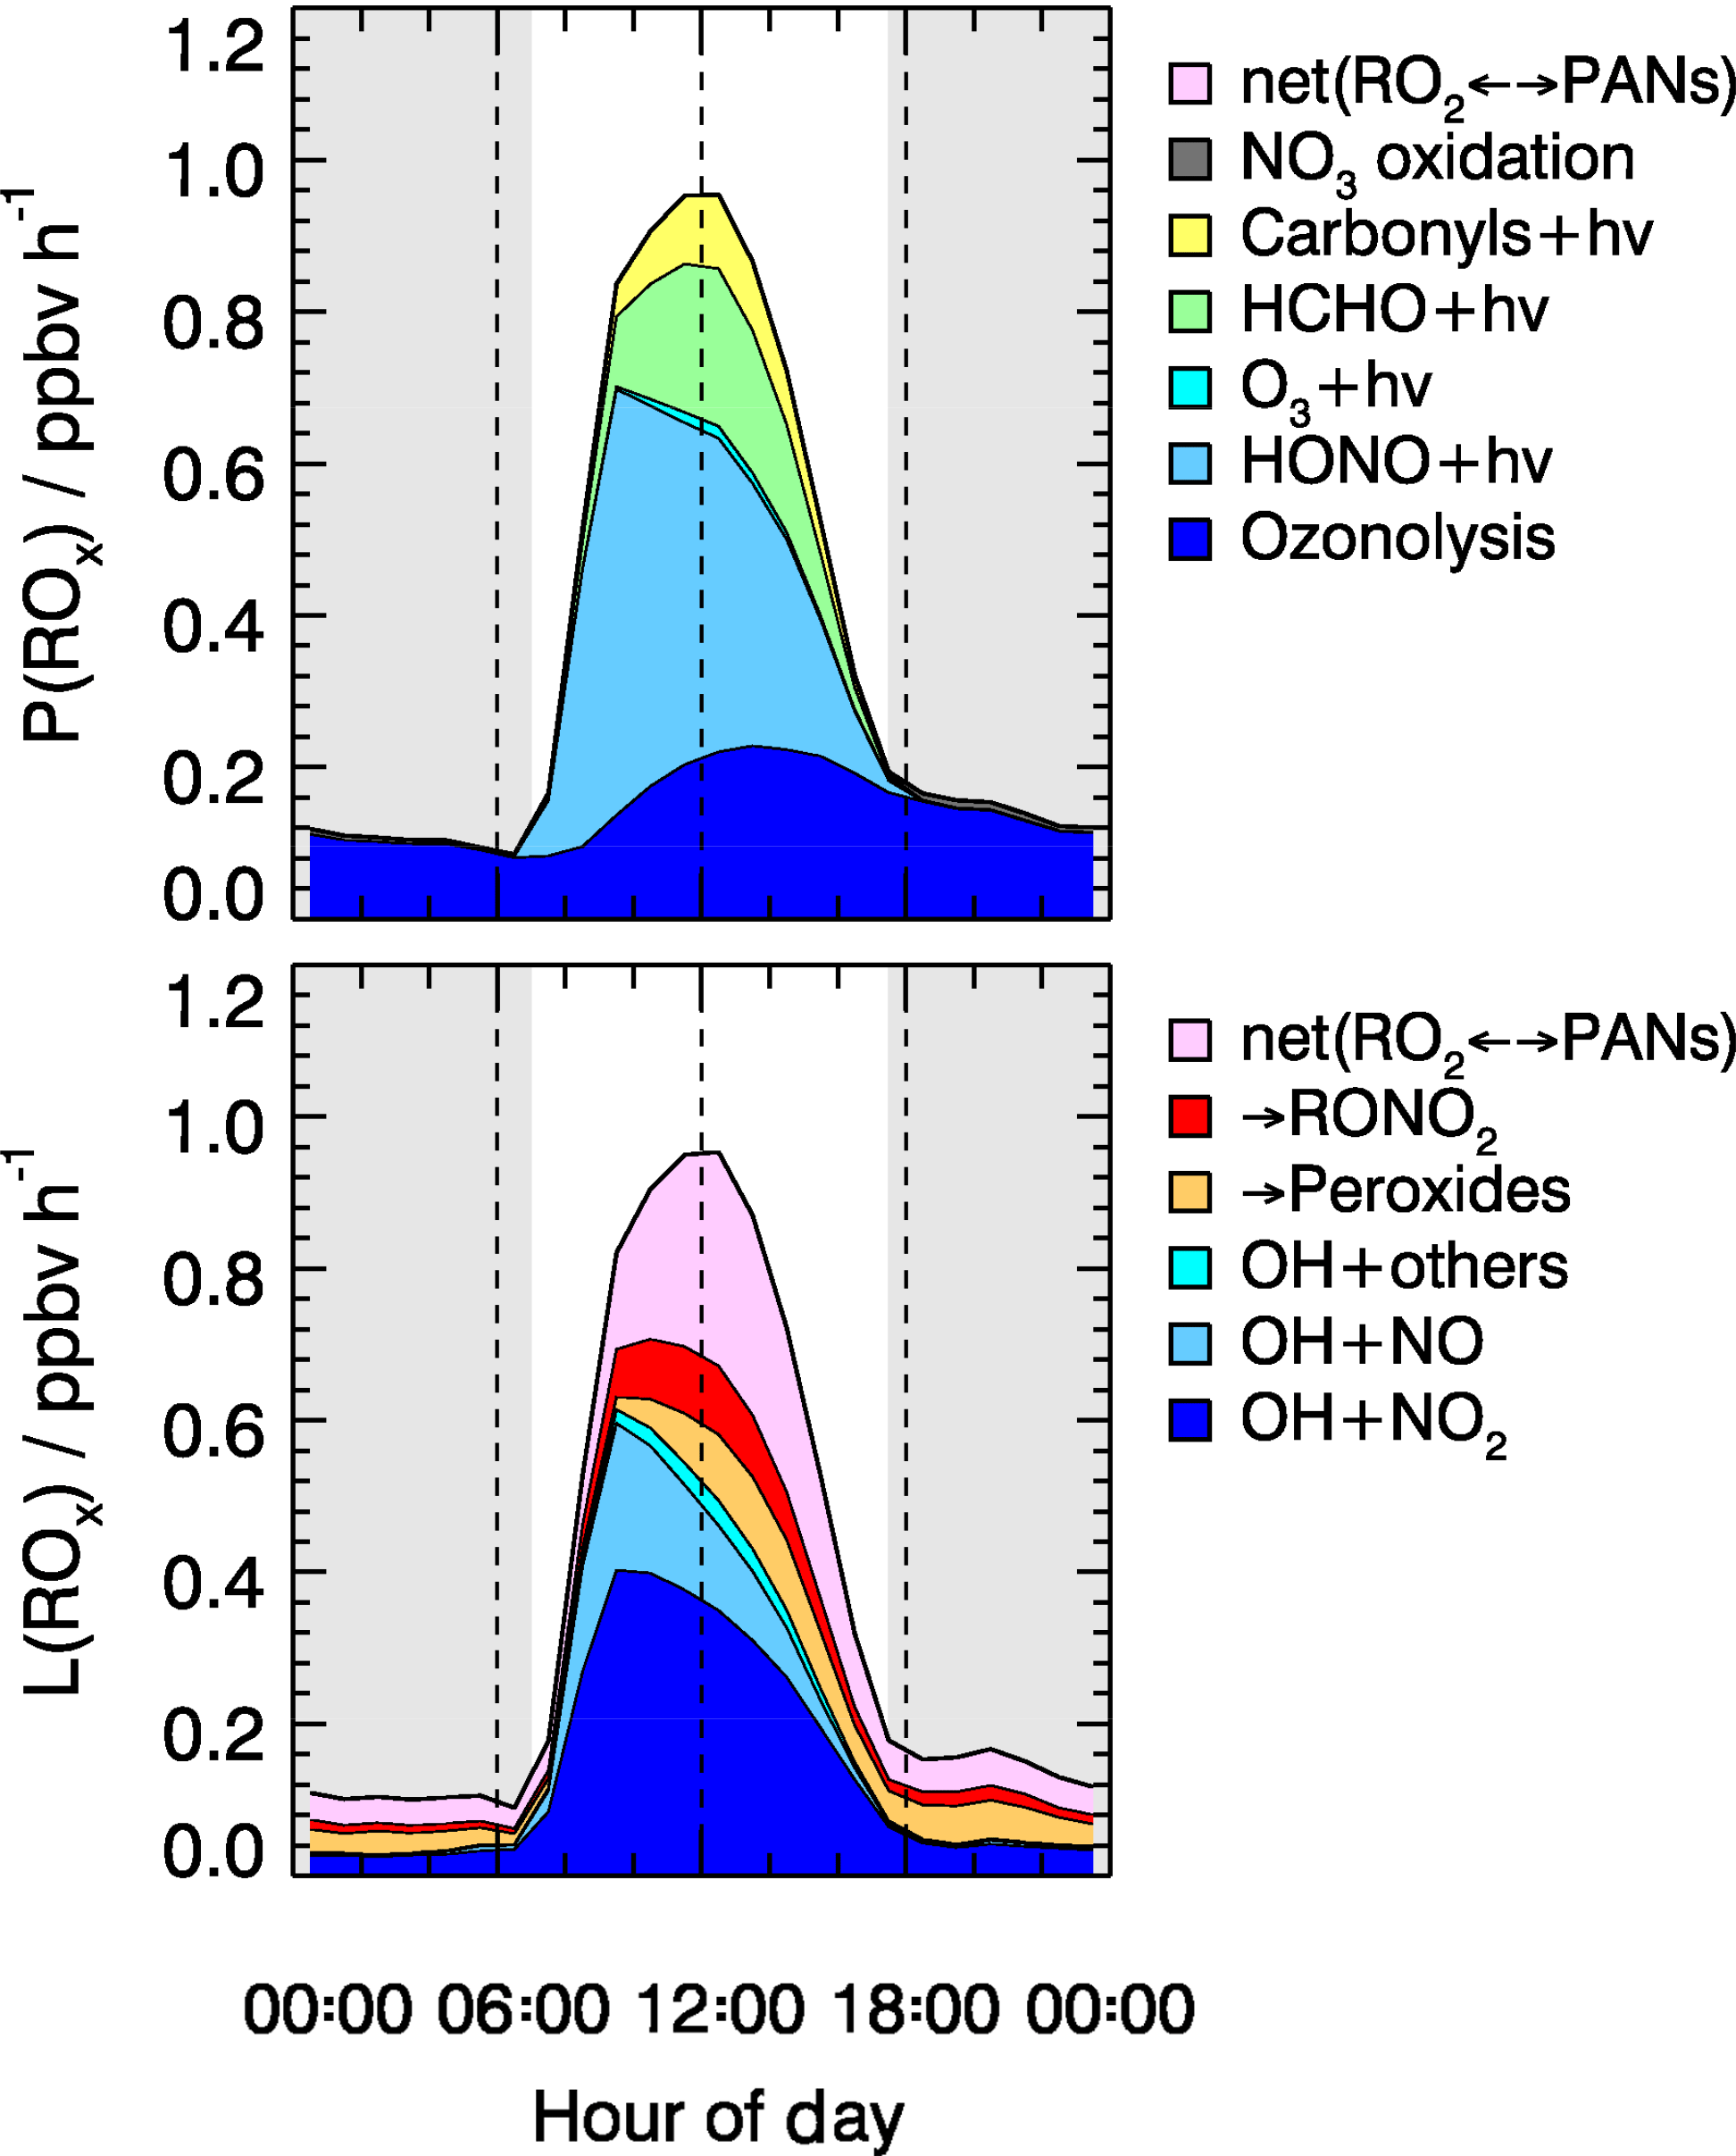
Figure 8Hourly averaged primary sources and sinks of ROx radicals derived from model calculations for all episodes. The grey areas denote nighttime.
The importance of HONO photolysis is reported in previous studies for other locations, both urban and suburban (Alicke et al., 2003; Dusanter et al., 2009; Mao et al., 2010; Ren et al., 2013). For winter campaigns, HONO photolysis was found to be the dominant (>50 %) daytime ROx radical source in New York City (NYC) (Ren et al., 2006), Tokyo (Kanaya et al., 2007), and Boulder, Colorado (Kim et al., 2014). During the PUMA campaign in Birmingham, HONO photolysis contributed only 36 % to the total OH radical primary sources (Emmerson et al., 2005b). Meanwhile, the reported value of 36 % is a lower limit, since HONO was not measured. Instead, it was calculated from the equilibrium between HONO and OH+NO. As OH and NO can recombine to nitrous acid, the net effect of HONO photolysis to radical production might be partly compensated. Kanaya et al. (2007) found that the OH+NO (+M) reaction was balanced by the HONO photolysis during the morning hours. In our study, the gas-phase HONO formation only compensated 10 % of the observed HONO photolysis. Therefore, the net effect of HONO photolysis remains the dominant radical source in wintertime during the BEST-ONE campaign. In Fig. 9, the radical production for the Wangdu summer campaign is shown in comparison to the current campaign. The total daytime radical production rate was reduced in winter by a factor of 6 compared to summertime. The contribution of HONO photolysis also changed, contributing 39 % to the total radical production for the Wangdu summer campaign.
The importance of alkene ozonolysis to the primary ROx radical production was also found in the IMPACT winter campaign in Tokyo, where it contributed 49 % of the ROx production on a 24 h basis (Kanaya et al., 2007). In other campaigns, alkene ozonolysis was comparable to HONO photolysis even during daytime, which contributed 42 % in NYC (Ren et al., 2006) and 63 % in Birmingham (Emmerson et al., 2005b), respectively. During the summertime in Wangdu, the contribution from alkene ozonolysis was only 15 % (Fig. 9). However, the absolute rate was 0.47 ppbv h−1, larger than what was observed at Huairou/Beijing in wintertime (0.16 ppbv h−1).

Figure 9Comparison of ROx primary sources and sinks from model calculations during different episodes for daytime averaged conditions. The budget analysis for the summer Wangdu campaign is plotted for comparison (Tan et al., 2017).
Different from our study, the photolysis of ozone was found to be relatively important in a rural site of Colorado, contributing 15 % to the OH primary production for noontime conditions. The absolute radical production rate is comparable in these two campaigns (Table 3); the higher contribution of ozone photolysis is due to the fact that the Colorado campaign took place at a slightly later time (February and March) of the year (Kim et al., 2014).
Table 3Noontime averaged concentrations of OH, NO2, and OH reactivity and total radical production rate for campaigns investigating photochemistry including OH radical measurements during wintertime.
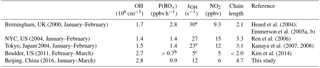
a kOH is calculated from the model. b Only the OH production rate is available and therefore should be regarded as the lower limit. c The sum of reactivity from VOC, OVOC, and NO2.
The photolysis of carbonyl compounds can be an important radical source for urban and suburban areas (Emmerson et al., 2005b). HCHO photolysis contributed up to 6 % of the total HOx () production in NYC (Ren et al., 2006) and 10 % in Tokyo (Kanaya et al., 2007) for wintertime conditions, comparable to their contributions in summertime, for example, 8 % for NYC (Ren et al., 2006) and 18 % for Tokyo (Kanaya et al., 2007).
The termination of ROx radicals is achieved either by the reaction with NOx or by the peroxy radical self-reactions. The NOx termination reactions can be further subdivided into OH+NO, OH+NO2, RO2+NO, and RO2+NO2. As shown in Fig. 8, the reaction between OH and NO2 dominated the total radical termination process during the BEST-ONE campaign, which contributed 49 % of the total ROx loss for daytime average. The equilibrium between peroxy radicals and PAN-type compounds was a sink for ROx radicals due to the low ambient temperature during the winter campaign. The net PAN-type compounds species formation had a noticeable impact on the radical budget (25 % daytime averaged). Since the observed and modeled PAN concentrations agree within 24 %, it gave confidence to the net PAN formation rate. In London, the net PAN formation was also found to be a major radical sink, contributing 35 % to the total radical destruction rate (Whalley et al., 2018). The ROx self-reactions were nearly negligible (<3 %) as the peroxy radical concentrations were small (). For comparison, this is 1 order of magnitude smaller than in the summertime Wangdu campaign, where the radical termination process was mainly dominated by the hydroperoxide formation path (Fig. 9).
The relative importance of various loss pathways was compared between the different episodes (Fig. 9). The reaction between OH and NO2 contributed 40 % and 61 % to the total ROx loss during clean and polluted episodes. The net loss of PAN-type compounds became of relative importance during background episodes, contributing 50 % to the total radical termination because of the lower temperatures (Table 2).
4.2 Model–measurement comparison of peroxy radicals concentrations
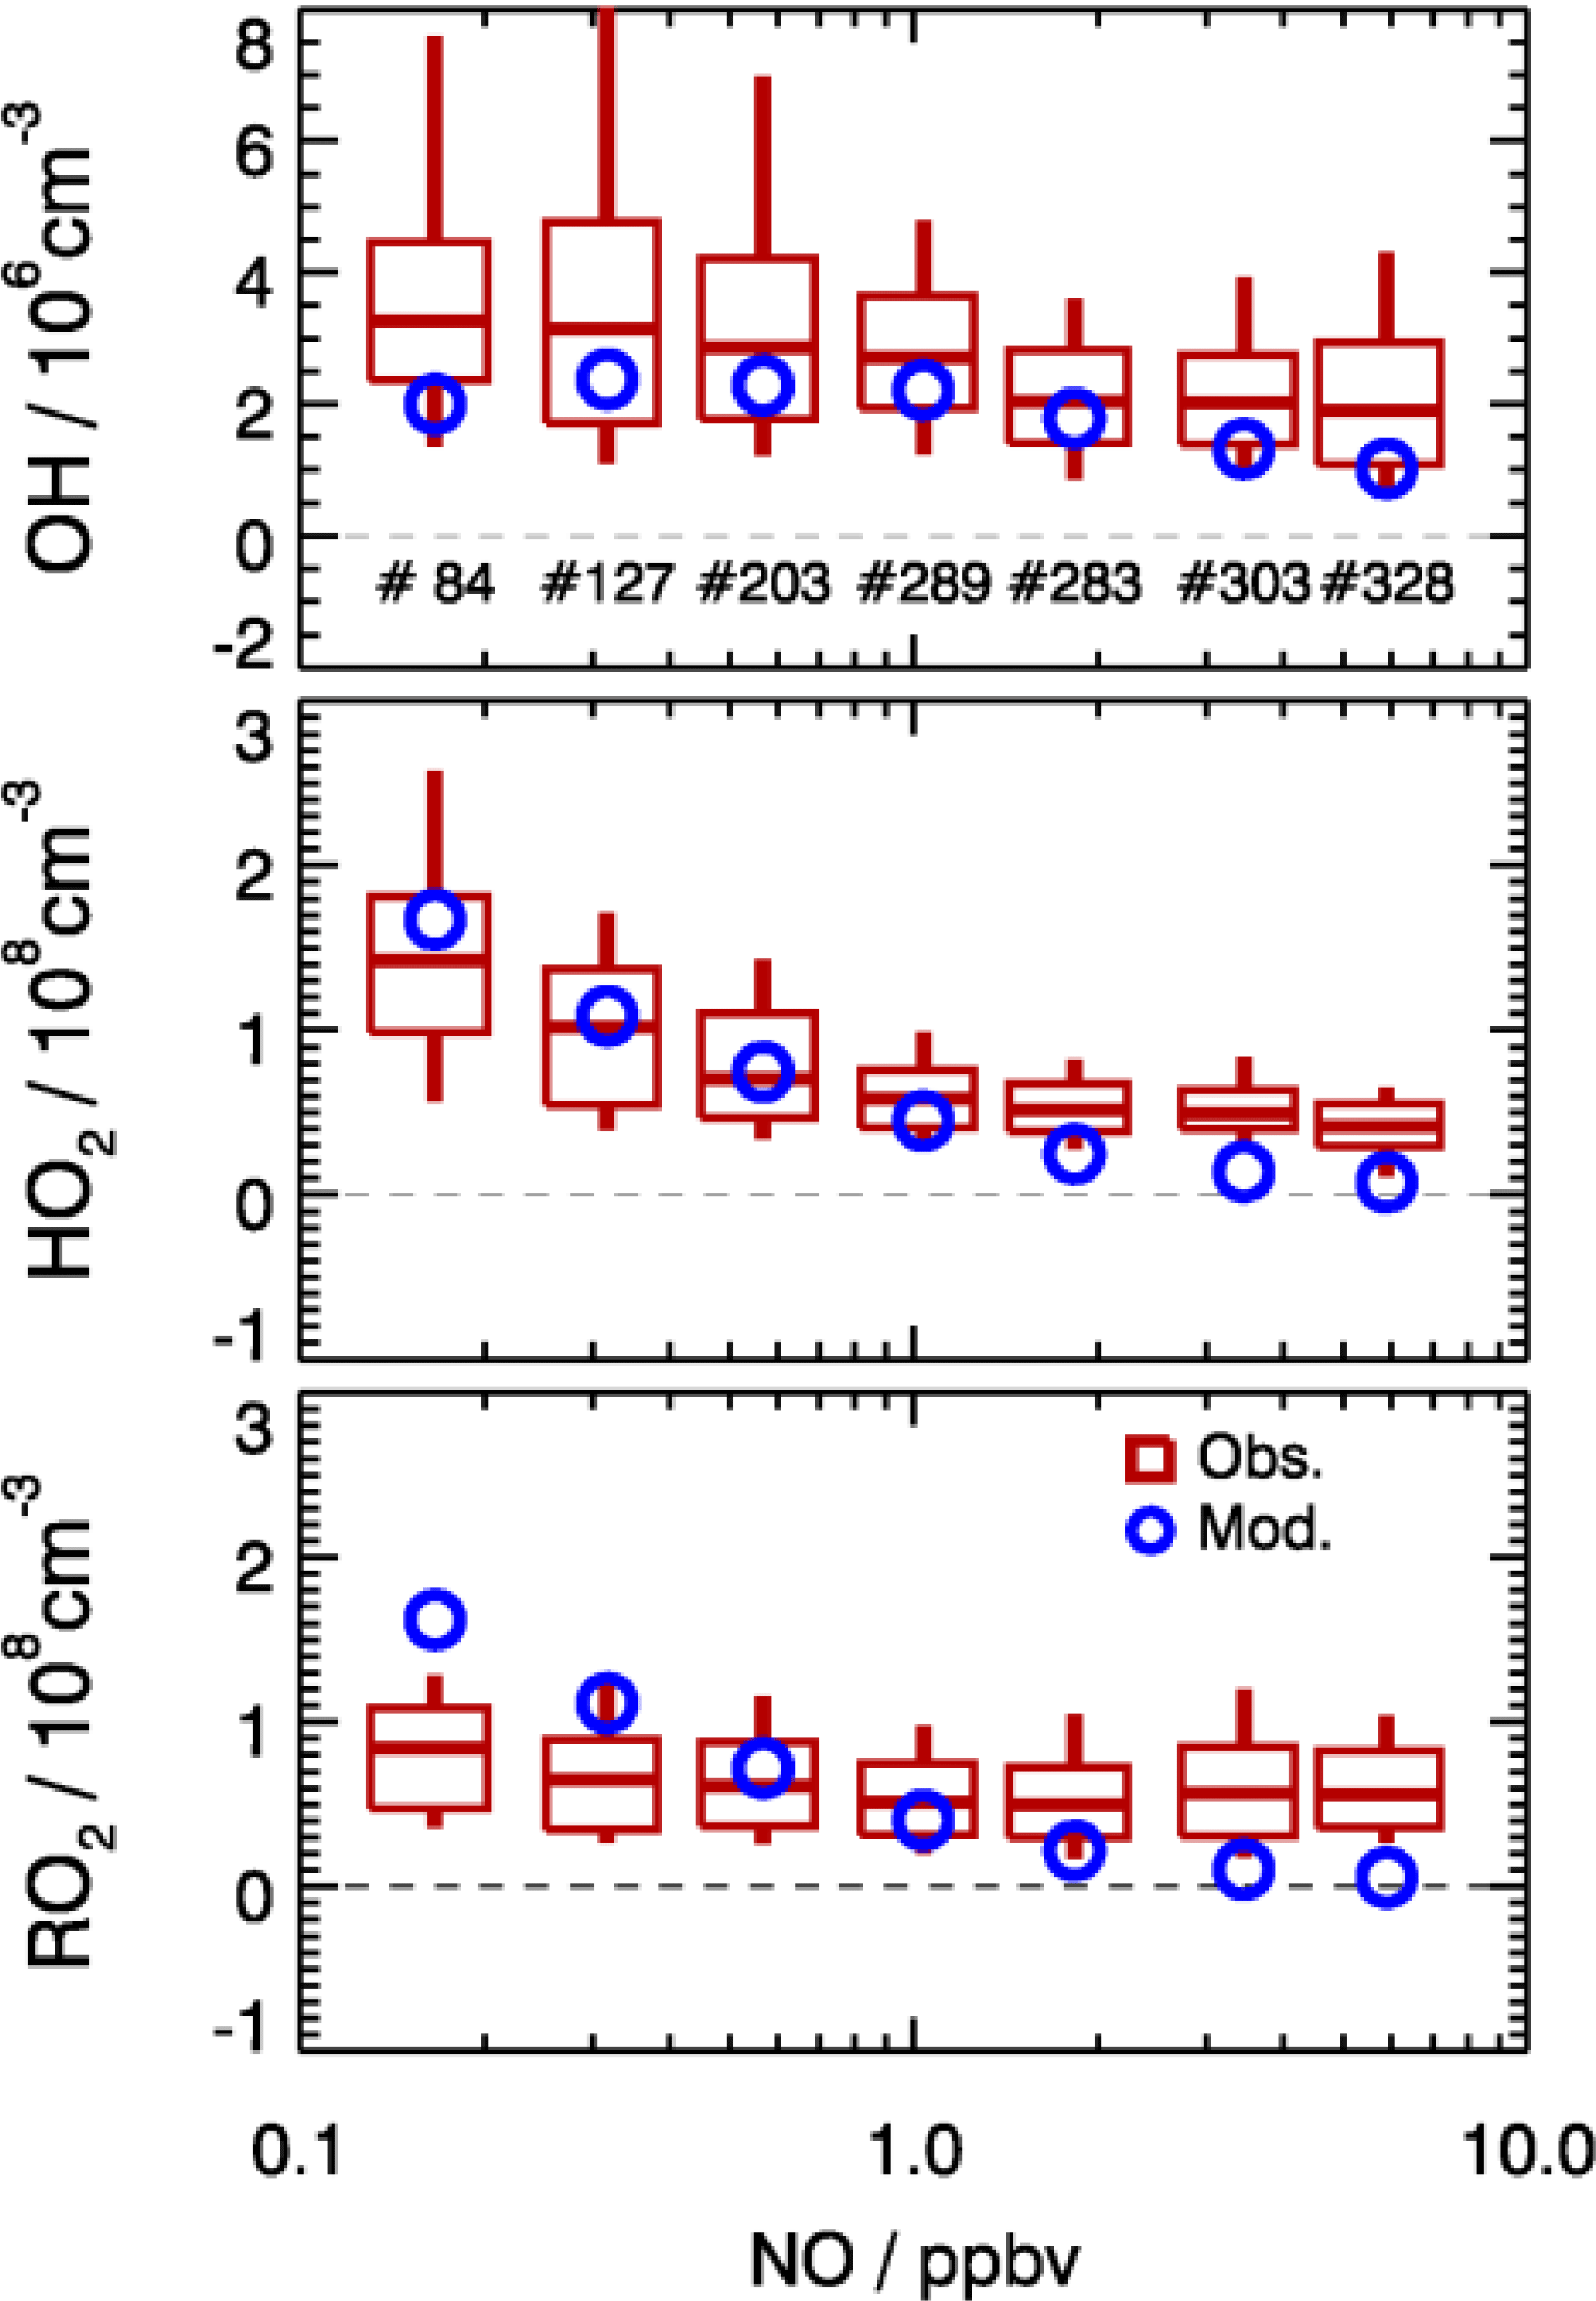
Figure 10Dependence of observed and model-calculated OH, HO2, and RO2 concentrations on NO concentrations for daytime conditions . Boxes give the 75 % and 25 % percentiles, the center lines the median, and vertical lines the 90 % and 10 % percentiles for each NO interval. Only median values are shown for model results. Numbers in the upper panel give the number of data points included in the analysis of each NO interval.
As shown in Fig. 10, the observed RO2 concentrations were relatively constant over the whole NO regime. However, the model predicted a strong decreasing trend with higher NO concentrations. This is further illustrated by the observed-to-modeled ratio, which increased from a value of 1 at 1 ppbv of NO to 9 at 6 ppbv of NO (Fig. 11). As shown in Fig. 11, the underestimation of both HO2 and RO2 radical concentrations became larger with higher NOx. In contrast, the observed-to-modeled ratio of OH concentrations was almost constant with a value of 1.5 over the full NOx regime, which is within the combined uncertainties of measurement and model calculations. An underestimation of HO2 radical concentrations by the model at high NOx values was also observed in previous studies (Shirley et al., 2006; Ren et al., 2006, 2013; Emmerson et al., 2007; Kanaya et al., 2007; Griffith et al., 2016). HO2 measurements in previous field campaigns could have suffered from interferences from specific RO2 species, so that the reported observed-to-modeled ratios could have been even larger in these campaigns. It was suggested that one reason for this discrepancy might be due to the poor mixing and segregation between NO and peroxy radicals (Dusanter et al., 2009). Alternatively, it can also imply missing peroxy radical sources in the current chemical mechanisms relevant in particular for the high NOx regime. In addition, the underestimation of the measured RO2 radicals by the model could explain partly the discrepancy observed for HO2 radicals due to insufficient recycling from the OH oxidation chain.
In the present study, the radical cycling between OH and the peroxy radicals is relatively well constrained due to the availability of measured kOH and NO. Since the model reproduces kOH within 10 %, unmeasured VOCs cannot be responsible for a possible underestimation of the peroxy radical production resulting from the reaction of VOCs with OH. As the NO concentration in the model was constrained to measurements, also the main loss processes of peroxy radicals in the high NOx regime, the reactions with NO, are well determined. In addition, a possible segregation effect by the fast variability of radical precursors in combination with non-synchronous observations was minimized by the experimental setup. The inlets of the LIF instrument and of other instruments were very close to each other (within 2 m). The sampling height was about 20 m above ground, 50 m away from the next street. Therefore, segregation is expected to play only a minor role. This is supported by the observed O3, NO, and NO2 concentrations, which were close (within 10 %) to a steady state. All these arguments indicate that the significant peroxy radical underestimation is probably caused by missing primary sources in the model.
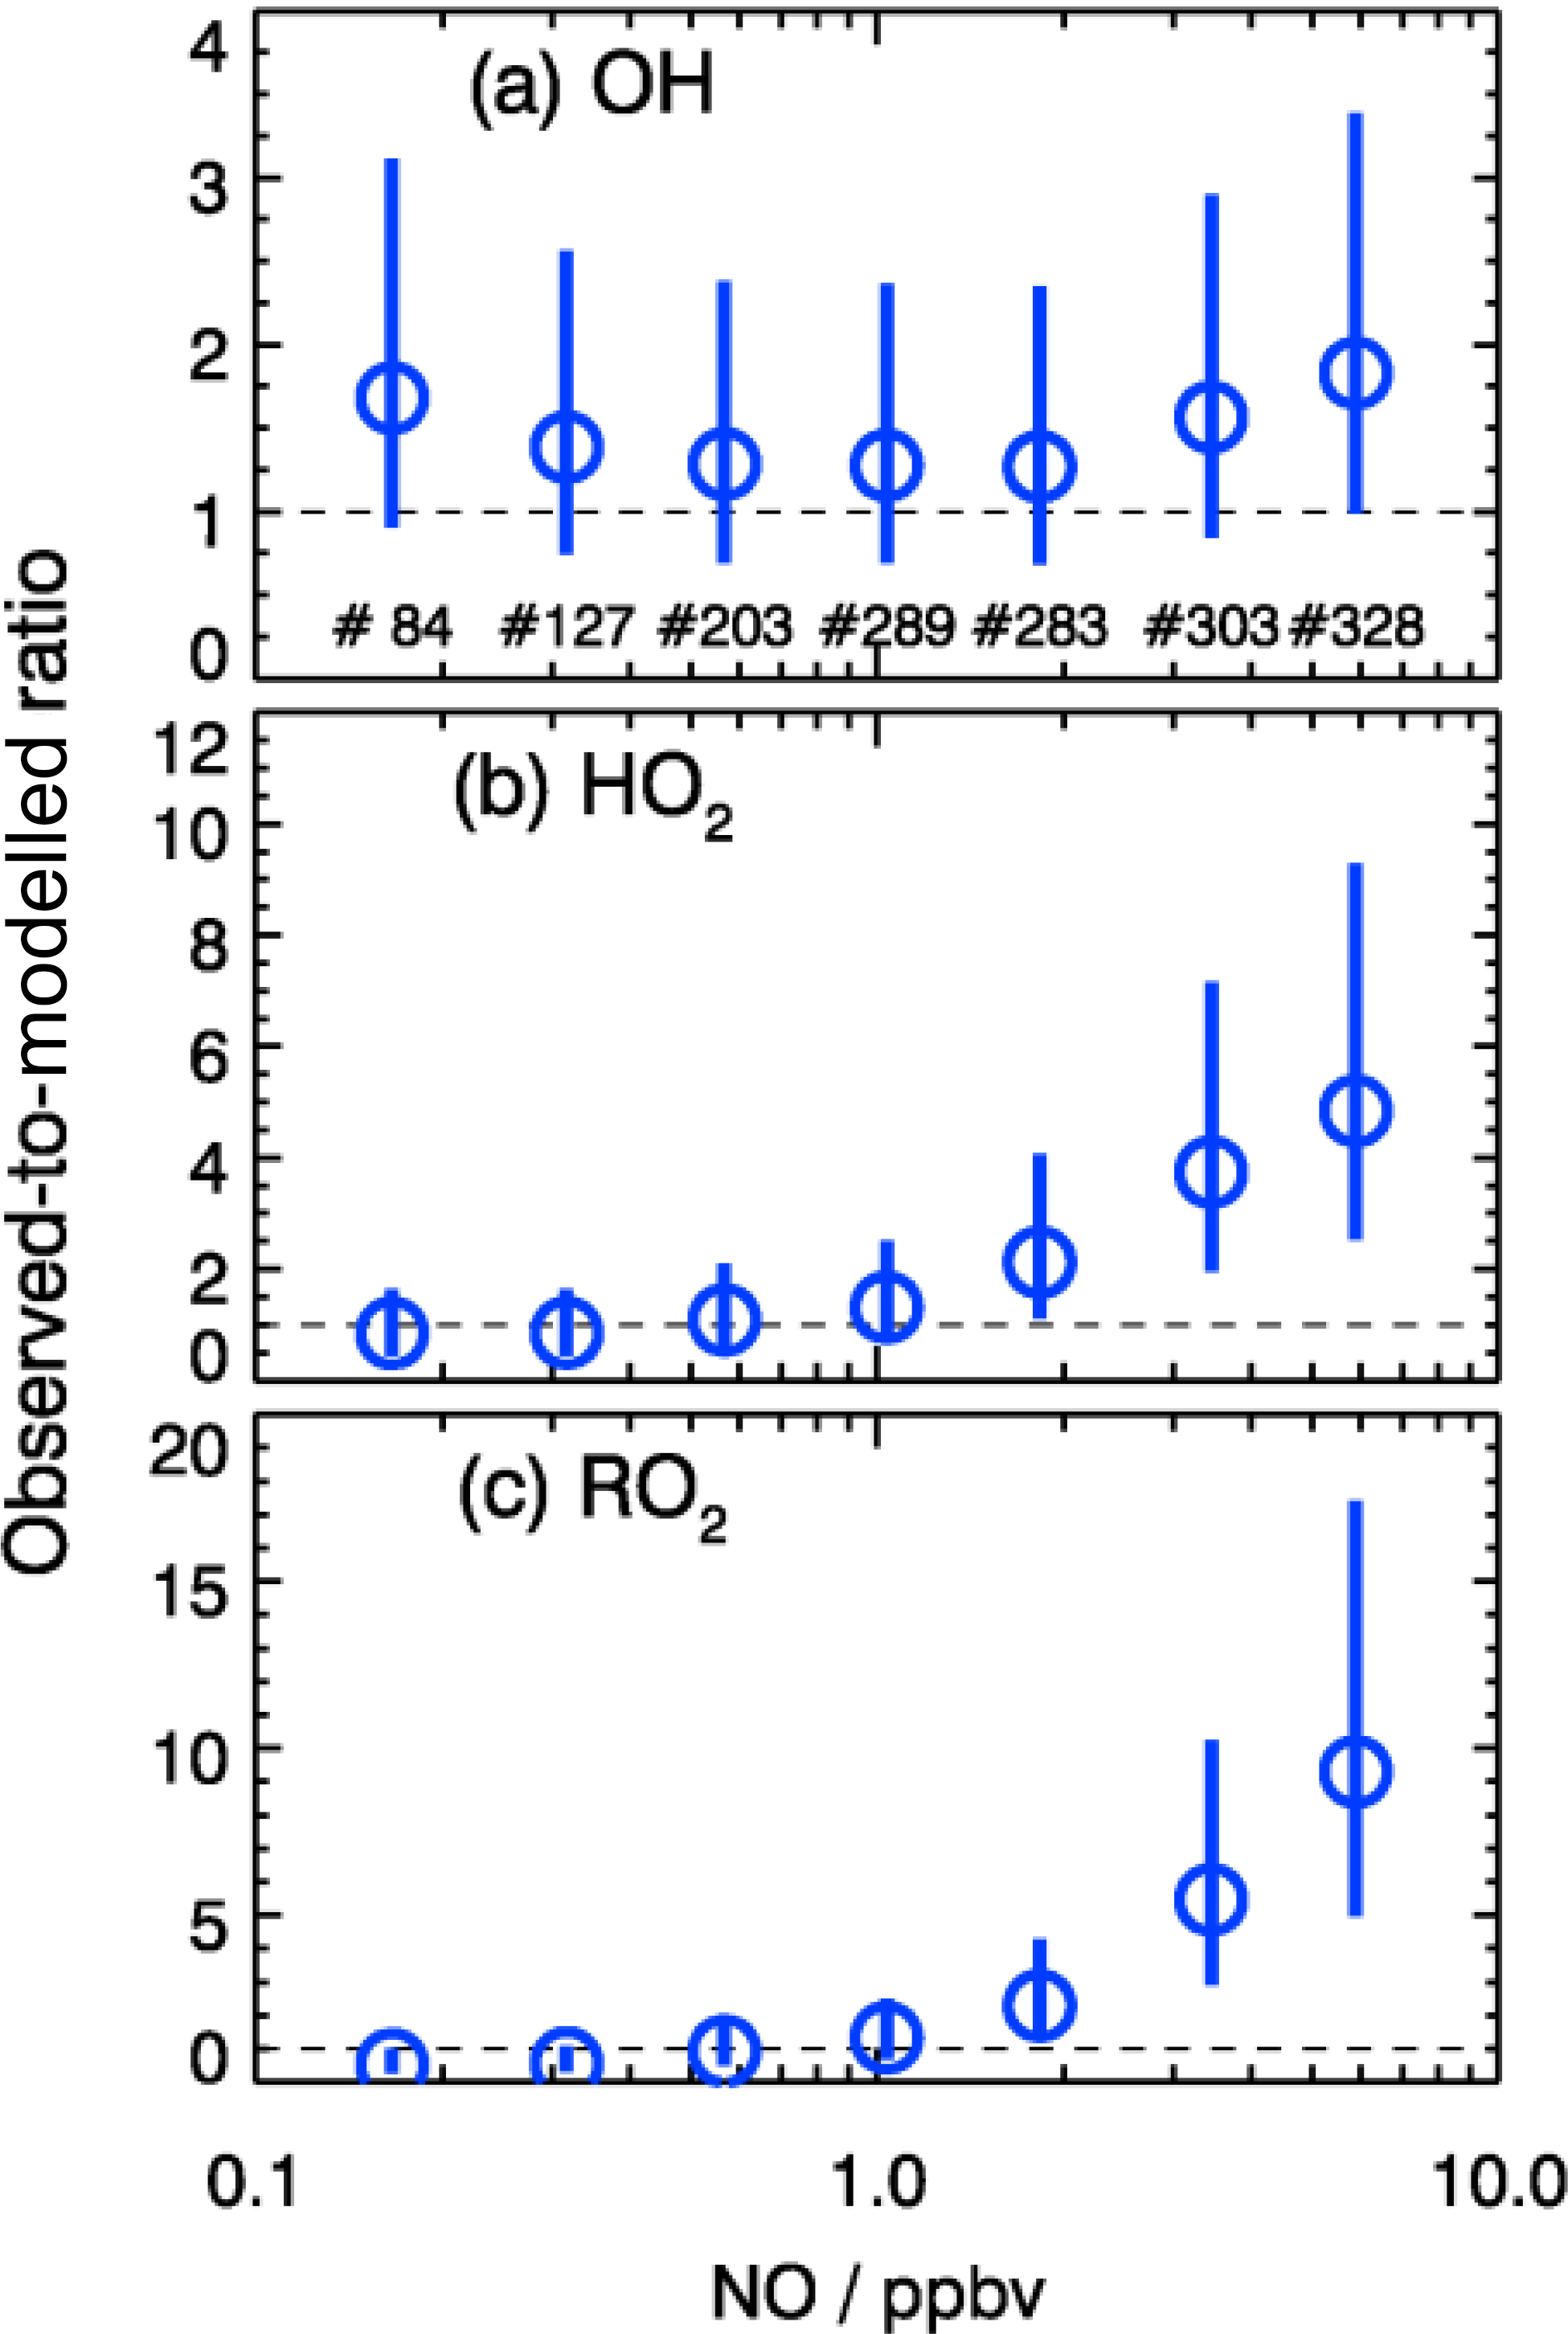
Figure 11Dependence of observed-to-modeled ratio of OH, HO2, and RO2 on NO concentrations for daytime conditions . The vertical lines denote the combined uncertainty from radical measurements and model calculations via error propagation. Numbers in the upper panel give the number of data points included in the analysis of each NO interval.
Based on the discussion above, we can assume that the peroxy radicals were in the steady state so that their production and destruction rates were balanced at all times. The production of peroxy radicals P(HO2+RO2) can be calculated as follows:
Here, kVOC denotes the part of OH reactivity which is caused by CO, CH4, VOC, and OVOC reactions. This value is equal to the difference between observed total OH reactivity and NOx reactivity. The known HO2 and RO2 primary sources contribute less than 5 % compared to the radical recycling rate at high NOx conditions.
The loss rate of HO2 and RO2 can be expressed as
For high NOx conditions, the termination rates for HO2+HO2, HO2+RO2, and RO2+RO2 are less than 1 % compared to the reaction rates between HO2 and NO. We also tested the equilibrium between HO2 and HNO4 as well as between RO2 and PAN-type compounds. They had only a minor impact on the ROx budget calculation (<4 %). The reaction of RO2 and NO is not in Eq. (4), because this reaction converts to HO2 and thus is not an effective loss of peroxy radicals.
Because the production and destruction rates of peroxy radicals must be balanced, the missing peroxy radical source P′(ROx) can be determined by the difference between known radical loss rate and production rate. It is worth noting that all primary sources and termination processes of HO2 and RO2 are negligible compared to the radical propagation.
As shown in Fig. 12, P′(ROx) is essentially zero in background air. In the clean and polluted cases, however, a significant missing radical source is found during daytime. On polluted days, P′(ROx) is very large and shows a broad maximum with a peak value of about 5 ppbv h−1 at 10:00 CNST. The production rate is 2.5 ppbv h−1 on average, nearly a factor of 5 larger than the known primary source of ROx during the polluted days (0.62 ppbv h−1). The error of the P′(ROx) determination is estimated to be ±1.7 ppbv by considering the uncertainty from measurement and kinetic reaction rates. On the clean days (Fig. 12), the missing radical source is significant only during morning hours, peaking at 3 ppbv h−1 at 10:00 CNST.
A missing primary radical source was already proposed to explain a morning RO2 underestimation by the model during the summer campaign in Wangdu (Tan et al., 2017). The proposed source originated from photolysis of ClNO2 generating chlorine radicals, which can oxidize VOC to RO2. However, the observed ClNO2 (0.5 ppbv, maximum of diurnal average; Tham et al., 2016) and Cl2 (Liu et al., 2017) concentrations could only explain 10 % and 30 % of the missing primary ROx source for the summer Wangdu campaign (Tan et al., 2017). During the winter campaign in Beijing, the missing primary ROx source was 2 to 3 times larger than what was found during the Wangdu summer campaign. The underestimation of RO2 concentrations in the model occurred mainly during the pollution episodes, when the measurement site was influenced by air masses transported from the Beijing central area or by local emissions. Since ClNO2 and molecular chlorine were not measured in this campaign, their possible role in the production of ROx is difficult to quantify. High N2O5 concentrations were observed in this campaign with values up to 10 ppbv during the pollution episodes (Wang et al., 2017a) and also aerosol chlorine was abundant (up to 7 µg m−3) to facilitate the production of ClNO2. Therefore, the ClNO2 has the potential to explain at least part of the missing RO2 source. However, the production rate of ClNO2 depends on the N2O5 aerosol uptake coefficient and the ClNO2 yield, both of which can be highly variable (Tham et al., 2018). Therefore, measurements of chlorine-chemistry-related species would be essential to evaluate its effect on the OH–HO2–RO2 radical system, but they are not available here. Implementing a generic primary RO2 radical source in the model allows increasing the modeled HO2 and RO2 concentrations. However, matching the modeled RO2 concentrations to the observations leads to an overprediction of OH by more than a factor of 5. To maintain a relatively good agreement between observed and modeled OH, an additional OH sink would be needed, but this is difficult to reconcile with the good agreement between the measured and modeled kOH.
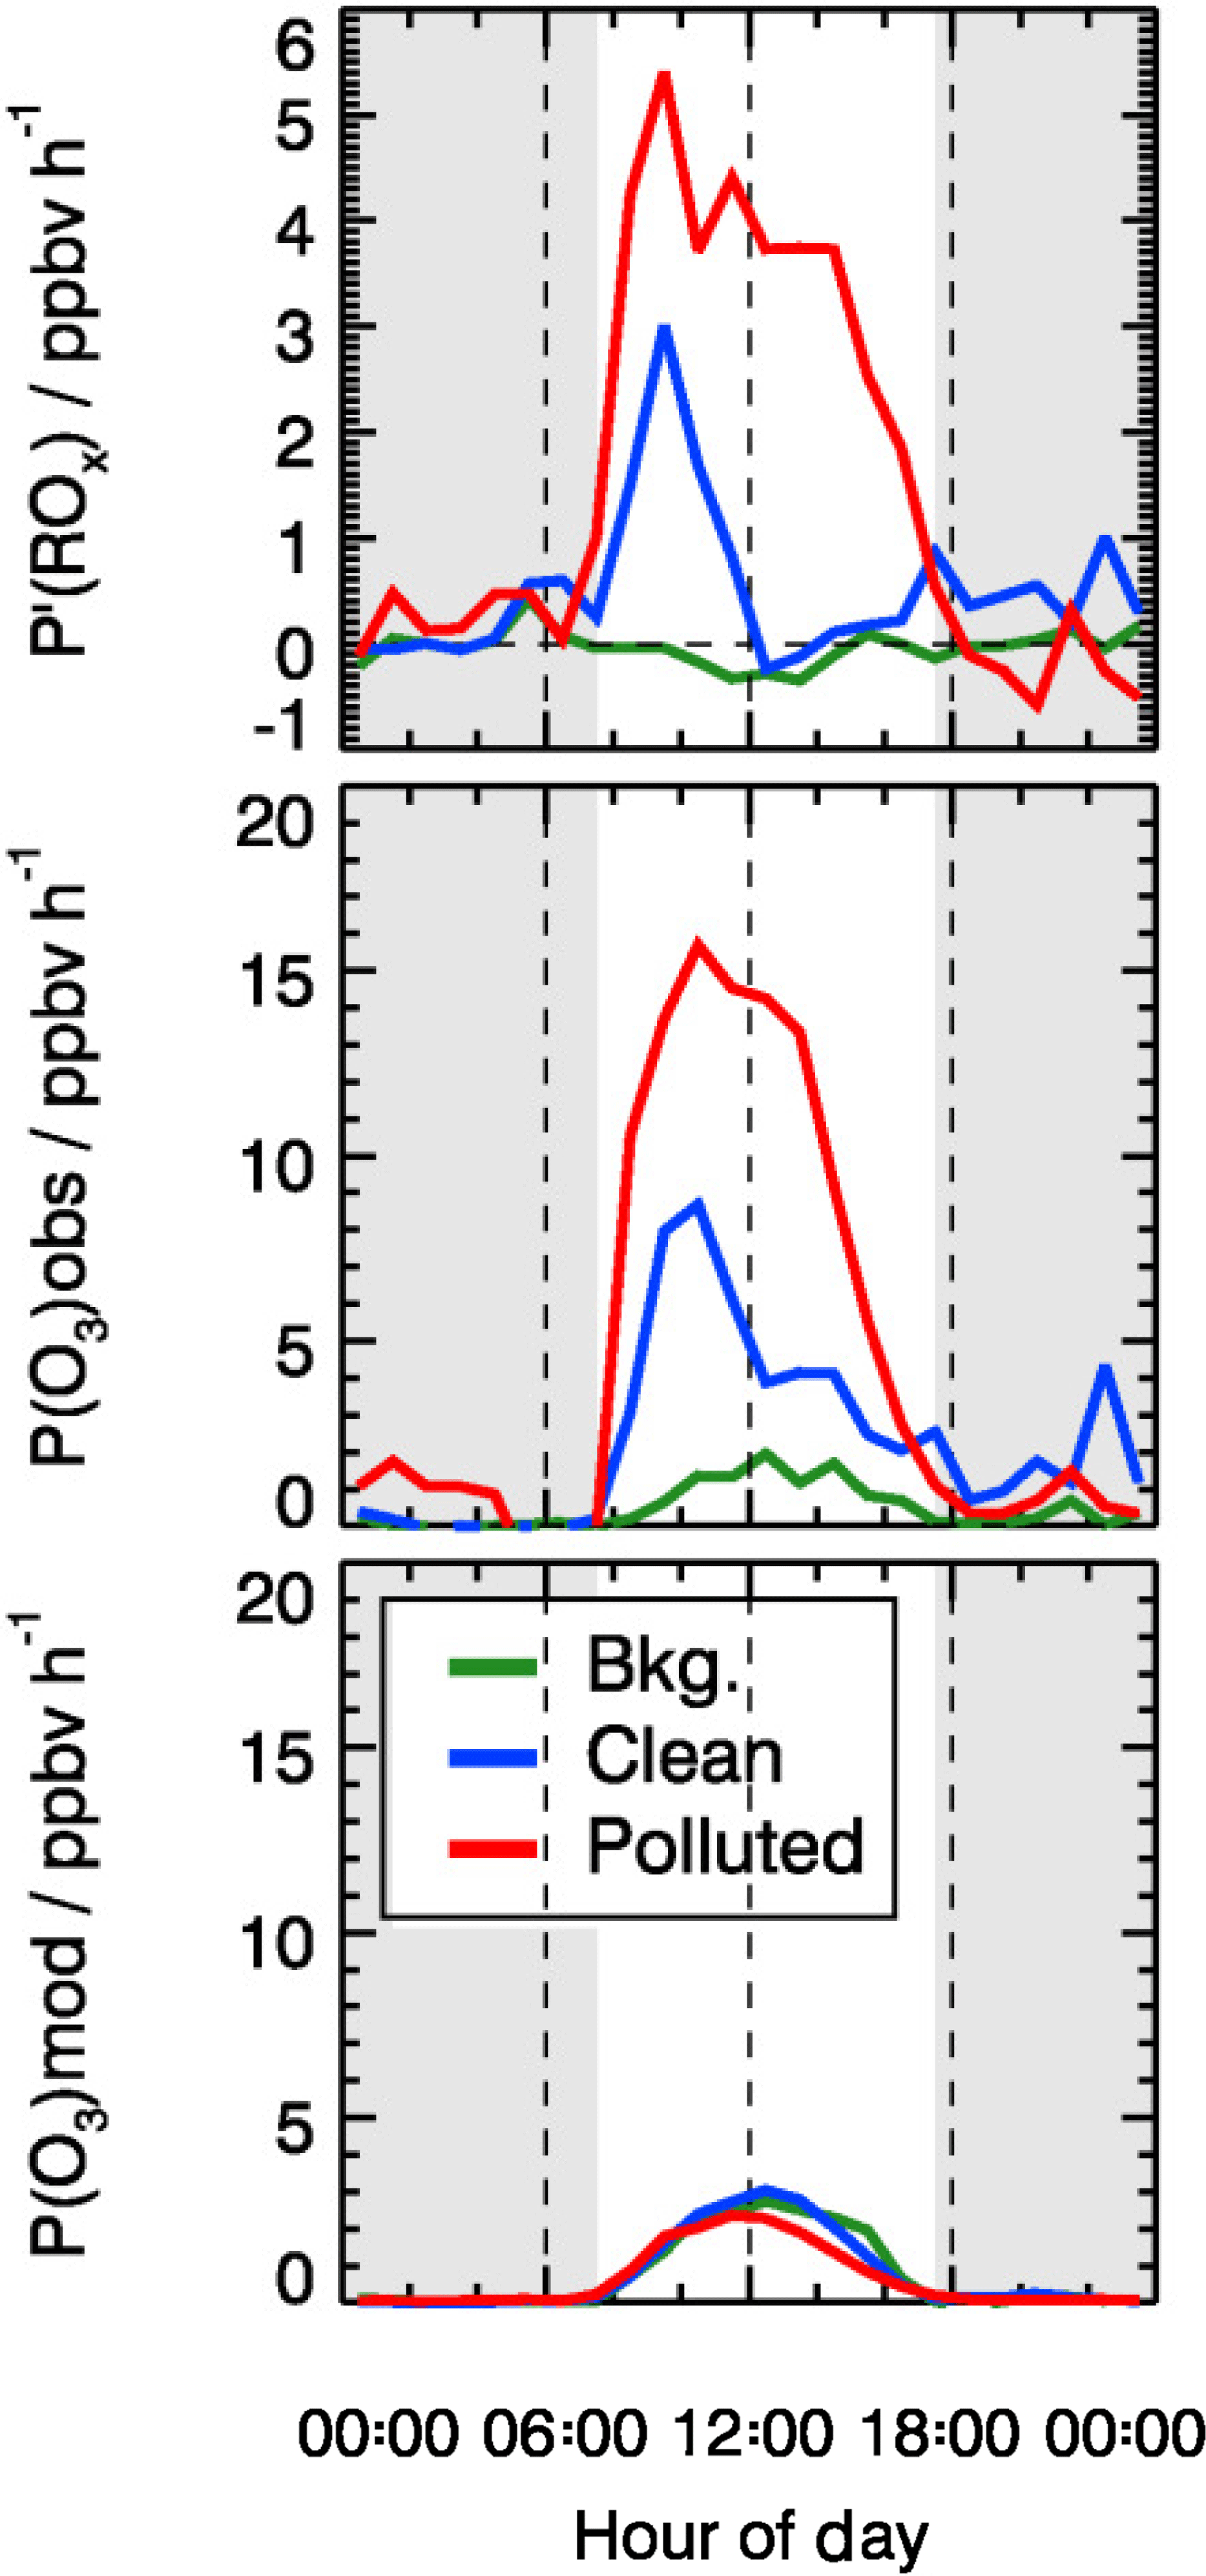
Figure 12Mean diurnal profiles of calculated missing ROx source (see text) and local ozone production determined from measured and modeled radical concentrations. The grey areas denote nighttime.
From the time series (Fig. 3) and the mean diurnal profiles (Fig. 4) of Ox, it is possible to deduce that excess Ox higher than the typical Ox value of 40 ppbv during afternoon only appeared during the pollution days. This indicates that the Ox was produced by local photochemical reactions and/or was transported from the upwind areas. The change of the Ox concentration is caused by both chemical production/destruction and physical processes (advection, vertical mixing, deposition, and so on). Therefore, it is important to note that the large local production rate is not necessarily observed in the measured local Ox concentration. In this study, we compared the chemical production rate and the Ox concentration change to illustrate whether chemical production can support the Ox concentration increase. The maximum instantaneous ozone production rate (not including any Ox potential loss process) can be approximated by the oxidation rate of NO by HO2 and RO2:
The base model underpredicts the observed HO2 and RO2 concentrations significantly, leading to the strong underestimation of this local ozone production rate (Fig. 12). As discussed above, an additional primary radical source is required to close the ROx budget, which would be the dominant contributor to the fast ozone production rate during pollution episodes. Similarly, ozone production rates that were directly measured in cities in the US were significantly higher than model calculations for high NOx regimes (Baier et al., 2017; Brune et al., 2016; Cazorla et al., 2012).
4.3 High OH concentration in Beijing during wintertime
The observed OH concentrations presented in this study are nearly 1 order of magnitude larger than what global models predict for northern China in winter (Lelieveld et al., 2016; Huang et al., 2014). The higher-than-expected OH concentrations indicate that the oxidation capacity of the atmosphere was high in Beijing and in the North China Plain in wintertime. As shown in Table 3, the averaged OH concentrations in Beijing for January were also higher than at other midlatitude field studies in which OH concentrations were measured in winter. In this study, the observed OH radical concentrations at noontime ranged from in severely polluted air () to in relatively clean air (). The reported OH maximum concentrations for urban and suburban locations in the northern hemispheric winter were in NYC (Ren et al., 2006), in Birmingham (Heard et al., 2004), and in Tokyo (Kanaya et al., 2007), respectively (Table 3). Comparably high OH concentrations of up to were observed at a rural site in Colorado in late February (Kim et al., 2014). In our study, the OH maximum reached from 20 to 28 February with similar j(O1D) values (maximum on average) to those observed at the Colorado site. On the other hand, the OH reactivity was on average less than 5 s−1, which resulted in much slower OH turnover rates at that rural site in the US with an estimated maximum of 1.6 ppbv h−1 (Kim et al., 2014). The combination of high OH concentration and moderate OH reactivity at Huairou/Beijing resulted in a fast oxidation rate by OH up to 3.6 ppbv h−1 for the campaign average conditions.
The primary radical production rate at Huairou/Beijing was in the lower range among all other winter HOx campaigns (Table 3). However, the high observed OH concentrations and moderate OH reactivities led to a fast OH turnover rate, which had to be sustained by a large radical chain length. The radical chain length is used to describe the efficiency of radical propagation. It can be calculated as follows:
The radical chain length was up to five at Huairou/Beijing but was observed to be in the range from two to three in other winter campaigns (Table 3). This indicates radical propagation is very efficient during the BEST-ONE campaign. However, if radical primary production is missing in the calculation, the calculated radical chain length would be too large. Therefore, for this study, the chain length should be regarded as an upper limit. For example, in the NACHTT campaign, only the OH production rate was taken into account by Kim et al. (2014), which leads to an overestimation of the radical chain length.
Secondary products are believed to be major contributors to aerosol particles in haze events (Guo et al., 2014; Cheng et al., 2016; Wang et al., 2016, 2017b). An important question is what is the contribution of gas-phase reactions to haze formation. Previous studies attempted to quantify the contributions of gas-phase and aerosol-phase reactions to oxidation processes during wintertime by chemical models (Huang et al., 2014; Guo et al., 2014; Nan et al., 2017). In this study, the in situ observations of the OH radical provide an experimental constraint to quantify the sulfate and nitrate production by OH oxidation. As discussed above, the high OH concentrations indicate a fast gas-phase oxidation during wintertime in Beijing. As a consequence, the nitrate acid production rate P(HNO3) during wintertime at Huairou/Beijing was 0.28 ppbv h−1 for daytime averaged, only 3 times slower compared to the campaign in Wangdu during summertime (0.81 ppbv h−1). In comparison, the SO2 oxidation rate was 0.02 ppbv h−1. One should keep in mind that the formation of gas-phase sulfate and nitrate via OH oxidation does not necessarily lead to particle formation, due to the dependence on the gas–aerosol partitioning. The relatively fast oxidation rate presented here only shows the particle growth potential from gas-phase reactions. Nevertheless, the in situ measurements presented in this study provide experimental evidence for a strong gas-phase production potential of aerosol precursors, which underlines the importance of taking OH chemistry into account for the understanding of the wintertime haze formation.
The BEST-ONE campaign was performed at Huairou at the northwest edge of Beijing in 2016 to elucidate pollution formation mechanisms in the North China Plain providing the first wintertime observations of OH, HO2, and RO2 radicals in this region. Relatively high radical concentrations were observed compared to other winter campaigns in suburban and urban environments at similar latitudes. OH radical concentrations at noontime ranged from in severely polluted air () to in relatively clean air (), 2-fold higher than those observed in Birmingham (Heard et al., 2004), Tokyo (Kanaya et al., 2007), and NYC (Ren et al., 2006) during wintertime. OH reactivity was measured simultaneously during this campaign and showed a large variability in values between 5 and 95 s−1. The experimentally determined OH cumulative turnover rates were on average 20.7 ppbv per day, indicating a fast gas-phase oxidation capacity in this region even in wintertime. During a strong haze event in early March at the end of the campaign, the OH turnover rate increased to more than 20 ppbv h−1, which is comparable to summertime conditions.
In addition to the radical observations, numerous parameters were measured during the BEST-ONE campaign, revealing the key processes of radical chemistry for wintertime pollution episodes. The photolysis of O3, the globally most important source of OH radicals, was strongly reduced due to the low UV-B levels and the small concentration of water vapor during wintertime. The initiation of ROx radical chain reactions was instead dominated by the photolysis of HONO, which contributed about 46 % of the observed total primary radical production rate. Most of the observed HONO cannot be explained by the gas-phase production from the OH+NO reaction. Similar to summertime, other HONO sources must be dominating the HONO production, thereby playing a critical role in the photochemical oxidation of pollutants in urban air in wintertime. The alkene ozonolysis reactions were the second important radical source, contributing 28 % to the total primary source. The radical chain termination processes were dominated by the reaction between OH and NO2 (49 %).
The comparison of radical concentrations between observations and box model simulations based on long-lived trace gas measurements showed only 30 % difference during clean air episodes. However, RO2 radical concentrations were underestimated by a factor of 5 by the model in the high NOx regime. This severe underestimation of RO2 suggests that an important radical source is missing in the current chemical mechanism during the pollution episodes. As a consequence, the production of secondary pollutants like ozone driven by this missing radical source during wintertime haze events in Beijing could be strongly underestimated. Although the chlorine chemistry has the potential to partly explain the missing radical source, its effect on radical concentrations could not be quantified due to the lack of ClNO2 measurements. In the future, the measurements of chlorine-related species (e.g., ClNO2, Cl2) would be helpful to gain more insights regarding what the contributions of ClNO2 are to the radical sources and to the formation of secondary pollution.
The data used in this study are available from the corresponding author upon request (k.lu@pku.edu.cn).
The supplement related to this article is available online at: https://doi.org/10.5194/acp-18-12391-2018-supplement.
YZ, AW, and AK organized the field campaign. KL and YZ designed the experiments on ROx chemistry. KL, FR and ZT analyzed the data. ZT wrote the manuscript with input from FR and KL. All authors contributed to measurements, discussing results, and commenting on the manuscript.
The authors declare that they have no conflict of interest.
We thank the science teams of the BEST-ONE campaign. This work was supported
by the National Natural Science Foundation of China (grant nos. 91544225,
21522701, 21190052, and 41375124), the National Science and Technology
Support Program of China (no. 2014BAC21B01), the Strategic Priority
Research Program of the Chinese Academy of Sciences (grant no.
XDB05010500), the Collaborative Innovation Center for Regional
Environmental Quality, the EU-project AMIS (Fate and Impact of Atmospheric
Pollutants, PIRSES-GA-2011-295132), the BMBF project: ID-CLAR
(01DO17036), and the special fund of State Key Joint Laboratory of Environment Simulation
and Pollution Control (18K03ESPCP). The authors gratefully acknowledge the
NOAA Air Resources Laboratory (ARL) for the provision of the HYSPLIT
transport and dispersion model and READY website
(http://www.ready.noaa.gov) used in this publication.
Edited by: Steven Brown
Reviewed by: two anonymous referees
Alicke, B., Geyer, A., Hofzumahaus, A., Holland, F., Konrad, S., Patz, H. W., Schafer, J., Stutz, J., Volz-Thomas, A., and Platt, U.: OH formation by HONO photolysis during the BERLIOZ experiment, J. Geophys. Res., 108, 8247, https://doi.org/10.1029/2001jd000579, 2003.
Baier, B. C., Brune, W. H., Miller, D. O., Blake, D., Long, R., Wisthaler, A., Cantrell, C., Fried, A., Heikes, B., Brown, S., McDuffie, E., Flocke, F., Apel, E., Kaser, L., and Weinheimer, A.: Higher measured than modeled ozone production at increased NOx levels in the Colorado Front Range, Atmos. Chem. Phys., 17, 11273–11292, https://doi.org/10.5194/acp-17-11273-2017, 2017.
Brune, W. H., Baier, B. C., Thomas, J., Ren, X., Cohen, R. C., Pusede, S. E., Browne, E. C., Goldstein, A. H., Gentner, D. R., Keutsch, F. N., Thornton, J. A., Harrold, S., Lopez-Hilfiker, F. D., and Wennberg, P. O.: Ozone production chemistry in the presence of urban plumes, Faraday Discuss., 189, 161–189, https://doi.org/10.1039/C5FD00204D, 2016.
Cazorla, M., Brune, W. H., Ren, X., and Lefer, B.: Direct measurement of ozone production rates in Houston in 2009 and comparison with two estimation methods, Atmos. Chem. Phys., 12, 1203–1212, https://doi.org/10.5194/acp-12-1203-2012, 2012.
Cheng, Y., Zheng, G., Wei, C., Mu, Q., Zheng, B., Wang, Z., Gao, M., Zhang, Q., He, K., Carmichael, G., Pöschl, U., and Su, H.: Reactive nitrogen chemistry in aerosol water as a source of sulfate during haze events in China, Sci. Adv., 2, , e1601530, https://doi.org/10.1126/sciadv.1601530, 2016.
Dusanter, S., Vimal, D., Stevens, P. S., Volkamer, R., Molina, L. T., Baker, A., Meinardi, S., Blake, D., Sheehy, P., Merten, A., Zhang, R., Zheng, J., Fortner, E. C., Junkermann, W., Dubey, M., Rahn, T., Eichinger, B., Lewandowski, P., Prueger, J., and Holder, H.: Measurements of OH and HO2 concentrations during the MCMA-2006 field campaign – Part 2: Model comparison and radical budget, Atmos. Chem. Phys., 9, 6655–6675, https://doi.org/10.5194/acp-9-6655-2009, 2009.
Emmerson, K. M., Carslaw, N., Carpenter, L. J., Heard, D. E., Lee, J. D., and Pilling, M. J.: Urban atmospheric chemistry during the PUMA campaign 1: Comparison of modelled OH and HO2 concentrations with measurements, J. Atmos. Chem., 52, 143–164, https://doi.org/10.1007/s10874-005-1322-3, 2005a.
Emmerson, K. M., Carslaw, N., and Pilling, M. J.: Urban atmospheric chemistry during the PUMA campaign 2: Radical budgets for OH, HO2 and RO2, J. Atmos. Chem., 52, 165–183, https://doi.org/10.1007/s10874-005-1323-2, 2005b.
Emmerson, K. M., Carslaw, N., Carslaw, D. C., Lee, J. D., McFiggans, G., Bloss, W. J., Gravestock, T., Heard, D. E., Hopkins, J., Ingham, T., Pilling, M. J., Smith, S. C., Jacob, M., and Monks, P. S.: Free radical modelling studies during the UK TORCH Campaign in Summer 2003, Atmos. Chem. Phys., 7, 167–181, https://doi.org/10.5194/acp-7-167-2007, 2007.
Fuchs, H., Holland, F., and Hofzumahaus, A.: Measurement of tropospheric RO2 and HO2 radicals by a laser-induced fluorescence instrument, Rev. Sci. Instrum., 79, 084104, https://doi.org/10.1063/1.2968712, 2008.
Fuchs, H., Bohn, B., Hofzumahaus, A., Holland, F., Lu, K. D., Nehr, S., Rohrer, F., and Wahner, A.: Detection of HO2 by laser-induced fluorescence: calibration and interferences from RO2 radicals, Atmos. Meas. Tech., 4, 1209–1225, https://doi.org/10.5194/amt-4-1209-2011, 2011.
Fuchs, H., Tan, Z., Hofzumahaus, A., Broch, S., Dorn, H.-P., Holland, F., Künstler, C., Gomm, S., Rohrer, F., Schrade, S., Tillmann, R., and Wahner, A.: Investigation of potential interferences in the detection of atmospheric ROx radicals by laser-induced fluorescence under dark conditions, Atmos. Meas. Tech., 9, 1431–1447, https://doi.org/10.5194/amt-9-1431-2016, 2016.
Fuchs, H., Novelli, A., Rolletter, M., Hofzumahaus, A., Pfannerstill, E. Y., Kessel, S., Edtbauer, A., Williams, J., Michoud, V., Dusanter, S., Locoge, N., Zannoni, N., Gros, V., Truong, F., Sarda-Esteve, R., Cryer, D. R., Brumby, C. A., Whalley, L. K., Stone, D., Seakins, P. W., Heard, D. E., Schoemaecker, C., Blocquet, M., Coudert, S., Batut, S., Fittschen, C., Thames, A. B., Brune, W. H., Ernest, C., Harder, H., Muller, J. B. A., Elste, T., Kubistin, D., Andres, S., Bohn, B., Hohaus, T., Holland, F., Li, X., Rohrer, F., Kiendler-Scharr, A., Tillmann, R., Wegener, R., Yu, Z., Zou, Q., and Wahner, A.: Comparison of OH reactivity measurements in the atmospheric simulation chamber SAPHIR, Atmos. Meas. Tech., 10, 4023–4053, https://doi.org/10.5194/amt-10-4023-2017, 2017a.
Fuchs, H., Tan, Z., Lu, K., Bohn, B., Broch, S., Brown, S. S., Dong, H., Gomm, S., Häseler, R., He, L., Hofzumahaus, A., Holland, F., Li, X., Liu, Y., Lu, S., Min, K.-E., Rohrer, F., Shao, M., Wang, B., Wang, M., Wu, Y., Zeng, L., Zhang, Y., Wahner, A., and Zhang, Y.: OH reactivity at a rural site (Wangdu) in the North China Plain: contributions from OH reactants and experimental OH budget, Atmos. Chem. Phys., 17, 645–661, https://doi.org/10.5194/acp-17-645-2017, 2017b.
Goliff, W. S., Stockwell, W. R., and Lawson, C. V.: The regional atmospheric chemistry mechanism, version 2, Atmos. Environ., 68, 174–185, 2013.
Griffith, S. M., Hansen, R. F., Dusanter, S., Michoud, V., Gilman, J. B., Kuster, W. C., Veres, P. R., Graus, M., de Gouw, J. A., Roberts, J., Young, C., Washenfelder, R., Brown, S. S., Thalman, R., Waxman, E., Volkamer, R., Tsai, C., Stutz, J., Flynn, J. H., Grossberg, N., Lefer, B., Alvarez, S. L., Rappenglueck, B., Mielke, L. H., Osthoff, H. D., and Stevens, P. S.: Measurements of Hydroxyl and Hydroperoxy Radicals during CalNex-LA: Model Comparisons and Radical Budgets, J. Geophys. Res., 121, 4211–4232, https://doi.org/10.1002/2015JD024358, 2016.
Guo, S., Hu, M., Zamora, M. L., Peng, J., Shang, D., Zheng, J., Du, Z., Wu, Z., Shao, M., Zeng, L., Molina, M. J., and Zhang, R.: Elucidating severe urban haze formation in China, P. Natl. Acad. Sci. USA, 111, 17373–17378, https://doi.org/10.1073/pnas.1419604111, 2014.
Heard, D. E., Carpenter, L. J., Creasey, D. J., Hopkins, J. R., Lee, J. D., Lewis, A. C., Pilling, M. J., Seakins, P. W., Carslaw, N., and Emmerson, K. M.: High levels of the hydroxyl radical in the winter urban troposphere, Geophys. Res. Lett., 31, L18112, https://doi.org/10.1029/2004gl020544, 2004.
Hofzumahaus, A., Aschmutat, U., Hessling, M., Holland, F., and Ehhalt, D. H.: The measurement of tropospheric OH radicals by laser-induced fluorescence spectroscopy during the POPCORN field campaign, Geophys. Res. Lett., 23, 2541–2544, https://doi.org/10.1029/96gl02205, 1996.
Hofzumahaus, A., Rohrer, F., Lu, K., Bohn, B., Brauers, T., Chang, C.-C., Fuchs, H., Holland, F., Kita, K., Kondo, Y., Li, X., Lou, S., Shao, M., Zeng, L., Wahner, A., and Zhang, Y.: Amplified Trace Gas Removal in the Troposphere, Science, 324, 1702–1704, https://doi.org/10.1126/science.1164566, 2009.
Holland, F., Hofzumahaus, A., Schäfer, J., Kraus, A., and Pätz, H. W.: Measurements of OH and HO2 radical concentrations and photolysis frequencies during BERLIOZ, J. Geophys. Res., 108, 8246, https://doi.org/10.1029/2001jd001393, 2003.
Huang, R. J., Zhang, Y. L., Bozzetti, C., Ho, K. F., Cao, J. J., Han, Y. M., Daellenbach, K. R., Slowik, J. G., Platt, S. M., Canonaco, F., Zotter, P., Wolf, R., Pieber, S. M., Bruns, E. A., Crippa, M., Ciarelli, G., Piazzalunga, A., Schwikowski, M., Abbaszade, G., Schnelle-Kreis, J., Zimmermann, R., An, Z. S., Szidat, S., Baltensperger, U., El Haddad, I., and Prevot, A. S. H.: High secondary aerosol contribution to particulate pollution during haze events in China, Nature, 514, 218–222, https://doi.org/10.1038/nature13774, 2014.
Kan, H., Chen, R., and Tong, S.: Ambient air pollution, climate change, and population health in China, Environ. Int., 42, 10–19, https://doi.org/10.1016/j.envint.2011.03.003, 2012.
Kanaya, Y., Cao, R., Akimoto, H., Fukuda, M., Komazaki, Y., Yokouchi, Y., Koike, M., Tanimoto, H., Takegawa, N., and Kondo, Y.: Urban photochemistry in central Tokyo: 1. Observed and modeled OH and HO2 radical concentrations during the winter and summer of 2004, J. Geophys. Res., 112, D21312, https://doi.org/10.1029/2007jd008670, 2007.
Kanaya, Y., Fukuda, M., Akimoto, H., Takegawa, N., Komazaki, Y., Yokouchi, Y., Koike, M., and Kondo, Y.: Urban photochemistry in central Tokyo: 2. Rates and regimes of oxidant (O3+NO2) production, J. Geophys. Res., 113, D06301, https://doi.org/10.1029/2007JD008671, 2008.
Kim, S., VandenBoer, T. C., Young, C. J., Riedel, T. P., Thornton, J. A., Swarthout, B., Sive, B., Lerner, B., Gilman, J. B., Warneke, C., Roberts, J. M., Guenther, A., Wagner, N. L., Dube, W. P., Williams, E., and Brown, S. S.: The primary and recycling sources of OH during the NACHTT-2011 campaign: HONO as an important OH primary source in the wintertime, J. Geophys. Res., 119, 6886–6896, https://doi.org/10.1002/2013jd019784, 2014.
Kleffmann, J., Gavriloaiei, T., Hofzumahaus, A., Holland, F., Koppmann, R., Rupp, L., Schlosser, E., Siese, M., and Wahner, A.: Daytime formation of nitrous acid: A major source of OH radicals in a forest, Geophys. Res. Lett., 32, L05818, https://doi.org/10.1029/2005GL022524, 2005.
Kleinman, L. I., Daum, P. H., Lee, Y. N., Nunnermacker, L. J., Springston, S. R., Weinstein-Lloyd, J., and Rudolph, J.: Ozone production efficiency in an urban area, J. Geophys. Res., 107, 4733, https://doi.org/10.1029/2002jd002529, 2002.
Kley, D., Geiss, H., and Mohnen, V. A.: Tropospheric ozone at elevated sites and precursor emissions in the United States and Europe, Atmos. Environ., 28, 149–158, 1994.
Kraus, A. and Hofzumahaus, A.: Field Measurements of Atmospheric Photolysis Frequencies for O3, NO2, HCHO, CH3CHO, H2O2, and HONO by UV Spectroradiometry, J. Atmos. Chem., 31, 161–180, https://doi.org/10.1023/a:1005888220949, 1998.
Lelieveld, J., Gromov, S., Pozzer, A., and Taraborrelli, D.: Global tropospheric hydroxyl distribution, budget and reactivity, Atmos. Chem. Phys., 16, 12477–12493, https://doi.org/10.5194/acp-16-12477-2016, 2016.
Lew, M. M., Dusanter, S., and Stevens, P. S.: Measurement of interferences associated with the detection of the hydroperoxy radical in the atmosphere using laser-induced fluorescence, Atmos. Meas. Tech., 11, 95–109, https://doi.org/10.5194/amt-11-95-2018, 2018.
Liu, X., Qu, H., Huey, L. G., Wang, Y., Sjostedt, S., Zeng, L., Lu, K., Wu, Y., Hu, M., Shao, M., Zhu, T., and Zhang, Y.: High Levels of Daytime Molecular Chlorine and Nitryl Chloride at a Rural Site on the North China Plain, Environ. Sci. Technol., 51, 9588–9595, https://doi.org/10.1021/acs.est.7b03039, 2017.
Lou, S., Holland, F., Rohrer, F., Lu, K., Bohn, B., Brauers, T., Chang, C. C., Fuchs, H., Häseler, R., Kita, K., Kondo, Y., Li, X., Shao, M., Zeng, L., Wahner, A., Zhang, Y., Wang, W., and Hofzumahaus, A.: Atmospheric OH reactivities in the Pearl River Delta – China in summer 2006: measurement and model results, Atmos. Chem. Phys., 10, 11243–11260, https://doi.org/10.5194/acp-10-11243-2010, 2010.
Lu, K. D., Rohrer, F., Holland, F., Fuchs, H., Bohn, B., Brauers, T., Chang, C. C., Häseler, R., Hu, M., Kita, K., Kondo, Y., Li, X., Lou, S. R., Nehr, S., Shao, M., Zeng, L. M., Wahner, A., Zhang, Y. H., and Hofzumahaus, A.: Observation and modelling of OH and HO2 concentrations in the Pearl River Delta 2006: a missing OH source in a VOC rich atmosphere, Atmos. Chem. Phys., 12, 1541–1569, https://doi.org/10.5194/acp-12-1541-2012, 2012.
Lu, K. D., Hofzumahaus, A., Holland, F., Bohn, B., Brauers, T., Fuchs, H., Hu, M., Häseler, R., Kita, K., Kondo, Y., Li, X., Lou, S. R., Oebel, A., Shao, M., Zeng, L. M., Wahner, A., Zhu, T., Zhang, Y. H., and Rohrer, F.: Missing OH source in a suburban environment near Beijing: observed and modelled OH and HO2 concentrations in summer 2006, Atmos. Chem. Phys., 13, 1057–1080, https://doi.org/10.5194/acp-13-1057-2013, 2013.
Mao, J., Ren, X., Chen, S., Brune, W. H., Chen, Z., Martinez, M., Harder, H., Lefer, B., Rappenglueck, B., Flynn, J., and Leuchner, M.: Atmospheric oxidation capacity in the summer of Houston 2006: Comparison with summer measurements in other metropolitan studies, Atmos. Environ., 44, 4107–4115, https://doi.org/10.1016/j.atmosenv.2009.01.013, 2010.
Mao, J., Ren, X., Zhang, L., Van Duin, D. M., Cohen, R. C., Park, J.-H., Goldstein, A. H., Paulot, F., Beaver, M. R., Crounse, J. D., Wennberg, P. O., DiGangi, J. P., Henry, S. B., Keutsch, F. N., Park, C., Schade, G. W., Wolfe, G. M., Thornton, J. A., and Brune, W. H.: Insights into hydroxyl measurements and atmospheric oxidation in a California forest, Atmos. Chem. Phys., 12, 8009–8020, https://doi.org/10.5194/acp-12-8009-2012, 2012.
Meusel, H., Tamm, A., Kuhn, U., Wu, D., Leifke, A. L., Fiedler, S., Ruckteschler, N., Yordanova, P., Lang-Yona, N., Pöhlker, M., Lelieveld, J., Hoffmann, T., Pöschl, U., Su, H., Weber, B., and Cheng, Y.: Emission of nitrous acid from soil and biological soil crusts represents an important source of HONO in the remote atmosphere in Cyprus, Atmos. Chem. Phys., 18, 799–813, https://doi.org/10.5194/acp-18-799-2018, 2018.
Nan, J., Wang, S., Guo, Y., Xiang, Y., and Zhou, B.: Study on the daytime OH radical and implication for its relationship with fine particles over megacity of Shanghai, China, Atmos. Environ., 154, 167–178, https://doi.org/10.1016/j.atmosenv.2017.01.046, 2017.
Novelli, A., Hens, K., Tatum Ernest, C., Kubistin, D., Regelin, E., Elste, T., Plass-Dülmer, C., Martinez, M., Lelieveld, J., and Harder, H.: Characterisation of an inlet pre-injector laser-induced fluorescence instrument for the measurement of atmospheric hydroxyl radicals, Atmos. Meas. Tech., 7, 3413–3430, https://doi.org/10.5194/amt-7-3413-2014, 2014.
Peeters, J., Muller, J.-F., Stavrakou, T., and Nguyen, V. S.: Hydroxyl radical recycling in isoprene oxidation driven by hydrogen bonding and hydrogen tunneling: The upgraded LIM1 mechanism, J. Phys. Chem. A, 118, 8625–8643, 2014.
Ren, X., Brune, W. H., Mao, J., Mitchell, M. J., Lesher, R. L., Simpas, J. B., Metcalf, A. R., Schwab, J. J., Cai, C., Li, Y., Demerjian, K. L., Felton, H. D., Boynton, G., Adams, A., Perry, J., He, Y., Zhou, X., and Hou, J.: Behavior of OH and HO2 in the winter atmosphere in New York city, Atmos. Environ., 40, 252–263, https://doi.org/10.1016/j.atmosenv.2005.11.073, 2006.
Ren, X. R., van Duin, D., Cazorla, M., Chen, S., Mao, J. Q., Zhang, L., Brune, W. H., Flynn, J. H., Grossberg, N., Lefer, B. L., Rappengluck, B., Wong, K. W., Tsai, C., Stutz, J., Dibb, J. E., Jobson, B. T., Luke, W. T., and Kelley, P.: Atmospheric oxidation chemistry and ozone production: Results from SHARP 2009 in Houston, Texas, J. Geophys. Res., 118, 5770–5780, https://doi.org/10.1002/jgrd.50342, 2013.
Rickly, P. and Stevens, P. S.: Measurements of a potential interference with laser-induced fluorescence measurements of ambient OH from the ozonolysis of biogenic alkenes, Atmos. Meas. Tech., 11, 1–16, https://doi.org/10.5194/amt-11-1-2018, 2018.
Shirley, T. R., Brune, W. H., Ren, X., Mao, J., Lesher, R., Cardenas, B., Volkamer, R., Molina, L. T., Molina, M. J., Lamb, B., Velasco, E., Jobson, T., and Alexander, M.: Atmospheric oxidation in the Mexico City Metropolitan Area (MCMA) during April 2003, Atmos. Chem. Phys., 6, 2753–2765, https://doi.org/10.5194/acp-6-2753-2006, 2006.
Stein, A. F., Draxler, R. R., Rolph, G. D., Stunder, B. J. B., Cohen, M. D., and Ngan, F.: NOAA's HYSPLIT Atmospheric Transport and Dispersion Modeling System, B. Am. Meteorol. Soc., 96, 2059–2077, https://doi.org/10.1175/bams-d-14-00110.1, 2015.
Su, H., Cheng, Y. F., Oswald, R., Behrendt, T., Trebs, I., Meixner, F. X., Andreae, M. O., Cheng, P., Zhang, Y., and Pöschl, U.: Soil Nitrite as a Source of Atmospheric HONO and OH Radicals, Science, 333, 1616–1618, https://doi.org/10.1126/science.1207687, 2011.
Sun, Y. L., Zhuang, G. S., Tang, A. H., Wang, Y., and An, Z. S.: Chemical characteristics of PM2.5 and PM10 in haze-fog episodes in Beijing, Environ. Sci. Technol., 40, 3148–3155, https://doi.org/10.1021/es051533g, 2006.
Tan, Z., Fuchs, H., Lu, K., Hofzumahaus, A., Bohn, B., Broch, S., Dong, H., Gomm, S., Häseler, R., He, L., Holland, F., Li, X., Liu, Y., Lu, S., Rohrer, F., Shao, M., Wang, B., Wang, M., Wu, Y., Zeng, L., Zhang, Y., Wahner, A., and Zhang, Y.: Radical chemistry at a rural site (Wangdu) in the North China Plain: observation and model calculations of OH, HO2 and RO2 radicals, Atmos. Chem. Phys., 17, 663–690, https://doi.org/10.5194/acp-17-663-2017, 2017.
Tham, Y. J., Wang, Z., Li, Q., Yun, H., Wang, W., Wang, X., Xue, L., Lu, K., Ma, N., Bohn, B., Li, X., Kecorius, S., Größ, J., Shao, M., Wiedensohler, A., Zhang, Y., and Wang, T.: Significant concentrations of nitryl chloride sustained in the morning: investigations of the causes and impacts on ozone production in a polluted region of northern China, Atmos. Chem. Phys., 16, 14959–14977, https://doi.org/10.5194/acp-16-14959-2016, 2016.
Tham, Y. J., Wang, Z., Li, Q., Wang, W., Wang, X., Lu, K., Ma, N., Yan, C., Kecorius, S., Wiedensohler, A., Zhang, Y., and Wang, T.: Heterogeneous N2O5 uptake coefficient and production yield of ClNO2 in polluted northern China: Roles of aerosol water content and chemical composition, Atmos. Chem. Phys. Discuss., https://doi.org/10.5194/acp-2018-313, in review, 2018.
Wang, G., Zhang, R., Gomez, M. E., Yang, L., Levy Zamora, M., Hu, M., Lin, Y., Peng, J., Guo, S., Meng, J., Li, J., Cheng, C., Hu, T., Ren, Y., Wang, Y., Gao, J., Cao, J., An, Z., Zhou, W., Li, G., Wang, J., Tian, P., Marrero-Ortiz, W., Secrest, J., Du, Z., Zheng, J., Shang, D., Zeng, L., Shao, M., Wang, W., Huang, Y., Wang, Y., Zhu, Y., Li, Y., Hu, J., Pan, B., Cai, L., Cheng, Y., Ji, Y., Zhang, F., Rosenfeld, D., Liss, P. S., Duce, R. A., Kolb, C. E., and Molina, M. J.: Persistent sulfate formation from London Fog to Chinese haze, P. Natl. Acad. Sci. USA, 113, 13630–13635, https://doi.org/10.1073/pnas.1616540113, 2016.
Wang, H., Chen, J., and Lu, K.: Development of a portable cavity-enhanced absorption spectrometer for the measurement of ambient NO3 and N2O5: experimental setup, lab characterizations, and field applications in a polluted urban environment, Atmos. Meas. Tech., 10, 1465–1479, https://doi.org/10.5194/amt-10-1465-2017, 2017a.
Wang, H., Lu, K., Chen, X., Zhu, Q., Chen, Q., Guo, S., Jiang, M., Li, X., Shang, D., Tan, Z., Wu, Y., Wu, Z., Zou, Q., Zheng, Y., Zeng, L., Zhu, T., Hu, M., and Zhang, Y.: High N2O5 Concentrations Observed in Urban Beijing: Implications of a Large Nitrate Formation Pathway, Environ. Sci. Tech. Lett., 416–420, https://doi.org/10.1021/acs.estlett.7b00341, 2017b.
Wang, M., Zeng, L., Lu, S., Shao, M., Liu, X., Yu, X., Chen, W., Yuan, B., Zhang, Q., and Hu, M.: Development and validation of a cryogen-free automatic gas chromatograph system (GC-MS/FID) for online measurements of volatile organic compounds, Anal. Meth., 6, 9424–9434, 2014.
Whalley, L. K., Blitz, M. A., Desservettaz, M., Seakins, P. W., and Heard, D. E.: Reporting the sensitivity of laser-induced fluorescence instruments used for HO2 detection to an interference from RO2 radicals and introducing a novel approach that enables HO2 and certain RO2 types to be selectively measured, Atmos. Meas. Tech., 6, 3425–3440, https://doi.org/10.5194/amt-6-3425-2013, 2013.
Whalley, L. K., Stone, D., Dunmore, R., Hamilton, J., Hopkins, J. R., Lee, J. D., Lewis, A. C., Williams, P., Kleffmann, J., Laufs, S., Woodward-Massey, R., and Heard, D. E.: Understanding in situ ozone production in the summertime through radical observations and modelling studies during the Clean air for London project (ClearfLo), Atmos. Chem. Phys., 18, 2547–2571, https://doi.org/10.5194/acp-18-2547-2018, 2018.
Yang, F., Tan, J., Zhao, Q., Du, Z., He, K., Ma, Y., Duan, F., Chen, G., and Zhao, Q.: Characteristics of PM2.5 speciation in representative megacities and across China, Atmos. Chem. Phys., 11, 5207–5219, https://doi.org/10.5194/acp-11-5207-2011, 2011.
Zhao, X. J., Zhao, P. S., Xu, J., Meng,, W., Pu, W. W., Dong, F., He, D., and Shi, Q. F.: Analysis of a winter regional haze event and its formation mechanism in the North China Plain, Atmos. Chem. Phys., 13, 5685–5696, https://doi.org/10.5194/acp-13-5685-2013, 2013.