the Creative Commons Attribution 4.0 License.
the Creative Commons Attribution 4.0 License.
 | 13 Aug 2018
Net radiative effects of dust in the tropical North Atlantic based on integrated satellite observations and in situ measurements
Qianqian Song
Hongbin Yu
Seiji Kato
Ping Yang
Peter Colarco
Lorraine A. Remer
Claire L. Ryder
In this study, we integrate recent in situ measurements with satellite retrievals of dust physical and radiative properties to quantify dust direct radiative effects on shortwave (SW) and longwave (LW) radiation (denoted as DRESW and DRELW, respectively) in the tropical North Atlantic during the summer months from 2007 to 2010. Through linear regression of the CERES-measured top-of-atmosphere (TOA) flux versus satellite aerosol optical depth (AOD) retrievals, we estimate the instantaneous DRESW efficiency at the TOA to be W m−2 AOD−1 and W m−2 AOD−1 based on AOD from MODIS and CALIOP, respectively. We then perform various sensitivity studies based on recent measurements of dust particle size distribution (PSD), refractive index, and particle shape distribution to determine how the dust microphysical and optical properties affect DRE estimates and its agreement with the above-mentioned satellite-derived DREs. Our analysis shows that a good agreement with the observation-based estimates of instantaneous DRESW and DRELW can be achieved through a combination of recently observed PSD with substantial presence of coarse particles, a less absorptive SW refractive index, and spheroid shapes. Based on this optimal combination of dust physical properties we further estimate the diurnal mean dust DRESW in the region of −10 W m−2 at TOA and −26 W m−2 at the surface, respectively, of which ∼ 30 % is canceled out by the positive DRELW. This yields a net DRE of about −6.9 and −18.3 W m−2 at TOA and the surface, respectively. Our study suggests that the LW flux contains useful information on dust particle size, which could be used together with SW observations to achieve a more holistic understanding of the dust radiative effect.
- Article
(3796 KB) - Full-text XML
- BibTeX
- EndNote


Mineral dust is the most abundant atmospheric aerosol component in terms of dry mass (Choobari et al., 2014; Textor et al., 2006). The Sahara is the largest source of atmospheric dust aerosols, with an estimated emission of 670 Mt yr−1 (Rajot et al., 2008; Washington et al., 2003). African dust from the Sahara is regularly lifted by strong near-surface winds and transported westwards within the Saharan air layer (SAL) over to the tropical North Atlantic during northern summer (Cuesta et al., 2009; Karyampudi et al., 1999). During the transport, dust aerosols can scatter and absorb both shortwave solar (referred to as “SW”) and longwave thermal infrared (referred to as “LW”) radiation, and thereby influence Earth's energy budget (McCormick and Ludwig, 1967; Tegen and Lacis, 1996; Yu et al., 2006). This is known as the direct radiative effect (DRE) of dust, which can have a significant influence on the global energy balance (Boucher et al., 2013), as well as regional weather and climate (e.g., Miller and Tegen, 1998; Evan et al., 2006; Lau and Kim, 2007). Therefore, it is important to quantify dust DREs as accurately as possible. Moreover, mineral dusts can also influence the life cycle and properties of clouds, by altering the thermal structure of the atmosphere (known as semi-direct effects) (Ackerman et al., 2000; Hansen et al., 1997; Koren et al., 2004) and by acting as cloud condensation nuclei and ice nuclei (known as indirect effects) (Albrecht, 1989; Rosenfeld et al., 1998; Twomey, 1977) . In addition, when African dust aerosols are deposited into the Atlantic Ocean and the Amazon basin, they supply essential nutrients for marine and rainforest ecosystems (Yu et al., 2015), which has important implications for biogeochemical cycles (Jickells et al., 2005). In this study, we focus on the quantification of the dust direct radiative effect on both SW and LW radiation.
Substantial effort has been made to understand and quantify the DRE of mineral dust since the 1980s (Carlson and Benjamin, 1980; Cess, 1985; Liao and Seinfeld, 1998; Ramaswamy and Kiehl, 1985). Most studies have focused on the SW DRE (DRESW) of mineral dust under clear-sky (cloud-free) conditions (Myhre et al., 2003; Tegen et al., 1996; Yu et al., 2006) . Through scattering and absorption, dust aerosols reduce the amount of solar radiation reaching the surface, inducing a negative (cooling) effect at the surface. The DRESW of dust at the top of the atmosphere (TOA) also depends strongly on the albedo of the underlying surface (Keil and Haywood, 2003; Yu et al., 2006). Over a dark surface, the scattering effect of dust dominates; it leads to a negative DRE at TOA that cools the climate system (Myhre et al., 2003; Tegen et al., 1996). In contrast, high reflectance of a bright surface enhances the absorption by dust aerosols and could yield a positive dust DRESW (warming effect on the climate system) at TOA when the surface albedo exceeds a critical value (Zhang et al., 2016; Xu et al., 2017). Different from other aerosol types (e.g., smoke and sulfate aerosols), dust aerosols are large enough to have a significant LW direct radiative effect (DRELW) (Sokolik and Toon, 1999; Sokolik et al., 1998). Lofted dust aerosols absorb the LW radiation from the warm surface and re-emit the LW radiation usually at lower temperatures, thereby reducing the outgoing LW radiation and leading to a positive DRE at TOA that tends to warm the climate system. At the same time, they emit the LW radiation downward that generates a warming effect at the surface. The dust LW effect depends strongly on surface emissivity (Yang et al., 2009) and the vertical profile of atmosphere temperature. The net radiative effect (DREnet) of dust is the summation of its DRESW and DRELW. Note that DRESW only acts during daytime, whereas DRELW operates during both day and night.
Quantification of the DRESW and DRELW of dust remains challenging and there is a large range of estimates in the literature. Take the Tropical Atlantic for example. Yu et al. (2006) found that the seasonal (JJA) average clear-sky aerosol DRESW at TOA in this region varies from −5.7 to −12.8 W m−2 based on observations and from −3.7 to −10.4 W m−2 based on model simulations. An important reason is that dust DRE depends on many factors, including both the microphysical (e.g., dust particle size and shape) and optical (e.g., refractive index) properties, as well as the surface and atmospheric properties (e.g., surface reflectance and temperature, atmospheric absorption). Sokolik et al. (1998) showed that for the submicron dust particles, the DRESW is dominant and DRELW is negligible, whereas for supermicron dust particles, DRELW is more important (Sokolik and Toon, 1996; Sokolik et al., 1999). Therefore, an accurate measurement of the particle size distribution (PSD) is highly important for estimating the DRE of dust. However, dust PSDs are highly variable and difficult to measure or retrieve, and, as a result, the observations of dust PSD are usually subjected to large uncertainties (see Mahowald et al., 2014, and references therein). PSD inferred from AERONET observations (Dubovik et al., 2006) relies on observations at shortwave channels, which could bias the dust size low. In fact, more and more observations are emerging to suggest that the dust PSD, even in regions far from source regions, contains a substantial fraction of coarse particles. Based on the airborne in situ measurement of the dust PSD in the Caribbean Basin from the Puerto Rico Dust Experiment (PRIDE) campaign, Maring et al. (2003) noted that dust particles appear to settle more slowly than expected from the widely used Stokes gravitational settling model. Similarly, recent measurements from the latest Fennec project (Ryder et al., 2013b) and the Saharan Aerosol Long-Range Transport and Aerosol–Cloud Interaction Experiment (SALTRACE) (Weinzierl et al., 2017) all suggested that transported dust aerosols in the SAL are significantly coarser than expected based on the Stokes gravitational deposition. Such unexpected existence of coarse particles has important implications for understanding the DRE of dust. In a case of significant fraction of coarse particles, the warming effect on LW radiation (positive) DRELW would partly cancel the DRESW, leading to a less negative or even a positive DREnet. Most recently, Kok et al. (2017) argued that most of the current global climate models tend to underestimate the size of dust particles and therefore overestimate the cooling effects of dust. Their estimate of the global mean dust DREnet is between −0.48 and +0.20 W m−2, which includes the possibility that dust causes a net warming of the planet.
In addition to the dust particle size, the particle shape and refractive index also have a significant influence on the dust DRE. Dust particles are generally nonspherical in shape, which make their single-scattering properties (i.e., extinction efficiency, single-scattering albedo, and scattering phase matrix) fundamentally different from those based on spherical models. A few dust particle shape models have been developed (Dubovik et al., 2006; Kandler et al., 2009), which have been increasingly used in aerosol remote sensing and modeling (Levy et al., 2007). Räisänen et al. (2013) found that replacing the spherical dust models in a general circulation model (GCM) with a nonspherical model leads to negligible changes in the DRE of dust at TOA. However, a recent GCM-based study by Colarco et al. (2014) suggests that the influence of nonsphericity on dust DRE can be significant at the surface and within the atmosphere, depending on the refractive index of dust. Similarly, Kok et al. (2017) argue that a spherical model significantly underestimates the extinction of dust, leading to errors in estimates of dust DRE.
Over the past few decades, substantial efforts have been made to measure the spectral refractive index of dust, mostly limited to the SW spectral range (Balkanski et al., 2007; Dubovik et al., 2002, 2006; Formenti et al., 2011; Hess et al., 1998; Levoni et al., 1997). The current widely used LW refractive index of dust was measured using rather old techniques in the 1970s and 1980s (e.g., Volz, 1972, 1973; Fouquart et al., 1987). Recently, Di Biagio et al. (2014, 2017) compiled a comprehensive dust aerosol refractive index database in the LW spectrum ranging from 3 to 15 µm, based on 19 natural samples from 8 dust regions around the globe. This database is the first one as far as we know to document the regional differences in dust LW refractive index due to the regional characteristics of dust chemical composition. We also call special attention to a newly developed database of Saharan and Asian dust (Stegmann and Yang, 2017).
Satellite observations have long become indispensable for studying dust aerosols. In particular, the combination of passive (e.g., MODIS and CERES) and active (e.g., CALIPSO) sensors on board NASA's A-Train satellite constellation provides unprecedented data to study dust aerosols, from long-range transport (e.g., Liu et al., 2008; Yu et al., 2015) to dust DREs (e.g., Yu et al., 2006; Zhang et al., 2016). As A-Train observations become mature, substantial efforts have been made to collocate and fuse the observations from different sensors to make the use of A-Train observations easier for the users. A prominent example is the CERES–CALIPSO–CloudSat–MODIS (CCCM) product developed by Kato et al. (2011), which has become a popular dataset for studying the radiative effects of clouds and aerosols and for evaluating GCMs.
The present study is inspired and motivated by the latest measurements of the microphysical and optical properties of dust, namely the in situ dust PSD from the Fennec field campaign (Ryder et al., 2013a, b) and the dust LW refractive index from Di Biagio (2014, 2017), as well as recent studies (e.g., Kok et al., 2017) suggesting that cooling effects of dust are overestimated in most climate models due to the underestimation of dust size. The study is carried out in three steps, each with a distinct objective. First, we attempt to derive a set of observation-based instantaneous dust DRESW and DRELW for the tropical North Atlantic based on the A-Train satellite observations reported in the CCCM product, without imposing any assumptions on dust size, shape, or refractive index. Here, the instantaneous dust DRE represents dust DRE derived under the conditions (e.g., solar position, atmospheric condition) at the measured or computed time to distinguish from the diurnally averaged DRE in Sect. 4. Then, we perform multiple sets of radiative transfer computations of the instantaneous dust DRE in the North Atlantic region based on the same dust extinction profiles from CCCM in combination with different dust physical and optical properties. The objective is to understand the sensitivity of the dust DRESW and DRELW to the PSD, nonsphericity, and refractive index of dust and to obtain a set of dust properties that yield the best agreement with satellite flux observations (e.g., CERES). In the third step, we use the derived dust properties and extend the radiative transfer computations to the diurnal mean and to the DRE at the surface. The rest of this paper is organized as follows: Sect. 2 describes the data and model used. Section 3 presents the sensitivity of the dust DRE to dust size, shape, and refractive index. Section 4 discusses diurnally averaged net DRE of dust aerosols and uncertainty analysis. Section 5 concludes the article.
2.1 The CERES–CALIPSO–CloudSat–MODIS (CCCM) product
To estimate instantaneous dust DRE, we use aerosol and radiation remote sensing products from the A-Train satellite sensors, namely, the integrated CERES, CALIPSO, CloudSat, and MODIS merged product (CCCM) developed by Kato et al. (2011). In the CCCM product, high-resolution CALIOP, CloudSat, and MODIS retrievals are collocated with 20 km CERES footprints. For each CERES footprint, the CCCM product provides the TOA flux observations (both SW and LW) from CERES, aerosol (MOD04 “dark target” product; Remer et al., 2005) and cloud (MOD06; Platnick et al., 2003) properties retrieved from MODIS, aerosol optical thickness for each aerosol layer from CALIOP (Winker et al., 2010), and cloud vertical profile from the combination of CALIOP and CloudSat (Kato et al., 2010). Up to 16 aerosol layers identified by CALIOP are kept within a CERES footprint. Figure 1 shows the JJA mean aerosol optical depth (AOD) from the CALIOP observations reported in the CCCM product. Clearly, the transported dust aerosols lead to enhanced AOD in the tropical North Atlantic region.
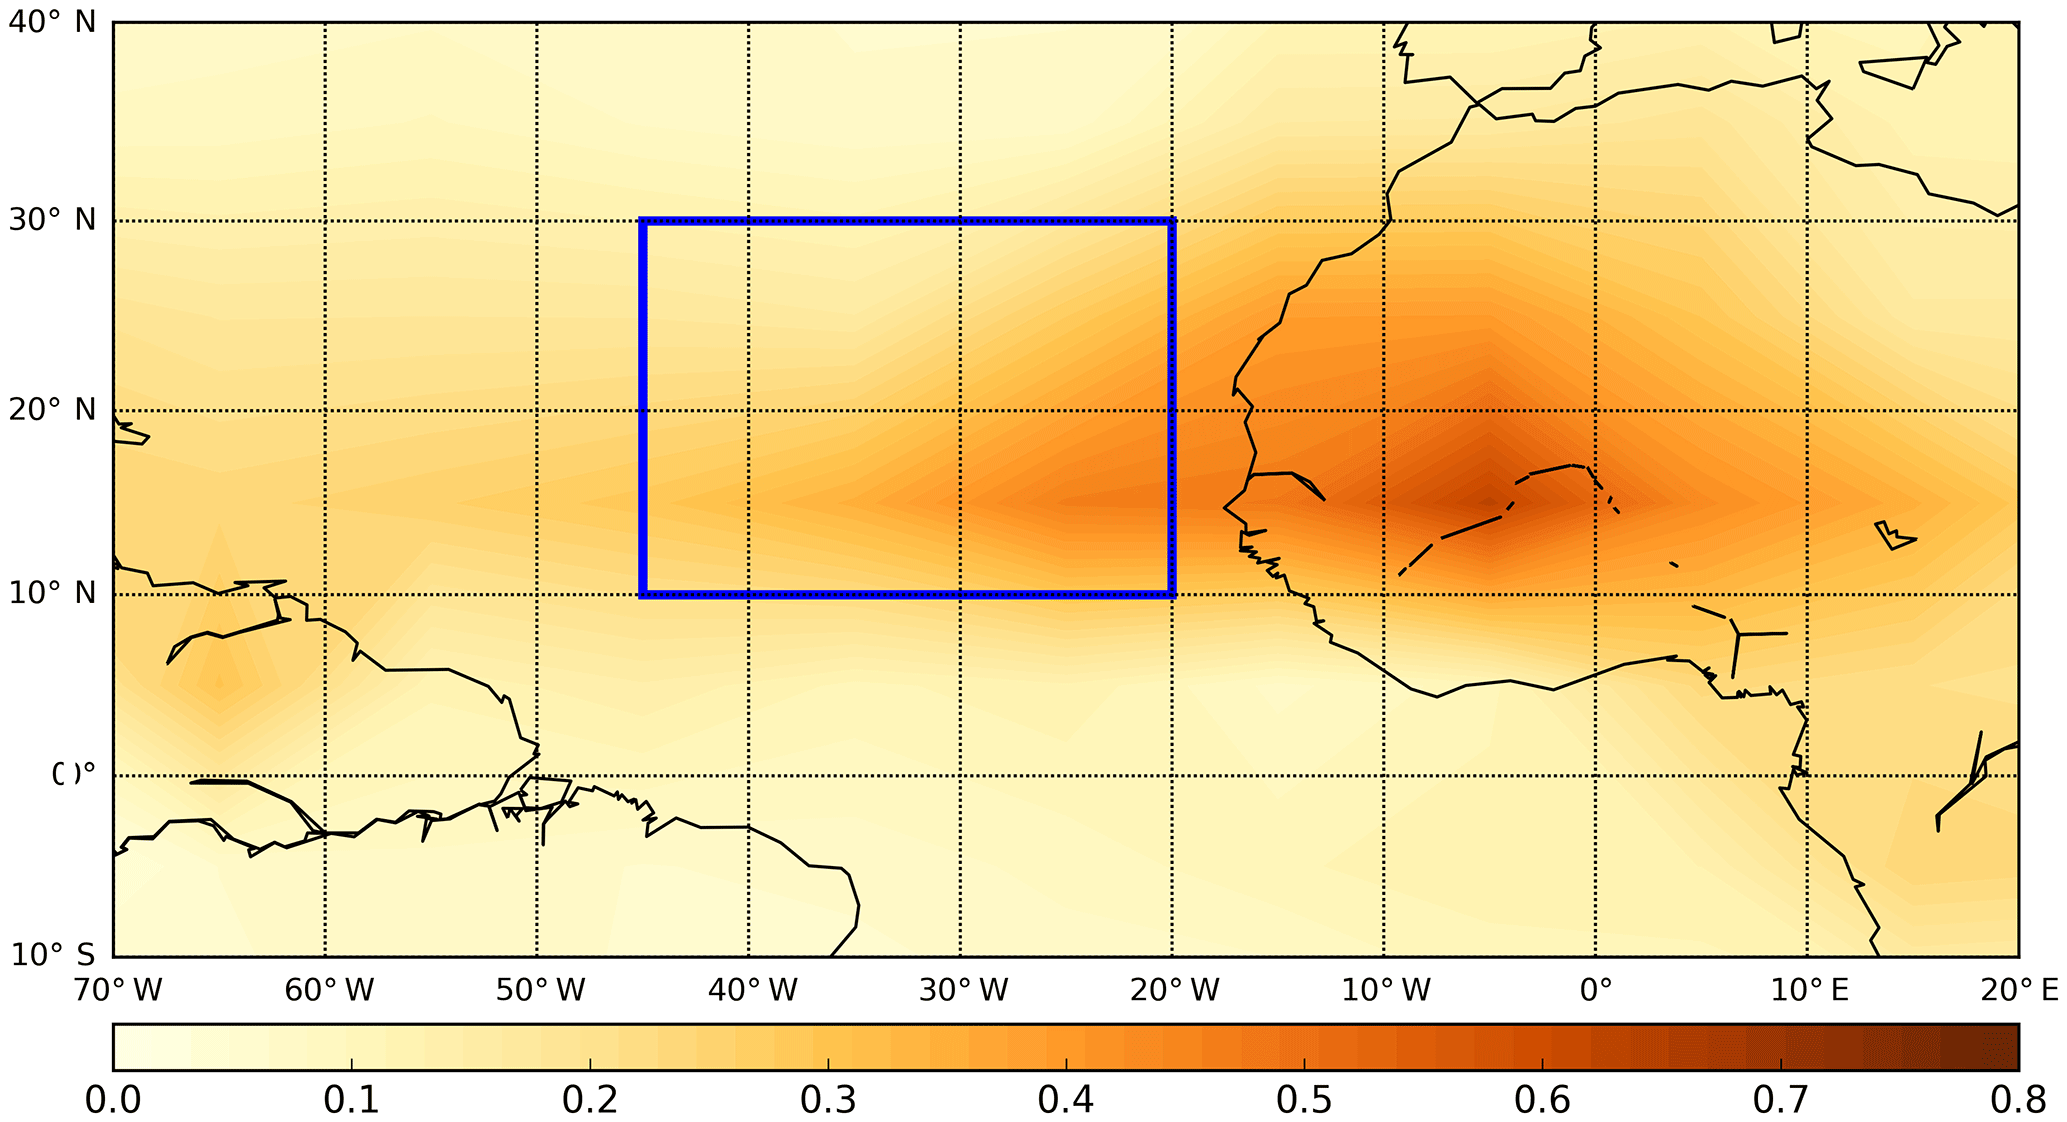
Figure 1CALIPSO-derived seasonal mean (JJA) dust aerosol optical depth (AOD) at 0.5 µm averaged over five summers (2007–2010) in cloud-free sky conditions from the integrated CALIPSO, CloudSat, CERES, and MODIS merged product (CCCM).
In addition to the raw retrievals, the CCCM product also provides post-processed flux computations for each CERES pixel based on derived aerosol and/or cloud extinction profiles, which is done in the following steps. First, the CALIOP aerosol retrievals within each CERES pixel are averaged to obtain the aerosol extinction profile at the 0.5 µm reference wavelength. Then, the aerosol type and associated spectral optical properties, e.g., extinction coefficient, single-scattering albedo, and asymmetry factor, are specified, mostly based on the aerosol type simulations from the Model of Atmospheric Transport and Chemistry (MATCH) (Collins et al., 2001), with the exception of dust aerosols. If CALIOP observes dust aerosols (dust and polluted dust), the aerosol type is set to dust. This is based on the consideration that the depolarization observation capability of CALIOP is ideal for dust detection because the nonsphericity of dust can cause significant depolarization in contrast to most other types of aerosols. Finally, the aerosol extinction profiles and the aerosol spectral optical properties are used to compute the broadband fluxes at both TOA and the surface and for both SW and LW under two conditions: (1) with aerosol and (2) without aerosol, so that the aerosol DRE can be derived from the difference of the two conditions. Temperature and humidity profiles used in flux computations are from the Goddard Earth Observing System (GEOS-5) Data Assimilation System reanalysis (Rienecker et al., 2008).
2.2 Dust physical and optical models
To investigate the sensitivity of the dust DRE to microphysical and optical properties of particles, we use several sets of widely used or newly obtained dust size distribution, dust shape distribution, and dust refractive index.
Two dust particle size distributions (PSD), shown in Fig. 2, are considered in this study. One PSD is inferred based on AERONET ground-based retrievals at the Cape Verde site (16∘ N, 22∘ W) from Dubovik et al. (2002) (referred to as “AERONET PSD”). The other dust PSD is obtained from the recent airborne measurements of transported Saharan dust from the Fennec 2011 field campaign over both the Sahara (Mauritania and Mali) and the eastern Atlantic Ocean, between the African coast and Fuerteventura. Ryder et al. (2013a) separated the PSD measurements from this campaign into three broad categories: fresh, aged, SAL. The fresh category over the Sahara represents dust uplifted no more than 12 h prior to measurement; the aged category over the Sahara represents dust aerosols mobilized 12 to 70 h prior to measurement; the SAL category represents dust aerosols transported over the adjacent east Atlantic, mostly from flights over Fuerteventura, Canary Islands (28∘ N, 13∘ W). All these categories come from the mean of vertical profile observations (excluding the marine boundary layer for SAL categories). The Fennec airborne PSD dataset is particularly novel, in that larger particle sizes were measured than had previously been done in dust layers, with the exception of Weinzierl et al. (2011), and that errors due to sizing uncertainties have been specifically quantified (see Ryder et al., 2013b, 2015 for full details). Because this paper focuses on the tropical Atlantic Ocean region, we use dust size distribution in the SAL category (referred to as the “Fennec-SAL PSD”). Evidently from Fig. 2, the Fennec-SAL PSD, which peaks around 5–6 µm and has a significant fraction of particles with r > 10 µm, is much coarser than the AERONET PSD, which peaks around 1–2 µm and has almost no particles r > 10 µm.
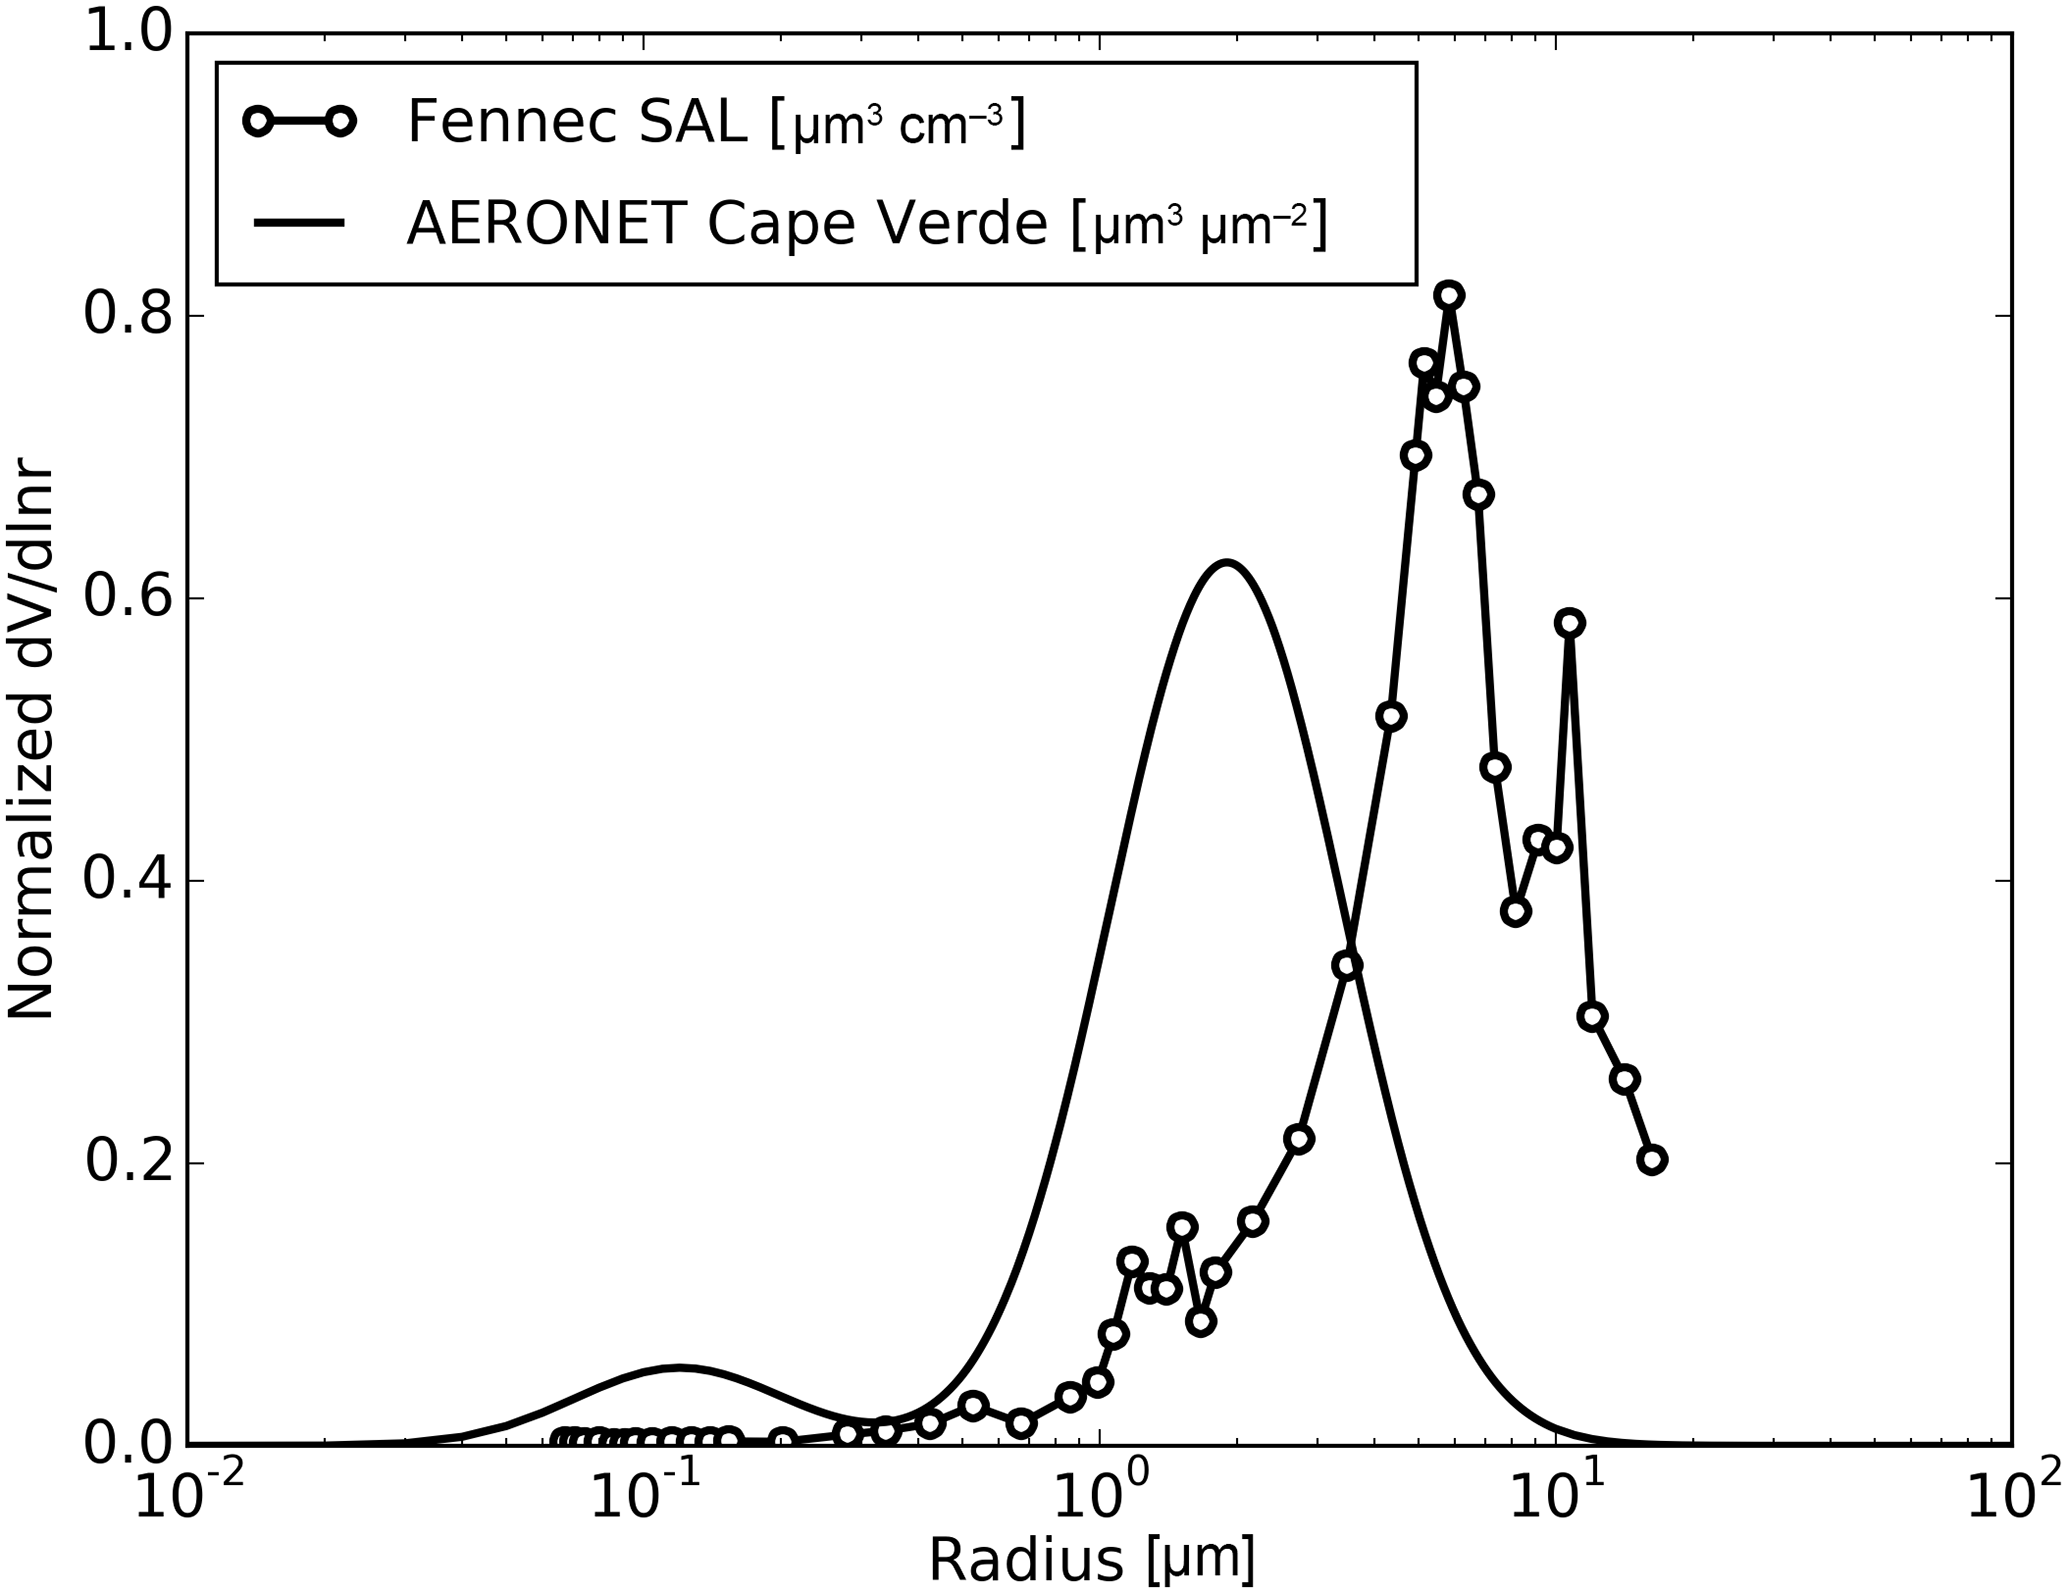
Figure 2Size distributions of mineral dust used in this study. Fennec-SAL curve is from a new in situ measurement of Saharan dust taken during the Fennec 2011 aircraft campaign (Ryder et al., 2013b). The solid curve represents desert dust size distribution retrieved from AERONET observations at Cape Verde site reported in Dubovik et al. (2002).
The dust refractive indices are taken from the following three sources.
-
The Optical Properties for Aerosols and Clouds (OPAC) database (Hess et al., 1998) was used, which has been widely used in climate models and satellite remote sensing algorithms.
-
A merger of remote-sensing-based estimates of dust refractive indices in the shortwave from 0.5 to 2.5 µm (Colarco et al., 2014), drawn from Kim et al. (2011) in the visible and Colarco et al. (2002) in the UV (referred to as “Colarco-SW”), was used. Kim et al. (2011) collected the AERONET (Version 2) retrievals from 14 sites over North Africa and the Arabian Peninsula. Then the dust refractive index is derived from the dust-dominant cases for these sites selected based on the combination of large aerosol optical depth (AOD ≥ 0.4 at 440 nm) and small Ångström exponents (Åext≤ 0.2) to select the dust cases. Colarco et al. (2002) derived the dust refractive index in the UV by matching the simulated dust radiative signature in the UV with the satellite observations from the Total Ozone Mapping Spectrometer.
-
The refractive indices in the LW from 3 to 15 µm from Di Biagio et al. (2017) (referred to as “Di Biagio-LW”) is used. This database is based on the laboratory measurements of 19 natural soil sample from 8 regions: northern Africa, the Sahel, eastern Africa and the Middle East, eastern Asia, North and South America, southern Africa, and Australia. The refractive index from the Mauritania site is selected for this study because it is geographically close to the Fennec field campaign.
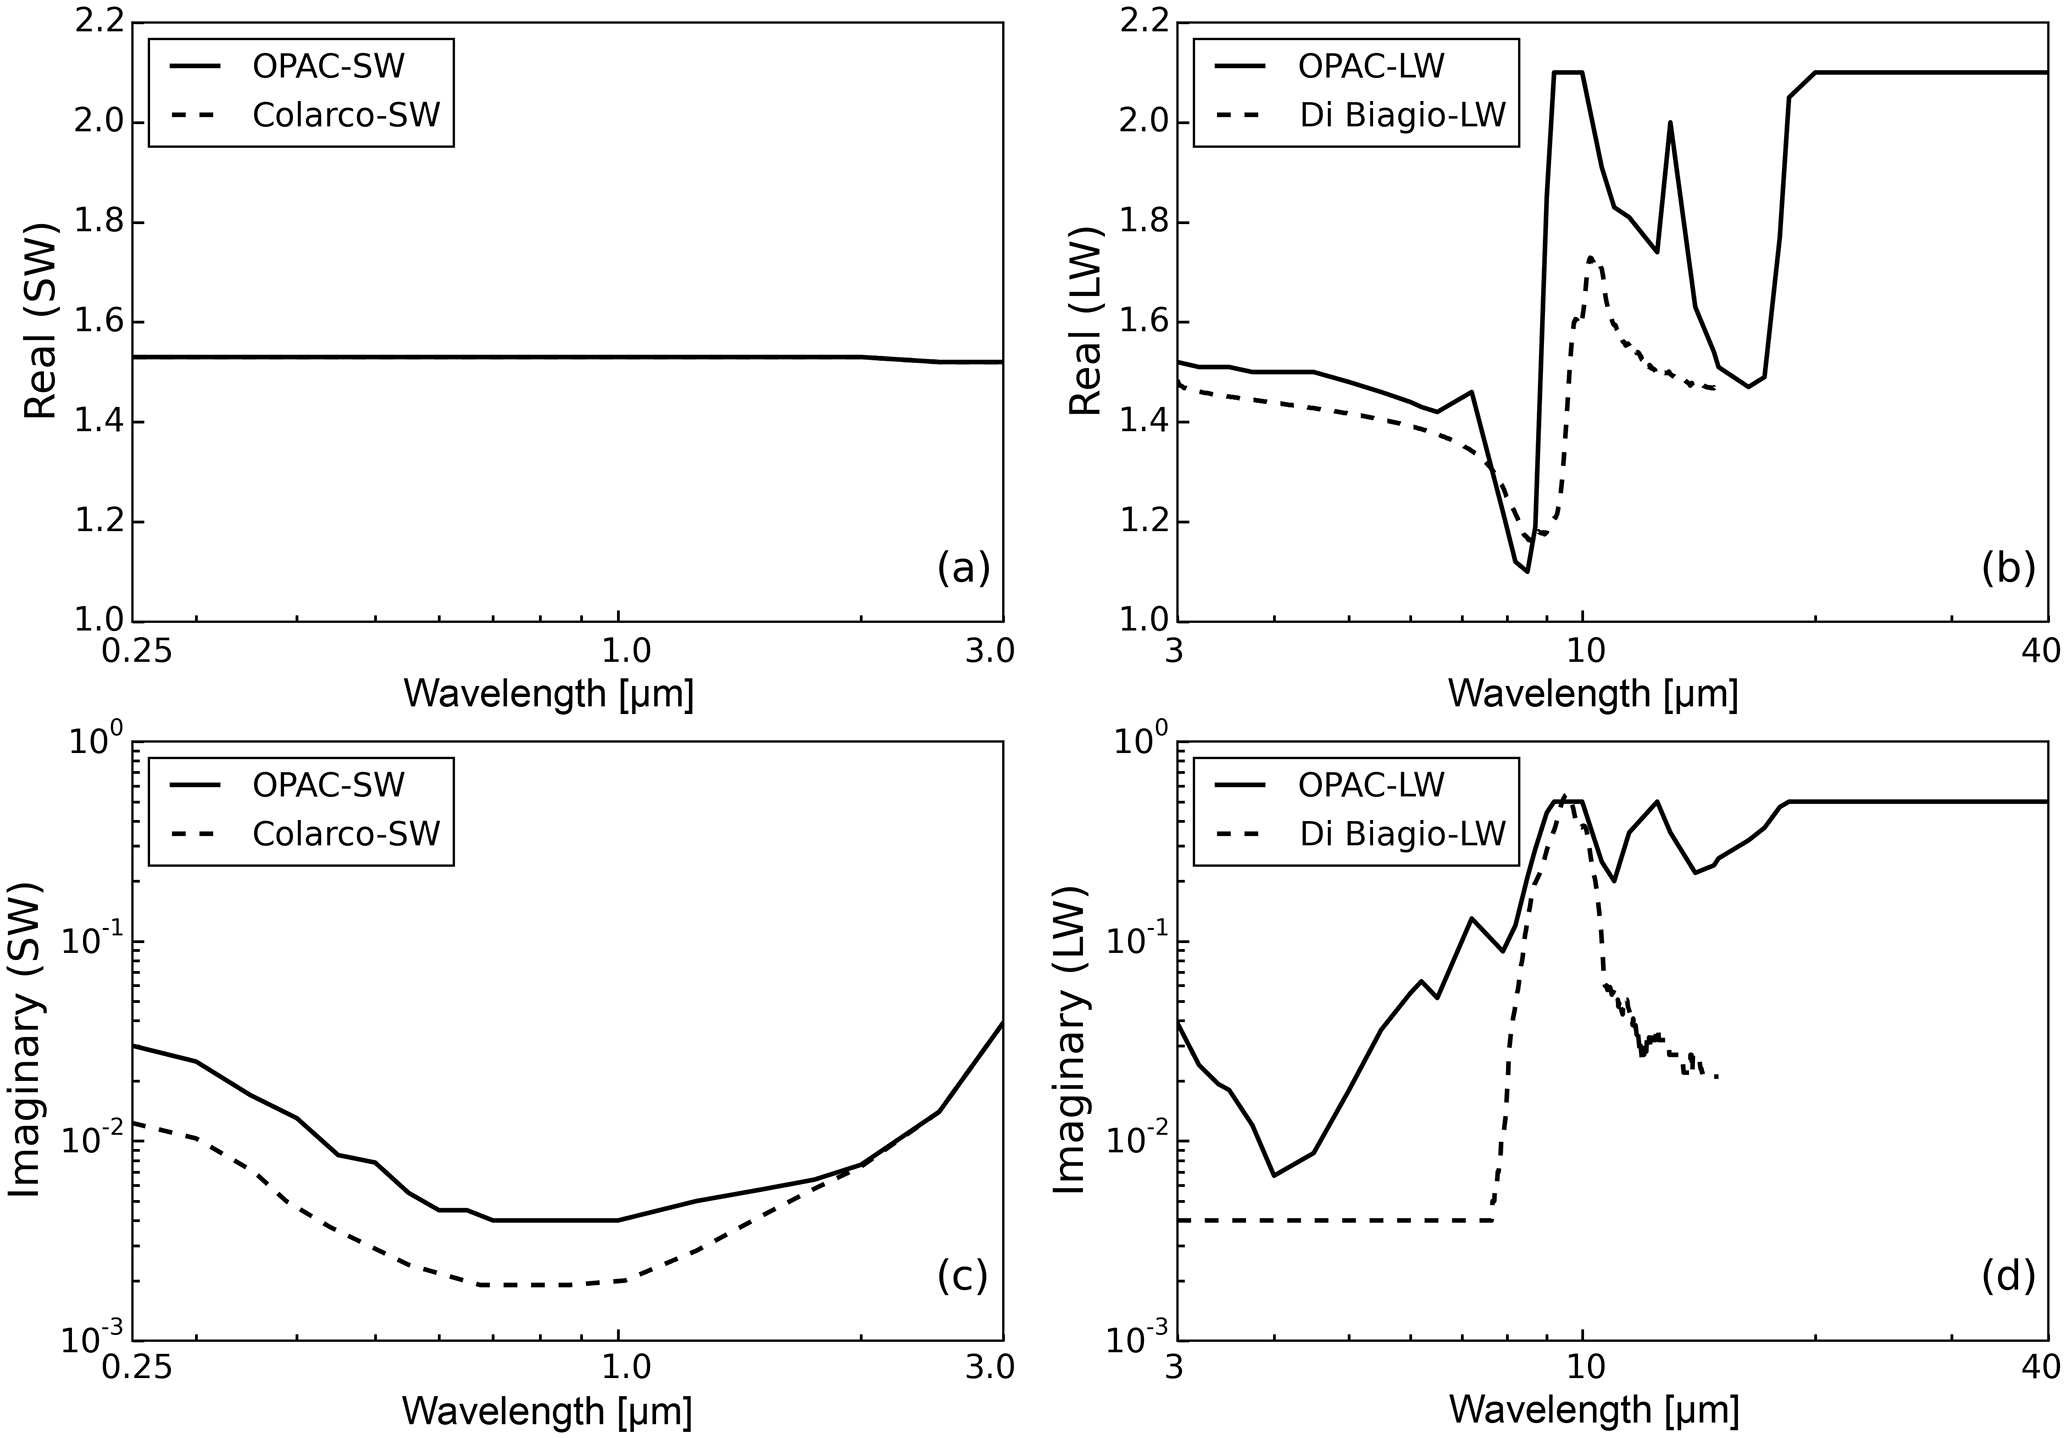
Figure 3(a) Real and (b) imaginary part of the SW dust refractive index from OPAC (Hess et al., 1998) and Colarco et al. (2014). (c) Real and (d) imaginary part of the LW dust refractive index from OPAC (Hess et al., 1998) and Di Biagio et al. (2017).
Figure 3 compares the real and imaginary parts of the refractive index for each of these datasets. In the SW, the imaginary part of the OPAC refractive index is much greater than that of Colarco-SW, which implies that dust aerosols based on the OPAC refractive index are more absorptive. In the LW, the Di Biagio-LW refractive index is smaller than the OPAC values in terms of both the real and imaginary parts.
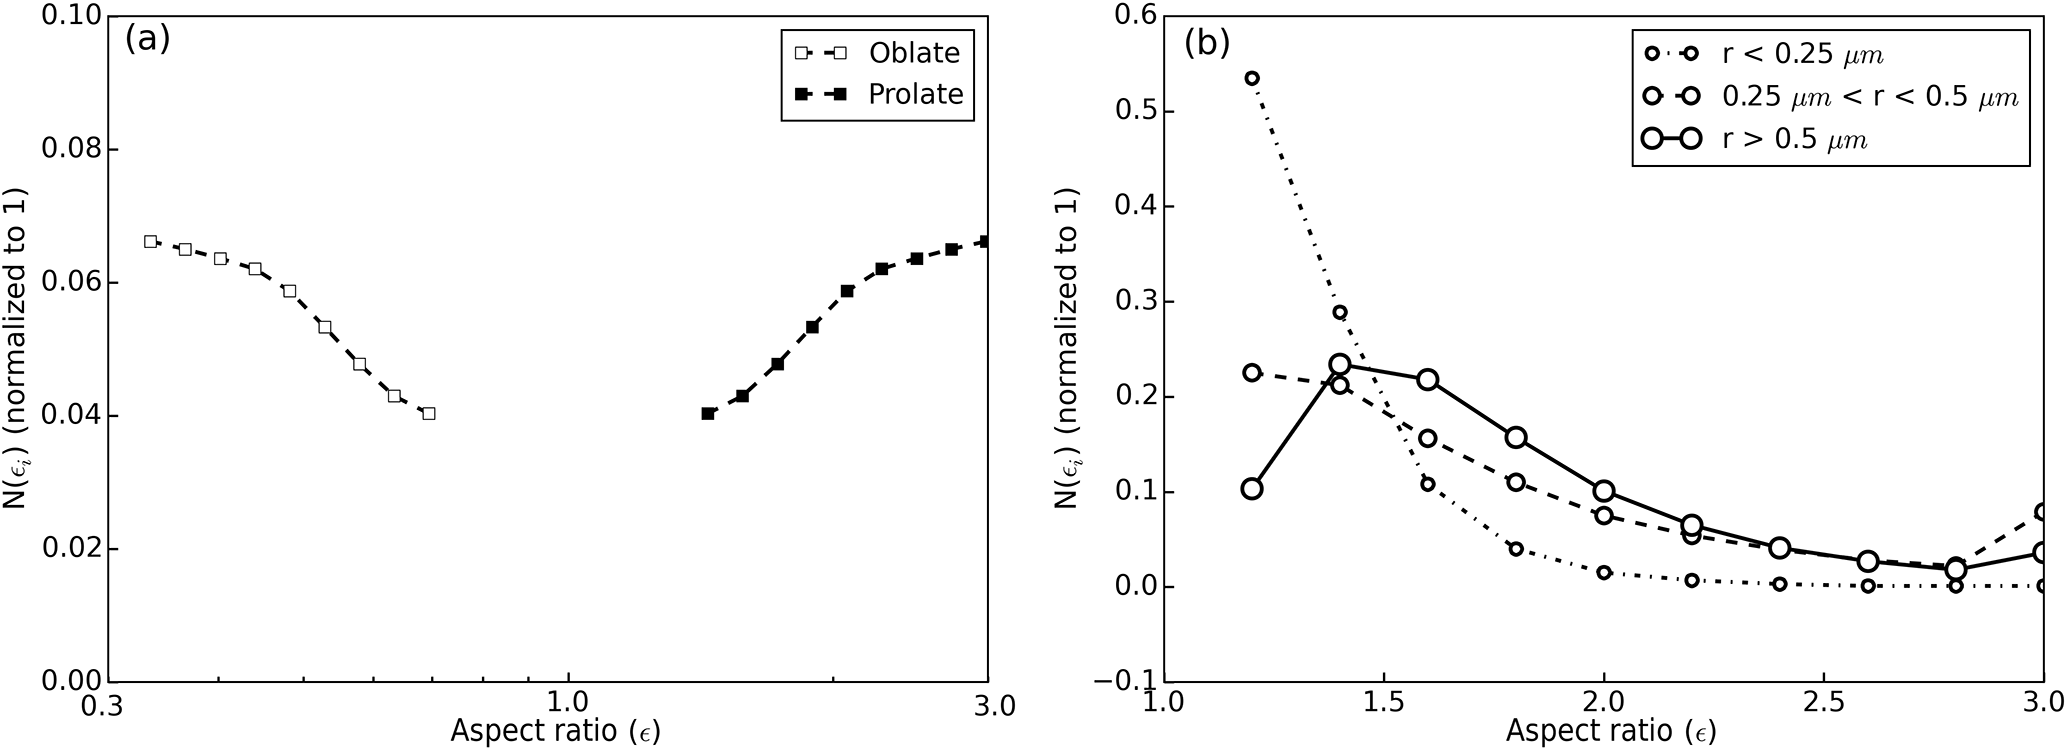
Figure 4Two spheroidal dust shape distributions models: panel (a) shows aspect ratio distributions from Dubovik et al. (2006). The lnϵ interval is 0.09. Panel (b) shows aspect ratio distributions as a function of the particle radius interval discretized from the measurements of Kandler et al. (2009). The first point of each line covers the measurement data from ϵ= 1.0 to 1.3, the last point of each line covers ϵ> 2.9 and the other points cover ϵ intervals of 0.2 (Koepke et al. 2015).
Dust aerosols are generally nonspherical in shape. Spheroids have proven to be a reasonable first-order approximation of the shape of nonspherical dust (Dubovik et al., 2006; Mishchenko et al., 1997). The shape of a spheroid particle is determined by the so-called aspect ratio, i.e., the ratio of the polar to equatorial lengths of the spheroid. In our study, two spheroidal shape distributions are used for computing the optical properties of nonspherical dust: (1) a size-independent aspect ratio distribution from Dubovik et al. (2006) (see Fig. 4a) and (2) a size-dependent aspect ratio distribution extracted from Table 2 in Koepke et al. (2015), which is discretized from measurement data of Kandler et al. (2009) (Fig. 4b). The Dubovik et al. (2006) shape distribution employs both oblate (aspect ratio < 1) and prolate (aspect ratio > 1) spheroids, while the Kandler et al. (2009) shape distribution only considers prolate spheroids. For comparison purposes, we also include spherical dust in our sensitivity studies. We use the Lorenz–Mie theory code of Wiscombe (1980) to compute the optical properties of spherical dust particles. The optical properties of spheroidal dust particles are derived from the database of Meng et al. (2010). Note that we assume the volume-equivalent radius for the AERONET-PSD to be consistent with Dubovik et al. (2006) and the maximum dimension for Fennec-SAL PSD to be consistent with Ryder et al. (2013b).
2.3 Radiative transfer modeling
The Rapid Radiative Transfer Model (RRTM) (Mlawer et al., 1997) is used to compute both SW and LW radiative fluxes for both clear and dusty atmospheres. RRTM retains reasonable accuracy in comparison with line-by-line results for single column calculations. It divides the solar spectrum into 14 continuous bands ranging from 0.2 to 12.2 µm and the thermal infrared (3.08–1000 µm) into 16 bands. We explicitly specify the spectral AOD, ω, and g of dust aerosols for every band in the radiative transfer simulations.
3.1 Selection of cloud-free and dust-dominant cases in the CCCM product
In this study, we focus on the Saharan dust outflow region in the North Atlantic marked by the box in Fig. 1 (10–30∘ N, 45–20∘ W). This selection is based on several considerations. Firstly, during the summer months (JJA) this region is dominated by transported dust aerosols from Sahara. Secondly, because the ocean surface is dark, dust aerosols have a strong negative DRESW in this region. Thirdly, the above-mentioned AERONET Cape Verde and Fennec-SAL PSD measurements are made in the vicinity of this region. Finally, the dust DREs in this region have been extensively studied in the literature, making it easier for us to compare our results with previous work.
We first select cloud-free and dust-dominant CERES pixels in the region from four summer seasons (2007–2010) of the available CCCM product. Within each CERES pixel, the CCCM product reports two cloud masks, one from CALIOP and the other from MODIS. The former is more sensitive to optically thin clouds but has a very narrow spatial sampling rate, only available along the CALIOP ground track. The latter provides the cloud mask for the entire CERES pixel but may miss thin clouds. Because of the relatively large footprint size (∼ 20 km), the cloud-free condition actually poses a very strong constraint on the CERES product. Out of the total 36 165 of CERES pixels in this region from 4 seasons of data, we found 1663 (only 5 %) cloud-free pixels according to the CALIOP cloud mask. The sampling is further reduced to 464 (only 1.3 %) if the MODIS cloud mask is used to ensure the entire CERES footprint is cloud-free. This result is not surprising because the MODIS cloud mask is more “clear-sky-conservative”; i.e., it tends to label a pixel as cloudy if there is any ambiguity in its cloud mask test (Ackerman et al., 1998). A comparison of collocated CALIOP and MODIS cloud mask along the CALIOP track by Holz et al. (2008) reveals that MODIS masks more pixels as clear-sky than CALIOP does in the tropical Atlantic dust outflow region (see their Fig. 3a), which is consistent with our result.
After selecting the cloud-free cases, we use the aerosol type information in the CCCM product to further select dust-dominant cases (i.e., more than 90 % of the aerosols within a given CERES pixel are attributed to dust, in terms of area coverage). As mentioned before, the CCCM product relies on CALIOP observations for detecting dust aerosols. After imposing the dust-dominant condition, we are left with a total of 607 and 245 cloud-free and dust-dominant CERES pixels if CALIPSO and MODIS cloud mask are used, respectively. Furthermore, we found that within these selected pixels, 153 out of 607 cases and 87 out of 245 cases have both CALIOP and MODIS aerosol optical depth (AOD) retrievals in the CCCM product, and the rest (454 out of 607 cases and 158 out of 245 cases) only have AOD retrievals from CALIOP, but no AOD retrieval from MODIS. The reason for this is unclear and beyond the scope of this study, but perhaps it is due to the more rigorous quality control used in the passive aerosol retrieval from MODIS (Remer et al., 2005).
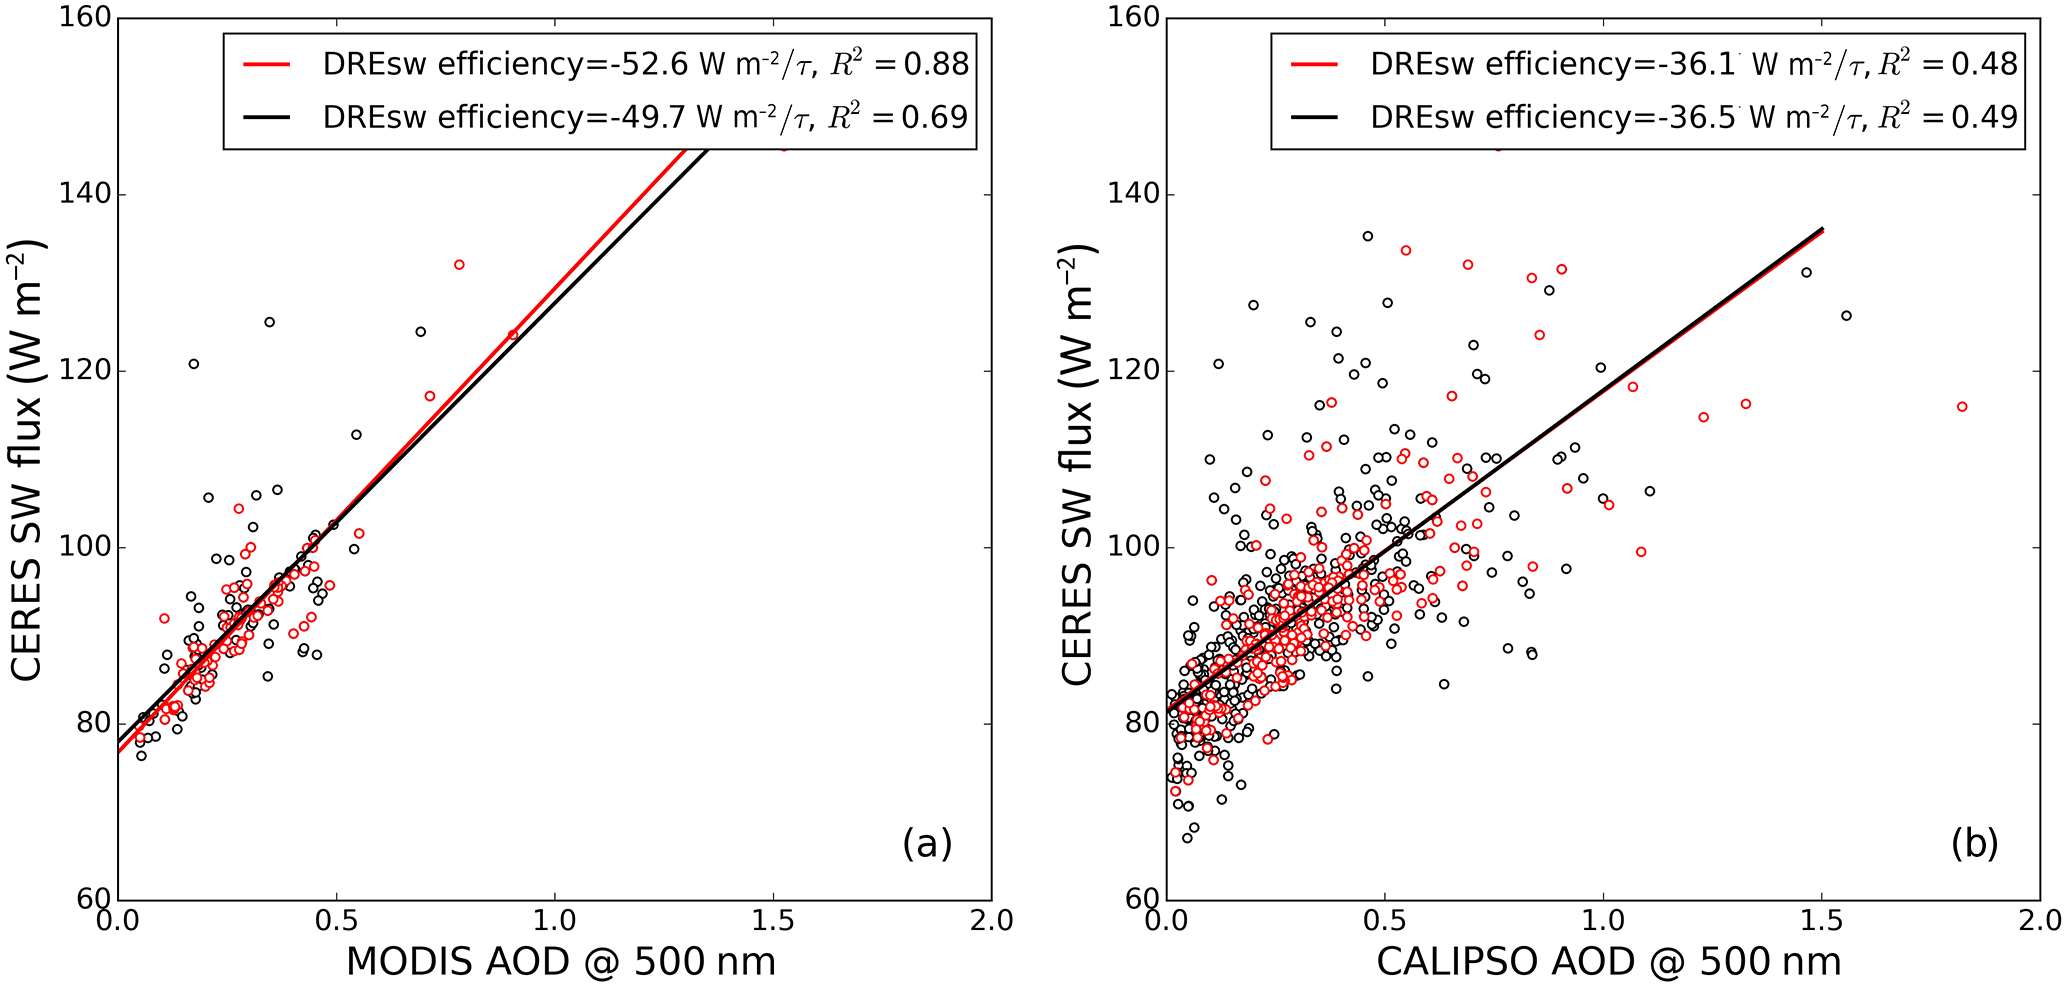
Figure 5Linear regressions of CERES-measured upward SW flux at TOA with satellite-retrieved AOD for the selected cloud-free and dust-dominant cases. (Black points represent the cases selected using the CALIPSO cloud mask along the ground track and red points represent the cases selected using MODIS cloud mask over the entire CERES footprint.) Panel (a) shows the regression results based on MODIS AOD for cases (153 black points and 87 red points) with MODIS AOD retrievals. Panel (b) is for all cases (607 black points and 245 red points) with CALIPSO AOD retrievals.
3.2 Observation-based estimate of instantaneous dust DRE
Many previous studies have shown that the aerosol DRESW over the dark ocean surface is approximately linear with the AOD. The increasing rate of the magnitude of DRESW with AOD is called the DRESW efficiency, which is an important and useful quantity in many applications such as aerosol model evaluation (Zhou et al., 2005). We note that DRESW depends on the solar zenith angle (SZA). However, because the selected region is relatively small, the SZA at the A-Train overpass time in the domain only varies slightly among our selected cases, from 20 to 28∘. Considering the limited sample size and the small SZA variation, we therefore estimate DRE efficiency based on the combination of all selected cases without breaking them into smaller SZA intervals. Because of the nearly linear relationship between DRESW and AOD, the CERES TOA flux observations and the collocated AOD retrievals from either CALIOP or MODIS can be combined to derive an observation-based estimate of the instantaneous dust DRE. Figure 5 shows linear regressions of CERES-measured upward SW flux at TOA with satellite-retrieved AOD for the selected cloud-free and dust-dominant cases. Black dots and lines are for selected cases using the CALIOP cloud mask. For the 153 cases with both CALIOP and MODIS AOD retrievals, the combination of CERES and MODIS (Fig. 5a) leads to a DRESW efficiency of dust W m−2 AOD−1 (AOD is at 0.5 µm), with a linear regression R2 value of 0.69. The uncertainty, i.e., ±7.1 W m−2 AOD−1, associated with the regression line coefficients is estimated based on the 1σ (one standard deviation) errors following Hsu et al. (2000) The combination of CERES flux and CALIOP AOD (Fig. 5b) leads to a DRESW efficiency of W m−2 AOD−1 based on 1σ error, with a R2 value of 0.5. To investigate the impact of different cloud masks, we also show the regression results derived from the cases selected based on the MODIS cloud mask in Fig. 5 (red dots and lines). We notice that the results are very similar to those based on the CALIOP cloud mask. Therefore, we conclude that the selection of cloud mask has a negligible impact on our estimation of the DRE and the main uncertainty is associated with the AOD retrieval. Considering that the MODIS and CALIOP aerosol retrievals are based on completely different methods, some differences between the two are not surprising. The tighter correlation between MODIS AOD and the TOA upward SW flux is expected because the MODIS retrieval is based on the reflected spectral solar radiation, whereas the CALIOP AOD retrievals are based on the inversion of backward scattering lidar signals. The potential reasons for the differences between CALIOP and MODIS AOD retrievals are beyond the scope of this study. Interested readers are referred to a couple of recent comparison studies by Kim et al. (2013) and Ma et al. (2013).
Table 1Observation-based instantaneous (at A-Train overpassing time) DRE and DRESW efficiency at the top of the atmosphere (TOA). The values in the parentheses for DRELW are based on the assumption of 0.7 W m−2 bias in our clear-sky OLR computation. See text for details.
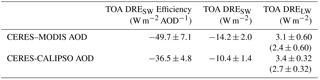
In summary, the instantaneous dust DRESW efficiency in the selected region during summer season is W m−2 AOD−1 based on CERES–MODIS observations and W m−2 AOD−1 based on CERES–CALIOP observations. With the DRESW efficiency the DRESW can be easily derived from the AOD observations. The instantaneous DRESW estimated from the CERES–MODIS and CERES–CALIOP data is and W m−2, respectively (see Table 1).
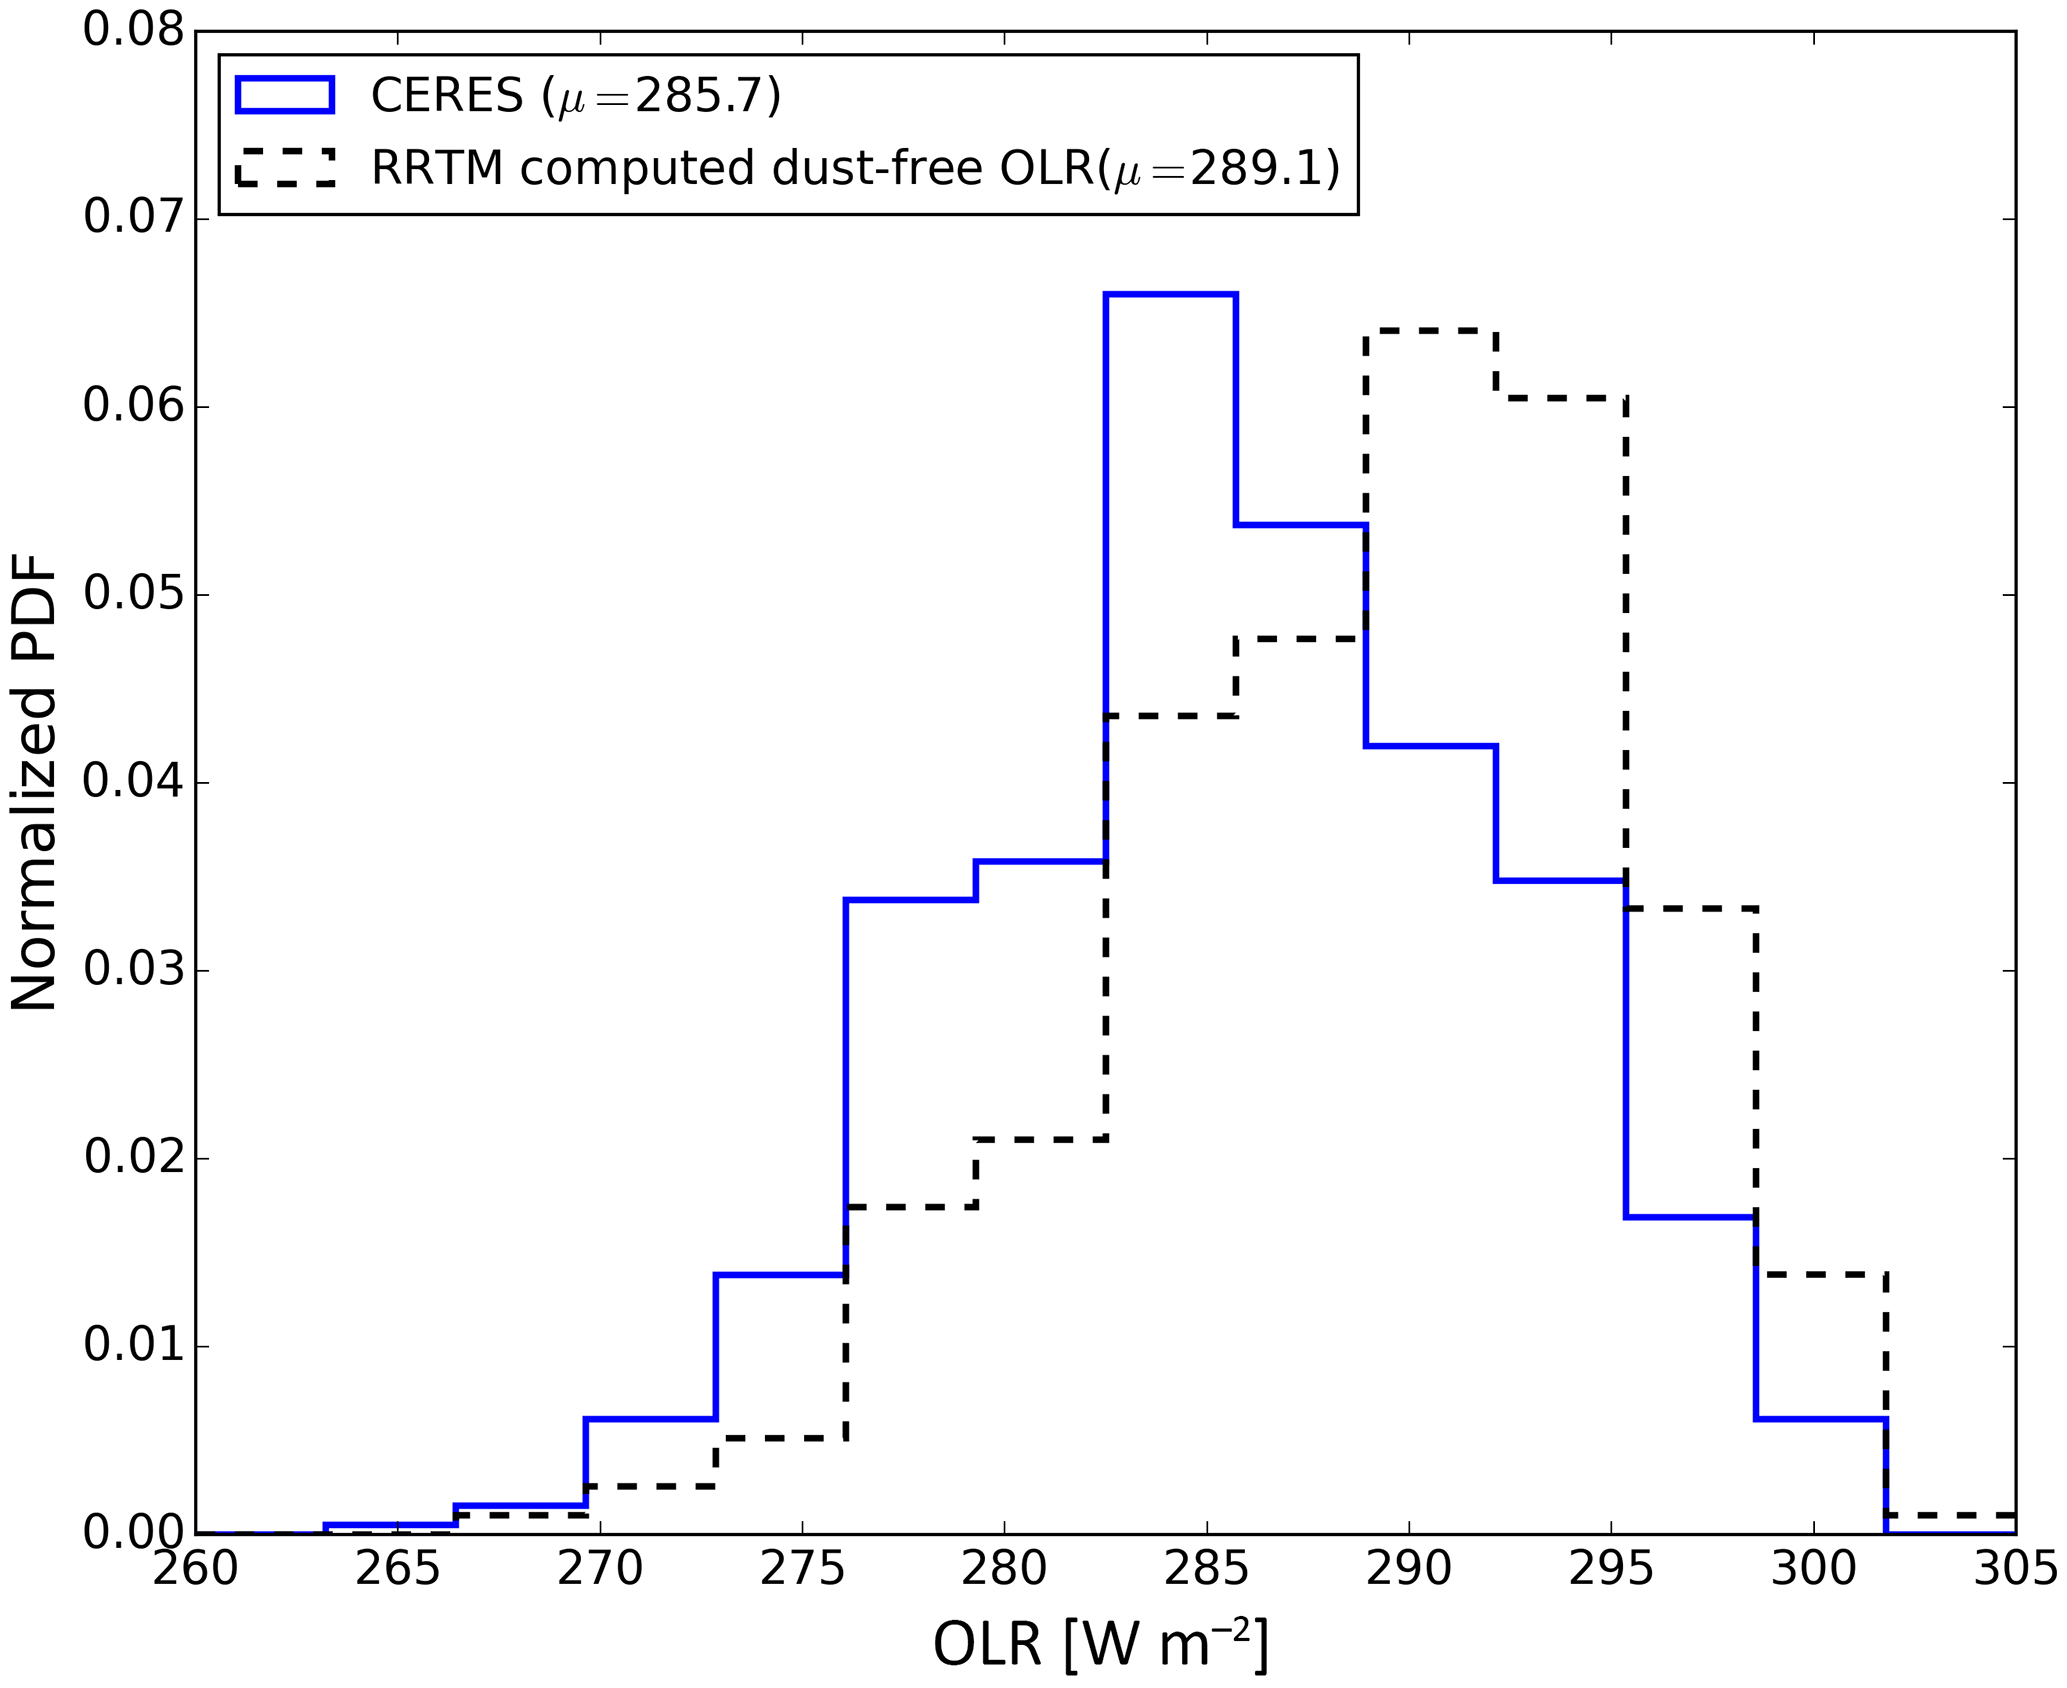
Figure 6Probability density function (PDF) of observed OLR from CERES (i.e., with dust) and computed dust-free OLR based on the atmospheric profiles and surface temperature reported in CCCM.
In addition to the SW flux measurement, the CCCM product also provides the CERES measurement of LW flux at TOA. Figure 6 shows the histograms of the broadband outgoing longwave radiation (OLR) measured by CERES for the selected cases. Note that besides dust AOD, OLR also strongly depends on other factors such as surface temperature, atmospheric profiles, and dust altitude. As a result, there is a high variability in those above-mentioned factors among the selected 607 cases. Therefore, it is not possible to derive the DRELW efficiency and DRELW in the same way as we did for the SW. Here we use a different method. To estimate the DRELW, we first computed the dust-free OLR based on ancillary data of surface temperature and atmospheric profiles reported in the CCCM which is from the GEOS Model of NASA's Global Modeling and Assimilation Office (GMAO) (Kato et al., 2011). Then, the DRELW can be estimated from the difference between CERES observed OLR (i.e., blue solid line in Fig. 6) and the computed dust-free OLR (i.e., black dashed line in Fig. 6). We refer to this method as “semi-observation-based” as it is based on the combination of observed dust-laden OLR and computed dust-free OLR. To test if our computed dust-free OLR has any potential bias due to, for example, errors in the ancillary data (i.e., atmospheric gas and temperature), we selected 75 cloud-free cases in the same region and season with no dust detected by CALIPSO. Note that because of the small dust loading in these cases the computed OLR at TOA mainly depends on the accuracy of ancillary data of surface temperature and atmospheric profiles. Therefore, the comparison between the computed OLR and CERES measurements of those cases can inform us if there is any potential bias in our computation of dust-free OLR. It turns out that the difference between RRTM and CERES OLR has a mean value around 0.7 W m−2, with standard deviation around 3.8 W m−2 (not shown). Therefore, in the following analysis all our dust-free OLR values are reduced by 0.7 W m−2 to account for this positive bias, which leads to a semi-observation-based instantaneous DRELW of dust at 2.7±0.32 W m−2 with the 95 % confidence level.
The cloud-free and dust-laden cases from the CCCM product facilitate an ideal test bed for investigating the sensitivity of dust DREs to the microphysical (i.e., PSD and shape) and optical (i.e., refractive index) properties of dust. We use the aerosol extinction profiles at the 0.5 µm from the CCCM product (which is based on CALIOP/CALIPSO observations) and different combinations of the dust properties to drive multiple sets of radiative transfer simulations of dust DREs. Through comparisons of the radiative transfer simulations with CERES observations, we study how the physical and optical properties influence both the DRESW and DRELW of dust. It should be mentioned here that the CCCM product also uses the same methodology to generate the aforementioned post-processed flux profile. In the analysis, we will also compare our dust DRE simulations with the results provided in the CCCM product.

Figure 7(a) Extinction efficiency (Qe), (b) single scattering albedo (SSA), (c) asymmetry factor (g), (d) normalized AOD with respect to AOD @ 0.5 µm, and (e) AOD × SSA ) of dust aerosols based on different combinations of PSD and refractive index. PSD type and refractive index type are indicated in legends.
4.1 Sensitivity to dust size and refractive index
In the first sensitivity study, we study the influences of dust size and refractive index on dust scattering properties and consequently dust DREs. Based on different combinations of the PSDs (AERONET vs. Fennec-SAL) and SW refractive index (OPAC vs. Colarco-SW), we simulate four sets of dust spectral scattering properties (Fig. 7), and correspondingly four sets of dust DRESW efficiency (Fig. 8). In the simulations, dust particles are assumed to be spheroidal, and the aspect ratio distribution from Dubovik et al. (2006) (see Fig. 4a) is used. The OPAC-LW refractive index is also used. The impacts of dust shape distribution and LW refractive index on dust DRE will be discussed later.
Figure 7 shows the scattering properties for the four different combinations of dust PSD and refractive index. The extinction efficiency (Qe) based on the Fennec-SAL PSD is significantly larger than that based on the AERONET PSD (Fig. 7a). The spectral shape is also different. The Qe based on the Fennec-SAL PSD is rather flat in the SW region due to its large size, whereas the Qe based on the AERONET PSD decreases with wavelength. The Qe shows no sensitivity to refractive index in Fig. 7a. It is because the Colarco-SW and OPAC-SW are only different in the imaginary part (see Fig. 3), which has minimal influence on Qe. In contrast, the single scattering albedo (SSA) in Fig. 7b shows more sensitivity to refractive index. As expected, the Fennec-SAL PSD and OPAC-SW combination (i.e., larger size and more absorptive refractive index) has the smallest SW SSA, while the AERONET PSD and Colarco-SW (i.e., smaller size and less absorptive refractive index) has the largest SW SSA. The other two combinations yield similar SW SSA values that are in between the above-mentioned two extremes. The asymmetry factor (g) in Fig. 7c shows a primary sensitivity to size and a secondary sensitivity to refractive index.
Figure 7d shows spectral variation of dust AOD normalized with respect to AOD at 0.5 µm. The peak wavelength of solar radiation (0.5 µm) and peak wavelength of terrestrial thermal radiation (10 µm) are highlighted with dashed lines. The 0.5 µm AOD is used as the reference for normalization because as mentioned before, we use the 0.5 µm aerosol extinction profile in the CCCM derived from CALIOP to drive our radiative transfer simulations. After spectral normalization, one can see that given the same 0.5 µm AOD, the 10 µm AOD based on the Fennec-PSD is much larger than that based on the AERONET PSD by around 80 %. This is an important feature that has important implications for the DRELW of dust. The SW reflection of dust depends not only on AOD, but also on SSA and g. Figure 7e shows spectral variation of AOD*SSA*(1−g), where AOD indicates dust load, is multiplied by SSA to take the scattered fraction, and is then multiplied by (1−g) to take the backscattered portion. It is a quantity more relevant for understanding dust SW reflection. Evidently, this index suggests that the combination of smaller size (AERONET PSD) and less absorptive refractive index (Colarco-SW) leads to the most reflective dust among the four sets of simulations, whereas the larger size (Fennec PSD) and more absorptive refractive index (OPAC) combination generates the least reflective dust. The other two combinations are in between and somewhat similar.
Table 2Instantaneous DRESW and DRESW efficiency at TOA and the surface based on different dust models (e.g., PSD, refractive index, and shape).
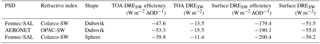
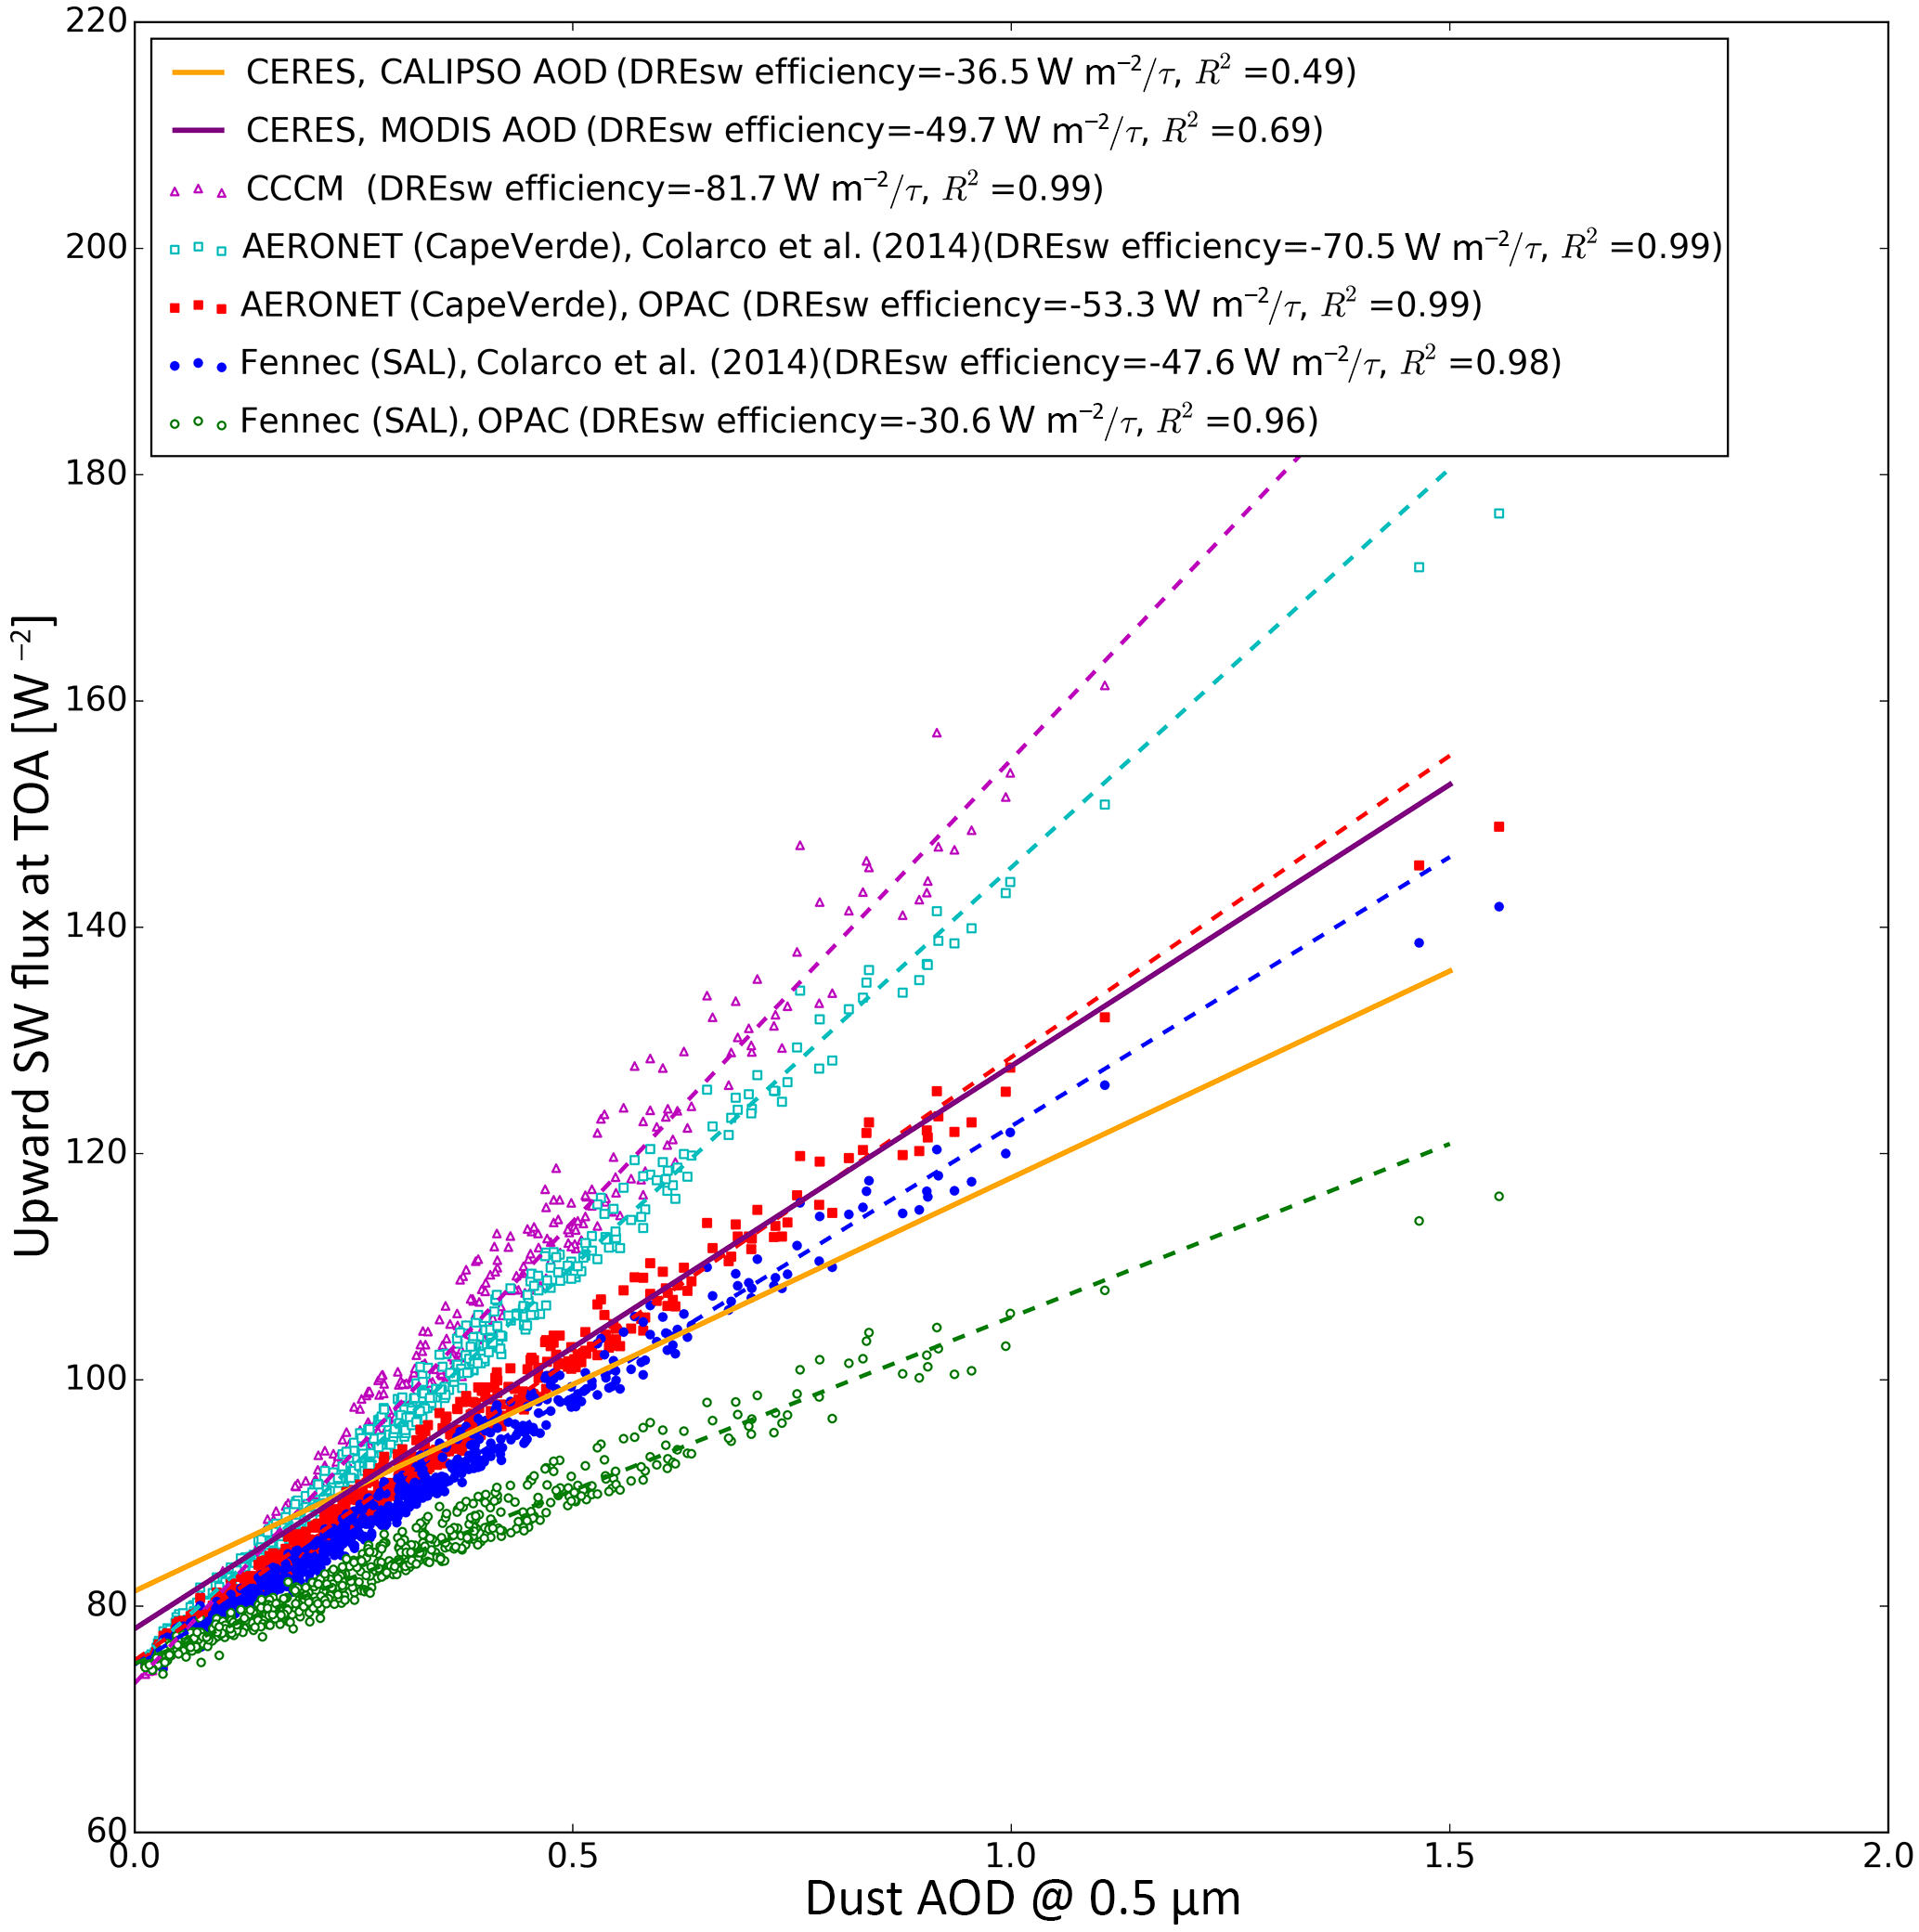
Figure 8The four sets of simulated TOA upward SW fluxes as a function of the input AOD at 0.5 µm. For comparison purposes, the DRESW efficiency regression results based on observations in Fig. 5, as well as the results reported in the CCCM product, are also plotted.
Figure 8 shows the four sets of simulated TOA upward SW fluxes as a function of the input AOD at 0.5 µm. For comparison purposes, the DRESW efficiency regression results based on observations in Fig. 5, as well as the results reported in the CCCM product, are also plotted. Focusing on our computations first, we note that as expected the most reflective dust based on the combination of AERONET PSD and Colarco-SW refractive index leads to the largest DRESW efficiency (−70.5 W m−2 AOD−1), while the least reflective dust based on the combination of Fennec-SAL PSD and OPAC refractive index yields the smallest DRESW efficiency (–30.6 W m−2 AOD−1). Clearly, these results are outside of the range based on observations (i.e., –49.7±7.1 W m−2 AOD−1), suggesting they are too extreme. The other two combinations, i.e. AERONET PSD–OPAC-SW and Fennec-SAL PSD–Colarco-SW, generate a similar DRESW efficiency at −47.6 and −53.3 W m−2 AOD−1, respectively, both comparable to the CERES–MODIS-based value. Interestingly, the DRESW efficiency based on the flux computations reported in the CCCM product is −81 W m−2 AOD−1, even larger than that based on AERONET PSD–Colarco refractive index, suggesting that the dust model used in the CCCM flux computations is too reflective in the SW. The instantaneous DRESW and DRESW efficiencies at the surface for the two combinations that agree with the CERES observations, i.e., AERONET PSD–OPAC-SW and Fennec-SAL PSD–Colarco-SW, are given in Table 2.
One additional point to note in Fig. 8 is that, the TOA flux vs. AOD relations based on the radiative transfer computations are much less scattered than those based on observations. The R2 value for the computation-based regressions all exceed 0.95, much higher than the observation-based results in Fig. 5. This is because, in reality, the TOA flux is influenced not only by AOD, but also by many other factors, such as surface reflectance variation, boundary layer aerosols that might be undetected by satellites, and uncertainty in the satellite retrieval algorithm. Most of these factors are not accounted for in the radiative transfer computations, leading to a near-perfect correlation between TOA flux and input AOD. This should not be interpreted as a lack of variability, rather than a smaller uncertainty.
On the one hand, the results in Fig. 8 are encouraging, as they suggest that a relatively simple combination of dust size and refractive index can enable us to simulate the dust DRESW that is comparable with observations. On the other hand, the fact that two different dust models lead to similar DRESW efficiency simulations, both comparable with observations, points to a long-lasting problem in aerosol remote sensing. That is, different combinations of aerosol microphysical and optical properties can lead to similar radiative signatures. The combination of a smaller dust size with a more absorptive refractive index is as good as the combination of a larger size with a less absorptive refractive index, as far as DRESW is concerned.
But are the two combinations also equal in terms of closing the LW radiation? This is an important question because ideally, an appropriate dust model should close both SW and LW radiation. To address this question, we extend our radiative transfer simulations to the LW. It is important to point out that the LW and SW dust radiative properties are not independent but are related through the physical properties of dust. For example, the AOD at a given wavelength λ in LW is related to the visible AOD through
where Qe is the extinction efficiency that is determined by dust size, shape, and refractive index. The dust size and shape are obviously independent of wavelength and therefore connect the SW and LW. Even the refractive index in the SW and LW regions should be physically self-consistent because the refractive index is determined by the chemical composition of dust. Unfortunately, because the refractive index measurements are often made either for SW only or LW only, there is a lack of measurement of dust refractive index measurement from the visible all the way to the thermal infrared spectrum.
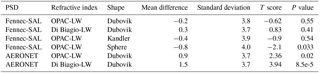
Table 3Instantaneous DRELW based on different dust models. Note that the diurnal mean values are almost identical to the instantaneous results due to small diurnal variation in the LW.
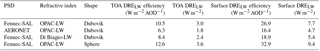
In our computations, we first use the LW dust refractive index from OPAC to compute the dust LW scattering properties and the corresponding OLR. Based on the same OPAC-LW refractive index, the Fennec-SAL PSD yields an instantaneous DRELW of +3.0 W m−2 at TOA and +7.7 W m−2 at the surface (see Table 3). The results based on the AERONET PSD are significantly smaller, +1.8 W m−2 at TOA and +4.7 W m−2 at surface. This difference between the two PSDs can be easily understood with Fig. 7b. Given the same visible AOD, the coarser Fennec PSD has a larger infrared AOD than the AERONET PSD, and therefore stronger warming effects in the LW.
The more important question is as follows: which one, Fennec or AERONET PSD, leads to OLR simulations that agree better with the CERES observations? The differences between the computed OLR values and the CERES measurements of OLR for the selected dust cases are shown in Table 4, together with the significance test results, i.e., t score and p value from the Student's t test. Interestingly, the OLR values based on the combination of AERONET PSD–OPAC-LW refractive index are systematically warmer (larger) than CERES measurements by an average of 0.9 W m−2. The high t score of 2.36 and low p value of 0.02 indicate this warm bias to be statistically significant. In contrast, the OLR values based on the combination of Fennec PSD–OPAC-LW refractive index have a bias only at −0.5 W m−2 and a p value (0.55) significantly larger than the commonly used 0.05 threshold, which means that OLR of this dust model is statistically indistinguishable from the CERES measurements. Then, to investigate the sensitivity of the computation to LW dust refractive index, we performed the computations again based on the Di Biagio et al. LW refractive index. As shown in Table 4, the OLR based on Fennec PSD is still better than that based on the AERONET PSD, even though both sets deteriorate slightly in comparison with the results based on the OPAC LW refractive index. Overall, the size difference is the primary reason for the fact that the OLR based on Fennec PSD is systematically smaller than that based on the AERONET PSD. As shown in Fig. 7, due to size difference, the Qe based on the Fennec-SAL PSD (coarser) decreases at a slower rate than that based on the AERONET PSD (finer). As a result, according to Eq. (1) given the same SW AOD, the Fennec-SAL has a larger LW AOD and therefore less OLR than the AERONET PSD. In comparison with our results, the OLR values reported in the CCCM product (not shown here) are on average 3.1 W m−2 larger than CERES measurements. This warm OLR bias of the CCCM product in the LW is consistent with its bias in the SW that is “too reflective”, shown in Fig. 8.
Table 4The difference in OLR between our computations and the CERES measurements for the selected dust cases. The values in the table are based on the assumption of 0.7 W m−2 bias in our clear-sky OLR computation.
The LW result in Table 4 is interesting and important. First of all, it suggests that the LW spectral region provides useful information content on dust properties that is complementary to SW. As we see from Fig. 8, the Fennec-SAL PSD–Colarco-SW refractive index and AERONET PSD–OPAC-SW SW refractive combinations yield very similar SW radiation simulations. However, only Fennec PSD can lead to reasonable LW radiation simulation. Secondly, although the main point here is more about the usefulness of the information content in LW, the fact that the coarser Fennec PSD leads to better OLR simulation than AERONET PSD and the CCCM product (based on MATCH) aligns with the recent studies (e.g., Kok et al., 2017) that argue that dust size tends to be underestimated in the aerosol simulation models.
Finally, as expected, the combination of Fennec PSD–OPAC-LW also yields the best simulation of the dust DRELW, at 3.0 W m−2, in comparison with the result derived from the CERES OLR observations and RRTM dust-free OLR computation with ancillary data provided by the CCCM product (i.e., W m−2 based on the CERES-CALIPSO combination).
4.2 Sensitivity to dust shape
In this section, we investigate the sensitivity of the dust DRE to the shape (or shape distribution) of dust. For all the computations in the last section, we have used the spheroidal dust model with the aspect ratio distribution from Dubovik et al. (2006) (See Fig. 4a). Now, we replace this model with another spheroidal dust model by Kandler et al. (2009), shown in Fig. 4b. For comparison purposes, we also carry out another set of computation assuming spherical dust. For dust size and refractive index, we use the Fennec-SAL and Colarco-SW/OPAC-LW refractive index since dust DREs based on this combination have shown the best agreement with the observations.

Figure 9(a) Extinction efficiency (Qe), (b) single scattering albedo (SSA), (c) asymmetry factor (g), (d) normalized AOD with respect to AOD @ 0.5 µm, and (e) AOD × SSA ) of dust aerosols based on different combinations of PSD and refractive index. PSD type and refractive index type are indicated in the legends.
In Fig. 9, we compare the scattering properties of dust based on three different shape models. Overall, the two spheroidal models are very similar and both significantly different from the spherical model. More specifically, in the SW, the Qe based on spheroidal models is significantly larger than that based on the spherical dust model. In the LW the opposite is true. The ω in Fig. 9b suggests that spherical dust is more absorptive than spheroidal dust in the SW region, when other aspects are equal. Fig. 9d and e show the normalized AOD with respect to AOD(0.5 µm) and the spectral variation of the scattering index AOD*SSA*(1−g). From Fig. 9d we can see that given the same SW AOD, the spherical model has larger LW AOD than the two spheroidal models. The comparison in Fig. 9e reveals that the spherical dust model is less reflective than the spheroidal model in the SW.
Figure 10 shows the radiative transfer simulations for the selected cases based on the three dust shape models. The DRESW efficiency based on the Kandler et al. (2009) model is −48.3 W m−2 AOD−1, which is almost identical to −47.6 W m−2 AOD−1 based on the Dubovik et al. (2006) model. In contrast, the DRESW efficiency based on the spherical dust model is much smaller, −39.8 W m−2 AOD−1, which can be expected from the results in Fig. 9e (i.e., spherical dust is less reflective). Because the DRESW efficiencies based on all three shape models are within the observation-based values, we cannot tell if the spherical dust model is better or worse than the spheroidal models.
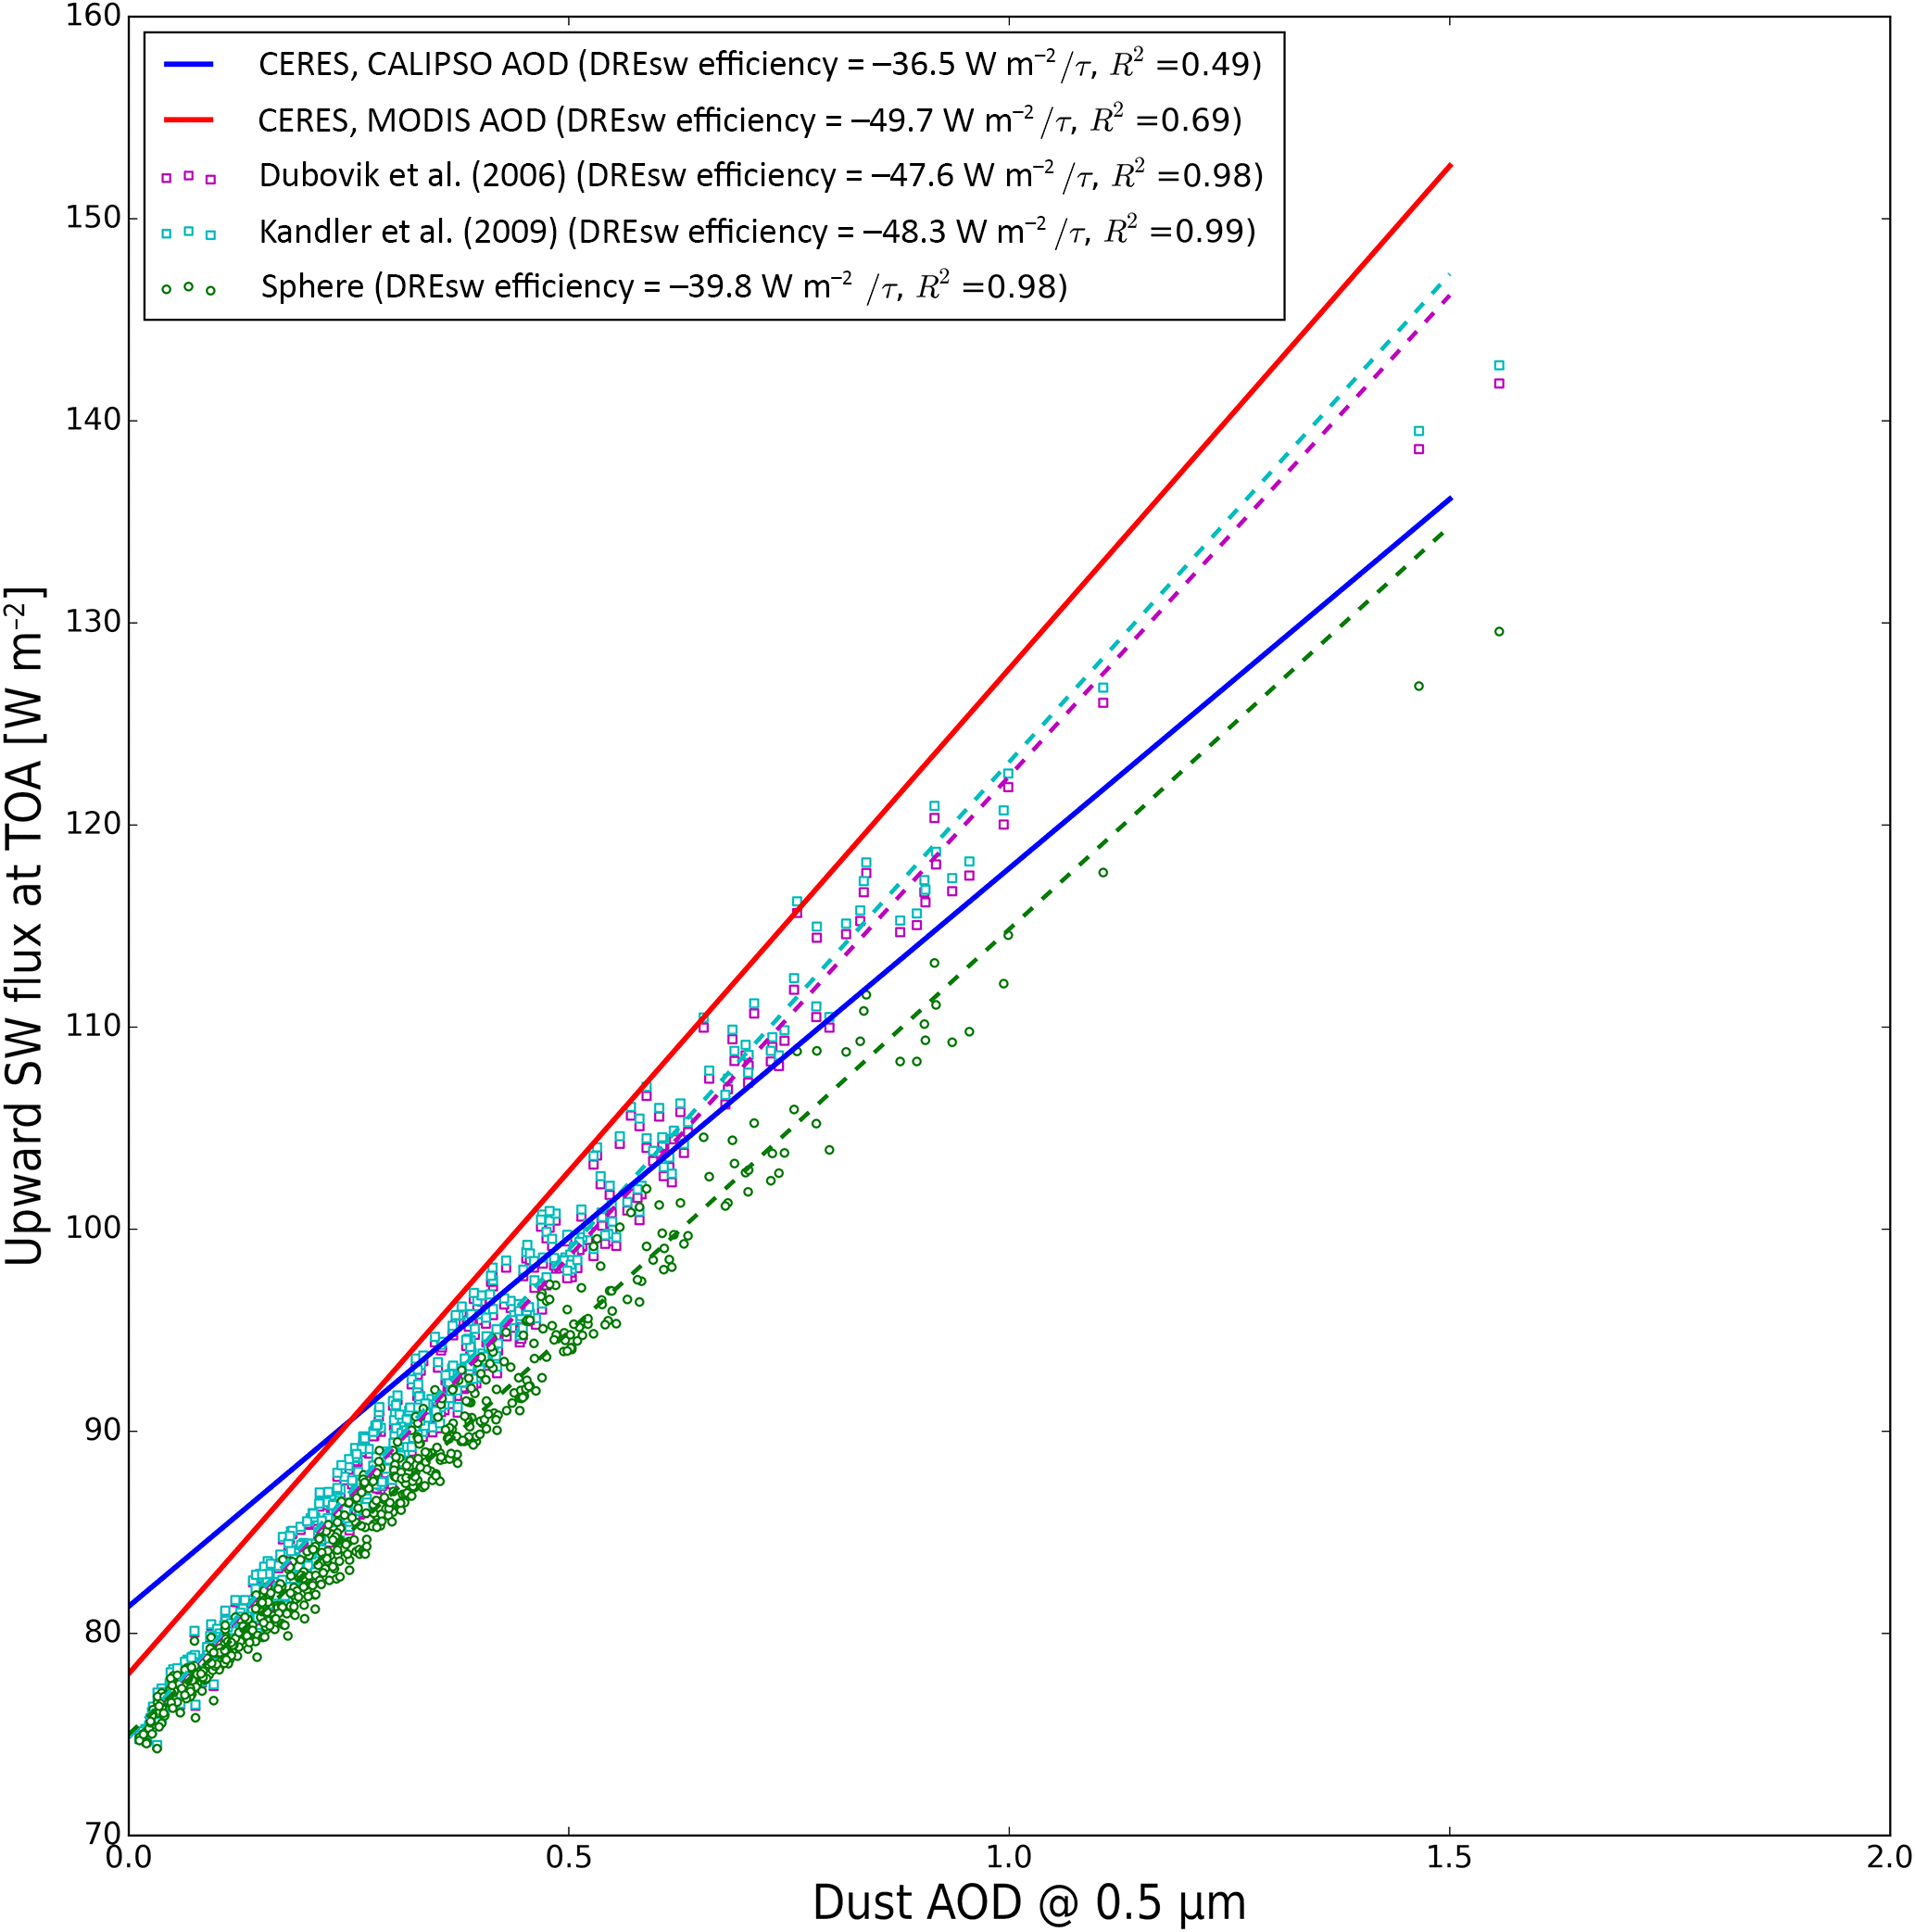
Figure 10The radiative transfer simulations are shown for the selected cases based on the three dust shape models.
As mentioned above, the two spheroidal dust models yield very similar OLR simulations and are both statistically indistinguishable from the CERES observations. In contrast, the OLR simulations based on the spheroidal dust models have a statistically significant −0.8 W m−2 cold bias, with a p value of 0.03 (see Table 4). Overall, the results in Fig. 10 and Table 4 indicate that the two spheroidal models provide a slightly better, especially in LW, agreement with the observations. Note that different shape models may have a different angular and/or spectral signature in terms of radiance, which is more important for satellite remote sensing. But this is beyond the scope of this study and will be investigated in future work.
The DRE computations in the last section (i.e., Tables 1– 3) are instantaneous values corresponding to the overpassing time of Aqua around 13:30 local time. The strong solar insolation makes the instantaneous DRESW much larger than DRELW in terms of magnitude, leading to a strong negative DREnet (cooling) of dust. However, the DRESW only operates during the daytime, while the DRELW operates both day and night. In addition, because of the availability of satellite observations only at TOA, we have only focused on the DRE at TOA in the analyses above. To appreciate the relative magnitude of DRELW with respect to DRESW we extend our DRE simulations and analysis from the instantaneous to the diurnal mean, and also from TOA to the surface. Over tropical ocean, the OLR is most sensitive to sea surface temperature (SST). Our sensitivity study based on the 3 h MERRA (Modern-Era Retrospective analysis for Research and Applications) data suggests that the diurnal SST variation in the tropical North Atlantic region is so small that the diurnal mean OLR is close to the instantaneous value. Similarly, we also found that the diurnal variation of the atmospheric profile (e.g., water vapor) has a negligible impact on the diurnal DRESW computation. Therefore, we only compute the diurnal variation of DRESW due to the change of solar zenith angle and ignore the small diurnal variation of DRELW as well as the impacts of atmospheric profile change on DRESW.
Table 5Diurnally mean DRESW and DRESW efficiency at TOA and the surface.
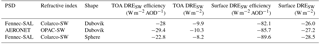
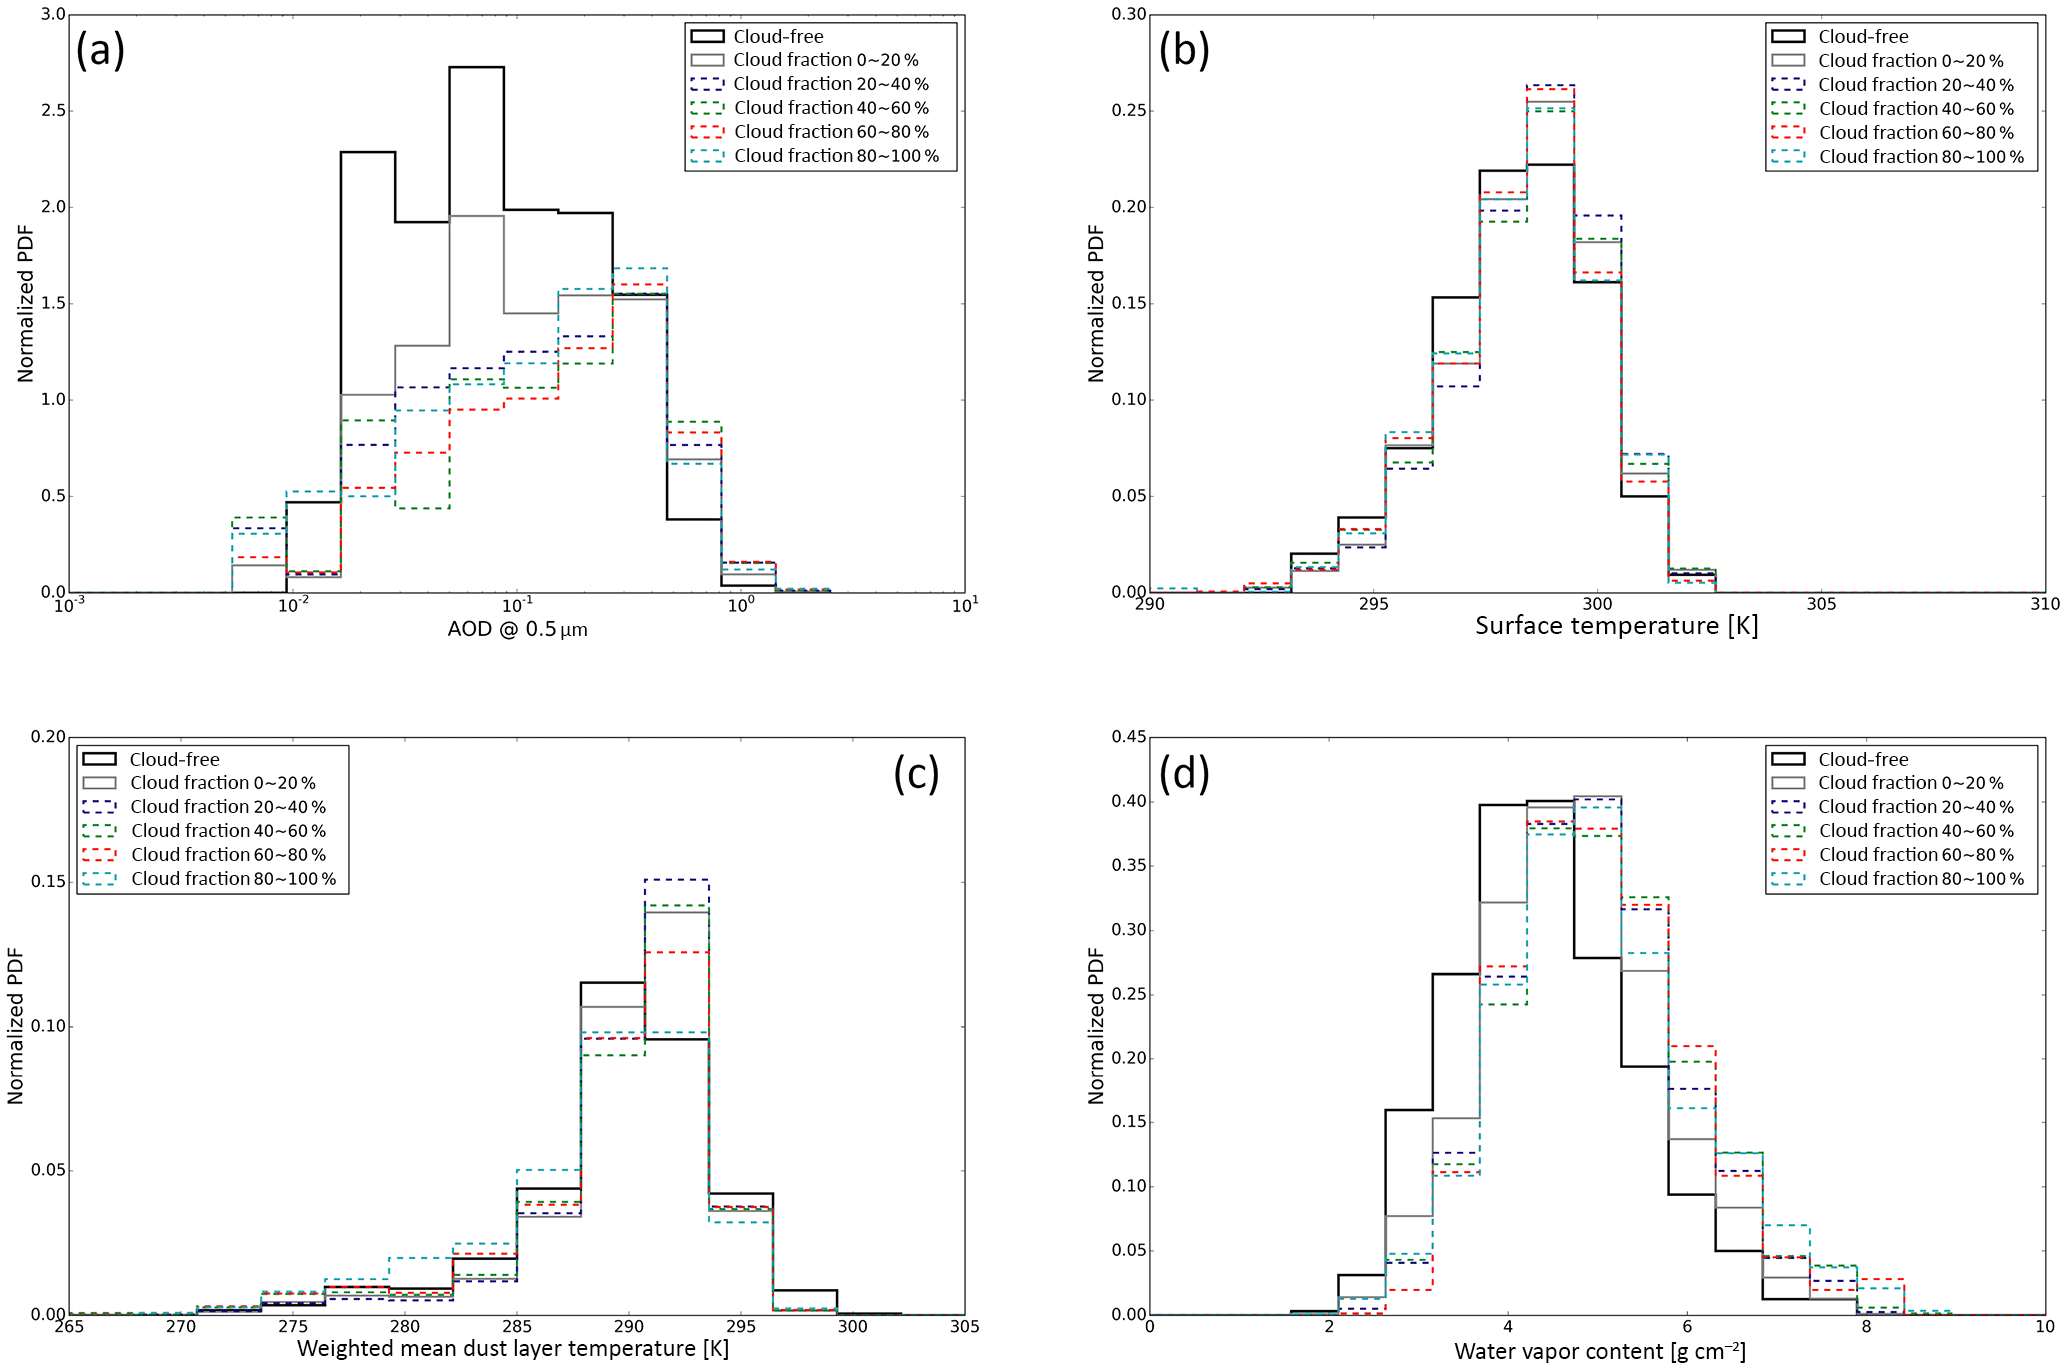
Figure 11Histograms of (a) dust AOD, (b) surface temperature, (c) dust temperature, and (d) total column water vapor of dust-dominant CERES pixels with different cloud fractions.
Table 5 summarizes the key results of the diurnal mean DRESW and DRESW efficiency at TOA, as well as at the surface. In the SW, the two most reasonable combinations of PSD and refractive index, Fennec-SAL PSD–Colarco-SW and AERONET-PSD–OPAC-SW, lead to similar TOA DRESW efficiencies around −29 W m−2 AOD−1, which is at the center of the −16–41 W m−2 AOD−1 range reported in Yu et al. (2006). At the surface, the DRESW efficiency based on these two combinations is around −83 W m−2 AOD−1, which is significantly stronger than the −27 to −68 W m−2 AOD−1 range reported in Yu et al. (2006). It should be noted that we have limited this study to dust-dominant cases, whereas the values in Yu et al. (2006) are based on a simple domain average and include other types of aerosol.
By combining the information in Tables 3 and 5, we can easily derive the net DREnet of dust in the North Atlantic during summer. The TOA DREnet based on the combination of Fennec-SAL PSD–Colarco-SW–OPAC-LW refractive indices gives a regional mean DREnet of −6.9 and −18.3 W m−2 at TOA and the surface, respectively. In comparison, the corresponding values based on the combination of AERONET PSD–OPAC-SW–OPAC-LW refractive indices are −8.5 and −22.5 W m−2, respectively. It is interesting and important to point out that the DRELW is significant, about 17–36 % (depending on the choice of PSD and refractive index) in terms of magnitude with respect to the DRESW, and therefore not negligible in the DREnet regardless whether for TOA or the surface.
In this study, we use A-Train satellite observations reported in the CCCM product and recent in situ measurements of dust properties to investigate the DREs of the dust aerosols in the North Atlantic African dust outflow region during summer months. First, we select about 600 cloud-free and dust-dominant CERES pixels from 5 seasons of the CCCM product. Based on these cases, we first derive a set of observation-based instantaneous (corresponding to Aqua overpass time) DRESW efficiency and DRESW using the combination of CERES-measured TOA flux and MODIS- or CALIPSO-retrieved dust AOD. The DRESW efficiency and DRESW based on CERES–MODIS observation are W m−2 AOD−1 and W m−2, respectively. The values based on the CERES–CALIOP combination are W m−2 AOD−1 and W m−2, respectively. Using the combination of CERES-measured OLR (i.e., with dust) and computed dust-free OLR based on ancillary data, we also derive a set of semi-observation-based TOA DRELW between 2.38 and 3.72 W m−2.
In the follow-up sensitivity study, we use the RRTM radiative transfer model to compute the DRE of dust using the observed 0.5 µm dust extinction profiles from CALIPSO under various different assumptions of dust PSD, refractive index, and shape distributions. We find that two dust models, one based on Fennec-SAL PSD and Colarco-SW refractive index and the other on AERONET PSD and OPAC-SW refractive index, provide the best fit to the observation-based DRESW efficiency and DRESW. However, only the one based on the Fennec-SAL PSD, which is much coarser than the AERONET-PSD, can also provide a reasonable fit to the observation-based DRELW. We also find that the DREs based on the two spheroidal dust models are quite similar to each other, but more different from those based on spherical dust, suggesting that the detailed shape distribution is less important in the calculation of dust DRE. Based on the dust model that provides the best fit to the observation-based DRE, we estimate the diurnal mean dust DRESW efficiency in the North Atlantic region during summer months (JJA) from 2007 to 2010 to be around −28 and −82 W m−2 AOD−1 at TOA and the surface, respectively. The corresponding DRESW is −9.9 and −26 W m−2 at TOA and the surface, respectively. The diurnal mean DRELW is about 3 W m−2 at TOA and 7.7 W m−2 at the surface. As dust aerosol properties vary temporally and spatially, DREs of dust aerosols also have high spatiotemporal variation. Therefore, it is worth extending the analysis to other regions and years in future studies.
Our estimation of the instantaneous TOA DRESW efficiency is in reasonable agreement with the values reported in a recent study by Mishra et al. (2017). Their observations are from a satellite instrument similar to CERES, called Megha-Tropiques ScaRaB (MT-ScaRaB). Flying in a low-inclination orbit, this instrument is able to observe the TOA radiation in the tropical region at various local times. Using 4 years of MT-ScaRaB radiation and MODIS AOD observations, Mishra et al. (2017) estimate that the instantaneous TOA DRESW corresponding to a solar zenith angle of ∼ 40∘ in the North Atlantic region is about W m−2 AOD−1, which is in between our range of W m−2 AOD−1 and W m−2 AOD−1. Our estimation of the diurnal mean TOA DRESW efficiency (−28 W m−2 AOD−1) is in between −18 W m−2 AOD−1 reported in Mishra et al. (2017) and −35 W m−2 AOD−1 reported in Li et al. (2004). The difference may result from the different selection of cases and domain. Note that our analysis is limited to cloud-free and dust-dominant cases that are selected based on MODIS and CALIOP observations.
Due to the lack of studies on dust DRELW in this region, it is difficult to find a comparable result in the literature to validate our estimate of DRELW. Nevertheless, our result that the positive DRELW cancels about 30 % of the negative DRESW in the computation of the diurnal mean net dust DRE is in agreement with many previous studies attesting to the importance of dust DRELW (e.g., Zhang and Christopher, 2003; Haywood et al., 2005). Note that over land, e.g., the Sahara Desert, the brighter surface reflectance will reduce the cooling effect of DRESW or even leads to warming (positive) DRESW. At the same time, the hot surface temperature during the daytime may result in DRELW significantly larger than that over ocean. Therefore, the DRELW is expected to be even more significant in comparison with DRESW over land than over ocean, which is an interesting topic for future studies.
Another interesting result from this study is that given the same visible AOD, dust particle size and dust absorption in the SW can counteract each other in determining dust DRESW. As a result, it is difficult to specify both variables using the SW radiation alone. In such case, the LW radiation could provide complementary and important information on dust properties, especially dust particle size. Most of the current aerosol property retrieval algorithms use only SW radiation observations. There are also a few algorithms to retrieve dust properties using only LW radiation observations (e.g., Pierangelo et al., 2004; DeSouza-Machado et al., 2006; Peyridieu et al., 2010). It is worth exploring in future studies the possibility and benefit of retrieving dust properties utilizing both SW and LW observations.
Finally, as discussed in Sect. 3.1, because the selected region is quite cloudy, and the footprint of CERES is relatively large, the sampling rate of cloud-free and dust-dominant cases is very low. An important question that arises from the low sampling is whether our results are representative. More specifically, one may wonder if our cloud-free cases are also representative of the clear-sky part of cloudy CERES pixels. To address this question, we investigated if dust properties (e.g., AOD and dust temperature) and meteorological conditions (e.g., surface temperature and precipitable water) have any correlation with the cloud fraction. If the statistics of the dust properties and meteorological conditions from our clear-sky cases are similar to those from the cloudy cases, then our results are arguably representative of not only the clear-sky dust-dominant CERES pixels, but also the clear-sky part of cloudy dust-dominant CERES pixels. To this end, we first check the AOD. This time we selected all the dust-dominant cases based on CALIOP observations regardless of the cloud fraction. Then, we divided all the cases into five groups according to the cloud fraction within the CERES pixel, i.e., 0–20 %, 20–40 %, 40–60 %, 60–80 %, and > 80 %. As shown in Fig. 11a, the dust AOD from the cloudy groups is statistically larger than that from our cloud-free cases, which also means a larger DRESW if the DRE efficiency remains the same. We do not know whether other dust properties, such as size, shape, and refractive index, are correlated with cloud fraction. Investigating this is extremely challenging, if not impossible, using satellite observations. We have to leave this for future studies using other types of measurements (e.g., in situ). In addition to dust AOD, we also checked the surface temperature, the dust layer temperature (weighted by the dust extinction coefficient from CALIOP), and the total amount of water vapor in the column. These quantities are potentially important for the DRELW. As shown in the Fig. 11, in terms of the surface temperature (Fig. 11b) and dust layer temperature (Fig. 11c), the cloudy dust-dominant cases are almost identical to our cloud-free dust-dominant cases. However, not surprisingly, we found that the cloud-free cases are drier than the cloudy cases (Fig. 11c). Note that, given the same dust properties, an increasing of water vapor increases the atmospheric opacity in the LW, which tends to reduce the dust DRELW. In summary, if the dust particles' properties (i.e., dust size, shape, and refractive index) remain the same, then the DRESW of dust in the clear-sky part of cloudy CERES pixels would be slightly larger than that based on our results because of the larger AOD. In the LW, the larger AOD of the clear-sky part of cloudy CERES pixels would lead to a larger DRELW, but on the other hand, the increased humidity under cloudy conditions counteracts the effect of larger AOD. The net result is dependent on the relative importance of these two competing factors.
The CCCM data are from NASA (https://eosweb.larc.nasa.gov/project/ceres/cer-news_cccm_aqua-fm3-modis-cal-cs_relb1_table, Kato et al., 2011).
ZZ and HY conceived the scientific ideas, and QS and ZZ did the analysis and completed the initial draft of the manuscript. SK helped to understand CCCM data. HY, SK, PY, PC, LAR and CLR gave many suggestions to the study and contributed significantly to the revision of the manuscript.
The authors declare that they have no conflict of interest.
Zhibo Zhang is supported by the NASA TASNPP project. Qianqian Song is
supported by a fellowship from the Joint Center for Earth Systems Technology
of UMBC. Hongbin Yu was supported by the NASA Radiation Science Program
managed by Hal Maring and the CALIPSO/CloudSat project managed by
David Considine. Seiji Kato's contribution to this research has been
supported by the NASA CERES project. Peter Colarco's work is supported by the
NASA Atmospheric Composition Modeling and Analysis Program (ACMAP,
16-ACMAP16-0051, PI: Adriana Rocha Lima,
program manager: Richard Eckman). Lorraine A. Remer would like to acknowledge support from NASA grants NNX15AD15G and NNX14AR21G for her participation in this project.
Edited by: Jui-Yuan Christine Chiu
Reviewed by: three anonymous referees
Ackerman, A. S., Toon, O. B., Stevens, D. E., Heymsfield, A. J., Ramanathan, V., and Welton, E. J.: Reduction of tropical cloudiness by soot, Science, 288, 1042–1047, https://doi.org/10.1126/science.288.5468.1042, 2000.
Ackerman, S. A., Strabala, K. I., Menzel, W. P., Frey, R. A., Moeller, C. C., and Gumley, L. E.: Discriminating clear sky from clouds with MODIS, J. Geophys. Res.-Atmos., 103, 32141–32157, https://doi.org/10.1029/1998jd200032, 1998.
Albrecht, B. A.: Aerosols, Cloud Microphysics, and Fractional Cloudiness, Science, 245, 1227–1230, https://doi.org/10.1126/science.245.4923.1227, 1989.
Balkanski, Y., Schulz, M., Claquin, T., and Guibert, S.: Reevaluation of Mineral aerosol radiative forcings suggests a better agreement with satellite and AERONET data, Atmos. Chem. Phys., 7, 81–95, https://doi.org/10.5194/acp-7-81-2007, 2007.
Boucher, O., Randall, D., Artaxo, P., Bretherton, C., Feingold, G., Forster, P., Kerminen, V.-M., Kondo, Y., Liao, H., Lohmann, U., Rasch, P., Satheesh, S. K., Sherwood, S., Stevens, B., and Zhang, X. Y.: Clouds and Aerosols, in: Climate Change 2013: The Physical Science Basis. Contribution of Working Group I to the Fifth Assessment Report of the Intergovernmental Panel on Climate Change, edited by: Stocker, T. F., Qin, D., Plattner, G.-K., Tignor, M., Allen, S. K., Boschung, J., Nauels, A., Xia,Y., Bex, V., and Midgley, P. M., Cambridge University Press, Cambridge, United Kingdom and New York, NY, USA, 2013.
Carlson, T. N. and Benjamin, S. G.: Radiative Heating Rates for Saharan Dust, J. Atmos. Sci., 37, 193–213, https://doi.org/10.1175/1520-0469(1980)037<0193:Rhrfsd>2.0.Co;2, 1980.
Cess, R. D.: Nuclear-War – Illustrative Effects of Atmospheric Smoke and Dust Upon Solar-Radiation, Climatic Change, 7, 237–251, https://doi.org/10.1007/Bf00140508, 1985.
Choobari, O. A., Zawar-Reza, P., and Sturman, A.: The global distribution of mineral dust and its impacts on the climate system: A review, Atmos. Res., 138, 152–165, https://doi.org/10.1016/j.atmosres.2013.11.007, 2014.
Colarco, P. R., Nowottnick, E. P., Randles, C. A., Yi, B. Q., Yang, P., Kim, K. M., Smith, J. A., and Bardeen, C. G.: Impact of radiatively interactive dust aerosols in the NASA GEOS-5 climate model: Sensitivity to dust particle shape and refractive index, J. Geophys. Res.-Atmos., 119, 753–786, https://doi.org/10.1002/2013jd020046, 2014.
Colarco, P. R., Toon, O. B., Torres, O., and Rasch, P. J.: Determining the UV imaginary index of refraction of Saharan dust particles from Total Ozone Mapping Spectrometer data using a three-dimensional model of dust transport, J. Geophys. Res.-Atmos., 107, 4289, https://doi.org/10.1029/2001jd000903, 2002.
Collins, W. D., Rasch, P. J., Eaton, B. E., Khattatov, B. V., Lamarque, J. F., and Zender, C. S.: Simulating aerosols using a chemical transport model with assimilation of satellite aerosol retrievals: Methodology for INDOEX, J. Geophys. Res.-Atmos., 106, 7313–7336, https://doi.org/10.1029/2000jd900507, 2001.
Cuesta, J., Marsham, J. H., Parker, D. J., and Flamant, C.: Dynamical mechanisms controlling the vertical redistribution of dust and the thermodynamic structure of the West Saharan atmospheric boundary layer during summer, Atmos. Sci. Lett., 10, 34–42, https://doi.org/10.1002/asl.207, 2009.
DeSouza-Machado, S. G., Strow, L. L., Hannon, S. E., and Motteler, H. E.: Infrared dust spectral signatures from AIRS, Geophys. Res. Lett., 33, L03801, https://doi.org/10.1029/2005gl024364, 2006.
Di Biagio, C., Formenti, P., Styler, S. A., Pangui, E., and Doussin, J. F.: Laboratory chamber measurements of the longwave extinction spectra and complex refractive indices of African and Asian mineral dusts, Geophys. Res. Lett., 41, 6289–6297, https://doi.org/10.1002/2014gl060213, 2014.
Di Biagio, C., Formenti, P., Balkanski, Y., Caponi, L., Cazaunau, M., Pangui, E., Journet, E., Nowak, S., Caquineau, S., Andreae, M. O., Kandler, K., Saeed, T., Piketh, S., Seibert, D., Williams, E., and Doussin, J.-F.: Global scale variability of the mineral dust long-wave refractive index: a new dataset of in situ measurements for climate modeling and remote sensing, Atmos. Chem. Phys., 17, 1901–1929, https://doi.org/10.5194/acp-17-1901-2017, 2017.
Dubovik, O., Holben, B., Eck, T. F., Smirnov, A., Kaufman, Y. J., King, M. D., Tanre, D., and Slutsker, I.: Variability of absorption and optical properties of key aerosol types observed in worldwide locations, J. Atmos. Sci., 59, 590–608, https://doi.org/10.1175/1520-0469(2002)059<0590:Voaaop>2.0.Co;2, 2002.
Dubovik, O., Sinyuk, A., Lapyonok, T., Holben, B. N., Mishchenko, M., Yang, P., Eck, T. F., Volten, H., Munoz, O., Veihelmann, B., van der Zande, W. J., Leon, J. F., Sorokin, M., and Slutsker, I.: Application of spheroid models to account for aerosol particle nonsphericity in remote sensing of desert dust, J. Geophys. Res.-Atmos., 111, D11208, https://doi.org/10.1029/2005jd006619, 2006.
Evan, A. T., Dunion, J., Foley, J. A., Heidinger, A. K., and Velden, C. S.: New evidence for a relationship between Atlantic tropical cyclone activity and African dust outbreaks, Geophys. Res. Lett., 33, L19813, https://doi.org/10.1029/2006gl026408, 2006.
Formenti, P., Schütz, L., Balkanski, Y., Desboeufs, K., Ebert, M., Kandler, K., Petzold, A., Scheuvens, D., Weinbruch, S., and Zhang, D.: Recent progress in understanding physical and chemical properties of African and Asian mineral dust, Atmos. Chem. Phys., 11, 8231–8256, https://doi.org/10.5194/acp-11-8231-2011, 2011.
Fouquart, Y., Bonnel, B., Brogniez, G., Buriez, J. C., Smith, L., Morcrette, J. J., and Cerf, A.: Observations of Saharan Aerosols – Results of Eclats Field Experiment 2. Broad-Band Radiative Characteristics of the Aerosols and Vertical Radiative Flux Divergence, J. Clim. Appl. Meteorol., 26, 38–52, https://doi.org/10.1175/1520-0450(1987)026<0038:Oosaro>2.0.Co;2, 1987.
Hansen, J., Sato, M., and Ruedy, R.: Radiative forcing and climate response, J. Geophys. Res.-Atmos., 102, 6831–6864, https://doi.org/10.1029/96jd03436, 1997.
Haywood, J. M., Allan, R. P., Culverwell, I., Slingo, T., Milton, S., Edwards, J., and Clerbaux, N.: Can desert dust explain the outgoing longwave radiation anomaly over the Sahara during July 2003?, J. Geophys. Res.-Atmos., 110, D05105, https://doi.org/10.1029/2004jd005232, 2005.
Hess, M., Koepke, P., and Schult, I.: Optical properties of aerosols and clouds: The software package OPAC, B. Am. Meteorol. Soc., 79, 831–844, https://doi.org/10.1175/1520-0477(1998)079<0831:Opoaac>2.0.Co;2, 1998.
Holz, R. E., Ackerman, S. A., Nagle, F. W., Frey, R., Dutcher, S., Kuehn, R. E., Vaughan, M. A., and Baum, B.: Global Moderate Resolution Imaging Spectroradiometer (MODIS) cloud detection and height evaluation using CALIOP, J. Geophys. Res.-Atmos., 113, D00a19, https://doi.org/10.1029/2008jd009837, 2008.
Hsu, N. C., Herman, J. R., and Weaver, C.: Determination of radiative forcing of Saharan dust using combined TOMS and ERBE data, J. Geophys. Res.-Atmos., 105, 20649–20661, https://doi.org/10.1029/2000jd900150, 2000.
Jickells, T. D., An, Z. S., Andersen, K. K., Baker, A. R., Bergametti, G., Brooks, N., Cao, J. J., Boyd, P. W., Duce, R. A., Hunter, K. A., Kawahata, H., Kubilay, N., laRoche, J., Liss, P. S., Mahowald, N., Prospero, J. M., Ridgwell, A. J., Tegen, I., and Torres, R.: Global iron connections between desert dust, ocean biogeochemistry, and climate, Science, 308, 67–71, https://doi.org/10.1126/science.1105959, 2005.
Kandler, K., Schutz, L., Deutscher, C., Ebert, M., Hofmann, H., Jackel, S., Jaenicke, R., Knippertz, P., Lieke, K., Massling, A., Petzold, A., Schladitz, A., Weinzierl, B., Wiedensohler, A., Zorn, S., and Weinbruch, S.: Size distribution, mass concentration, chemical and mineralogical composition and derived optical parameters of the boundary layer aerosol at Tinfou, Morocco, during SAMUM 2006, Tellus B, 61, 32–50, https://doi.org/10.1111/j.1600-0889.2008.00385.x, 2009.
Karyampudi, V. M., Palm, S. P., Reagen, J. A., Fang, H., Grant, W. B., Hoff, R. M., Moulin, C., Pierce, H. F., Torres, O., Browell, E. V., and Melfi, S. H.: Validation of the Saharan dust plume conceptual model using lidar, Meteosat, and ECMWF data, B. Am. Meteorol. Soc., 80, 1045–1075, https://doi.org/10.1175/1520-0477(1999)080<1045:Votsdp>2.0.Co;2, 1999.
Kato, S., Sun-Mack, S., Miller, W. F., Rose, F. G., Chen, Y., Minnis, P., and Wielicki, B. A.: Relationships among cloud occurrence frequency, overlap, and effective thickness derived from CALIPSO and CloudSat merged cloud vertical profiles, J. Geophys. Res.-Atmos., 115, D00h28, https://doi.org/10.1029/2009jd012277, 2010.
Kato, S., Rose, F. G., Sun-Mack, S., Miller, W. F., Chen, Y., Rutan, D. A., Stephens, G. L., Loeb, N. G., Minnis, P., Wielicki, B. A., Winker, D. M., Charlock, T. P., Stackhouse, P. W., Xu, K. M., and Collins, W. D.: Improvements of top-of-atmosphere and surface irradiance computations with CALIPSO-, CloudSat-, and MODIS-derived cloud and aerosol properties, J. Geophys. Res.-Atmos., 116, D19209, https://doi.org/10.1029/2011jd016050, 2011.
Keil, A. and Haywood, J. M.: Solar radiative forcing by biomass burning aerosol particles during SAFARI 2000: A case study based on measured aerosol and cloud properties, J. Geophys. Res.-Atmos., 108, 8467, https://doi.org/10.1029/2002JD002315 , 2003.
Kim, D., Chin, M., Yu, H., Eck, T. F., Sinyuk, A., Smirnov, A., and Holben, B. N.: Dust optical properties over North Africa and Arabian Peninsula derived from the AERONET dataset, Atmos. Chem. Phys., 11, 10733–10741, https://doi.org/10.5194/acp-11-10733-2011, 2011.
Kim, M. H., Kim, S. W., Yoon, S. C., and Omar, A. H.: Comparison of aerosol optical depth between CALIOP and MODIS-Aqua for CALIOP aerosol subtypes over the ocean, J. Geophys. Res.-Atmos., 118, 13241–13252, https://doi.org/10.1002/2013jd019527, 2013.
Koepke, P., Gasteiger, J., and Hess, M.: Technical Note: Optical properties of desert aerosol with non-spherical mineral particles: data incorporated to OPAC, Atmos. Chem. Phys., 15, 5947–5956, https://doi.org/10.5194/acp-15-5947-2015, 2015.
Kok, J. F., Ridley, D. A., Zhou, Q., Miller, R. L., Zhao, C., Heald, C. L., Ward, D. S., Albani, S., and Haustein, K.: Smaller desert dust cooling effect estimated from analysis of dust size and abundance, Nat. Geosci., 10, 274–278, https://doi.org/10.1038/Ngeo2912, 2017.
Koren, I., Kaufman, Y. J., Remer, L. A., and Martins, J. V.: Measurement of the effect of Amazon smoke on inhibition of cloud formation, Science, 303, 1342–1345, https://doi.org/10.1126/science.1089424, 2004.
Lau, K. M. and Kim, K. M.: Cooling of the Atlantic by Saharan dust, Geophys. Res. Lett., 34, L23811, https://doi.org/10.1029/2007gl031538, 2007.
Levoni, C., Cervino, M., Guzzi, R., and Torricella, F.: Atmospheric aerosol optical properties: a database of radiative characteristics for different components and classes, Appl. Opt., 36, 8031–8041, https://doi.org/10.1364/Ao.36.008031, 1997.
Levy, R. C., Remer, L. A., Mattoo, S., Vermote, E. F., and Kaufman, Y. J.: Second-generation operational algorithm: Retrieval of aerosol properties over land from inversion of Moderate Resolution Imaging Spectroradiometer spectral reflectance, J. Geophys. Res.-Atmos., 112, D13211, https://doi.org/10.1029/2006jd007811, 2007.
Li, F., Vogelmann, A. M., and Ramanathan, V.: Saharan dust aerosol radiative forcing measured from space, J. Climate, 17, 2558–2571, https://doi.org/10.1175/1520-0442(2004)017<2558:Sdarfm>2.0.Co;2, 2004.
Liao, H. and Seinfeld, J. H.: Radiative forcing by mineral dust aerosols: sensitivity to key variables, J. Geophys. Res.-Atmos., 103, 31637–31645, https://doi.org/10.1029/1998jd200036, 1998.
Liu, Z. Y., Omar, A., Vaughan, M., Hair, J., Kittaka, C., Hu, Y. X., Powell, K., Trepte, C., Winker, D., Hostetler, C., Ferrare, R., and Pierce, R.: CALIPSO lidar observations of the optical properties of Saharan dust: A case study of long-range transport, J. Geophys. Res.-Atmos., 113, D07207, https://doi.org/10.1029/2007jd008878, 2008.
Ma, X., Bartlett, K., Harmon, K., and Yu, F.: Comparison of AOD between CALIPSO and MODIS: significant differences over major dust and biomass burning regions, Atmos. Meas. Tech., 6, 2391–2401, https://doi.org/10.5194/amt-6-2391-2013, 2013.
Mahowald, N., Albani, S., Kok, J. F., Engelstaeder, S., Scanza, R., Ward, D. S., and Flanner, M. G.: The size distribution of desert dust aerosols and its impact on the Earth system, Aeolian Res., 15, 53–71, https://doi.org/10.1016/j.aeolia.2013.09.002, 2014.
Maring, H., Savoie, D. L., Izaguirre, M. A., Custals, L., and Reid, J. S.: Mineral dust aerosol size distribution change during atmospheric transport, J. Geophys. Res.-Atmos., 108, 8592, https://doi.org/10.1029/2002jd002536, 2003.
McCormick, R. A. and Ludwig, J. H.: Climate Modification by Atmospheric Aerosols, Science, 156, 1358–1359, https://doi.org/10.1126/science.156.3780.1358, 1967.
Meng, Z. K., Yang, P., Kattawar, G. W., Bi, L., Liou, K. N., and Laszlo, I.: Single-scattering properties of tri-axial ellipsoidal mineral dust aerosols: A database for application to radiative transfer calculations, J. Aerosol Sci., 41, 501–512, https://doi.org/10.1016/j.jaerosci.2010.02.008, 2010.
Miller, R. L. and Tegen, I.: Climate response to soil dust aerosols, J. Climate, 11, 3247–3267, https://doi.org/10.1175/1520-0442(1998)011<3247:Crtsda>2.0.Co;2, 1998.
Mishchenko, M. I., Travis, L. D., Kahn, R. A., and West, R. A.: Modeling phase functions for dustlike tropospheric aerosols using a shape mixture of randomly oriented polydisperse spheroids, J. Geophys. Res.-Atmos., 102, 16831–16847, https://doi.org/10.1029/96jd02110, 1997.
Mishra, M. K., Gupta, A. K., and Rajeev, K.: Spaceborne Observations of the Diurnal Variation of Shortwave Aerosol Direct Radiative Effect at Top of Atmosphere Over the Dust-Dominated Arabian Sea and the Atlantic Ocean, IEEE T. Geosci. Remote, 55, 6610–6616, https://doi.org/10.1109/Tgrs.2017.2730758, 2017.
Mlawer, E. J., Taubman, S. J., Brown, P. D., Iacono, M. J., and Clough, S. A.: Radiative transfer for inhomogeneous atmospheres: RRTM, a validated correlated-k model for the longwave, J. Geophys. Res.-Atmos., 102, 16663–16682, https://doi.org/10.1029/97jd00237, 1997.
Myhre, G., Grini, A., Haywood, J. M., Stordal, F., Chatenet, B., Tanre, D., Sundet, J. K., and Isaksen, I. S. A.: Modeling the radiative impact of mineral dust during the Saharan Dust Experiment (SHADE) campaign, J. Geophys. Res.-Atmos., 108, 8579, https://doi.org/10.1029/2002jd002566, 2003.
Peyridieu, S., Chédin, A., Tanré, D., Capelle, V., Pierangelo, C., Lamquin, N., and Armante, R.: Saharan dust infrared optical depth and altitude retrieved from AIRS: a focus over North Atlantic – comparison to MODIS and CALIPSO, Atmos. Chem. Phys., 10, 1953–1967, https://doi.org/10.5194/acp-10-1953-2010, 2010.
Pierangelo, C., Chédin, A., Heilliette, S., Jacquinet-Husson, N., and Armante, R.: Dust altitude and infrared optical depth from AIRS, Atmos. Chem. Phys., 4, 1813–1822, https://doi.org/10.5194/acp-4-1813-2004, 2004.
Platnick, S., King, M. D., Ackerman, S. A., Menzel, W. P., Baum, B. A., Riedi, J. C., and Frey, R. A.: The MODIS cloud products: Algorithms and examples from Terra, IEEE T. Geosci. Remote, 41, 459–473, https://doi.org/10.1109/Tgrs.2002.808301, 2003.
Räisänen, P., Haapanala, P., Chung, C. E., Kahnert, M., Makkonen, R., Tonttila, J., and Nousiainen, T.: Impact of dust particle non-sphericity on climate simulations, Q. J. Roy. Meteor. Soc., 139, 677, 2222–2232, https://doi.org/10.1002/qj.2084, 2013.
Rajot, J. L., Formenti, P., Alfaro, S., Desboeufs, K., Chevaillier, S., Chatenet, B., Gaudichet, A., Journet, E., Marticorena, B., Triquet, S., Maman, A., Mouget, N., and Zakou, A.: AMMA dust experiment: An overview of measurements performed during the dry season special observation period (SOP0) at the Banizoumbou (Niger) supersite, J. Geophys. Res.-Atmos., 113, D00c14, https://doi.org/10.1029/2008jd009906, 2008.
Ramaswamy, V. and Kiehl, J. T.: Sensitivities of the Radiative Forcing Due to Large Loadings of Smoke and Dust Aerosols, J. Geophys. Res.-Atmos., 90, 5597–5613, https://doi.org/10.1029/JD090iD03p05597, 1985.
Remer, L. A., Kaufman, Y. J., Tanre, D., Mattoo, S., Chu, D. A., Martins, J. V., Li, R. R., Ichoku, C., Levy, R. C., Kleidman, R. G., Eck, T. F., Vermote, E., and Holben, B. N.: The MODIS aerosol algorithm, products, and validation, J. Atmos. Sci., 62, 947–973, https://doi.org/10.1175/Jas3385.1, 2005.
Rienecker, M. M., Suarez, M. J., Todling, R., Bacmeister, J., Takacs, L., Liu, H.-C., Gu, W., Sienkiewicz, M., Koster, R. D., Gelaro, R., Stajner, I., and and Nielsen, J. E.: The GEOS-5 data assimilation system – Documentation of versions 5.0.1, 5.1.0, and 5.2.0, NASA Tech. Memo., 27, 2008.
Rosenfeld, D. and Lensky, I. M.: Satellite-based insights into precipitation formation processes in continental and maritime convective clouds, B. Am. Meteorol. Soc., 79, 2457–2476, https://doi.org/10.1175/1520-0477(1998)079<2457:Sbiipf>2.0.Co;2, 1998.
Ryder, C. L., Highwood, E. J., Lai, T. M., Sodemann, H., and Marsham, J. H.: Impact of atmospheric transport on the evolution of microphysical and optical properties of Saharan dust, Geophys. Res. Lett., 40, 10, 2433–2438, https://doi.org/10.1002/grl.50482, 2013a.
Ryder, C. L., Highwood, E. J., Rosenberg, P. D., Trembath, J., Brooke, J. K., Bart, M., Dean, A., Crosier, J., Dorsey, J., Brindley, H., Banks, J., Marsham, J. H., McQuaid, J. B., Sodemann, H., and Washington, R.: Optical properties of Saharan dust aerosol and contribution from the coarse mode as measured during the Fennec 2011 aircraft campaign, Atmos. Chem. Phys., 13, 303–325, https://doi.org/10.5194/acp-13-303-2013, 2013b.
Ryder, C. L., McQuaid, J. B., Flamant, C., Rosenberg, P. D., Washington, R., Brindley, H. E., Highwood, E. J., Marsham, J. H., Parker, D. J., Todd, M. C., Banks, J. R., Brooke, J. K., Engelstaedter, S., Estelles, V., Formenti, P., Garcia-Carreras, L., Kocha, C., Marenco, F., Sodemann, H., Allen, C. J. T., Bourdon, A., Bart, M., Cavazos-Guerra, C., Chevaillier, S., Crosier, J., Darbyshire, E., Dean, A. R., Dorsey, J. R., Kent, J., O'Sullivan, D., Schepanski, K., Szpek, K., Trembath, J., and Woolley, A.: Advances in understanding mineral dust and boundary layer processes over the Sahara from Fennec aircraft observations, Atmos. Chem. Phys., 15, 8479–8520, https://doi.org/10.5194/acp-15-8479-2015, 2015.
Sokolik, I. N. and Toon, O. B.: Direct radiative forcing by anthropogenic airborne mineral aerosols, Nature, 381, 681–683, https://doi.org/10.1038/381681a0, 1996.
Sokolik, I. N. and Toon, O. B.: Incorporation of mineralogical composition into models of the radiative properties of mineral aerosol from UV to IR wavelengths, J. Geophys. Res.-Atmos., 104, 9423–9444, https://doi.org/10.1029/1998jd200048, 1999.
Sokolik, I. N., Toon, O. B., and Bergstrom, R. W.: Modeling the radiative characteristics of airborne mineral aerosols at infrared wavelengths, J. Geophys. Res.-Atmos., 103, 8813–8826, https://doi.org/10.1029/98jd00049, 1998.
Stegmann, P. G. and Yang, P.: A regional, size-dependent, and causal effective medium model for Asian and Saharan mineral dust refractive index spectra, J. Aerosol Sci., 114, 327–341, https://doi.org/10.1016/j.jaerosci.2017.10.003, 2017.
Tegen, I. and Lacis, A. A.: Modeling of particle size distribution and its influence on the radiative properties of mineral dust aerosol, J. Geophys. Res.-Atmos., 101, 19237–19244, https://doi.org/10.1029/95jd03610, 1996.
Tegen, I., Lacis, A. A., and Fung, I.: The influence on climate forcing of mineral aerosols from disturbed soils, Nature, 380, 419–422, https://doi.org/10.1038/380419a0, 1996.
Textor, C., Schulz, M., Guibert, S., Kinne, S., Balkanski, Y., Bauer, S., Berntsen, T., Berglen, T., Boucher, O., Chin, M., Dentener, F., Diehl, T., Easter, R., Feichter, H., Fillmore, D., Ghan, S., Ginoux, P., Gong, S., Grini, A., Hendricks, J., Horowitz, L., Huang, P., Isaksen, I., Iversen, I., Kloster, S., Koch, D., Kirkevåg, A., Kristjansson, J. E., Krol, M., Lauer, A., Lamarque, J. F., Liu, X., Montanaro, V., Myhre, G., Penner, J., Pitari, G., Reddy, S., Seland, Ø., Stier, P., Takemura, T., and Tie, X.: Analysis and quantification of the diversities of aerosol life cycles within AeroCom, Atmos. Chem. Phys., 6, 1777–1813, https://doi.org/10.5194/acp-6-1777-2006, 2006.
Twomey, S.: The influence of pollution on the shortwave albedo of clouds, J. Atmos. Sci., 34, 1149–1152, 1977.
Volz, F. E.: Infrared Refractive-Index of Atmospheric Aerosol Substances, Appl. Opt., 11, 755–759, https://doi.org/10.1364/Ao.11.000755, 1972.
Volz, F. E.: Infrared Optical-Constants of Ammonium Sulfate, Sahara Dust, Volcanic Pumice, and Flyash, Appl. Opt., 12, 564–568, https://doi.org/10.1364/Ao.12.000564, 1973.
Washington, R., Todd, M., Middleton, N. J., and Goudie, A. S.: Dust-storm source areas determined by the total ozone monitoring spectrometer and surface observations, Ann. Assoc. Am. Geogr., 93, 297–313, https://doi.org/10.1111/1467-8306.9302003, 2003.
Weinzierl, B., Sauer, D., Esselborn, M., Petzold, A., Veira, A., Rose, M., Mund, S., Wirth, M., Ansmann, A., Tesche, M., Gross, S., and Freudenthaler, V.: Microphysical and optical properties of dust and tropical biomass burning aerosol layers in the Cape Verde region-an overview of the airborne in situ and lidar measurements during SAMUM-2, Tellus B, 63, 589–618, https://doi.org/10.1111/j.1600-0889.2011.00566.x, 2011.
Weinzierl, B., Ansmann, A., Prospero, J. M., Althausen, D., Benker, N., Chouza, F., Dollner, M., Farrell, D., Fomba, W. K., Freudenthaler, V., Gasteiger, J., Gross, S., Haarig, M., Heinold, B., Kandler, K., Kristensen, T. B., Mayol-Bracero, O. L., Muller, T., Reitebuch, O., Sauer, D., Schafler, A., Schepanski, K., Spanu, A., Tegen, I., Toledano, C., and Walser, A.: The saharan aerosol long-range transport and aerosol-cloud-interaction experiment Overview and Selected Highlights, B. Am. Meteorol. Soc., 98, 1427–1451, https://doi.org/10.1175/Bams-D-15-00142.1, 2017.
Winker, D. M., Pelon, J., Coakley, J. A., Ackerman, S. A., Charlson, R. J., Colarco, P. R., Flamant, P., Fu, Q., Hoff, R. M., Kittaka, C., Kubar, T. L., Le Treut, H., McCormick, M. P., Megie, G., Poole, L., Powell, K., Trepte, C., Vaughan, M. A., and Wielicki, B. A.: THE CALIPSO MISSION A Global 3D View of Aerosols and Clouds, B. Am. Meteorol. Soc., 91, 1211–1229, https://doi.org/10.1175/2010bams3009.1, 2010.
Wiscombe, W. J.: Improved Mie Scattering Algorithms, Appl. Opt., 19, 1505–1509, https://doi.org/10.1364/Ao.19.001505, 1980.
Xu, H., Guo, J. P., Wang, Y., Zhao, C. F., Zhang, Z. B., Min, M., Miao, Y. C., Liu, H., He, J., Zhou, S. W., and Zhai, P. M.: Warming effect of dust aerosols modulated by overlapping clouds below, Atmos. Environ., 166, 393–402, https://doi.org/10.1016/j.atmosenv.2017.07.036, 2017.
Yang, E. S., Gupta, P., and Christopher, S. A.: Net radiative effect of dust aerosols from satellite measurements over Sahara, Geophys. Res. Lett., 36, L18812, https://doi.org/10.1029/2009gl039801, 2009.
Yu, H., Kaufman, Y. J., Chin, M., Feingold, G., Remer, L. A., Anderson, T. L., Balkanski, Y., Bellouin, N., Boucher, O., Christopher, S., DeCola, P., Kahn, R., Koch, D., Loeb, N., Reddy, M. S., Schulz, M., Takemura, T., and Zhou, M.: A review of measurement-based assessments of the aerosol direct radiative effect and forcing, Atmos. Chem. Phys., 6, 613–666, https://doi.org/10.5194/acp-6-613-2006, 2006.
Yu, H. B., Chin, M., Yuan, T. L., Bian, H. S., Remer, L. A., Prospero, J. M., Omar, A., Winker, D., Yang, Y. K., Zhang, Y., Zhang, Z. B., and Zhao, C.: The fertilizing role of African dust in the Amazon rainforest: A first multiyear assessment based on data from Cloud-Aerosol Lidar and Infrared Pathfinder Satellite Observations, Geophys. Res. Lett., 42, 1984–1991, https://doi.org/10.1002/2015gl063040, 2015.
Zhang, J. L. and Christopher, S. A.: Longwave radiative forcing of Saharan dust aerosols estimated from MODIS, MISR, and CERES observations on Terra, Geophys. Res. Lett., 30, 2188, https://doi.org/10.1029/2003gl018479, 2003.
Zhang, Z., Meyer, K., Yu, H., Platnick, S., Colarco, P., Liu, Z., and Oreopoulos, L.: Shortwave direct radiative effects of above-cloud aerosols over global oceans derived from 8 years of CALIOP and MODIS observations, Atmos. Chem. Phys., 16, 2877–2900, https://doi.org/10.5194/acp-16-2877-2016, 2016.
Zhou, M., Yu, H., Dickinson, R. E., Dubovik, O., and Holben, B. N.: A normalized description of the direct effect of key aerosol types on solar radiation as estimated from Aerosol Robotic Network aerosols and Moderate Resolution Imaging Spectroradiometer albedos, J. Geophys. Res.-Atmos., 110, D19202, https://doi.org/10.1029/2005jd005909, 2005.
- Abstract
- Introduction
- Data and models
- Case selection and observation-based estimate of instantaneous dust DRE
- Sensitivity of dust DRE to microphysical and optical properties of particles
- Diurnally mean dust DRE in North Atlantic
- Summary and discussions
- Data availability
- Author contributions
- Competing interests
- Acknowledgements
- References