the Creative Commons Attribution 4.0 License.
the Creative Commons Attribution 4.0 License.
 | 13 Aug 2018
Formation and evolution of tar balls from northwestern US wildfires
Peter R. Buseck
Kouji Adachi
Timothy B. Onasch
Stephen R. Springston
Lawrence Kleinman
Biomass burning is a major source of light-absorbing black and brown carbonaceous particles. Tar balls (TBs) are a type of brown carbonaceous particle apparently unique to biomass burning. Here we describe the first atmospheric observations of the formation and evolution of TBs from forest fires. Aerosol particles were collected on transmission electron microscopy (TEM) grids during aircraft transects at various downwind distances from the Colockum Tarps wildland fire. TB mass fractions, derived from TEM and in situ measurements, increased from <1 % near the fire to 31–45 % downwind, with little change in TB diameter. Given the observed evolution of TBs, it is recommended that these particles be labeled as processed primary particles, thereby distinguishing TB formation–evolution from secondary organic aerosols. Single-scattering albedo determined from scattering and absorption measurements increased slightly with downwind distance. Similar TEM and single-scattering albedo results were observed sampling multiple wildfires. Mie calculations are consistent with weak light absorbance by TBs (i.e., m similar to the literature values 1.56−0.02i or 1.80−0.007i) but not consistent with absorption 1 order of magnitude stronger observed in different settings. The field-derived TB mass fractions reported here indicate that this particle type should be accounted for in biomass burning emission inventories.
- Article
(5298 KB) - Full-text XML
-
Supplement
(2256 KB) - BibTeX
- EndNote


Wildfires are major sources of organic and black carbon aerosol particles (de Gouw and Jimenez, 2009; Bond et al., 2013; Andrea and Rosenfeld, 2008; Park et al., 2007) and tar balls (TBs), for reasons that will become apparent, are under-recognized constituents of wildfire emissions. Here we focus on the production of atmospheric TBs from wildfires in the northwestern United States and agricultural burns in the lower Mississippi Valley.
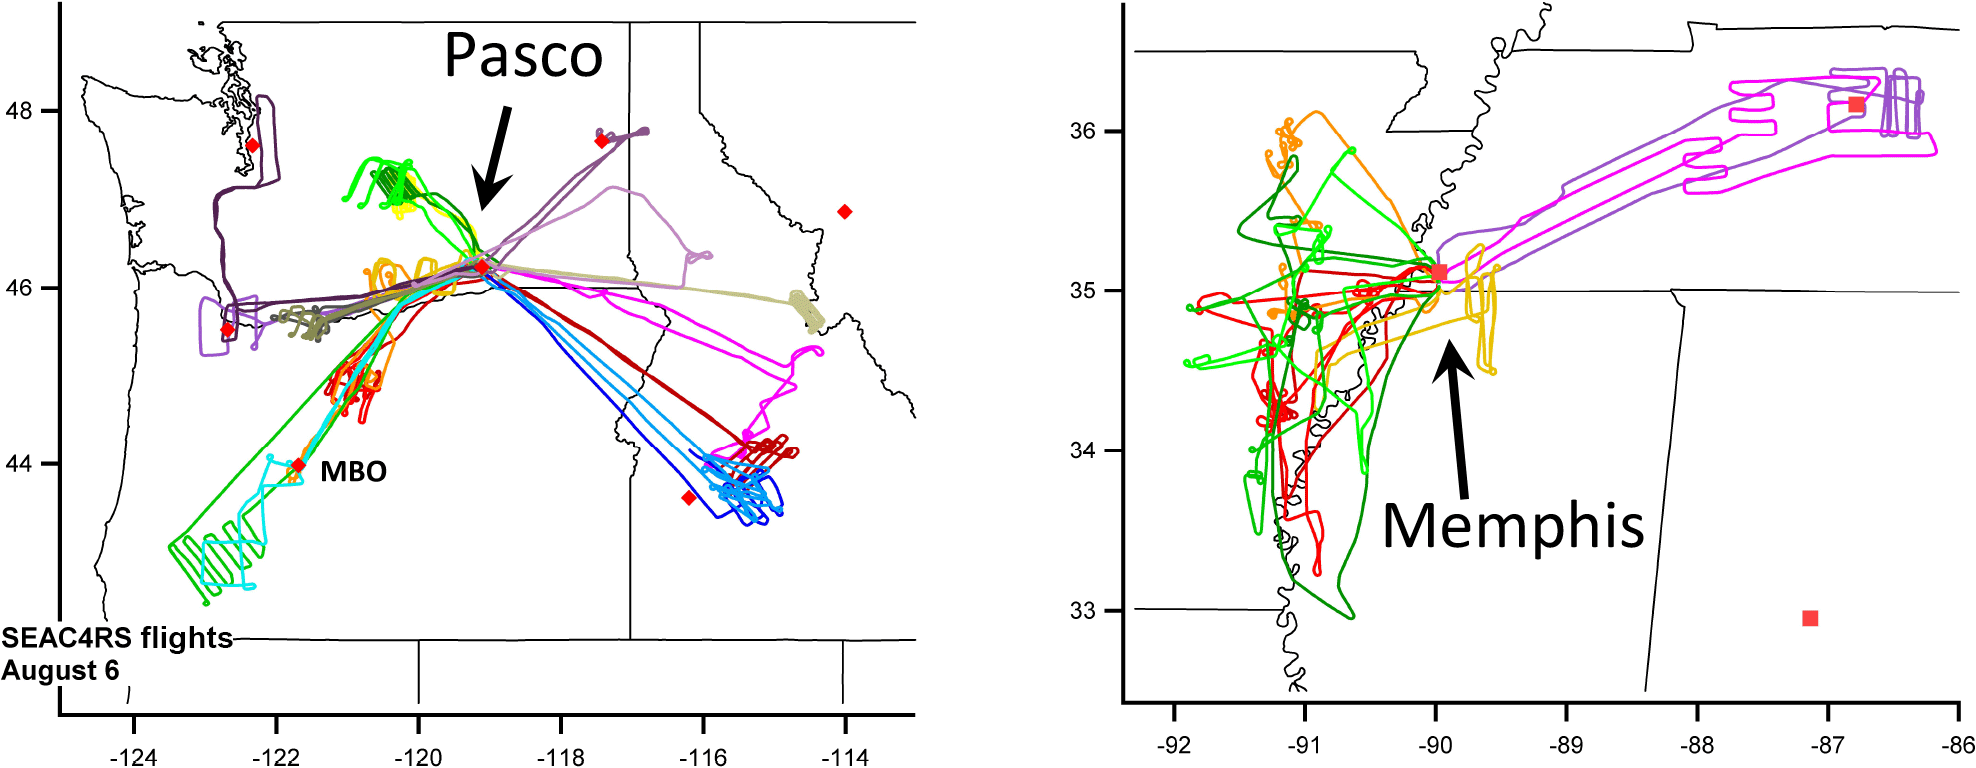
Figure 1Compilation of all BBOP flight tracks. The summer deployment was staged out of Pasco (WA) and targeted 17 wildfires in Idaho, Oregon, and Washington. The fall deployment targeted over 24 agricultural burns in the lower Mississippi Valley and was staged out of Memphis (TN). Five research flights targeted urban centers (Seattle, Portland, Spokane, Nashville, Memphis).
To help quantify the contribution of biomass burning (BB) to aerosol radiative forcing, the Department of Energy's Atmospheric Radiation Measurement (ARM) program carried out an aircraft-based field campaign (BBOP: Biomass Burning Observation Project; BBOP, 2015) that targeted the near-field evolution (<5 h) of BB aerosol particles. This campaign focused on wildfires in the northwestern United States in the summer and agricultural burns in the lower Mississippi Valley in the fall (Fig. 1). The present paper describes the wildfire production of TBs.
TBs (Pósfai et al., 2003, 2004; Li et al., 2003) are a type of carbonaceous particle that is characterized by near sphericity, high viscosity, absence of graphitic fine structure, and resistance to electron-beam radiation that appear to be the nearly exclusive byproduct of some types of biofuel combustion/pyrolysis and wildfires (Tóth et al., 2014; Tivanski et al., 2007; Hand et al., 2005; Cofer et al., 1988). Detection of TBs is currently limited to electron microscopy (transmission electron microscopy, TEM, Pósfai et al., 2004; Adachi and Buseck, 2011; secondary electron microscopy, SEM, Chakrabarty et al., 2006, 2010; China et al., 2013; and scanning transmission X-ray spectroscopy, STXM, Tivanski et al., 2007).
The origin of TBs is controversial. Suggestions include formation through secondary gas-to-particle polymerization during pyrolysis (Pósfai et al., 2004) and the rapid heating of directly injected “tar” droplets into the atmosphere (Tóth et al., 2014). We find that they form during volatile loss and maturation in the emission plume.
In some wildfire samples TBs are the dominant particle type collected on microscopy sample grids, outnumbering black carbon particles by a factor of 10 (Hand et al., 2005; China et al., 2013). Clearly, TB formation and TB microphysical and optical properties must be understood so that their radiative forcing contribution can be properly assessed and incorporated into climate models.
Using an aircraft-based, pseudo-Lagrangian sampling strategy in which samples of different plume ages were collected onto separate TEM grids, we report on the direct observation of TB formation downwind of the northwestern US Colockum Tarps wildfire1 near Ellensburg, WA. Flight tracks were perpendicular to the wind-advected fire plume with one upwind and six downwind transects repeated two or three times each. Our analysis combines the ratio of TB ∕ ns-soot2 derived from TEM analysis with non-refractory particulate matter (NR-PM) from the soot particle aerosol mass spectrometer (SP-AMS; Aerodyne Research, Inc.) and refractory black carbon (rBC) loadings from the single-particle soot photometer (SP2; Droplet Measurement Technologies). We observe a steady increase in the TB number and volume fraction with plume age. From the combined set of instruments, we obtain the first estimate of the particulate mass fraction of TBs in hours-old plumes: 31–45 %. A comparison of single-scattering albedo (SSA) from optical measurements compared with Mie calculations for limiting values of the TB refractive index (Alexander et al., 2008; Hoffer et al., 2016) suggests that TBs exert a cooling influence on such smoke plumes.
2.1 Aircraft platform
The BBOP field campaign comprised two deployments – a wildfire deployment staged in the Pacific Northwest (Richland, WA) from July to mid-September 2013 and an agricultural (controlled) burn deployment staged in the lower Mississippi Valley (Memphis, TN) during October 2013 (Fig. 1). Schmid et al. (2014) described the research platform used during the BBOP field campaign. The aircraft was equipped with an isokinetic aerosol inlet on the starboard side of the aircraft and a dedicated trace gas inlet on the port side. Ambient aerosol samples are brought to individual instruments via conductive tubing while trace gas sampling utilized PFA tubing and/or T316 stainless steel. All instruments were time synced prior to every flight. The Gulfstream 1 (G-1) aircraft was outfitted for four measurement classes: (i) microphysical properties, (ii) optical properties, (iii) trace gases, and (iv) radiation. Below are measurement details for those instruments in the present study.
2.2 Instruments
2.2.1 Electron microscopy
Aerosol particles were collected onto TEM lacey-carbon substrate grids (Type 01881, Ted Pella, Inc., lacey formvar/carbon, 200 mesh Cu grids) using a two-stage aerosol impactor sampler (AS-16W, Arios Inc., Tokyo, Japan) that could collect 16 TEM grid samples per flight. Sampling times ranged from 1 to 30 min depending on particle loading. The lower and upper 50 % cutoff aerodynamic diameters for the samples used in this study are approximately 100 and 700 nm, respectively.
Particle analysis was carried out using a 120 kV transmission electron microscope (JEM-1400, JEOL) equipped with an energy-dispersive X-ray spectrometer (EDS; Oxford Instruments). A total of ∼3300 particles were examined from representative images of the 16 Colockum Flats TEM grids in order to determine TB number fractions. A Gatan, Inc. 628 single-tilt holder was used for TB heating experiments (Adachi et al., 2017). Ns-soot volumes as determined from 2-D TEM images using fractal parameters from Adachi et al. (2010) were in qualitative agreement with those derived from SP2 measurements of rBC.
2.2.2 Trace gas and optical measurements
The oxides of nitrogen (e.g., NO, NOx, NOy) were measured with a three-channel chemiluminescent instrument (Air Quality Design Inc., model 1). NO2 was converted to NO by a high-intensity light-emitting diode (LED), and NOy was reduced to NO by a 350 ∘C Mo converter mounted at the tip of an inlet outside of the aircraft. CO was measured by intra-cavity off-axis spectroscopy (Los Gatos, model 907).
Aerosol scattering at 700, 550, and 450 nm was determined using a TSI 3563 integrating nephelometer. Correction factors for truncation and non-cosine response were applied based on the method of Anderson and Ogren (1998) for sub-micrometer particles. A single-wavelength photothermal interferometer (PTI) was used to acquire in situ aerosol absorption at 532 nm (Sedlacek III and Lee, 2007; Cross et al., 2010).
2.2.3 Aerosol mass
Refractory black carbon
Mass concentrations of rBC particles with volume-equivalent diameters between ∼80 and 500 nm, assuming a rBC density of 1.8 g cm−3, were measured via laser-induced incandescence (SP2 by Droplet Measurement Technologies) and calibrated with fullerene soot (Alfa Aesar; stock no. 40971; lot no. L18U002).
Aerosol mass spectrometry
An Aerodyne SP-AMS (Onasch et al., 2012) was used to measure the NR-PM, including organic (OA) and inorganic aerosol. Standard AMS measurement uncertainty is estimated to be 25 % as discussed by Canagaratna et al. (2007). The SP-AMS uses two methods for vaporizing particles. As in a conventional AMS, a resistively heated tungsten vaporizer flash volatilizes non-refractory aerosol in a vacuum followed by electron ionization and detection via mass spectrometry (Canagaratna et al., 2007). With dual vaporizers, light-absorbing refractory aerosols are vaporized by a Nd:YAG laser, after which the particle beam encounters the tungsten vaporizer. The tungsten vaporizer was calibrated with ammonium nitrate and the laser vaporizer was calibrated with atomized Regal Black multiple times during the BBOP study following established protocols (Onasch et al., 2012; Canagaratna et al., 2007; Willis et al., 2014). Onasch et al. (2012) discuss the complications that may occur with dual vaporizers with respect to collection efficiencies (CEs). Lee et al. (2015) observed the CE of ambient NR-PM increased when both vaporization sources were used. During the BBOP campaign, the SP-AMS was operated using the tungsten vaporizer with or without laser vaporization, laser-on or laser-off modes, respectively, and also observed higher NR-PM for laser-on conditions. Changes between these two modes were carried out from flight to flight, from one plume transect to the next, and sometimes on shorter timescales. The CE for the SP-AMS operating in laser-off mode was determined to be 0.5 from two intercomparison flights with a surface-based AMS at MBO (Collier et al., 2016) and correlations with scattered light were measured at 550 nm, where the mass-specific scattering coefficients (MSCs) are expected to be near 3.6±1.2 m2 g−1 (Hand and Malm, 2007). All the data for the Colockum Tarps fire presented here were collected with the SP-AMS in laser-on mode. In order to determine the appropriate CE for non-refractory aerosol under laser-on conditions, we compared laser-on with laser-off measurements for five similar wildfires measured during BBOP, in which 16 plume transect pairs were sequentially sampled under similar conditions for laser-on and laser-off modes. Averages of the NR-PM measured by the SP-AMS during these sequential plume transects were normalized by measured CO and/or light scattering and the laser-on-to-laser-off ratios were calculated. Counting each transect pair as a data point and using the laser-off CE=0.5 as the best estimate of ambient NR-PM loadings, we obtain an average laser-on CE=0.76 (1σ=0.10) with CE values that range from 0.63 to 0.88 for a given transect pair.
2.3 Plume sampling strategy
For the wildfire flights, a pseudo-Lagrangian sampling protocol in which flight transects orthogonal to the plume direction were conducted at selected distances downwind of the source was employed. The plume age was calculated using prevailing wind speed and direction together with the assumption that the emission source was constant for all sampling transects.
Photochemical age and plume dilution
Photochemical age of the smoke plume was calculated using the ratio of NOx to NOy as described by Kleinman et al. (2008). Effects of plume dilution were corrected by normalizing data stream (e.g., scattering, absorption, mass loading) by CO enhancement – a conserved tracer.
2.4 Colockum Tarps Fire
The Colockum Tarps fire sampled on the afternoon of 30 July 2013 is representative of at least eight wildfire plumes studied in BBOP with multiple transects covering ∼2 to 4 h of transport. The fire was first noted on 27 July and was declared 98 % contained on 15 August3. A total of ∼323 750 000 m2, consisting of short grass, timber grass understory, and hardwood litter, were burned. An analysis of the time dependence of gaseous and aerosol constituents shows that the fire is typical of several other wildland fires sampled in the BBOP campaign, the description of which will be the subject of future publications.
Figure 2 shows the aircraft ground track for the afternoon 30 July flight. There are 13 plume crossings and one upwind leg. Each is nearly orthogonal to the plume transport direction, as determined from aircraft wind observations. Locations of TEM samples are color-coded and labeled in Fig. 3 in sequential order (1 to 16) and according to their downwind position (T0 to T6). There are two sets of transects, referred to here as Set A and Set B, each of which cover a sampling distance from the main fire region to ∼35 km downwind in six steps from A-T1 to A-T6 and B-T1 to B-T6 (Fig. 3). TEM sample 1 at location T0 was collected upwind of the Colockum Tarps fire. Plume travel, or aging, times between consecutive transects is approximately 30 min, and the aging time probed is ∼3 h. Concentration of CO, a common combustion tracer, during a time series (Fig. 3) ranges between approximately 0.2 ppm upwind and 5 ppm over fire hot spots near transects T1 and T2. Peak concentrations decrease with downwind distance due to dilution.
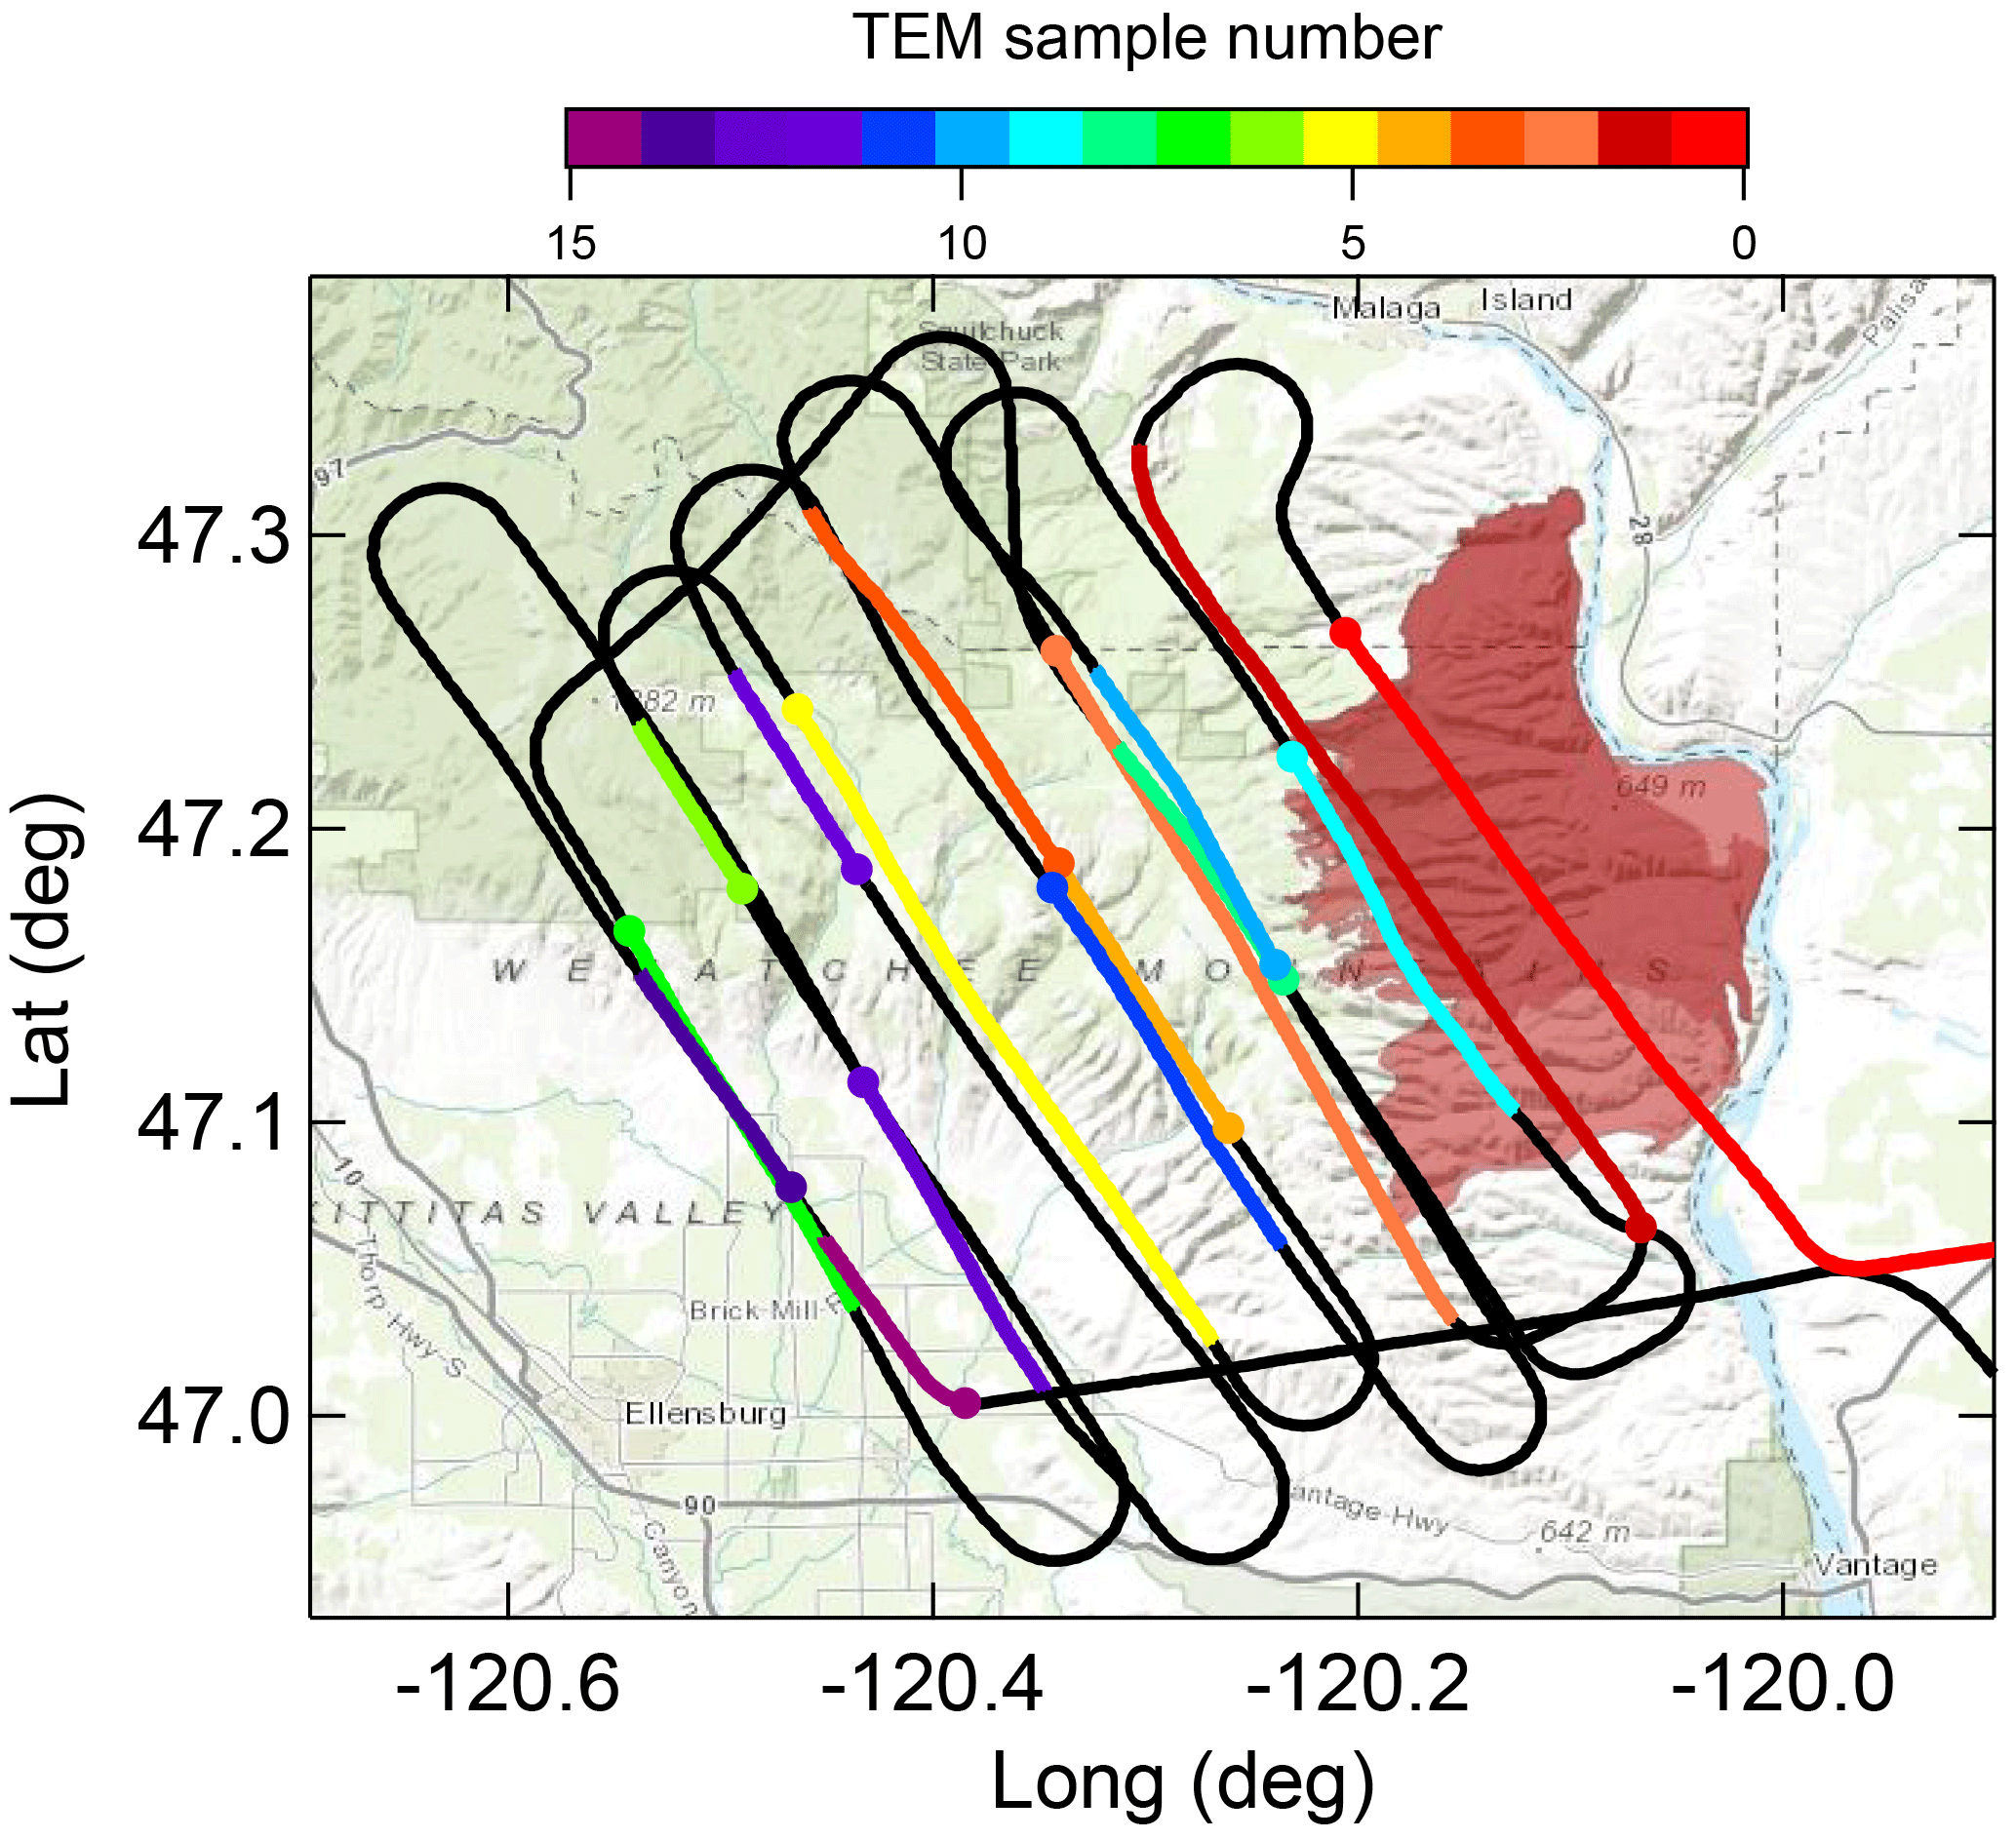
Figure 2BBOP G-1 flight track for the Colockum Tarps Fire. Knowing the wind speed and direction, individual transects sample smoke plume at specific ages. Orthogonal transects roughly represent 30 min of aging starting from 0 h over the fire. For more information see Colockum Tarps Fire, 2013, in footnote 3. Ground track of aircraft for Flight 730b indicating locations in which 16 TEM grids were sequentially used to collect aerosol samples. Color-coding is used to distinguish TEM sampling. The red trace, from the first transect, represents upwind of the fire.
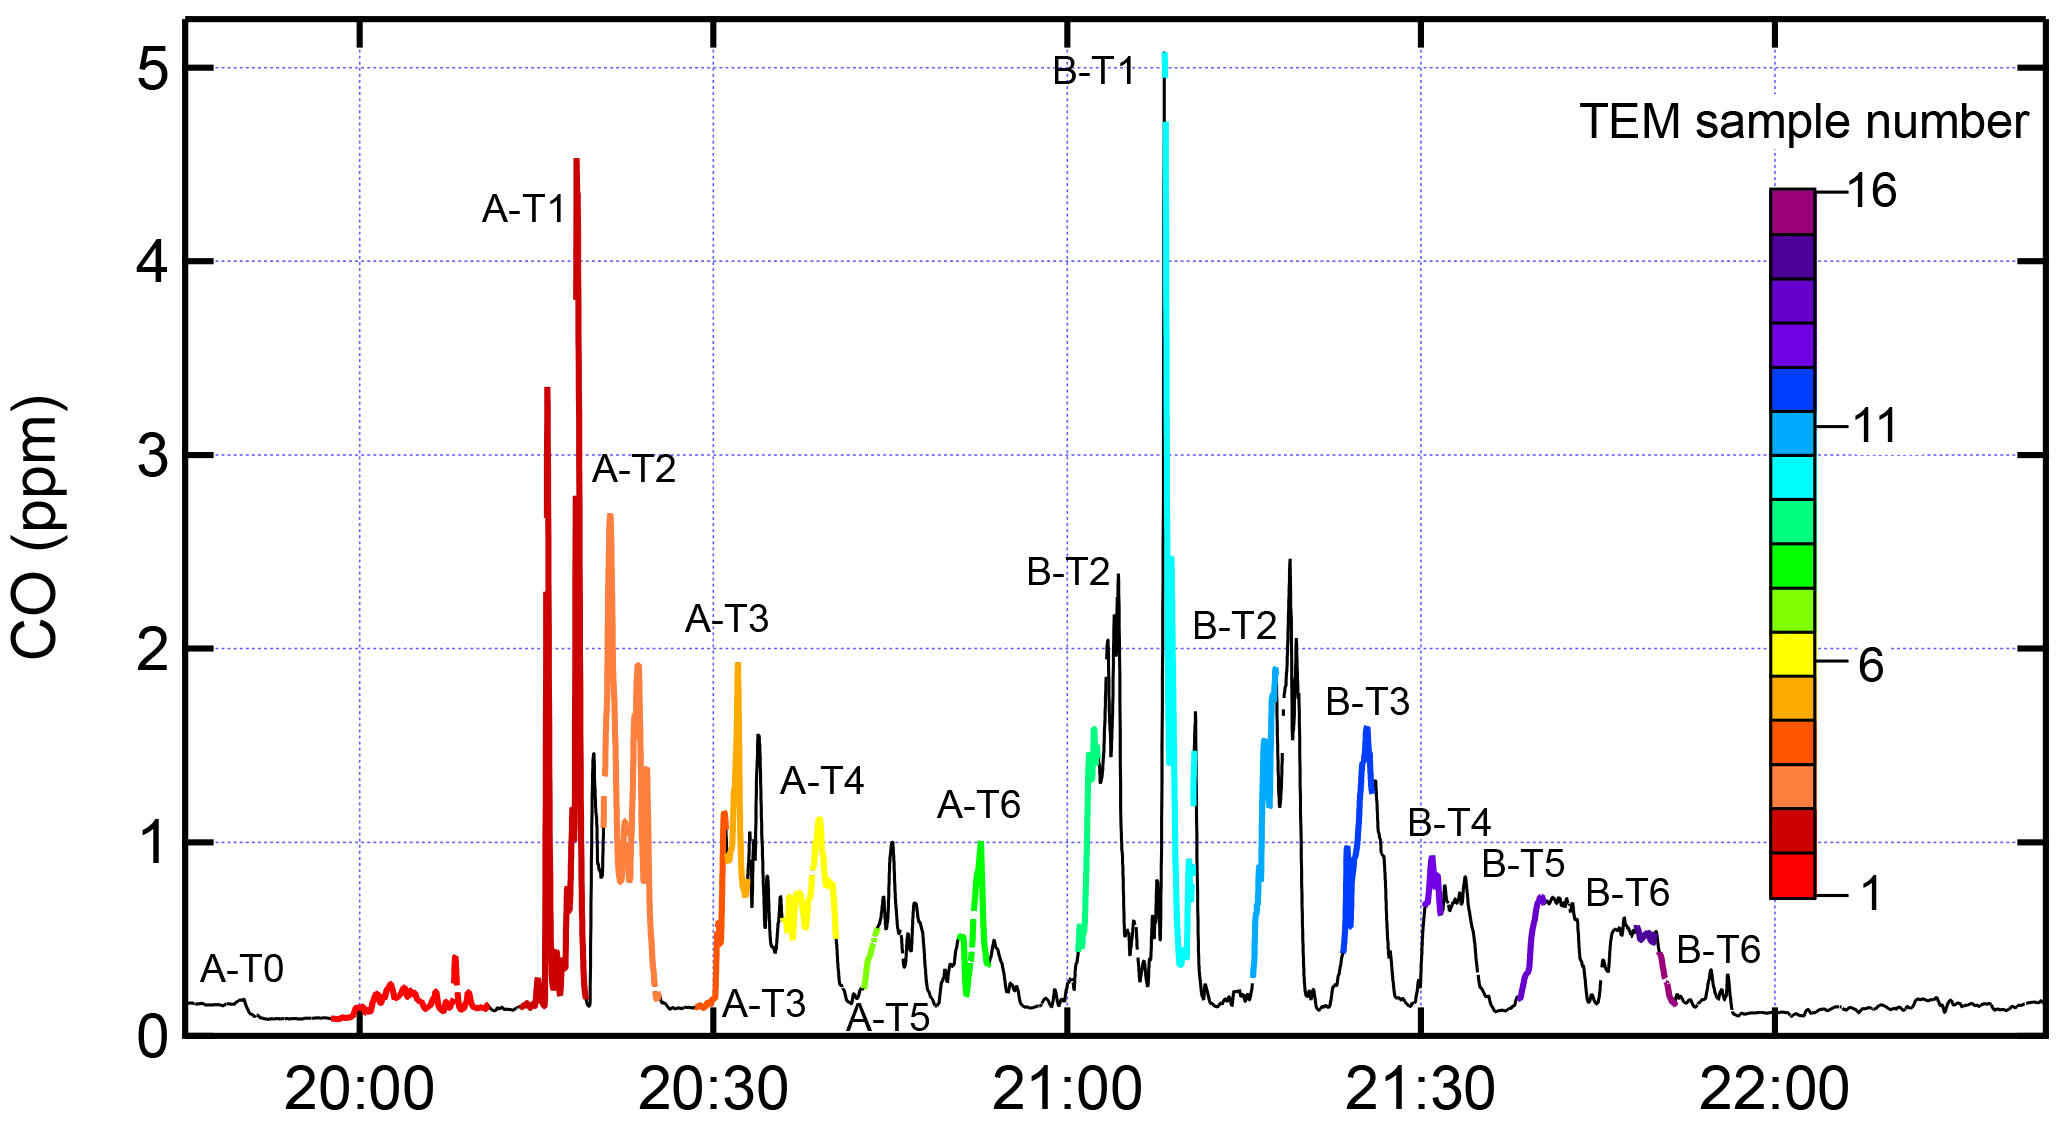
Figure 3Time series for CO, using the same color scheme as Fig. 2 to label TEM samples. Two sets of transects, called Set A and Set B, cover a similar sampling distance from just upwind of the main fire region (T0) to ∼35 km downwind in six steps from T1 to T6. Set A encompasses transects A-T1 to A-T6 and Set B transects B-T1 to B-T6. A total of 16 TEM grids were used in this flight.
NOx emitted by forest fires is oxidized to peroxyacetyl nitrate (PAN), organic nitrates, and HNO3, which collectively are detected as NOy (Fischer et al., 2010; Fisher et al., 2016). A qualitative measure of atmospheric oxidative processing is thereby provided by , as described by Kleinman et al. (2008), and its increase with downwind distance (Fig. 4). Little change occurs during the 1 h separating the first set of transects (Set A) from the second set (Set B), indicating fire conditions were approximately steady during that time period.
2.5 BBOP ARM data archive
All data used in the present analysis are publicly available on the Department of Energy ARM data archive (http://www.archive.arm.gov/armlogin/login.jsp, last access: 26 July 2018). DOE ARM verifies data quality through quality assurance and data quality checks.
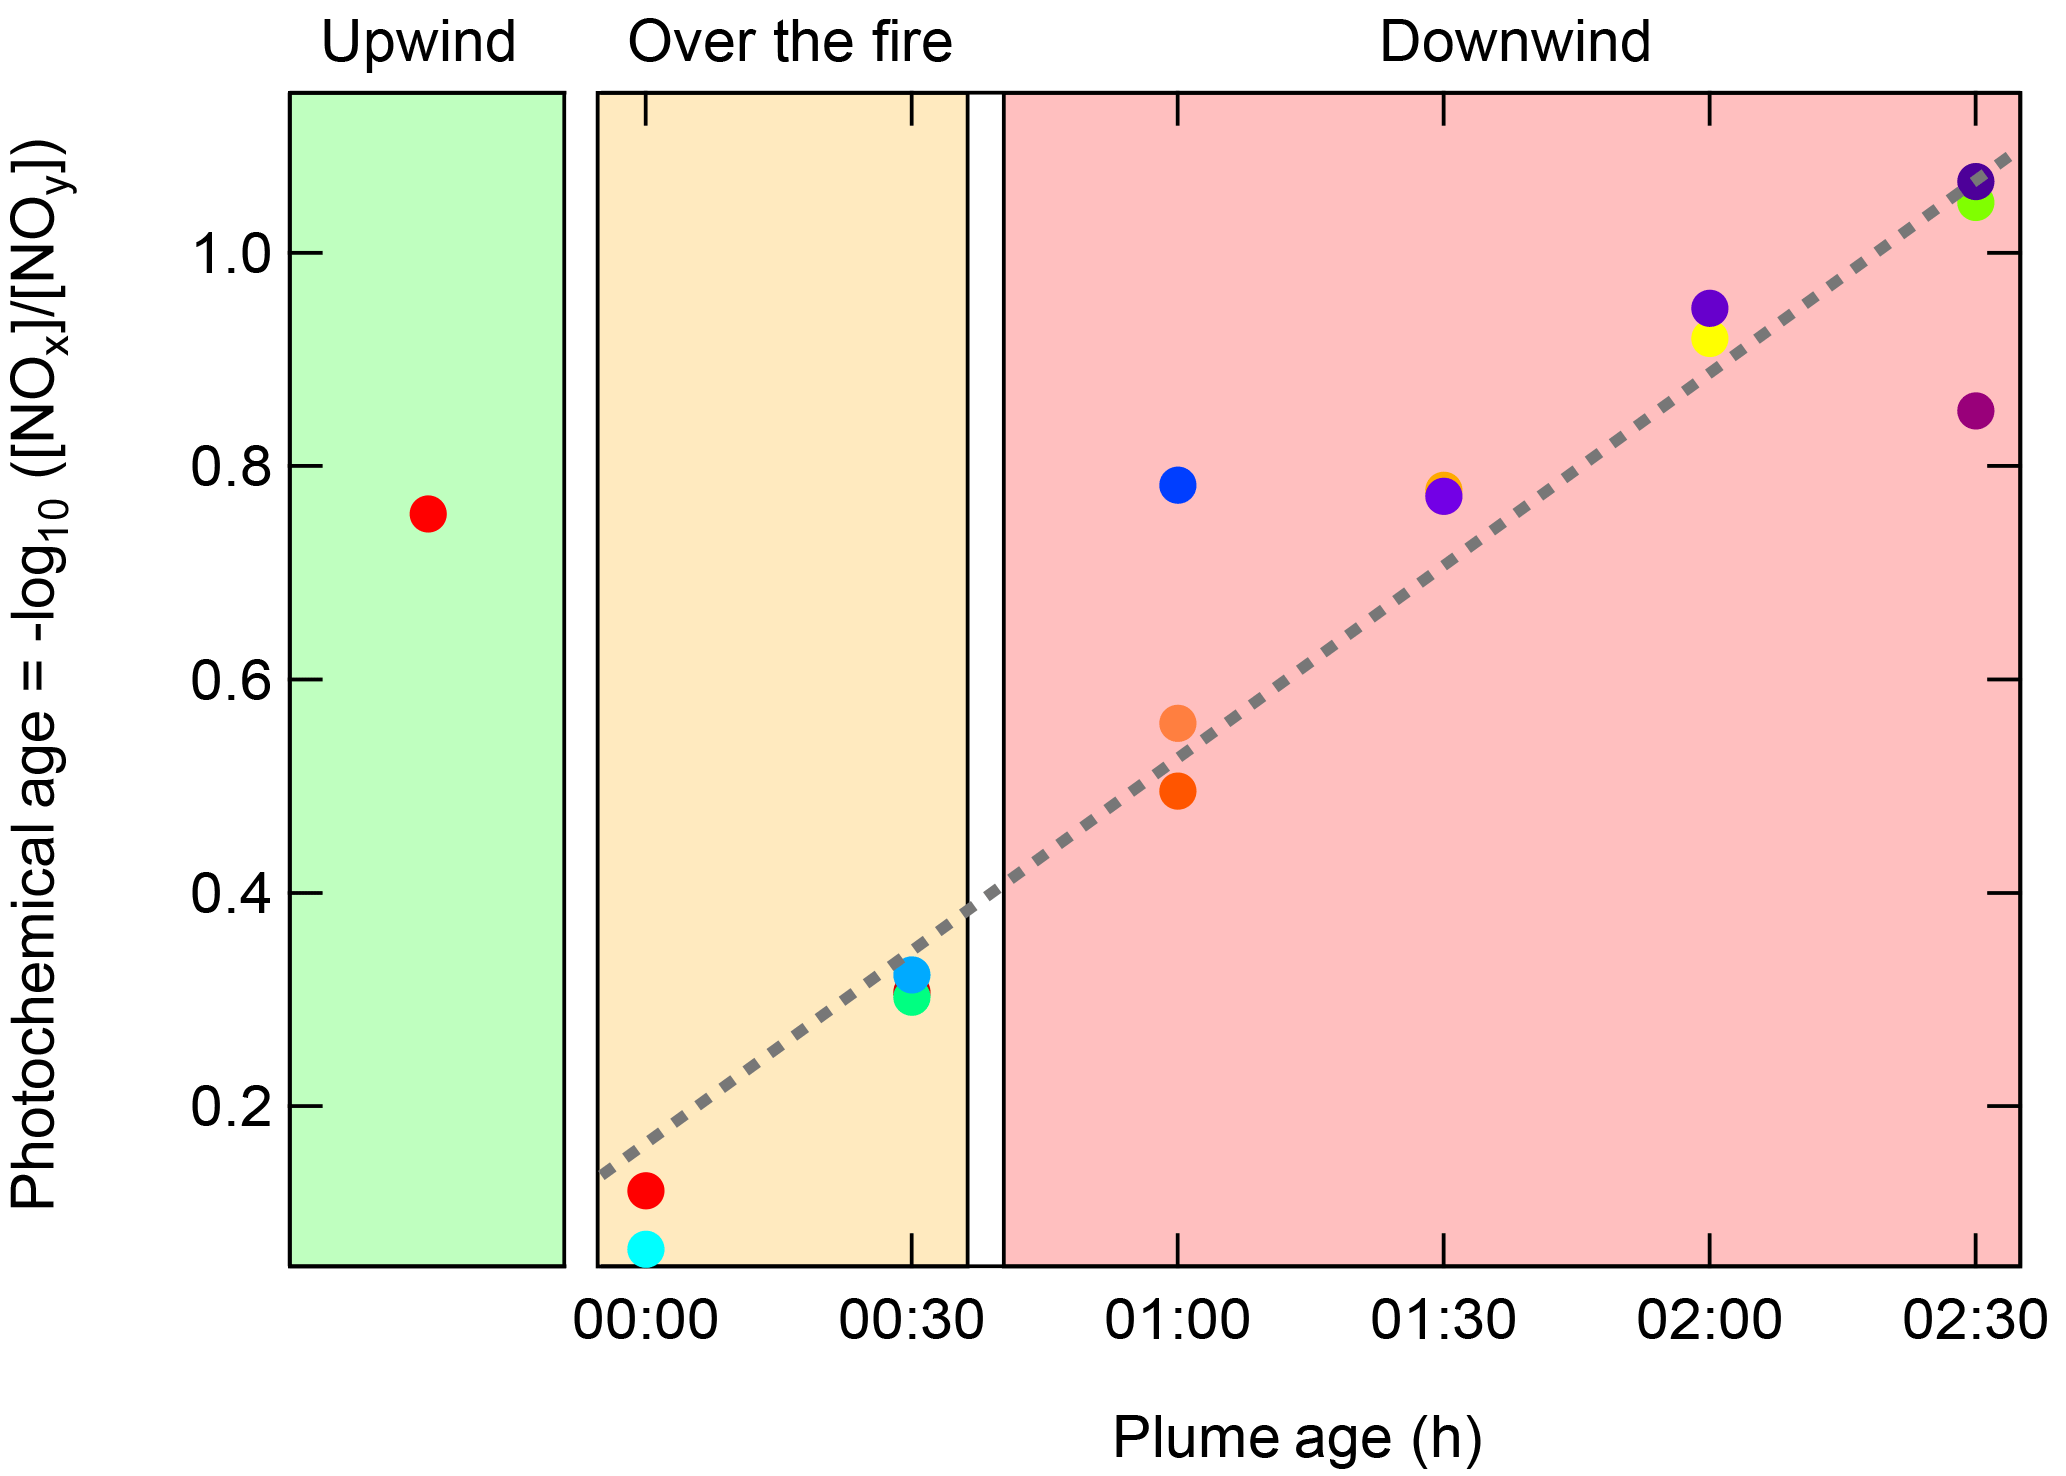
Figure 4Photochemical age metric, , as a function of plume age. Clean-air background subtracted from NOx and NOy. Grey dotted line is a linear best fit to the dataset. Colors on the plot correspond to those in Figs. 2 and 3.
3.1 Tar ball production
Four TEM images of aerosol particles with increasing photochemical age, collected near the active fire (0 h) and at three downwind distances, are shown in Fig. 5. Four types of carbonaceous particles are identified: (1) solid ns-soot, (2) low-viscosity OA, (3) high-viscosity OA, and (4) solid TBs. TBs and ns-soot are stable under conditions used to obtain TEM images and both can be unambiguously identified based on morphology. High-viscosity organic particles are distinguished from solid TBs by particle deformation (Adachi et al., 2017) upon impact with the lacey-carbon grid. Due to the spreading flow of low-viscosity particles and material evaporation during storage or electron-beam analysis, quantification of total OA by TEM is difficult (Adachi et al., 2017). Similar to that reported by Chakrabarty et al. (2016) and Girotto et al. (2018), agglomerated TBs are observed in some TEM images.
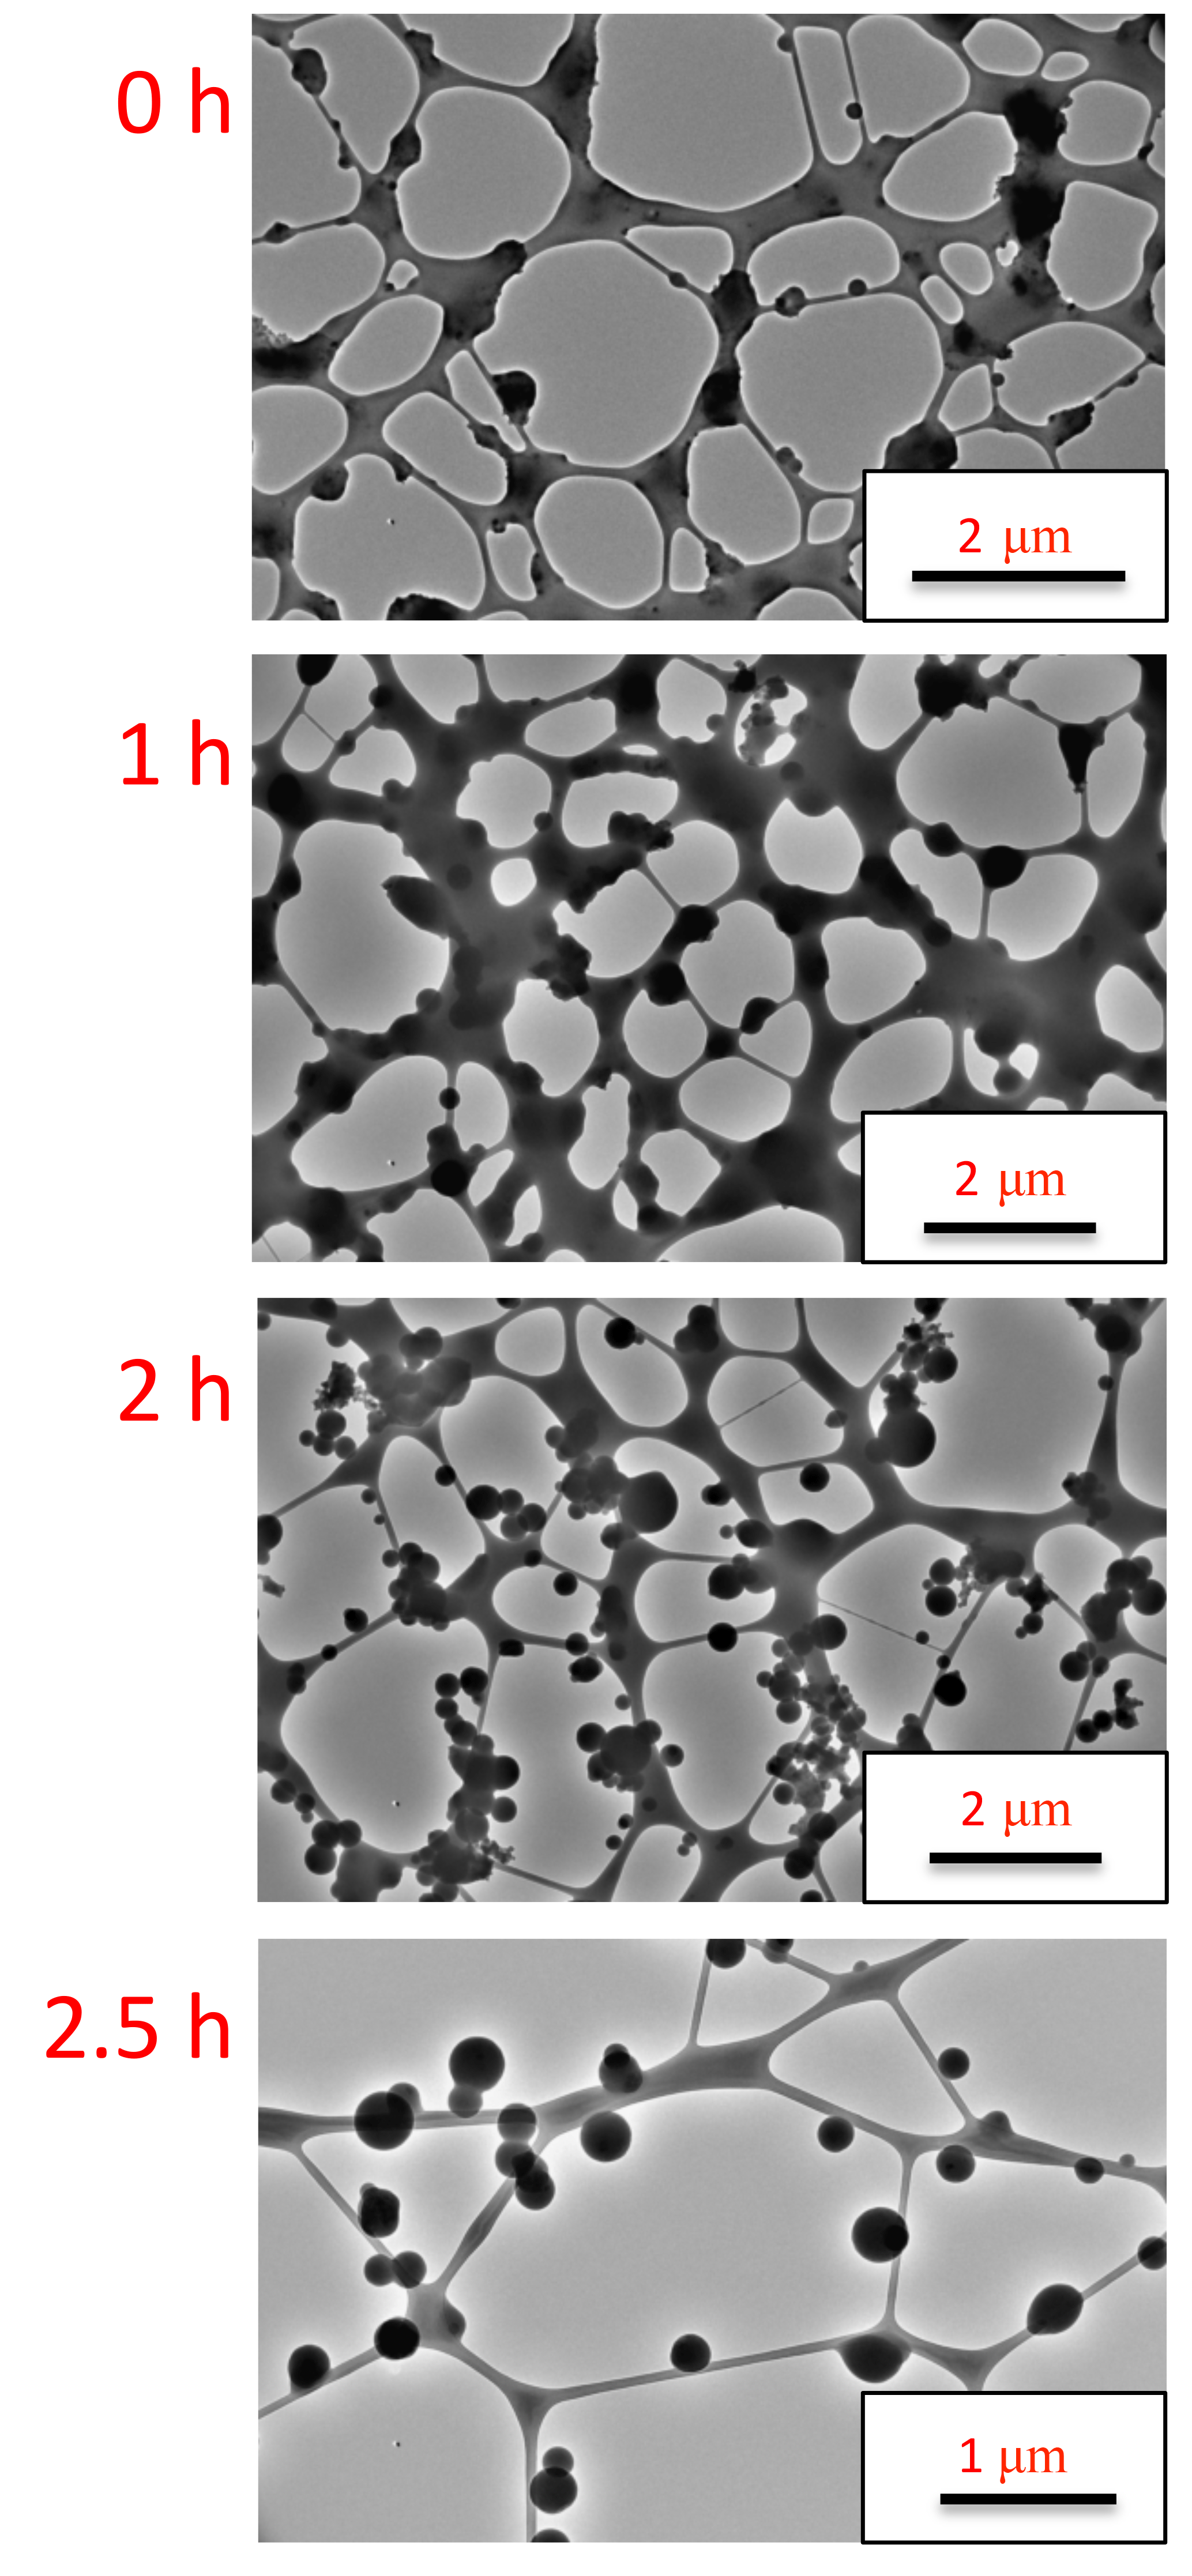
Figure 5TEM images collected from the Colockum Tarps fire. The spiderweb-like strands consist of carbon from the TEM grid. Near the source (0 h), low-viscosity organic matter predominates and TBs are absent. TBs steadily increase in number fraction as the plume ages from 1 to 2.5 h, while lower-viscosity organic particles decrease in number fraction. Note the change in magnification in the 2.5 h image. Images for other transects and other wild fires during BBOP exhibit the same change in particle characteristics as a function of plume age.
Over the fire, the TB number concentration is near zero and OA particles dominate. As the plume ages, the TEM images reveal an increase in the number fraction of TBs, with the highest number fraction, 64 %, observed in the most aged portion of the plume (A-T6 and B-T6 in Fig. 3). In air that has the chemical signature of aged, diluted BB smoke (A-T0 in Fig. 3, which was collected upwind of the fire), the number fraction of TBs is 36 %. These number fractions are similar to those reported by others (Pósfai et al., 2003, 2004; Hand et al., 2005; China et al., 2013).
Since TEM number fractions reported here and elsewhere (Hand et al., 2005; China et al., 2013) are sensitive to the loss of volatile particles, a more useful statistic is the number ratio of TBs to ns-soot, which is 3.8 and 7.6 for downwind transects 15 and 16 (Fig. 3). The TB ∕ ns-soot number ratio in aged, diluted BB air sampled upwind of the fire (i.e., background) is 10.8. These ratios are similar to the number ratio of 10 reported by China et al. (2013).
If the Tóth et al. (2014) mechanism – direct injection of precursor tar droplets followed by rapid heating – were indeed responsible for TB formation, then the BBOP TEM images should reveal TBs at the source since that is where the high-temperature zone, necessary for particle solidification, is located. Instead, there is a steady growth in TB ∕ ns-soot number ratio as the plume ages. This increase indicates that TBs are not directly emitted but rather form (or transform) in the atmosphere within a few hours of emission. Measurements of TB abundance in smaller fires suggest that rapid changes can occur within 15 min of atmospheric aging (Adachi and Buseck, 2011). Adachi and Buseck (2011) observed 10-fold more TBs in the plumes of more-distant fires compared with nearby fires. In contrast to the present study, fresh and aged smoke samples reported by Adachi and Buseck (2011) were in general from different fires. TEM samples with more TBs showed OA morphological changes consistent with an increase in viscosity. Apparently, atmospheric processing causes some OA particles that start out deformable to solidify (Adachi et al., 2010) and be recognized as TBs in the TEM images. The atmospheric processing leading to TBs may involve dehydration and oligomerization of low-volatility OA (Pósfai et al., 2004; Adachi and Buseck, 2011).
Sampling within a single fire as presented here provides further evidence that TBs are processed primary particles (see Sect. 4.1 on nomenclature). The downwind increase in TB mass is due to an increase in number concentration rather than a change in particle size (solid green 50th percentile line bounded by the 25th and 75th percentiles, shaded area, in the lower panel of Fig. 6). To accomplish a number increase by condensation would require that particles smaller than the 100 nm sampling cutoff for accurate TEM imaging grow into a detectable size range, a feature not observed in the TEM-measured size distributions from which average TB diameter is calculated (upper trace in Fig. 6). TEM samples often included background air with varying properties along with the plume being investigated and the collection of particles from background air is likely responsible for the spread observed between the 25th and 75th percentile lines derived from individual data points (shaded area in Fig. 6).

Figure 6The 50th percentile line (green solid) bounded by the 25th and 75th percentiles (shaded area) represents the TB number fraction (167 analyzed TEM sample grids) as a function of photochemical age for 11 BBOP wildfire flights conducted in the Pacific Northwest and demonstrates that TB formation occurs downwind from the source. The spread described by the 25th and 75th percentiles from individual data points (shaded area) is believed to be due to TEM samples often including background air with varying properties along with the plume being investigated. Blue squares are the mean number fractions for the Colockum Tarps fire. The upper trace (red circles) shows that the TB average diameter is independent of photochemical age for the Colockum Tarps fire, consistent with TBs being processed primary particles. Error bars are 1 standard deviation.
3.2 Tar ball mass fractions
To date, the only way to definitively identify TBs has been through microscopy. However, issues associated with particle volatility have severely limited evaluations of the radiative forcing contribution from this aerosol type. In response to this limitation, we combine TEM image analysis with SP2 and SP-AMS measurements to derive the first estimates of the mass loadings and mass fractions of TBs in wildland fire plumes. TB mass loadings and the TB mass fractions are derived by combining (i) the number ratio of TBs to ns-soot determined from TEM images with (ii) speciated aerosol concentration measurements from the SP2 and SP-AMS, averaged over the TEM collection time periods.
In our calculation of the TB mass fractions, we make three significant assumptions: first, TEM grids collect TBs and ns-soot with the same efficiency; second, ns-soot, as determined by TEM, is the same as rBC measured with an SP2. A similar assumption was recently invoked by Adachi et al. (2016). For convenience, both quantities will be called “soot”. Third, the SP-AMS CE for TBs is the same for other NR-PM. Adachi et al. (2017) studied the thermal vaporization of TBs by heating BBOP samples to 600 ∘C and found them to be less volatile than most OAs, suggesting that TBs may exhibit a different CE in the SP-AMS than other OAs (see Supplement). However, given the current lack of chemical information on TBs in general, TB chemical signatures cannot be deconvolved from SP-AMS OA mass spectra. Therefore, calculations are performed assuming TBs have the same CE as other OAs.
Ambient particulate mass concentrations (e.g., µg m−3 at STP) of TBs, soot, non-refractory inorganics, and non-refractory organics are denoted as MTB, Msoot, MIN, and MORG, respectively. TB fractional contribution to total mass is denoted by fTB and we define R as the ratio MTB∕Msoot derived from TEM and SP2, respectively. We have
The SP-AMS was used to measure MAMS, the non-refractory component of Mtotal.
Except for a sensitivity calculation4, the SP-AMS CE is assumed to be the same for all non-refractory species; that is . Equation (2) is written with separate contributions to total mass from TBs and organics. However, in practice, neither MORG nor MTB can be obtained from Eq. (2) because additional chemical information is needed to allow the SP-AMS to discriminate tar ball organic signals from other organic particulate matter. Combining Eqs. (1) and (2), we obtain
For an error analysis, it is convenient to restate Eq. (3b) in terms of R,
To a first approximation, sub-micrometer aerosol mass loadings in wildfire plumes consist of less than 10 % ns-soot and inorganic constituents, with the remainder split between OA and TBs. TB ∕ ns-soot number ratios derived from TEM (Adachi et al., 2010) are used to derive volume ratios by combining the observed TB diameters from TEM with the rBC volume-equivalent diameters (VEDs) derived from SP2 measurements. As discussed above, this approach assumes that ns-soot, as determined by TEM, is the same as rBC measured by the SP2. Use of the SP2-derived ns-soot VED is considered superior to a TEM-derived VED since the latter is very sensitive to the fractal parameters used (Adachi et al., 2010). These volume ratios can be converted into mass ratios using assumed densities. For a TB density (Alexander et al., 2008) of 1.5 g cm−3 and an ns-soot spherule density (Park et al., 2004) of 1.8 g cm−3, the TB ∕ soot mass (volume) ratios are 16.3 (19.6) and 39.3 (47.2) for downwind transects 15 and 16, respectively. Figure 7a shows the averaged TB ∕ soot mass as a function of plume age5.
The calculation of fTB for a typical downwind sample is given in Table 1. An accuracy of 1 standard deviation has been estimated by combining individual measurement errors (listed in Table 1) in quadrature, assuming that they are uncorrelated. It is seen that the accuracy of fTB depends primarily on R, which we estimate has a 50 % uncertainty.
Table 1Calculation of the fractional mass of TBs and its uncertainty.
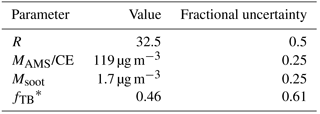
* Downwind value of fTB in text is an average of TEM samples 8, 15, and 16 and has a value of 0.26.
Figure 7b shows that TB mass fractions increase with plume age. Over the fire, this mass fraction is close to zero and increases in the aged plume to 31–45 %, or approximately a third of the particle mass in the smoke plume. The error bars in Fig. 7b represent the measurement precisions (1σ); the estimated uncertainty in fTB is 61 %. These values represent the first field measurements of TB mass fractions. Upwind of the fire, in aged biomass burning smoke, the TB mass fractions are nearly 50 % of the ambient PM. Figure 7c shows the ΔOA ∕ ΔCO ratio as a function of plume age. While this ratio remains nearly constant over the first couple of hours of aging, increases in the TB ∕ soot mass ratio and TB mass fractions are observed. This comparison supports a downwind formation mechanism. Similar observations of minimal change in the ΔOA ∕ ΔCO have been previously reported (Jolleys et al., 2012, 2014; Zhou et al., 2017).
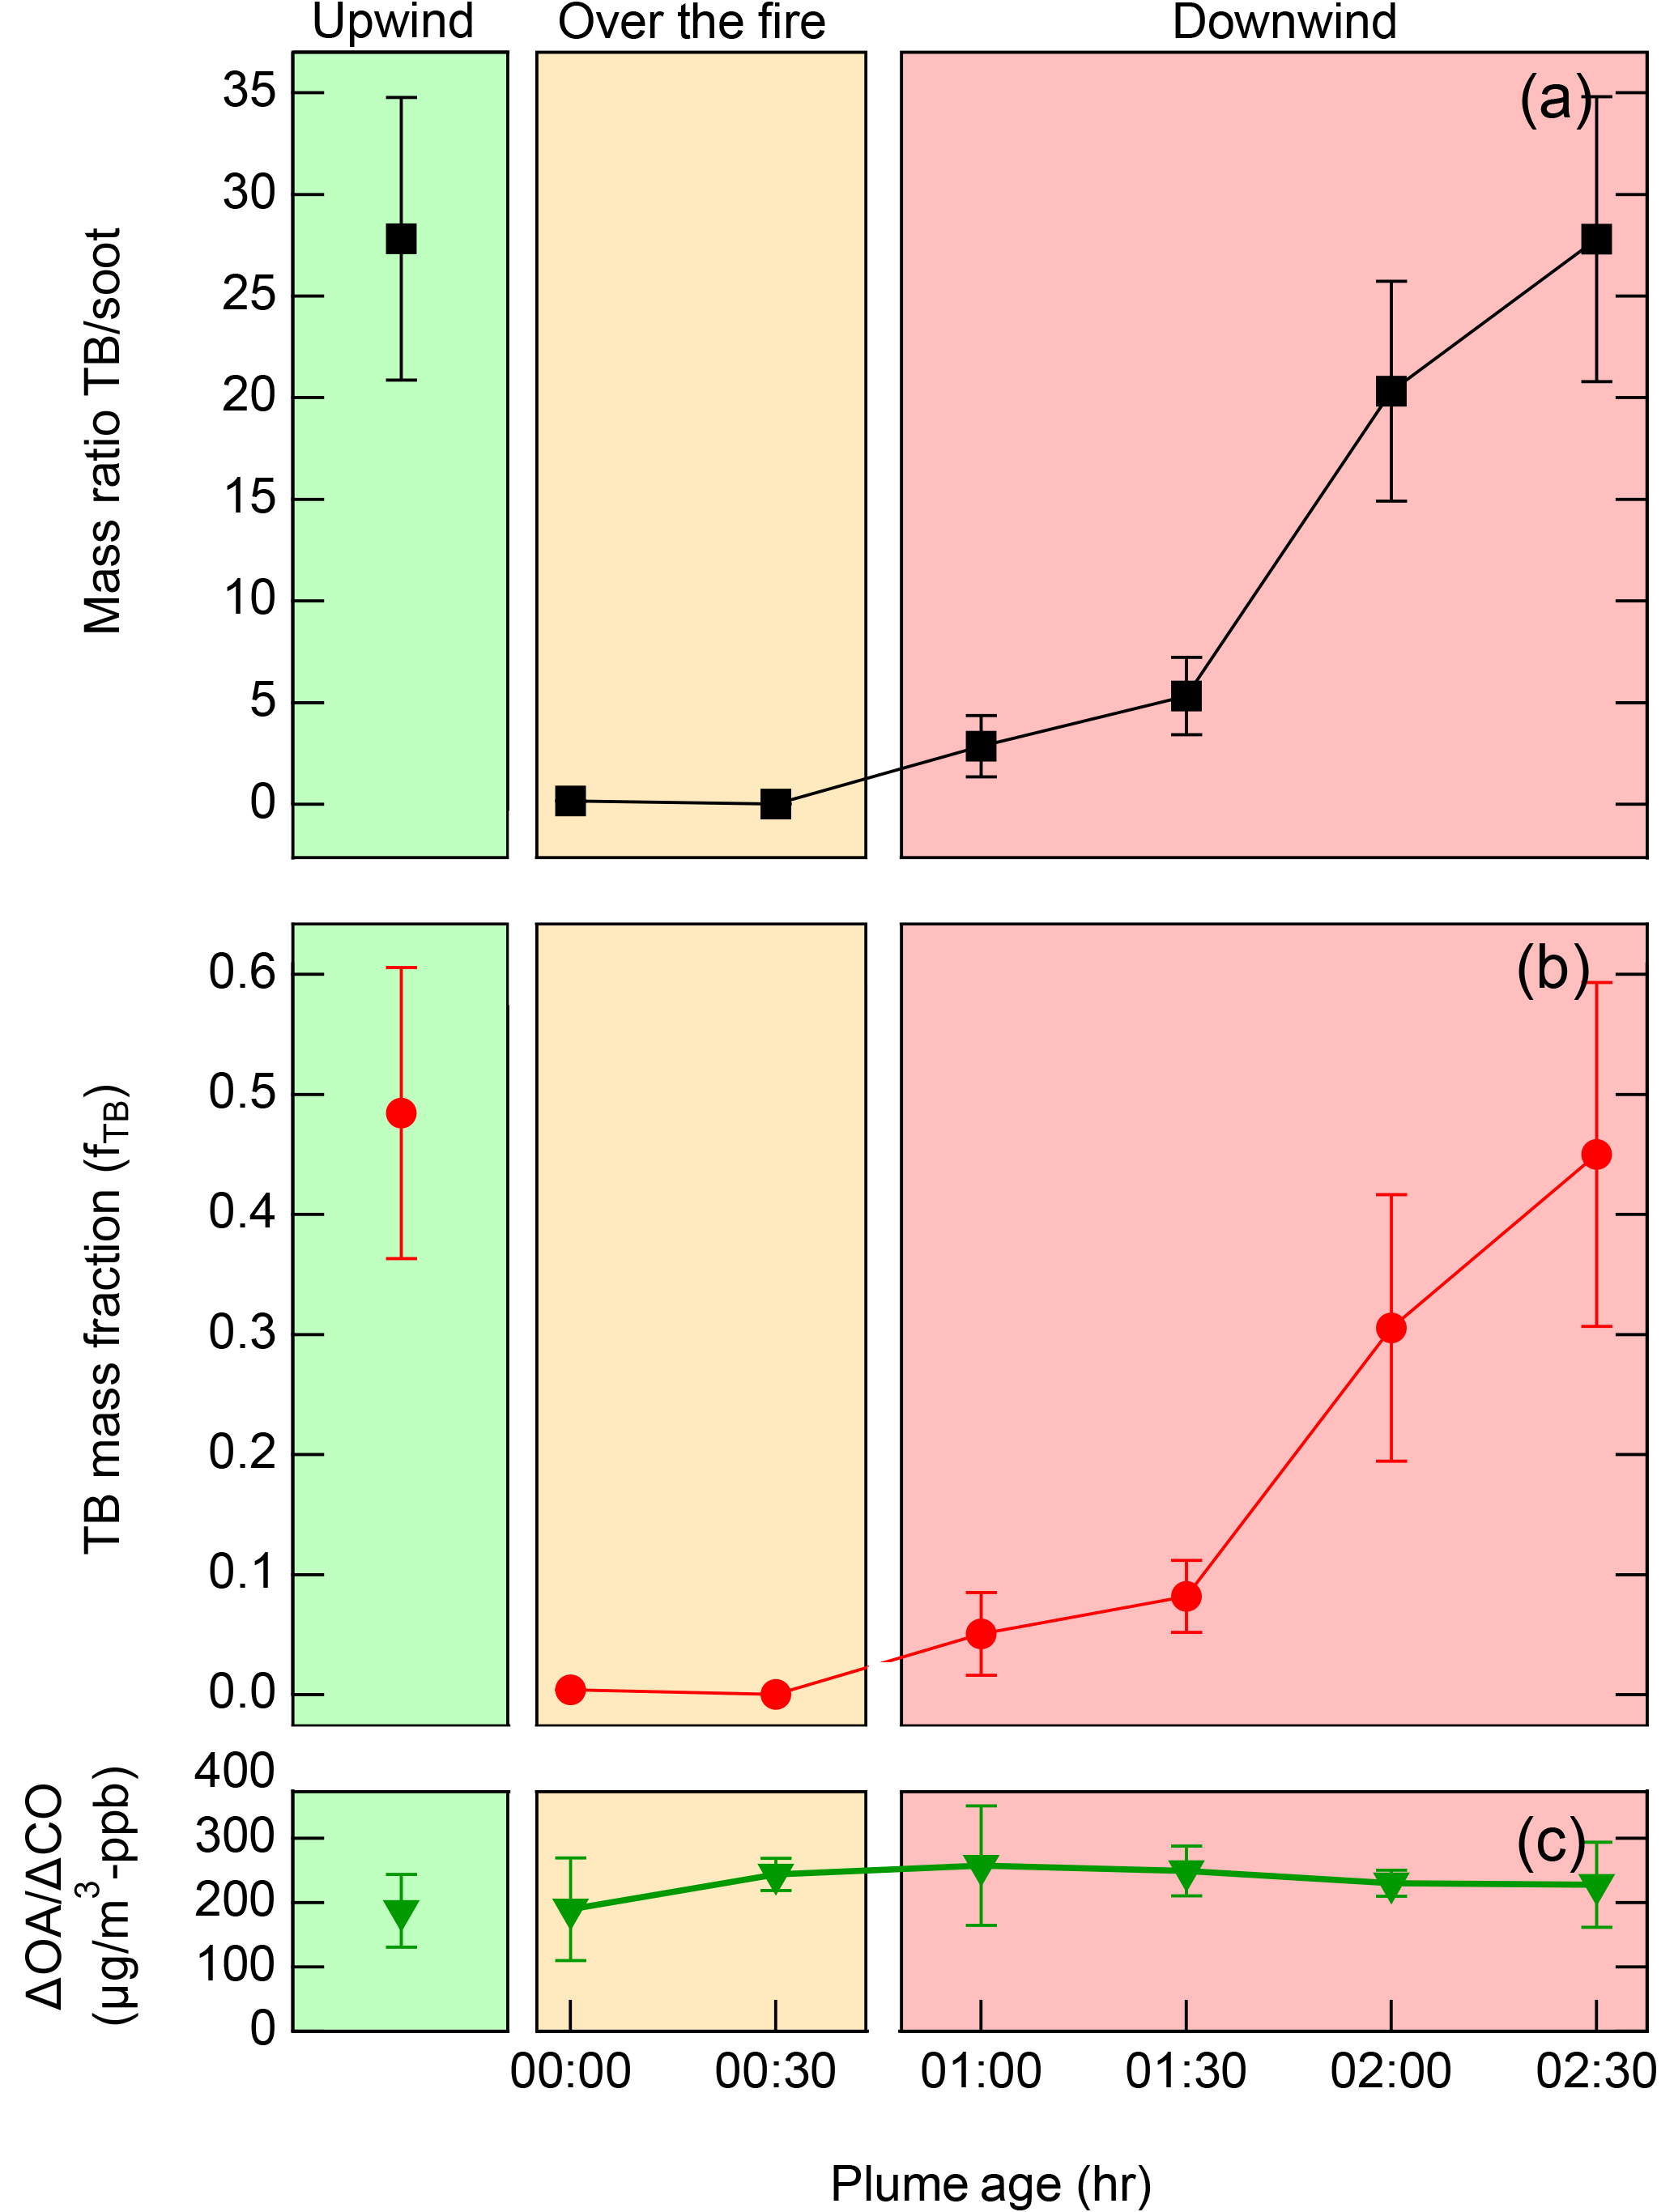
Figure 7(a) Mass ratio of TB to ns-soot (black squares) as a function of plume age (based on 953 particles). Ratios are the average TB volume-equivalent diameters (VEDs) from TEM samples collected at a given plume age to the average ns-soot VEDs derived from the SP2. The background TB ∕ ns-soot ratio was measured during the upwind transect. (b) Mass fractions of TBs (red circles) in the smoke plume as a function of plume age are derived from TEM TB ∕ ns-soot mass ratios, rBC mass loadings from SP2, and NR-PM from SP-AMS. As the wildfire plume ages, the TB mass fractions increase from 0 to 0.45 of the total aerosol mass loading. Upwind of the Colockum Tarps fire, the background TB mass fraction is estimated to be about ∼50 % (green shaded region). The error bars in Fig. 6b represent the measurement precisions (1σ); the estimated uncertainty in fTB is 61 %. (c) Ratio of organic aerosol to CO – to correct for dilution – for background (upwind) and as a function of plume age.
These estimates for the TB mass fractions in BB plumes are similar to the mass fractions observed for a low-volatility positive matrix factorization (PMF) factor (BBOA-3) recently reported by Zhou et al. (2017) in smoke from wildfires sampled at MBO during the BBOP campaign. TEM samples from overflights of MBO had high TB-to-ns-soot number ratios similar to those reported here.
4.1 Nomenclature
The results presented here raise the question of how best to describe TBs. Are they processed primary particles, as we have elected to describe them here, or are they secondary particles? The argument for the latter can be found in the atmospheric chemistry community in which SO2 is a primary pollutant but its oxidation product, sulfate, is called a secondary pollutant. Applying similar logic, if emitted organic particles are converted to tar balls via oxidation reactions, TBs would be classified as secondary. However, within the aerosol community, secondary organic aerosol (SOA) has exclusively been used to describe particulate matter condensed from the gas phase. We did not observe TBs on the TEM grids exposed over the fire but they were found in increasing numbers downwind. Because we did not observe particle growth (Fig. 7c), a gas-to-particle condensation mechanism for TB formation seems implausible. We have therefore elected to label TBs as processed primary particles.
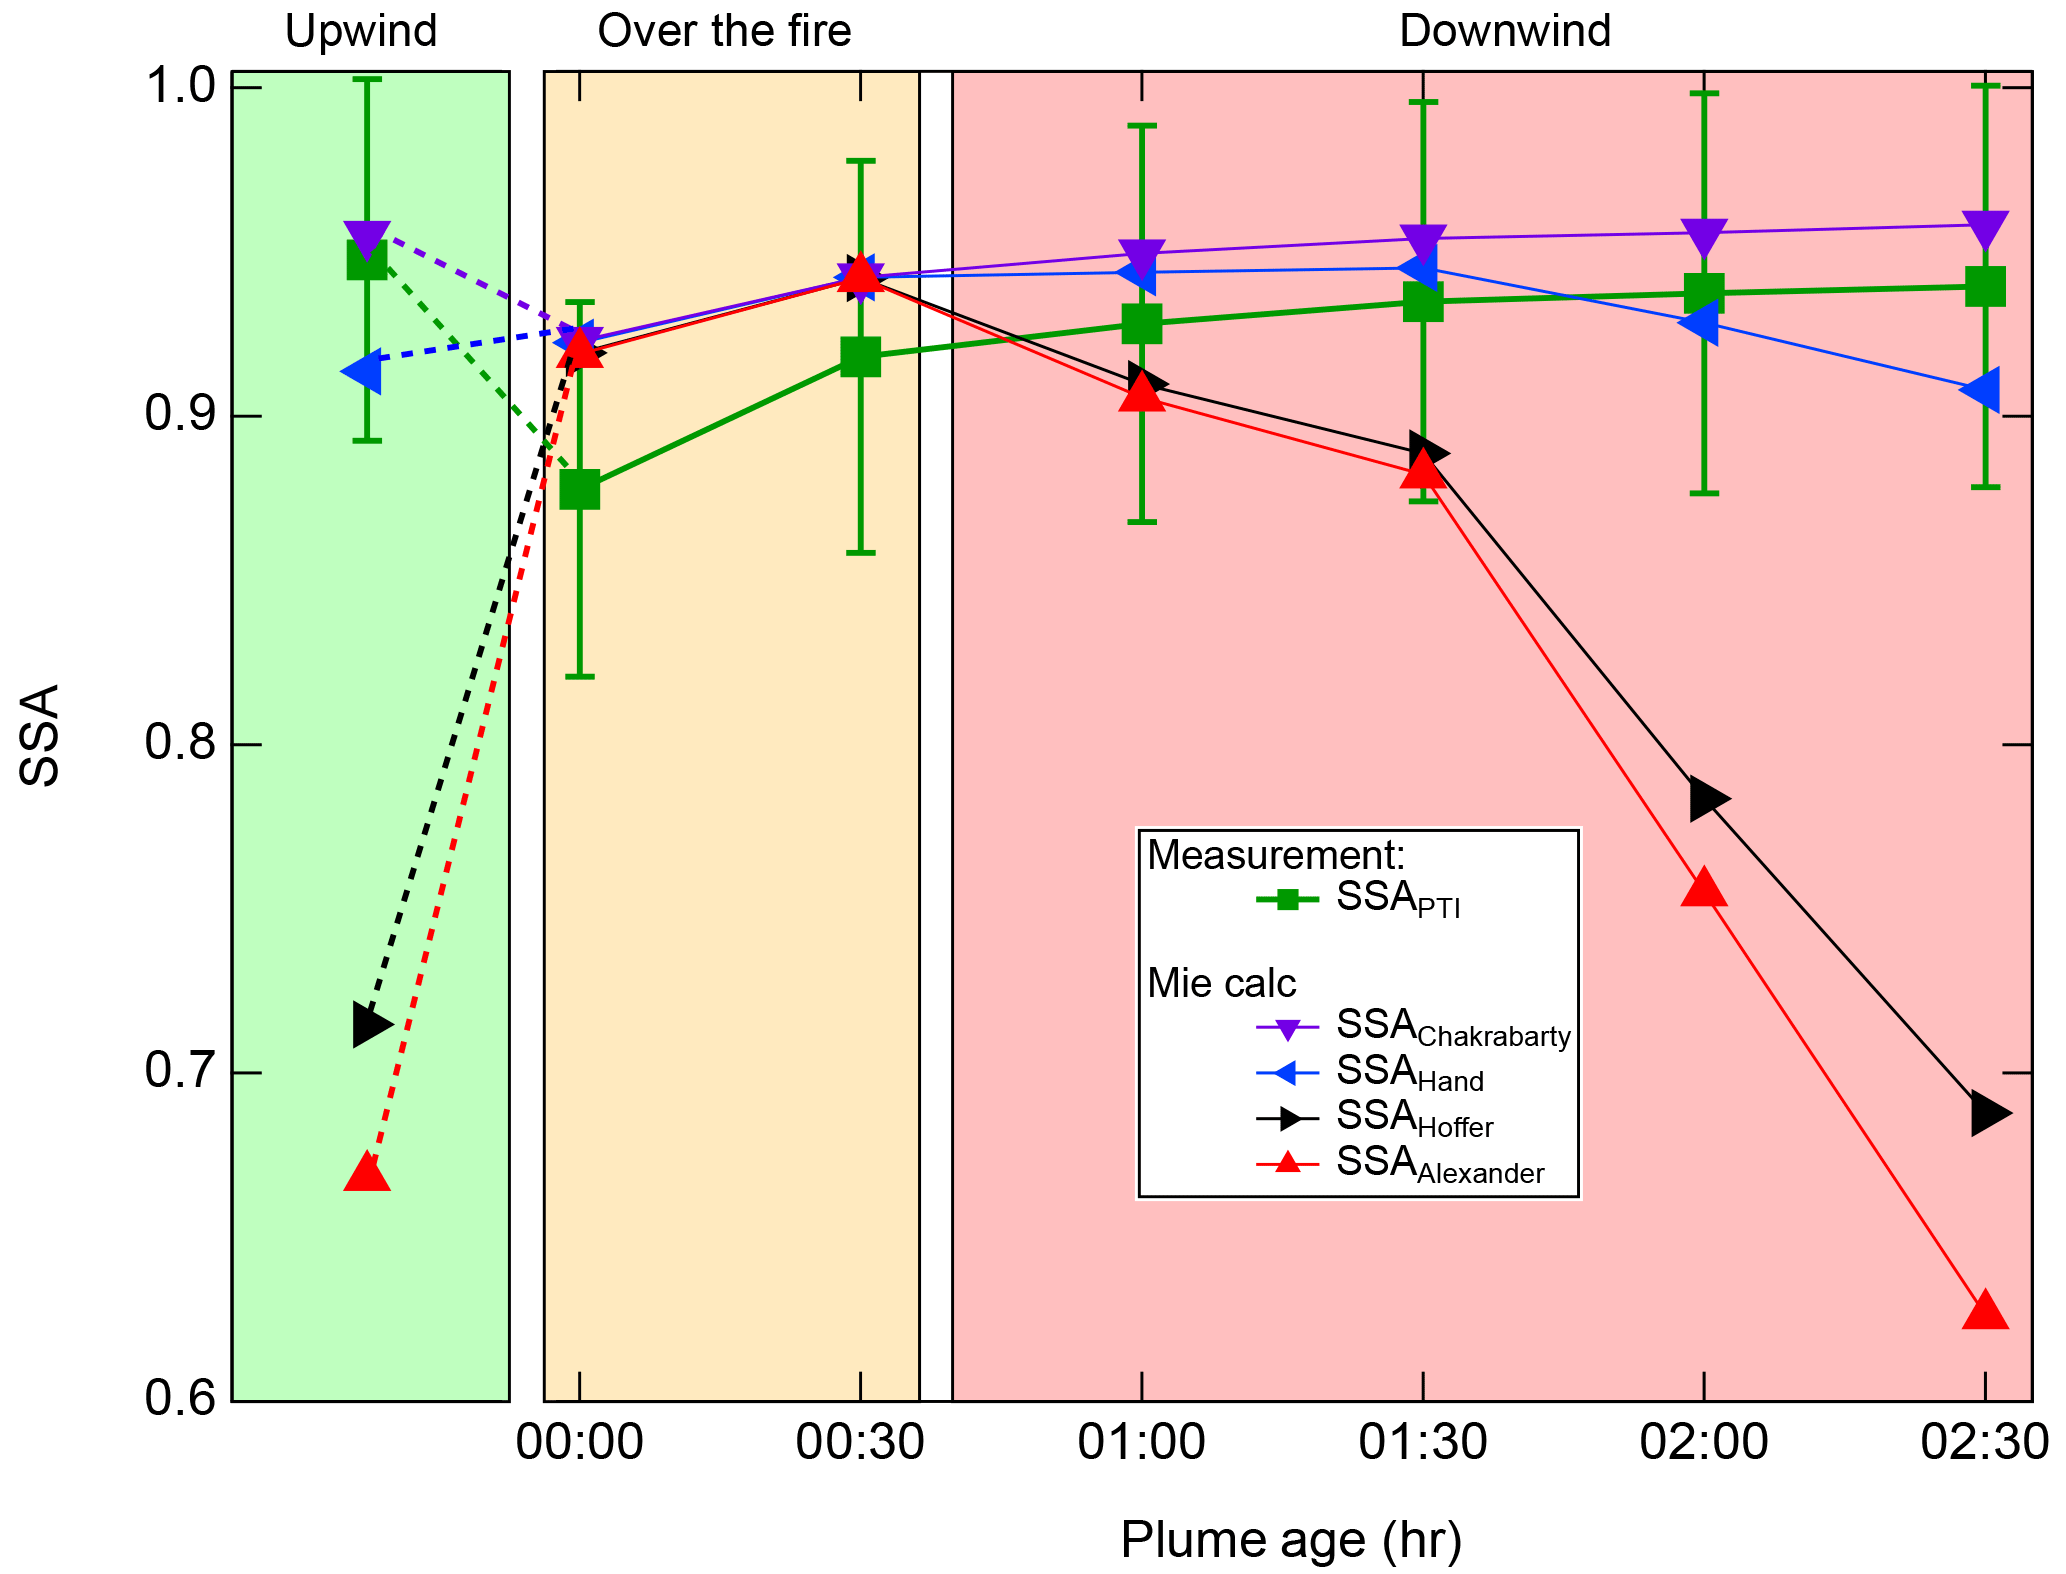
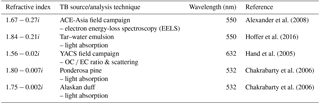
Figure 8Single-scattering albedo (SSA) derived assuming four refractive indices for TBs (SSAAlexander – red, upward-pointing triangles, 1.67−0.27i, Alexander et al., 2008; SSAHoffer – black, right-facing triangles, 1.84−0.21i, Hoffer et al., 2016; SSAHand – blue, left-facing triangles, 1.56−0.02i, Hand et al., 2005; and SSAChakrabarty – purple, downward-pointing triangles, 1.80−0.007i, Chakrabarty et al., 2010). Comparison of the calculated SSAs with those derived from primary measurements of aerosol absorption and scattering reveal that TBs observed in the field by in situ measurements (Hand et al., 2005; Chakrabarty et al., 2010) do not exhibit the strong absorption suggested by laboratory studies (Alexander et al., 2008; Hoffer et al., 2016) (red upward-pointing triangles and black right-facing triangles).
4.2 Inventory implications
Top-down, bottom-up comparisons of satellite-retrieved optical properties (e.g., aerosol optical depth or AOD) with inventory-based optical properties reveal a discrepancy that requires emissions to be scaled up by a factor ranging from 1.5 (Reddington et al., 2016) to over 10 (Bond et al., 2013; Lu and Sokolik, 2013; van der Werf et al., 2010; Kaiser et al., 2012; Kopacz et al., 2010; Reid et al., 2009). Our results and those of Adachi et al. (2017) underscore the importance of studying TBs, including their physicochemical and optical properties, such that new techniques can be developed to identify (e.g., via specific chemical signatures) and accurately account for TBs in bottom-up inventories. Several scenarios are possible, one of which is that TBs may have escaped being accounted for in wildfire inventories (Urbanski, 2014; Reid et al., 2005), which would reduce the top-down and bottom-up discrepancy. Liu et al. (2017) recently highlighted the importance of quantifying wildfire and prescribed burn emission factors.
Table 3MAC and MSE of aerosol components.
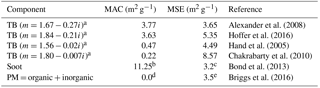
a Refractive index used for Mie calculation. b Uncoated soot × 1.5 to account for coating. c Estimated to give an SSA for soot of 0.3 for uncoated soot. d Minor absorption at 550 nm ignored. e MSE determined at biomass burns geographically close to our observations. The average value of 3.5 m2 g−1, determined for ambient air samples, has been applied to our organic and inorganic fraction. The error incurred is less than the variability in MSE among fires.
4.3 Optical properties
Inconsistencies in the values of the TB refractive index (Table 2) preclude a useful assessment of the radiative impact of these particles. Aerosol SSA was calculated on the basis of the mass fractions, mass absorption coefficient (MAC), and mass scattering efficiency (MSE) of each species. A mass-weighted average was used as if the aerosol were an external mixture. More complicated schemes were not warranted in the absence of mixing state information. Using the mass fractions determined from Eqs. (3b) or (4) and the definition of SSA, we obtain
where i labels the four aerosol components in our calculation (see Eq. 1a).
Comparisons of the SSA derived from optical measurements with Mie calculations that assumed TBs were either weak (1.56−0.02i or 1.80−0.007i) or strong absorbers (1.67−0.27i) are shown in Fig. 8 as a function of plume age. When TBs are assumed to be stronger absorbers, as reported by Alexander et al. (2008) and Hoffer et al. (2016), the increase in TB mass fraction as a function of plume age should result in a large decrease in SSA. However, such a decrease is not observed. Instead, there is a slight increase in SSA with age. This comparison indicates that TBs in the Colockum Tarps wildfire are weaker absorbers than suggested in laboratory studies (Hoffer et al., 2016, 2017). Other wildfires sampled in BBOP had comparable TB-to-soot ratios and age trends. SSAs were also similar in magnitude and time trend to the Colockum Tarps wildfire, so we believe our observations at least pertain to fires in this region.
MAC and MSE for TBs were determined from Mie calculations based upon literature values of refractive index in Table 2, a log normal fit to the observed size distribution (count median diameter = 242 nm, geometric standard deviation = 1.32), and a TB density of 1.5 g cm−3. Results are given in Table 3 along with literature values used for the other aerosol components. Plausible changes to optical parameters other than the MAC of TBs had little effect on the results in Fig. 8.
The causes for disparate measurements of TB refractive index have not been identified. We note that highly absorptive TBs made in the laboratory via the Tóth et al. (2014) mechanism, such as those used by Hoffer et al. (2016, 2017), are formed differently than the ambient TBs reported here. The other high-absorption result in Table 3 reported by Alexander et al. (2008) is from an EELS (electron energy-loss spectroscopy) spectrum of a collected ambient aerosol, but it is not clear that the TBs analyzed by Alexander have a BB origin. These comparisons suggest there may be variability in TB optical properties dependent upon fuel source, formation mechanism, and, potentially, aging.
4.4 Radiative forcing implications
Incorporation of TBs into models of BB (Jacobson, 2014) have been hampered because the only technique for detecting these particles is single-particle microscopy, which is an off-line, intensive technique with sampling issues (e.g., does not quantify volatile aerosol lost in storage or upon electron beam irradiation). Our work shows that TBs can represent a significant fraction of the aerosol mass in some wildfire plumes and that regional effects of TBs over BB-dominated regions would be much more significant. Inclusion of TBs will also help to constrain the BC radiative forcing in BB.
Data are publicly available at the DOE ARM data archive portal (http://www.archive.arm.gov/armlogin/login.jsp, last access: 8 August 2018) with registration to the website.
-
Carbon monoxide concentration (CO), BBOP –
https://doi.org/10.5439/1461844 -
Oxides of Nitrogen – Airborne, BBOP –
https://doi.org/10.5439/1461846 -
Single Particle Soot Photometer (SP2) BBOP –
https://doi.org/10.5439/1461848 -
Photothermal Interferometer (PTI) BBOP –
https://doi.org/10.5439/1461849 -
Soot Particle Aerosol Mass Spectrometer (SP-AMS) BBOP –
https://doi.org/10.5439/1461869 -
Transmission electron microscope (TEM), BBOP –
https://doi.org/10.5439/1461870 -
Nephelometer PSAP, BBOP –
https://doi.org/10.5439/1461871
The supplement related to this article is available online at: https://doi.org/10.5194/acp-18-11289-2018-supplement.
As lead PIs for the BBOP project, AJS III and LK selected target fires and designed fire-specific G-1 flight tracks. KA and PRB were responsible for TEM analysis, TBO for SP-AMS analysis, AJS III for SP2 and PTI analysis, and SRS for CO data. AJS III, PBR, KA, LK, and TBO interpreted the data and wrote the manuscript.
The authors declare that they have no conflict of interest.
The authors gratefully acknowledge Ernie Lewis and Leah Williams for help
with laboratory studies of TBs as well as discussions about the AMS
collection efficiency in the derivation of the mass fraction expressions.
This research was performed under sponsorship of the U.S. DOE Office of
Biological & Environmental Sciences (OBER) Atmospheric Research Program
(ASR) under contract DE-SC0012704 (BNL). Researchers recognize the DOE
Atmospheric Radiation Measurement (ARM) Climate Research program and facility
for both the support to carry out the BBOP campaign and for use of the G-1
research aircraft. The authors gratefully acknowledge the skill and safety
exemplified by the AAF (ARM Aerial Facility) pilots and flight staff.
Kouji Adachi thanks the support of the Global Environment Research Fund of
the Japanese Ministry of the Environment (2-1703 and 2-1403) and JSPS KAKENHI
(grant number JP25740008 and JP16K16188). Peter R. Buseck acknowledges
support from the Pacific Northwest National Lab (PNNL) and the DOE
Atmospheric Radiation Measurement (ARM) Program under Research Subcontract
no. 205689. Timothy B. Onasch acknowledges support from the DOE ARM program
during BBOP and the DOE ASR program for BBOP analysis (contract
DE-SC0014287).
Edited by: Manvendra K.
Dubey
Reviewed by: two anonymous referees
Adachi, K. and Buseck, P. B.: Atmospheric tar balls from biomass burning in Mexico, J. Geophys. Res.-Atmos., 116, D05204, https://doi.org/10.1029/2010JD015102, 2011.
Adachi, K., Chung, S. H., and Buseck, P. R.: Shapes of soot aerosol particles and implications for their effects on climate, J. Geophys. Res.-Atmos., 115, D15206, https://doi.org/10.1029/2009JD012868, 2010.
Adachi, K., Moteki, N., Kondo, Y., and Igarashi, Y.: Mixing states of light-absorbing particles measured using a transmission electron microscope and a single-particle soot photometer in Tokyo, Japan, J. Geophys. Res.-Atmos., 121, 9153–9164, https://doi.org/10.1002/2016JD025153, 2016.
Adachi, K., Sedlacek, A. J., Kleinman, L., Chand, D., Hubbe, J., and Buseck, P. R.: Thermal behavior of aerosol particles from biomass burning using a transmission electron microscope, Aerosol Sci. Tech., 52, 46–56, https://doi.org/10.1080/02786826.2017.1373181, 2017.
Alexander, D. T. L., Crozier, P. A., and Anderson, J. R.: Brown carbon spheres in East Asian outflow and their optical properties, Science, 321, 833–835, https://doi.org/10.1126/science.1155296, 2008.
Anderson, T. L. and Ogren, J. A.: Determining Aerosol Radiative Properties Using the TSI 3563 Integrating Nephelometer, Aerosol Sci. Tech., 29, 57–69, 1998.
Andrea, M. O. and Rosenfeld, D. Aerosol-cloud-precipitation interactions. Part 1. The nature and sources of cloud-active aerosols, Earth-Sci. Rev., 89, 13–41, 2008.
BBOP (Biomass Burning Observation Project): Final Campaign Report, available at: http://www.arm.gov/publications/programdocs/doe-sc-arm-15-083.pdf (last access: 26 July 2018), 2015.
Bond, T. C., Doherty, S. J., Fahey, D. W., Forster, P. M., Berntsen, T., DeAngelo, B. J., Flanner, M. G., Ghan, S., Kärcher, B., Koch, D., Kinne, S., Kondo, Y., Quinn, P. K., Sarofim, M. C., Schultz, M. G., Schulz, M., Venkataraman, C., Zhang, H., Zhang, S., Bellouin, N., Guttikunda, S. K., Hopke, P. K., Jacobson, M. Z., Kaiser, J. W., Klimont, Z., Lohmann, U., Schwarz, J. P., Shindell, D., Storelvmo, T., Warren, S. G., and Zender, C. S.: Bounding the role of black carbon in the climate system: A scientific assessment, J. Geophys. Res., 118, 5380–5552, https://doi.org/10.1002/jgrd.50171, 2013.
Briggs, L. N., Jaffe, D. A., Gao, H., Hee, J. R., Baylon, P. M., Zhang, Q., Zhou, S., Collier, S. C., Sampson, P. D., and Cary, R. A.: Particulate matter, ozone, and nitrogen species in aged wildfire plumes observed at the Mount Bachelor Observatory, Aerosol Air Qual. Res., 16, 3075–3087, https://doi.org/10.4209/aaqr.2016.03.0120, 2016.
Buseck, P. R., Adachi, K., Gelencsér, A., Tompa, É., and Pósfai, M.: Ns-Soot: A Material-Based Term for Strongly Light-Absorbing Carbonaceous Particles, Aerosol Sci. Tech., 48, 777–788, 2014.
Canagaratna, M. R., Jayne, J. T., Jiménez, J. L., Allan, J. D., Alfarra, M. R., Zhang, Q., Onasch, T. B., Drewnick, F., Coe, H., Middlebrook, A., Delia, A., Williams, L. R., Trimborn, A. M., Northway, M. J., DeCarlo, P. F., Kolb, C. E., Davidovits, P., and Worsnop, D. R.: Chemical and Microphysical Characterization of Ambient Aerosols with the Aerodyne Aerosol Mass Spectrometer, Mass Spectrom. Rev., 26, 185–222, 2007.
Chakrabarty, R. K., Moosmüller, H., Garro, M. A., Arnott, W. P., Walker, J., Susott, R. A., Babbitt, R. E., Wold, C. E., Lincoln, E. N., and Hao, W. M.: Emissions from the laboratory combustion of wildland fuels: Particle morphology and size, J. Geophys. Res., 111, D07204, https://doi.org/10.1029/2005JD006659, 2006.
Chakrabarty, R. K., Moosmüller, H., Chen, L.-W. A., Lewis, K., Arnott, W. P., Mazzoleni, C., Dubey, M. K., Wold, C. E., Hao, W. M., and Kreidenweis, S. M.: Brown carbon in tar balls from smoldering biomass combustion, Atmos. Chem. Phys., 10, 6363–6370, https://doi.org/10.5194/acp-10-6363-2010, 2010.
Chakrabarty, R. K., Gyawali, M., Yatavelli, R. L. N., Pandey, A., Watts, A. C., Knue, J., Chen, L.-W. A., Pattison, R. R., Tsibart, A., Samburova, V., and Moosmüller, H.: Brown carbon aerosols from burning of boreal peatlands: microphysical properties, emission factors, and implications for direct radiative forcing, Atmos. Chem. Phys., 16, 3033–3040, https://doi.org/10.5194/acp-16-3033-2016, 2016.
China, S., Mazzoleni, C., Gorkowski, K., Aiken, A. C., and Dubey, M. K.: Morphology and mixing state of individual freshly emitted wildfire carbonaceous particles, Nat. Commun., 4, 2122, https://doi.org/10.1038/ncomms3122, 2013.
Cofer, W. R., Levine, J. S., Sebacher, D. I., Winstead, E. L., Riggen, P. J., Brass, J. A., and Ambrosia, V. G.: Particulate emissions from a mid-latitude prescribed chaparral fire, J. Geophys. Res., 93, 5207–5212, 1988.
Collier, S., Zhou, S., Onasch, T., Jaffe, D., Kleinman, L., Sedlacek III, A. J., Briggs, N., Hee, J., Fortner, E., Shilling, J. E., Worsnop, D., Yokelson, R. J., Parworth, C., Ge X., Xu, J., Butterfield, Z., Chand, D., Dubey M. K., Pekour, M., Springston, S. R., and Zhang, Q.: Aerosol Emissions from Western U.S. Wildfires and Correlation with Combustion Efficiency, Environ. Sci. Technol., 50, 8613–8622, https://doi.org/10.1021/acs.est.6b01617, 2016.
Cross, E. S., Onasch, T. B., Ahern, A., Wrobel, W., Slowik, J. G., Olfert, J., Lack, D. A., Massoli, P., Cappa, C. D., Schwarz, J. P., Spackman, J. R., Fahey, D. W., Sedlacek III, A. J., Trimborn, A., Jayne, J. T., Freedman, A., Williams, L. R., Ng, N. L., Mazzoleni, C., Dubey, M. K., Brem, B., Kok, G., Subramanian, R., Freitag, S., Clarke, A., Thornhill, D., Marr, L. C., Kolb, C. E., Worsnop, D. R., and Davidovits, P.: Soot Particle Studies – Instrument Intercomparison – Project Overview, Aerosol Sci. Tech., 44, 592–561, 2010.
de Gouw, J. and Jimenez, J. J.: Organic aerosols in the Earth's atmosphere, Environ. Sci. Technol., 43, 7614–7618, 2009.
Fischer, E. V., Jaffe, D. A., Reidmiller, D. R., and Jaegle, L.: Meteorological controls on observed peroxyacetyl nitrate at Mount Bachelor during the spring of 2008, J. Geophys. Res., 115, D03302, https://doi.org/10.1029/2009JD012776, 2010.
Fisher, J. A., Jacob, D. J., Travis, K. R., Kim, P. S., Marais, E. A., Chan Miller, C., Yu, K., Zhu, L., Yantosca, R. M., Sulprizio, M. P., Mao, J., Wennberg, P. O., Crounse, J. D., Teng, A. P., Nguyen, T. B., St. Clair, J. M., Cohen, R. C., Romer, P., Nault, B. A., Wooldridge, P. J., Jimenez, J. L., Campuzano-Jost, P., Day, D. A., Hu, W., Shepson, P. B., Xiong, F., Blake, D. R., Goldstein, A. H., Misztal, P. K., Hanisco, T. F., Wolfe, G. M., Ryerson, T. B., Wisthaler, A., and Mikoviny, T.: Organic nitrate chemistry and its implications for nitrogen budgets in an isoprene- and monoterpene-rich atmosphere: constraints from aircraft (SEAC4RS) and ground-based (SOAS) observations in the Southeast US, Atmos. Chem. Phys., 16, 5969–5991, https://doi.org/10.5194/acp-16-5969-2016, 2016.
Girotto, G., China, S., Bhandari, J., Gorkowski, K., Scarnato, B. V., Capek, T., Marinoni, A., Veghte, P., Kulkarn, G., Aiken, A. C., Dubey, M., and Mazzoleni C.: Fractal-like Tar Ball Aggregates from Wildfire Smoke, Environ. Sci. Tech. Let., 5, 360–365, 2018.
Hand, J. L. and Malm, W. C.: Review of aerosol mass scattering efficiencies from ground-based measurements since 1990, J. Geophys. Res.-Atmos., 112, D16203, https://doi.org/10.1029/2007JD008484, 2007.
Hand, J. L., Malm, W. C., Laskin, A., Day, D., Lee, T., Wang, C., Carrico, C., Carrillo, J., Cowin, J. P., Collet Jr., J., and Iedema, M. J.: Optical, physical and chemical properties of tar balls observed during the Yosemite Aerosol Characterization Study, J. Geophys. Res.-Atmos., 110, D21210, https://doi.org/10.1029/2004JD005728, 2005.
Hoffer, A., Tóth, A., Nyiro-Kósa, I., Pósfai, M., and Gelencsér, A.: Light absorption properties of laboratory-generated tar ball particles, Atmos. Chem. Phys., 16, 239–246, https://doi.org/10.5194/acp-16-239-2016, 2016.
Hoffer, A., Tóth, Á., Pósfai, M., Chung, C. E., and Gelencsér, A.: Brown carbon absorption in the red and near-infrared spectral region, Atmos. Meas. Tech., 10, 2353–2359, https://doi.org/10.5194/amt-10-2353-2017, 2017.
Jacobson, M. Z.: Effects of biomass burning on climate, accounting for heat and moisture fluxes, black and brown carbon, and cloud absorption effects, J. Geophys. Res.-Atmos., 119, 8980–9002, https://doi.org/10.1002/2014JD021861, 2014.
Jolleys, M. D., Coe, H., G. McFiggans, G., Capes, G., Allan, J. D., Crosier, J., Williams, P. I., Allen, G., Bower, K. N., Jimenez, J. L., Russel, L. M., Grutter, M., and Baumgardner, D.: Characterizing the aging of biomass burning organic aerosol by use of mixing ratios: A meta-analysis of four regions, Environ. Sci. Technol., 46, 13093–13102, https://doi.org/10.1021/es302386v, 2012.
Jolleys, M. D., Coe, H., McFiggans, G., McMeeking, G. R., Lee, T., Kreidenweis, S. M., Collett Jr., J. L., and Sullivan, A. P.: Organic aerosol emission ratios from the laboratory combustion of biomass fuels, J. Geophys. Res.-Atmos., 119, 12850–12871, https://doi.org/10.1002/2014JD021589, 2014.
Kaiser, J. W., Heil, A., Andreae, M. O., Benedetti, A., Chubarova, N., Jones, L., Morcrette, J.-J., Razinger, M., Schultz, M. G., Suttie, M., and van der Werf, G. R.: Biomass burning emissions estimated with a global fire assimilation system based on observed fire radiative power, Biogeosciences, 9, 527–554, https://doi.org/10.5194/bg-9-527-2012, 2012.
Kleinman, L. I., Springston, S. R., Daum, P. H., Lee, Y.-N., Nunnermacker, L. J., Senum, G. I., Wang, J., Weinstein-Lloyd, J., Alexander, M. L., Hubbe, J., Ortega, J., Canagaratna, M. R., and Jayne, J.: The time evolution of aerosol composition over the Mexico City plateau, Atmos. Chem. Phys., 8, 1559–1575, https://doi.org/10.5194/acp-8-1559-2008, 2008.
Kopacz, M., Jacob, D. J., Fisher, J. A., Logan, J. A., Zhang, L., Megretskaia, I. A., Yantosca, R. M., Singh, K., Henze, D. K., Burrows, J. P., Buchwitz, M., Khlystova, I., McMillan, W. W., Gille, J. C., Edwards, D. P., Eldering, A., Thouret, V., and Nedelec, P.: Global estimates of CO sources with high resolution by adjoint inversion of multiple satellite datasets (MOPITT, AIRS, SCIAMACHY, TES), Atmos. Chem. Phys., 10, 855–876, https://doi.org/10.5194/acp-10-855-2010, 2010.
Lee, A. K. Y., Willis, M. D., Healy, R. M., Onasch, T. B., and Abbatt, J. P. D.: Mixing state of carbonaceous aerosol in an urban environment: single particle characterization using the soot particle aerosol mass spectrometer (SP-AMS), Atmos. Chem. Phys., 15, 1823–1841, https://doi.org/10.5194/acp-15-1823-2015, 2015.
Li, J., Pósfai, M., Hobbs, P. V., and Buseck, P. R.: Individual aerosol particles from biomass burning in southern Africa: 2. Compositions and aging of inorganic particles, J. Geophys. Res., 108, 8484, https://doi.org/10.1029/2002JD002310, 2003.
Liu, X., Huey, L. G., Yokelson, R. J., Selimovic, V., Simpson, I. J., Müller, M., Jimenez, J. L., Campuzano-Jost, P., Beyersdorf, A. J., Blake, D. R., Butterfield, Z., Choi, Y., Crounse, J. D., Day, D. A., Diskin, G. S., Dubey, M. K., Fortner, E., Hanisco, T. F., Hu, W., King, L. E., Kleinman, L., Meinardi, S., Mikovini, T., Onasch, T. B., Palm, B. B., Peischl, J., Pollack, I. B., Ryerson, T. B., Sachse, G. W., Sedlacek, A. J., Shilling, J. E., Springston, S. R., St. Clair, J. M., Tanner, D. J., Teng, A. P., Wennberg, P. O., Wisthaler, A., and Wolfe, G. M.: Western U.S. wildfires: Emissions and air quality tradeoffs with prescribed burning, J. Geophys. Res., 122, 6108–6129, https://doi.org/10.1002/2016JD026315, 2017.
Lu, Z. and Sokolik, I. N.: The effect of smoke emission amount on changes in cloud properties and precipitation: A case study of Canadian boreal wildfires of 2007, J. Geophys. Res.-Atmos., 118, 11777–11793, https://doi.org/10.1002/2013JD019860, 2013.
Onasch, T. B., Trimborn, A., Fortner, E. C., Jayne, J. T., Kok, G. L., Williams, L. R., Davidovits, P., and Worsnop, D. R.: Soot Particle Aerosol Mass Spectrometer: Development, Validation, and Initial Application, Aerosol Sci. Tech., 46, 804–817, https://doi.org/10.1080/02786826.2012.663948, 2012.
Park, K., Kittelson, D. B., Zachariah, M. R., and McMurry, P. H.: Measurement of inherent material density of nanoparticle agglomerates, J. Nanopart. Res., 6, 267–272, 2004.
Park, R. J., Jacob, D. J., and Logan, J. A.: Fire and biofuel contributions to annual mean aerosol mass concentrations in the United States, Atmos. Environ., 41, 7389–7400, 2007.
Pósfai, M., Simonics, R., Li, J., Hobbs, P. V., and Buseck, P. R.: Individual aerosol particles from biomass burning in southern Africa: 1. Compositions and size distributions of carbonaceous particles, J. Geophys. Res.-Atmos., 108, 8483, https://doi.org/10.1029/2002JD002291, 2003.
Pósfai, M., Gelencsér, A., Simonics, R., Arató, K., Li, J., Hobbs, P. V., and Buseck, P. R.: Atmospheric tar balls: particles from biomass and biofuel burning, J. Geophys. Res., 109, D06213, https://doi.org/10.1029/2003JD004169, 2004.
Reddington, C. L., Spracklen, D. V., Artaxo, P., Ridley, D. A., Rizzo, L. V., and Arana, A.: Analysis of particulate emissions from tropical biomass burning using a global aerosol model and long-term surface observations, Atmos. Chem. Phys., 16, 11083–11106, https://doi.org/10.5194/acp-16-11083-2016, 2016.
Reid, J. S., Koppmann, R., Eck, T. F., and Eleuterio, D. P.: A review of biomass burning emissions part II: intensive physical properties of biomass burning particles, Atmos. Chem. Phys., 5, 799–825, https://doi.org/10.5194/acp-5-799-2005, 2005.
Reid, J. S., Hyer, E. J., Prins, E. M., Westphal, D. L., Zhang, J., Wang, J., Christopher, S. A., Curtis, C. A., Schmidt, C. C., Eleuterio, D. P., Richardson, K. A., and Hoffman, J. P.: Global Monitoring and Forecasting of Biomass-Burning Smoke: Description of and Lessons from the Fire Location and Modeling of Burning Emissions (FLAMBE) Program, IEEE J. Sel. Top. Appl., 2, 144–162, 2009.
Schmid, B., Tomlinson, J., Hubbe, J. M., Comstock, J. M., Mei, F., Chand, D., Pekour, M. S., Kluzek, C. D., Andrews, E., Biraud, S., and McFarquhar, G.: The DOE ARM Aerial Facility, B. Am. Meteorol. Soc., 95, 723–742, https://doi.org/10.1175/BAMS-D-13-00040.1, 2014.
Sedlacek III, A. J. and Lee, J.: Photothermal Interferometric Aerosol Absorption Spectrometry, Aerosol Sci. Tech., 41, 1089–1101, 2007.
Tivanski, A. V., Hopkins, R. J., Tyliszczak, T., and Gilles, M. K.: Oxygenated Interface on Biomass Burn Tar Balls Determined by Single Particle Scanning Transmission X-ray Microscopy, J. Phys. Chem. A, 111, 5448–5458, 2007.
Tóth, A., Hoffer, A., Nyiro-Kósa, I., Pósfai, M., and Gelencsér, A.: Atmospheric tar balls: aged primary droplets from biomass burning?, Atmos. Chem. Phys., 14, 6669–6675, https://doi.org/10.5194/acp-14-6669-2014, 2014.
Urbanski, S.: Wildland fire emissions, carbon, and climate: Emission factors, Forest Ecol. Manag., 31 751–760, 2014.
van der Werf, G. R., Randerson, J. T., Giglio, L., Collatz, G. J., Mu, M., Kasibhatla, P. S., Morton, D. C., DeFries, R. S., Jin, Y., and van Leeuwen, T. T.: Global fire emissions and the contribution of deforestation, savanna, forest, agricultural, and peat fires (1997–2009), Atmos. Chem. Phys., 10, 11707–11735, https://doi.org/10.5194/acp-10-11707-2010, 2010.
Willis, M. D., Lee, A. K. Y., Onasch, T. B., Fortner, E. C., Williams, L. R., Lambe, A. T., Worsnop, D. R., and Abbatt, J. P. D.: Collection efficiency of the soot-particle aerosol mass spectrometer (SP-AMS) for internally mixed particulate black carbon, Atmos. Meas. Tech., 7, 4507–4516, https://doi.org/10.5194/amt-7-4507-2014, 2014.
Zhou, S., Collier, S., Jaffe, D. A., Briggs, N. L., Hee, J., Sedlacek III, A. J., Kleinman, L., Onasch, T. B., and Zhang, Q.: Regional influence of wildfires on aerosol chemistry in the western US and insights into atmospheric aging of biomass burning organic aerosol, Atmos. Chem. Phys., 17, 2477–2493, https://doi.org/10.5194/acp-17-2477-2017, 2017.