the Creative Commons Attribution 4.0 License.
the Creative Commons Attribution 4.0 License.
 | 13 Aug 2018
Intra-annual variations of regional aerosol optical depth, vertical distribution, and particle types from multiple satellite and ground-based observational datasets
Jonathan H. Jiang
David J. Diner
Hui Su
Kuo-Nan Liou
Zhe Jiang
Lei Huang
Yoshi Takano
Xuehua Fan
Ali H. Omar
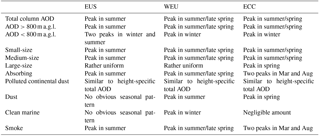
The climatic and health effects of aerosols are strongly dependent on the intra-annual variations in their loading and properties. While the seasonal variations of regional aerosol optical depth (AOD) have been extensively studied, understanding the temporal variations in aerosol vertical distribution and particle types is also important for an accurate estimate of aerosol climatic effects. In this paper, we combine the observations from four satellite-borne sensors and several ground-based networks to investigate the seasonal variations of aerosol column loading, vertical distribution, and particle types over three populous regions: the Eastern United States (EUS), Western Europe (WEU), and Eastern and Central China (ECC). In all three regions, column AOD, as well as AOD at heights above 800 m, peaks in summer/spring, probably due to accelerated formation of secondary aerosols and hygroscopic growth. In contrast, AOD below 800 m peaks in winter over WEU and ECC regions because more aerosols are confined to lower heights due to the weaker vertical mixing. In the EUS region, AOD below 800 m shows two maximums, one in summer and the other in winter. The temporal trends in low-level AOD are consistent with those in surface fine particle (PM2.5) concentrations. AOD due to fine particles (<0.7 µm diameter) is much larger in spring/summer than in winter over all three regions. However, the coarse mode AOD (>1.4 µm diameter), generally shows small variability, except that a peak occurs in spring in the ECC region due to the prevalence of airborne dust during this season. When aerosols are classified according to sources, the dominant type is associated with anthropogenic air pollution, which has a similar seasonal pattern as total AOD. Dust and sea-spray aerosols in the WEU region peak in summer and winter, respectively, but do not show an obvious seasonal pattern in the EUS region. Smoke aerosols, as well as absorbing aerosols, present an obvious unimodal distribution with a maximum occurring in summer over the EUS and WEU regions, whereas they follow a bimodal distribution with peaks in August and March (due to crop residue burning) over the ECC region.
- Article
(5732 KB) - Full-text XML
- BibTeX
- EndNote


Aerosols have adverse effects on human health (Lelieveld et al., 2015) and play a key role in Earth's climate through aerosol–radiation interactions (McCormick and Ludwig, 1967) and aerosol–cloud interactions (Twomey, 1977; Albrecht, 1989; Garrett and Zhao, 2006). Compared with long-lived climate forcers such as CO2, aerosols have relatively short lifetimes and hence large spatiotemporal variability (Unger et al., 2008; Shindell et al., 2009). Therefore, the climatic and health effects of aerosols are not only induced by inter-annual concentration changes, but also strongly depend on their intra-annual variability.
Aerosol optical depth (AOD) has been widely used to represent the column aerosol loading and to assess the aerosol impacts on radiation, clouds, and precipitation (Ma et al., 2014; Niu and Li, 2012; Zhao et al., 2018b; Song et al., 2017). However, the wide ranges of particle optical properties and size distribution mean that even for the same AOD, different aerosol types have different effects on not only the magnitude, but also the sign, of aerosol radiative forcing (IPCC, 2013; Gu et al., 2006; Garrett et al., 2004). IPCC (2013) estimate that the historical global mean direct radiative forcings due to sulfate, organic carbon (OC), black carbon (BC), and mineral dust are −0.40, −0.19, +0.36, and −0.10 W m−2, respectively. Furthermore, absorbing and non-absorbing aerosols have been found to have very different impacts on the surface radiative cooling effects (Yang et al., 2016) and the development of convective clouds (Massie et al., 2016; Ramanathan et al., 2005; Rosenfeld et al., 2008). Besides aerosol type, the aerosol vertical distribution influences its mass concentration within the planetary boundary layer (PBL) (Zheng et al., 2017) and the vertical profile of heating rate (Johnson et al., 2008; Guan et al., 2010; Zhang et al., 2013), which subsequently modifies the atmospheric stability and convective strength (Ramanathan et al., 2007), with potential changes in cloud properties (Johnson et al., 2004). Understanding aerosol variability as a function of height is also important because the indirect effect of aerosols is mainly dependent on those mixed with the clouds (Zhao et al., 2018c). Meanwhile, the health impacts of aerosols are only associated with those present near the surface, where they are inhaled. For these reasons, systematic analyses of the intra-annual variations of aerosol vertical distribution and particle types, in addition to total column AOD, are necessary to improve our understanding of aerosol climatic and health effects.
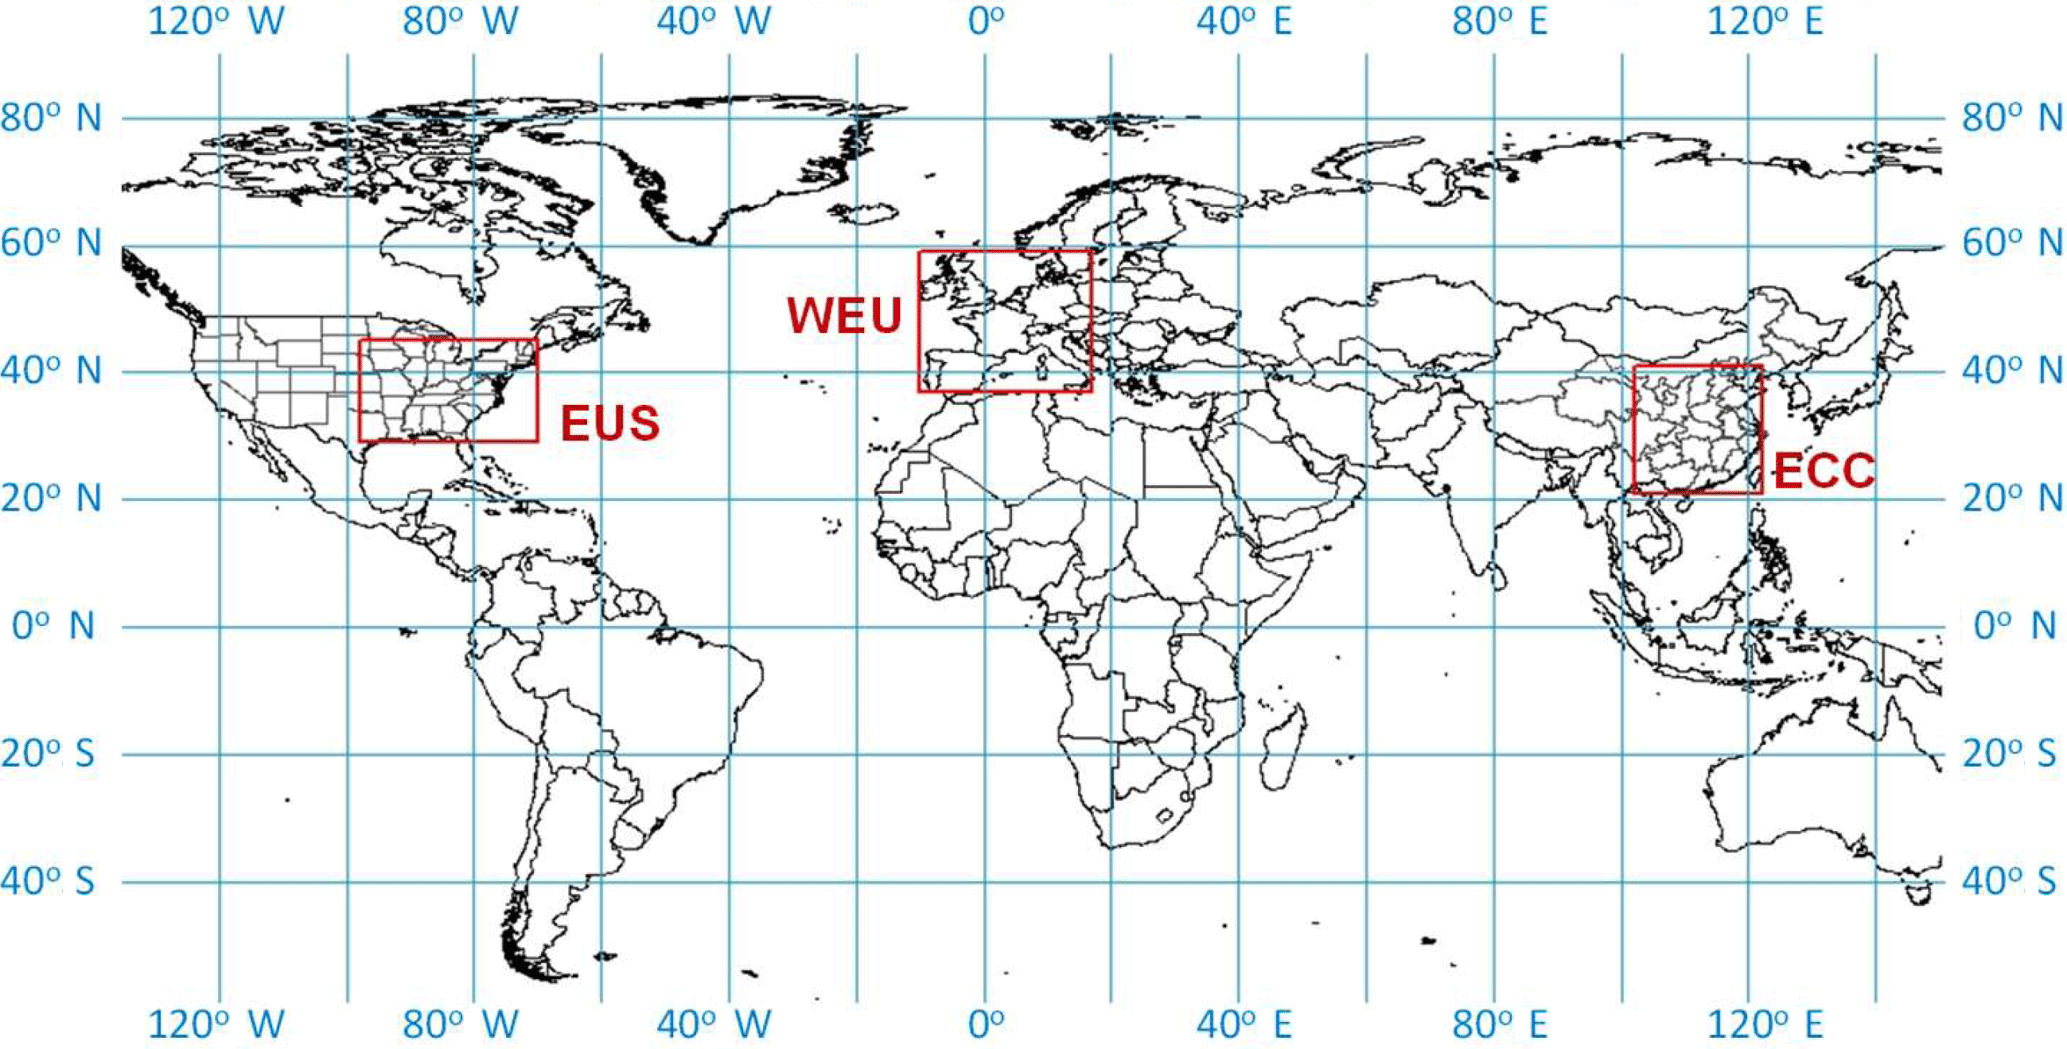
Figure 1Target regions for this study: the Eastern United States (EUS), Western Europe (WEU), and Eastern and Central China (ECC).
Numerous studies have investigated the seasonal variations of AOD at global and regional scales using satellite observations (e.g., Kim et al., 2007; Song et al., 2009; Mehta et al., 2016; Mao et al., 2014). By comparison, most previous studies of the temporal variations of aerosol vertical distributions and aerosol types have been confined to only a few sites due to coverage limitations associated with reliance on ground-based instruments (e.g., Liu et al., 2012; Matthias et al., 2004). Despite continuous advancement of remote sensing technology and emergence of new spaceborne sensors, only a limited number of studies have utilized satellite observations to examine the seasonal variations of aerosol profiles and/or types at regional or larger scales (Huang et al., 2013; Kahn and Gaitley, 2015; Yu et al., 2010; Li et al., 2016). Huang et al. (2013) analyzed the seasonal variations of aerosol extinction profile and type distribution using 5-year observations from the Cloud-Aerosol Lidar and Infrared Pathfinder Satellite Observations (CALIPSO). Kahn and Gaitley (2015) examined the spatiotemporal variations of aerosol types retrieved by the Multi-angle Imaging SpectroRadiometer (MISR). Different satellite-borne sensors, such as MISR, CALIPSO, and the Moderate resolution Imaging Spectroradiometer (MODIS), employ different principles of measurement and retrieval, and thus provide different sensitivities to column AOD, aerosol types, and vertical profiles. Therefore, integration of data from multiple satellites and ground-based observational networks makes it possible to deepen our understanding of the intra-annual variations of aerosol loadings, profiles, and types.
In this study, we investigate the seasonal variations of aerosol column loading, vertical distribution, and particle types using multiple satellite and ground-based observational datasets covering the period from 2007 to 2016. The purpose is to assess the consistency among various datasets and provide a comprehensive characterization of aerosol properties in polluted regions to facilitate future studies of aerosol climate effects and local air quality issues. The data are from MISR, MODIS, CALIPSO, Aerosol Robotic Network (AERONET), and surface PM2.5 monitors. Following our previous study (Zhao et al., 2017), we selected three populous regions that have experienced substantial anthropogenic pollution (Wang et al., 2017, 2014) and have received considerable attention in other climate studies: the Eastern United States (EUS; 29–45∘ N, 70–98∘ W), Western Europe (WEU; 37–59∘ N, 10∘ W–17∘ E), and Eastern and Central China (ECC; 21–41∘ N, 102–122∘ E). The geographical boundaries of these regions are shown in Fig. 1.
2.1 Satellite data
We obtain retrievals of total column AOD as well as AOD for various height ranges and aerosol types during 2007–2016 from MISR (flying on the Terra satellite), MODIS (Terra and Aqua), and the Cloud-Aerosol Lidar with Orthogonal Polarization (CALIOP) on CALIPSO. The aerosol retrievals from MISR and MODIS are only available for clear-sky conditions in the daytime. CALIPSO provides retrievals during both day and night, but only clear-sky daytime profiles are used in order to be consistent with the products from MISR and MODIS.
MISR observes the Earth with moderately high spatial resolution (275 m to 1.1 km) at nine along-track viewing angles in each of four visible or near-infrared spectral bands, which enables the partitioning of AOD by particle type over both land and ocean, in addition to retrieval of total AOD (Kahn and Gaitley, 2015; Kahn et al., 2001). Its observations provide near-global coverage every 9 days (Diner et al., 1998). We make use of the Level 3 daily global aerosol product (MIL3DAE) version F15_0031, which is generated at a spatial resolution of 0.5∘ × 0.5∘ based on the Level 2 aerosol product V22. The variables used in the analysis are total AOD at 555 nm as well as AODs for six aerosol components, namely small (<0.7 µm diameter), medium (0.7–1.4 µm diameter), large (>1.4 µm diameter), spherical, non-spherical, and absorbing. Based on comparison with ground-based AERONET measurements, the errors in MISR Level 2 AOD data are in the order of ±0.05 or , whichever is larger (Kahn et al., 2005, 2010). In addition, retrieval of MISR aerosol type information from individual retrievals is considered to be reliable when AOD>0.15, and has diminished sensitivity at smaller AOD (Kahn and Gaitley, 2015; Kahn et al., 2010). In this study we use only monthly mean values, for which the uncertainties in aerosol types are expected to be smaller than those for individual retrievals. Note that we did not do a relative humidity (RH) correction to AOD retrievals from MISR as well as other sensors. The seasonal variations of AOD represent a combined effect of variations in aerosol abundance, vertical distribution, chemical constituents, and meteorological conditions.
The MODIS sensors onboard the Terra and Aqua satellites observe the Earth with multiple wavelength bands over a 2330 km swath (King et al., 2003), which provides near-daily global coverage. In this study we obtain column AOD data at 550 nm with a 1∘ × 1∘ resolution from the Level 3 daily atmosphere products Collection 6 (MOD08 and MYD08 for the Terra and Aqua platforms, respectively). Comparison studies with AERONET have estimated the accuracy of Level 2 AOD retrievals to be about over land and over ocean (Levy et al., 2010; Remer et al., 2005). For both MISR and MODIS data, we calculate regional mean AOD by averaging valid AOD values over all grids within the three target regions.
Table 1Summary of the seasonal variations of the total, height-specific, and type-specific AOD.
CALIOP is a dual-wavelength polarization lidar on the CALIPSO satellite, and is designed to acquire vertical profiles of aerosols and clouds at 532 and 1064 nm wavelengths (Winker et al., 2007). CALIPSO flies in formation with Aqua, and all three satellites employed in this paper fly in orbits that have 16-day repeat cycles. In addition to vertical extinction profiles, CALIPSO categorizes an aerosol layer as one of seven types based on a number of parameters including altitude, location, surface type, volume depolarization ratio, and integrated attenuated backscatter (Omar et al., 2009). The seven aerosol types are dust, smoke, clean continental, polluted continental, polluted dust, clean marine, and dusty marine. For most profiles, this aerosol classification is consistent with that derived from AERONET inversion data (Mielonen et al., 2009). In this study, we adopt the Level 2 aerosol profile product (05kmAPro, V4.10), which has an along-track horizontal resolution of 5 km and a vertical resolution of 60 m or 180 m, depending on whether the aerosol height is below or above 20.2 km altitude. We do not use the CALIOP Level 3 product because it is difficult to collocate with AERONET observations (see Sect. 2.2) due to its coarse resolution (). For each clear-sky profile, we calculate the column AOD at 532 nm by vertically integrating extinction coefficients of the features that are identified as “aerosols” and have valid quality control (QC) flags, i.e., cloud aerosol discrimination (CAD) score , extinction , and extinction coefficient uncertainty <99.9 (Huang et al., 2013). In addition, we employ two quality filters used in generating the Level 3 product in order to eliminate features that probably suffer from surface contamination, i.e., near-surface features with large negative extinction coefficients and contaminated features beneath the surface-attached opaque layer (NASA CALIPSO team, 2011). Following the same method, we also bin the 532 nm AODs into various height ranges, i.e., 0–200, 200–500, 500–800, 800–1200, 1200–2000, and >2000 m above ground level (a.g.l.). Finally, we derive monthly mean AODs by averaging all clear-sky aerosol profiles within each month over the three target regions. Although aerosol extinction coefficients with heights below 200 m a.g.l. are considered to be uncertain despite the application of quality filters (NASA CALIPSO team, 2011), we include them for completeness but exercise with caution when interpreting variations of AODs below 200 m. It should be noted that CALIPSO AOD is reported at a different wavelength (532 nm) from those used in the MISR and MODIS products (555 and 550 nm, respectively); this slight wavelength difference is not expected to affect our conclusions regarding AOD seasonal variations.
2.2 AERONET and surface PM2.5 data
We use AOD observations from AERONET to compare with the AOD seasonal variations derived from satellite datasets. AERONET sunphotometers directly measure AOD at seven wavelengths (approximately 340, 380, 440, 500, 675, 870, and 1020 nm) with an estimated uncertainty of 0.01–0.02 (Holben et al., 2001; Eck et al., 1999), which is much smaller than the uncertainties associated with satellite measurements (Kahn et al., 2010; Levy et al., 2010; Schuster et al., 2012). Therefore, we consider AERONET as “ground truth” for AOD temporal variations. We adopt the AERONET Level 2 Version 2.0 direct-sun measurements of spectral AODs, which are subsequently interpolated to 550 nm using a second-order polynomial fit to ln(AOD) vs. ln(wavelength) as recommended by Eck et al. (1999). A fundamental difference between satellite and AERONET AOD observations is that a satellite acquires data at a single overpass time (or spread over 7 min for MISR's nine views) and over an extended spatial area in the case of MISR and MODIS, whereas AERONET obtains a time series of point data at each surface station. To match coincident measurements, the AERONET AOD retrievals for each site are averaged within a 2 h window centered on the satellite overpass times (about 10:30 for MISR and MODIS/Terra, and 13:30 for MODIS/Aqua and CALIPSO, depending on site location), and compared with the satellite AOD retrievals in a grid box (consistent with the grids used in the MODIS Level 3 products) that contains the corresponding AERONET site. Only those days for which a satellite overpasses an AERONET site are used in the comparisons. As AOD variation has a large spatial correlation length of 40–400 km (Anderson et al., 2003), spatial averaging over a grid should not bias the seasonal variations of AOD but has the benefit of increase the number of data points with valid AOD retrievals that are used in the comparisons. To assure data quality, only the AERONET sites that span at least 5 years with at least 10 months of valid data in each year are included in the comparison. After screening, 28, 54, and 13 sites are used in our analysis of the EUS, WEU, and ECC regions.

Figure 2Monthly mean AOD observed by MISR, MODIS/Terra, MODIS/Aqua, and CALIPSO during 2007–2016 in (a) EUS, (b) WEU, and (c) ECC. For CALIPSO, only clear-sky daytime profiles are averaged in order to be consistent with the MISR and MODIS products. “MODIS/Terra_match MISR” is a sensitivity case in which the monthly mean AOD of MODIS/Terra is calculated using only the days when MISR overpasses, and “MODIS/Aqua_match CALIPSO” is a case in which the monthly mean AOD of MODIS/Aqua is calculated using only the overpassing days of CALIPSO. The error bars denote the standard deviation of the monthly mean AOD values obtained over all years. Note the different scales on the y axes of the plots.
To provide additional information on the seasonal variations of satellite-observed aerosol loadings near the surface, we obtain surface PM2.5 concentrations from several observational networks over the three target regions. Hourly PM2.5 concentrations for 225 sites over the EUS region are achieved from the Air Quality System (AQS), which is a large observational database containing ambient air pollution data collected by the United States Environmental Protection Agency (USEPA), as well as state, local, and tribal air pollution control agencies in the United States (USEPA, 2015). For the ECC region, we obtain hourly PM2.5 concentrations from the Ministry of Environmental Protection of China (MEP, http://datacenter.mep.gov.cn/, last access: 15 August 2017), which provides continuous measurements at 496 sites located in 74 major cities in China. Hourly and daily PM2.5 concentrations for 52 sites over the WEU region are taken from the European Monitoring and Evaluation Programme (EMEP). Similar to the processing of AERONET data, we only include sites whose data span ≥5 years with ≥10 months of data in each year, except in the case of the ECC region where at least 2 years of data are required because the PM2.5 concentrations have been only publicly available since January 2013.
3.1 Seasonal variations of column AOD
Figure 2 illustrates the monthly variations in column AOD observed by MISR, MODIS/Terra, MODIS/Aqua, and CALIPSO during 2007–2016 in the three target regions. All satellite-borne sensors show that AOD in the EUS region is the highest in summer and lowest in winter, though CALIPSO reports a noticeably smaller difference between the summer and winter extrema compared with the other three satellite instruments. For the WEU and ECC regions, MISR, MODIS/Terra, and MODIS/Aqua also reveal consistent seasonal patterns in which AOD peaks in spring and/or summer and reaches its lowest valley in winter. However, CALIPSO shows little intra-annual variation in AOD, with small peaks occurring in spring and fall.
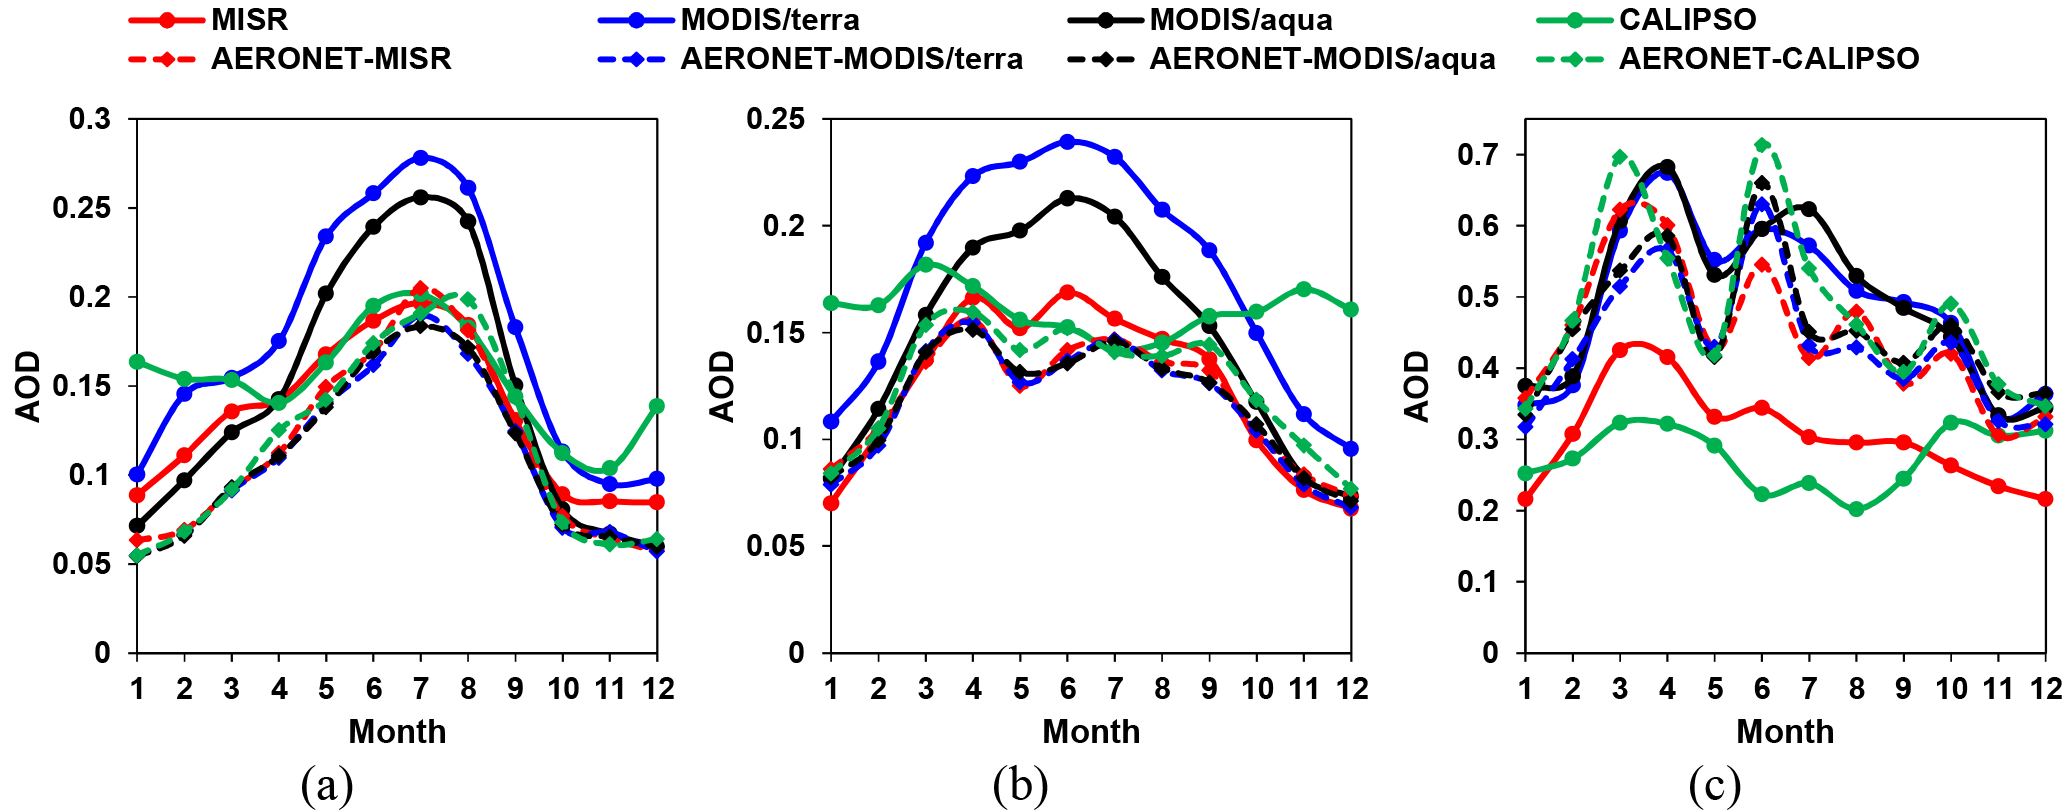
Figure 3Monthly mean AOD observed by satellites and AERONET averaged across the AERONET sites during 2007–2016 in (a) EUS, (b) WEU, and (c) ECC. The observations from MISR, MODIS/Terra, MODIS/Aqua, and CALIPSO are averaged over grid boxes containing the AERONET sites. The AERONET data are averaged within a 2 h window centered on satellite overpass times. The numbers of AERONET sites included in analysis are 28, 54, and 13, in the EUS, WEU, and ECC regions, respectively. As the four sensors overpass a site in different days and different times of day, we separately calculate the AERONET data matched to each sensor (denoted by “AERONET-xxx”). The AERONET curves matched to different sensors are close in EUS and WEU, partly because there are plenty of sites in these two regions, and the discrepancy due to the sampling issue is thus smoothed out. In contrast, there are only 13 AERONET sites in ECC, so there exists larger discrepancy between the AERONET data matched to different sensors. Note the different scales on the y axes of the plots.
As described in Sect. 2.1, MODIS provides near-daily global coverage but MISR and CALIPSO do not. As a result, the monthly mean AOD from different sensors is calculated based on different sets of days, which might lead to uncertainties in the estimation of monthly mean AOD (Colarco et al., 2014; Wang and Zhao, 2017). To rule out the impact of spatiotemporal sampling on seasonal variation patterns, we design two sensitivity cases: a “MODIS/Terra_match MISR” case in which the monthly mean AOD of MODIS/Terra is calculated using only the days when MISR overpasses, and a “MODIS/Aqua_match CALIPSO” case in which the monthly mean AOD of MODIS/Aqua is calculated using only the overpassing days of CALIPSO. The results are illustrated in Fig. 2. In all three regions, the monthly mean AODs are slightly different for “MODIS/Terra” and “MODIS/Terra_match MISR”, but the seasonal variation patterns are largely the same. The same results are found for “MODIS/Aqua” and “MODIS/Aqua_match CALIPSO”. As such, we conclude that sampling has little effect on the AOD seasonal variation patterns reported in this study. In fact, this conclusion is compatible with the findings of Colarco et al. (2014). Colarco et al. (2014) revealed that the spatial sampling artifacts were significant for fine aggregation grid (e.g., 0.5∘), but they are reduced at coarse grid scales (e.g., 10∘). In this study, we use only the mean AOD over three large regions (about ) across 10 years, thus the sampling artifacts are expected to be even smaller. Despite this, we acknowledge that the inconsistent spatiotemporal sampling of different retrieval products (due to different swath width and mixing of Level 2 and Level 3 products) adds to the uncertainty in monthly AOD estimation. A more direct comparison at the measurement/retrieval level merits further in-depth study.
In view of the substantial differences between CALIPSO and the other three sensors, we compare satellite retrieved AOD seasonal variations with point-based ground measurements from AERONET (Fig. 3). As in other studies, AERONET data are treated as “ground truth” for column AOD due to its smaller uncertainty compared with satellite data (Kahn et al., 2010; Levy et al., 2010; Schuster et al., 2012; Fan et al., 2018). Figure 3 shows that, in all three regions, the AOD seasonal variations measured by AERONET are similar to those retrieved by MISR, MODIS/Terra, and MODIS/Aqua, but are quite different from CALIPSO data. Reasons for the different seasonal patterns between CALIPSO and other sensors will be discussed in Sect. 3.2. Considering the high accuracy of AERONET, we conclude that AOD peaks in summer/spring and dips in winter. An important reason for the higher AOD in summer is that the stronger radiation and higher temperature accelerate the formation of secondary aerosols (Timonen et al., 2014), including sulfate, nitrate, ammonium, and secondary organic aerosol (SOA). SOA is produced by photo-oxidation of volatile organic compounds (VOCs) and intermediate volatility organic compounds (IVOCs), as well as the chemical aging of primary organic aerosol (Zhao et al., 2016). Another reason is that more abundant water vapor in summer favors the hygroscopic growth of aerosols (Liu et al., 2012; Zheng et al., 2017). The different patterns of long-range transport as a function of season is also partly responsible for the seasonable variation of AOD (Tian et al., 2017; Yang et al., 2018; Garrett et al., 2010).
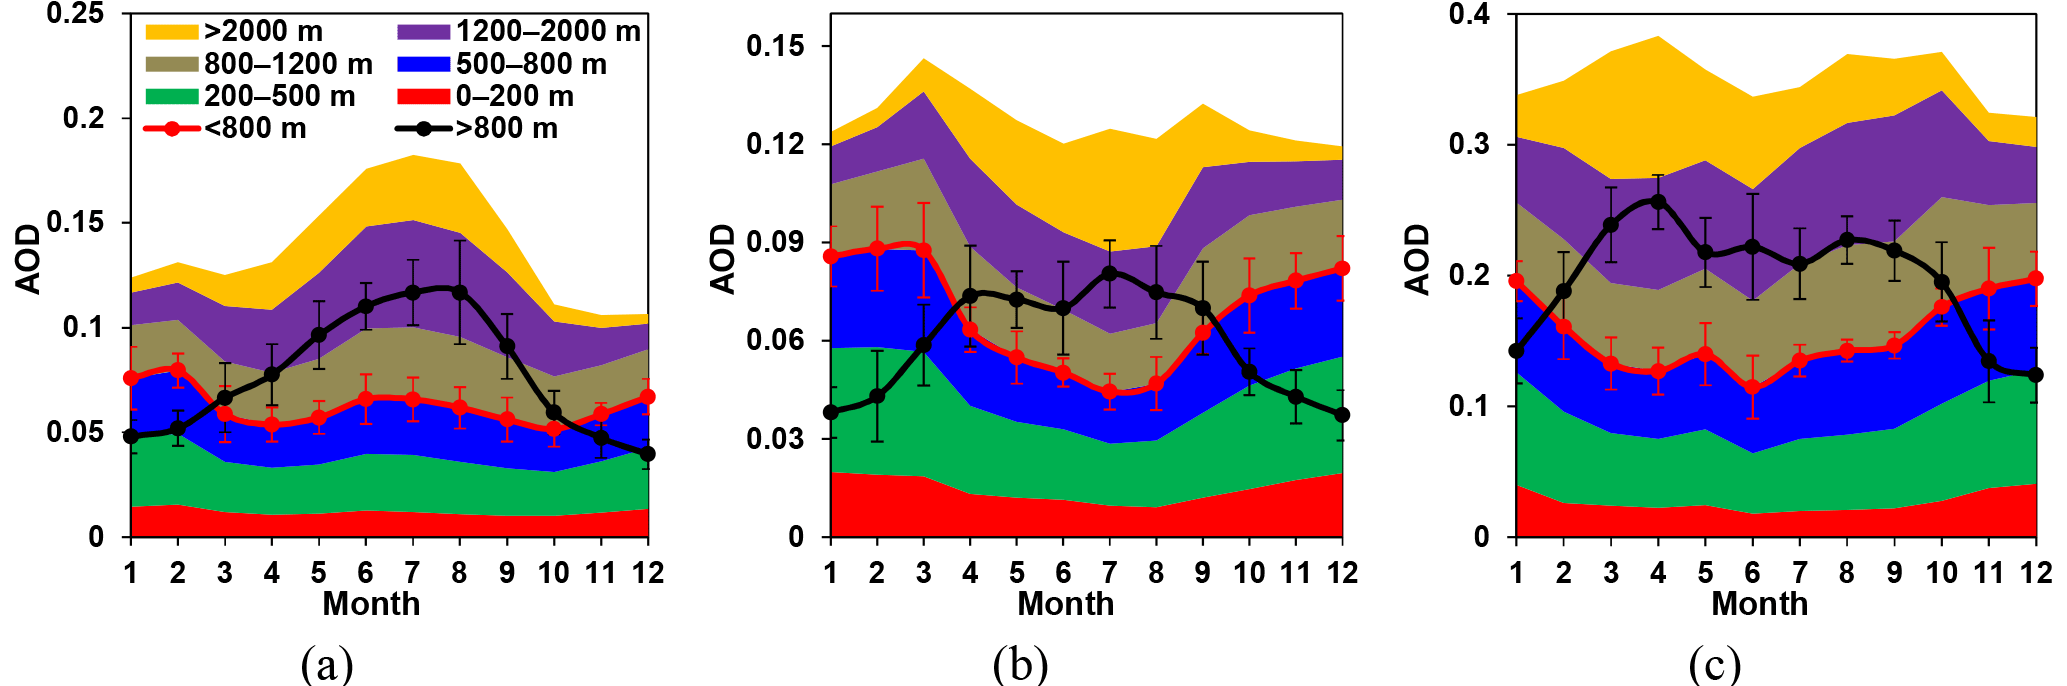
Figure 4Monthly mean AOD as a function of height above ground level observed by CALIPSO during 2007–2016 in (a) EUS, (b) WEU, and (c) ECC. Only clear-sky daytime profiles are averaged in order to be consistent with the products of MISR and MODIS. The range of AOD within a particular height range is depicted by the colored stacks. The integrated AODs for heights below and above 800 m are shown as solid lines, for which the error bars are defined in the same way as in Fig. 2. Note the different scales on the y axes of the plots.
While relative patterns of AOD seasonal variations from observations of MISR, MODIS/Terra, and MODIS/Aqua are similar to each other and to those of AERONET, the magnitude of AOD observed by these sensors shows considerable discrepancies. In all three regions, the AOD retrieved from MODIS is larger than that from MISR, consistent with the results of previous studies (de Meij et al., 2012; Zhao et al., 2017; Chin et al., 2014; Kang et al., 2016; Qi et al., 2013). This is most likely due to differences in observing strategy, retrieval algorithms, and spatiotemporal sampling (Kahn et al., 2009). The MISR-retrieved AOD agrees well with the AERONET observations in EUS and WEU regions. However, in the ECC region MISR underestimates the AERONET AOD, probably because there is less signal from the surface at higher AOD, which creates ambiguity that can result in the algorithm assigning too much of the top-of-atmosphere radiance to the surface (i.e., a higher surface albedo), thereby underestimating the AOD (Kahn et al., 2010). The MODIS/Terra and MODIS/Aqua overestimate the AERONET AOD to some extent in all three regions. The overestimation was also reported in two previous studies (de Meij et al., 2012; Ruiz-Arias et al., 2013) using the level 3 MODIS products (Collection 5 or 5.1). We show a relatively larger overestimation than that reported by de Meij et al. (2012) and Ruiz-Arias et al. (2013), partly because we used the AERONET AOD averaged within a 2 h window centered on the satellite overpass times while the two previous studies used the daily/monthly mean AERONET AOD in the comparisons. The daily mean AOD observed by AERONET is about 10 % larger than the value during the satellite overpass times (Li et al., 2013). The reasons for the discrepancy between MODIS and AERONET are yet to be thoroughly investigated.
3.2 Seasonal variations of aerosol loadings as a function of height
In addition to column AOD, the climatic effects of aerosols are also strongly dependent on their vertical distribution. To explore intra-annual variations in aerosol vertical profile, Fig. 4 presents CALIPSO-observed monthly variations of AOD as a function of height in the three target regions. A striking pattern is that the AOD seasonal variations are dramatically different at lower and upper heights. Over the WEU and ECC regions, AODs of the vertical layers below 800 m a.g.l. generally peak in winter, while those above 800 m a.g.l. peak in summer/spring. As a result, the CALIPSO-observed column AOD for these two regions presents a rather uniform seasonal pattern. For the EUS region, the maximum AOD above 800 m a.g.l. also occurs in summer; however, AOD below 800 m a.g.l. shows two peaks, one in summer and the other in winter. The integration of various layers thus yields a nearly unimodal distribution with maximum occurring in summer.
To provide an independent evaluation of the CALIPSO-observed AOD variations at lower heights, we examine the seasonal variations of near-surface PM2.5 concentrations at hundreds of surface monitor locations within the three target regions (Fig. 5). The aerosol extinction coefficient, and hence AOD at lower heights is affected by not only the particle mass concentrations, but also aerosol type (absorbing vs. non-absorbing aerosols, coarse-mode vs. fine-mode aerosols) and meteorological parameters such as RH, wind speed and direction, and planetary boundary layer height (Zheng et al., 2017). Nevertheless, previous studies have reported fairly good correlations between extinction coefficient/low-level AOD and PM2.5 concentrations (Cheng et al., 2013; Zheng et al., 2017). For this reason, it is reasonable to qualitatively compare the seasonal variation patterns of near-surface PM2.5 concentrations and low-level AOD. We calculate monthly mean PM2.5 concentrations using only the days when CALIPSO overpasses an observational site to enable a better comparison. Figure 5 shows that, over the ECC and WEU regions, surface PM2.5 concentrations are largest in winter and smallest in summer. In the EUS region, the maximum PM2.5 concentration occurs in summer and a second maximum occurs in winter. These trends are generally consistent with the seasonal variations of AOD at low heights, implying that CALIPSO data can generally capture the seasonal changes in low-level aerosol abundance.

Figure 5Monthly mean surface PM2.5 concentrations during 2007–2016 in three target regions. The numbers of observational sites included in averaging are 225, 52, and 496, in the EUS, WEU, and ECC regions. Note the different scales on the y axes for EUS/WEU and ECC.
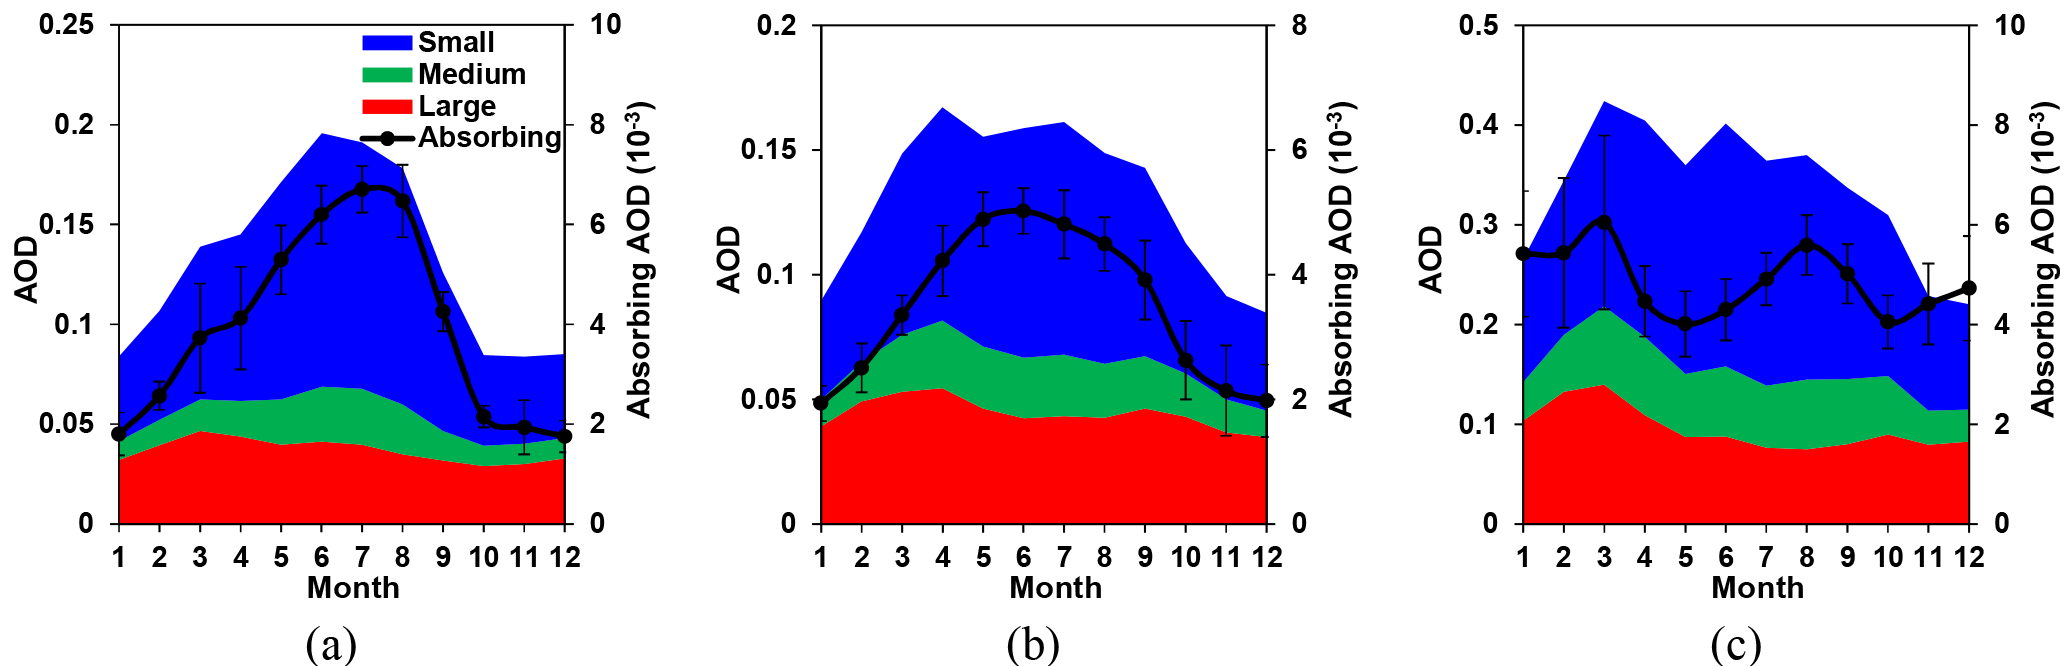
Figure 6Monthly mean AOD of different aerosol types observed by MISR during 2007–2016 in (a) EUS, (b) WEU, and (c) ECC. The size-resolved AODs are depicted by the colored stacks (left Y axis); the integration of the three size ranges yields total column AOD, as represented by the upper edge of the blue color. The AOD of absorbing aerosols is shown as solid lines (right Y axis), for which the error bars are defined in the same way as in Fig. 2. Note the different scales on the y axes of the plots.
The aerosol vertical distribution is an important factor in reconciling CALIPSO and other sensors with regard to AOD seasonal variations. MISR, MODIS, and AERONET all measure column-integrated AOD using spectroradiometers, whereas CALIOP is an active lidar which estimates vertically resolved AOD based on vertical profiles of attenuated backscatter. By comparing CALIPSO with the Atmospheric Radiation Measurement (ARM) program's ground-based Raman lidars, Thorsen et al. (2017) showed that CALIPSO does not detect all relatively significant aerosols due to insufficient detection sensitivity and tends to miss optically thin aerosol layers. Consequently, the fraction of aerosols detected in the upper levels (>800 m a.g.l.) is much smaller than that in the lower levels (<800 m a.g.l.) because the upper-level aerosols are often optically thin. As a result, the CALIPSO-observed AOD seasonal variations are significantly weighted toward lower heights. Note that the aerosols with heights below 200 m a.g.l. are frequently undetected because of surface contamination (Kim et al., 2017; NASA CALIPSO team, 2011), but this does not alter the key feature that the AOD is weighted toward lower heights. Over WEU and ECC regions, the unimodal AOD distributions with a summer peak at higher levels are largely counteracted by the opposite seasonal variations at lower levels, resulting in rather uniform seasonal variations of column AOD. For the EUS regions, due to the bimodal AOD distribution at lower heights, the summer peak in column AOD variations remain but the difference between peak and valley is smaller than implied by the observations of MISR/MODIS/AERONET. In this sense, although the integrated CALIPSO column AOD does not agree well with AERONET, it does provide valuable information with respect to seasonal variations of aerosols within a specific height range. This is because the detection fraction of aerosols does not vary significantly with season at a given height due to relatively small variability of optical thickness. Specifically, the seasonal mean AOD within a specific height range differs by 3 times at most as a function of season (Fig. 4), while it decreases by about 2 orders of magnitude with the increase of height (Kim et al., 2017; Thorsen et al., 2017). Aside from the seasonal variations, the difference in the magnitude of AOD between CALIPSO and other sensors are also largely explained by the undetected aerosol layers by CALIPSO (Kim et al., 2017; Thorsen et al., 2017) as well as the assumed lidar ratios in CALIPSO retrievals (Ma et al., 2013).
Why are the AOD seasonal variations different between the lower and upper levels? The atmosphere in winter is generally more stable and vertical mixing is weaker, thus more aerosols, particularly primary aerosols, are confined to lower heights, resulting in the peak of low-level AOD in winter (Guo et al., 2016; Liu et al., 2012; Zheng et al., 2017). At higher levels, the maximum AOD in summer can be explained by two reasons: (1) more aerosols, especially primary aerosols, are transported to the upper levels in summer due to stronger vertical mixing (Guo et al., 2016; Liu et al., 2012; Zheng et al., 2017), and (2) secondary aerosol formation is more rapid in summer because of stronger radiation and higher temperature, and much of the secondary aerosols are produced in the upper levels (de Reus et al., 2000; Minguillon et al., 2015; Heald et al., 2005). In addition, the seasonal variations of AOD at different vertical levels may also be influenced by the variations of water vapor amount, which affects the hygroscopic growth (Liu et al., 2012; Zheng et al., 2017) as well as the seasonal patterns of inter-regional transport of aerosols (Tian et al., 2017; Yang et al., 2018; Garrett et al., 2010).
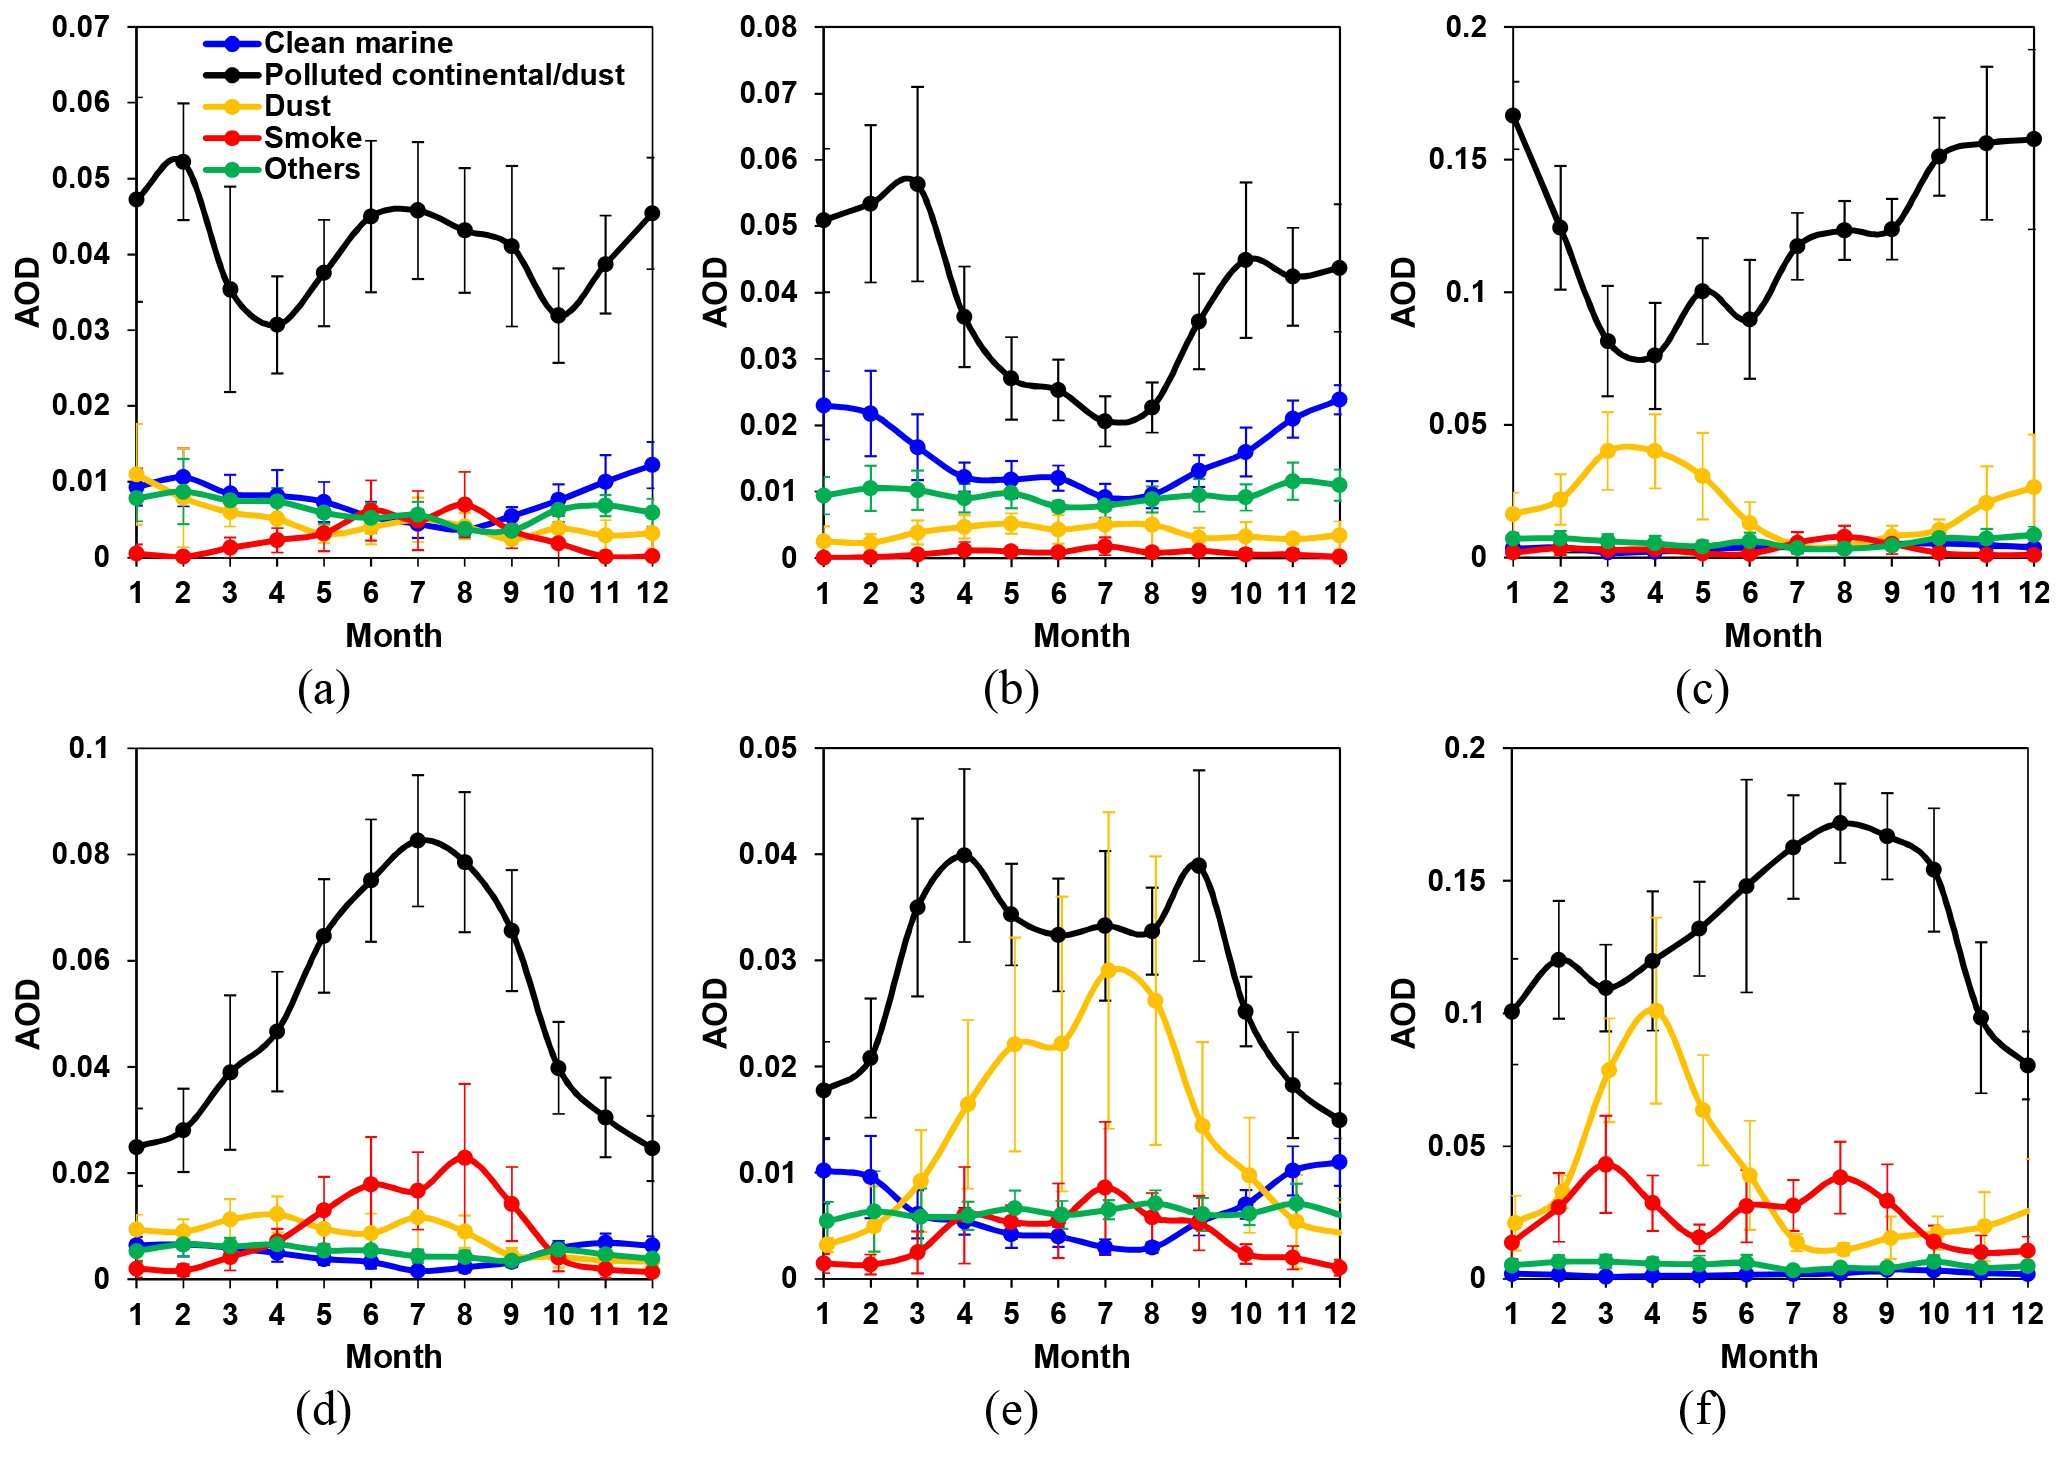
Figure 7Monthly mean AOD of different aerosol types (a–c) below 800 m and (d–f) above 800 m observed by CALIPSO during 2007–2016 in (a, d) EUS, (b, e) WEU, and (c, f) ECC. Only clear-sky daytime profiles are used in the averaging to be consistent with the products of MISR and MODIS. The definition of error bars is the same as in Fig. 2. Note the different scales on the y axes of the plots.
3.3 Seasonal variations of aerosol types
Aside from column AOD and vertical profiles, another factor influencing aerosol climate impact is aerosol type (i.e., partitioning by size and chemical composition). The MISR and CALIPSO products classify aerosols based on distinct principles of measurement and retrieval algorithms. Analysis of the two datasets in combination can potentially lead to a deeper understanding of the factors driving temporal variations of aerosol type. Key features of intra-annual variations of various aerosol types are summarized in Table 1.
Figures 6 illustrates the seasonal variations of type-specific AODs retrieved by MISR. MISR distributes AODs into three size ranges, i.e., small (<0.7 µm diameter), medium (0.7–1.4 µm diameter), and large (>1.4 µm diameter). The ambient aerosols are comprised of primary aerosols (dust, sea-spray aerosols, and primary anthropogenic aerosols) and secondary aerosols (sulfate, nitrate, ammonium, and SOA). Among these constituents, dust and sea-spray aerosols are predominantly coarse particles and secondary aerosols are dominated by very fine particles, while primary anthropogenic aerosols span a large size range, leading to a mean size intermediate between dust/sea-spray and secondary constituents (Seinfeld and Pandis, 2006). Figure 6 indicates that the small-size AOD is much larger in spring/summer than in winter over all regions, primarily due to accelerated secondary aerosol formation and enhanced hygroscopic growth (see Sect. 3.1). In contrast, large-size AOD generally shows rather uniform distributions, except for the ECC region where a peak occurs in late winter/early spring. AOD of primary anthropogenic aerosols are less influenced by seasonal effects than secondary aerosols, which partly accounts for the rather uniform distributions of large-size AOD. Additionally, the seasonal variations of large-size AOD are also affected by dust and sea-spray aerosols, as discussed below.
In contrast to MISR's partitioning of aerosol type by size and absorption, the CALIPSO-retrieved aerosol types are characterized by emission source (Fig. 7). As discussed in Sect. 3.2, relative variability in CALIPSO-derived AOD at different height ranges appears to be more reliable than integrated column AOD, thus we show aerosol types below and above 800 m separately in Fig. 7. Particles associated with anthropogenic air pollution (polluted continental and polluted dust) comprise the dominant type in all three regions. The seasonal variation patterns of polluted continental/dust are in accordance with those of the total AOD. Specifically, at higher levels, the maximum AOD of polluted continental/dust aerosols occurs in spring/summer in all regions. However, at lower levels the maximum occurs in winter (plus a second maximum in summer in EUS).
With regard to dust and clean marine (sea-spray) aerosols, the AOD in the EUS region does not show an obvious seasonal pattern. In the WEU region, AOD of dust aerosols peaks in summer, consistent with previous surface-based observational studies which show that dust events in Europe predominantly occur during summer due to transport from the Sahara region (Stafoggia et al., 2016). The AOD of dust is primarily located above 800 m, supporting the conclusion that dust aerosols in WEU mainly originate from long range transport. As the dust AOD is subject to a large inter-annual variability (denoted by the large error bars in Fig. 7), we use the Student's t test to demonstrate the statistical significance of the seasonal variations. The dust AOD in summer is statistically larger than that in any other season at the 0.05 level, indicating the robustness of the peak in summer. Contrary to dust, the AOD of sea-spray aerosols in WEU is much higher in winter than in summer, probably because winter is the relative windy season with large low pressure systems over the Atlantic Ocean and the North Sea (Manders et al., 2009). The offset of the opposite variation trends in dust and sea-spray aerosols partly accounts for the rather uniform distributions of large-size AOD in WEU (see Fig. 6). Over the ECC region, sea-spray aerosols make a negligible contribution to total AOD. The dust AOD is much larger in spring than in any other season (significant at the 0.05 level), which is tied to the outburst of springtime Gobi desert dust storms (China Meteorological Administration, 2012). The high dust AOD explains the peak in large-size AOD in spring over the ECC region (see Fig. 6).
Smoke aerosols are predominantly located above 800 m in all regions. Over the EUS and WEU regions, smoke aerosols present a unimodal distribution with maximum occurring in summer. The differences between smoke AOD in summer and the other three seasons are all statistically significant at the 0.05 level, except for the difference between summer and spring over the WEU region, which is statistically significant at the 0.10 level. In the ECC region, the smoke AOD follows a bimodal distribution with peaks occurring in March and August and valleys occurring in May and December. The differences between either of the peak months and either of the valley months are statistically significant at the 0.05 level. MISR's independent retrieval of absorbing AOD (Fig. 6) presents a highly similar seasonal pattern (statistically significant at the 0.05 level) as the CALIPSO smoke AOD. In fact, smoke and absorbing aerosols are closely correlated with each other, as smoke consists of a much larger fraction of absorbing aerosols (Dubovik et al., 2002), such as BC and light-absorbing organic aerosol (Kirchstetter and Thatcher, 2012), as compared to other aerosol types. Besides, the MISR absorbing AOD and CALIPSO smoke AOD are also consistent in the order of magnitude. The variability of MISR absorbing AOD (shown in the right Y axis of Fig. 6) is about 0.002–0.005, while the variability of smoke AOD from CALIPSO is about 0.01–0.03. The smoke AOD includes the contributions of both the absorbing and scattering portions. The MISR absorbing AOD, which is calculated using total AOD× (1 − single scattering albedo), represents only the absorbing portion but includes contributions from aerosol types other than smoke (Bull et al., 2011). Considering that the single scattering albedo of smoke is about 0.80–0.94 (Dubovik et al., 2002), we are able to reconcile the magnitude of MISR absorbing AOD and CALIPSO smoke AOD. For the preceding reasons, the seasonal patterns of smoke and absorbing aerosols act as a cross-validation and strengthen the reliability of the observed trends. Over the EUS and WEU regions, the largest smoke AOD in summer could be explained by the highest emissions from forest and grassland fires (van der Werf et al., 2017). Over the ECC region, an additional peak occurs in March because agricultural residue burning makes a substantial contribution to total smoke emissions (van der Werf et al., 2017), and such burning takes place more frequently in March due to burning of crop residues left on the fields from the previous growing season (Shon, 2015).
This study investigated the seasonal variations of aerosol column loading, vertical distribution, and particle types using multiple satellite and ground-based observational datasets during 2007–2016 over EUS, WEU, and ECC regions. Retrievals from MISR and MODIS reveal that column AOD in all three regions peaks in spring/summer and reaches its low in winter, which is consistent with observations from AERONET. This seasonal pattern is probably explained by accelerated formation of secondary aerosols in spring/summer due to stronger insolation and higher temperature. In contrast, CALIPSO shows a much weaker seasonal variability in column AOD, probably because CALIPSO-retrieved AOD is weighted toward lower heights, as some thin aerosol layers in high levels are undetected due to insufficient detection sensitivity. Despite the discrepancy in integrated column AOD, CALIPSO does provide valuable information with respect to intra-annual variations of AOD as a function of height. Over the WEU and ECC regions, AODs of the vertical layers below 800 m generally peak in winter, while those above 800 m mostly peak in summer. For the EUS region, the maximum AOD above 800 m also occurs in summer; however, AOD below 800 m shows two peaks, one in summer and the other in winter. The seasonal variations of AOD at low heights are consistent with seasonal patterns of measured surface PM2.5 concentrations.
When aerosols are binned into different size ranges, the small-size AOD is much larger in spring/summer than in winter over all three regions. Large-size AOD generally shows rather uniform distributions, except for the ECC region where a peak occurs in spring, consistent with the largest dust AOD in this season. When aerosols are classified according to sources, the aerosols associated with anthropogenic air pollution (as well as mixtures of anthropogenic pollution and dust) are the dominant type in all three regions. AOD of polluted aerosols has a similar seasonal pattern as total AOD. Dust and clean marine aerosols in the WEU region peak in summer and winter, respectively, whereas they do not show an obvious seasonal pattern in the EUS region. Smoke aerosols, which CALIPSO indicates are predominantly located at heights above 800 m, present an obvious unimodal distribution with maximum occurring in summer over EUS and WEU regions, and a bimodal distribution with peaks in August and March over the ECC region. This pattern is in good agreement with the seasonal variations of absorbing AOD derived from MISR.
The combination of multiple satellite and ground-based observations facilitate a systematic and deeper understanding of the seasonal variations of aerosols, particularly their vertical and type distribution. Comparison of multiple measurement and retrieval methodologies enables reducing the uncertainties in the estimation of aerosol direct effects by providing improved information about aerosol vertical and type distributions, which significantly affect the aerosol-induced scattering and absorption of radiation. More importantly, the intra-annual variations of vertical distributions and types of aerosols are important for understanding their impact on atmospheric dynamics, cloud fields, and precipitation production (Ramanathan et al., 2005; Massie et al., 2016; Zhao et al., 2018a; Wang et al., 2013). Finally, the data and variation patterns presented in this study can be used to evaluate and improve model simulations, with the ultimate goal of improving model assessment of the climatic and health effects of aerosols.
The data needed to evaluate the results and conclusions have been presented in the text and figures. Additional related data will be available upon request.
JHJ and BZ designed the research; BZ, JHJ, YG, ZJ, LH, and YT conducted the research; BZ, JHJ, DJD, HS, YG, KNL, ZJ, XF, and AHO analyzed the results; BZ, JHJ, and YG wrote the paper with contributions from all coauthors.
The authors declare that they have no conflict of interest.
This study was supported by the MISR project at the Jet Propulsion
Laboratory, California Institute of Technology, under contract with NASA,
NASA CCST and TASNPP (Grant 80NSSC18K0985) programs, and NSF AGS-1701526. We
acknowledge Michael J. Garay and Jason L. Tackett for their valuable comments
and suggestions.
Edited by: Xiaohong
Liu
Reviewed by: two anonymous referees
Albrecht, B. A.: Aerosols, Cloud Microphysics, and Fractional Cloudiness, Science, 245, 1227–1230, https://doi.org/10.1126/science.245.4923.1227, 1989.
Anderson, T. L., Charlson, R. J., Winker, D. M., Ogren, J. A., and Holmen, K.: Mesoscale variations of tropospheric aerosols, J. Atmos. Sci., 60, 119–136, https://doi.org/10.1175/1520-0469(2003)060<0119:Mvota>2.0.Co;2, 2003.
Bull, M., Matthews, J., McDonald, D., Menzies, A., Moroney, C., Mueller, K., Paradise, S., and Smyth, M.: MISR Data Products Specifications Revision S, available at: https://eosweb.larc.nasa.gov/sites/default/files/project/misr/DPS_v50_RevS.pdf (last access: 30 September 2017), Jet Propulsion Laboratory, California Institute of Technology, 2011.
Cheng, Z., Wang, S. X., Jiang, J. K., Fu, Q. Y., Chen, C. H., Xu, B. Y., Yu, J. Q., Fu, X., and Hao, J. M.: Long-term trend of haze pollution and impact of particulate matter in the Yangtze River Delta, China, Environ. Pollut., 182, 101–110, https://doi.org/10.1016/j.envpol.2013.06.043, 2013.
Chin, M., Diehl, T., Tan, Q., Prospero, J. M., Kahn, R. A., Remer, L. A., Yu, H., Sayer, A. M., Bian, H., Geogdzhayev, I. V., Holben, B. N., Howell, S. G., Huebert, B. J., Hsu, N. C., Kim, D., Kucsera, T. L., Levy, R. C., Mishchenko, M. I., Pan, X., Quinn, P. K., Schuster, G. L., Streets, D. G., Strode, S. A., Torres, O., and Zhao, X.-P.: Multi-decadal aerosol variations from 1980 to 2009: a perspective from observations and a global model, Atmos. Chem. Phys., 14, 3657–3690, https://doi.org/10.5194/acp-14-3657-2014, 2014.
China Meteorological Administration: Sand-dust weather almanac 2010, China Meteorological Press, Beijing, 2012.
Colarco, P. R., Kahn, R. A., Remer, L. A., and Levy, R. C.: Impact of satellite viewing-swath width on global and regional aerosol optical thickness statistics and trends, Atmos. Meas. Tech., 7, 2313–2335, https://doi.org/10.5194/amt-7-2313-2014, 2014.
de Meij, A., Pozzer, A., and Lelieveld, J.: Trend analysis in aerosol optical depths and pollutant emission estimates between 2000 and 2009, Atmos. Environ., 51, 75–85, https://doi.org/10.1016/j.atmosenv.2012.01.059, 2012.
de Reus, M., Strom, J., Curtius, J., Pirjola, L., Vignati, E., Arnold, F., Hansson, H. C., Kulmala, M., Lelieveld, J., and Raes, F.: Aerosol production and growth in the upper free troposphere, J. Geophys. Res.-Atmos., 105, 24751–24762, https://doi.org/10.1029/2000jd900382, 2000.
Diner, D. J., Beckert, J. C., Reilly, T. H., Bruegge, C. J., Conel, J. E., Kahn, R. A., Martonchik, J. V., Ackerman, T. P., Davies, R., Gerstl, S. A. W., Gordon, H. R., Muller, J. P., Myneni, R. B., Sellers, P. J., Pinty, B., and Verstraete, M. M.: Multi-angle Imaging SpectroRadiometer (MISR) – Instrument description and experiment overview, IEEE. T. Geosci. Remote., 36, 1072–1087, https://doi.org/10.1109/36.700992, 1998.
Dubovik, O., Holben, B., Eck, T. F., Smirnov, A., Kaufman, Y. J., King, M. D., Tanre, D., and Slutsker, I.: Variability of absorption and optical properties of key aerosol types observed in worldwide locations, J. Atmos. Sci., 59, 590–608, https://doi.org/10.1175/1520-0469(2002)059<0590:voaaop>2.0.co;2, 2002.
Eck, T. F., Holben, B. N., Reid, J. S., Dubovik, O., Smirnov, A., O'Neill, N. T., Slutsker, I., and Kinne, S.: Wavelength dependence of the optical depth of biomass burning, urban, and desert dust aerosols, J. Geophys. Res.-Atmos., 104, 31333–31349, https://doi.org/10.1029/1999jd900923, 1999.
Fan, X. H., Xia, X. A., and Chen, H. B.: Can MODIS Detect Trends in Aerosol Optical Depth Over Land?, Adv. Atmos. Sci., 34, 1–11, 2018.
Garrett, T. J. and Zhao, C. F.: Increased Arctic cloud longwave emissivity associated with pollution from mid-latitudes, Nature, 440, 787–789, https://doi.org/10.1038/nature04636, 2006.
Garrett, T. J., Zhao, C., Dong, X., Mace, G. G., and Hobbs, P. V.: Effects of varying aerosol regimes on low-level Arctic stratus, Geophys. Res. Lett., 31, L17105, https://doi.org/10.1029/2004gl019928, 2004.
Garrett, T. J., Zhao, C., and Novelli, P. C.: Assessing the relative contributions of transport efficiency and scavenging to seasonal variability in Arctic aerosol, Tellus B, 62, 190–196, https://doi.org/10.1111/j.1600-0889.2010.00453.x, 2010.
Gu, Y., Liou, K. N., Xue, Y., Mechoso, C. R., Li, W., and Luo, Y.: Climatic effects of different aerosol types in China simulated by the UCLA general circulation model, J. Geophys. Res.-Atmos., 111, D15201, https://doi.org/10.1029/2005jd006312, 2006.
Guan, H., Schmid, B., Bucholtz, A., and Bergstrom, R.: Sensitivity of shortwave radiative flux density, forcing, and heating rate to the aerosol vertical profile, J. Geophys. Res.-Atmos., 115, D06209, https://doi.org/10.1029/2009jd012907, 2010.
Guo, J., Miao, Y., Zhang, Y., Liu, H., Li, Z., Zhang, W., He, J., Lou, M., Yan, Y., Bian, L., and Zhai, P.: The climatology of planetary boundary layer height in China derived from radiosonde and reanalysis data, Atmos. Chem. Phys., 16, 13309–13319, https://doi.org/10.5194/acp-16-13309-2016, 2016.
Heald, C. L., Jacob, D. J., Park, R. J., Russell, L. M., Huebert, B. J., Seinfeld, J. H., Liao, H., and Weber, R. J.: A large organic aerosol source in the free troposphere missing from current models, Geophys. Res. Lett., 32, L18809, DOI 10.1029/2005gl023831, 2005.
Holben, B. N., Tanre, D., Smirnov, A., Eck, T. F., Slutsker, I., Abuhassan, N., Newcomb, W. W., Schafer, J. S., Chatenet, B., Lavenu, F., Kaufman, Y. J., Castle, J. V., Setzer, A., Markham, B., Clark, D., Frouin, R., Halthore, R., Karneli, A., O'Neill, N. T., Pietras, C., Pinker, R. T., Voss, K., and Zibordi, G.: An emerging ground-based aerosol climatology: Aerosol optical depth from AERONET, J. Geophys. Res.-Atmos., 106, 12067–12097, https://doi.org/10.1029/2001jd900014, 2001.
Huang, L., Jiang, J. H., Tackett, J. L., Su, H., and Fu, R.: Seasonal and diurnal variations of aerosol extinction profile and type distribution from CALIPSO 5-year observations, J. Geophys. Res.-Atmos., 118, 4572–4596, https://doi.org/10.1002/jgrd.50407, 2013.
IPCC: Climate Change 2013: The Physical Science Basis. Contribution of Working Group I to the Fifth Assessment Report of the Intergovernmental Panel on Climate Change, edited by: Stocker, T. F., Qin, D., Plattner, G.-K., Tignor, M., Allen, S. K., Boschung, J., Nauels, A., Xia, Y., Bex, V., and Midgley, P. M., Cambridge University Press, Cambridge, UK and New York, NY, USA, 1535 pp., 2013.
Johnson, B. T., Shine, K. P., and Forster, P. M.: The semi-direct aerosol effect: Impact of absorbing aerosols on marine stratocumulus, Q. J. Roy. Meteor. Soc., 130, 1407–1422, https://doi.org/10.1256/qj.03.61, 2004.
Johnson, B. T., Heese, B., McFarlane, S. A., Chazette, P., Jones, A., and Bellouin, N.: Vertical distribution and radiative effects of mineral dust and biomass burning aerosol over West Africa during DABEX, J. Geophys. Res.-Atmos., 113, D00C12, https://doi.org/10.1029/2008jd009848, 2008.
Kahn, R., Banerjee, P., and McDonald, D.: Sensitivity of multiangle imaging to natural mixtures of aerosols over ocean, J. Geophys. Res.-Atmos., 106, 18219–18238, https://doi.org/10.1029/2000jd900497, 2001.
Kahn, R. A. and Gaitley, B. J.: An analysis of global aerosol type as retrieved by MISR, J. Geophys. Res.-Atmos., 120, 4248–4281, https://doi.org/10.1002/2015jd023322, 2015.
Kahn, R. A., Gaitley, B. J., Martonchik, J. V., Diner, D. J., Crean, K. A., and Holben, B.: Multiangle Imaging Spectroradiometer (MISR) global aerosol optical depth validation based on 2 years of coincident Aerosol Robotic Network (AERONET) observations, J. Geophys. Res.-Atmos., 110, D10S04, https://doi.org/10.1029/2004jd004706, 2005.
Kahn, R. A., Nelson, D. L., Garay, M. J., Levy, R. C., Bull, M. A., Diner, D. J., Martonchik, J. V., Paradise, S. R., Hansen, E. G., and Remer, L. A.: MISR Aerosol Product Attributes and Statistical Comparisons With MODIS, IEEE. T. Geosci. Remote., 47, 4095–4114, https://doi.org/10.1109/tgrs.2009.2023115, 2009.
Kahn, R. A., Gaitley, B. J., Garay, M. J., Diner, D. J., Eck, T. F., Smirnov, A., and Holben, B. N.: Multiangle Imaging SpectroRadiometer global aerosol product assessment by comparison with the Aerosol Robotic Network, J. Geophys. Res.-Atmos., 115, D23209, https://doi.org/10.1029/2010jd014601, 2010.
Kang, N., Kumar, K. R., Hu, K., Yu, X. N., and Yin, Y.: Long-term (2002–2014) evolution and trend in Collection 5.1 Level-2 aerosol products derived from the MODIS and MISR sensors over the Chinese Yangtze River Delta, Atmos. Res., 181, 29–43, https://doi.org/10.1016/j.atmosres.2016.06.008, 2016.
Kim, M.-H., Omar, A. H., Vaughan, M. A., Winker, D. M., Trepte, C. R., Hu, Y., Liu, Z., and Kim, S.-W.: Quantifying the low bias of CALIPSO's column aerosol optical depth due to undetected aerosol layers, J. Geophys. Res.-Atmos., 122, 1098–1113, https://doi.org/10.1002/2016jd025797, 2017.
Kim, S. W., Yoon, S. C., Kim, J., and Kim, S. Y.: Seasonal and monthly variations of columnar aerosol optical properties over east Asia determined from multi-year MODIS, LIDAR, and AERONET Sun/sky radiometer measurements, Atmos. Environ., 41, 1634–1651, https://doi.org/10.1016/j.atmosenv.2006.10.044, 2007.
King, M. D., Menzel, W. P., Kaufman, Y. J., Tanre, D., Gao, B. C., Platnick, S., Ackerman, S. A., Remer, L. A., Pincus, R., and Hubanks, P. A.: Cloud and aerosol properties, precipitable water, and profiles of temperature and water vapor from MODIS, IEEE. T. Geosci. Remote., 41, 442–458, https://doi.org/10.1109/Tgrs.2002.808226, 2003.
Kirchstetter, T. W. and Thatcher, T. L.: Contribution of organic carbon to wood smoke particulate matter absorption of solar radiation, Atmos. Chem. Phys., 12, 6067–6072, https://doi.org/10.5194/acp-12-6067-2012, 2012.
Lelieveld, J., Evans, J. S., Fnais, M., Giannadaki, D., and Pozzer, A.: The contribution of outdoor air pollution sources to premature mortality on a global scale, Nature, 525, 367–371, https://doi.org/10.1038/nature15371, 2015.
Levy, R. C., Remer, L. A., Kleidman, R. G., Mattoo, S., Ichoku, C., Kahn, R., and Eck, T. F.: Global evaluation of the Collection 5 MODIS dark-target aerosol products over land, Atmos. Chem. Phys., 10, 10399–10420, https://doi.org/10.5194/acp-10-10399-2010, 2010.
Li, S. S., Garay, M. J., Chen, L. F., Rees, E., and Liu, Y.: Comparison of GEOS-Chem aerosol optical depth with AERONET and MISR data over the contiguous United States, J. Geophys. Res.-Atmos., 118, 11228–11241, https://doi.org/10.1002/jgrd.50867, 2013.
Li, S. S., Yu, C., Chen, L. F., Tao, J. H., Letu, H., Ge, W., Si, Y. D., and Liu, Y.: Inter-comparison of model-simulated and satellite-retrieved componential aerosol optical depths in China, Atmos. Environ., 141, 320–332, https://doi.org/10.1016/j.atmosenv.2016.06.075, 2016.
Liu, J. J., Zheng, Y. F., Li, Z. Q., Flynn, C., and Cribb, M.: Seasonal variations of aerosol optical properties, vertical distribution and associated radiative effects in the Yangtze Delta region of China, J. Geophys. Res.-Atmos., 117, D00K38, https://doi.org/10.1029/2011jd016490, 2012.
Ma, X., Bartlett, K., Harmon, K., and Yu, F.: Comparison of AOD between CALIPSO and MODIS: significant differences over major dust and biomass burning regions, Atmos. Meas. Tech., 6, 2391–2401, https://doi.org/10.5194/amt-6-2391-2013, 2013.
Ma, X. Y., Yu, F. Q., and Quaas, J.: Reassessment of satellite-based estimate of aerosol climate forcing, J. Geophys. Res.-Atmos., 119, 10394–10409, https://doi.org/10.1002/2014jd021670, 2014.
Manders, A. M. M., Schaap, M., Jozwicka, M., van Arkel, F., Weijers, E. P., and Matthijsen, J.: The contribution of sea salt to PM10 and PM2.5 in the Netherlands. Netherlands Research Program on Particulate Matter, Report 500099004, available at: http://www.pbl.nl/sites/default/files/cms/publicaties/500099004.pdf (last access: 30 September 2017), 2009.
Mao, K. B., Ma, Y., Xia, L., Chen, W. Y., Shen, X. Y., He, T. J., and Xu, T. R.: Global aerosol change in the last decade: An analysis based on MODIS data, Atmos. Environ., 94, 680–686, https://doi.org/10.1016/j.atmosenv.2014.04.053, 2014.
Massie, S. T., Delanoë, J., Bardeen, C. G., Jiang, J. H., and Huang, L.: Changes in the shape of cloud ice water content vertical structure due to aerosol variations, Atmos. Chem. Phys., 16, 6091–6105, https://doi.org/10.5194/acp-16-6091-2016, 2016.
Matthias, V., Balis, D., Bosenberg, J., Eixmann, R., Iarlori, M., Komguem, L., Mattis, I., Papayannis, A., Pappalardo, G., Perrone, M. R., and Wang, X.: Vertical aerosol distribution over Europe: Statistical analysis of Raman lidar data from 10 European Aerosol Research Lidar Network (EARLINET) stations, J. Geophys. Res.-Atmos., 109, D18201, https://doi.org/10.1029/2004jd004638, 2004.
McCormick, R. A. and Ludwig, J. H.: Climate Modification by Atmospheric Aerosols, Science, 156, 1358–1359, https://doi.org/10.1126/science.156.3780.1358, 1967.
Mehta, M., Singh, R., Singh, A., Singh, N., and Anshumali: Recent global aerosol optical depth variations and trends – A comparative study using MODIS and MISR level 3 datasets, Remote. Sens. Environ., 181, 137–150, https://doi.org/10.1016/j.rse.2016.04.004, 2016.
Mielonen, T., Arola, A., Komppula, M., Kukkonen, J., Koskinen, J., de Leeuw, G., and Lehtinen, K. E. J.: Comparison of CALIOP level 2 aerosol subtypes to aerosol types derived from AERONET inversion data, Geophys. Res. Lett., 36, L18804, https://doi.org/10.1029/2009gl039609, 2009.
Minguillon, M. C., Brines, M., Perez, N., Reche, C., Pandolfi, M., Fonseca, A. S., Amato, F., Alastuey, A., Lyasota, A., Codina, B., Lee, H. K., Eun, H. R., Ahn, K. H., and Querol, X.: New particle formation at ground level and in the vertical column over the Barcelona area, Atmos. Res., 164, 118–130, https://doi.org/10.1016/j.atmosres.2015.05.003, 2015.
NASA CALIPSO team: CALIPSO Quality Statements Lidar Level 3 Aerosol Profile Monthly Products Version Release: 1.00, availabe at: https://eosweb.larc.nasa.gov/PRODOCS/calipso/Quality_Summaries/CALIOP_L3AProProducts_1-00.html (last access: 23 November 2017), 2011.
Niu, F. and Li, Z.: Systematic variations of cloud top temperature and precipitation rate with aerosols over the global tropics, Atmos. Chem. Phys., 12, 8491–8498, https://doi.org/10.5194/acp-12-8491-2012, 2012.
Omar, A. H., Winker, D. M., Kittaka, C., Vaughan, M. A., Liu, Z., Hu, Y., Trepte, C. R., Rogers, R. R., Ferrare, R. A., Lee, K.-P., Kuehn, R. E., and Hostetler, C. A.: The CALIPSO Automated Aerosol Classification and Lidar Ratio Selection Algorithm, J. Atmos. Ocean. Tech., 26, 1994–2014, https://doi.org/10.1175/2009jtecha1231.1, 2009.
Qi, Y. L., Ge, J. M., and Huang, J. P.: Spatial and temporal distribution of MODIS and MISR aerosol optical depth over northern China and comparison with AERONET, Chinese. Sci. Bull., 58, 2497, https://doi.org/10.1007/s11434-013-5678-5, 2013.
Ramanathan, V., Chung, C., Kim, D., Bettge, T., Buja, L., Kiehl, J. T., Washington, W. M., Fu, Q., Sikka, D. R., and Wild, M.: Atmospheric brown clouds: Impacts on South Asian climate and hydrological cycle, P. Natl. Acad. Sci. USA., 102, 5326–5333, https://doi.org/10.1073/pnas.0500656102, 2005.
Ramanathan, V., Ramana, M. V., Roberts, G., Kim, D., Corrigan, C., Chung, C., and Winker, D.: Warming trends in Asia amplified by brown cloud solar absorption, Nature, 448, 575–575, https://doi.org/10.1038/nature06019, 2007.
Remer, L. A., Kaufman, Y. J., Tanre, D., Mattoo, S., Chu, D. A., Martins, J. V., Li, R. R., Ichoku, C., Levy, R. C., Kleidman, R. G., Eck, T. F., Vermote, E., and Holben, B. N.: The MODIS aerosol algorithm, products, and validation, J. Atmos. Sci., 62, 947–973, Doi 10.1175/Jas3385.1, 2005.
Rosenfeld, D., Lohmann, U., Raga, G. B., O'Dowd, C. D., Kulmala, M., Fuzzi, S., Reissell, A., and Andreae, M. O.: Flood or drought: How do aerosols affect precipitation?, Science, 321, 1309–1313, https://doi.org/10.1126/science.1160606, 2008.
Ruiz-Arias, J. A., Dudhia, J., Gueymard, C. A., and Pozo-Vázquez, D.: Assessment of the Level-3 MODIS daily aerosol optical depth in the context of surface solar radiation and numerical weather modeling, Atmos. Chem. Phys., 13, 675–692, https://doi.org/10.5194/acp-13-675-2013, 2013.
Schuster, G. L., Vaughan, M., MacDonnell, D., Su, W., Winker, D., Dubovik, O., Lapyonok, T., and Trepte, C.: Comparison of CALIPSO aerosol optical depth retrievals to AERONET measurements, and a climatology for the lidar ratio of dust, Atmos. Chem. Phys., 12, 7431–7452, https://doi.org/10.5194/acp-12-7431-2012, 2012.
Seinfeld, J. H. and Pandis, S. N.: Atmospheric Chemistry and Physics, from air pollution to climate change, John Wiley & Sons, Inc., Hoboken, New Jersey, 2006.
Shindell, D. T., Faluvegi, G., Koch, D. M., Schmidt, G. A., Unger, N., and Bauer, S. E.: Improved Attribution of Climate Forcing to Emissions, Science, 326, 716–718, https://doi.org/10.1126/science.1174760, 2009.
Shon, Z. H.: Long-term variations in PM2.5 emission from open biomass burning in Northeast Asia derived from satellite-derived data for 2000–2013, Atmos. Environ., 107, 342–350, https://doi.org/10.1016/j.atmosenv.2015.02.038, 2015.
Song, C. K., Ho, C. H., Park, R. J., Choi, Y. S., Kim, J., Gong, D. Y., and Lee, Y. B.: Spatial and Seasonal Variations of Surface PM10 Concentration and MODIS Aerosol Optical Depth over China, Asia-Pac, J. Atmos. Sci., 45, 33–43, 2009.
Song, S. K., Shon, Z. H., and Park, Y. H.: Diurnal and seasonal characteristics of the optical properties and direct radiative forcing of different aerosol components in Seoul megacity, Sci. Total. Environ., 599, 400–412, https://doi.org/10.1016/j.scitotenv.2017.04.195, 2017.
Stafoggia, M., Zauli-Sajani, S., Pey, J., Samoli, E., Alessandrini, E., Basagana, X., Cernigliaro, A., Chiusolo, M., Demaria, M., Diaz, J., Faustini, A., Katsouyanni, K., Kelessis, A. G., Linares, C., Marchesi, S., Medina, S., Pandolfi, P., Perez, N., Querol, X., Randi, G., Ranzi, A., Tobias, A., Forastiere, F., Angelini, P., Berti, G., Bisanti, L., Cadum, E., Catrambone, M., Davoli, M., de'Donato, F., Gandini, M., Grosa, M., Ferrari, S., Pelosini, R., Perrino, C., Pietrodangelo, A., Pizzi, L., Poluzzi, V., Priod, G., Rowinski, M., Scarinzi, C., Stivanello, E., Dimakopoulou, K., Elefteriadis, K., Kelessis, A., Maggos, T., Michalopoulos, N., Pateraki, S., Petrakakis, M., Rodopoulou, S., Sypsa, V., Agis, D., Alguacil, J., Artinano, B., Barrera-Gomez, J., de la Rosa, J., Fernandez, R., Jacquemin, B., Karanasiou, A., Ostro, B., Salvador, P., Sanchez, A. M., Sunyer, J., Bidondo, M., Declercq, C., Le Tertre, A., Lozano, P., Pascal, L., Pascal, M., and Grp, M.-P. S.: Desert Dust Outbreaks in Southern Europe: Contribution to Daily PM10 Concentrations and Short-Term Associations with Mortality and Hospital Admissions, Environ. Health. Persp., 124, 413–419, https://doi.org/10.1289/ehp.1409164, 2016.
Thorsen, T. J., Ferrare, R. A., Hostetler, C. A., Vaughan, M. A., and Fu, Q.: The impact of lidar detection sensitivity on assessing aerosol direct radiative effects, Geophys. Res. Lett., 44, 9059–9067, https://doi.org/10.1002/2017gl074521, 2017.
Tian, P., Cao, X., Zhang, L., Sun, N., Sun, L., Logan, T., Shi, J., Wang, Y., Ji, Y., Lin, Y., Huang, Z., Zhou, T., Shi, Y., and Zhang, R.: Aerosol vertical distribution and optical properties over China from long-term satellite and ground-based remote sensing, Atmos. Chem. Phys., 17, 2509–2523, https://doi.org/10.5194/acp-17-2509-2017, 2017.
Timonen, H., Aurela, M., Carbone, S., Saarnio, K., Frey, A., Saarikoski, S., Teinila, K., Kulmala, M., and Hillamo, R.: Seasonal and diurnal changes in inorganic ions, carbonaceous matter and mass in ambient aerosol particles in an urban, background area, Boreal Environ. Res., 19, 71–86, 2014.
Twomey, S.: Influence of pollution on shortwave albedo of clouds, J. Atmos. Sci., 34, 1149–1152, https://doi.org/10.1175/1520-0469(1977)034<1149:tiopot>2.0.co;2, 1977.
Unger, N., Shindell, D. T., Koch, D. M., and Streets, D. G.: Air pollution radiative forcing from specific emissions sectors at 2030, J. Geophys. Res.-Atmos., 113, D02306, https://doi.org/10.1029/2007jd008683, 2008.
USEPA: National Ambient Air Quality Standards Table, available at: https://www.epa.gov/criteria-air-pollutants/naaqs-table (last access: 2 April 2018), 2015.
van der Werf, G. R., Randerson, J. T., Giglio, L., van Leeuwen, T. T., Chen, Y., Rogers, B. M., Mu, M., van Marle, M. J. E., Morton, D. C., Collatz, G. J., Yokelson, R. J., and Kasibhatla, P. S.: Global fire emissions estimates during 1997–2016, Earth Syst. Sci. Data, 9, 697–720, https://doi.org/10.5194/essd-9-697-2017, 2017.
Wang, J. D., Zhao, B., Wang, S. X., Yang, F. M., Xing, J., Morawska, L., Ding, A. J., Kulmala, M., Kerminen, V. M., Kujansuu, J., Wang, Z. F., Ding, D. A., Zhang, X. Y., Wang, H. B., Tian, M., Petaja, T., Jiang, J. K., and Hao, J. M.: Particulate matter pollution over China and the effects of control policies, Sci. Total. Environ., 584, 426–447, https://doi.org/10.1016/j.scitotenv.2017.01.027, 2017.
Wang, S. X., Zhao, B., Cai, S. Y., Klimont, Z., Nielsen, C. P., Morikawa, T., Woo, J. H., Kim, Y., Fu, X., Xu, J. Y., Hao, J. M., and He, K. B.: Emission trends and mitigation options for air pollutants in East Asia, Atmos. Chem. Phys., 14, 6571–6603, https://doi.org/10.5194/acp-14-6571-2014, 2014.
Wang, Y. and Zhao, C. F.: Can MODIS cloud fraction fully represent the diurnal and seasonal variations at DOE ARM SGP and Manus sites?, J. Geophys. Res.-Atmos., 122, 329–343, https://doi.org/10.1002/2016jd025954, 2017.
Wang, Y., Khalizov, A., Levy, M., and Zhang, R. Y.: New Directions: Light absorbing aerosols and their atmospheric impacts, Atmos. Environ., 81, 713–715, https://doi.org/10.1016/j.atmosenv.2013.09.034, 2013.
Winker, D. M., Hunt, W. H., and McGill, M. J.: Initial performance assessment of CALIOP, Geophys. Res. Lett., 34, L19803, https://doi.org/10.1029/2007gl030135, 2007.
Yang, X., Zhao, C. F., Zhou, L. J., Wang, Y., and Liu, X. H.: Distinct impact of different types of aerosols on surface solar radiation in China, J. Geophys. Res.-Atmos., 121, 6459–6471, https://doi.org/10.1002/2016jd024938, 2016.
Yang, X., Zhao, C., Zhou, L., Li, Z., Cribbc, M., and Yang, S.: Wintertime cooling and a potential connection with transported aerosols in Hong Kong during recent decades, Atmos. Res., 211, 52–61, 2018.
Yu, H. B., Chin, M., Winker, D. M., Omar, A. H., Liu, Z. Y., Kittaka, C., and Diehl, T.: Global view of aerosol vertical distributions from CALIPSO lidar measurements and GOCART simulations: Regional and seasonal variations, J. Geophys. Res.-Atmos., 115, D00H30, https://doi.org/10.1029/2009jd013364, 2010.
Zhang, L., Li, Q. B., Gu, Y., Liou, K. N., and Meland, B.: Dust vertical profile impact on global radiative forcing estimation using a coupled chemical-transport-radiative-transfer model, Atmos. Chem. Phys., 13, 7097–7114, https://doi.org/10.5194/acp-13-7097-2013, 2013.
Zhao, B., Wang, S. X., Donahue, N. M., Jathar, S. H., Huang, X. F., Wu, W. J., Hao, J. M., and Robinson, A. L.: Quantifying the effect of organic aerosol aging and intermediate-volatility emissions on regional-scale aerosol pollution in China, Sci. Rep-Uk., 6, 28815, https://doi.org/10.1038/srep28815, 2016.
Zhao, B., Jiang, J. H., Gu, Y., Diner, D., Worden, J., Liou, K. N., Su, H., Xing, J., Garay, M., and Huang, L.: Decadal-scale trends in regional aerosol particle properties and their linkage to emission changes, Environ. Res. Lett., 12, 054021, https://doi.org/10.1088/1748-9326/aa6cb2, 2017.
Zhao, B., Gu, Y., Liou, K. N., Wang, Y., Liu, X., Huang, L., Jiang, J. H., and Su, H.: Type-Dependent Responses of Ice Cloud Properties to Aerosols From Satellite Retrievals, Geophys. Res. Lett., 45, 3297–3306, https://doi.org/10.1002/2018GL077261, 2018a.
Zhao, B., Liou, K.-N., Gu, Y., Jiang, J. H., Li, Q., Fu, R., Huang, L., Liu, X., Shi, X., Su, H., and He, C.: Impact of aerosols on ice crystal size, Atmos. Chem. Phys., 18, 1065–1078, https://doi.org/10.5194/acp-18-1065-2018, 2018b.
Zhao, C. F., Qiu, Y. M., Dong, X. B., Wang, Z. E., Peng, Y. R., Li, B. D., Wu, Z. H., and Wang, Y.: Negative Aerosol-Cloud r(e) Relationship From Aircraft Observations Over Hebei, China, Earth Space Sci., 5, 19–29, https://doi.org/10.1002/2017ea000346, 2018c.
Zheng, C. W., Zhao, C. F., Zhu, Y. N., Wang, Y., Shi, X. Q., Wu, X. L., Chen, T. M., Wu, F., and Qiu, Y. M.: Analysis of influential factors for the relationship between PM2.5 and AOD in Beijing, Atmos. Chem. Phys., 17, 13473–13489, 10.5194/acp-17-13473-2017, 2017.