the Creative Commons Attribution 4.0 License.
the Creative Commons Attribution 4.0 License.
 | 25 Jul 2018
Status and future of numerical atmospheric aerosol prediction with a focus on data requirements
Jeffrey S. Reid
Peter Knippertz
John H. Marsham
Francesca Di Giuseppe
Samuel Rémy
Sara Basart
Olivier Boucher
Ian M. Brooks
Laurent Menut
Lucia Mona
Paolo Laj
Gelsomina Pappalardo
Alfred Wiedensohler
Alexander Baklanov
Malcolm Brooks
Peter R. Colarco
Emilio Cuevas
Arlindo da Silva
Jeronimo Escribano
Johannes Flemming
Nicolas Huneeus
Oriol Jorba
Stelios Kazadzis
Stefan Kinne
Thomas Popp
Patricia K. Quinn
Thomas T. Sekiyama
Taichu Tanaka
Enric Terradellas
Numerical prediction of aerosol particle properties has become an important activity at many research and operational weather centers. This development is due to growing interest from a diverse set of stakeholders, such as air quality regulatory bodies, aviation and military authorities, solar energy plant managers, climate services providers, and health professionals. Owing to the complexity of atmospheric aerosol processes and their sensitivity to the underlying meteorological conditions, the prediction of aerosol particle concentrations and properties in the numerical weather prediction (NWP) framework faces a number of challenges. The modeling of numerous aerosol-related parameters increases computational expense. Errors in aerosol prediction concern all processes involved in the aerosol life cycle including (a) errors on the source terms (for both anthropogenic and natural emissions), (b) errors directly dependent on the meteorology (e.g., mixing, transport, scavenging by precipitation), and (c) errors related to aerosol chemistry (e.g., nucleation, gas–aerosol partitioning, chemical transformation and growth, hygroscopicity). Finally, there are fundamental uncertainties and significant processing overhead in the diverse observations used for verification and assimilation within these systems. Indeed, a significant component of aerosol forecast development consists in streamlining aerosol-related observations and reducing the most important errors through model development and data assimilation. Aerosol particle observations from satellite- and ground-based platforms have been crucial to guide model development of the recent years and have been made more readily available for model evaluation and assimilation. However, for the sustainability of the aerosol particle prediction activities around the globe, it is crucial that quality aerosol observations continue to be made available from different platforms (space, near surface, and aircraft) and freely shared. This paper reviews current requirements for aerosol observations in the context of the operational activities carried out at various global and regional centers. While some of the requirements are equally applicable to aerosol–climate, the focus here is on global operational prediction of aerosol properties such as mass concentrations and optical parameters. It is also recognized that the term “requirements” is loosely used here given the diversity in global aerosol observing systems and that utilized data are typically not from operational sources. Most operational models are based on bulk schemes that do not predict the size distribution of the aerosol particles. Others are based on a mix of “bin” and bulk schemes with limited capability of simulating the size information. However the next generation of aerosol operational models will output both mass and number density concentration to provide a more complete description of the aerosol population. A brief overview of the state of the art is provided with an introduction on the importance of aerosol prediction activities. The criteria on which the requirements for aerosol observations are based are also outlined. Assimilation and evaluation aspects are discussed from the perspective of the user requirements.
- Article
(1020 KB) - Full-text XML
- BibTeX
- EndNote


Over the last 2 decades, the concept of global observing systems and the importance of defining user requirements for the purpose of monitoring and forecasting elements of the Earth system have gained momentum. This also applies to atmospheric composition in general and aerosol in particular with the studies of Barrie et al. (2004) for atmospheric composition monitoring, Reid et al. (2011) for operational aerosol forecasting, Benedetti et al. (2011) for operational verification of aerosol properties, and Colarco et al. (2014) for the use of Earth Observing System data for aerosol operational systems. Indeed, at the time of writing this document, there are at least nine operational centers producing and distributing real-time global aerosol forecasting products, including ECMWF Copernicus Atmosphere Monitoring Service (CAMS), Finnish Meteorological Institute (FMI), Fleet Numerical Meteorology and Oceanography Center (FNMOC), Japan Meteorological Agency (JMA), NOAA National Centers for Environmental Prediction (NCEP), and UK Met Office. In addition, there are numerous quasi-operational centers generating near-real-time (NRT) data streams and forecasts, including the Barcelona Supercomputing Center (BSC), Météo-France, and NASA's Global Modeling and Assimilation Office (GMAO). Each of these centers has its own internal requirements for data to support data assimilation, evaluation, development, and ultimately user-specific product delivery of their aerosol forecasting programs. Commissioned by the World Meteorological Organization (WMO), this document outlines the requirements of the aerosol prediction system developers (the data “user” in this context). It has been compiled through consultation with experts in aerosol modeling, assimilation, and evaluation from both the operational centers and the aerosol research community. However, it was recognized from the onset that compositional forecasting is in its infancy relative to its well-matured numerical weather prediction (NWP) predecessor, with a high dependence on nonoperational data sources and diversity in modeled parameters and architecture. Even functional definitions differ among developers. At the same time, the compositional community is aware of mainstream NWP's own requirement challenges for observations, architecture, distribution, formats, quality assurance, etc., all with far fewer degrees of freedom than the atmospheric composition community faces. Therefore we see this document as the beginning of an evolutionary process towards more specific technical requirements in the future.
1.1 Context and needs of the numerical atmospheric composition prediction community
Numerical atmospheric aerosol prediction (NAAP) is still an activity in its infancy, born largely from the global climate and air quality communities. It is a sub-component of the larger and far more mature field of NWP, and as such, it is reasonable to expect that NAAP will follow the overall architecture and best practices set up by the NWP community. This includes, in particular, best practices in using and setting requirements for observational data. Just as there are requirements for radiosonde releases and weather station data transmission, one would expect similar considerations for parameters such as PM10 (total mass of particles with an aerodynamic diameter of less than 10 µm), PM2.5 (total mass of particles with an aerodynamic diameter of less than 2.5 µm), and other key parameters such as aerosol optical depth (AOD), extinction coefficient, mass concentrations of individual chemical components, and light scattering and absorption coefficients. To a large degree this type of data is already being collected in many countries around the world and intercalibration procedures are in place in existing surface networks. This said, it is acknowledged that even within the typical WMO meteorological feeds, there are differences in reporting practices among countries, long-standing biases in instrumentation deployed, and challenges to modernization (e.g., in commercial radiosonde products; Ingleby et al., 2016). There are, however, a number of additional unique challenges facing the NAAP community that should be addressed and integrated into the development of relevant global aerosol data streams. There is a long history of reporting and sharing meteorological data because it is understood to be of mutual benefit to all parties in the exchange, and with weather being considered an “act of nature” there is less political motive behind data policies. Atmospheric composition data, however, are often related to air quality through anthropogenic emissions of pollutants and thus have local regulatory or even international treaty ramifications. There can subsequently be some local hesitance to report unfavorable data, or at least to provide additional funding to ease its distribution. One exception is dust storms, and indeed reporting of dust observation and prediction is more mature than any other aerosol species, even though there are only a few ground stations in key source areas. Even so, the enhancement of dust production due to water policy decisions can be divisive. Compositional data collection can be far more expensive in equipment and analytical services and often difficult to calibrate. While NWP has suffered at times with diversity in, for example, commercial radiosonde providers and instrument efficacy (e.g., relative humidity), aerosol measurement has considerably more degrees of freedom in its measurement technology, overall maintenance, and reporting. Indeed, significant diversity exists in composition measurements including chemistry and size-related parameters, in particular in regard to carbonaceous species and the coarse mode, respectively (Bond and Bergstrom, 2006; Chow et al., 2007; Reid et al., 2003, 2006). While institutions such as the WMO, the United States Environmental Protection Agency (EPA), or the European Environment Agency (EEA) set benchmark levels for air quality monitoring, they are by no means universally applied. The research community is nevertheless making a huge effort to intercompare and standardize their measurements. However, it is another step for standardization to be universally applied. Furthermore, the ability to report with a given timeliness, critical for NAAP and NWP consumption alike, is related to measurement technology. A host of potential variables can be generated relating to mass, composition, optical properties, or microphysics. Deployed instruments and their locations are also constantly evolving. The authors of this paper are keenly aware of the difficulties associated with aerosol measurements and the efforts made to improve these. The requirements or recommendations made herein should not be interpreted as criticisms of the existing observing system but rather an acknowledgement of the current state of the field and as a means of moving forward. They are not meant to introduce more rigidity but rather should be interpreted for awareness and practicality. Given the early state of the field and diversity in development approaches and customer requirements at aerosol prediction centers, the community requires flexibility as it finds its way. Regardless of data type, whether in situ or from remote sensing, there are three guiding principles that should be considered.
-
Data should be easily accessible, publicly available, reasonably well documented, and, for baseline quantities, encoded into a similar format. Currently data distribution is diffuse and potential users have difficulty maintaining and evaluating global-scale data outside of the largest and most consistent networks (for example the NASA Aerosol Robotic Network (AERONET) sun photometer dataset; Holben et al., 1998). While long-term sites are preferred, the operational reality has been for a reduction in support for key supersites, such as Atmospheric Radiation Measurement (ARM) or Global Atmosphere Watch (GAW). Thus, future data distribution models could mimic meteorological data, for which observations are broadcast and consolidated for use (e.g., 6 or 12 hourly PM2.5 or PM10 data). However, care must be taken to avoid ongoing legacy issues in the current broadcast system.
-
Timeliness requirements also vary by center. Based on the consensus of centers, 3 h latency is preferred, and 6 h is adequate, especially for satellite products. There is nevertheless value in 12 h or even multiday delivery for evaluation and model refinement purposes, including surface particulate matter monitoring. Timeliness should be a goal, but not necessarily a requirement. This is especially true for compositional data requiring laboratory work for analysis.
-
Realistic error bars or error models must be provided. The operational community can easily cope with uncertain data, provided that uncertainty is known on a data point-by-data point basis. Indeed, error tolerances are strongly customer and application related.
Mindful of these considerations, specific issues and definitions of user requirements are addressed in the following subsections. Note that in this paper no mention is made of the volcanic ash aerosol system. While the prediction of this type of aerosol is essential for numerous applications, we believe that there is a need for a separate study dealing with specific requirements for volcanic ash aerosols. Several communities are dealing with this topic, for example the GAW Scientific Advisory Group (SAG) on volcanic ash, the GAW SAG on Modelling Applications (SAG-APP), the aerosol lidar networks and their confederation (e.g., Micro-Pulse Lidar Network, MPLNET; European Aerosol Research Lidar Network, EARLINET; GAW Aerosol Lidar Observation Network, GALION), and others. The AEROSOL Bulletin 3 available from WMO provides an overview of current efforts on this topic (available from WMO, https://library.wmo.int, last access: 15 July 2018).
1.2 The nature of user requirements
The notion of user requirements implies that the specific technology or science application has an underlying group or community that has an interest in using the data, be it data from an observational platform or simulations from a model. Communities use the data for their applications, and this (implicitly or explicitly) sets the requirements. One of the principles behind the development of user requirements implies that data requirements should be put forward by the relevant communities independently of the current technologies and systems available, with the overarching goal of supporting the applications of the community in question, for example weather prediction, ocean modeling, climate investigation, etc. Specifically for observation requirements, no consideration is given to what type of instruments, observing platforms, or data processing systems are necessary or even possible to meet them. Even though in practice it is not possible to make user requirements completely technology free and current availability of technology influences their formulation, it is a useful exercise to understand data gaps and also to establish if new observing systems can meet all or some of the user requirements. This process of formulating user requirements also establishes an important direct link between model developers and data providers. Many data products that are provided by environmental agencies or individual scientists end up not being in the model development–assimilation–assessment loop as they do not correspond with what is needed by the modelers (e.g., in terms of accessibility, timeliness, quality, or uncertainty). Vice versa, often model developers have unrealistic expectations, do not specify their priorities, and end up using only a subset of available observations. Dialogue between these two communities is what ultimately fosters progress on both sides. The requirements for observations are usually given in terms of the following criteria: (i) resolution (horizontal, vertical, and sometimes temporal), (ii) sampling (horizontal and vertical), (iii) frequency (how often a measurement is taken in time), (iv) timeliness (i.e., availability), (v) repetition cycle (how often the same area of the globe is observed), and most importantly (vi) uncertainty related to either the actual instrument accuracy and/or the algorithm used to perform the retrieval in the case of derived observations (for example AOD or total column ozone). Additionally, the user must specify what physical or chemical variables should be measured.
Resolution and sampling differ in that resolution relates to the area and time period of which a measurement is representative, whereas sampling indicates the distance between two successive measurements in both space and time. Frequency is related to the temporal sampling of an instrument, whereas repetition gives a measure of how often the same location is observed. For example, an instrument on a polar-orbiting satellite may have very high frequency but low repetition.
Uncertainty can be divided into accuracy, which relates to the bias of the measurement, and precision, which relates to the random error. For example, in the presence of biased observations, averaging more observations does not generally improve the accuracy, but may improve the precision. For each application, it is generally accepted that improved observations in terms of resolution, sampling, frequency, and accuracy, etc. against some baseline are generally more useful than coarser, less frequent, and less accurate counterpart observations. The latter, however, could still be useful. Some of the criteria may come into play depending on the particular area of application. For example, timeliness is a criterion which is not included in the requirements for climate research, whereas due to the constraints on the timely delivery of the forecasts, it is a crucial parameter for operational prediction and assimilation. The usefulness of an observation is dependent on the specific application and its availability. This is specified in the requirements by adding three values per criterion: the “goal”, the “threshold”, and the “breakthrough”. The goal is the value above which further improvement of the observation would not bring any significant improvement to the application. Goals may evolve depending on the progress of the application and the capacity to make better use of the observations. The threshold is the value below which the observation has no value for the given application. An example of a threshold requirement for assimilation is, for example, the timeliness of the data: observations that are delivered beyond a certain time (normally 3 to 6 h for NRT NWP applications) cannot be used in the analysis. The breakthrough is a value in between the goal and the threshold that, if achieved, would result in a significant improvement for the application under consideration. Of these three parameters the most elusive is the breakthrough because its value may change more drastically than the other two with system developments.
While the usefulness class of requirement is conceptually straightforward it is less so functionally and consequently can have an arbitrary nature in a rapidly developing field such as NAAP. Thus, while this document will provide examples of usefulness, there is a hesitation to be overly specific at this time. In particular, breakthrough and goal values for different variables are not independent: accurate measurements of one variable may lower the usefulness of another less accurately measured variable because the variables are related in the model. For instance AOD measurements become less valuable for surface monitoring if the full profile of the extinction coefficient becomes available with the required sampling and accuracy.
1.3 Rolling review of requirements and task team on observational requirements and satellite measurements
The WMO has developed a framework for different thematic areas such as global numerical weather prediction, high-resolution numerical weather prediction, nowcasting and very-short-range forecasting, ocean applications, and atmospheric chemistry, among others, to be reviewed periodically in terms of design and the implementation of various observing systems, using as guidance the user requirements set out by the relevant community (Barrie et al., 2004). This process is called the rolling review of requirements (RRR) and it involves several steps. For each application area, these steps are as follows: (i) a review of “technology-free” user requirements (i.e., not taking into account the available technology) for observations in one of the thematic areas, (ii) a review of current and future observing capabilities (space based and surface based), (iii) a critical review of whether the capabilities meet the requirements, and finally (iv) a statement of guidance based on the outcomes of the critical review. This statement of guidance is often called gap analysis as it shows whether the current observing system is suitable for the given application and what is needed in the future observing system in order for it to meet the requirements set out by the user community. To facilitate this process, the WMO maintains an online database on user requirements and observing system capabilities called Observing Systems Capability Analysis and Review Tool (OSCAR). Details on the RRR are provided in Eyre et al. (2013) and references therein.
Recently, the WMO GAW set up an ad hoc Task Team on Observational Requirements and Satellite Measurements as regards Atmospheric Composition and Related Physical Parameters (TT-ObsReq, http://www.wmo.int/pages/prog/arep/gaw/TaskTeamObsReq.html, last access: 12 July 2018) to review the user requirements specifically for atmospheric composition. Application areas related to atmospheric composition include (i) forecasting atmospheric composition, which covers applications from global to regional scales (≈10 km and coarser) with stringent timeliness requirements (NRT) to support operations such as sand and dust storm and chemical weather forecasts; (ii) monitoring atmospheric composition, which covers applications related to evaluating and analyzing changes (temporally and spatially) in atmospheric composition regionally and globally to support treaty monitoring, climatologies, and reanalyses, assessing trends in composition and emissions–fluxes, and to better understanding processes, using data of controlled quality (and with less stringent time requirements than needed for NRT). (iii) Providing atmospheric composition information to support services in urban and populated areas covers applications that target limited areas (with horizontal resolution of a few kilometers or smaller) and stringent timeliness requirements to support services related to weather–climate–pollution, such as air quality forecasting.
The WMO GAW TT-ObsReq also analyzed the role of atmospheric composition observations in support of the other WMO application areas (http://www.wmo.int/pages/prog/www/OSY/GOS-RRR.html, last access: 15 July 2018). After the second workshop of the TT-ObsReq (12–13 August 2014, Zürich), the committee identified key parameters needed for forecasting atmospheric composition. For aerosols these parameters were aerosol mass and size distribution (or at least mass in three fraction sizes: up to 1, 2.5, and 10 µm as it is common practice in air quality, speciation, and chemical composition, AOD at multiple wavelengths, absorption AOD (AAOD), ratio of vertically integrated mass to AOD, vertical distribution of aerosol extinction). Some of the parameters outlined for monitoring atmospheric composition may also be relevant to the operational prediction of aerosol particle properties, which is one of the application areas (forecasting atmospheric composition) and is the focus of this study. Because recommendations from the committee are technology free, they differ slightly from those identified by the Scientific Advisory Group on Aerosol (GAW report 227), which limits their recommendations to variables that can be directly measured.
Requirements are outlined based on what is needed for the fundamental components of an aerosol prediction system, which are (i) modeling processes (aerosol particle emissions, secondary production and removal), (ii) data assimilation (when present), and (iii) model evaluation. Section 2 briefly presents current operational and pre-operational aerosol systems at both global and regional scales. Section 3 describes the data needs and the requirements for emissions and removal processes, Sect. 4 outlines those for the assimilation component, and finally Sect. 5 describes those related to model evaluation. Section 6 summarizes those data needs and includes some final thoughts.
Several centers with operational or quasi-operational capabilities are currently running aerosol prediction systems. These are BSC, ECMWF, FMI, FNMOC–NRL, GMAO, JMA, Météo-France, NCEP, and the UK Met Office on the global level. There are also numerous regional models run by the above centers as well as for example the China Meteorological Agency (CMA), the Korea Meteorological Agency (KMA), the Institut national de l'environnement industriel et des risques (INERIS), and the Deutscher Wetterdienst (DWD), just to mention a few. These systems are used for various applications, including, but not exclusive to, global air quality forecasts (dust and biomass burning), operation impacts, boundary conditions for regional systems, and flight campaign planning (Chin et al., 2003). Each relies on different dynamical cores, advection solvers, and aerosol microphysics schemes that necessarily generate a large degree of diversity among the various models (see for example Ginoux, 2003). The range of horizontal and vertical resolutions across the models is also very diverse, as is inline versus offline architecture. In general, increasing resolution does not necessarily mean better model skills as it may request new tuning of parameters of subscale processes (e.g., orographic gravity wave drag), as well as larger ensemble runs due to high variability. While all centers are pursuing data assimilation, four have multiple species data assimilation capabilities (namely ECMWF, FNMOC/NRL, GMAO, and JMA), while the Met Office has a dust-only system with data assimilation. Methods in development vary from 2D-Var, 4D-Var, ensemble Kalman filter (EnKF), to hybrid schemes.
In recent years, aerosol forecasting centers have been turning to ensemble prediction to describe the future state of the aerosol fields from a probabilistic point of view. Multi-model consensus products have been developed to alleviate the shortcomings of individual aerosol forecast models while offering insight into the uncertainties and sensitivities associated with a single-model forecast. Examples include the International Cooperative for Aerosol Prediction (ICAP) Multi-Model Ensemble (ICAP-MME; Sessions et al. (2015) (http://www.nrlmry.navy.mil/aerosol/, last access: 18 July 2018) for global aerosol forecasts and the WMO Sand and Dust Storm Warning Advisory and Assessment System (SDS-WAS) North African and Middle East regional node for regional dust forecasting (http://sds-was.aemet.es/, last access: 16 July 2018; Terradellas, 2016). Both initiatives have demonstrated that simply collecting different forecasts in a single database and generating web pages with common plotting conventions is an effective tool for developers to assess and improve their forecasting systems. Use of ensemble forecast techniques is especially relevant for situations associated with unstable weather patterns, or in extreme conditions. Ensemble approaches are also known to have more skills at longer ranges (>3 days) for which the probabilistic approach provides more reliable information than a single model run due to the model error increasing over time. Moreover, an exhaustive comparison of different models with each other and against multi-model products as well as observations can reveal weaknesses of individual models and provide an assessment of model uncertainties in simulating the aerosol cycle. Multi-model ensembles also represent a paradigm shift in which offering the best product to the users as a collective scientific community becomes more important than competing for achieving the best forecast as individual centers. This new paradigm fosters collaboration and interaction and ultimately results in improvements in the individual models and in better final products.
A detailed description of the individual models is beyond the scope of this paper. For a review of the current systems that provide aerosol forecasts, some with focus on dust, see for example Benedetti et al. (2014) and Sessions et al. (2015). Ensemble systems are presented in Rubin et al. (2016) and Di Tomaso et al. (2017). An overview of regional aerosol forecasting systems can be found in Menut and Bessagnet (2010), Kukkonen et al. (2011), Zhang et al. (2012a, b), and Baklanov et al. (2014). In the rest of the paper, we will mainly focus on requirements for global models, acknowledging that regional (i.e., limited-area) models may have different sets of requirements, including additional boundary conditions. Regional ground-based networks can, for example, address some of those needs while not providing sufficient coverage for global models (e.g., AERONET DRAGON networks; Holben et al., 2018). Global observations can also be of use for regional applications but the requirement for the resolution, for example, may differ from that of a global model. In general most of the requirements below will apply to both global and regional models. Moreover, although some of the data requirements presented here are shared with aerosol models for climate applications, here we focus on numerical aerosol prediction at the short and medium ranges (up to 10 days). In this context we are essentially dealing with an initial and boundary condition problem for which the requirements for assimilation have high importance. For sub-seasonal to seasonal aerosol prediction, which is not dealt with here specifically, requirements for ocean state and variability as well requirements for the development of prognostic emissions models are also important. In the wider context of aerosol projections for climate prediction, the emphasis is much more on emissions scenarios and the requirements will consequently be different.
3.1 General concepts
Modeling of aerosol particle sources and sinks is of the utmost importance because these processes largely control the spatiotemporal distributions of aerosol particle concentrations and size distributions. In addition, in polluted environments, uncertainties are dominated by emissions, whereas in remote regions transport and aerosol processes control the uncertainty. For a given source strength, sinks also control the atmospheric residence times of aerosol particles, which is in turn a key indicator of long-range transport of aerosol species. A good representation of aerosol particle sources and sinks is particularly important to determine the overall analysis and forecast of particle mass, surface area, and number concentrations in regions with few observations for data assimilation. A discrepancy in aerosol sources and/or sink processes can cause a systematic drift in aerosol particle concentrations and AOD over the forecast range in a forecasting system with data assimilation. This is because often the data assimilation corrects for the bias in sources and/or sinks. This correction is often not retained in the subsequent forecast integration due to the fact that the model does not represent the emission and removal processes adequately. For this reason, it is useful to also set user requirements for source and sink observations of aerosol particles. Efforts to formulate aerosol data assimilation with emissions fluxes as well as or instead of mixing ratios as a control variable might have a role to play in correcting these forecast drifts, although such observations would remain important constraints in such a framework.
It is appropriate to differentiate sources of aerosols and aerosol precursors that are directly emitted by human activities from those (natural or anthropogenic) emissions that depend on natural processes. User requirements for directly emitted anthropogenic emissions can be articulated around the following criteria: accuracy, spatial resolution, temporal resolution, speciation, aerosol size distribution, and hygroscopicity. User requirements for emissions that depend on meteorological processes also include requirements for key meteorological and environmental quantities that control such emissions, for example winds and surface conditions or any other parameters that may lead to aerosol formation.
3.2 User requirements for desert mineral dust emissions
For a reliable prediction of mineral dust aerosol, sufficiently accurate knowledge of both the emitting soil and the deflating winds is needed. Both aspects suffer from insufficient observational constraints, creating a large challenge for quantitative emissions predictions. Important source regions globally include the Sahara–Sahel, southwest Asia–Middle East, Taklimakan–Gobi deserts of China, Australia, and the southwest United States–adjacent Mexico (Prospero et al., 2002). However, larger source regions show substantial fine structure and throughout the world there are also many individual sources such as in Patagonia, the Arctic plains, and countless dry or drying lake beds. Estimating dust emissions sources can also be performed with satellite data (for examples see Di Tomaso et al., 2017; Escribano et al., 2016, 2017; Huneeus et al., 2012; Schutgens et al., 2012; Yumimoto and Takemura, 2013).
Dust models typically employ maps of dust source functions (e.g., Ginoux et al., 2012; Zender et al., 2003) because soil properties in arid and hyper-arid regions from global inventories are insufficient to provide consistent soil texture information. This includes aspects such as soil particle size distribution and binding energies but also the existence of roughness elements and soil moisture content that impact on mobilization thresholds. See Darmenova et al. (2009) for a comprehensive review. This severely limits the level of complexity that can be put into models representing the physical processes of dust emissions (e.g., Kok et al., 2014; Marticorena and Bergametti, 1995; Shao, 2001). In order to obtain a better understanding of the involved uncertainties, an update to the objective comparison of different dust source inventories by Cakmur et al. (2006) would be desirable and could be extended to take into account uncertainties in the dust emissions parameterization itself.
In addition to that, dust emissions is further complicated by suppressing influences of soil moisture (Fécan et al., 1998) and vegetation cover, including brown vegetation from a previous rainy period (Kergoat et al., 2017), which can vary on relatively small time and spatial scales. This is particularly acute in the semiarid Sahel with its seasonal vegetation, also creating large variations in surface roughness (Cowie et al., 2013). There is currently a debate as to what extent the mineralogy of emitted dust particles should be taken into account, as this would alter its interactions with both radiation (Journet et al., 2014) and cloud microphysics (Nickovic et al., 2016). While certainly this is an interesting field of research, the former aspect is probably more relevant on longer timescales, and the latter is not even considered in most current dust prediction models.
Surface wind speeds, particularly peak gusts, are also poorly represented in many meteorological models (Knippertz and Todd, 2012) and this induces errors in both dust emissions and subsequent transport (Menut et al., 2015). Indeed, given the strong nonlinearity in dust production to wind, the gusts may dominate the nature of dust production (e.g., Reid et al., 2008). This may be particularly true for northern Africa but many aspects apply to other source regions around the world, too. For example, many models create too much vertical mixing in the stable nighttime planetary boundary layer (PBL) over arid areas, leading to an underestimation of nocturnal low-level jets and a too flat diurnal cycle in surface winds (Fiedler et al., 2013; Largeron et al., 2015; Roberts et al., 2017). This is partly related to an underestimation of turbulent dust emissions during the day (Klose and Shao, 2012). Another substantial problem is the lack of dust generation related to cold pools (haboobs) associated with moist convection over the Sahel and Sahara (and many other desert areas in Asia, Australia, and America), a process largely absent in models with parameterized convection (Marsham et al., 2011; Heinold et al., 2013; Pantillon et al., 2015, 2016). This leads to even reanalyses missing the summertime maximum in dust-generating winds in the central Sahara (Cuevas et al., 2015; Roberts et al., 2017).
It is challenging to improve model representation of dust generation due to an enormous lack of observations from key source regions. The logistically difficult and politically unstable Saharan and Middle East regions have large areas void of any ground stations. What is required to better understand and specify the meteorology of dust production is a much denser network of stations that observe standard meteorological parameters such as wind, temperature, humidity, and pressure, ideally located in some of the main source regions. Given the large diurnal cycle and the short lifetime of some dust-raising mechanisms, particularly moist convection, an hourly or better time resolution would be desirable (Bergametti et al., 2017; Cowie et al., 2015). A first step in creating such a network was undertaken during the recent Fennec project, which deployed stations in 2011 (Hobby et al., 2013), but the deployed stations could not be maintained beyond 2013 (Roberts et al., 2017), and thus do not provide continuous monitoring or a long climatology, but they have demonstrated that (i) reporting the sub-3 min variance in winds is generally unimportant, but resolving the diurnal cycle is critical; (ii) there are substantial biases even in analyzed winds, which miss the summertime wind maximum in the central Sahara; and (iii) it is important to evaluate dust uplift together with model winds, and observational records of this relationship are invaluable (Roberts et al., 2018).
The lack of observations in combination with the difficult-to-represent meteorology also leads to substantial deviations among different analysis products, even on continental scales (Roberts et al., 2015), creating substantial differences in dust emissions (e.g., Menut, 2008). However, the fine-scale nature of dust emissions prevents large scale observations from providing constraint on what a “correct” dust source function is; rather available observations provide only a gross tuning parameter (Khade et al., 2013). Particularly the depth of the Saharan heat low, which is crucial for the large-scale circulation over northern Africa and thus a dominating factor for dust generation, can vary substantially among different analyses or model simulations with different resolution (Marsham et al., 2011). A much denser network of high-quality pressure and wind observations is needed to better constrain models in this regard. Pressure measurements have the advantage of being less affected by local conditions (e.g., topographic circulations, inhomogeneities in roughness) than wind measurements and have – through data assimilation – a far greater impact on the analyzed heat low, which in turn controls the model winds. However, direct wind measurements over under-observed source regions would also be highly desirable.
In addition, our knowledge of the amount and the size distribution of the emitted mineral dust particles is limited. Significant diversity exists among measurement methods for airborne dust (Reid et al., 2003), with aerodynamic and inversion methods being generally in agreement (Reid et al., 2008), and with optical particle counters showing larger sizes. This leaves mass as one of strongest constraints on the system. Investment is required in instrumentation that can accurately characterize coarse and giant aerosol particles. A network of ground stations is subsequently required that in addition to standard meteorology measures mineral dust emissions, ideally including mass or number size distributions of emitted particles. Ideally such stations should be complemented with information about the state of the soil (texture, soil moisture, vegetation, mineralogy). Some such efforts were made during recent field campaigns such as Fennec (Marsham et al., 2013), the Bodélé Dust Experiment (BoDEx) (Washington et al., 2006), and the Japanese Australian Dust Experiment (JADE) (Ishizuka et al., 2008) just to name a few examples. Longer-term monitoring stations, however, are very rare, with the African Monsoon Multidisciplinary Analyses (AMMA) Sahelian Dust Transect (SDT) being a notable exception (Bergametti et al., 2017; Marticorena et al., 2010). Worth mentioning are also the CV-DUST project (Pio et al., 2014) and the Cape Verde Atmospheric Observatory (CVAO) with its long-term dust record (Fomba et al., 2014). An extension of such activities to more remote source areas would be highly desirable.
Given the relative lack of in situ data, a continued reliance on remote sensing is anticipated in coming years, but a number of challenges remain. First, obscuration of dust by cloud (Kocha et al., 2013) is likely a problem that cannot be solved. Second, much summertime dust is emitted at night (Marsham et al., 2013) but most current products are daytime only, requiring better information from wavelengths other than visible ones. Infrared products from geostationary satellites are being developed but still have biases related to atmospheric moisture and uncertainties from the dust optical properties (Banks et al., 2013, 2018). These would need to be further improved and provided in NRT for data assimilation, but have been useful for source detection (Schepanski et al., 2007). Newly developed dust optical depth products such as those from infrared high-spectral sensors (e.g., Infrared Atmospheric Sounding Interferometer (IASI); Capelle et al., 2014; Klüser et al., 2012; Peyridieu et al., 2013) or those produced with the Generalized Retrieval of Aerosol and Surface Properties (GRASP) algorithm (Chen et al., 2018) are promising but have more limited space–time coverage. In addition, location of AERONET stations closer to source regions (as discussed in Li et al., 2016) would allow evaluation of models and satellite retrievals near the source (e.g., the short-term deployment during the Fennec field campaign; Banks et al., 2013), and retrievals from such observations should in future account for particles with diameters exceeding 30 µm (Ryder et al., 2013).
Lidar technique advancements that have occurred in the last decade allow better insight into the desert dust distribution in the atmospheric columns today. With respect to the conventional passive remote-sensing techniques, lidar measurements provide optical properties of atmospheric aerosol as a function of the altitude. This implies that aerosol layers can be identified and characterized in terms of optical properties by lidar measurements. Different lidar techniques exist with different levels of accuracy, but their added value for desert dust observations in measurement campaigns, long-term measurements, and model evaluation is widely demonstrated (see Ansmann et al., 2017; Mona et al., 2012, for more details). In addition, depolarization measurement capability allows reliable identification of nonspherical particle presence and therefore reliable information on the contribution of the desert particle to the aerosol backscatter and extinction coefficient as a function of the altitude. Desert dust profiles provided by CALIPSO at a global level since 2006 improved our knowledge of the desert dust distribution in the atmospheric column and of the transport mechanisms and impacts worldwide (e.g., Yu et al., 2015). At a ground-based level, lidar networks like EARLINET, MPLNET, and AD-Net are improving more and more in terms of methodologies and observational capability, also fostering the link and synergy with more operational communities like the ceilometer one. This said, characterization of the the near-surface environment is problematic, with attenuation being an issue for space and airborne lidars and overlap corrections for lidars at the surface looking upwards. Regardless, the advancements in lidar observations are going to improve the overall knowledge of the desert dust vertical distribution, in particular close to the source regions, through satellite measurements (CALIPSO, the Cloud-Aerosol Transport System (CATS), to a limited extent ESA Doppler wind lidar ALADIN on Aeolus, and to a fuller extent ATLID on EarthCARE) and low-cost automatic systems like ceilometers.
Finally, the dust-focused satellite data should be complemented by improved spaceborne assessments of soil moisture, vegetation cover (green and brown), and soil mineralogy to better characterize varying conditions in source regions (Kergoat et al., 2017). For soil mineralogy, airborne and spaceborne spectroscopic mapping (such as DLR EnMAP and upcoming NASA-EMIT missions) provides a new resource to determine the relative abundance of the key dust source minerals with sufficient detail and coverage, but this resource has been virtually unexplored in the context of dust modeling.
3.3 User requirements for marine aerosol particle emissions
Sea spray provides the largest mass flux of any aerosol type (Andreae and Rosenfeld, 2008) and sea salt aerosol dominates the total aerosol loading over the remote oceans (Haywood et al., 1999). There are few long-term measurement sites of marine aerosol, all restricted to islands or coastal sites (e.g., MAN, https://aeronet.gsfc.nasa.gov/new_web/maritime_aerosol_network.html, last access: 18 July 2018). The source of sea spray aerosol is strongly dependent upon environmental conditions, primarily the local surface wind speed, but also on wave state (Norris et al., 2013b), water temperature, salinity, and the presence of surfactants (de Leeuw et al., 2011). Biological material in the surface water can contribute to a significant organic component in the sea spray aerosol, increasingly so with decreasing particle size (de Leeuw et al., 2011). Most models, however, use simple source functions formulated in terms of wind speed only; the most widely used is that of Monahan et al. (1986), which is often applied well beyond the range of conditions from which it was derived and for which it is valid (Spada et al., 2013). Jaeglé et al. (2011) found discrepancies between modeled and observed marine aerosol concentrations correlated with sea surface temperature; significant improvement in agreement was found when the model sea spray source function was modified to include a temperature dependence. This result is consistent with a number of laboratory studies which show an increase in coarse-mode aerosol production with increasing water temperature (e.g., Mårtensson et al., 2003; Salter et al., 2014a; Sellegri et al., 2006; Woolf et al., 1987). Indeed, there appears to be a number of physical and biological effects that can strongly perturb the bubble–aerosol production relationship (Keene et al., 2017).
Extensive in situ measurement of aerosol particles within the marine atmospheric boundary layer is unlikely to be viable. Satellite remote-sensing approaches offer the possibility of estimating both ambient aerosol loading and the source flux of marine aerosol. Passive measurement of reflected solar radiation can provide AOD (Remer et al., 2005) and some information on both size and vertical distribution (Kokhanovsky, 2013). Active remote sensing can provide much better vertical resolution, and if multiple wavelengths are used, size distributions can be inferred. Both passive and active techniques suffer, however, from the fact that aerosol retrievals are only possible under cloud-free conditions. Moreover, complicating matters is that there is more diversity in individual size measurements of sea spray than any other aerosol species (Reid et al., 2006).
The source of sea spray aerosol is breaking waves and the bursting of bubbles generated by them. Many source functions, including that of Monahan et al. (1986), scale a production flux of sea spray per unit area whitecap – integrated over its lifetime – by a whitecap fraction parameterized as a function of wind speed. There remains, however, an order of magnitude uncertainty in the parameterization of the whitecap fraction, and there is increasing evidence that neither the production of aerosol per unit area whitecap nor the lifetime of a whitecap are independent of the scale of wave breaking or other water properties (Norris et al., 2013a; Callaghan, 2013; Spada et al., 2013; Salter et al., 2014b, 2015). Recent work on satellite retrievals of the whitecaps (Anguelova and Gaiser, 2011, 2013; Anguelova and Webster, 2006) shows significant promise as a means of providing this driving parameter for sea spray source functions and implicitly accounting for the wide range of important controlling factors in addition to wind speed (Salisbury et al., 2013, 2014). It might also ultimately allow a source function to be specified directly in terms of the satellite measurements. While such an approach would provide near global coverage, the temporal sampling interval is dependent on satellite orbit.
The combination of satellite-based estimates of both aerosol loading and source flux offers the optimum means of constraining operational model representation of marine aerosol. Future progress depends on improvements to, and validation of, the retrievals and on improved estimates of the dependence of sea spray production on wave breaking and water properties. Measurements at very high wind speeds are also required to better constrain the parameterized source functions under extreme conditions, when sea spray production is greatest, for example during hurricanes or tropical storms.
3.4 User requirements for anthropogenic and biogenic aerosol emissions
What is generally perceived as anthropogenic air pollution is in fact a result of complex and poorly understood photochemical processing as well as emissions from point and area sources. Often, anthropogenic emissions are taken to be those associated with domestic, industrial, and mobile sources. However, agricultural emissions, including fertilizers and open maintenance burning, are inconsistently included in the terms biogenic and anthropogenic, respectively. This ambiguity can be initially handled by accepting that, from an aerosol point of view, it is all a single class of processes and anthropogenic and biogenic emissions follow similar processing in models. Gridded emissions inventories are commonly generated for primary particles (e.g., primary organic matter, POM; and black carbon, BC). Sulfates, nitrates, other inorganics, secondary organic aerosol (SOA), and BC are supplemented by emissions of key gases important for secondary aerosol particle production (e.g., SO2, NOx, ammonia, isoprene, alkenes, aromatics, terpenes). These inventories are the result of large-scale land classification maps, fuel inventories, and transportation corridor databases. Individual source classifications vary by study author but often include power production, heavy industry/smelting, biofuels, mobile sources, road dust, agricultural field emissions, agricultural–domestic stack and burn piles, and plant emissions of species such as isoprene and terpenes. We classify larger open biomass burning, including agriculture field burning, as distinct.
Aerosol particle sources are usually prescribed from compiled emissions inventories. Despite the efforts put into emissions inventories by the community and continuous progress, there remain inherent difficulties in producing accurate inventories. This is for a number of reasons such as the large variety of point and diffuse sources, uncertainties in emissions factors, unknown or unaccounted for sources, and the model emissions approach that is applied (López-Aparicio et al., 2017). Among emissions uncertainties, there is even a hierarchy of errors. While point and area sources are less uncertain year after year thanks to satellite data, emissions factors remain uncertain due to the impossibility of measuring them in realistic conditions and due to their strong dependence on the environment. Moreover, satellite-based inventories may miss small sources as is the case for smoke inventories in agricultural burning regions.
Since the error in emissions inventories automatically translates into a similar or even larger error in concentrations, a user requirement on emissions uncertainties might be tempting. However it should be kept in mind that uncertainties and biases in emissions are difficult to estimate and reducing the error to a single number might not be possible. Aerosol source inversion techniques (e.g., Escribano et al., 2017; Huneeus et al., 2012) have made some progress but are not yet at a stage at which they can constrain emissions inventories to better than the user requirement. Such studies can nevertheless point to regional problems in emissions inventories.
One ideally requires emissions inventories that have a resolution as good as the model resolution. For global modeling systems, this amounts to a spatial resolution and sampling of typically 50 km, although of course many benefits in modeling aerosol transport and deposition may be gained by running NWP at a high resolution, even if sources are not known at that resolution. As computing power increases, it is relatively easy to increase model resolution. Sub-grid-scale information in emissions inventories can be used to post-process and downscale, at least statistically, the simulated model concentrations (Wang et al., 2014). New methods based, for example, on population density as a proxy are also being used (Mailler et al., 2017). For these reasons, it is appropriate that global emissions inventories always aim for spatial resolution and sampling that are higher than those of models at a given time (i.e., we recommend a minimum of ∼ 10 km resolution given the current state of play). Even higher resolutions (<1 km) are required for regional and urban air quality models given that the typical scale for emissions is very small (e.g., the width of a road for surface traffic).
Temporal distribution of emissions inventories can be critical as emissions inventories need to sample the diurnal, weekly, and seasonal cycles in emissions. Since some aerosol data products are only available for the daytime (e.g., AOD retrieved in the visible part of the electromagnetic spectrum), it is important to deal with the diurnal cycle in emissions so as not to introduce biases in the simulated quantities. As modeling improves, it may become necessary to move from static gridded inventories to include feedbacks with societal (e.g., public holidays, agricultural practices) or meteorological (e.g., influence of cold spells on emissions from heating–biofuel systems or dry spells–wind on stack burning) conditions. Biogenic emissions from plants also have a strong dependency on temperature and water stress.
Aerosol particle speciation in global aerosol models should be reflected in global emissions inventories with a minimum of aerosol precursors such as SO2, NH3, and NOx and primary aerosol particles such as elemental carbon or BC and POM. Industrial dust and fly ash are often left out but can be important in some regions (such as China) and should be included in user requirements. Requirements for speciation for volatile organic compounds (VOCs) are more difficult to set out because it is unclear what level of complexity is required in global aerosol models whose aim is to reproduce mass or number concentrations or optical thickness due to SOA. We argue here that speciation of VOCs is directly related to the complexity of the aerosol scheme considered and is more difficult to link to user requirements. This is further complicated by SOA production likely being a product of joint anthropogenic emissions. At the minimum bulk seasonal emissions of key classes of reactive VOCs are required (e.g., alkenes, aromatics, isoprene, terpenes).
Aerosol particle properties, such as size and composition, play an important role in determining the aerosol particle radiative efficiency and the ability to serve as cloud condensation nuclei as well as a role in health-related impacts. User requirements for aerosol particle mass or number size distributions translate into user requirements for aerosol particle size resolution at the emissions points. Such user requirements can be expressed in several ways, i.e., in PM10, PM2.5, and PM1 emissions rates, or in combined requirements for aerosol particle mass and number emissions rates for typical aerosol size ranges. Historically, the focus has been first on PM10, then PM2.5, and lastly on PM1 for both health impacts and the particulate matter connection to cloud formation. The concept itself of particulate matter at a given size cutoff is directly linked to the availability of sampling inlets, but with more current and future instruments we can expect to have complete information on the aerosol size distribution.
3.5 User requirements for open biomass burning aerosol emissions
Biomass burning emissions represent a highly temporally and spatially variable source of aerosols to the atmosphere and reliable and timely estimates are a key input to air quality and atmospheric composition forecasts. Here we define open biomass burning emissions as emissions by fire consuming open vegetation in fields, grasslands, or forests. Biofuel or stacked agricultural burning are included in the anthropogenic and biogenic emissions and not considered as open biomass burning. Within the International Global Atmospheric Chemistry (IGAC) project, there is at present about half a dozen advanced global aerosol models that include emissions from vegetation fires that could be included in a multi-model ensemble forecast. Only half of the models participating in IGAC are currently operational; the others remain in the research and development stage (for some, only the vegetation fire component is not operational).
Several real-time smoke forecasting products exist and are related to satellite-based active fire hot spot or burn area databases. The most established global aerosol forecasts are represented in the International Cooperative for Aerosol Prediction (ICAP). Four models include dedicated smoke treatment: CAMS (ECMWF and partners), MASINGAR (MRI-JMA), GEOS-5 (NASA), and NAAPS (U.S. Navy), for which the first two use emissions from the Global Fire Assimilation System (GFAS; Di Giuseppe et al., 2017, 2018; Kaiser et al., 2012), the second from a similar Quick Fire Emissions Dataset (QFED; Darmenov and da Silva, 2013) based on fire radiative power (FRP), and the last from the hot-spot-based Fire Locating and Modeling of Burning Emissions (FLAMBE) system (Reid et al., 2009a). Currently most models scale biomass burning emissions to reach acceptable values of biomass burning aerosol optical thickness close to observations (MODIS or AERONET). This scaling factor ranges from 1.7 for the Met Office Unified Model limited area model configuration over South America that was used for the South American Biomass Burning Analysis (SAMBBA) campaign (Kolusu et al., 2015) to 1.8–4.5 for GEOS-5 (Colarco et al., 2011) and 3.4 for CAMS (Kaiser et al., 2012). In CAM5 (Tosca et al., 2013), regional scaling factors are used (Lynch et al., 2016). In small-fire regions, the required factors can be much larger (Petrenko et al., 2017). The need for these correcting factors arises from both possible underestimation of the biomass burning aerosol emissions and model biases.
Emissions of aerosols, and other pollutants, associated with open biomass burning are estimated using emissions factors which convert between the mass of fuel consumed (derived from FRP or burnt-area observations) and the species of interest via the carbon content of the fuel (e.g., Akagi et al., 2011; Andreae and Merlet, 2001; Kaiser et al., 2012). These emissions factors are typically calculated using laboratory or field campaign measurements of smoke constituents, which, while providing accurate measurements, may not be fully representative of all biomass burning and smoke conditions. In particular, large uncertainties, and missing observations, persist in emissions factors for different fuel types (e.g., peat), fire conditions (smoldering vs. flaming), and smoke processing scenarios (e.g., in the presence of clouds, daytime vs. nighttime conditions) following Akagi et al. (2011), for example. Increased and more extensive in situ measurements of different fire types would provide the data required to improve emissions factors currently used in the operational models. Incorporating meteorological parameters (French et al., 2004, 2011), such as surface temperature, humidity, and soil moisture, which could be carried out in NRT in the operational models, will also be beneficial in adapting otherwise static emissions factors to particular environmental conditions. A special case is also provided by peat fires, which for their extent and intensity are an important contributor to global carbon emissions, especially during events in Indonesia related to the El Niño–Southern Oscillation (for example, see the dedicated section in the BAMS State of the Climate 2015; Benedetti et al., 2016, or Huijnen et al., 2016). The remotely detectable signal from peat fires is relatively small and the proportionality to biomass burnt is less certain for these fires than for aboveground fires. Also, the emissions factors vary for individual fires so that estimates on a small scale have a limited accuracy. Observations that would help in better constraining the fire emissions factors would be of great usefulness.
There are other ways in which fire emissions can be estimated globally, for example from smoke observations or from burnt-area estimations. These two alternative approaches could not be used in a real-time operational framework and have limitations themselves. The uncertainties in emissions estimates from smoke observations are still large due to variable and relatively poorly known optical properties of aerosols, poorly characterized errors of the used atmospheric chemistry and transport models, and noise in the satellite observations. For burnt-area products, uncertainties arise mostly from small fires remaining undetected in the burnt-area observations and large uncertainties in the estimates of the rather variable input of available fuel load and combustion completeness. For peat fires in particular, the burn depth is not constrained with global observations.
An increase in the number and coverage of observations will certainly improve biomass burning emissions estimates. Currently fire products from sensors on low orbit (MODIS; Visible Infrared Imaging Radiometer Suite, VIIRS) and geostationary satellites (Spinning Enhanced Visible and Infrared Imager, SEVIRI; GOES; Himawari-8) are available. To estimate emissions, observation gaps may occur due to cloud cover or when satellite observations are not available, and the consistent merging of FRP from different satellites is still an open research topic because their values are often very different and globally biased. However, combining the high temporal resolution of the geostationary products, which would greatly help in accounting for the usually strong diurnal cycle of fire emissions, and the higher precision and global reach of low-Earth-orbiting products is an important objective. Future satellite observations might help in reducing the discrepancy between low-Earth-orbiting and geostationary products.
To support the assessment of fire impacts, measurements of the combustion species (aerosols and reactive and greenhouse gases) are needed. There are several stations that can support verifications of haze forecast, but their number is very limited and some existing stations do not share data in a timely manner. There is also a network of ground-based observations, including GAW stations and other global networks (e.g., AERONET). Lidar networks can also help to identify plume heights.
Fire emissions occur most of the time in the PBL. However, for some large fires, estimated at roughly 15 % of all fires, fire emissions are released in the free troposphere above the PBL (Martin et al., 2012; Sofiev et al., 2012; Val Martin et al., 2010). In some extreme cases, fire emissions can even reach the upper troposphere–lower stratosphere region (Fromm et al., 2006). The height in the atmosphere at which this occurs is often referred to as the injection height. An observational dataset of injection heights exists through the MISR Plume Height Project (MPHP; Nelson et al., 2013), based on a combination of MISR smoke aerosol and MODIS thermal anomaly products. This dataset has recently been updated and extended to produce the MPHP2 dataset. These observations have been very useful in calibrating and/or evaluating global biomass burning emissions injection height datasets (Sofiev et al., 2013). Satellite products that can provide, in NRT, an estimate of this injection height would greatly help in accurately forecasting large biomass burning events. Another factor of uncertainty, to a lesser extent, is the shape of the vertical injection profile. In this case, profiling observations would be required (see also discussion on lidar observations in Sect. 3.2).
In this section we have highlighted some of the challenging aspects related to the estimation of emissions from biomass burning. In addition, extensive work in drawing user requirements has recently been performed by the Interdisciplinary Biomass Burning Initiative (IBBI) and GAW SAG-APP. A draft of Regional Vegetation Fire and Smoke Pollution Warning and Advisory System (VFSP-WAS): Concept Note and Expert Recommendations was written, which forms the basis of user requirements for biomass burning aerosols (WMO GAW Report No. 235, available at http://www.wmo.int/pages/prog/arep/gaw/documents, last access: 18 July 2018).
3.6 User requirements for removal processes
Wet and dry deposition and sedimentation are important removal processes that control the prediction of atmospheric aerosol distribution. However, the aerosol deposition fluxes themselves may become important NAAP forecast products, for example to forecast the soiling of solar panels.
The removal processes are modeled as a function of available meteorological variables describing boundary layer mixing. Wet deposition requires information about the occurrence of convection, precipitation, and fog. Dry deposition modeling requires information related to particle size, shape, density, and hygroscopicity. It also needs information about the state of the land surface and the vegetation, in particular for soluble aerosols. NAAP takes these meteorological variables from the underlying operational NWP models. It should be noted that improving the forecast of precipitation remains a major challenge for the NWP. Inaccuracies of the precipitation forecast directly influence the quality of the aerosol forecasts. Improving the surface information can be achieved by better linking NAAP to advanced land-surface modeling and by updating to the most recent land-use datasets.
Observations of wet deposition fluxes are available from acid deposition networks. These observations could be used to evaluate wet deposition of soluble aerosols such as sulfate, nitrates, and ammonia. For this purpose, the observations need to be made available in a timely manner and at a temporal resolution suited for NAAP evaluation, which is often higher than the frequency (i.e., annual means) required for impact monitoring. Finally, the observed wet deposition fluxes are often strongly influenced by local processes, which makes it necessary to filter the observation in such a way that they are representative of the scale resolved by the NAAP models.
While some observations of wet deposition are made routinely, fewer observations of dry deposition are available. Uncertainties in deposition contribute substantially to the insufficient constraints, in particular of the mineral dust mass budget in atmospheric mineral dust models. Currently, there are very few stations measuring dust deposition, both in the vicinity of and far from source regions (e.g., Bergametti and Fôret, 2014). CARAGA (Fu et al., 2017; Laurent et al., 2015), which is a network of automatic deposition collectors installed throughout the western Mediterranean Basin, samples mass flux of atmospheric insoluble deposition weekly. This initial effort is focusing to constrain regional models of dust simulation but the potentiality of these low-cost and automatic instruments can also be used in remote and isolated regions such as the Sahara. Recently, Yu et al. (2015) tried to infer dust deposition by combining MODIS and Cloud-Aerosol Lidar with Orthogonal Polarization (CALIOP) data. Their CALIOP-based multiyear mean estimate of dust deposition matches better with estimates from in situ measurements and model simulations than previous satellite-based estimates.
Measuring deposition fluxes is still a scientific challenge. Therefore, the different sites often use different instruments and observational protocols (e.g., procedure to minimize contamination by local sources), which limits the comparability among observations. It is therefore desirable to enhance or develop standards for deposition measurements and to encourage continuous operation.
The Workshop on Measurement-Model Fusion for Global Total Atmospheric Deposition (MMF-GTAD), recently organized by the GAW Scientific Advisory Group for Total Atmospheric Deposition (SAG-TAD), explored the feasibility and methodology of producing, on a routine retrospective basis, global maps of atmospheric gas and aerosol concentrations as well as wet, dry, and total deposition. In particular they reviewed the current state of global measurements (ground based and satellite), chemical transport modeling (global and hemispheric), and measurement–model fusion and mapping techniques (see GAW Report 234, at https://www.wmo.int/pages/prog/arep/gaw/documents, last access: 18 July 2018).
4.1 General concepts
Data assimilation systems have become an important component of aerosol prediction for both gas- and particulate-phase species. Several global and regional models currently provide analysis of gases and/or aerosol particles. Currently five centers routinely assimilate aerosol data into their models, ECMWF CAMS, FNMOC–NRL, GMAO, JMA, and the UK Met Office. As an example among others, the CAMS system incorporates retrieved observations of ozone, CO, SO2, NO2, and AOD in its analysis in order to provide initial conditions for the prediction of these species. The assimilated data are currently based on retrieved products. Bayesian, statistical, or empirical methods are usually applied, depending on the complexity of the instruments and the observation characteristics.
Direct assimilation of atmospheric clear-sky radiances in the UV, visible, and near-infrared wavelengths, where the aerosol signal is strongest, is being considered as a future step, which would allow a seamless assimilation of data from different satellite instruments. This has been shown possible in a study by (Weaver et al., 2007) but it has not been pursued in operational contexts as of now. The use of current and potentially future thermal infrared instruments has also been researched for infrared-sensitive species such as dust in relation to dust, sea surface temperature (SST), water vapor, and temperature assimilation (Bogdanoff et al., 2015; Merchant et al., 2006; Quan et al., 2013; Schmit et al., 2009). There is a delicate trade-off between the complexity and rapidity of the radiative transfer code, particularly in the shortwave part of the spectrum, as well as between model complexity and skill. Complexity may be required for accurately simulating clear-sky aerosol radiances in cases of low and high aerosol loads while rapidity is required in an operational context. Consideration of polarization might also be necessary for the shorter wavelengths, thus further increasing the complexity and hence the computational cost of the radiative transfer calculations. The optimality of assimilating retrieved aerosol products versus radiances and the choice of a suitable algorithm or method for fast radiative transfer at short wavelengths are still being debated. On the one hand, direct radiance assimilation avoids the problem in diversity between the model and the retrieval assumptions (aerosol type, refractive index, meteorological parameters, etc.); on the other hand, the complexity of the observations might complicate or even prevent the implementation of radiance assimilation, especially for advanced sensors such as multi-angle instruments or polarimeters. In the end, the most pragmatic approach prevails in an operational context; hence the assimilation currently depends heavily on the availability of good-quality retrieval products with reliable uncertainty estimates.
Emissions are not part of the analyzed fields but are specified either from established emissions inventories (an extensive intercomparison of a selection of these inventories is given in Granier et al., 2011), as a dynamic boundary condition from satellite observations as is the case for the emissions of biomass burning aerosols, CO, and other species from wild fires (e.g., GFAS, Kaiser et al., 2012; FLAMBE, Reid et al., 2009b; QFED, Petrenko et al., 2012), or computed in the model for some natural aerosol emissions (as sea spray or mineral dust). Estimation of emissions through data assimilation will be the next step for global models. This has already been successfully tried in regional models (e.g., Elbern et al., 2007; Khade et al., 2013) and in off-line or online global models (i.e., Di Tomaso et al., 2017; Escribano et al., 2017; Huneeus et al., 2012).
The most common approach is the adjustment of initial conditions in a manner similar to meteorological data assimilation used in NWP. Optimal interpolation, variational approaches (3D- and 4D-Var), EnKF, or hybrid techniques combining the advantages of both variational and EnKF techniques are all applicable and have been used at various operational centers in various setups (Benedetti et al., 2009; Di Tomaso et al., 2017; Rubin et al., 2016, 2017; Sekiyama et al., 2010; Zhang et al., 2008). Research is still ongoing for the optimal definition of the background error covariance matrices for aerosols, including errors deriving from the misspecification of the emissions. Hybrid 4D-Var–EnKF systems could be used to this end. Independently of the specific assimilation framework, assimilation is a key data-hungry application.
4.2 User requirements for data assimilation
In the past, the aerosol prediction and assimilation community had to use data that were being made available, and not necessarily aimed at the needs of this community. Aerosol products were often provided with climate applications in mind and made available as daily means or monthly averages. While the needs of the operational community are largely similar to those of the climate research community, the timeliness requirements are different. By the year 2000, operational aerosol data products such as from the Advanced Very High Resolution Radiometer (AVHRR) had seen some use in NRT data assimilation, but data quality and delivery time were problematic. A breakthrough was made after the launch of Terra with the creation of the joint NASA–NOAA “bent pipe” program followed some years later by the NASA LANCE servers (Michael et al., 2010), providing many NRT composition, weather, and surface products at ∼3 h latency (such as AIRS, MISR, MLS, MODIS, MOPPIT, or OMI). Expedited products (∼24 h) are also available, for example, from the CALIPSO program. Future aerosol-related lidar missions such as EarthCARE and Aeolus, are now establishing best-effort NRT data delivery, following the example of LANCE expedited products. This has also been made possible by the fruitful collaboration between modeling community and data provider, in an effort to make an optimal use of the resources and provide the best service to the end users.
As discussed previously, most aerosol assimilation systems at the moment rely on products such as AOD, rather than raw measurements such as satellite radiances. However, the tendency in the future will likely be towards the use of satellite radiances, either raw or aggregated and possibly cloud-cleared, for consistency with the current approach in NWP. This represents a challenge for both the model developers and the data providers and might also involve joint development of observation operators. The last point is particularly true considering that there is a fundamental inconsistency between simulated and observed variables. The prognostic variables in the model are the mass and number concentrations of the individual species, whereas the observed variables are mostly optical properties. Converting from one to the other necessitates assumptions and, consequently, is a source of error which has to be mitigated.
Ground-based instruments such as AOD from the AERONET program, are generated in a timely and consistent manner that makes them a candidate for assimilation as well. In the case of lidar measurements, aerosol backscatter, attenuated backscatter, or extinction are all candidate variables and desired for assimilation. The lidar community (e.g., EARLINET, MPLNET, NEIS) is currently establishing protocols for data posting and format as part of the GALION program.
Some general recommendations related to data assimilation observational requirements are outlined below.
4.2.1 Timeliness
Observations of key variables have to be timely. In particular, especially for aerosol prediction and air-quality applications, the data to be fed into the assimilation system need to be in NRT (i.e., available within 6 h) and have an associated time stamp. A 3 h posting of data is preferred, although some systems can cope with as long as 12 h.
4.2.2 Uncertainty
Regarding the user requirements for uncertainties for assimilation applications, two main points should be highlighted:
-
Observation errors on the assimilated product have to be provided at the pixel or retrieval level. Broad diagnostic or static error models can help to understand the general accuracy of the data product but are not so useful for data assimilation in which the observations are considered pixel by pixel. Therefore, prognostic error models of the data are a functional requirement, and these models need to undergo validation as well. Wherever possible error covariances should also be provided (Bormann et al., 2016), which include correlations of errors among different aerosol products from a given sensor, correlations of errors in time (especially for retrievals from geostationary satellites), and correlations of errors in space (e.g., due to the similarity in surface properties or viewing geometries). Additionally, other information is deemed necessary for the correct assimilation of the observations, such as averaging kernels for chemical species. Moreover, retrieval errors should be required to stay below a certain threshold in order to make the cut for assimilation.
-
Biases should be quantified and, where possible, corrected before data provision for assimilation (Zhang and Reid, 2006). Even sophisticated assimilation systems with online bias correction struggle with aerosol observations as there is limited redundancy at the moment and no single satellite sensor can be used as an absolute reference as they all suffer from biases. Ground-based lidars and sun photometers are currently being investigated to provide a bias-free anchoring for satellite data or as a dataset to be assimilated in their own right (Rubin et al., 2017). This approach shows promise, provided that the calibration of the ground-based instruments is monitored and possible sources of biases in the processing of the data are removed.
Much effort has already been going into addressing points 1 and 2 above thanks also to collaborations fostered by AeroCom and AeroSat (see for example Witek et al., 2018) or projects funded by space agencies. An example of the latter is the Climate Change Initiative, funded by the European Space Agency (Hollmann et al., 2013; Popp et al., 2016). If utilized incorrectly, the assimilation of observations can cause more harm than good in the model. However, as long as random and systematic errors are provided on a retrieval level, the assimilation can “cope” with large errors; this is given the fact that errors (both in the background and in the observations) appear as weighting factors. If the error in the observation is large compared to the difference between the model and the observation (departure), then that particular observation will have only a minor influence on the analysis. This is particularly true for unbiased random errors. For systematic errors that have spatial or temporal correlation this is not true. Unless biases can be removed, if the differences between the model and the observations are too large, the assimilation cannot cope and the observation in question is usually rejected on the assumption of perfect model, which is often made in, for example, variational assimilation. Generally the analysis is the result of a statistical compromise between error assumptions on the model background and on the observations. There is limited tolerance of biases, but the main assumption behind the most common estimators for data assimilation is that they are linear and unbiased.
4.2.3 Spatial resolution and sampling
The requirement on spatial resolution of the observations needed for assimilation is quite relaxed due to the fact that current global assimilation for operational aerosol prediction cannot afford to run very high-resolution analysis. For this reason, even data with coarse spatial resolution (100 km) can be beneficial. However, in most cases, current satellite-based sensors have a much better spatial resolution down to a few kilometers for passive sensors and a few hundred meters for active sensors (depending on the application). Spatial sampling is possibly more important than resolution for assimilation. It has been shown that assimilation of an instrument with large spatial sampling (wide swath) such as MODIS is more beneficial than assimilation of highly accurate measurements from a passive sensor with a narrow swath. However, using observations from a narrow-swath instrument adds value to the analysis. From the point of view of the ground-based networks, the density is an important factor. Vertically resolved observations are also very important, even if the spatial resolution is not very high, since they provide information regarding the vertical structure of the aerosol field which is completely missing in the integrated AOD measurements that are currently provided. Lidar backscatter and extinction profiles provide the necessary vertical information and the challenge remains to integrate this information with that provided by the passive sensors. This entails both improving the modeling and the retrieval aspects. This area of development is important to the community.
4.2.4 Temporal resolution
The issue of temporal resolution is similar to that of spatial resolution. In principle highly temporally resolved data are beneficial to the analysis, particularly because they provide information on the diurnal aerosol variability. However, issues connected to large data volume may arise. This is particularly true for datasets coming from geostationary satellites, which now provide data with a temporal resolution of 10–15 min. In some cases, such data have to be heavily thinned or averaged (Saide et al., 2014). This is obviously only a technical limitation that might not be applicable across the range of assimilation systems. For example, the new generation of Japanese geostationary satellites, Himawari 8–9 (Bessho et al., 2016) provide excellent data that have been demonstrated to be of use for data assimilation (Yumimoto et al., 2016). For ground-based instruments, similar considerations can be made, although data volume might not be as high.
4.2.5 Speciation
The problem of constraining the aerosol species in the model has become more important with user demand of products related to single aerosol types. Providing forecast of AOD constrained by observations is not enough as detailed speciated information on dust, biomass burning, and anthropogenic aerosol particles is needed for several applications. For example, a large portion of users are interested specifically in dust forecasts for energy-related and transportation applications. For NWP as well, having robust aerosol climatologies to use in the radiation scheme is a necessity. However, it is not only total AOD that is of interest but the extinction connected to the single species since their radiative impact depends on refractive index, which is in turn a function of chemical composition.
Data assimilation can partially help to constrain the problem if appropriate speciated information can be included. At the moment the main observation is total AOD, which is used to constrain either total AOD itself or total aerosol mixing ratio. In some models the control variables in the assimilation are the individual species but there is no information on speciation contained in the AOD: the same value of AOD can be obtained using different combinations of the AODs of the individual aerosol species. This implies that any information on speciation comes from the model itself, for example through the background error covariance matrix, regardless of the degree of sophistication of the assimilation (Liu et al., 2011; Schwartz et al., 2012). Rather than assimilating total AOD, it seems more desirable to assimilate coarse-mode AOD (coarse dust and sea salt) and fine-mode AOD (e.g., fine sea salt, fine dust, sulfate, and biomass burning aerosols) independently. However, if both fine- and coarse-mode AODs are retrieved using the same measurements, the correlation of their errors would have to be provided. AAOD is also a desired parameter to constrain the absorbing aerosols in the model, particularly for NWP application as this parameter controls the amount of heating induced by aerosols in the atmosphere. This effect can sometimes counteract the surface cooling that nonabsorbent aerosols have (Chylek and Wong, 1995). The accuracy of AAOD would need to be comparable to that of total AOD for the product to have an impact in the analysis. Wherever direct speciation measurements are possible, those would be best suited to be used to correct model prediction of a given aerosol species. These could be measurements derived from a (relatively dense) network of ground-based instruments and/or from satellites. Some promising results to derive aerosol speciation from AERONET observations have been obtained by Schuster et al. (2005) and more recently by Torres et al. (2017) using the GRASP algorithm.
Recent improvements in lidar retrievals also indicate the possibility of discriminating speciation information from these profiling information, at least for certain aerosol species such as dust and volcanic aerosols. For dust, more specifically, a few simple meteorological parameters could also be pointed out, referring back to Sect. 2.
-
Surface pressure observations from northern Africa to better constrain pressure gradients (and therefore winds) are needed.
-
More direct wind observations to improve the wind analysis over source regions are needed. This can be particularly challenging due to the paucity of radiosondes and wind profilers in this region as well as the limitations of atmospheric motion vectors (AMVs) over non-cloudy regions. To this end, the wind observations which will be collected by the Doppler wind lidar ALADIN onboard the Aeolus satellite, to be launched in August 2018, will be a welcome addition.
-
Surface temperature and dew point help to better constrain soil moisture in the top soil layer in most data assimilation systems. This can be particularly important for dust from semiarid areas like the Sahel as well as East Asian semiarid areas, where seasonal soil moisture and vegetation can be a major factor for uncertainties.
4.2.6 Resilience
Several data sources are needed to ensure resilience of the system and a wealth of observation-based information. Currently most centers rely on satellite data for the analysis of aerosol particles. The next generation of satellite measurements are designed to provide more information on the horizontal and vertical distribution of atmospheric particulate, but current efforts often focus on trace gases, while aerosol products are often considered secondary. It is important to consider that some satellites currently providing vital information for aerosol assimilation are coming to the end of their lifetime (for example MODIS). It will therefore be crucial that there are concerted efforts to replace such instruments and insure continuation of data provision and long-term consistency of the records. In the case of MODIS, VIIRS data play exactly that role. For spaceborne lidar instruments such as CALIOP, however, the situation is less clear as, at the moment, there is no single mission aimed at replacing it when the CALIPSO satellite will be decommissioned. The same is true for advanced multi-angle imaging spectroradiometers such as the MISR instrument. Frequent instrumental changes may cause problems for data uptake and recalibration of bias corrections, impinging as well on the quality of the forecast products. Efforts are also under way to use ground-based and aircraft measurements.
4.2.7 Format and accessibility
Finally, observations have to be available in a format that is easily accessible, and should also be as compatible as possible with model fields. For example, it could be more useful to report fine- and coarse-mode AOD at a reference wavelength (as it is more relevant to modal schemes in global modeling) rather than or in addition to the Ångström exponent (AE) (O'Neill et al., 2003). However, errors on AODs at multiple wavelengths are correlated, while errors in AE retrievals tend to be only weakly correlated with those in AOD, making AE a possibly more attractive variable for assimilation. Conversely, errors in a slope derived from two or more spectral AOD measurements can be large. Moreover, interpretation of AE is not straightforward in a column in which several aerosol modes are present. The usefulness of AE over AOD (or fine- or coarse-mode AOD) is still a matter of debate in the retrieval and assimilation communities.
It is also recommended that mechanisms are put in place for easy data transfer, especially for heavy-duty users.
5.1 General concepts
Model development is cyclically intertwined with evaluation and validation efforts. Identified model deficiencies in the evaluation processes set the requirements for development and subsequent evaluation, thus repeating the cycle. NWP has well-established evaluation protocols of prediction products, whereas similar procedures for aerosol forecasting are still being defined (Benedetti et al., 2011; Reid et al., 2011). The less developed verification system for NAAP compared to NWP, together with NAAP's additional degrees of freedom, dearth of suitable observations that inform specific model physics shortcomings, and overall lack of standardized evaluation processes are key limiting factors to the advancement of operational aerosol prediction. One major difference between NWP and NAAP verification is that NWP often relies heavily on verification of a forecast system against its own (or another) analysis. This approach seems much less suitable for NAAP for which the models have far more degrees of freedom and the observational constraint on the analysis is much weaker.
For operational forecasting purposes, we distinguish between two different evaluations: operational model evaluation that is conducted as soon as observations of the forecast period are made available and benchmark testing in which the model's performance in simulating a given event or longer time period (e.g., seasonal or annual cycle) is examined in depth. Operational evaluation, sometimes referred to as verification, is generally part of the operational forecasting process and is therefore performed on a regular basis in NRT, whereas benchmark evaluation can made any time after the forecast period, and observations that were not available for the NRT evaluation can be included. These two evaluations are complementary, while the operational evaluation allows the quantification of the confidence and predictive accuracy of the model products and quickly identifies problems which may arise in the forecast. Benchmark testing identifies weaknesses of individual models and provides an assessment of model performance and uncertainties. This is in turn useful information for the forecast users and helps set requirements for long-term model development.
It is not within the scope of this paper to list and describe the requirements for an extensive model evaluation associated with model developments. This could involve various aspects of the aerosol life cycle such as aerosol–cloud interactions, heterogeneous chemistry, removal processes, etc. Each one of these aspects would require a large and specific set of observations. In the present section, we will focus on the evaluation conducted as part of the implementation of an operational forecast. For operational purposes, it is important that these observations are delivered timely and on a regular basis, to ensure the possibility of a routine evaluation. As pointed out in Sect. 2, in addition to aerosol measurements it is also important to include meteorological and chemical observations in the model evaluation process to complement and understand the resulting aerosol predicted fields. Moreover, taking into account that there are operational forecasting systems with data assimilation, it is important to include independent observational datasets (not used during the data assimilation process) in the model evaluation.
Referring to the requirements of observations as outlined in the introduction (i.e., ease of access and consistency, uncertainty, and speed of delivery), globally consistent and available datasets such as for AOD from AERONET or NASA satellites by default currently drive the evaluation process and consequently model development. AERONET's ability to provide high accuracy of fine- and coarse-mode AOD data over the globe with typical preliminary data availability within 6–24 h makes it a favored metric variable (Sessions et al., 2015). Likewise, the maturity, coverage, speed, and ease of access of MODIS aerosol retrievals makes MODIS AOD retrievals the dominant satellite verification product (as discussed in Sect. 4 favored for data assimilation as well). This dominance of AOD to some degree is because of the exclusion of perhaps more applicable baseline variables not meeting the noted observational requirement, such as PM2.5 and PM10 or aerosol vertical distribution. As discussed in Sect. 3, additional evaluation variables related to model microphysics (chemical composition, absorption, size, full solar and infrared radiative properties, etc.) are only sporadically available and are rarely collected simultaneously.
Satellite remote sensing is the most convenient tool for providing global aerosol spatial and temporal distributions. There has been a series of significant satellite system developments to aid NAAP evaluation and development. In the 1990s, the community in earnest utilized AVHRR and TOMS. In 2000, with the launch of the NASA Terra satellite with MODIS, MISR in 2002 with Aqua and the formation of the A-train (with CALIPSO, CloudSat, OMI, and PARASOL), and European sensors such as IASI all led to significant advancement in observations and model evaluation. Such polar satellites are at relatively low altitudes (between 500 and 800 km), covering a global domain at high spatial resolution with a consistent sensor. However, the polar sensors provide few measurements per day over the same point. Conversely, geostationary satellites are situated at a set point over the Equator, at 36 000 km height, and provide measurements over a given disk. For instance, Meteosat second generation (MSG), which hosts the SEVIRI radiometer, is an essential tool for NRT monitoring in Europe and Africa. Next-generation geostationary satellite sensors, such as Advanced Himawari Imager (AHI) on Himawari-8, Advanced Baseline Imager (ABI) on GOES-16 and GOES-17, and eventually Flexible Combined Imager (FCI) on Meteosat Third Generation (MTG), will likewise result in a jump in the community's ability to characterize aerosol fields from space with much needed temporal resolution.
Along with satellite sensor development, algorithm development has also changed to take advantage of previously gained or new sensor capabilities. While AOD is still currently the dominant metric, many satellite products, both passive and active, are useful and indeed used by the community, including various forms of UV aerosol indices, significant event products, infrared dust products, and scale height–vertical distribution. Each product has its particular strength or weakness projected on the core remote-sensing challenges of lower boundary conditions (e.g., surface properties), cloud mask, aerosol microphysics, and ultimately system noise characteristics, each of which leads to tractable biases in all of these products (see for example Campbell et al., 2012; Hyer et al., 2011; Reid et al., 2013; Shi et al., 2013a, b; Toth et al., 2018; Zhang and Reid, 2006). This has led to the development of new products. For example, the MODIS dark target method fails over bright surfaces due to insufficient contrast. To compensate, the MODIS deep blue algorithm was developed to take advantage of lower albedo in blue wavelengths of arid regions (Hsu et al., 2004). Most recently, day–night band imagery on VIIRS has led to new developments in nighttime aerosol product development, further expanding temporal coverage into the night (Fu et al., 2018; Johnson et al., 2013; McHardy et al., 2015; Wang et al., 2016).
Since the atmospheric residence time of aerosol particles in the troposphere is relatively short (from hours to ∼ 1 week, depending on species-specific physical processes and meteorological conditions) and the footprint area of a single station may be limited, there is a need for ground-based observation networks with sufficient density and representativeness of stations. These are for direct evaluation of the models as well as verifying the satellite products used. A description of the current and future needs for the observing system has been provided in Laj et al. (2009). Clearly, all analyses point to the need for improving geographical coverage of measuring stations. Point measurements are biased towards populated areas as in Europe and the United States (see Fig. 1). Data collected from commercial aircraft can provide invaluable observations for model evaluation (e.g., In-service Aircraft for a Global Observing System, IAGOS; http://www.iagos.org/, last access: 18 July 2018). At the moment, however, this is not established for operational aerosol applications. Moreover, due to the spatial and temporal skewness of the distribution of data collected from aircraft (often more dense close to airports), some care needs to be put into assimilating them into operational systems.
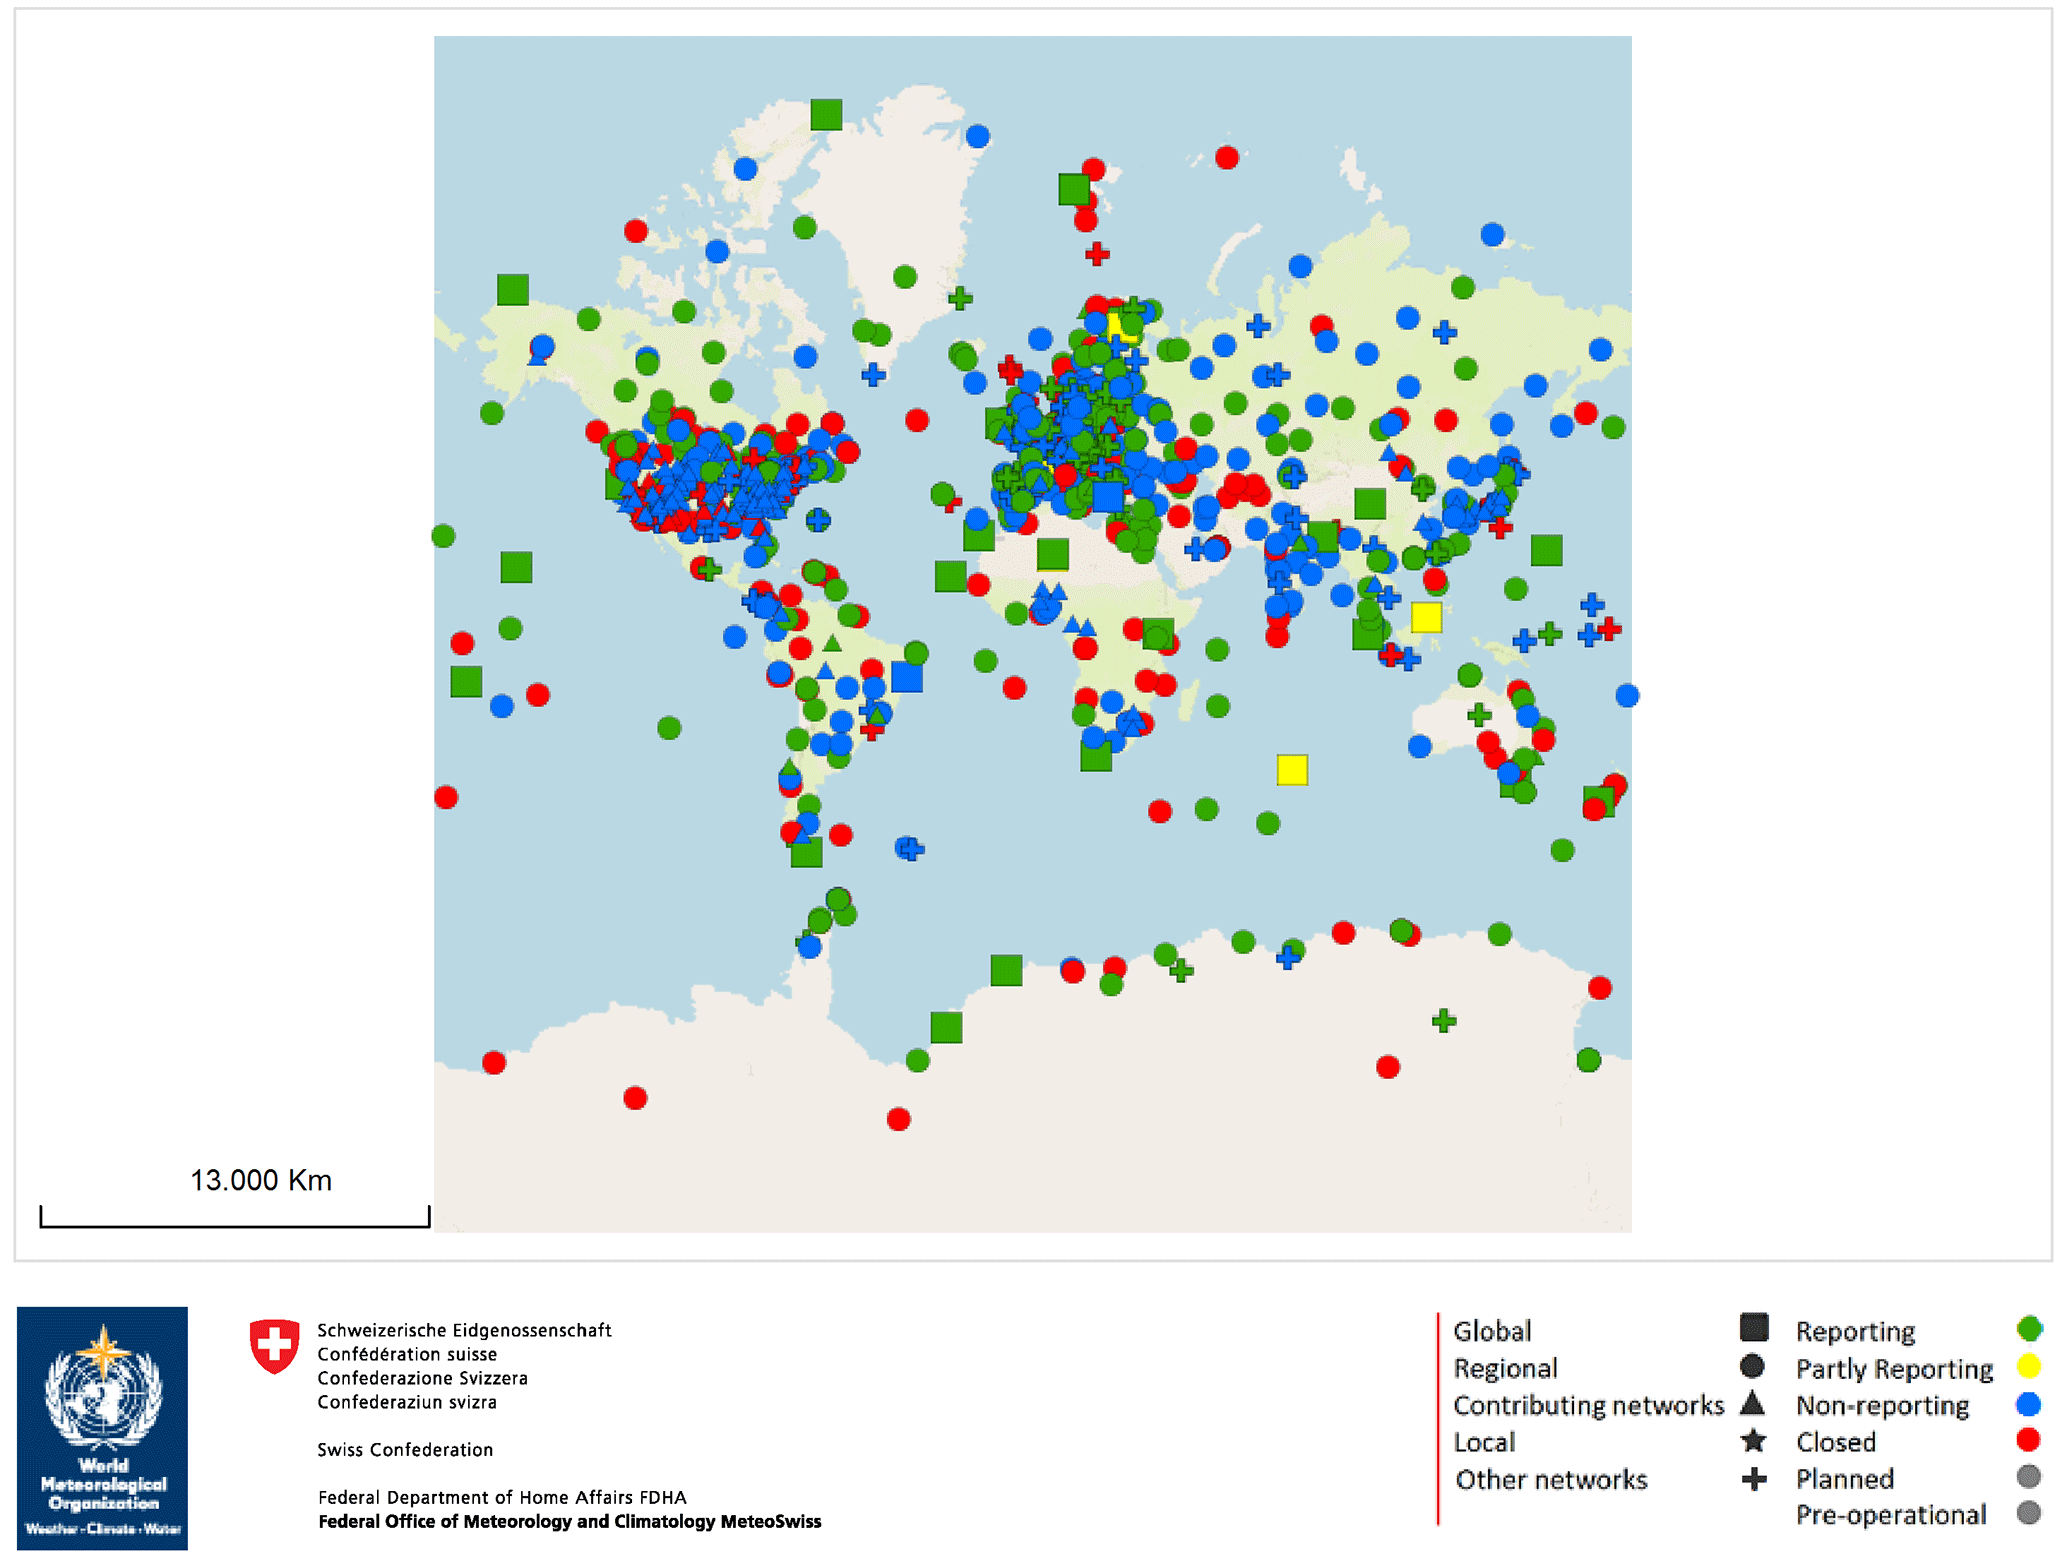
Figure 1Map of surface stations currently included in GAWSIS. Figure courtesy of MeteoSwiss.
Various ground-based observational systems are in operation to monitor aerosol properties in the atmosphere (GAW Report 2016) that can be policy-driven, science-driven, or both. Their organizational structure may vary. Among the main contributors to the aerosol observing system are
-
near-surface concentration measurements, including the European Monitoring and Evaluation Programme (EMEP; http://www.emep.int, last access: 18 July 2018), the Interagency Monitoring of Protected Visual Environments (IMPROVE) program (http://vista.cira.colostate.edu/improve/, last access: 18 July 2018), and the African Monsoon Multidisciplinary Analysis (AMMA) Sahelian Dust Transect (Marticorena et al., 2010).
-
aerosol variables at near surface provided by the European Research Infrastructure ACTRIS (Aerosol, Clouds, and Trace Gases Research InfraStructure, https://www.actris.eu/, last access: 18 July 2018) and NOAA ESRL's Global Monitoring Division with its specific program on aerosol monitoring (https://www.esrl.noaa.gov/gmd/aero/, last access: 18 July 2018).
-
vertical profiles, including the European Aerosol Research Lidar Network (EARLINET; http://www.earlinet.org, last access: 18 July 2018), which is part of ACTRIS; the Asian Dust and Aerosol Lidar Observation Network (AD-Net; http://www-lidar.nies.go.jp/AD-Net/, last access: 18 July 2018); the Latin America Lidar Network (LALINET, http://lalinet.org/, last access: 18 July 2018); and the NASA Micro-Pulse Lidar Network (MPLNET, https://mplnet.gsfc.nasa.gov/, last access: 18 July 2018). There is a current effort to unify a subset of data from all of these networks as part of GALION.
-
AOD, including the global Aerosol RObotic NETwork (AERONET; https://aeronet.gsfc.nasa.gov/, last access: 18 July 2018) (Holben et al., 1998), the Global Atmospheric Watch Precision Filter Radiometer (GAW-PFR) Network (Wehrli, 2008), and the Sky Radiometer Network (SKYNET; http://www.skynet-isdc.org/, last access: 18 July 2018) (Takamura et al., 2004). Details on homogeneity of AOD from different networks can be found in Kim et al. (2008).
-
wet deposition, including EMEP, the Acid Deposition Monitoring Network in East Asia (EANET, http://www.eanet.asia/, last access: 18 July 2018), the National Atmospheric Deposition Program (NADP, http://nadp.sws.uiuc.edu/, last access: 18 July 2018), and the Canadian Air and Precipitation Monitoring Network (CAPMoN) in North America.
All these networks (except AERONET, AMMA, and EMEP) are GAW contributing networks. These ground-based station networks cover different types of regions documenting variability in aerosol properties: clean and polluted continental, marine, Arctic, dust, biomass burning, and free troposphere. While global GAW stations are expected to measure as many of the key variables as possible, the approximately 300 GAW regional stations generally carry out a smaller set of observations.
The most widely used network is AERONET, providing measurements of AOD as well as aerosol size distribution and real and complex indices of refraction for high-AOD periods with over 600 sites around the world. Most stations report in NRT and products are used at several centers for both routine and retrospective validation. Future developments for AERONET will include nighttime lunar photometry, much desired by the modeling community. While recognizing the current efforts, there is still the need to secure long-term funding for ground-based stations and to further develop infrastructure and data protocols in order to fully support forecasting aerosol activities. Much effort has also been dedicated to standardizing protocols and formats to ensure quality assurance, traceability, data quality, and data accessibility of aerosol observations from both ground-based and space-based sensors. However, this is still a challenge.
Most of the routine measurements (e.g., hourly or daily basis) are conducted as part of regional networks and infrastructures and their usage for operational evaluation is limited to the configuration of the model used in the forecast. Depending on the model resolution, global models do not always capture the spatial variability in the individual stations, particularly for mountain sites and urban sites where the influence of unresolved topography and/or local emissions sources are dominant factors for the aerosol distribution. Station data are sometimes selected if representative of background conditions or they may be aggregated. For that reason, for model evaluation, it is mandatory to provide additional information on the observation site with a correct classification based on its spatial representation (regional or global) and its localization (environment types and emissions types). In addition, detailed information on the model individual aerosol components has become more important in the last years. Speciated information on dust, biomass burning, and anthropogenic aerosol particles is needed for several socioeconomic applications (e.g., solar energy and air quality). However, the presence of different types of aerosols mixed in the measurement points should introduce errors in the comparison between individual aerosol model outputs and observations.
5.2 User requirements for operational evaluation
Operational evaluation is specific for models used operationally. It involves operational online verification of model output, plausibility checks and quality control. As in the case of data assimilation (see Sect. 4), highly temporally resolved data are needed. The operational evaluation is an assessment of how the forecast behaves relative to observations that are in NRT (i.e., available within 24 to 48 h since the forecast run), allowing the modeling group and the end users to have a quick overview of the quality of the forecast. Note that the timeliness requirement is less stringent than for assimilation. At present the most used product to evaluate aerosol model outputs in NRT are surface and/or satellite-based atmospheric-column-integrated variables such as AOD (at a reference wavelength of 550 nm). Only recently have products like aerosol size distribution, aerosol scattering, or absorption coefficients become available in NRT from a limited number of stations. However, the ability of a model to reproduce AOD at a station or even a region may not always be a good indicator of its performance to reproduce surface concentration or vertical aerosol distribution (Huneeus et al., 2016; Reid et al., 2017), even though these model variables are clearly interconnected. Therefore, and in the absence of emissions and deposition routine observations, model evaluation should combine atmospheric-column-integrated variables with vertical profiles (extinction coefficient at a reference wavelength at 550 nm to provide information about the height and thickness of the aerosol layer), and surface measurements (such as PM10, PM2.5, and PM1). They also provide an evaluation of the aerosol size distribution on surface level. For the atmospheric column, the AE (which provides aerosol size information) and the separation of AOD into fine-mode and coarse-mode contributions can be used to evaluate the aerosol size distribution.
Additionally, since datasets of weather surface records have better spatial and temporal coverage, observations of horizontal visibility included in meteorological reports are used as an alternative way to monitor aerosol events in NRT and to qualitatively evaluate the aerosol forecasts. In addition, key meteorological variables such as surface winds (linked to emissions of natural aerosols) and precipitation (linked to wet deposition) should be considered.
5.3 User requirements for benchmark testing
Benchmark testing examines individual processes and input drivers that may affect model performance and requires detailed atmospheric measurements that are not, typically, routinely available and can provide better quality control. In addition to those variables considered in the operational evaluation, benchmark testing is expected to include as many of the key variables as possible. Comprehensive measurements of aerosol size distributions, chemical composition, and optical properties are needed. Such observations should ideally be collocated with detailed meteorological information and vertical distribution (e.g., lidars and radiosondes). Routine long-term measurements of aerosol size distributions, chemical composition, and optical properties in operational ground-based networks are urgently needed for model evaluation. Budget constraints are removing some of the very few sites still in existence. Measurements should include the following: mass concentrations of chemical components (soot, organics, ammonia, sulfate, nitrate, mineral dust, and sea salt), number concentrations (of PM1, PM2.5, and PM10), and size distribution (if possible resolved by chemical species). Evaluating whether relevant emissions and feedback processes are treated accurately by a model is challenging, although data assimilation can provide valuable information (Pope et al., 2016). In addition to key meteorological parameters associated with aerosol emissions (e.g., surface winds and soil moisture), the effects of aerosols on radiation and clouds, for example, depend on the physical and chemical properties of the aerosols. Evaluating direct and semi-direct aerosol effects on aerosol absorption properties requires aerosol optical properties in addition to AOD such as AAOD, particle depolarization (relative to aerosol speciation), altitude distribution (relative to clouds), radiation observations such as solar irradiance (downward and net shortwave radiation, downward longwave radiation, and outgoing longwave radiation), and solar surface albedo. Evaluating indirect aerosol effects on clouds and precipitation is even more challenging and it would require additional detailed observations of cloud properties such as cloud optical depth, cloud droplet number concentrations, or cloud-top height and thickness (used to evaluate aerosol and deep or shallow convective cloud interactions). For benchmark testing, there is also a need for co-located and simultaneous meteorology and chemistry measurements at locations carefully selected to ensure spatial representativeness. To fully understand processes, more sites with co-located observations of visibility, cloud, radiation, vertical profiles of temperature, relative humidity, and winds and aerosol properties would be highly desirable. Precipitation and deposition observations are also extremely relevant for benchmarking. Innovative designs for global measurement systems (existing technological platforms such as commercial aircraft, cell phones, cars, etc.) should be further exploited. Such a task should fit the mandate of international organizations such as WMO and EUMETNET (see GAW Report 226 on Coupled Chemistry-Meteorology/Climate Modelling, available from WMO).
5.4 Format and accessibility
As in the case of data assimilation (see Sect. 4), observations used in the model evaluation have to be compatible with the model output fields. In this sense, it would be desirable to work on the establishment of formats and common protocols for data harmonization and exchange. This is the main objective of the World Data Centers. At present, there are six GAW World Data Centers (WDCs), each responsible for archiving one or more GAW measurement parameters or measurement types. They are operated and maintained by their individual host institutions. They collect, document, and archive atmospheric measurements and the associated metadata from measurement stations worldwide and make these data freely available to the scientific community. In some cases, GAW WDCs also provide additional products including data analyses, maps of data distributions, and data summaries. However, each GAW WDC treats their database independently even if different communities are providing the same aerosol parameter. This fact can introduce some discrepancies into the definition of one parameter, creating problems for the model-to-observation comparisons.
Numerical atmospheric aerosol prediction is at a crossroads. It has experienced quick progress in recent years due to the availability of aerosol models, aerosol satellite observations, data assimilation techniques, and the know-how of numerical weather prediction. This paper takes stock of past achievements and reflects on how further progress can be made with a focus on user requirements for aerosol measurements in the context of operational prediction. Requirements are discussed in relation to modeling, assimilation, and evaluation and concern resolution, sampling, accuracy, and timeliness of the observations. However, it was felt that no hard-line requirements can be set up in terms of goal, threshold, and breakthrough values given the relative youth of NAAP. Rather, this study aims at developing the needs of a new community and establishing scientific criteria based on which those values can be defined at a later stage. At this moment, there is a more pressing need to recognize that measurements of aerosol particle properties are not only a “nice-to-have” element in operational and observational ground-based research networks and spaceborne platforms, but they are instead an important and necessary part of the Global Observing System.
Further improvements to NAAP will likely follow several directions, including
-
better representation of aerosol processes. This will require pitching the right level of complexity (especially in terms of chemical speciation) and obtaining the best possible meteorological information from NWP and the relevant aerosol measurements to calibrate and evaluate aerosol parametrizations.
-
improved data assimilation, in terms of both technique and choice of aerosol variables to be assimilated. Key questions for the future are whether there is a benefit to move from assimilating AOD to assimilating clear-sky radiances in the shortwave spectrum and how to make the best possible use of vertical profiles from lidar observations.
-
better aerosol data fueled by a stronger integration of NAAP with aerosol data providers and clear presentation of user requirements. NAAP ought to better consider the issue of aerosol speciation and aerosol size distribution in aerosol modeling and data assimilation and verification.
Concerning aerosol requirements, we recommend the following stepwise approach. The community should start with a better quantification of requirements for total mass, chemical speciation, and size distribution at the surface with the aim to improve emissions and boundary layer processes. Second, similar requirements will also be required in the free troposphere, in order to better constrain long-range transport, sedimentation, and interaction with radiation. Third, having this information, the next step would be to better understand how the various data streams complement each other (or not) in the context of global operational aerosol prediction in order to assess which additional data are expected to improve the aerosol forecast the most.
Data providers and networks are all listed in the text (see Sect. 5), and the data are freely available.
ABe wrote the first version of the manuscript (introduction, general concepts, background and assimilation section), and finalized it with contributions from the co-authors. JSR re-wrote the general concept part, revised the whole manuscript and improved it. PK and JHM wrote and revised the section on dust. SR wrote the section on biomass burning aerosols which was revised by FDG. IB wrote and revised the section on marine aerosols. The section on removal processes was revised by JF. SB, ET, EC and OJ wrote the section on evaluation and contributed to the revisions of the dust modelling section. LM, OB, NH and JE provided general comments and contributed to several parts of the manuscript. LM provided the part related to the lidar measurements. ABa provided useful comments to the initial version of the manuscript. The members of the Global Atmospheric Watch (GAW) Scientific Advisory Group (SAG) on Aeorosols (PL, AW, SKa, SKi, TP, GP, PKQ) provided insightful comments and references. The members of the International Cooperative for Aerosol Prediction (PC, ADS, TT, TS, and MB) also provided useful comments and references.
The authors declare that they have no conflict of interest.
We gratefully acknowledge Oksana Tarasova (WMO) for supporting this
initiative and encouraging the Scientific Advisory Group on Aerosols to take
the lead in writing this paper. We also thank Judd Welton, Silvina Carou,
Markus Fiebig, Brent Holben, Sang-Woo Kim, John Liggio, Sarah Lu,
Olga Mayol-Bracero, Hu Min, John Ogren, Andrea Petzold, and Nobuo Sugimoto.
Mark Parrington is gratefully acknowledged for his contribution to the fire
emissions section. Thanks also to Zak Kipling for his useful comments on the
final draft of the paper. Angela Benedetti has received funding from the
H2020 Aerosols, Clouds, and Trace gases Research InfraStructure (ACTRIS2,
grant number 654109). Sara Basart and Oriol Jorba acknowledge the AXA
Research Fund for funding aerosol research at the Barcelona Supercomputing
Center through the AXA Chair on Sand and Dust Storms. InDust (COST Action
CA16202) as well as the DACCIWA project
(funding from the European Union Seventh Framework Programme (FP7/2007-2013)
under grant agreement 603502) are also gratefully acknowledged. Marsham was supported by the NERC SWAMMA
project (RG.EVEA.103394). Jeffrey S. Reid's contributions were supported by
the Office of Naval Research Code 322, NOAA PMEL contribution number
4739. Olivier Boucher, Samuel Rémy, and Jeronimo Escribano acknowledge
support from the Copernicus Atmosphere Monitoring Service implemented by
ECMWF on behalf of the European Commission. Nicolas Huneeus acknowledges
FONDAP 15110009.
Edited by: Barbara
Ervens
Reviewed by: two anonymous referees
Akagi, S. K., Yokelson, R. J., Wiedinmyer, C., Alvarado, M. J., Reid, J. S., Karl, T., Crounse, J. D., and Wennberg, P. O.: Emission factors for open and domestic biomass burning for use in atmospheric models, Atmos. Chem. Phys., 11, 4039–4072, https://doi.org/10.5194/acp-11-4039-2011, 2011. a, b
Andreae, M. and Rosenfeld, D.: Aerosol–cloud–precipitation interactions. Part 1. The nature and sources of cloud-active aerosols, Earth-Sci. Rev., 89, 13–41, 2008. a
Andreae, M. O. and Merlet, P.: Emission of trace gases and aerosols from biomass burning, Global Biogeochem. Cy., 15, 955–966, 2001. a
Anguelova, M. D. and Gaiser, P. W.: Skin depth at microwave frequencies of sea foam layers with vertical profile of void fraction, J. Geophys. Res.-Oceans, 116, C11002, https://doi.org/10.1029/2011JC007372, 2011. a
Anguelova, M. D. and Gaiser, P. W.: Microwave emissivity of sea foam layers with vertically inhomogeneous dielectric properties, Remote Sens. Environ., 139, 81–96, 2013. a
Anguelova, M. D. and Webster, F.: Whitecap coverage from satellite measurements: A first step toward modeling the variability of oceanic whitecaps, J. Geophys. Res.-Oceans, 111, C03017, https://doi.org/10.1029/2005JC003158, 2006. a
Ansmann, A., Rittmeister, F., Engelmann, R., Basart, S., Jorba, O., Spyrou, C., Remy, S., Skupin, A., Baars, H., Seifert, P., Senf, F., and Kanitz, T.: Profiling of Saharan dust from the Caribbean to western Africa – Part 2: Shipborne lidar measurements versus forecasts, Atmos. Chem. Phys., 17, 14987–15006, https://doi.org/10.5194/acp-17-14987-2017, 2017. a
Baklanov, A., Schlünzen, K., Suppan, P., Baldasano, J., Brunner, D., Aksoyoglu, S., Carmichael, G., Douros, J., Flemming, J., Forkel, R., Galmarini, S., Gauss, M., Grell, G., Hirtl, M., Joffre, S., Jorba, O., Kaas, E., Kaasik, M., Kallos, G., Kong, X., Korsholm, U., Kurganskiy, A., Kushta, J., Lohmann, U., Mahura, A., Manders-Groot, A., Maurizi, A., Moussiopoulos, N., Rao, S. T., Savage, N., Seigneur, C., Sokhi, R. S., Solazzo, E., Solomos, S., Sørensen, B., Tsegas, G., Vignati, E., Vogel, B., and Zhang, Y.: Online coupled regional meteorology chemistry models in Europe: current status and prospects, Atmos. Chem. Phys., 14, 317–398, https://doi.org/10.5194/acp-14-317-2014, 2014. a
Banks, J., Brindley, H., Flamant, C., Garay, M., Hsu, N., Kalashnikova, O., Klüser, L., and Sayer, A.: Intercomparison of satellite dust retrieval products over the west African Sahara during the Fennec campaign in June 2011, Remote Sens. Environ., 136, 99–116, 2013. a, b
Banks, J. R., Schepanski, K., Heinold, B., Hünerbein, A., and Brindley, H. E.: The influence of dust optical properties on the colour of simulated MSG-SEVIRI Desert Dust infrared imagery, Atmos. Chem. Phys., 18, 9681–9703, https://doi.org/10.5194/acp-18-9681-2018, 2018. a
Barrie, L., Borrell, P., Boucher, O., Burrows, J., Camy-Peyret, C., Fishman, J., Goede, A., Granier, C., Hilsenrath, E., Hinsman, D., Kelder, H., Langen, J., Mohnen, V., Ogawa, T., Peter, T., Simon, P. C., Whung, P.-Y., and Volz-Thomas, A.: International Global Atmospheric Chemistry Observations System (IGACO) Theme Report, edited by: Barrie, L., Borrell, P., and Langen, J., ESA SP-1282, 54 pp., IGOS, Geneva, Switzerland, 2004. a, b
Benedetti, A., Morcrette, J.-J., Boucher, O., Dethof, A., Engelen, R. J., Fisher, M., Flentje, H., Huneeus, N., Jones, L., Kaiser, J. W., Kinne, S., Mangold, A., Razinger, M., Simmons, A. J., and Suttie, M.: Aerosol analysis and forecast in the European Centre for Medium-Range Weather Forecasts Integrated Forecast System: 2. Data assimilation, J. Geophys. Res.-Atmos., 114, D13205, https://doi.org/10.1029/2008JD011115, 2009. a
Benedetti, A., Reid, J. S., and Colarco, P. R.: International cooperative for aerosol prediction workshop on aerosol forecast verification, B. Am. Meteorol. Soc., 92, ES48–ES53, https://doi.org/10.1175/BAMS-D-11-00105.1, 2011. a, b
Benedetti, A., Baldasano, J. M., Basart, S., Benincasa, F., Boucher, O., Brooks, M. E., Chen, J.-P., Colarco, P. R., Gong, S., Huneeus, N., Jones, L., Lu, S., Menut, L., Morcrette, J.-J., Mulcahy, J., Nickovic, S., Pérez García-Pando, C., Reid, J. S., Sekiyama, T. T., Tanaka, T. Y., Terradellas, E., Westphal, D. L., Zhang, X.-Y., and Zhou, C.-H.: Operational dust prediction, in: Mineral Dust, 223–265, Springer, Dordrecht, 2014. a
Benedetti, A., Di Giuseppe, F., Flemming, J., Inness, A., Parrington, M., Rémy, S., and Ziemke, J.: Atmospheric composition changes due to the extreme 2015 Indonesian fire season triggered by El Niño [in “State of the Climate in 2015”], B. Am. Meteorol. Soc., 97, S56–S57, 2016. a
Bergametti, G. and Fôret, G.: Chapter 8, in: Mineral Dust, 179–200, Springer, Dordrecht, 2014. a
Bergametti, G., Marticorena, B., Rajot, J., Chatenet, B., Féron, A., Gaimoz, C., Siour, G., Coulibaly, M., Koné, I., Maman, A., and Zakou, A.: Dust Uplift Potential in the Central Sahel: An Analysis Based on 10 years of Meteorological Measurements at High Temporal Resolution, J. Geophys. Res.-Atmos., 122, 12433–12448, https://doi.org/10.1002/2017JD027471, 2017. a, b
Bessho, K., Date, K., Hayashi, M., Ikeda, A., Imai, T., Inoue, H., Kumagai, Y., Miyakawa, T., Murata, H., Ohno, T., Okuyama, A., Oyama, R., Sasaki, Y., Shimazu, Y., Shimoji, K., Sumida, Y., Suzuki, M., Taniguchi, H., Tsuchiyama, H., Uesawa, D., Yokota, H., and Yoshida, R.: An introduction to Himawari-8/9-Japan's new-generation geostationary meteorological satellites, J. Meteorol. Soc. Jpn. II, 94, 151–183, 2016. a
Bogdanoff, A. S., Westphal, D. L., Campbell, J. R., Cummings, J. A., Hyer, E. J., Reid, J. S., and Clayson, C. A.: Sensitivity of infrared sea surface temperature retrievals to the vertical distribution of airborne dust aerosol, Remote Sens. Environ., 159, 1–13, 2015. a
Bond, T. C. and Bergstrom, R. W.: Light absorption by carbonaceous particles: An investigative review, Aerosol Sci. Tech., 40, 27–67, 2006. a
Bormann, N., Bonavita, M., Dragani, R., Eresmaa, R., Matricardi, M., and McNally, A.: Enhancing the impact of IASI observations through an updated observation-error covariance matrix, Q. J. Roy. Meteor. Soc., 142, 1767–1780, 2016. a
Cakmur, R., Miller, R., Perlwitz, J., Geogdzhayev, I., Ginoux, P., Koch, D., Kohfeld, K., Tegen, I., and Zender, C.: Constraining the magnitude of the global dust cycle by minimizing the difference between a model and observations, J. Geophys. Res.-Atmos., 111, D06207, https://doi.org/10.1029/2005JD005791, 2006. a
Callaghan, A. H.: An improved whitecap timescale for sea spray aerosol production flux modeling using the discrete whitecap method, J. Geophys. Res.-Atmos., 118, 9997, https://doi.org/10.1002/jgrd.50768, 2013. a
Campbell, J. R., Tackett, J. L., Reid, J. S., Zhang, J., Curtis, C. A., Hyer, E. J., Sessions, W. R., Westphal, D. L., Prospero, J. M., Welton, E. J., Omar, A. H., Vaughan, M. A., and Winker, D. M.: Evaluating nighttime CALIOP 0.532 µm aerosol optical depth and extinction coefficient retrievals, Atmos. Meas. Tech., 5, 2143–2160, https://doi.org/10.5194/amt-5-2143-2012, 2012. a
Capelle, V., Chédin, A., Siméon, M., Tsamalis, C., Pierangelo, C., Pondrom, M., Crevoisier, C., Crepeau, L., and Scott, N. A.: Evaluation of IASI-derived dust aerosol characteristics over the tropical belt, Atmos. Chem. Phys., 14, 9343–9362, https://doi.org/10.5194/acp-14-9343-2014, 2014. a
Chen, C., Dubovik, O., Henze, D. K., Lapyonak, T., Chin, M., Ducos, F., Litvinov, P., Huang, X., and Li, L.: Retrieval of Desert Dust and Carbonaceous Aerosol Emissions over Africa from POLDER/PARASOL Products Generated by GRASP Algorithm, Atmos. Chem. Phys. Discuss., https://doi.org/10.5194/acp-2018-35, in review, 2018. a
Chin, M., Ginoux, P., Lucchesi, R., Huebert, B., Weber, R., Anderson, T., Masonis, S., Blomquist, B., Bandy, A., and Thornton, D.: A global aerosol model forecast for the ACE-Asia field experiment, J. Geophys. Res.-Atmos., 108, D23S90, https://doi.org/10.1029/2004JD004829, 2003. a
Chow, J. C., Yu, J. Z., Watson, J. G., Hang Ho, S. S., Bohannan, T. L., Hays, M. D., and Fung, K. K.: The application of thermal methods for determining chemical composition of carbonaceous aerosols: A review, J. Environ. Sci. Heal. A, 42, 1521–1541, 2007. a
Chylek, P. and Wong, J.: Effect of absorbing aerosols on global radiation budget, Geophys. Res. Lett., 22, 929–931, 1995. a
Colarco, P., daSilva, A., and Darmenov, A.: The NASA GEOS-5 Aerosol Forecasting System, NASA GSFC Technical Report GSFC.ABS.4714.2011, Greenbelt, MD, USA, 2011. a
Colarco, P. R., Benedetti, A., Reid, J., and Tanaka, T.: Using EOS data to improve aerosol forecasting: the International Cooperative for Aerosol Research (ICAP), The Earth Observer, NASA GSFC, Greenbelt, MD, USA, 2014. a
Cowie, S. M., Knippertz, P., and Marsham, J. H.: Are vegetation-related roughness changes the cause of the recent decrease in dust emission from the Sahel?, Geophys. Res. Lett., 40, 1868–1872, 2013. a
Cowie, S. M., Marsham, J. H., and Knippertz, P.: The importance of rare, high-wind events for dust uplift in northern Africa, Geophys. Res. Lett., 42, 8208–8215, 2015. a
Cuevas, E., Camino, C., Benedetti, A., Basart, S., Terradellas, E., Baldasano, J. M., Morcrette, J. J., Marticorena, B., Goloub, P., Mortier, A., Berjón, A., Hernández, Y., Gil-Ojeda, M., and Schulz, M.: The MACC-II 2007–2008 reanalysis: atmospheric dust evaluation and characterization over northern Africa and the Middle East, Atmos. Chem. Phys., 15, 3991–4024, https://doi.org/10.5194/acp-15-3991-2015, 2015. a
Darmenov, A. and da Silva, A.: The quick fire emissions dataset (QFED) – documentation of versions 2.1, 2.2 and 2.4, NASA Technical Report Series on Global Modeling and Data Assimilation, NASA TM-2013-104606, Vol. 32, 183 pp., http://gmao.gsfc.nasa.gov/pubs/tm/ (last access: 18 July 2018), 2013. a
Darmenova, K., Sokolik, I. N., Shao, Y., Marticorena, B., and Bergametti, G.: Development of a physically based dust emission module within the Weather Research and Forecasting (WRF) model: Assessment of dust emission parameterizations and input parameters for source regions in Central and East Asia, J. Geophys. Res.-Atmos., 114, D14201, https://doi.org/10.1029/2008JD011236, 2009. a
de Leeuw, G., Andreas, E. L., Anguelova, M. D., Fairall, C., Lewis, E. R., O'Dowd, C., Schulz, M., and Schwartz, S. E.: Production flux of sea spray aerosol, Rev. Geophys., 49, RG2001, https://doi.org/10.1029/2010RG000349, 2011. a, b
Di Giuseppe, F., Rémy, S., Pappenberger, F., and Wetterhall, F.: Improving Forecasts of Biomass Burning Emissions with the Fire Weather Index, J. Appl. Meteorol. Clim., 56, 2789–2799, 2017. a
Di Giuseppe, F., Rémy, S., Pappenberger, F., and Wetterhall, F.: Using the Fire Weather Index (FWI) to improve the estimation of fire emissions from fire radiative power (FRP) observations, Atmos. Chem. Phys., 18, 5359–5370, https://doi.org/10.5194/acp-18-5359-2018, 2018. a
Di Tomaso, E., Schutgens, N. A. J., Jorba, O., and Pérez García-Pando, C.: Assimilation of MODIS Dark Target and Deep Blue observations in the dust aerosol component of NMMB-MONARCH version 1.0, Geosci. Model Dev., 10, 1107–1129, https://doi.org/10.5194/gmd-10-1107-2017, 2017. a, b, c, d
Elbern, H., Strunk, A., Schmidt, H., and Talagrand, O.: Emission rate and chemical state estimation by 4-dimensional variational inversion, Atmos. Chem. Phys., 7, 3749–3769, https://doi.org/10.5194/acp-7-3749-2007, 2007. a
Escribano, J., Boucher, O., Chevallier, F., and Huneeus, N.: Subregional inversion of North African dust sources, J. Geophys. Res.-Atmos., 121, 8549–8566, 2016. a
Escribano, J., Boucher, O., Chevallier, F., and Huneeus, N.: Impact of the choice of the satellite aerosol optical depth product in a sub-regional dust emission inversion, Atmos. Chem. Phys., 17, 7111–7126, https://doi.org/10.5194/acp-17-7111-2017, 2017. a, b, c
Eyre, J., Andersson, E., Charpentier, E., Dibbern, J., Lafeuille, J., Ondrás̀, M., and Riishojgaard, L. P.: WMO CBS activities relevant to observations in the Arctic, community White Paper for Arctic Observing Summit 2013, WMO, Geneva, Switzerland, 2013. a
Fécan, F., Marticorena, B., and Bergametti, G.: Parametrization of the increase of the aeolian erosion threshold wind friction velocity due to soil moisture for arid and semi-arid areas, in: Annales Geophysicae, Vol. 17, 149–157, Springer, Dordrecht, 1998. a
Fiedler, S., Schepanski, K., Heinold, B., Knippertz, P., and Tegen, I.: Climatology of nocturnal low-level jets over North Africa and implications for modeling mineral dust emission, J. Geophys. Res.-Atmos., 118, 6100–6121, 2013. a
Fomba, K. W., Müller, K., van Pinxteren, D., Poulain, L., van Pinxteren, M., and Herrmann, H.: Long-term chemical characterization of tropical and marine aerosols at the Cape Verde Atmospheric Observatory (CVAO) from 2007 to 2011, Atmos. Chem. Phys., 14, 8883–8904, https://doi.org/10.5194/acp-14-8883-2014, 2014. a
French, N. H., Goovaerts, P., and Kasischke, E. S.: Uncertainty in estimating carbon emissions from boreal forest fires, J. Geophys. Res.-Atmos., 109, D14S08, https://doi.org/10.1029/2003JD003635, 2004. a
French, N. H., de Groot, W. J., Jenkins, L. K., Rogers, B. M., Alvarado, E., Amiro, B., De Jong, B., Goetz, S., Hoy, E., Hyer, E., Keane, R., Law, B. E., McKenzie, D.,. McNulty, S. G., Ottmar, R., Pérez-Salicrup, D. R., Randerson, J., Robertson, K. M., and Turetsky, M.: Model comparisons for estimating carbon emissions from North American wildland fire, J. Geophys. Res.-Biogeo., 116, G00K05, https://doi.org/10.1029/2010JG001469, 2011. a
Fromm, M., Tupper, A., Rosenfeld, D., Servranckx, R., and McRae, R.: Violent pyro-convective storm devastates Australia's capital and pollutes the stratosphere, Geophys. Res. Lett., 33, L05815, https://doi.org/10.1029/2005GL025161, 2006. a
Fu, D., Xia, X., Duan, M., Zhang, X., Li, X., Wang, J., and Liu, J.: Mapping nighttime PM2.5 from VIIRS DNB using a linear mixed-effect model, Atmos. Environ., 178, 214–222, 2018. a
Fu, Y., Desboeufs, K., Vincent, J., Bon Nguyen, E., Laurent, B., Losno, R., and Dulac, F.: Estimating chemical composition of atmospheric deposition fluxes from mineral insoluble particles deposition collected in the western Mediterranean region, Atmos. Meas. Tech., 10, 4389–4401, https://doi.org/10.5194/amt-10-4389-2017, 2017. a
Ginoux, P.: Effects of nonsphericity on mineral dust modeling, J. Geophys. Res.-Atmos., 108, 4052, https://doi.org/10.1029/2002JD002516, 2003. a
Ginoux, P., Prospero, J. M., Gill, T. E., Hsu, N. C., and Zhao, M.: Global-scale attribution of anthropogenic and natural dust sources and their emission rates based on MODIS Deep Blue aerosol products, Rev. Geophys., 50, RG3005, https://doi.org/10.1029/2012RG000388, 2012. a
Granier, C., Bessagnet, B., Bond, T., D'Angiola, A., van Der Gon, H. D., Frost, G. J., Heil, A., Kaiser, J. W., Kinne, S., Klimont, Z., Kloster, S., Lamarque, J.-F., Liousse, C., Masui, T., Meleux, F., Mieville, A., Ohara, T., Raut, J.-C., Riahi, K., Schultz, M. G., Smith, S. J., Thompson, A., van Aardenne, J., van der Werf, G. R., and van Vuuren, D. P.: Evolution of anthropogenic and biomass burning emissions of air pollutants at global and regional scales during the 1980–2010 period, Climatic Change, 109, 163, https://doi.org/10.1007/s10584-011-0154-1, 2011. a
Haywood, J., Ramaswamy, V., and Soden, B.: Tropospheric aerosol climate forcing in clear-sky satellite observations over the oceans, Science, 283, 1299–1303, 1999. a
Heinold, B., Knippertz, P., Marsham, J., Fiedler, S., Dixon, N., Schepanski, K., Laurent, B., and Tegen, I.: The role of deep convection and nocturnal low-level jets for dust emission in summertime West Africa: Estimates from convection-permitting simulations, J. Geophys. Res.-Atmos., 118, 4385–4400, 2013. a
Hobby, M., Gascoyne, M., Marsham, J. H., Bart, M., Allen, C., Engelstaedter, S., Fadel, D. M., Gandega, A., Lane, R., McQuaid, J. B., Ouchene, B., Ouladichir, A., Parker, D. J., Rosenberg, P., Ferroudj, M. S., Saci, A., Seddik, F., Todd, M., Walker, D., and Washington, R.: The Fennec automatic weather station (AWS) network: Monitoring the Saharan climate system, J. Atmos. Ocean. Tech., 30, 709–724, 2013. a
Holben, B. N., Eck, T., Slutsker, I., Tanre, D., Buis, J., Setzer, A., Vermote, E., Reagan, J., Kaufman, Y., Nakajima, T., Lavenu, F., Jankowiak, I., and Smirnov, A.: AERONET – A federated instrument network and data archive for aerosol characterization, Remote Sens. Environ., 66, 1–16, 1998. a, b
Holben, B. N., Kim, J., Sano, I., Mukai, S., Eck, T. F., Giles, D. M., Schafer, J. S., Sinyuk, A., Slutsker, I., Smirnov, A., Sorokin, M., Anderson, B. E., Che, H., Choi, M., Crawford, J. H., Ferrare, R. A., Garay, M. J., Jeong, U., Kim, M., Kim, W., Knox, N., Li, Z., Lim, H. S., Liu, Y., Maring, H., Nakata, M., Pickering, K. E., Piketh, S., Redemann, J., Reid, J. S., Salinas, S., Seo, S., Tan, F., Tripathi, S. N., Toon, O. B., and Xiao, Q.: An overview of mesoscale aerosol processes, comparisons, and validation studies from DRAGON networks, Atmos. Chem. Phys., 18, 655–671, https://doi.org/10.5194/acp-18-655-2018, 2018. a
Hollmann, R., Merchant, C. J., Saunders, R., Downy, C., Buchwitz, M., Cazenave, A., Chuvieco, E., Defourny, P., de Leeuw, G., Forsberg, R., Holzer-Popp, T., Paul, F., Sandven, S., Sathyendranath, S., van Roozendael, M., and Wagner, W.: The ESA climate change initiative: Satellite data records for essential climate variables, B. Am. Meteorol. Soc., 94, 1541–1552, 2013. a
Hsu, N. C., Tsay, S.-C., King, M. D., and Herman, J. R.: Aerosol properties over bright-reflecting source regions, IEEE T. Geosci. Remote Sens., 42, 557–569, 2004. a
Huijnen, V., Wooster, M., Kaiser, J., Gaveau, D., Flemming, J., Parrington, M., Inness, A., Murdiyarso, D., Main, B., and Van Weele, M.: Fire carbon emissions over maritime southeast Asia in 2015 largest since 1997, Sci. Rep.-UK, 6, 26886, https://doi.org/10.1038/srep26886, 2016. a
Huneeus, N., Chevallier, F., and Boucher, O.: Estimating aerosol emissions by assimilating observed aerosol optical depth in a global aerosol model, Atmos. Chem. Phys., 12, 4585–4606, https://doi.org/10.5194/acp-12-4585-2012, 2012. a, b, c
Huneeus, N., Basart, S., Fiedler, S., Morcrette, J.-J., Benedetti, A., Mulcahy, J., Terradellas, E., Pérez García-Pando, C., Pejanovic, G., Nickovic, S., Arsenovic, P., Schulz, M., Cuevas, E., Baldasano, J. M., Pey, J., Remy, S., and Cvetkovic, B.: Forecasting the northern African dust outbreak towards Europe in April 2011: a model intercomparison, Atmos. Chem. Phys., 16, 4967–4986, https://doi.org/10.5194/acp-16-4967-2016, 2016. a
Hyer, E. J., Reid, J. S., and Zhang, J.: An over-land aerosol optical depth data set for data assimilation by filtering, correction, and aggregation of MODIS Collection 5 optical depth retrievals, Atmos. Meas. Tech., 4, 379–408, https://doi.org/10.5194/amt-4-379-2011, 2011. a
Ingleby, B., Pauley, P., Kats, A., Ator, J., Keyser, D., Doerenbecher, A., Fucile, E., Hasegawa, J., Toyoda, E., Kleinert, T., Qu, W., St. James, J., Tennant, W., and Weedon, R.: Progress toward high-resolution, real-time radiosonde reports, B. Am. Meteorol. Soc., 97, 2149–2161, 2016. a
Ishizuka, M., Mikami, M., Leys, J., Yamada, Y., Heidenreich, S., Shao, Y., and McTainsh, G.: Effects of soil moisture and dried raindroplet crust on saltation and dust emission, J. Geophys. Res.-Atmos., 113, 2008. a
Jaeglé, L., Quinn, P. K., Bates, T. S., Alexander, B., and Lin, J.-T.: Global distribution of sea salt aerosols: new constraints from in situ and remote sensing observations, Atmos. Chem. Phys., 11, 3137–3157, https://doi.org/10.5194/acp-11-3137-2011, 2011. a
Johnson, R. S., Zhang, J., Hyer, E. J., Miller, S. D., and Reid, J. S.: Preliminary investigations toward nighttime aerosol optical depth retrievals from the VIIRS Day/Night Band, Atmos. Meas. Tech., 6, 1245–1255, https://doi.org/10.5194/amt-6-1245-2013, 2013. a
Journet, E., Balkanski, Y., and Harrison, S. P.: A new data set of soil mineralogy for dust-cycle modeling, Atmos. Chem. Phys., 14, 3801–3816, https://doi.org/10.5194/acp-14-3801-2014, 2014. a
Kaiser, J. W., Heil, A., Andreae, M. O., Benedetti, A., Chubarova, N., Jones, L., Morcrette, J.-J., Razinger, M., Schultz, M. G., Suttie, M., and van der Werf, G. R.: Biomass burning emissions estimated with a global fire assimilation system based on observed fire radiative power, Biogeosciences, 9, 527–554, https://doi.org/10.5194/bg-9-527-2012, 2012. a, b, c, d
Keene, W. C., Long, M. S., Reid, J. S., Frossard, A. A., Kieber, D. J., Maben, J. R., Russell, L. M., Kinsey, J. D., Quinn, P. K., and Bates, T. S.: Factors That Modulate Properties of Primary Marine Aerosol Generated From Ambient Seawater on Ships at Sea, J. Geophys. Res.-Atmos., 122, 11961–11990, https://doi.org/10.1002/2017JD026872, 2017. a
Kergoat, L., Guichard, F., Pierre, C., and Vassal, C.: Influence of dry-season vegetation variability on Sahelian dust during 2002–2015, Geophys. Res. Lett., 44, 5231–5239, https://doi.org/10.1002/2016GL072317, 2017. a, b
Khade, V. M., Hansen, J. A., Reid, J. S., and Westphal, D. L.: Ensemble filter based estimation of spatially distributed parameters in a mesoscale dust model: experiments with simulated and real data, Atmos. Chem. Phys., 13, 3481–3500, https://doi.org/10.5194/acp-13-3481-2013, 2013. a, b
Kim, S.-W., Yoon, S.-C., Dutton, E. G., Kim, J., Wehrli, C., and Holben, B. N.: Global surface-based sun photometer network for long-term observations of column aerosol optical properties: intercomparison of aerosol optical depth, Aerosol Sci. Tech., 42, 1–9, 2008. a
Klose, M. and Shao, Y.: Stochastic parameterization of dust emission and application to convective atmospheric conditions, Atmos. Chem. Phys., 12, 7309–7320, https://doi.org/10.5194/acp-12-7309-2012, 2012. a
Klüser, L., Erbertseder, T., and Meyer-Arnek, J.: Observation of volcanic ash from Puyehue-Cordón Caulle with IASI, Atmos. Meas. Tech., 6, 35–46, https://doi.org/10.5194/amt-6-35-2013, 2013. a
Knippertz, P. and Todd, M. C.: Mineral dust aerosols over the Sahara: Meteorological controls on emission and transport and implications for modeling, Rev. Geophys., 50, RG1007, https://doi.org/10.1029/2011RG000362, 2012. a
Kocha, C., Tulet, P., Lafore, J.-P., and Flamant, C.: The importance of the diurnal cycle of Aerosol Optical Depth in West Africa, Geophys. Res. Lett., 40, 785–790, 2013. a
Kok, J. F., Mahowald, N. M., Fratini, G., Gillies, J. A., Ishizuka, M., Leys, J. F., Mikami, M., Park, M.-S., Park, S.-U., Van Pelt, R. S., and Zobeck, T. M.: An improved dust emission model – Part 1: Model description and comparison against measurements, Atmos. Chem. Phys., 14, 13023–13041, https://doi.org/10.5194/acp-14-13023-2014, 2014. a
Kokhanovsky, A.: Remote sensing of atmospheric aerosol using spaceborne optical observations, Earth-Sci. Rev., 116, 95–108, 2013. a
Kolusu, S. R., Marsham, J. H., Mulcahy, J., Johnson, B., Dunning, C., Bush, M., and Spracklen, D. V.: Impacts of Amazonia biomass burning aerosols assessed from short-range weather forecasts, Atmos. Chem. Phys., 15, 12251–12266, https://doi.org/10.5194/acp-15-12251-2015, 2015. a
Kukkonen, J., Balk, T., Schultz, D., Baklanov, A., Klein, T., Miranda, A., Monteiro, A., Hirtl, M., Tarvainen, V., Boy, M., Peuch, V.-H., Poupkou, A., Kioutsioukis, I., Finardi, S., Sofiev, M., Sokhi, R., Lehtinen, K. E. J., Karatzas, K., Josè, R. S., Astitha, M., Kallos, G., Schaap, M., Reimer, E., Jakobs, H., and Eben, K.: Operational chemical weather forecasting models on a regional scale in Europe, in: Air Pollution Modeling and its Application XXI, 359–365, Springer, Dordrecht, 2011. a
Laj, P., Klausen, J., Bilde, M., Plass-Duelmer, C., Pappalardo, G., Clerbaux, C., Baltensperger, U., Hjorth, J., Simpson, D., Reimann, S., Coheur, P.-F., Richter, A., De Mazière, M., Rudich, Y., McFiggans, G., Torseth, K., Wiedensohler, A., Morin, S., Schulz, M., Allan, J. D., Attiét, J.-L., Barnes, I., Birmili, W., Cammas, J. P., Dommen, J., Dorn, H.-P., Fowler, D., Fuzzi, S., Glasius, M., Granier, C., Hermann, M., Isaksen, I. S. A., Kinne, S., Koreno, I., Madonna, F., Maione, M., Massling, A., Moehler, O., Mona, L., Monks, P. S., Müllerr, D., Müller, T., Orphal, J., Peuch, V.-H., Stratmann, F., Tanré, D., Tyndall, G., Abo Riziq, A., Van Roozendael, M., Villani, P., Wehner, B., Wex, H., and Zardini, A. A.: Measuring atmospheric composition change, Atmos. Environ., 43, 5351–5414, 2009. a
Largeron, Y., Guichard, F., Bouniol, D., Couvreux, F., Kergoat, L., and Marticorena, B.: Can we use surface wind fields from meteorological reanalyses for Sahelian dust emission simulations?, Geophys. Res. Lett., 42, 2490–2499, 2015. a
Laurent, B., Losno, R., Chevaillier, S., Vincent, J., Roullet, P., Bon Nguyen, E., Ouboulmane, N., Triquet, S., Fornier, M., Raimbault, P., and Bergametti, G.: An automatic collector to monitor insoluble atmospheric deposition: application for mineral dust deposition, Atmos. Meas. Tech., 8, 2801–2811, https://doi.org/10.5194/amt-8-2801-2015, 2015. a
Li, J., Li, X., Carlson, B. E., Kahn, R. A., Lacis, A. A., Dubovik, O., and Nakajima, T.: Reducing multisensor satellite monthly mean aerosol optical depth uncertainty: 1. Objective assessment of current AERONET locations, J. Geophys. Res.-Atmos., 121, 13609–13627, https://doi.org/10.1002/2016JD025469, 2016. a
Liu, Z., Liu, Q., Lin, H.-C., Schwartz, C. S., Lee, Y.-H., and Wang, T.: Three-dimensional variational assimilation of MODIS aerosol optical depth: Implementation and application to a dust storm over East Asia, J. Geophys. Res.-Atmos., 116, D23206, https://doi.org/10.1029/2011JD016159, 2011. a
López-Aparicio, S., Guevara, M., Thunis, P., Cuvelier, K., and Tarrasón, L.: Assessment of discrepancies between bottom-up and regional emission inventories in Norwegian urban areas, Atmos. Environ., 154, 285–296, 2017. a
Lynch, P., Reid, J. S., Westphal, D. L., Zhang, J., Hogan, T. F., Hyer, E. J., Curtis, C. A., Hegg, D. A., Shi, Y., Campbell, J. R., Rubin, J. I., Sessions, W. R., Turk, F. J., and Walker, A. L.: An 11-year global gridded aerosol optical thickness reanalysis (v1.0) for atmospheric and climate sciences, Geosci. Model Dev., 9, 1489–1522, https://doi.org/10.5194/gmd-9-1489-2016, 2016. a
Mailler, S., Menut, L., Khvorostyanov, D., Valari, M., Couvidat, F., Siour, G., Turquety, S., Briant, R., Tuccella, P., Bessagnet, B., Colette, A., Létinois, L., Markakis, K., and Meleux, F.: CHIMERE-2017: from urban to hemispheric chemistry-transport modeling, Geosci. Model Dev., 10, 2397–2423, https://doi.org/10.5194/gmd-10-2397-2017, 2017. a
Marsham, J. H., Knippertz, P., Dixon, N. S., Parker, D. J., and Lister, G.: The importance of the representation of deep convection for modeled dust-generating winds over West Africa during summer, Geophys. Res. Lett., 38, L16803, https://doi.org/10.1029/2011GL048368, 2011. a, b
Marsham, J. H., Hobby, M., Allen, C., Banks, J., Bart, M., Brooks, B., Cavazos-Guerra, C., Engelstaedter, S., Gascoyne, M., Lima, A., Martins, J. V., McQuaid, J. B., O'Leary, A., Ouchene, B., Ouladichir, A., Parker, D. J., Saci, A., Salah-Ferroudj, M., Todd, M. C., and Washington, R.: Meteorology and dust in the central Sahara: Observations from Fennec supersite-1 during the June 2011 Intensive Observation Period, J. Geophys. Res.-Atmos., 118, 4069–4089, https://doi.org/10.1002/jgrd.50211, 2013. a, b
Mårtensson, E., Nilsson, E., de Leeuw, G., Cohen, L., and Hansson, H.-C.: Laboratory simulations and parameterization of the primary marine aerosol production, J. Geophys. Res.-Atmos., 108, 4297, https://doi.org/10.1029/2002JD002263, 2003. a
Marticorena, B. and Bergametti, G.: Modeling the atmospheric dust cycle: 1. Design of a soil-derived dust emission scheme, J. Geophys. Res.-Atmos., 100, 16415–16430, 1995. a
Marticorena, B., Chatenet, B., Rajot, J. L., Traoré, S., Coulibaly, M., Diallo, A., Koné, I., Maman, A., NDiaye, T., and Zakou, A.: Temporal variability of mineral dust concentrations over West Africa: analyses of a pluriannual monitoring from the AMMA Sahelian Dust Transect, Atmos. Chem. Phys., 10, 8899–8915, https://doi.org/10.5194/acp-10-8899-2010, 2010. a, b
Martin, M. V., Kahn, R. A., Logan, J. A., Paguam, R., Wooster, M., and Ichoku, C.: Space-based Observational Constraints for 1-D Plume Rise Models, J. Geophys. Res., 117, D22204, https://doi.org/10.1029/2012JD018370, 2012. a
McHardy, T. M., Zhang, J., Reid, J. S., Miller, S. D., Hyer, E. J., and Kuehn, R. E.: An improved method for retrieving nighttime aerosol optical thickness from the VIIRS Day/Night Band, Atmos. Meas. Tech., 8, 4773–4783, https://doi.org/10.5194/amt-8-4773-2015, 2015. a
Menut, L.: Sensitivity of hourly Saharan dust emissions to NCEP and ECMWF modeled wind speed, J. Geophys. Res.-Atmos., 113, D16201, https://doi.org/10.1029/2007JD009522, 2008. a
Menut, L. and Bessagnet, B.: Atmospheric composition forecasting in Europe, Ann. Geophys., 28, 61–74, https://doi.org/10.5194/angeo-28-61-2010, 2010. a
Menut, L., Rea, G., Mailler, S., Khvorostyanov, D., and Turquety, S.: Aerosol forecast over the Mediterranean area during July 2013 (ADRIMED/CHARMEX), Atmos. Chem. Phys., 15, 7897–7911, https://doi.org/10.5194/acp-15-7897-2015, 2015. a
Merchant, C., Embury, O., Le Borgne, P., and Bellec, B.: Saharan dust in nighttime thermal imagery: Detection and reduction of related biases in retrieved sea surface temperature, Remote Sens. Environ., 104, 15–30, 2006. a
Michael, K., Murphy, K., Lowe, D., Masuoka, E., Vollmer, B., Tilmes, C., Teague, M., Ye, G., Maiden, M., Goodman, H. M., and Justice, C.: Implementation of the land, atmosphere near real-time capability for EOS (LANCE), in: Geoscience and Remote Sensing Symposium (IGARSS), 2010 IEEE International, 1442–1445, IEEE, 2010. a
Mona, L., Liu, Z., Müller, D., Omar, A., Papayannis, A., Pappalardo, G., Sugimoto, N., and Vaughan, M.: Lidar measurements for desert dust characterization: an overview, Adv. Meteorol., 2012, 356265, https://doi.org/10.1155/2012/356265, 2012. a
Monahan, E. C., Spiel, D. E., and Davidson, K. L.: A model of marine aerosol generation via whitecaps and wave disruption, in: Oceanic whitecaps, 167–174, Springer, Dordrecht, 1986. a, b
Nelson, D. L., Garay, M. J., Kahn, R. A., and Dunst, B. A.: Stereoscopic Height and Wind Retrievals for Aerosol Plumes with the MISR INteractive eXplorer (MINX), Remote Sens., 5, 4593–4628, https://doi.org/10.3390/rs5094593, 2013. a
Nickovic, S., Cvetkovic, B., Madonna, F., Rosoldi, M., Pejanovic, G., Petkovic, S., and Nikolic, J.: Cloud ice caused by atmospheric mineral dust – Part 1: Parameterization of ice nuclei concentration in the NMME-DREAM model, Atmos. Chem. Phys., 16, 11367–11378, https://doi.org/10.5194/acp-16-11367-2016, 2016. a
Norris, S. J., Brooks, I. M., Moat, B. I., Yelland, M. J., de Leeuw, G., Pascal, R. W., and Brooks, B.: Near-surface measurements of sea spray aerosol production over whitecaps in the open ocean, Ocean Sci., 9, 133–145, https://doi.org/10.5194/os-9-133-2013, 2013a. a
Norris, S. J., Brooks, I. M., and Salisbury, D. J.: A wave roughness Reynolds number parameterization of the sea spray source flux, Geophys. Res. Lett., 40, 4415–4419, 2013b. a
O'Neill, N., Eck, T., Smirnov, A., Holben, B., and Thulasiraman, S.: Spectral discrimination of coarse and fine mode optical depth, J. Geophys. Res.-Atmos., 108, 4559, https://doi.org/10.1029/2002JD002975, 2003. a
Pantillon, F., Knippertz, P., Marsham, J. H., and Birch, C. E.: A parameterization of convective dust storms for models with mass-flux convection schemes, J. Atmos. Sci., 72, 2545–2561, 2015. a
Pantillon, F., Knippertz, P., Marsham, J. H., Panitz, H.-J., and Bischoff-Gauss, I.: Modeling haboob dust storms in large-scale weather and climate models, J. Geophys. Res.-Atmos., 121, 2090–2109, 2016. a
Petrenko, M., Kahn, R., Chin, M., Soja, A., and Kucsera, T.: The use of satellite-measured aerosol optical depth to constrain biomass burning emissions source strength in the global model GOCART, J. Geophys. Res.-Atmos., 117, D18212, https://doi.org/10.1029/2012JD017870, 2012. a
Petrenko, M., Kahn, R., Chin, M., and Limbacher, J.: Refined Use of Satellite Aerosol Optical Depth Snapshots to Constrain Biomass Burning Emissions in the GOCART Model, J. Geophys. Res.-Atmos., 122, 10983–11004, https://doi.org/10.1002/2017JD026693, 2017. a
Peyridieu, S., Chédin, A., Capelle, V., Tsamalis, C., Pierangelo, C., Armante, R., Crevoisier, C., Crépeau, L., Siméon, M., Ducos, F., and Scott, N. A.: Characterisation of dust aerosols in the infrared from IASI and comparison with PARASOL, MODIS, MISR, CALIOP, and AERONET observations, Atmos. Chem. Phys., 13, 6065–6082, https://doi.org/10.5194/acp-13-6065-2013, 2013. a
Pio, C. A., Cardoso, J. G., Cerqueira, M. A., Calvo, A., Nunes, T. V., Alves, C. A., Custódio, D., Almeida, S. M., and Almeida-Silva, M.: Seasonal variability of aerosol concentration and size distribution in Cape Verde using a continuous aerosol optical spectrometer, Frontiers in Environmental Science, 2, 15, https://doi.org/10.3389/fenvs.2014.00015, 2014. a
Pope, R., Marsham, J., Knippertz, P., Brooks, M., and Roberts, A.: Identifying errors in dust models from data assimilation, Geophys. Res. Lett., 43, 9270–9279, 2016. a
Popp, T., de Leeuw, G., Bingen, C., Brühl, C., Capelle, V., Chedin, A., Clarisse, L., Dubovik, O., Grainger, R., Griesfeller, J., Heckel, A., Kinne, S., Klüser, L., Kosmale, M., Kolmonen, P., Lelli, L., Litvinov, P., Mei, L., North, P., Pinnock, S., Povey, A., Robert, C., Schulz, M., Sogacheva, L., Stebel, K., Stein Zweers, D., Thomas, G., Gijsbert Tilstra, L., Vandenbussche, S., Veefkind, P., Vountas, M., and Xue, Y.: Development, production and evaluation of aerosol climate data records from European satellite observations (Aerosol_cci), Remote Sens., 8, 421, https://doi.org/10.3390/rs8050421, 2016. a
Prospero, J. M., Ginoux, P., Torres, O., Nicholson, S. E., and Gill, T. E.: Environmental characterization of global sources of atmospheric soil dust identified with the Nimbus 7 total ozone mapping spectrometer (TOMS) absorbing aerosol product, Rev. Geophys., 40, 1002, https://doi.org/10.1029/2000RG000095, 2002. a
Quan, X., Huang, H.-L., Zhang, L., Weisz, E., and Cao, X.: Sensitive detection of aerosol effect on simulated IASI spectral radiance, J. Quant. Spectrosc. Ra., 122, 214–232, 2013. a
Reid, J. S., Jonsson, H. H., Maring, H. B., Smirnov, A., Savoie, D. L., Cliff, S. S., Reid, E. A., Livingston, J. M., Meier, M. M., Dubovik, O., and Tsay, S.-C.: Comparison of size and morphological measurements of coarse mode dust particles from Africa, J. Geophys. Res.-Atmos., 108, 8593, https://doi.org/10.1029/2002JD002485, 2003. a, b
Reid, J. S., Brooks, B., Crahan, K. K., Hegg, D. A., Eck, T. F., O'Neill, N., de Leeuw, G., Reid, E. A., and Anderson, K. D.: Reconciliation of coarse mode sea-salt aerosol particle size measurements and parameterizations at a subtropical ocean receptor site, J. Geophys. Res.-Atmos., 111, D02202, https://doi.org/10.1029/2005JD006200, 2006. a, b
Reid, J. S., Reid, E. A., Walker, A., Piketh, S., Cliff, S., Al Mandoos, A., Tsay, S.-C., and Eck, T. F.: Dynamics of southwest Asian dust particle size characteristics with implications for global dust research, J. Geophys. Res.-Atmos., 113, D14212, https://doi.org/10.1029/2007JD009752, 2008. a, b
Reid, J. S., Hyer, E. J., Prins, E. M., Westphal, D. L., Zhang, J., Wang, J., Christopher, S. A., Curtis, C. A., Schmidt, C. C., Eleuterio, D. P., Richardson, K. A., and Hoffman, J. P.: Global monitoring and forecasting of biomass-burning smoke: Description of and lessons from the Fire Locating and Modeling of Burning Emissions (FLAMBE) program, IEEE J. Sel. Top. Appl., 2, 144–162, 2009a. a
Reid, J. S., Hyer, E. J., Prins, E. M., Westphal, D. L., Zhang, J., Wang, J., Christopher, S. A., Curtis, C. A., Schmidt, C. C., Eleuterio, D. P., Richardson, K. A., and Hoffman, J. P.: Global monitoring and forecasting of biomass-burning smoke: Description of and lessons from the Fire Locating and Modeling of Burning Emissions (FLAMBE) program, IEEE J. Sel. Top. Appl., 2, 144–162, 2009b. a
Reid, J. S., Benedetti, A., Colarco, P. R., and Hansen, J. A.: International Operational Aerosol Observability Workshop, B. Am. Meteorol. Soc., 92, ES21–ES24, https://doi.org/10.1175/2010BAMS3183.1, 2011. a, b
Reid, J. S., Hyer, E. J., Johnson, R. S., Holben, B. N., Yokelson, R. J., Zhang, J., Campbell, J. R., Christopher, S. A., Di Girolamo, L., Giglio, L., Holz, R. E., Kearney, C., Miettinen, J., Reid, E. A., Turk, F. J., Zhao, G., Balasubramanian, R., Chew, B. N., Janjai, S., Lagrosas, N., Lestari, P., Lin, N.-H., Mahmud, M., Nguyen, A. X., Norris, B., Oanhu, N. T. K., Santo, M. O., Salinas, V., Welton, E. J., and Liew, S. C.: Observing and understanding the Southeast Asian aerosol system by remote sensing: An initial review and analysis for the Seven Southeast Asian Studies (7SEAS) program, Atmos. Res., 122, 403–468, 2013. a
Reid, J. S., Kuehn, R. E., Holz, R. E., Eloranta, E. W., Kaku, K. C., Kuang, S., Newchurch, M. J., Thompson, A. M., Trepte, C. R., Zhang, J., Atwood, S. A., Hand, J. L., Holben, B. N., Minnis, P., and Posselt, D. J.: Ground-based High Spectral Resolution Lidar observation of aerosol vertical distribution in the summertime Southeast United States, J. Geophys. Res.-Atmos., 122, 2970–3004, 2017. a
Remer, L. A., Kaufman, Y., Tanré, D., Mattoo, S., Chu, D., Martins, J. V., Li, R.-R., Ichoku, C., Levy, R., Kleidman, R., Eck, T. F., Vermote, E., and Holben, B. N.: The MODIS aerosol algorithm, products, and validation, J. Atmos. Sci., 62, 947–973, 2005. a
Roberts, A. J., Marsham, J. H., and Knippertz, P.: Disagreements in low-level moisture between (re) analyses over summertime West Africa, Mon. Weather Rev., 143, 1193–1211, 2015. a
Roberts, A. J., Marsham, J. H., Knippertz, P., Parker, D. J., Bart, M., Garcia-Carreras, L., Hobby, M., McQuaid, J. B., Rosenberg, P. D., and Walker, D.: New Saharan wind observations reveal substantial biases in analysed dust-generating winds, Atmos. Sci. Lett., 18, 366–372, 2017. a, b, c
Roberts, A. J., Woodage, M. J., Marsham, J. H., Highwood, E. J., Ryder, C. L., McGinty, W., Wilson, S., and Crook, J.: Can explicit convection improve modelled dust in summertime West Africa?, Atmos. Chem. Phys., 18, 9025–9048, https://doi.org/10.5194/acp-18-9025-2018, 2018. a
Rubin, J. I., Reid, J. S., Hansen, J. A., Anderson, J. L., Collins, N., Hoar, T. J., Hogan, T., Lynch, P., McLay, J., Reynolds, C. A., Sessions, W. R., Westphal, D. L., and Zhang, J.: Development of the Ensemble Navy Aerosol Analysis Prediction System (ENAAPS) and its application of the Data Assimilation Research Testbed (DART) in support of aerosol forecasting, Atmos. Chem. Phys., 16, 3927–3951, https://doi.org/10.5194/acp-16-3927-2016, 2016. a, b
Rubin, J. I., Reid, J. S., Hansen, J. A., Anderson, J. L., Holben, B. N., Xian, P., Westphal, D. L., and Zhang, J.: Assimilation of AERONET and MODIS AOT observations using variational and ensemble data assimilation methods and its impact on aerosol forecasting skill, J. Geophys. Res.-Atmos., 122, 4967–4992, 2017. a, b
Ryder, C. L., Highwood, E. J., Rosenberg, P. D., Trembath, J., Brooke, J. K., Bart, M., Dean, A., Crosier, J., Dorsey, J., Brindley, H., Banks, J., Marsham, J. H., McQuaid, J. B., Sodemann, H., and Washington, R.: Optical properties of Saharan dust aerosol and contribution from the coarse mode as measured during the Fennec 2011 aircraft campaign, Atmos. Chem. Phys., 13, 303–325, https://doi.org/10.5194/acp-13-303-2013, 2013. a
Saide, P. E., Kim, J., Song, C. H., Choi, M., Cheng, Y., and Carmichael, G. R.: Assimilation of next generation geostationary aerosol optical depth retrievals to improve air quality simulations, Geophys. Res. Lett., 41, 9188–9196, 2014. a
Salisbury, D. J., Anguelova, M. D., and Brooks, I. M.: On the variability of whitecap fraction using satellite-based observations, J. Geophys. Res.-Oceans, 118, 6201–6222, 2013. a
Salisbury, D. J., Anguelova, M. D., and Brooks, I. M.: Global distribution and seasonal dependence of satellite-based whitecap fraction, Geophys. Res. Lett., 41, 1616–1623, 2014. a
Salter, M. E., Nilsson, E. D., Butcher, A., and Bilde, M.: On the seawater temperature dependence of the sea spray aerosol generated by a continuous plunging jet, J. Geophys. Res.-Atmos., 119, 9052–9072, 2014a. a
Salter, M. E., Nilsson, E. D., Butcher, A., and Bilde, M.: On the seawater temperature dependence of the sea spray aerosol generated by a continuous plunging jet, J. Geophys. Res.-Atmos., 119, 9052–9072, 2014b. a
Salter, M. E., Zieger, P., Acosta Navarro, J. C., Grythe, H., Kirkevåg, A., Rosati, B., Riipinen, I., and Nilsson, E. D.: An empirically derived inorganic sea spray source function incorporating sea surface temperature, Atmos. Chem. Phys., 15, 11047–11066, https://doi.org/10.5194/acp-15-11047-2015, 2015. a
Schepanski, K., Tegen, I., Laurent, B., Heinold, B., and Macke, A.: A new Saharan dust source activation frequency map derived from MSG-SEVIRI IR-channels, Geophys. Res. Lett., 34, L18803, https://doi.org/10.1029/2007GL030168, 2007. a
Schmit, T. J., Li, J., Ackerman, S. A., and Gurka, J. J.: High-spectral-and high-temporal-resolution infrared measurements from geostationary orbit, J. Atmos. Ocean. Tech., 26, 2273–2292, 2009. a
Schuster, G. L., Dubovik, O., Holben, B. N., and Clothiaux, E. E.: Inferring black carbon content and specific absorption from Aerosol Robotic Network (AERONET) aerosol retrievals, J. Geophys. Res.-Atmos., 110, D10S17, https://doi.org/10.1029/2004JD004548, 2005. a
Schutgens, N., Nakata, M., and Nakajima, T.: Estimating aerosol emissions by assimilating remote sensing observations into a global transport model, Remote Sens., 4, 3528–3543, 2012. a
Schwartz, C. S., Liu, Z., Lin, H.-C., and McKeen, S. A.: Simultaneous three-dimensional variational assimilation of surface fine particulate matter and MODIS aerosol optical depth, J. Geophys. Res.-Atmos., 117, D13202, https://doi.org/10.1029/2011JD017383, 2012. a
Sekiyama, T. T., Tanaka, T. Y., Shimizu, A., and Miyoshi, T.: Data assimilation of CALIPSO aerosol observations, Atmos. Chem. Phys., 10, 39–49, https://doi.org/10.5194/acp-10-39-2010, 2010. a
Sellegri, K., O'Dowd, C., Yoon, Y., Jennings, S., and de Leeuw, G.: Surfactants and submicron sea spray generation, J. Geophys. Res.-Atmos., 111, D22215, https://doi.org/10.1029/2005JD006658, 2006. a
Sessions, W. R., Reid, J. S., Benedetti, A., Colarco, P. R., da Silva, A., Lu, S., Sekiyama, T., Tanaka, T. Y., Baldasano, J. M., Basart, S., Brooks, M. E., Eck, T. F., Iredell, M., Hansen, J. A., Jorba, O. C., Juang, H.-M. H., Lynch, P., Morcrette, J.-J., Moorthi, S., Mulcahy, J., Pradhan, Y., Razinger, M., Sampson, C. B., Wang, J., and Westphal, D. L.: Development towards a global operational aerosol consensus: basic climatological characteristics of the International Cooperative for Aerosol Prediction Multi-Model Ensemble (ICAP-MME), Atmos. Chem. Phys., 15, 335–362, https://doi.org/10.5194/acp-15-335-2015, 2015. a, b, c
Shao, Y.: A model for mineral dust emission, J. Geophys. Res.-Atmos., 106, 20239–20254, 2001. a
Shi, Y., Zhang, J., Reid, J. S., Hyer, E. J., and Hsu, N. C.: Critical evaluation of the MODIS Deep Blue aerosol optical depth product for data assimilation over North Africa, Atmos. Meas. Tech., 6, 949–969, https://doi.org/10.5194/amt-6-949-2013, 2013a. a
Shi, Y., Zhang, J., Reid, J. S., Liu, B., and Hyer, E. J.: Critical evaluation of cloud contamination in the MISR aerosol products using MODIS cloud mask products, Atmos. Meas. Tech., 7, 1791–1801, https://doi.org/10.5194/amt-7-1791-2014, 2014b. a
Sofiev, M., Ermakova, T., and Vankevich, R.: Evaluation of the smoke-injection height from wild-land fires using remote-sensing data, Atmos. Chem. Phys., 12, 1995–2006, https://doi.org/10.5194/acp-12-1995-2012, 2012. a
Sofiev, M., Vankevich, R., Ermakova, T., and Hakkarainen, J.: Global mapping of maximum emission heights and resulting vertical profiles of wildfire emissions, Atmos. Chem. Phys., 13, 7039–7052, https://doi.org/10.5194/acp-13-7039-2013, 2013. a
Spada, M., Jorba, O., Pérez García-Pando, C., Janjic, Z., and Baldasano, J. M.: Modeling and evaluation of the global sea-salt aerosol distribution: sensitivity to size-resolved and sea-surface temperature dependent emission schemes, Atmos. Chem. Phys., 13, 11735–11755, https://doi.org/10.5194/acp-13-11735-2013, 2013. a, b
Takamura, T., Nakajima, T., and SKYNET community group: Overview of SKYNET and its activities, Opt. Pura Appl., 37, 3303–3308, 2004. a
Terradellas, E.: SDS-WAS multi-model ensemble: a tool for dust forecast and climatological analysis, in: International Asian dust and Aerosol Workshop, 21 September 2016, Jeju, Korea, 2016. a
Torres, B., Dubovik, O., Fuertes, D., Schuster, G., Cachorro, V. E., Lapyonok, T., Goloub, P., Blarel, L., Barreto, A., Mallet, M., Toledano, C., and Tanré, D.: Advanced characterisation of aerosol size properties from measurements of spectral optical depth using the GRASP algorithm, Atmos. Meas. Tech., 10, 3743–3781, https://doi.org/10.5194/amt-10-3743-2017, 2017. a
Tosca, M. G., Randerson, J. T., and Zender, C. S.: Global impact of smoke aerosols from landscape fires on climate and the Hadley circulation, Atmos. Chem. Phys., 13, 5227–5241, https://doi.org/10.5194/acp-13-5227-2013, 2013. a
Toth, T. D., Campbell, J. R., Reid, J. S., Tackett, J. L., Vaughan, M. A., Zhang, J., and Marquis, J. W.: Minimum aerosol layer detection sensitivities and their subsequent impacts on aerosol optical thickness retrievals in CALIPSO level 2 data products, Atmos. Meas. Tech., 11, 499–514, https://doi.org/10.5194/amt-11-499-2018, 2018. a
Val Martin, M., Logan, J. A., Kahn, R. A., Leung, F.-Y., Nelson, D. L., and Diner, D. J.: Smoke injection heights from fires in North America: analysis of 5 years of satellite observations, Atmos. Chem. Phys., 10, 1491–1510, https://doi.org/10.5194/acp-10-1491-2010, 2010. a
Wang, J., Aegerter, C., Xu, X., and Szykman, J. J.: Potential application of VIIRS Day/Night Band for monitoring nighttime surface PM2.5 air quality from space, Atmos. Environ., 124, 55–63, 2016. a
Wang, R., Tao, S., Balkanski, Y., Ciais, P., Boucher, O., Liu, J., Piao, S., Shen, H., Vuolo, M. R., Valari, M., Chen, H., Chen, Y., Cozic, A., Huang, Y., Li, B., Li, W., Shen, G., Wang, B., and Zhang, Y.: Exposure to ambient black carbon derived from a unique inventory and high-resolution model, P. Natl. Acad. Sci. USA, 111, 2459–2463, 2014. a
Washington, R., Todd, M. C., Engelstaedter, S., Mbainayel, S., and Mitchell, F.: Dust and the low-level circulation over the Bodélé Depression, Chad: Observations from BoDEx 2005, J. Geophys. Res.-Atmos., 111, D03201, https://doi.org/10.1029/2005JD006502, 2006. a
Weaver, C., da Silva, A., Chin, M., Ginoux, P., Dubovik, O., Flittner, D., Zia, A., Remer, L., Holben, B., and Gregg, W.: Direct insertion of MODIS radiances in a global aerosol transport model, J. Atmos. Sci., 64, 808–827, 2007. a
Wehrli, C. J.: Remote sensing of aerosol optical depth in a global surface network, PhD thesis, https://doi.org/10.3929/ethz-a-005659798, DISS. ETH NO. 17591, ETH, Zurich, Switzerland, 2008. a
Witek, M. L., Garay, M. J., Diner, D. J., Bull, M. A., and Seidel, F. C.: New approach to the retrieval of AOD and its uncertainty from MISR observations over dark water, Atmos. Meas. Tech., 11, 429–439, https://doi.org/10.5194/amt-11-429-2018, 2018. a
Woolf, D. K., Bowyer, P. A., and Monahan, E. C.: Discriminating between the film drops and jet drops produced by a simulated whitecap, J. Geophys. Res.-Oceans, 92, 5142–5150, 1987. a
Yu, H., Chin, M., Yuan, T., Bian, H., Remer, L. A., Prospero, J. M., Omar, A., Winker, D., Yang, Y., Zhang, Y., Zhang, Y., and Zhao, C.: The fertilizing role of African dust in the Amazon rainforest: a first multiyear assessment based on data from Cloud-Aerosol Lidar and Infrared Pathfinder Satellite Observations, Geophys. Res. Lett., 42, 1984–1991, 2015. a, b
Yumimoto, K. and Takemura, T.: The SPRINTARS version 3.80/4D-Var data assimilation system: development and inversion experiments based on the observing system simulation experiment framework, Geosci. Model Dev., 6, 2005–2022, https://doi.org/10.5194/gmd-6-2005-2013, 2013. a
Yumimoto, K., Nagao, T., Kikuchi, M., Sekiyama, T., Murakami, H., Tanaka, T., Ogi, A., Irie, H., Khatri, P., Okumura, H., Arai, K., Morino, I., Uchino, O., and Maki, T.: Aerosol data assimilation using data from Himawari-8, a next-generation geostationary meteorological satellite, Geophys. Res. Lett., 43, 5886–5894, 2016. a
Zender, C. S., Bian, H., and Newman, D.: Mineral Dust Entrainment and Deposition (DEAD) model: Description and 1990s dust climatology, J. Geophys. Res.-Atmos., 108, 4416, https://doi.org/10.1029/2002JD002775, 2003. a
Zhang, J. and Reid, J. S.: MODIS aerosol product analysis for data assimilation: Assessment of over-ocean level 2 aerosol optical thickness retrievals, J. Geophys. Res.-Atmos., 111, D22207, https://doi.org/10.1029/2005JD006898, 2006. a, b
Zhang, J., Reid, J. S., Westphal, D. L., Baker, N. L., and Hyer, E. J.: A system for operational aerosol optical depth data assimilation over global oceans, J. Geophys. Res.-Atmos., 113, D10208, https://doi.org/10.1029/2007JD009065, 2008. a
Zhang, Y., Bocquet, M., Mallet, V., Seigneur, C., and Baklanov, A.: Real-time air quality forecasting, part I: History, techniques, and current status, Atmos. Environ., 60, 632–655, 2012a. a
Zhang, Y., Bocquet, M., Mallet, V., Seigneur, C., and Baklanov, A.: Real-time air quality forecasting, part II: State of the science, current research needs, and future prospects, Atmos. Environ., 60, 656–676, 2012b. a