the Creative Commons Attribution 4.0 License.
the Creative Commons Attribution 4.0 License.
 | 23 Jul 2018
African volcanic emissions influencing atmospheric aerosols over the Amazon rain forest
Florian Ditas
Marloes Penning de Vries
Bruna A. Holanda
Mira L. Pöhlker
Samara Carbone
David Walter
Nicole Bobrowski
Joel Brito
Xuguang Chi
Alexandra Gutmann
Isabella Hrabe de Angelis
Luiz A. T. Machado
Daniel Moran-Zuloaga
Julian Rüdiger
Johannes Schneider
Christiane Schulz
Qiaoqiao Wang
Manfred Wendisch
Paulo Artaxo
Thomas Wagner
Ulrich Pöschl
Meinrat O. Andreae
The long-range transport (LRT) of trace gases and aerosol particles plays an important role for the composition of the Amazonian rain forest atmosphere. Sulfate aerosols originate to a substantial extent from LRT sources and play an important role in the Amazonian atmosphere as strongly light-scattering particles and effective cloud condensation nuclei. The transatlantic transport of volcanic sulfur emissions from Africa has been considered as a source of particulate sulfate in the Amazon; however, direct observations have been lacking so far. This study provides observational evidence for the influence of emissions from the Nyamuragira–Nyiragongo volcanoes in Africa on Amazonian aerosol properties and atmospheric composition during September 2014. Comprehensive ground-based and airborne aerosol measurements together with satellite observations are used to investigate the volcanic event. Under the volcanic influence, hourly mean sulfate mass concentrations in the submicron size range reached up to 3.6 µg m−3 at the Amazon Tall Tower Observatory, the highest value ever reported in the Amazon region. The substantial sulfate injection increased the aerosol hygroscopicity with κ values up to 0.36, thus altering aerosol–cloud interactions over the rain forest. Airborne measurements and satellite data indicate that the transatlantic transport of volcanogenic aerosols occurred in two major volcanic plumes with a sulfate-enhanced layer between 4 and 5 km of altitude. This study demonstrates how African aerosol sources, such as volcanic sulfur emissions, can substantially affect the aerosol cycling and atmospheric processes in Amazonia.
- Article
(1186 KB) - Full-text XML
-
Supplement
(3652 KB) - BibTeX
- EndNote


Sulfate aerosol particles are produced in the atmosphere by the oxidation of sulfur dioxide (SO2) emitted by fossil fuel (FF) combustion, volcanic emissions, and by the oxidation of reduced sulfur compounds, such as DMS (Andreae and Rosenfeld, 2008). These particles scatter solar radiation and act as efficient cloud condensation nuclei (CCN; Stevens and Feingold, 2009). Anthropogenic SO2 emissions have increased over the 20th century to a maximum (120 Tg SO2 year−1) around the year 1980 and declined somewhat thereafter to around 100 Tg SO2 per year, but they are still the most important source of sulfur to the atmosphere (Boucher et al., 2013; http://edgar.jrc.ec.europa.eu/overview.php?v=431, last access: 6 September 2017). Volcanic emissions are the predominant natural source of SO2 and account for about 5 % of total annual SO2 emissions (Textor et al., 2004; Yang et al., 2017). The emitted SO2 is oxidized in the atmosphere to gaseous sulfuric acid, which is converted to sulfate aerosol particles (Chin et al., 1996; Reiner and Arnold, 1994). According to Chin and Jacob (1996), volcanic sulfur emissions can account for 20–40 % of sulfate aerosol particle mass concentrations in the troposphere and might therefore be able to substantially alter the atmospheric composition. Observational evidence of drastic changes hundreds of kilometers downwind of volcanic eruptions affecting physical and chemical aerosol properties can be found in Mather et al. (2003) and Robock (2000, 2007). Some examples are the Pinatubo eruption in 1991 that reached the stratosphere (> 10 km of height; Kirchner et al., 1999), the 2014–2015 tropospheric effusive eruption of the Holuhraun volcano in Iceland (Ilyinskaya et al., 2017), during which the emissions affected the cloud-drop effective radius (reff), while other cloud properties, like the cloud optical depth and the cloud liquid water path, remained unaffected (Malavelle et al., 2017), and the eruptive SO2 emissions of the Calbuco volcano in Chile, which reached southern Africa after being transported over the Atlantic Ocean (Sangeetha et al., 2018). Moreover, a connection between tropical volcanic explosive eruptions and El Niño-like events has been described recently (Khodri et al., 2017). Besides explosive–effusive eruptions, small eruptions and passive degassing account for relatively stable SO2 fluxes (23.0 ± 2.3 Tg year−1, 2005–2015) and on average emit approximately 1 order of magnitude more SO2 compared to explosive eruptions (Carn et al., 2017). To what extent volcanic passive sulfur emissions can affect cloud properties is still debated (Ebmeier et al., 2014; Malavelle et al., 2017).
There are several active volcanoes in Africa. The Nyamuragira–Nyiragongo neighboring volcanoes in the Democratic Republic of the Congo (DRC) were among the strongest passively degassing volcanoes worldwide between 2004 and 2014, with around 150 days of satellite-detected degassing in 2014 (Carn et al., 2016). The strong passive degassing activity of Nyamuragira, which started in 2011 and culminated in the formation of a lava lake in late 2014 (Bobrowski et al., 2017; Campion, 2014), led to 2 orders of magnitude higher SO2 mass emissions from the Nyiragongo–Nyamuragira complex compared to the 2014–2017 average (Barrière et al., 2017). The emissions from Nyamuragira in 2014 have been estimated at ca. 2.3 Tg SO2 year−1 (Fioletov et al., 2016).
In the Amazon rain forest, biogenic sulfate aerosol is sustained by oceanic DMS emissions and to a lesser degree by hydrogen sulfide (H2S), methanethiol (MeSH), and DMS emissions from soils and vegetation (Andreae and Andreae, 1988; Jardine et al., 2015; Martin et al., 2010). Occasional anthropogenic sulfur injections have been attributed to open biomass burning and fossil fuel combustion emissions either from Brazil or, via LRT, from Africa (Andreae et al., 1990; Talbot et al., 1988). Fossil fuel sources (e.g., ship traffic, power plants) do not often influence aerosol particles measured in the remote Amazon forest (Saturno et al., 2017) but can be important downwind of populated areas like Manaus, Brazil (Kuhn et al., 2010; Martin et al., 2016). Recent measurements during the South AMerican Biomass Burning Analysis (SAMBBA) campaign, which focused on biomass burning (BB) emissions, found no correlation between sulfate aerosol and various kinds of BB aerosol particles (Brito et al., 2014). On the other hand, aircraft observations of haze layers at 2–4 km of altitude over the Amazon rain forest have shown high sulfate enrichment in comparison to the boundary layer and the free troposphere concentrations (Andreae et al., 1988). These haze layers have been linked to LRT of aerosol particles from Africa (Holanda et al., 2018). A modeled global sulfate source attribution study showed that peak sulfate concentrations in southern Africa occur between June and August. For this 3-month period, estimated emissions from combustion sources were 0.81 Tg S, decreasing in the following 3 months to 0.66 Tg S (Yang et al., 2017). Observations in the Amazon rain forest have shown that sulfate and organic aerosol (OA) mass concentrations can increase up to 10 times from the wet to the dry season with a rather stable sulfate-to-OA mass ratio throughout the year (Andreae et al., 2015; Fuzzi et al., 2007; Martin et al., 2010).
Northeasterly and southeasterly trade winds (north and south of the intertropical convergence zone, ITCZ) are able to transport aerosols over large distances given the typically weak wet deposition in this latitude band (Wang et al., 2016). During the Amazonian dry season (August–November), the transport of African smoke from southern Africa savanna and shrubland fires is an important source of aerosol in addition to regional emissions (Andreae et al., 1994). Even though the potential impact of the transatlantic transport of African sulfur emissions has been suggested before based on transport models (Yang et al., 2017), no ground-based evidence has been reported previously in the literature concerning the impact of African volcanic sources.
To analyze a major degassing period of the Nyamuragira in September 2014 and the subsequent transatlantic transport of the volcanic plume, this paper combines satellite and backward trajectory data with measurements at the Amazon Tall Tower Observatory as well as during the ACRIDICON-CHUVA aircraft campaign in the Amazon Basin. This comprehensive data set indicates that the African volcanic SO2 emissions were oxidized to particulate sulfate, which reached the central Amazon rain forest and influenced aerosol physical and chemical properties significantly.
2.1 Ground-based instrumentation
The ground-based aerosol data presented here were collected at the Amazon Tall Tower Observatory (ATTO) site (called T0a in the GoAmazon2014/5 experiment; Martin et al., 2016) located in the Uatumã Sustainable Development Reserve, Amazonas, Brazil. Details about the ATTO site infrastructure, instrumentation, and an overview of running measurements can be found in Andreae et al. (2015). Figure 1 shows the ATTO site location and the location of the Nyamuragira volcano in the DRC (1.41∘ S, 29.2∘ E; 3058 m a.s.l). The long-term measurements at ATTO started in 2012. A systematic backward trajectory (BT) analysis of air masses arriving at ATTO can be found in C. Pöhlker et al. (2018). The ATTO aerosol measurements were taken on a triangular mast (02∘08.602′ S, 59∘00.033′ W; 130 m above sea level, a.s.l.) using a 25 mm diameter, 60 m high, stainless steel tube with a laminar sampling flow rate of 30 L min−1. The instruments were installed inside an air-conditioned container where the temperature was kept between 29 and 31 ∘C. All aerosol data were aggregated to hourly mean values. More details on the aerosol sampling setup can be found elsewhere (Moran-Zuloaga et al., 2017; Pöhlker et al., 2016; Saturno et al., 2017).

Equivalent black carbon (BCe) mass concentrations, , were calculated from absorption measurements by a multi-angle absorption photometer (MAAP; model 5012; Thermo Electron Group, Waltham, USA). The details of the instrument are described elsewhere (Petzold and Schönlinner, 2004). The BC mass absorption cross section (MAC) was retrieved from fitting MAAP absorption coefficients at 637 nm wavelength and refractory black carbon (rBC) mass concentrations were measured by using a single-particle soot photometer (SP2) revision D (Droplet Measurement Technologies, Longmont, USA). Details of the technique can be found in Stephens et al. (2003). The MAC calculations are described in Saturno et al. (2017). Light-scattering coefficients were measured using a three-wavelength integrating nephelometer (Aurora 3000; Ecotech Pty Ltd., Knoxfield, Australia). For details of the instrument, see Müller et al. (2011). Absorption and interpolated scattering measurements at a 637 nm wavelength were used to calculate the single scattering albedo of dry aerosol particles, ω0, at this wavelength, which is defined as the ratio of scattering to extinction coefficients (extinction = scattering + absorption). Strong BB- and FF-influenced observations were defined as periods when exceeded the 75th percentile (0.27 µg m−3) and the absorption wavelength dependence was above or within the BC-only regime, respectively. A detailed discussion on the absorption wavelength dependence can be found in Saturno et al. (2017).
An aerosol chemical speciation monitor (ACSM; Aerodyne Research Inc., Billerica, USA) was used to measure online non-refractory aerosol chemical composition (Carbone et al., 2018). These measurements started in February 2014 at the ATTO site. The technique resolves the submicron aerosol chemical species in the following categories: organics, sulfate, nitrate, ammonium, and chloride (Ng et al., 2011). In this study, we only use organics and sulfate mass concentration data, Morg and Msulfate, respectively.
Cloud condensation nuclei (CCN) number concentrations, NCCN, were measured with a CCN counter (CCNC; model CCN-100; Droplet Measurement Technologies, Longmont, USA), which was deployed at the ATTO site starting in March 2014. The instrument scanned over a range of different supersaturations and particle diameters; more details can be found elsewhere (Pöhlker et al., 2016). The hygroscopicity parameter, κ, retrieved for a CCN activation ratio of 50 % is used in this study. Condensation nuclei number concentrations (> 5 nm), NCN, were measured with a condensation particle counter (CPC; model 5412; Grimm Aerosol Technik, Germany).
2.2 Airborne in situ measurements
Chemical species of submicron aerosol particles were measured using a compact time-of-flight aerosol mass spectrometer (C-ToF-AMS) installed onboard the German High-Altitude and Long Range Research Aircraft (HALO; http://www.halo.dlr.de, last access: 13 September 2017), a modified business jet G550 (Gulfstream, Savannah, USA). The C-ToF-MS details are presented in Drewnick et al. (2005) and Schulz et al. (2018). A single-particle soot photometer (SP2; Droplet Measurement Technologies, Longmont, USA) was used to measure rBC mass concentration. The measurements took place between 6 September and 1 October 2014 during the “Aerosol, Cloud, Precipitation, and Radiation Interactions and Dynamics of Convective Cloud Systems” (ACRIDICON) – “Cloud Processes of the Main Precipitation Systems in Brazil: A Contribution to Cloud Resolving Modeling and to the GPM (Global Precipitation Measurement)” (CHUVA) campaign over the Amazon rain forest (Machado et al., 2014). More details on the flight trajectories and instrumentation can be found in Wendisch et al. (2016). In this study, only data up to 7 km of altitude have been used.
2.3 Air mass trajectories
To investigate the probability of the volcanic sulfate plume reaching the ATTO site, trajectories were calculated using the National Oceanic and Atmospheric Administration (NOAA) hybrid single-particle Lagrangian integrated trajectory HYSPLIT model (Draxler and Hess, 1997, 1998; Stein et al., 2015). NOAA Global Data Assimilation System (GDAS; Kleist et al., 2009) data at 1∘ × 1∘ resolution were used as meteorological input for HYSPLIT.
2.4 Satellite SO2 vertical column density data
As one of the most abundant gases in a volcanic plume, SO2 is often used as a tracer for volcanic emissions by a variety of spectroscopic remote sensing techniques. The strong characteristic absorption features in the UV spectral range allow for the quantification of SO2 using differential optical absorption spectroscopy (DOAS; see, e.g., Platt and Stutz, 2008 and Richter and Wagner, 2011) both from the ground (e.g., Bobrowski and Platt, 2007; Galle et al., 2003) and from space (e.g., Eisinger and Burrows, 1998; Khokhar et al., 2005 and Krueger, 1985).
The ozone monitoring instrument (OMI) onboard the National Aeronautics and Space Administration (NASA) Aura satellite, launched in 2004, detects backscattered solar radiation in the UV–Vis range (Levelt et al., 2006). The polar-orbiting instrument crosses the Equator at 13:30 LT (local time). DOAS analysis of OMI spectra yields column densities of trace gases such as NO2, SO2, and HCHO with a spatial resolution of about 13 × 24 km2 away from the swath edges. The OMI wide swath of 2600 km allowed for daily global coverage until the first occurrence of the so-called row anomaly in June 2007, an instrumental problem that causes grievous radiance errors in up to half of the OMI ground pixels (Van Hoek and Claas, 2010). The row anomaly strongly affects the reliability of observations; therefore all affected pixels were removed from the data set prior to analysis.
The OMI SO2 vertical column density (VCD) data presented in this paper were retrieved using the NASA principal-component-based algorithm with an a priori vertical profile representative of a volcanic plume in the middle troposphere (TRM; Li et al., 2013, 2017). The assumption that the volcanic plume is located in the mid-troposphere is justified by the elevation of the volcano (3058 m), the strength of the eruption, and, particularly, the HYSPLIT trajectory analysis presented later in this paper. It is, however, important to note that the sensitivity of the satellite measurements depends systematically on plume altitude. Thus, the absolute values of the SO2 VCD derived from the satellite observations overestimate or underestimate the true values if the plume is located at a higher or lower altitude, respectively. Fortunately, this does not influence our study, as the focus of this paper is on the spatial pattern of the SO2 plumes and not on the SO2 amount. The level-2 data were downloaded from https://mirador.gsfc.nasa.gov/ (last access: 27 October 2017) and gridded to a regular 0.1∘ × 0.1∘ grid for easily handling.
The Amazonian dry season (August–November) Msulfate hourly mean median over 3 years of measurements at the ATTO site was 0.60 µg m−3 (0.41–0.79, interquartile range, IQR) as shown in Fig. 2a. This value slightly increased under the influence of BB (median: 0.83 µg m−3) and did not change significantly during FF combustion influence (median: 0.56 µg m−3). During African dust advection periods when mineral dust particles are usually mixed with BB emissions and sea-salt aerosol particles, Moran-Zuloaga et al. (2017) measured sulfate mass concentrations of ∼ 0.44 µg m−3 using energy-dispersive X-ray analysis and M. L. Pöhlker et al. (2018) reported a Msulfate of ∼ 0.25 ± 0.19 µg m−3 measured by ACSM; both studies were conducted at the ATTO site. All these values and also measurements over the South Atlantic Ocean (Huang et al., 2018) were well below the Msulfate median values measured at ATTO between 21 and 30 September 2014 (1.60 µg m−3; see Fig. 2a). Note that the Msulfate median corresponding to 21–30 September 2014 is higher than 99.3 % of the data measured during the dry seasons and the FF combustion-influenced periods, and it is higher than at least 75 % of the data measured in the BB-influenced periods. Regarding the single scattering albedo, ω0, 637, shown in Fig. 2b, the lowest average was observed during FF-influenced periods, indicating the presence of dark aerosol particles rich in BC, which contrasts with the higher ω0, 637 observed in September 2014. As can be seen in Fig. 2, the ATTO observations between 21 and 30 September 2014 are remarkably different from strong BB-influenced and FF combustion-influenced periods in terms of Msulfate and ω0, 637. Given this, the elevated Msulfate observed in September 2014 could not be explained by combustion sources. Therefore, the possibility of an additional sulfate source, like volcanogenic sulfate aerosol, was considered. In the following section, satellite data and an air mass trajectory analysis are used to study the possibility of a volcanic plume reaching the Amazon rain forest during the period of interest. The last two sections are dedicated to a discussion of the aerosol physicochemical properties measured by aircraft and ground-based instruments.
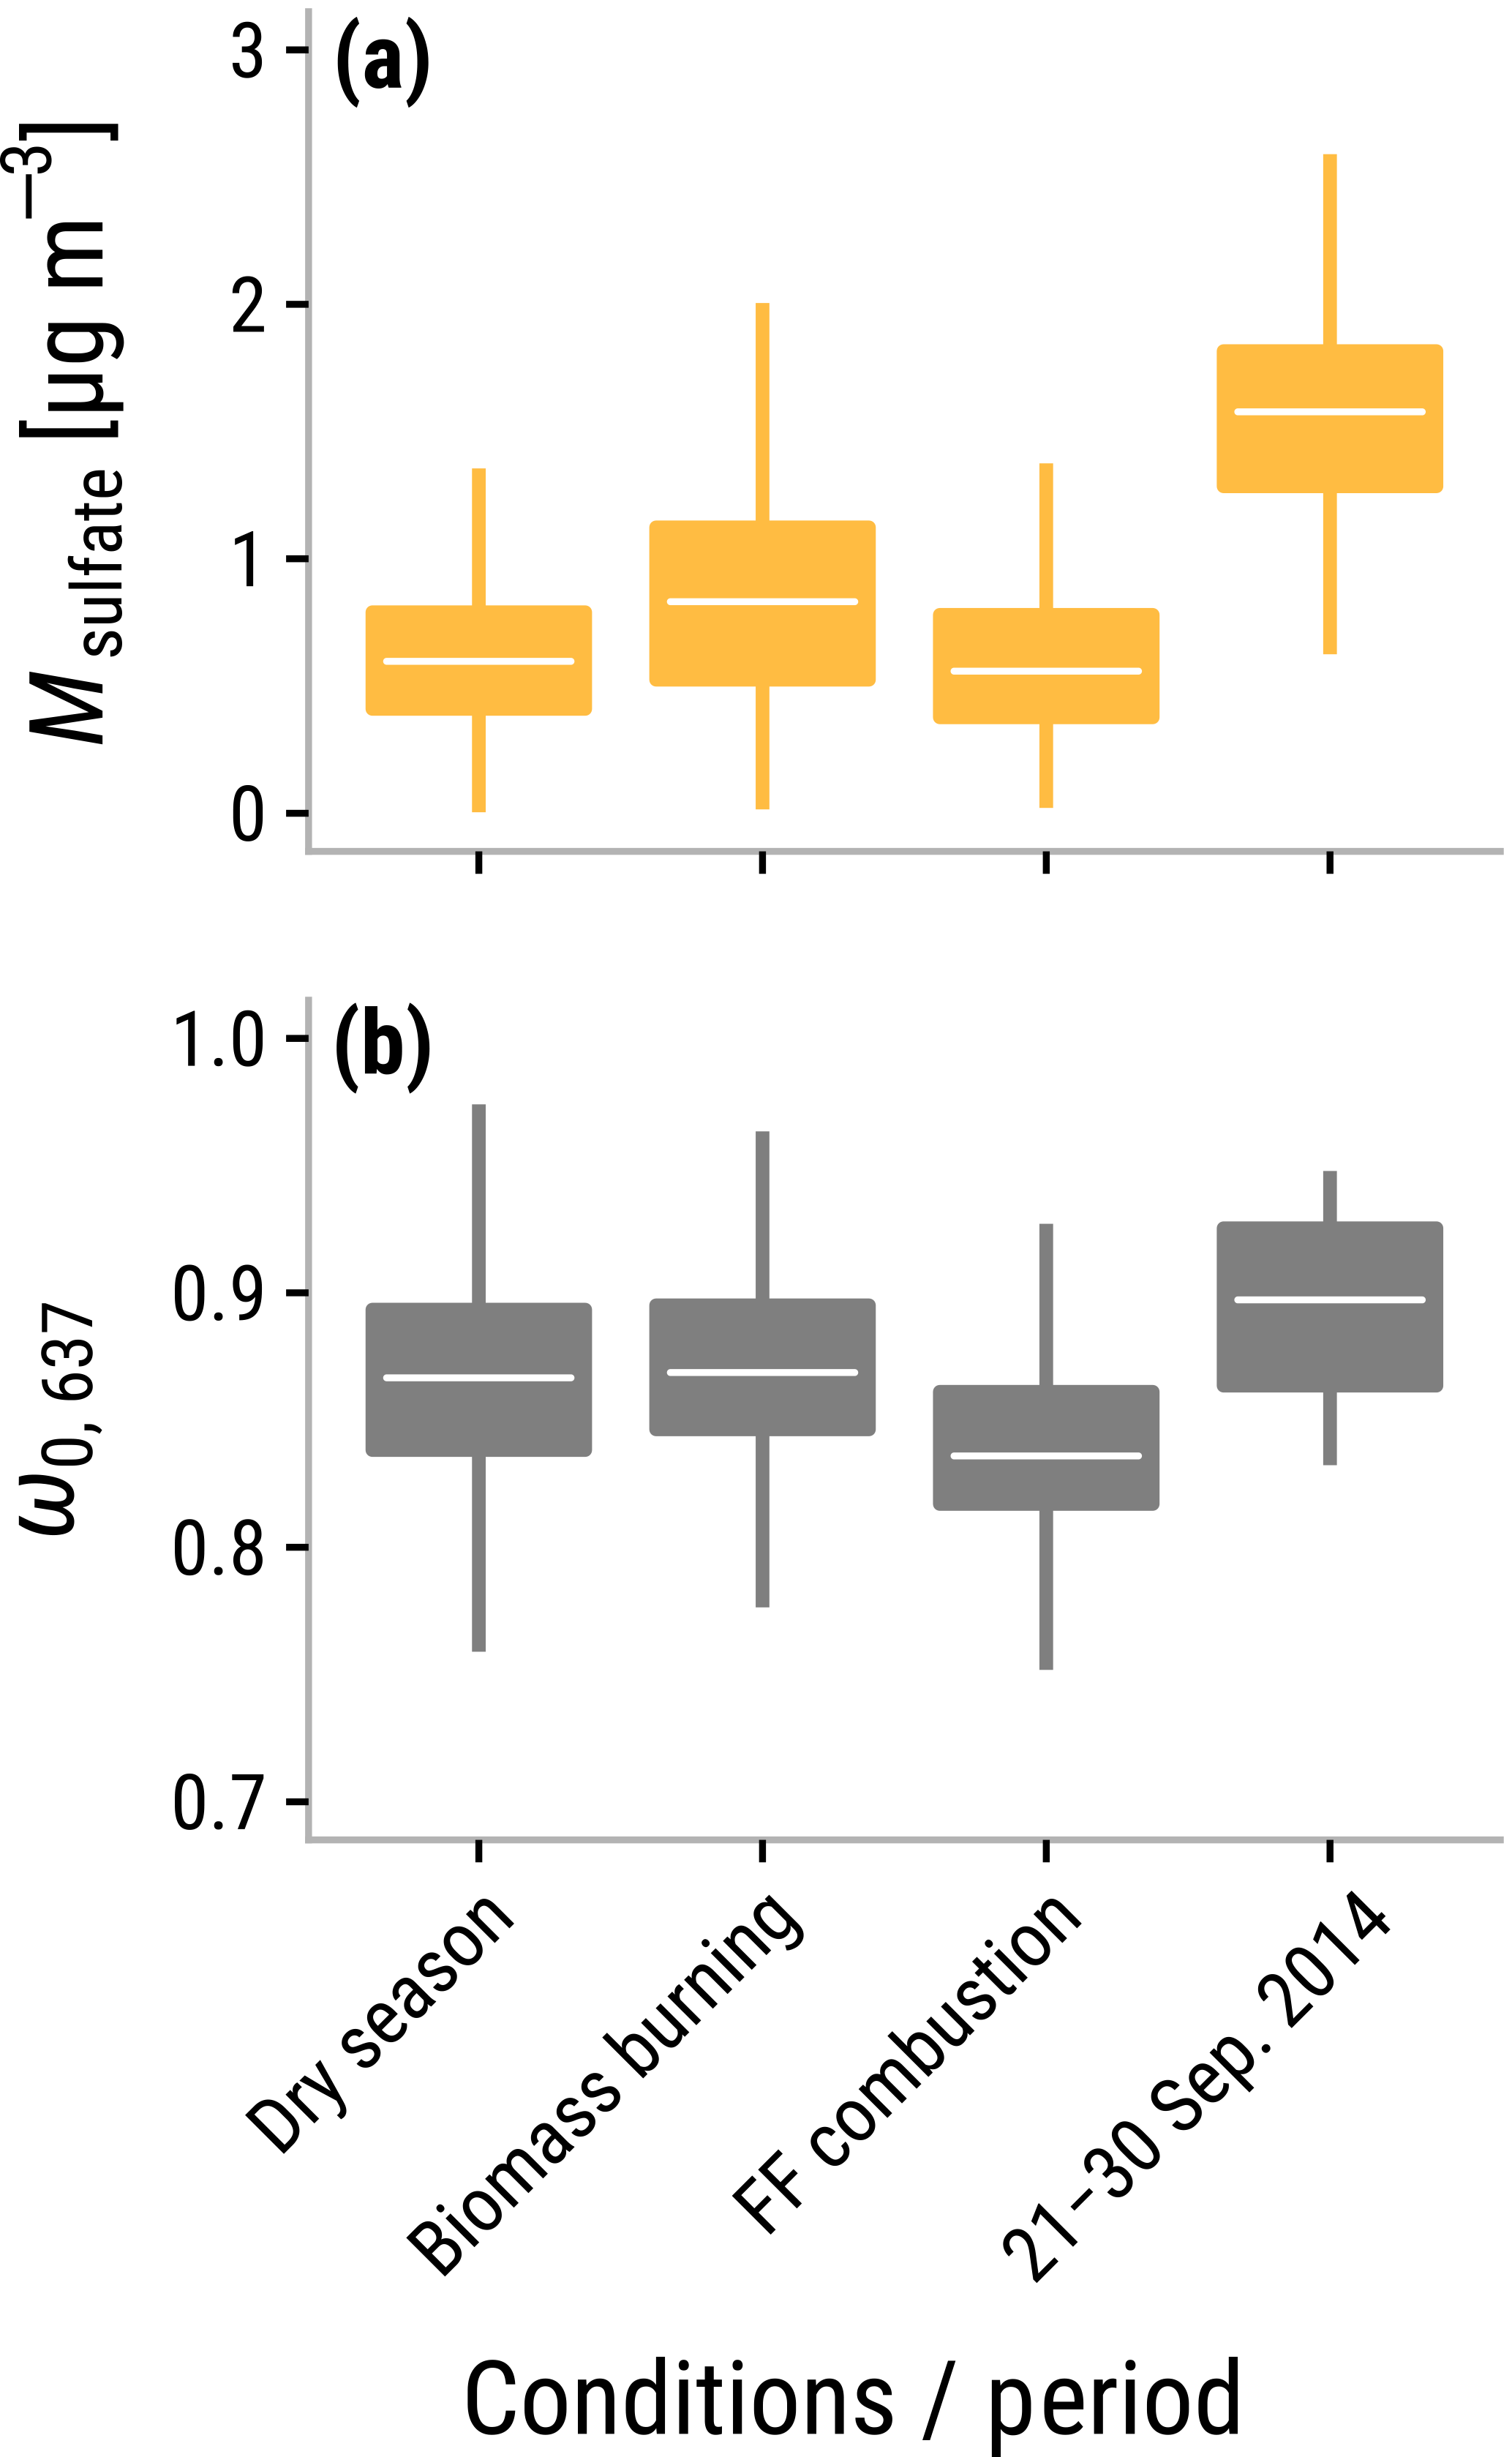
Figure 2Box and whisker plots of hourly mean (a) sulfate mass concentration, Msulfate, and (b) single scattering albedo at 637 nm, ω0, 637, during different periods and conditions including the dry season average 2014–2016, biomass burning and fossil fuel combustion-influenced conditions, and the period of interest from 21 to 30 September 2014. The white segment inside the box represents the median. The lower and upper box edges represent the first and the third quartiles, respectively. The whiskers represent the lowest and highest observations within the 99.3 % confidence interval.
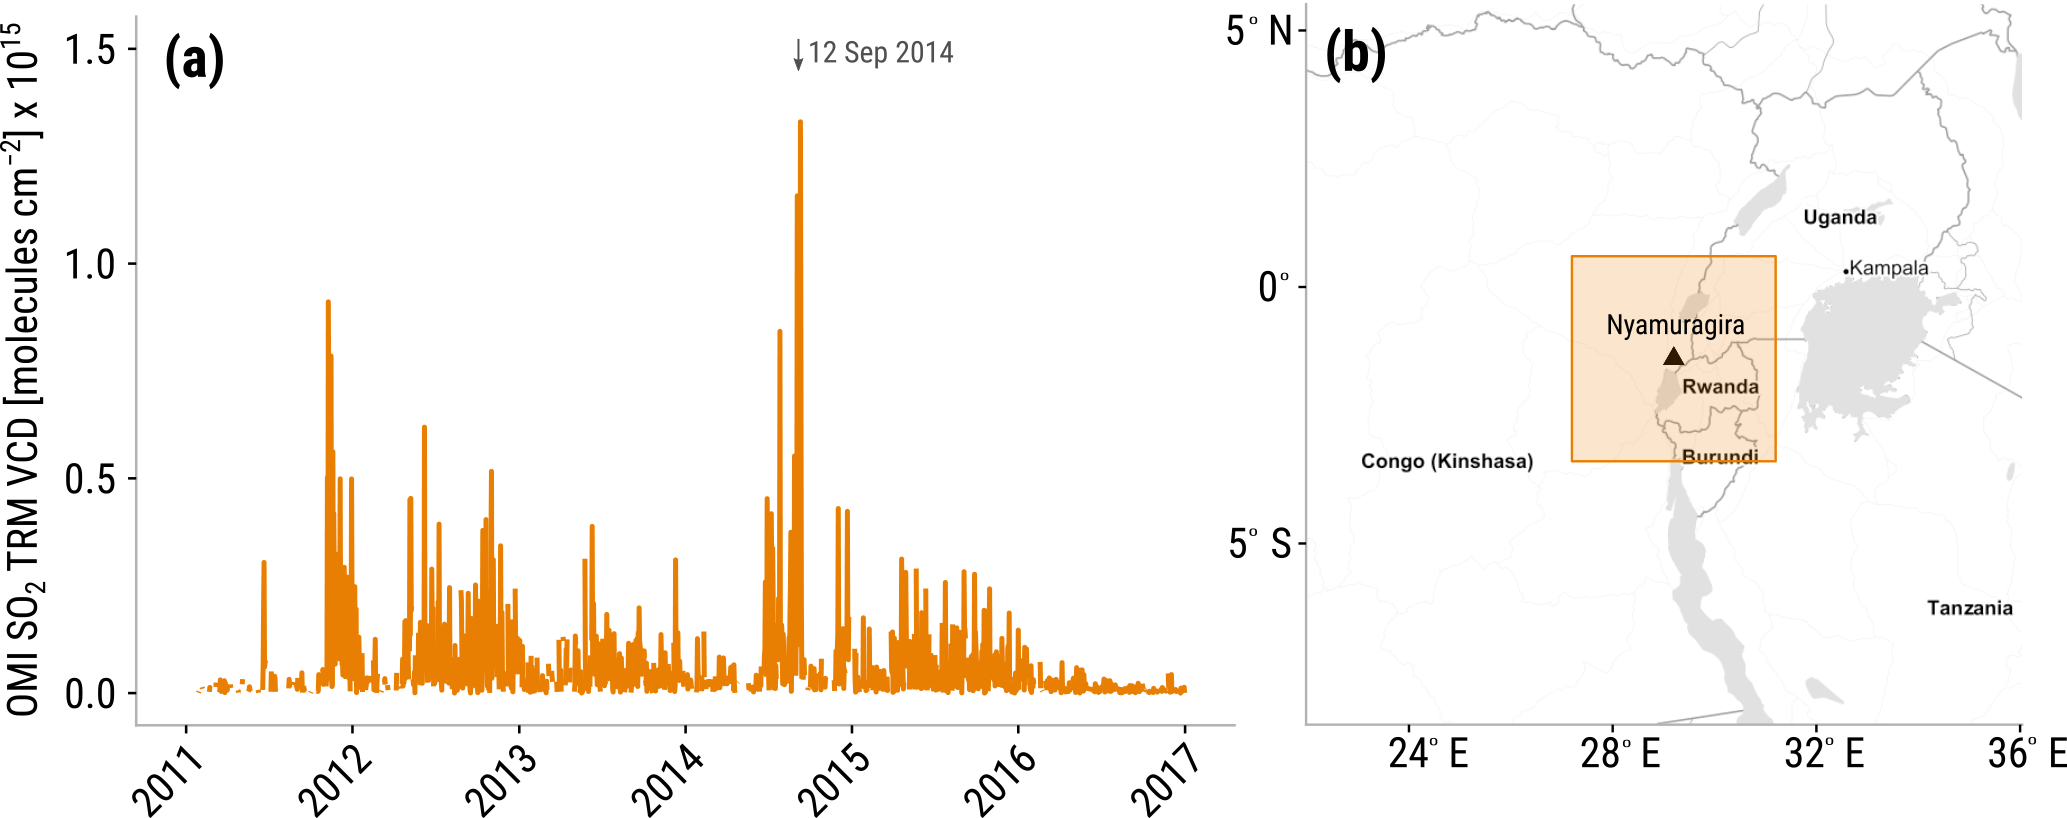
Figure 3(a) Time series of daily-averaged OMI SO2 TRM VCD observations corresponding to the averages over the area delimited by 27.2∘ E, 3.4∘ S, 31.2∘ E, and 0.6∘ N. (b) Map of eastern Africa showing the averaging area (orange square). The location of Nyamuragira is represented by a black triangle.
3.1 Satellite measurements and trajectory analysis of the volcanic plume
Given that the Nyamuragira and Nyiragongo volcanoes are so close to each other (within ∼ 15 km), their emissions detected by remote sensors are often treated as a paired source (Carn et al., 2017). Hereafter, the term “Nyamuragira” refers to the couple Nyamuragira–Nyiragongo in this text. Time series of area-averaged OMI SO2 observations are shown in Fig. 3a. The area where the average was calculated (Fig. 3b) corresponds to approximately 200 000 km2 around the volcanoes. Nyamuragira produced frequent intensive SO2 emission events in 2014 with a mean emission of 14.4 × 10⁶ kg SO2 day−1 (Barrière et al., 2017). Multiyear OMI SO2 VCD daily averages from 11∘ S to 17∘ N are summarized in Fig. S1 in the Supplement as a function of time and longitude. The figure shows observations during the ATTO measurement period (March 2012 to July 2017) and a snapshot of September 2014. According to Barrière et al. (2017), the emissions from June to October 2014 were mostly due to lava fountaining activity in Nyamuragira, characterized by strong tremors. The high emission activity of Nyamuragira at the end of 2014 was also observed by in situ measurements from November 2014 to October 2015, when SO2 emission fluxes reached up to 12.7 × 10⁶ kg day−1 (Bobrowski et al., 2017). These emissions were often transported westward, as can be observed in HYSPLIT forward trajectories calculated for 2014 (Fig. S2).
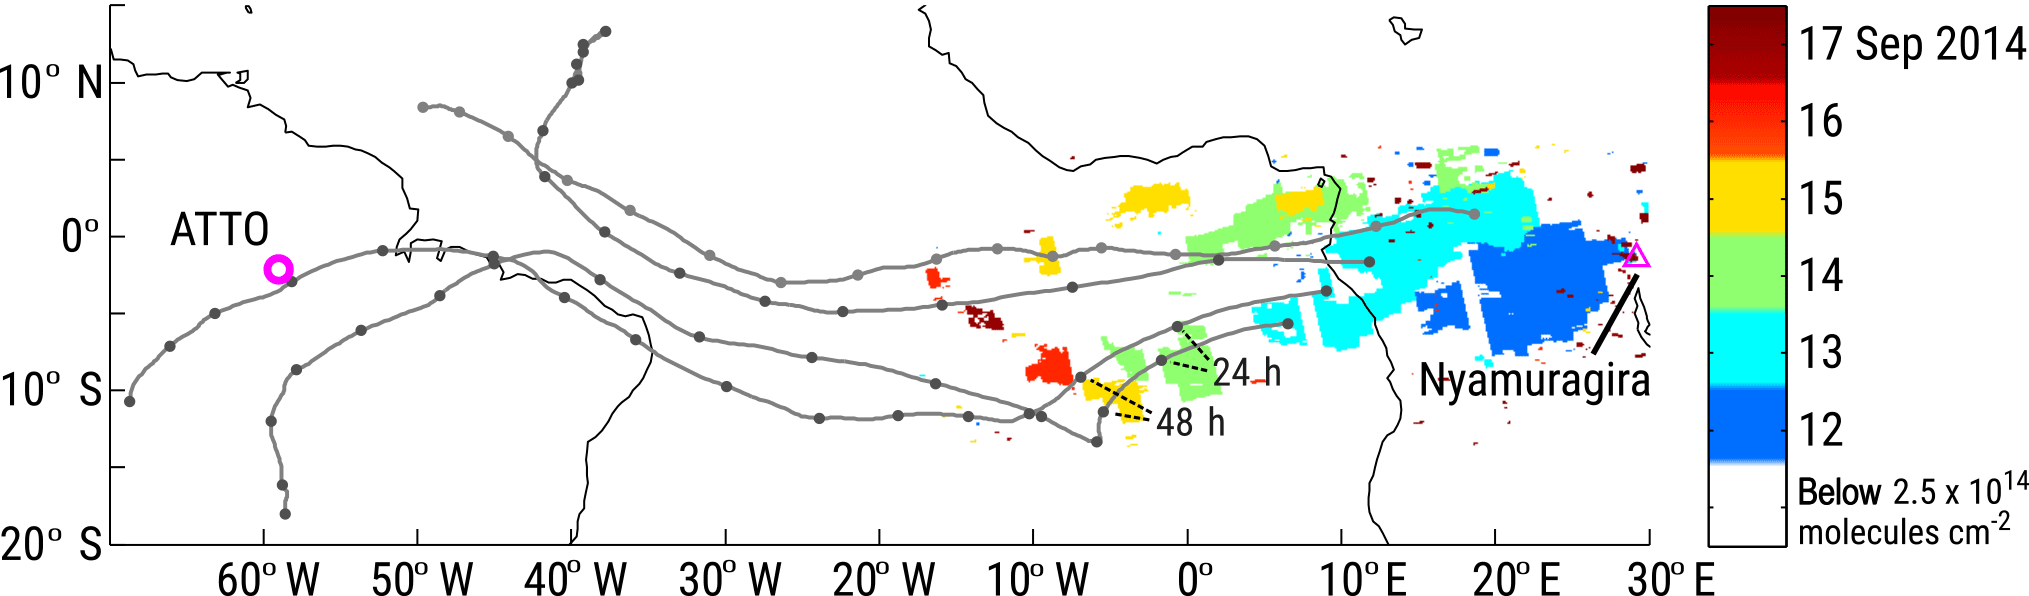
Figure 4Map of SO2 plumes with VCD > 2.5 × 10¹⁴ molecules cm−2 color-coded by date of observation. The 15-day forward trajectories started at 4 km (above mean sea level, a.m.s.l.) at four locations within the plume detected on 13 September 2014 (light blue) are indicated by black lines with markers at 24 h intervals.
Fortunately, during the high emission period mentioned above, specifically in September–October 2014, ground and airborne measurement campaigns took place in the Amazon Basin (Andreae et al., 2015; Wendisch et al., 2016; Martin et al., 2017). Satellite SO2 VCD observations over central Africa and the Atlantic Ocean were examined during this period in order to precisely identify the plume trajectory. A map of gridded OMI SO2 TRM VCD observations from 7 to 17 September 2014 is available as a Supplement (Fig. S3). Two emission events were observed at the Nyamuragira location, one on 7 September and another on 12 September. The latter exhibits a clear westward transport of the SO2 plume starting from 13 to 17 September. Figure 4 shows SO2 VCD observations during this period within the region between 20∘ W–30∘ E and 15∘ S–5∘ N with SO2 VCD larger than 2.5 × 10¹⁴ molecules cm−2. Several sets of trajectory calculations were performed. First, three to seven starting locations were selected within the SO2 plumes detected by OMI on 12–17 September 2014. At each location, 15-day (360 h) forward trajectories were started at the time of the satellite overpass (11:00–14:00 UTC) at seven altitudes spaced equally between 1 and 7 km. The resulting trajectories initialized at 4 km of altitude on 13 September are in best agreement with the satellite data and are shown in Fig. 4. All starting parameters were systematically varied and very consistent patterns were found (see Fig. S4). The trajectories are superimposed on the map presenting all SO2 plumes detected by OMI between 12 and 17 September. Trajectories started within the leading edge of the plume are in good agreement with the OMI data, as after 24 h (second marker) both trajectories are located within the plume detected on 14 September, and after 48 h (third marker) both trajectories are located within the plume detected on 15 September.
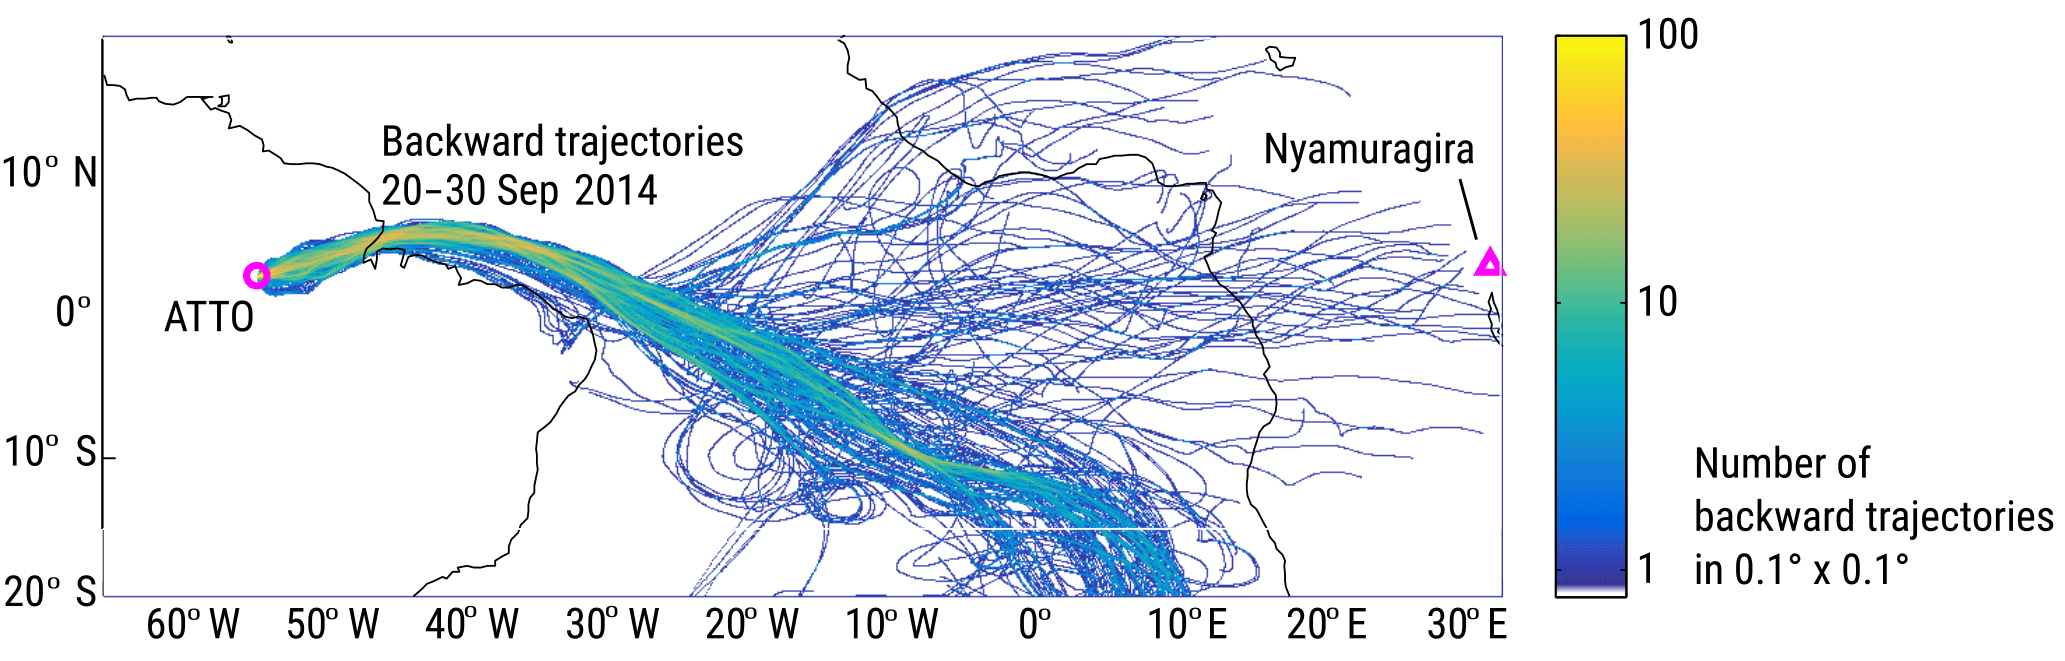
Figure 5Density of 15-day backward trajectories started from ATTO at an altitude of 300 m a.m.s.l. every hour starting at 00:00 UTC on 20 September 2014 to 23:00 UTC on 30 September 2014.
This approach of using the OMI data to evaluate the trajectories was used also with the purpose of minimizing uncertainties by calculating shorter trajectories instead of initializing them from the volcano location. It should be noted here that the trajectory calculations by HYSPLIT yield a line that can be understood as the center line of a propagating plume that widens both by stochastic uncertainty in the model calculations and by dispersive processes in the atmosphere. Consequently, the location of the plume becomes more uncertain the longer the model is run, and the physical size of the plume increases as well. Given the 9000 km distance between the volcanoes and ATTO, the uncertainty in the calculated plume trajectory position would become very large. To mitigate this problem, we use a multistep approach in which we follow the emissions using the satellite-observed locations of the SO2 plume for the initial days and then calculate forward trajectories from the observed location of the plume.
The two southernmost trajectories in Fig. 4 make a sharp turn after 15 September, which is in agreement with the observed pattern, although there is no longer an exact match with the respective OMI observations (in red and maroon). This discrepancy may be due to inaccuracy in the individual trajectories, or the SO2 plumes might have been below the OMI detection limit. The southernmost trajectories reach South America and come within several hundred kilometers of ATTO within 15 days, which is well within the HYSPLIT uncertainty estimated at 15–30 % of the trajectory length (https://www.arl.noaa.gov/hysplit/hysplit-frequently-asked-questions-faqs/faq-hg11/, last access: 19 March 2018). One trajectory reached the direct vicinity of ATTO on 25 September at 1.8 km of altitude, whereas another trajectory passed an area south of ATTO at an altitude of 1.5 km on 24 September. As discussed above, the locations along the trajectory should be interpreted as the centers of a plume, which had dispersed both vertically and horizontally. This dispersion is not considered in the trajectory mode of HYSPLIT (Stein et al., 2015), but of course takes place in reality by turbulent and convective processes. Consequently, a trajectory “parcel” moving at 1.8 km of altitude will certainly be dispersed to the surface in the highly convective Amazonian lower troposphere (Andreae et al., 1988).
In addition to the plume forward trajectory analysis, backward trajectories initiated at the ATTO site at an altitude of 300 m (approximately 170 m aboveground) were calculated for 360 h. These trajectories were initiated every hour from 20 September 00:00 UTC to 30 September 23:00 UTC. The results, presented as a trajectory density plot in Fig. 5, indicate that during this time period essentially all air masses come from southern Africa and a significant number of trajectories passes the area west of the volcano (e.g., 0–10∘ E, 0–10∘ S), where the volcanic plume was detected.
3.2 Airborne aerosol observations
Enhanced sulfate aerosol mass concentrations were observed above 3 km of altitude over the Amazon Basin during the ACRIDICON-CHUVA campaign, which were substantially greater than the concentrations measured at lower altitudes for some flights. A map including all airborne observations on the different flights can be found in the Supplement (Fig. S5). However, given the multiple sulfate aerosol sources, sulfate itself cannot be used as a tracer of volcanic emissions. In order to distinguish the volcanogenic sulfate from other aerosol sources like BB, which is important during this time of the year, we examined the Msulfate vertical profiles together with their sulfate-to-OA mass ratio (Msulfate∕Morg). A list of the ACRIDICON-CHUVA flights and Msulfate vertical profiles are presented as Supplement Table S1 and Fig. S6, respectively.
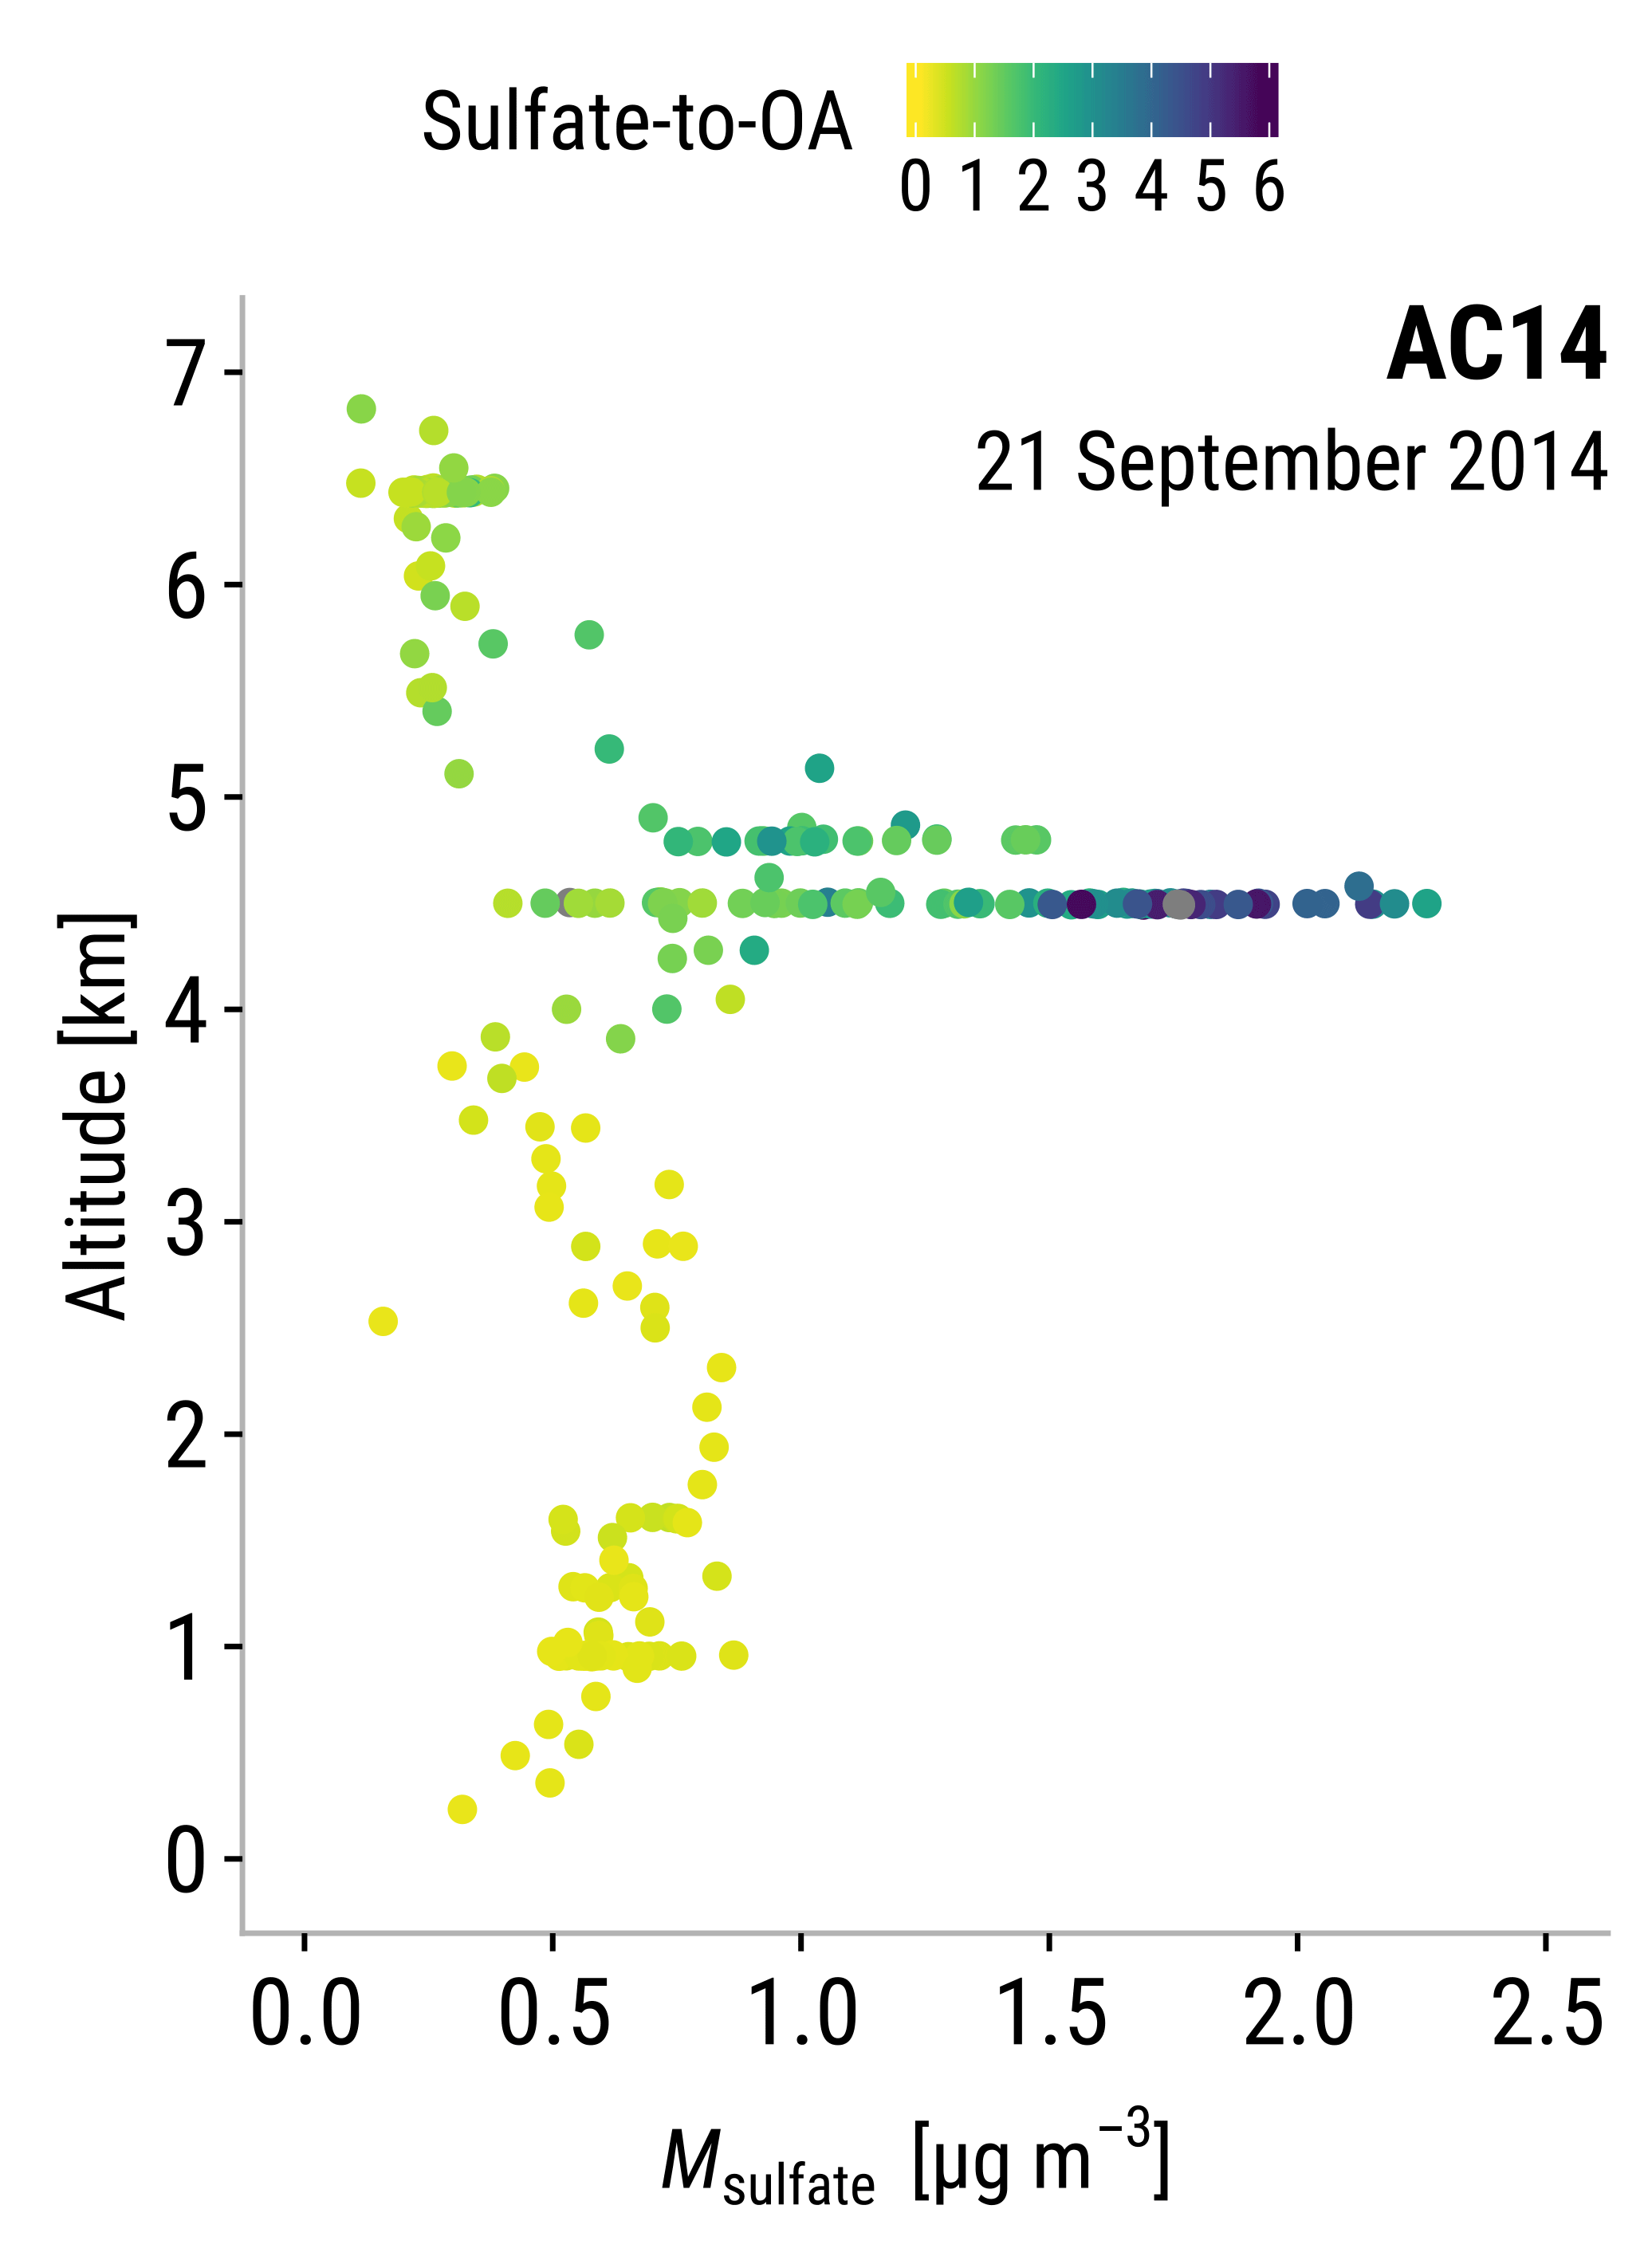
Figure 6Sulfate layer observations over the Amazon rain forest. The figure shows the Msulfate vertical profile observed during flight AC14 (21 September 2014). Color-coded sulfate-to-OA values are truncated at a maximum of 6.

Figure 7Map of gridded OMI SO2 VCD observed on 12 September 2014. Two plumes are shown on the map; the first one emitted on 7 September 2014 and the second one emitted on 12 September 2014. The 15-day backward trajectories initialized at several points along the track of flight AC14 (21 September 2014) at flight altitude are shown as continuous lines with dots. Trajectories starting at points where sulfate-to-OA ratios > 1 are shown in color (see Table 1 for details), and all other trajectories are shown in gray; dots are placed at 24 h intervals. The path of flight AC14 is marked in pink, with stars denoting the starting points of the backward trajectories. The locations of the ATTO site and Nyamuragira are marked with a pink circle and a triangle, respectively.
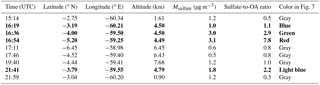
Table 1Measurements at points along the track of flight AC14 (21 September 2014) selected as starting points for backward trajectories presented in Fig. 7. Data points with a sulfate-to-OA ratio > 1 are emphasized by bold font.
From the different airborne observations, the elevated plumes observed on flights AC14 (21 September 2014) and AC17 (27 September 2014) exhibited median sulfate-to-OA mass ratios larger than 1.0, indicating strong volcanogenic influence. The Msulfate vertical profile measured on 21 September 2014 (AC14) is presented in Fig. 6. The observations show a sulfate-enhanced layer between 4 and 5 km of height, which was also observed during flight AC17 on 27 September 2014. The average Msulfate observed during flight AC14 was 1.1 ± 0.5 µg m−3 between 3 and 6 km of height. This sulfate-enhanced layer exhibits the highest sulfate-to-OA ratio and can be distinguished from lower layers below 3 km of height, which are characteristically rich in OA due to BB and biogenic emissions. Usually, BB aerosol particles have been shown to have higher OA mass concentrations than other aerosol particles (McNaughton et al., 2011; Saturno et al., 2017). The concentrations of rBC in the region between 4 and 5 km were also very low (9 ng m−3) compared to the values below 3 km of altitude (270 ng m−3; Holanda et al., 2018), ruling out a combustion source for the sulfate. In light of all the observations (i.e., enhanced sulfate layer above 4 km of height, high sulfate-to-OA ratio, very low rBC mass concentration) the most plausible explanation for the source of this sulfate plume is the LRT of volcanogenic aerosols.
Backward trajectories were calculated from several points along the flight paths. Figure 7 shows backward trajectories started at nine points along the AC14 (21 September 2014) flight track for which sulfate-to-OA ratios larger (colored lines) or smaller than 1 (gray lines) were detected; the flight and aerosol data measured at each point are presented in Table 1. Figure 7 clearly shows that the colored trajectories, with one exception, initialized within the sulfate plume originate from central Africa, whereas the gray trajectories, started outside of the sulfate plume, appear to originate from South America or from more southern regions over or across the Atlantic Ocean. The air mass trajectory analysis supports our hypothesis that the AC14 observations were likely the result of probing the volcanic plume emitted on 7 September, the first one detected by OMI (see Fig. S3). For flight AC17 a similar pattern is observed, with three out of four (colored) trajectories started within the sulfate plume originating from central Africa and half of the other trajectories clearly coming from regions more to the south (see Fig. S7 and Table S2).
Figures 4, 5, and 7 show that the trajectories agree well but not perfectly with the ground-based, airborne, and satellite measurements, which is mainly caused by the uncertainty of such long trajectories. Nevertheless, the fact that forward and backward trajectories calculated from various starting points and times agree on the sulfate source is a further indication that the sulfate plumes observed at and near ATTO originate from the Nyamuragira volcano. Combined with the westward transport pattern derived from SO2 satellite data and the lack of an alternative strong sulfate source, this makes quite a convincing case.
3.3 Ground-based aerosol observations
The arrival of African volcanic emissions over the Amazon rain forest is reflected in the aerosol physical and chemical properties measured at the ATTO site. The most evident effect was the significant increase in Msulfate. The 90th percentile of Msulfate measured at the ATTO site during the dry season 2014 was used as a threshold to define the volcanic influence event (Nya2014) as the time when this threshold was exceeded. By this criterion, the Nya2014 event spanned from 21 September 2014 at 02:00 UTC to 1 October 2014 at 01:00 UTC. Figure 8 shows different aerosol parameters measured before, during, and after the Nya2014 event. The NCN, shown in Fig. 8a, did not vary greatly from the values typical of the season (Pöhlker et al., 2016). The average NCN during the dry season in 2014 was (1.3 ± 0.6) × 103 particles cm−3, whereas during the Nya2014 event, there were three peaks lasting for a few hours with particle number concentrations higher than 3000 particles cm−3 on 27, 29, and 30 September 2014, likely related to BB plumes (details in M. L. Pöhlker et al., 2018).
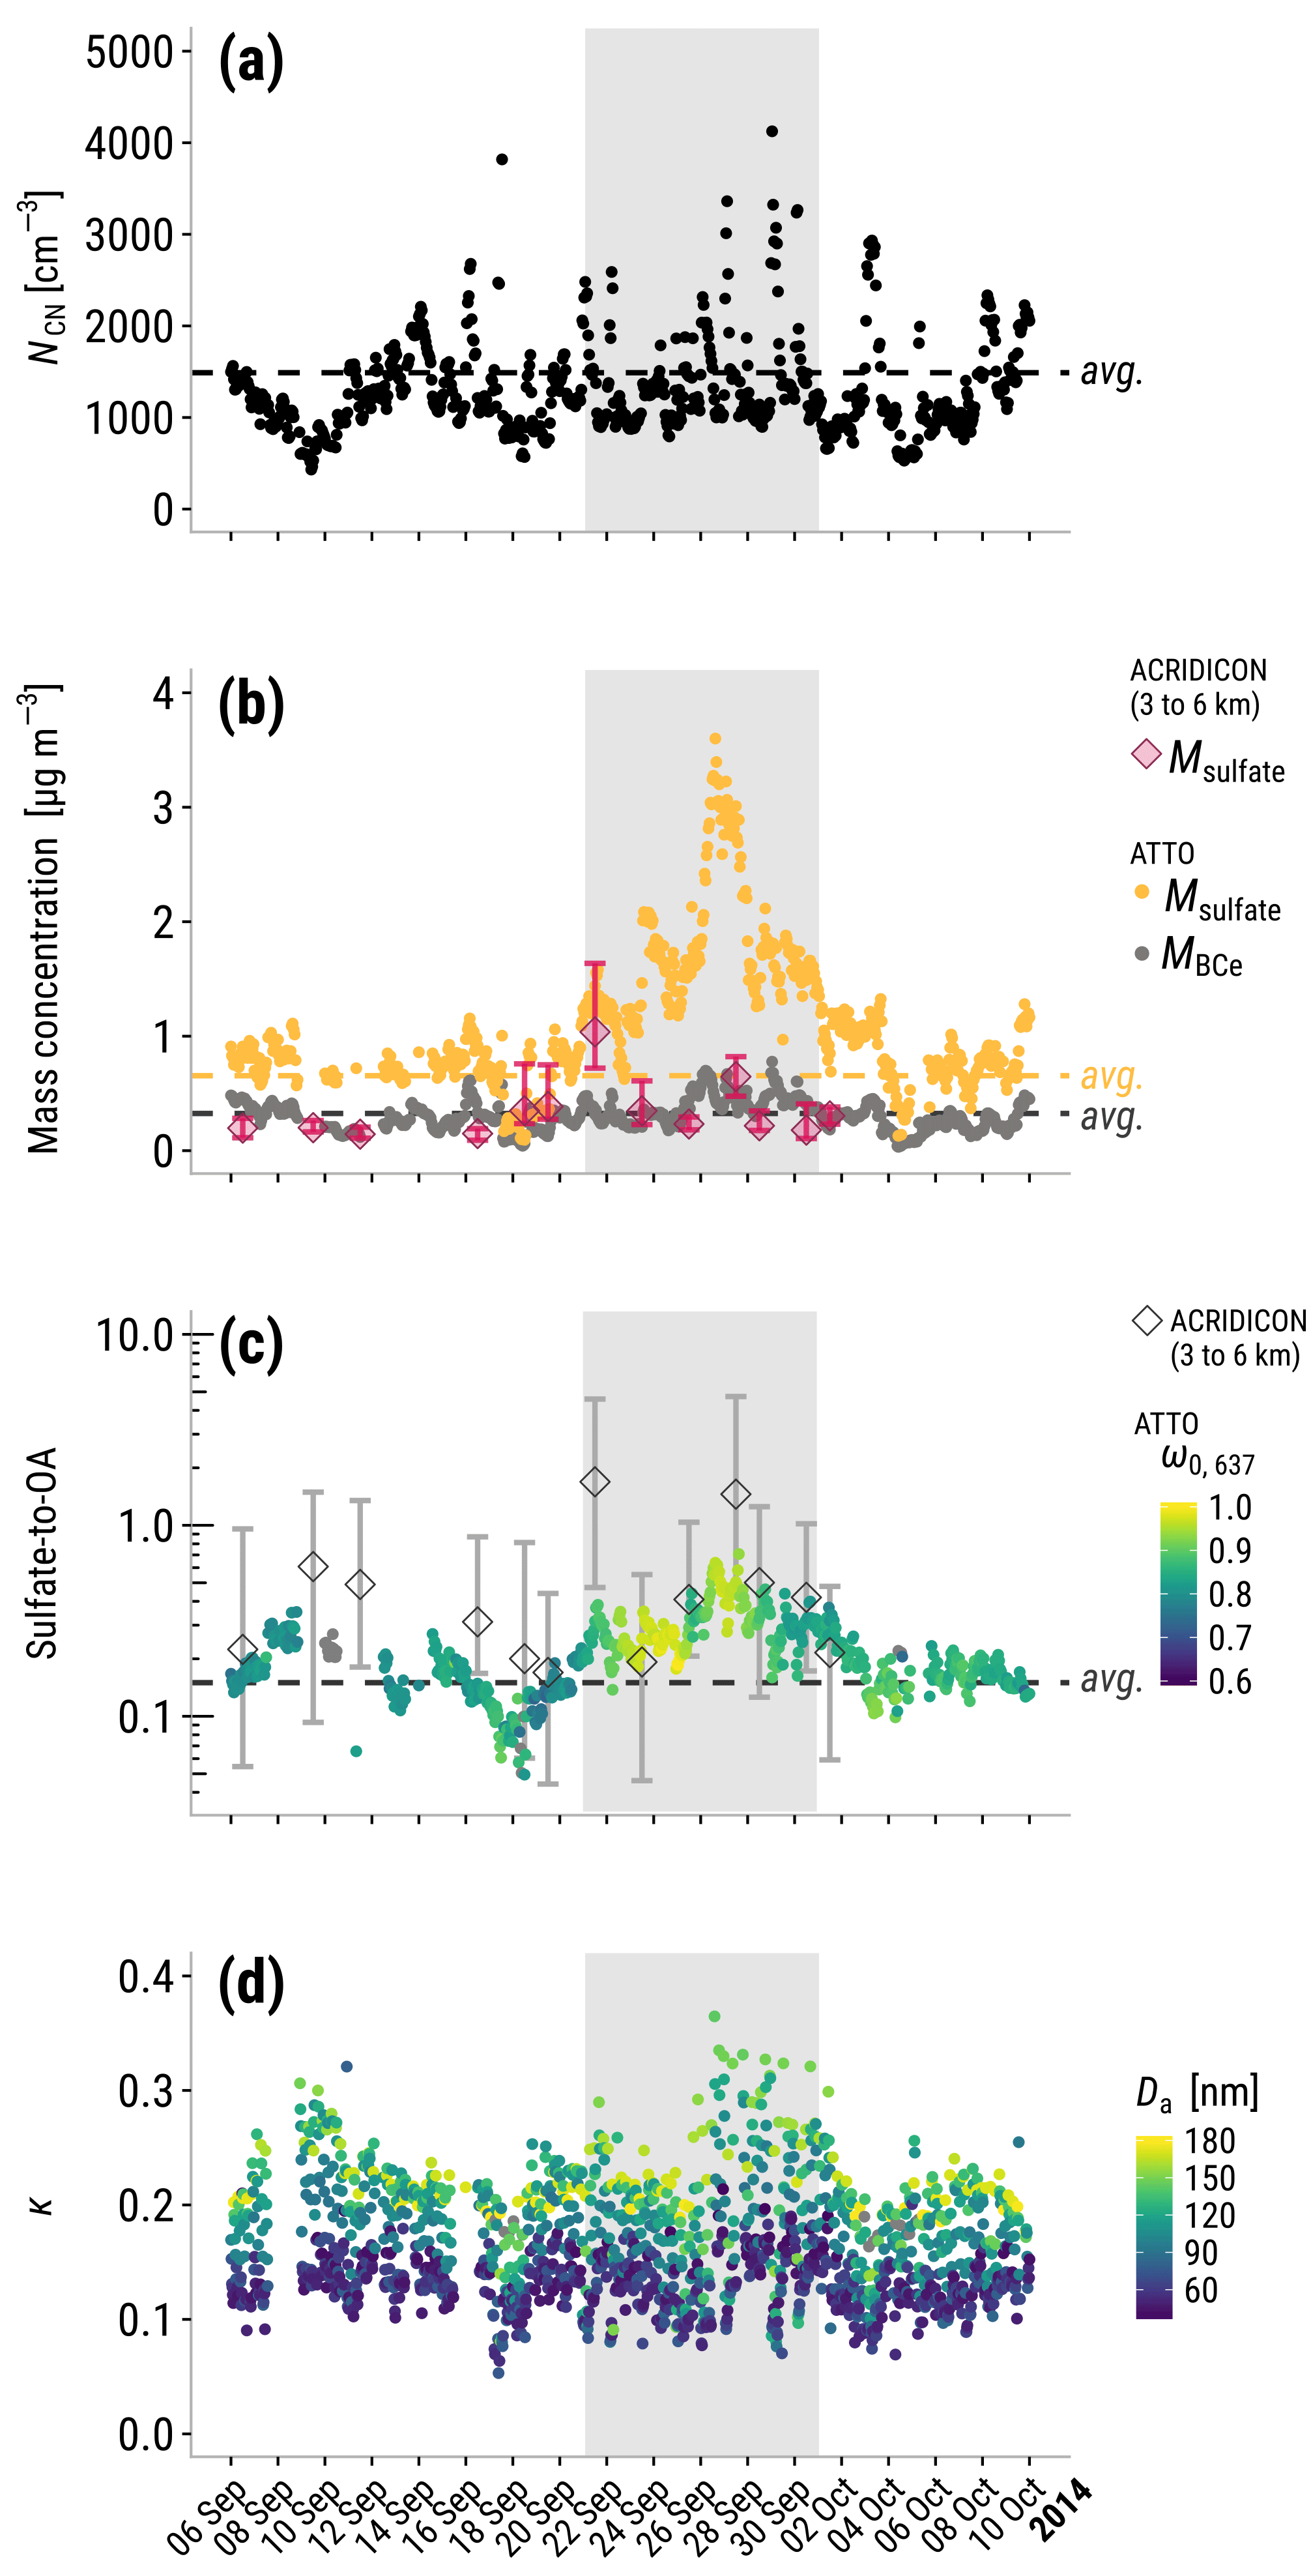
Figure 8Different aerosol properties measured during the Nya2014 event (gray shaded area). These time series include ATTO hourly means of (a) aerosol particle number concentration, NCN, (b) sulfate and BCe mass concentration, (c) sulfate-to-OA mass ratio with color-coded aerosol particle single scattering albedo at a 637 nm wavelength, and (d) hygroscopicity parameter, κ, at original time resolution with color-coded particle activation diameter. Dry season averages are shown as dashed lines. ACRIDICON-CHUVA flight medians and interquartile ranges from 3 to 6 km of altitude are shown in (b) and (c).
On the other hand, during the Nya2014 period, Msulfate averaged 1.7 ± 0.6 µg m−3, which was significantly above the dry season 2014 average of 0.7 ± 0.3 µg m−3; see Fig. 8b. The highest Msulfate value observed at the ATTO site was 3.6 µg m−3 (hourly mean) on 26 September 2014. For comparison, during the SAMBBA campaign in southern Amazonia, Msulfate barely exceeded 1.0 µg m−3 despite organics nearly reaching 100 µg m−3, of 5 µg m−3, and NCN above 25 × 103 particles cm−3 during the peak of biomass burning (Brito et al., 2014). A long-term measurement study also conducted in southern Amazonia reported Msulfate of 1.1 ± 0.7 µg m−3 during the dry season, with a maximum of 3.3 µg m−3 for aerosol particles with diameters smaller than 2 µm (Artaxo et al., 2002). It is important to note that the observations by Artaxo et al. (2002) were made under strong BB influence with average elemental carbon (EC) mass concentrations, MEC, of 3.8 ± 4.2 µg m−3, with a maximum of 25 µg m−3. In contrast, the BCe measurements at the ATTO site during the Nya2014 event had an average of 0.4 ± 0.1 µg m−3, with a maximum of 0.8 µg m−3, indicating that the BB influence was relatively weak during the period of interest, with some short (a few hours) spikes due to the influence of nearby fire events; see Fig. 8b. At a sampling site impacted by Manaus emissions, the submicron Msulfate was about 0.2 µg m−3 during the wet season, rarely exceeding 0.6 µg m−3 (de Sá et al., 2017). Therefore, even considering a range of pollution sources, our measurements at ATTO during the Nya2014 event are the highest submicron sulfate concentration ever reported in the Amazon Basin; see Martin et al. (2010) for a summary of wet and dry season aerosol observations. For comparison, the ACRIDICON-CHUVA airborne measurements are also included in Fig. 8b. The Msulfate measured on flight AC14 was significantly enhanced between 3 and 6 km of altitude, reaching a median of 1.0 µg m−3 and a 75th percentile of 1.6 µg m−3. Previous aircraft measurements during the SAMBBA campaign reported a Msulfate flight average of 0.48 µg m−3 (Allan et al., 2014).
The increased Msulfate period was accompanied by an enhanced sulfate-to-OA mass ratio according to the ATTO observations (Fig. 8c). The Nya2014 sulfate-to-OA average over about 10 days was 0.38 ± 0.09, significantly higher than the dry season average of 0.18 ± 0.15. During some BB pulses, decreased sulfate-to-OA ratios were observed, but the whole Nya2014 period was exceptionally high compared to typical dry season conditions. The sulfate-to-OA values measured at ground level were usually lower than the airborne values observed between 3 and 6 km of height because the OA sources (BB and biogenic emissions) are located at ground level and the LRT sulfate that arrives at higher altitudes is diluted upon vertical mixing. The possibility of FF burning was ruled out as an important sulfur source during the event discussed here because of the particularly high dry aerosol ω0 measured during the event (0.89 ± 0.04), as can be observed in the color-coded data in Fig. 8c. Usually, FF emissions rich in BC present characteristically low ω0 (0.2–0.3; Bond and Bergstrom, 2006) and its addition would have lowered the value of ω0. Instead, an increase in ω0 was observed to values higher than 0.90 during the period of maximum Msulfate (26–27 September 2014).
The effects of the volcanic sulfur plume on aerosol hygroscopicity were explored by analyzing the κ values measured at different supersaturations. Higher κ values were measured for the accumulation-mode aerosol (particles with a diameter greater than 100 nm; Fig. 8d; note the color-coded particle activation diameter, Da). During the Nya2014 event, the κ values increased significantly, especially when the maximum Msulfate was observed. For example, the average κ for a supersaturation of 0.10 % (Da= 167–179 nm, 25th and 75th percentile, respectively) was 0.26 ± 0.04 during the Nya2014 event, with a maximum of 0.36. Similarly, the particle hygroscopicity was also increased at Jungfraujoch (Switzerland) under the influence of the Eyjafjallajökull volcanic emissions in 2010 (Bukowiecki et al., 2011). In that case the Aitken-mode particles (10 to 50 nm diameter) were more strongly affected than the accumulation-mode particles because of the shorter aging period of the sulfate particles. The Nya2014 κ average was slightly higher than the 2014 dry season average of 0.21 ± 0.03 for 0.10 % supersaturation (excluding the volcanic event) and significantly higher than a strong BB event average of 0.18 ± 0.01 for 0.10 % supersaturation, whose high OA content (sulfate-to-OA ratio < 0.04) caused a significant drop in κ (M. L. Pöhlker et al., 2018).
Satellite SO2 observations showed two explosive events at the Nyamuragira volcano on 7 and 12 September 2014. These emissions were observed to be transported far over the South Atlantic Ocean. Modeled air mass trajectories, starting at the satellite-observed plume locations, showed that the plume was transported towards South America, eventually reaching the region of the Amazon Tall Tower Observatory in central Amazonia. Airborne observations during the ACRIDICON-CHUVA campaign probed a sulfate-enhanced layer between 4 and 5 km of height on 21 September 2014. Additionally, this layer exhibited very low rBC concentrations and an increased sulfate-to-OA mass ratio with medians higher than 1 for measurements between 3 and 6 km of height.
The ground-based Msulfate measured at the ATTO site reached hourly mean levels up to 3.6 µg m−3 on 26 September 2014, the highest values ever reported in the Amazon Basin. The sulfate-to-OA mass ratio increased from a dry season average of 0.18 ± 0.15 to an average of 0.38 ± 0.09 upon volcanic influence, which spanned about 10 days. Increased sulfate-to-OA ratios and single scattering albedo (ω0) suggest a rather low influence of BB and FF sources. In terms of aerosol hygroscopicity, the values of κ (for 0.10 % supersaturation) measured during the volcanic event reached an average of 0.26 ± 0.04 (and a maximum of 0.36), the highest levels observed under dry season conditions (average of 0.21 ± 0.03).
The evidence presented here shows one particular event of volcanic SO2 emissions in Africa influencing aerosol particle chemical composition, hygroscopicity, and optical properties in the Amazon Basin. Therefore, our study indicates that these emissions and their transatlantic transport could potentially affect Amazonian cloud microphysical properties. However, the extent and relevance of the episodic volcanic influence on the Amazonian atmosphere would require more extensive studies. Beyond the effects and implications of this particular event, the results of our study represent a reference case of the dynamics and conditions of transatlantic aerosol transport from southern Africa to South America. This could help us to understand the intercontinental advection of other aerosol species, such as combustion aerosol particles that are more difficult to trace.
The data presented in this paper can be accessed via e-mail request to Jorge Saturno (j.saturno@mpic.de) or Christopher Pöhlker (c.pohlker@mpic.de). OMI data are available online at https://doi.org/10.5067/Aura/OMI/DATA2022 (Li et al., 2006).
The supplement related to this article is available online at: https://doi.org/10.5194/acp-18-10391-2018-supplement.
JSa, FD, MPdV, BAH, MLP, DW, LATM, JSc, CS, MW, PA, TW, UP, MOA, and CP designed the research. JSa, FD, MPdV, BAH, MLP, SC, DW, JB, XC, IHdA, DMZ, JSc, CS, TW, MOA, and CP performed the measurements and/or contributed to the data analysis. All authors contributed to the discussion and interpretation of the results and writing the paper.
The authors declare that they have no conflict of interest.
This work has been supported by the Max Planck Society (MPG) and the Paul Crutzen Graduate School (PCGS). For the operation of the ATTO site, we acknowledge the support of the German Federal Ministry of Education and Research (BMBF contract 01LB1001A) and the Brazilian Ministério da Ciência, Tecnologia e Inovação (MCTI/FINEP contract 01.11.01248.00) as well as the Amazon State University (UEA), FAPEAM, LBA/INPA, and SDS/CEUC/RDS-Uatumã. We acknowledge the generous support of the ACRIDICON-CHUVA campaign by the Max Planck Society, the German Aerospace Center (DLR), FAPESP (São Paulo Research Foundation), and the German Science Foundation (Deutsche Forschungsgemeinschaft, DFG). This study was also supported by EU Project HAIC under FP7-AAT-2012-3.5.1-1 and by the German Science Foundation within DFG SPP HALO under contract no. VO1504/4-1 and contract no. JU 3059/1-1. The ACRIDICON-CHUVA aircraft measurements presented here were supported by BMBF grant no. 01LG1205E (ROMIC-SPITFIRE) and by DFG (SCHN1138/1-2). This paper contains results of research conducted under the Technical/Scientific Cooperation Agreement between the National Institute for Amazonian Research, the State University of Amazonas, and the Max-Planck-Gesellschaft e.V.; the opinions expressed are the entire responsibility of the authors and not of the participating institutions. We gratefully acknowledge the support of the Instituto Nacional de Pesquisas da Amazônia (INPA). We would like to especially thank all the people involved in the technical, logistical, and scientific support of the ATTO project, in particular Reiner Ditz, Jürgen Kesselmeier, Alberto Quesada, Niro Higuchi, Susan Trumbore, Matthias Sörgel, Thomas Disper, Andrew Crozier, Uwe Schulz, Steffen Schmidt, Antonio Ocimar Manzi, Alcides Camargo Ribeiro, Hermes Braga Xavier, Elton Mendes da Silva, Nagib Alberto de Castro Souza, Adi Vasconcelos Brandão, Amaury Rodrigues Pereira, Antonio Huxley Melo Nascimento, Feliciano de Souza Coehlo, Thiago de Lima Xavier, Josué Ferreira de Souza, Roberta Pereira de Souza, Bruno Takeshi, and Wallace Rabelo Costa. Jorge Saturno is grateful for PhD scholarship funding from Fundación Gran Mariscal de Ayacucho (Fundayacucho) and acknowledges Loreto Donoso, Martin Brüggemann, and David Cabrera for support and stimulating discussions. Moreover, we appreciate the support of Jošt V. Lavrič, Tobias Könemann, Thomas Klimach, Björn Nillius, Luciana V. Rizzo, Henrique M. Barbosa, Patrick Schlag, Jing Ming, Florian Dinger, Hang Su, Yafang Cheng, and Stephan Borrmann. We thank the GoAmazon2014/5 team, in particular Scot T. Martin. We also thank the ACRIDICON-CHUVA campaign team.
We acknowledge the NOAA Air Resources Laboratory (ARL) for the provision of the HYSPLIT transport and dispersion model and READY website (http://www.ready.noaa.gov, last access: 14 November 2017) used in this publication. We also acknowledge NASA for providing the OMI/SO2 total column level-2 data available online from the Goddard Earth Sciences Data and Information Services Center (GES DISC).
Finally, we appreciate the constructive comments by Evgenia Ilyinskaya and one anonymous
referee, which were very fruitful to improve important aspects of the paper.
The article processing charges for this open-access
publication were covered by the Max Planck Society.
Edited by: Ken Carslaw
Reviewed by: Evgenia Ilyinskaya and one anonymous referee
Allan, J. D., Morgan, W. T., Darbyshire, E., Flynn, M. J., Williams, P. I., Oram, D. E., Artaxo, P., Brito, J., Lee, J. D., and Coe, H.: Airborne observations of IEPOX-derived isoprene SOA in the Amazon during SAMBBA, Atmos. Chem. Phys., 14, 11393–11407, https://doi.org/10.5194/acp-14-11393-2014, 2014.
Andreae, M. O. and Andreae, T. W.: The cycle of biogenic sulfur compounds over the Amazon Basin: 1. Dry season, J. Geophys. Res., 93, 1487, https://doi.org/10.1029/JD093iD02p01487, 1988.
Andreae, M. O. and Rosenfeld, D.: Aerosol–cloud–precipitation interactions. Part 1. The nature and sources of cloud-active aerosols, Earth-Sci. Rev., 89, 13–41, https://doi.org/10.1016/j.earscirev.2008.03.001, 2008.
Andreae, M. O., Browell, E. V., Garstang, M., Gregory, G. L., Harriss, R. C., Hill, G. F., Jacob, D. J., Pereira, M. C., Sachse, G. W., Setzer, A. W., Dias, P. L. S., Talbot, R. W., Torres, A. L., and Wofsy, S. C.: Biomass-burning emissions and associated haze layers over Amazonia, J. Geophys. Res., 93, 1509, https://doi.org/10.1029/JD093iD02p01509, 1988.
Andreae, M. O., Berresheim, H., Bingemer, H., Jacob, D. J., Lewis, B. L., Li, S.-M., and Talbot, R. W.: The atmospheric sulfur cycle over the Amazon Basin: 2. Wet season, J. Geophys. Res., 95, 16813, https://doi.org/10.1029/JD095iD10p16813, 1990.
Andreae, M. O., Anderson, B. E., Blake, D. R., Bradshaw, J. D., Collins, J. E., Gregory, G. L., Sachse, G. W., and Shipham, M. C.: Influence of plumes from biomass burning on atmospheric chemistry over the equatorial and tropical South Atlantic during CITE 3, J. Geophys. Res., 99, 12793, https://doi.org/10.1029/94JD00263, 1994.
Andreae, M. O., Acevedo, O. C., Araùjo, A., Artaxo, P., Barbosa, C. G. G., Barbosa, H. M. J., Brito, J., Carbone, S., Chi, X., Cintra, B. B. L., da Silva, N. F., Dias, N. L., Dias-Júnior, C. Q., Ditas, F., Ditz, R., Godoi, A. F. L., Godoi, R. H. M., Heimann, M., Hoffmann, T., Kesselmeier, J., Könemann, T., Krüger, M. L., Lavric, J. V., Manzi, A. O., Lopes, A. P., Martins, D. L., Mikhailov, E. F., Moran-Zuloaga, D., Nelson, B. W., Nölscher, A. C., Santos Nogueira, D., Piedade, M. T. F., Pöhlker, C., Pöschl, U., Quesada, C. A., Rizzo, L. V., Ro, C.-U., Ruckteschler, N., Sá, L. D. A., de Oliveira Sá, M., Sales, C. B., dos Santos, R. M. N., Saturno, J., Schöngart, J., Sörgel, M., de Souza, C. M., de Souza, R. A. F., Su, H., Targhetta, N., Tóta, J., Trebs, I., Trumbore, S., van Eijck, A., Walter, D., Wang, Z., Weber, B., Williams, J., Winderlich, J., Wittmann, F., Wolff, S., and Yáñez-Serrano, A. M.: The Amazon Tall Tower Observatory (ATTO): overview of pilot measurements on ecosystem ecology, meteorology, trace gases, and aerosols, Atmos. Chem. Phys., 15, 10723–10776, https://doi.org/10.5194/acp-15-10723-2015, 2015.
Artaxo, P., Martins, J. V., Yamasoe, M. A., Procópio, A. S., Pauliquevis, T. M., Andreae, M. O., Guyon, P., Gatti, L. V., and Cordova Leal, A. M.: Physical and chemical properties of aerosols in the wet and dry seasons in Rondônia, Amazonia, J. Geophys. Res., 107, 8081, https://doi.org/10.1029/2001JD000666, 2002.
Barrière, J., Oth, A., Theys, N., D'Oreye, N., and Kervyn, F.: Long-term monitoring of long-period seismicity and space-based SO2 observations at African lava lake volcanoes Nyiragongo and Nyamulagira (DR Congo), Geophys. Res. Lett., 44, 6020–6029, https://doi.org/10.1002/2017GL073348, 2017.
Bobrowski, N. and Platt, U.: SO2/BrO ratios studied in five volcanic plumes, J. Volcanol. Geotherm. Res., 166, 147–160, https://doi.org/10.1016/j.jvolgeores.2007.07.003, 2007.
Bobrowski, N., Giuffrida, G. B., Arellano, S., Yalire, M., Liotta, M., Brusca, L., Calabrese, S., Scaglione, S., Rüdiger, J., Castro, J. M., Galle, B., and Tedesco, D.: Plume composition and volatile flux of Nyamulagira volcano, Democratic Republic of Congo, during birth and evolution of the lava lake, 2014–2015, Bull. Volcanol., 79, 90, https://doi.org/10.1007/s00445-017-1174-0, 2017.
Bond, T. C. and Bergstrom, R. W.: Light Absorption by Carbonaceous Particles: An Investigative Review, Aerosol Sci. Technol., 40, 27–67, https://doi.org/10.1080/02786820500421521, 2006.
Boucher, O., Randall, D., Artaxo, P., Bretherton, C., Feingold, G., Forster, P., Kerminen, V.-M., Kondo, Y., Liao, H., Lohmann, U., Rasch, P., Satheesh, S. K., Sherwood, S., Stevens, B., and Zhang, X. Y.: Clouds and Aerosols, in: Climate Change 2013 – The Physical Science Basis, edited by: Intergovernmental Panel on Climate Change, 571–658, Cambridge University Press, Cambridge, 2013.
Brito, J., Rizzo, L. V., Morgan, W. T., Coe, H., Johnson, B., Haywood, J., Longo, K., Freitas, S., Andreae, M. O., and Artaxo, P.: Ground-based aerosol characterization during the South American Biomass Burning Analysis (SAMBBA) field experiment, Atmos. Chem. Phys., 14, 12069–12083, https://doi.org/10.5194/acp-14-12069-2014, 2014.
Bukowiecki, N., Zieger, P., Weingartner, E., Jurányi, Z., Gysel, M., Neininger, B., Schneider, B., Hueglin, C., Ulrich, A., Wichser, A., Henne, S., Brunner, D., Kaegi, R., Schwikowski, M., Tobler, L., Wienhold, F. G., Engel, I., Buchmann, B., Peter, T., and Baltensperger, U.: Ground-based and airborne in-situ measurements of the Eyjafjallajökull volcanic aerosol plume in Switzerland in spring 2010, Atmos. Chem. Phys., 11, 10011–10030, https://doi.org/10.5194/acp-11-10011-2011, 2011.
Campion, R.: New lava lake at Nyamuragira volcano revealed by combined ASTER and OMI SO2 measurements, Geophys. Res. Lett., 41, 7485–7492, https://doi.org/10.1002/2014GL061808, 2014.
Carbone, S., Brito, J. F., Xu, L., Ng, N. L., Rizzo, L. V., Stern, R., Cirino, G. G., Holanda, B. A., Senna, E., Wolff, S., Saturno, J., Chi, X., Souza, R. A. F., Arana, A., de Sá, M., Pöhlker, M. L., Andreae, M. O., Pöhlker, C., Barbosa, H. M. J., and Artaxo, P.: Long-term chemical composition and source apportionment of submicron aerosol particles in the central Amazon basin (ATTO), to be submitted to Atmos. Chem. Phys. Discuss., 2018.
Carn, S. A., Clarisse, L., and Prata, A. J.: Multi-decadal satellite measurements of global volcanic degassing, J. Volcanol. Geotherm. Res., 311, 99–134, https://doi.org/10.1016/j.jvolgeores.2016.01.002, 2016.
Carn, S. A., Fioletov, V. E., McLinden, C. A., Li, C., and Krotkov, N. A.: A decade of global volcanic SO2 emissions measured from space, Sci. Rep., 7, 44095, https://doi.org/10.1038/srep44095, 2017.
Chin, M. and Jacob, D. J.: Anthropogenic and natural contributions to tropospheric sulfate: A global model analysis, J. Geophys. Res.-Atmos., 101, 18691–18699, https://doi.org/10.1029/96JD01222, 1996.
Chin, M., Jacob, D. J., Gardner, G. M., Foreman-Fowler, M. S., Spiro, P. A., and Savoie, D. L.: A global three-dimensional model of tropospheric sulfate, J. Geophys. Res.-Atmos., 101, 18667–18690, https://doi.org/10.1029/96JD01221, 1996.
de Sá, S. S., Palm, B. B., Campuzano-Jost, P., Day, D. A., Newburn, M. K., Hu, W., Isaacman-VanWertz, G., Yee, L. D., Thalman, R., Brito, J., Carbone, S., Artaxo, P., Goldstein, A. H., Manzi, A. O., Souza, R. A. F., Mei, F., Shilling, J. E., Springston, S. R., Wang, J., Surratt, J. D., Alexander, M. L., Jimenez, J. L., and Martin, S. T.: Influence of urban pollution on the production of organic particulate matter from isoprene epoxydiols in central Amazonia, Atmos. Chem. Phys., 17, 6611–6629, https://doi.org/10.5194/acp-17-6611-2017, 2017.
Draxler, R. R. and Hess, G. D.: Description of the HYSPLIT_4 modeling system, Tech. Rep. NOAA Technical Memo ERL ARL-224, Silver Spring, Maryland, USA, available at: http://www.hysplit.uhu.es/hysplitweb08/document/arl-224.pdf (last access: 14 November 2017), 1997.
Draxler, R. R. and Hess, G. D.: An overview of the HYSPLIT 4 modelling system for trajectories, dispersion and deposition, Aust. Met. Mag., 47, 295–308, 1998.
Drewnick, F., Hings, S. S., DeCarlo, P., Jayne, J. T., Gonin, M., Fuhrer, K., Weimer, S., Jimenez, J. L., Demerjian, K. L., Borrmann, S., and Worsnop, D. R.: A New Time-of-Flight Aerosol Mass Spectrometer (TOF-AMS) – Instrument Description and First Field Deployment, Aerosol Sci. Technol., 39, 637–658, https://doi.org/10.1080/02786820500182040, 2005.
Ebmeier, S. K., Sayer, A. M., Grainger, R. G., Mather, T. A., and Carboni, E.: Systematic satellite observations of the impact of aerosols from passive volcanic degassing on local cloud properties, Atmos. Chem. Phys., 14, 10601–10618, https://doi.org/10.5194/acp-14-10601-2014, 2014.
Eisinger, M. and Burrows, J. P.: Tropospheric sulfur dioxide observed by the ERS-2 GOME instrument, Geophys. Res. Lett., 25, 4177–4180, https://doi.org/10.1029/1998GL900128, 1998.
Fioletov, V. E., McLinden, C. A., Krotkov, N., Li, C., Joiner, J., Theys, N., Carn, S., and Moran, M. D.: A global catalogue of large SO2 sources and emissions derived from the Ozone Monitoring Instrument, Atmos. Chem. Phys., 16, 11497–11519, https://doi.org/10.5194/acp-16-11497-2016, 2016.
Fuzzi, S., Decesari, S., Facchini, M. C., Cavalli, F., Emblico, L., Mircea, M., Andreae, M. O., Trebs, I., Hoffer, A., Guyon, P., Artaxo, P., Rizzo, L. V., Lara, L. L., Pauliquevis, T., Maenhaut, W., Raes, N., Chi, X., Mayol-Bracero, O. L., Soto-García, L. L., Claeys, M., Kourtchev, I., Rissler, J., Swietlicki, E., Tagliavini, E., Schkolnik, G., Falkovich, A. H., Rudich, Y., Fisch, G., and Gatti, L. V.: Overview of the inorganic and organic composition of size-segregated aerosol in Rondônia, Brazil, from the biomass-burning period to the onset of the wet season, J. Geophys. Res.-Atmos., 112, D01201, https://doi.org/10.1029/2005JD006741, 2007.
Galle, B., Oppenheimer, C., Geyer, A., McGonigle, A. J., Edmonds, M., and Horrocks, L.: A miniaturised ultraviolet spectrometer for remote sensing of SO2 fluxes: a new tool for volcano surveillance, J. Volcanol. Geotherm. Res., 119, 241–254, https://doi.org/10.1016/S0377-0273(02)00356-6, 2003.
Holanda, B. A., Wang, Q., Saturno, J., Ditas, F., Ditas, J., Pöhlker, M. L., Klimach, T., Moran-Zuloaga, D., Schulz, C., Ming, J., Cheng, Y., Su, H., Wendisch, M., Machado, L. A. T., Schneider, J., Pöhlker, C., Artaxo, P., Pöschl, U., and Andreae, M. O.: Transatlantic transport of pollution aerosol from Africa to the Amazon rain forest – Aircraft observations in the context of the ACRIDICON-CHUVA campaign, to be submitted to Atmos. Chem. Phys. Discuss., 2018.
Huang, S., Wu, Z., Poulain, L., van Pinxteren, M., Merkel, M., Assmann, D., Herrmann, H., and Wiedensohler, A.: Source apportionment of the submicron organic aerosols over the Atlantic Ocean from 53∘ N to 53∘ S using HR-ToF-AMS, Atmos. Chem. Phys. Discuss., https://doi.org/10.5194/acp-2018-307, in review, 2018.
Ilyinskaya, E., Schmidt, A., Mather, T. A., Pope, F. D., Witham, C., Baxter, P., Jóhannsson, T., Pfeffer, M., Barsotti, S., Singh, A., Sanderson, P., Bergsson, B., McCormick Kilbride, B., Donovan, A., Peters, N., Oppenheimer, C., and Edmonds, M.: Understanding the environmental impacts of large fissure eruptions: Aerosol and gas emissions from the 2014–2015 Holuhraun eruption (Iceland), Earth Planet. Sc. Lett., 472, 309–322, https://doi.org/10.1016/j.epsl.2017.05.025, 2017.
Jardine, K., Yañez-Serrano, A. M., Williams, J., Kunert, N., Jardine, A., Taylor, T., Abrell, L., Artaxo, P., Guenther, A., Hewitt, C. N., House, E., Florentino, A. P., Manzi, A., Higuchi, N., Kesselmeier, J., Behrendt, T., Veres, P. R., Derstroff, B., Fuentes, J. D., Martin, S. T., and Andreae, M. O.: Dimethyl sulfide in the Amazon rain forest, Global Biogeochem. Cy., 29, 19–32, https://doi.org/10.1002/2014GB004969, 2015.
Khodri, M., Izumo, T., Vialard, J., Janicot, S., Cassou, C., Lengaigne, M., Mignot, J., Gastineau, G., Guilyardi, E., Lebas, N., Robock, A., and McPhaden, M. J.: Tropical explosive volcanic eruptions can trigger El Niño by cooling tropical Africa, Nat. Commun., 8, 778, https://doi.org/10.1038/s41467-017-00755-6, 2017.
Khokhar, M. F., Frankenberg, C., Van Roozendael, M., Beirle, S., Kühl, S., Richter, A., Platt, U., and Wagner, T.: Satellite observations of atmospheric SO2 from volcanic eruptions during the time-period of 1996–2002, Adv. Sp. Res., 36, 879–887, https://doi.org/10.1016/j.asr.2005.04.114, 2005.
Kirchner, I., Stenchikov, G. L., Graf, H.-F., Robock, A., and Antuña, J. C.: Climate model simulation of winter warming and summer cooling following the 1991 Mount Pinatubo volcanic eruption, J. Geophys. Res.-Atmos., 104, 19039–19055, https://doi.org/10.1029/1999JD900213, 1999.
Kleist, D. T., Parrish, D. F., Derber, J. C., Treadon, R., Wu, W.-S., Lord, S., Kleist, D. T., Parrish, D. F., Derber, J. C., Treadon, R., Wu, W.-S., and Lord, S.: Introduction of the GSI into the NCEP Global Data Assimilation System, Weather Forecast., 24, 1691–1705, https://doi.org/10.1175/2009WAF2222201.1, 2009.
Krueger, A. J.: Detection of volcanic eruptions from space by their sulfur dioxide clouds, Am. Inst. Aeronaut. Astronaut. Aerosp. Sci. Meet. 23rd, Reno, NV, 14–17 January 1985, 5 pp., available at: http://adsabs.harvard.edu/abs/1985aiaa.meetQ....K (last access: 14 November 2017), 1985.
Kuhn, U., Ganzeveld, L., Thielmann, A., Dindorf, T., Schebeske, G., Welling, M., Sciare, J., Roberts, G., Meixner, F. X., Kesselmeier, J., Lelieveld, J., Kolle, O., Ciccioli, P., Lloyd, J., Trentmann, J., Artaxo, P., and Andreae, M. O.: Impact of Manaus City on the Amazon Green Ocean atmosphere: ozone production, precursor sensitivity and aerosol load, Atmos. Chem. Phys., 10, 9251–9282, https://doi.org/10.5194/acp-10-9251-2010, 2010.
Levelt, P. F., van den Oord, G. H. J., Dobber, M. R., Malkki, A., Huib Visser, Johan de Vries, Stammes, P., Lundell, J. O. V., and Saari, H.: The ozone monitoring instrument, IEEE Trans. Geosci. Remote Sens., 44, 1093–1101, https://doi.org/10.1109/TGRS.2006.872333, 2006.
Li, C., Krotkov, N. A., and Joiner, J.: OMI/Aura Sulphur Dioxide (SO2) Total Column 1-orbit L2 Swath 13×24 km V003, Greenbelt, MD, USA, Goddard Earth Sciences Data and Information Services Center (GES DISC), available at: https://doi.org/10.5067/Aura/OMI/DATA2022 (last access: 27 October 2017), 2006.
Li, C., Joiner, J., Krotkov, N. A., and Bhartia, P. K.: A fast and sensitive new satellite SO2 retrieval algorithm based on principal component analysis: Application to the ozone monitoring instrument, Geophys. Res. Lett., 40, 6314–6318, https://doi.org/10.1002/2013GL058134, 2013.
Li, C., Krotkov, N. A., Carn, S., Zhang, Y., Spurr, R. J. D., and Joiner, J.: New-generation NASA Aura Ozone Monitoring Instrument (OMI) volcanic SO2 dataset: algorithm description, initial results, and continuation with the Suomi-NPP Ozone Mapping and Profiler Suite (OMPS), Atmos. Meas. Tech., 10, 445–458, https://doi.org/10.5194/amt-10-445-2017, 2017.
Machado, L. A. T., Silva Dias, M. A. F., Morales, C., Fisch, G., Vila, D., Albrecht, R., Goodman, S. J., Calheiros, A. J. P., Biscaro, T., Kummerow, C., Cohen, J., Fitzjarrald, D., Nascimento, E. L., Sakamoto, M. S., Cunningham, C., Chaboureau, J.-P., Petersen, W. A., Adams, D. K., Baldini, L., Angelis, C. F., Sapucci, L. F., Salio, P., Barbosa, H. M. J., Landulfo, E., Souza, R. A. F., Blakeslee, R. J., Bailey, J., Freitas, S., Lima, W. F. A., and Tokay, A.: The Chuva Project: How Does Convection Vary across Brazil?, B. Am. Meteorol. Soc., 95, 1365–1380, https://doi.org/10.1175/BAMS-D-13-00084.1, 2014.
Malavelle, F. F., Haywood, J. M., Jones, A., Gettelman, A., Clarisse, L., Bauduin, S., Allan, R. P., Karset, I. H. H., Kristjánsson, J. E., Oreopoulos, L., Cho, N., Lee, D., Bellouin, N., Boucher, O., Grosvenor, D. P., Carslaw, K. S., Dhomse, S., Mann, G. W., Schmidt, A., Coe, H., Hartley, M. E., Dalvi, M., Hill, A. A., Johnson, B. T., Johnson, C. E., Knight, J. R., O'Connor, F. M., Partridge, D. G., Stier, P., Myhre, G., Platnick, S., Stephens, G. L., Takahashi, H., and Thordarson, T.: Strong constraints on aerosol–cloud interactions from volcanic eruptions, Nature, 546, 485–491, https://doi.org/10.1038/nature22974, 2017.
Martin, S. T., Andreae, M. O., Artaxo, P., Baumgardner, D., Chen, Q., Goldstein, A. H., Guenther, A., Heald, C. L., Mayol-Bracero, O. L., McMurry, P. H., Pauliquevis, T., Pöschl, U., Prather, K. A., Roberts, G. C., Saleska, S. R., Silva Dias, M. A., Spracklen, D. V., Swietlicki, E., and Trebs, I.: Sources and properties of Amazonian aerosol particles, Rev. Geophys., 48, RG2002, https://doi.org/10.1029/2008RG000280, 2010.
Martin, S. T., Artaxo, P., Machado, L. A. T., Manzi, A. O., Souza, R. A. F., Schumacher, C., Wang, J., Andreae, M. O., Barbosa, H. M. J., Fan, J., Fisch, G., Goldstein, A. H., Guenther, A., Jimenez, J. L., Pöschl, U., Silva Dias, M. A., Smith, J. N., and Wendisch, M.: Introduction: Observations and Modeling of the Green Ocean Amazon (GoAmazon2014/5), Atmos. Chem. Phys., 16, 4785–4797, https://doi.org/10.5194/acp-16-4785-2016, 2016.
Martin, S. T., Artaxo, P., Machado, L., Manzi, A. O., Souza, R. A. F., Schumacher, C., Wang, J., Biscaro, T., Brito, J., Calheiros, A., Jardine, K., Medeiros, A., Portela, B., de Sá, S. S., Adachi, K., Aiken, A. C., Albrecht, R., Alexander, L., Andreae, M. O., Barbosa, H. M. J., Buseck, P., Chand, D., Comstock, J. M., Day, D. A., Dubey, M., Fan, J., Fast, J., Fisch, G., Fortner, E., Giangrande, S., Gilles, M., Goldstein, A. H., Guenther, A., Hubbe, J., Jensen, M., Jimenez, J. L., Keutsch, F. N., Kim, S., Kuang, C., Laskin, A., McKinney, K., Mei, F., Miller, M., Nascimento, R., Pauliquevis, T., Pekour, M., Peres, J., Petäjä, T., Pöhlker, C., Pöschl, U., Rizzo, L., Schmid, B., Shilling, J. E., Dias, M. A. S., Smith, J. N., Tomlinson, J. M., Tóta, J., and Wendisch, M.: The Green Ocean Amazon Experiment (GoAmazon2014/5) Observes Pollution Affecting Gases, Aerosols, Clouds, and Rainfall over the Rain Forest, B. Am. Meteorol. Soc., 98, 981–997, https://doi.org/10.1175/BAMS-D-15-00221.1, 2017.
Mather, T. A., Pyle, D. M. M., and Oppenheimer, C.: Tropospheric volcanic aerosol, in: Volcanism Earth's Atmosphere, edited by: Robock, A. and Oppenheimer, C., 189–212, https://doi.org/10.1029/139GM12, 2003.
McNaughton, C. S., Clarke, A. D., Freitag, S., Kapustin, V. N., Kondo, Y., Moteki, N., Sahu, L., Takegawa, N., Schwarz, J. P., Spackman, J. R., Watts, L., Diskin, G., Podolske, J., Holloway, J. S., Wisthaler, A., Mikoviny, T., de Gouw, J., Warneke, C., Jimenez, J., Cubison, M., Howell, S. G., Middlebrook, A., Bahreini, R., Anderson, B. E., Winstead, E., Thornhill, K. L., Lack, D., Cozic, J., and Brock, C. A.: Absorbing aerosol in the troposphere of the Western Arctic during the 2008 ARCTAS/ARCPAC airborne field campaigns, Atmos. Chem. Phys., 11, 7561–7582, https://doi.org/10.5194/acp-11-7561-2011, 2011.
Moran-Zuloaga, D., Ditas, F., Walter, D., Saturno, J., Brito, J., Carbone, S., Chi, X., Hrabe de Angelis, I., Baars, H., Godoi, R. H. M., Heese, B., Holanda, B. A., Lavric, J. V., Martin, S. T., Ming, J., Pöhlker, M. L., Ruckteschler, N., Su, H., Wang, Y., Wang, Q., Wang, Z., Weber, B., Wolff, S., Artaxo, P., Pöschl, U., Andreae, M. O., and Pöhlker, C.: Long-term study on coarse mode aerosols in the Amazon rain forest with the frequent intrusion of Saharan dust plumes, Atmos. Chem. Phys., 18, 10055–10088, https://doi.org/10.5194/acp-18-10055-2018, 2018.
Müller, T., Laborde, M., Kassell, G., and Wiedensohler, A.: Design and performance of a three-wavelength LED-based total scatter and backscatter integrating nephelometer, Atmos. Meas. Tech., 4, 1291–1303, https://doi.org/10.5194/amt-4-1291-2011, 2011.
Ng, N. L., Herndon, S. C., Trimborn, A., Canagaratna, M. R., Croteau, P. L., Onasch, T. B., Sueper, D., Worsnop, D. R., Zhang, Q., Sun, Y. L., and Jayne, J. T.: An Aerosol Chemical Speciation Monitor (ACSM) for Routine Monitoring of the Composition and Mass Concentrations of Ambient Aerosol, Aerosol Sci. Technol., 45, 780–794, https://doi.org/10.1080/02786826.2011.560211, 2011.
Petzold, A. and Schönlinner, M.: Multi-angle absorption photometry – a new method for the measurement of aerosol light absorption and atmospheric black carbon, J. Aerosol Sci., 35, 421–441, https://doi.org/10.1016/j.jaerosci.2003.09.005, 2004.
Platt, U. and Stutz, J.: Differential optical absorption spectroscopy: principles and applications, Springer Verlag, Berlin, ISBN-13: 978-3-540-75776-4, 2008.
Pöhlker, C., Walter, D., Paulsen, H., Könemann, T., Rodríguez-Caballero, E., Moran-Zuloaga, D., Brito, J., Carbone, S., Degrendele, C., Després, V. R., Ditas, F., Holanda, B. A., Kaiser, J. W., Lammel, G., Lavric, J. V., Ming, J., Pickersgill, D., Pöhlker, M. L., Praß, M., Ruckteschler, N., Saturno, J., Sörgel, M., Wang, Q., Weber, B., Wolff, S., Artaxo, P., Pöschl, U., and Andreae, M. O.: Land cover and its transformation in the backward trajectory footprint region of the Amazon Tall Tower Observatory, Atmos. Chem. Phys. Discuss., https://doi.org/10.5194/acp-2018-323, in review, 2018.
Pöhlker, M. L., Pöhlker, C., Ditas, F., Klimach, T., Hrabe de Angelis, I., Araújo, A., Brito, J., Carbone, S., Cheng, Y., Chi, X., Ditz, R., Gunthe, S. S., Kesselmeier, J., Könemann, T., Lavric, J. V., Martin, S. T., Mikhailov, E., Moran-Zuloaga, D., Rose, D., Saturno, J., Su, H., Thalman, R., Walter, D., Wang, J., Wolff, S., Barbosa, H. M. J., Artaxo, P., Andreae, M. O., and Pöschl, U.: Long-term observations of cloud condensation nuclei in the Amazon rain forest – Part 1: Aerosol size distribution, hygroscopicity, and new model parametrizations for CCN prediction, Atmos. Chem. Phys., 16, 15709–15740, https://doi.org/10.5194/acp-16-15709-2016, 2016.
Pöhlker, M. L., Ditas, F., Saturno, J., Klimach, T., Hrabe de Angelis, I., Araùjo, A. C., Brito, J., Carbone, S., Cheng, Y., Chi, X., Ditz, R., Gunthe, S. S., Holanda, B. A., Kandler, K., Kesselmeier, J., Könemann, T., Krüger, O. O., Lavric, J. V., Martin, S. T., Mikhailov, E., Moran-Zuloaga, D., Rizzo, L. V., Rose, D., Su, H., Thalman, R., Walter, D., Wang, J., Wolff, S., Barbosa, H. M. J., Artaxo, P., Andreae, M. O., Pöschl, U., and Pöhlker, C.: Long-term observations of cloud condensation nuclei over the Amazon rain forest – Part 2: Variability and characteristics of biomass burning, long-range transport, and pristine rain forest aerosols, Atmos. Chem. Phys., 18, 10289–10331, https://doi.org/10.5194/acp-18-10289-2018, 2018.
Reiner, T. and Arnold, F.: Laboratory investigations of gaseous sulfuric acid formation via SO3 + H2O + M → H2SO4 + M: Measurement of the rate constant and product identification, J. Chem. Phys., 101, 7399–7407, https://doi.org/10.1063/1.468298, 1994.
Richter, A. and Wagner, T.: The Use of UV, Visible and Near IR Solar Back Scattered Radiation to Determine Trace Gases, in: The Remote Sensing of Tropospheric Composition from Space, Physics of Earth and Space Environments, edited by: Burrows, J. P., Borrell, P., and Platt, U., 67–121, ISBN-13: 978-3-642-14790-6, Springer-Verlag Berlin Heidelberg, 2011.
Robock, A.: Volcanic eruptions and climate, Rev. Geophys., 38, 191–219, https://doi.org/10.1029/1998RG000054, 2000.
Robock, A.: Correction to “Volcanic eruptions and climate”, Rev. Geophys., 45, https://doi.org/10.1029/2007RG000232, 2007.
Sangeetha, S. K., Sivakumar, V., and Gebreslasie, M.: Long-range transport of SO2 over South Africa: A case study of the Calbuco volcanic eruption in April 2015, Atmos. Environ., 185, 78–90, https://doi.org/10.1016/j.atmosenv.2018.04.056, 2018.
Saturno, J., Holanda, B. A., Pöhlker, C., Ditas, F., Wang, Q., Moran-Zuloaga, D., Brito, J., Carbone, S., Cheng, Y., Chi, X., Ditas, J., Hoffmann, T., Hrabe de Angelis, I., Könemann, T., Lavric, J. V., Ma, N., Ming, J., Paulsen, H., Pöhlker, M. L., Rizzo, L. V., Schlag, P., Su, H., Walter, D., Wolff, S., Zhang, Y., Artaxo, P., Pöschl, U., and Andreae, M. O.: Black and brown carbon over central Amazonia: Long-term aerosol measurements at the ATTO site, Atmos. Chem. Phys. Discuss., https://doi.org/10.5194/acp-2017-1097, in review, 2017.
Schulz, C., Schneider, J., Amorim Holanda, B., Appel, O., Costa, A., de Sá, S. S., Dreiling, V., Fütterer, D., Jurkat-Witschas, T., Klimach, T., Krämer, M., Martin, S. T., Mertes, S., Pöhlker, M. L., Sauer, D., Voigt, C., Weinzierl, B., Ziereis, H., Zöger, M., Andreae, M. O., Artaxo, P., Machado, L. A. T., Pöschl, U., Wendisch, M., and Borrmann, S.: Aircraft-based observations of isoprene epoxydiol-derived secondary organic aerosol (IEPOX-SOA) in the tropical upper troposphere over the Amazon region, Atmos. Chem. Phys. Discuss., https://doi.org/10.5194/acp-2018-232, in review, 2018.
Stein, A. F., Draxler, R. R., Rolph, G. D., Stunder, B. J. B., Cohen, M. D., and Ngan, F.: NOAA's HYSPLIT Atmospheric Transport and Dispersion Modeling System, B. Am. Meteorol. Soc., 96, 2059–2077, https://doi.org/10.1175/BAMS-D-14-00110.1, 2015.
Stephens, M., Turner, N., and Sandberg, J.: Particle Identification by Laser-Induced Incandescence in a Solid-State Laser Cavity, Appl. Opt., 42, 3726, https://doi.org/10.1364/AO.42.003726, 2003.
Stevens, B. and Feingold, G.: Untangling aerosol effects on clouds and precipitation in a buffered system, Nature, 461, 607–613, https://doi.org/10.1038/nature08281, 2009.
Talbot, R. W., Andreae, M. O., Andreae, T. W., and Harriss, R. C.: Regional aerosol chemistry of the Amazon Basin during the dry season, J. Geophys. Res., 93, 1499, https://doi.org/10.1029/JD093iD02p01499, 1988.
Textor, C., Graf, H.-F., Timmreck, C., and Robock, A.: Emissions from volcanoes, in: Emissions of Atmospheric Trace Compounds. Advances in Global Change Research, edited by: Granier, C., Artaxo, P., and Reeves, C. E., 269–303, Springer, Dordrecht, 2004.
Van Hoek, M. and Claas, J.: Possibilities to avoid row anomaly rows Date Signature, TN-OMIE-KNMI-963, available at: http://bibliotheek.knmi.nl/knmipubDIV/TN-OMIE/tnomieknmi963_possibilities_to_avoid_row_anomaly_rows.pdf (last access: 14 November 2017), 2010.
Wang, Q., Saturno, J., Chi, X., Walter, D., Lavric, J. V., Moran-Zuloaga, D., Ditas, F., Pöhlker, C., Brito, J., Carbone, S., Artaxo, P., and Andreae, M. O.: Modeling investigation of light-absorbing aerosols in the Amazon Basin during the wet season, Atmos. Chem. Phys., 16, 14775–14794, https://doi.org/10.5194/acp-16-14775-2016, 2016.
Wendisch, M., Pöschl, U., Andreae, M. O., Machado, L. A. T., Albrecht, R., Schlager, H., Rosenfeld, D., Martin, S. T., Abdelmonem, A., Afchine, A., Araùjo, A. C., Artaxo, P., Aufmhoff, H., Barbosa, H. M. J., Borrmann, S., Braga, R., Buchholz, B., Cecchini, M. A., Costa, A., Curtius, J., Dollner, M., Dorf, M., Dreiling, V., Ebert, V., Ehrlich, A., Ewald, F., Fisch, G., Fix, A., Frank, F., Fütterer, D., Heckl, C., Heidelberg, F., Hüneke, T., Jäkel, E., Järvinen, E., Jurkat, T., Kanter, S., Kästner, U., Kenntner, M., Kesselmeier, J., Klimach, T., Knecht, M., Kohl, R., Kölling, T., Krämer, M., Krüger, M., Krisna, T. C., Lavric, J. V., Longo, K., Mahnke, C., Manzi, A. O., Mayer, B., Mertes, S., Minikin, A., Molleker, S., Münch, S., Nillius, B., Pfeilsticker, K., Pöhlker, C., Roiger, A., Rose, D., Rosenow, D., Sauer, D., Schnaiter, M., Schneider, J., Schulz, C., de Souza, R. A. F., Spanu, A., Stock, P., Vila, D., Voigt, C., Walser, A., Walter, D., Weigel, R., Weinzierl, B., Werner, F., Yamasoe, M. A., Ziereis, H., Zinner, T., and Zöger, M.: ACRIDICON–CHUVA Campaign: Studying Tropical Deep Convective Clouds and Precipitation over Amazonia Using the New German Research Aircraft HALO, B. Am. Meteorol. Soc., 97, 1885–1908, https://doi.org/10.1175/BAMS-D-14-00255.1, 2016.
Yang, Y., Wang, H., Smith, S. J., Easter, R., Ma, P.-L., Qian, Y., Yu, H., Li, C., and Rasch, P. J.: Global source attribution of sulfate concentration and direct and indirect radiative forcing, Atmos. Chem. Phys., 17, 8903–8922, https://doi.org/10.5194/acp-17-8903-2017, 2017.