the Creative Commons Attribution 4.0 License.
the Creative Commons Attribution 4.0 License.
 | 20 Jul 2018
The Δ17O and δ18O values of atmospheric nitrates simultaneously collected downwind of anthropogenic sources – implications for polluted air masses
Martine M. Savard
Amanda S. Cole
Robert Vet
Anna Smirnoff
There are clear motivations for better understanding the atmospheric processes that transform nitrogen (N) oxides (NOx) emitted from anthropogenic sources into nitrates (), two of them being that contributes to acidification and eutrophication of terrestrial and aquatic ecosystems, and particulate nitrate may play a role in climate dynamics. For these reasons, oxygen isotope delta values (δ18O, Δ17O) are frequently applied to infer the chemical pathways leading to the observed mass-independent isotopic anomalies from interaction with 17O-rich ozone (O3). Recent laboratory experiments suggest that the isotopic equilibrium between NO2 (the main precursor of ) and O3 may take long enough under certain field conditions that nitrates may be formed near emission sources with lower isotopic values than those formed further downwind. Indeed, previously published field measurements of oxygen isotopes in in precipitation () and in particulate () samples suggest that abnormally low isotopic values might characterize polluted air masses. However, none of the air studies have deployed systems allowing collection of samples specific to anthropogenic sources in order to avoid shifts in isotopic signature due to changing wind directions, or separately characterized gaseous HNO3 with Δ17O values. Here we have used a wind-sector-based, multi-stage filter sampling system and precipitation collector to simultaneously sample HNO3 and , and co-collect . The nitrates are from various distances (<1 to >125 km) downwind of different anthropogenic emitters, and consequently from varying time lapses after emission.
The separate collection of nitrates shows that the HNO3 δ18O ranges are distinct from those of w- and . Interestingly, the Δ17O differences between and HNO3 shift from positive during cold sampling periods to negative during warm periods. The low values observed during warm periods may partly derive from the involvement of 17O-depleted peroxy radicals (RO2) oxidizing NO during that season. Another possibility is that nitrates derive from NOx that has not yet reached isotopic equilibrium with O3. However, these mechanisms, individually or together, cannot explain the observed pNO3 minus HNO3 isotopic changes. We propose differences in dry depositional rates, faster for HNO3, as a mechanism for the observed shifts. Larger proportions of formed via the N2O5 pathway would explain the opposite fall–winter patterns. Our results show that the separate HNO3, and isotopic signals can be used to further our understanding of NOx oxidation and deposition. Future research should investigate all tropospheric nitrate species as well as NOx to refine our understanding of nitrate distribution worldwide and to develop effective emission reduction strategies.
- Article
(3172 KB) - Full-text XML
-
Supplement
(413 KB) - BibTeX
- EndNote


Anthropogenic NOx (NO and NO2) emissions are oxidized to nitrate in the atmosphere in the form of gaseous, wet or particulate forms, HNO3 being one of the main precursors of . All these species may have detrimental effects on human health and aquatic and terrestrial ecosystems through inhalation, acidification and excess nitrogen deposition. In addition, aerosols may play a significant role in regional climate dynamics as they interact with clouds and solar radiation (e.g., IPCC, 2013). For these reasons, understanding the chemical processes controlling the transport and fate of atmospheric reactive N is required to help develop effective emission reduction strategies and drive climate models (in the present article, we use nitrates to collectively refer to pNO3, HNO3 and wNO3).
Triple oxygen isotopes (δ18O and Δ17O) have been used to decipher atmospheric oxidation pathways of NOx leading to ambient nitrate. Michalski et al. (2003) performed the first measurement of Δ17O values in atmospheric nitrate. The authors found nitrate highly enriched in 18O and 17O, likely due to the transfer of anomalous oxygen atoms from ozone (O3) via the NOx–ozone photochemical cycle and oxidation to nitrate. During its formation, O3 inherits abnormally high δ18O and Δ17O values through mass independent fractionation. The specific Δ17O departure from the terrestrial mass-dependent fractionation line, named the 17O anomaly, is often expressed as (Thiemens, 1999). Further investigations suggested that the δ18O and Δ17O values of and reflect several reactions taking place after the atmospheric emission of NOx, i.e., atmospheric oxidation pathways transforming NOx into secondary products (Hastings et al., 2003; Michalski et al., 2003, 2004; Morin et al., 2007; Savarino et al., 2007; Alexander et al., 2009). Seasonal δ18O differences in samples (less variable and lower values during summer) have been interpreted to be due to changes in these chemical pathways (Hastings et al., 2003). Modelling and validation based on sparse existing data provide hope regarding a global understanding of atmospheric nitrate (Alexander et al., 2009); however, further measurements need to be done on the ground, particularly at mid-latitudes.
Additional studies dealing with triple oxygen isotope characterizations have addressed questions of methodology (Kaiser et al., 2007; Smirnoff et al., 2012), transfer of the ozone 17O anomaly to atmospheric nitrate (Liang and Yung, 2007; Savarino et al., 2008; Michalski et al., 2014) or sources and chemical pathways of high (Arctic) and low (Taiwan) latitude nitrate (Morin et al., 2008; Guha et al., 2017, respectively). Triple oxygen isotope characterizations of field samples are not yet widespread. Also rare are the nitrate δ18O and Δ17O values of field samples downwind from NOx-emitting sources at mid-latitudes (Kendall et al., 2007; Proemse et al., 2013). The few existing studies have chiefly characterized or the sum of and HNO3 (Michalski et al., 2004; Morin et al., 2007, 2008, 2009; Alexander et al., 2009; Proemse et al., 2012; Guha et al., 2017), and suggested these indicators would be useful to trace atmospheric nitrate in water (Kendall et al., 2007; Tsunogai et al., 2010; Dahal and Hastings, 2016), or to apportion the contribution of anthropogenic emissions to regional atmospheric nitrate loads (Proemse et al., 2013).
In the past, due to sampling challenges, HNO3 and were generally collected together (without differentiation). Therefore, no studies have separately and simultaneously collected and analyzed the HNO3 and and Δ17O values, and discussed these isotopic characteristics of nitrate collected downwind of anthropogenic emitters. While HNO3 and can be in equilibrium (e.g., if is in the form of solid NH4NO3), this is not always the case, for example, if nitrate is bonded to calcium or dissolved in liquid water on a wet particle (see Sect. 3.3). They have different lifetimes with respect to wet scavenging (Cheng and Zhang, 2017) and dry deposition velocities (Zhang et al., 2009), and may differ in their formation pathways as well. Therefore, investigating the mass-independent and mass-dependent oxygen fractionations in nitrates collected separately may help to identify their respective formation and loss pathways, and provide additional constraints on processes controlling their distribution.
Here we have characterized nitrate collected downwind of five emission sources in central and southern Alberta, Canada, namely (1) coal-fired power plants (CFPPs), (2) city traffic, (3) chemical industries and metal refining, (4) fertilizer plant and oil refinery and (5) gas compressors plus cattle and swine feedlots. To this end, we employed wind-sector-based active samplers to collect HNO3 and as well as downwind of the source types. The objective of this work was to assess the atmospheric NOx reaction pathways and determine processes responsible for the distribution of HNO3, w- and in a mid-latitudinal region.
2.1 Regional context
While national reported NOx emissions in Canada declined steadily from 2000 to 2015, emissions in the province of Alberta have remained relatively constant since 2004 (Environment and Climate Change Canada, 2016). Pioneering work was accomplished ,measuring nitrate on emitted PM2.5 (particulate matter less than 2.5 µm) and in bulk and throughfall precipitation samples (wet and some dry deposition on ion exchange resin collectors) collected at or downwind of the Athabasca oil sands mining operations in northern Alberta (Proemse et al., 2012, 2013). However, the Edmonton area in central Alberta, known to generate the highest NOx emissions in Canada, and the area of southern Alberta, characterized by dense gas compressor station and agricultural emissions, have never been investigated.

Figure 1Aerial images showing sampling sites (green triangles) in central and southern Alberta (a), and in the greater Edmonton area (b), along with emissions of NOx as tonnes of NO2 reported in the National Pollutant Release Inventory for 2013 (Environment and Climate Change Canada, 2018b).
This research project investigated nitrates (, HNO3 and ) from two main emission source areas: the Genesee and Edmonton areas of central Alberta, and the Vauxhall area of southern Alberta (Fig. 1a). These areas experience a continental climate, but the mean annual temperature at Vauxhall is slightly higher (5.6 ∘C) and total annual precipitation lower (320 mm) than in central Alberta (3.9 ∘C; 537 mm; Fig. S1 in the Supplement). Fall is generally the wettest season and winter the driest. The sampling sites were at altitudes between 645 and 820 m (above sea level), and in continental regions devoid of the influence of marine air masses (negligible halogen oxides).
The rural Vauxhall area was selected for collecting nitrates emitted from multiple small gas compressor stations scattered throughout southern Alberta and reduced N from cattle and swine feedlots. The other anthropogenic emissions are from three sites in central Alberta (Fig. 1b): CFPPs at the Genesee site, 55 km southwest of Edmonton; traffic-dominated emissions at Terrace Heights, a residential area near downtown Edmonton; and an industrial area in Fort Saskatchewan, northeast of Edmonton, where sampling two different wind sectors allowed separating different industries. In Fort Saskatchewan, sampling in the northwest sector targeted emissions from a mixture of sources of which the largest were a chemical plant and metal refinery (referred to as chemical plus metal industries; distance to sources of 3 to 7 km), while the north sector point emissions were dominated by a fertilizer plant and an oil refinery (referred to as fertilizers plus oil; distance to sources from 9 to 14 km). The NOx emissions reported in the National Pollutant Release Inventory (Environment and Climate Change Canada, 2018b) for 2013 from all Alberta sources are also shown in Fig. 1.
2.2 Sampling protocols
Collection of nitrate samples took place between 30 September 2010 and 20 January 2014. Active air sampling was carried out using a modified version of Environment Canada's CAPMoN (Canadian Air and Precipitation Monitoring Network) sampling protocol, which is described in detail elsewhere (Sirois and Fricke, 1992). Precipitation sampling also followed CAPMoN wet-only protocols as described in the literature (Sirois and Vet, 1999). A conditional sampling method was employed to maximize the collection of nitrogen compounds from the anthropogenic sources, in which the sampling pumps and precipitation collector were activated when the site wind vane registered winds faster than 0.55 m s−1 (2 km h−1) from the direction of the targeted sources. The CAPMoN sampling system was installed and operated at different sites, each at varying distances from the targeted point (<1 to 35 km) and diffuse sources (3 to >125 km; Table 1). Back trajectories run using the HYSPLIT model (Stein et al., 2015; Rolph, 2017) for every hour of sampling verified that the conditional sampling approach collected air masses that had primarily passed over or near the targeted source (i.e., there was no landscape feature that decoupled wind direction from back trajectories; see sample plot of back trajectories from Genesee in Fig. S2).
Table 1Settings and conditions for wind-sector-based simultaneous sampling of atmospheric nitrates.
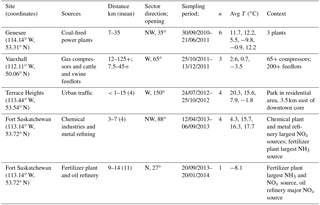
n: number of sampling sessions. Avg T: average temperature during each of the consecutive sampling sessions.
Ambient air was pulled through a three-stage filter pack system to collect, sequentially, particulate matter on a Teflon filter, gaseous nitric acid (HNO3) on a Nylasorb nylon filter and gaseous ammonia on a citric acid-coated Whatman 41 filter (all 47 mm). The Teflon–nylon filter method for and HNO3 has been extensively compared and evaluated, and is currently used by national monitoring networks targeting regional background sites, CAPMoN in Canada and CASTNet (Clean Air Status and Trends Network) in the United States. Previous testing showed negligible collection of HNO3 on the Teflon filter, <3 % breakthrough of HNO3 from the nylon filter with loadings more than 3 times higher than reported here and blanks for and HNO3 of approximately 0.2 µg N per filter (Anlauf et al., 1985, 1986). Intercomparisons with more labour-intensive methods, such as tunable diode laser absorption spectroscopy and annular denuder–filter pack systems, have shown evidence of some volatilization of ammonium nitrate from the Teflon filter, leading to a negative bias in and positive bias in HNO3 under hot (>25 ∘C) and dry conditions, particularly in high ambient concentrations (e.g., Appel et al., 1981). However, other field studies have shown no significant differences in HNO3 between filter packs and denuder and/or TDLAS systems (Anlauf et al., 1986; Sickles Ii et al., 1990) or mixed results (Spicer et al., 1982; Zhang et al., 2009). While those studies used short-duration sampling, a comparison for weekly samples at a lower concentration site showed good agreement between filter pack and denuder values for most of the study but potential interference from HNO2 (nitrous acid) on the nylon filter in two samples (Sickles Ii et al., 1999). Based on the conditions in Alberta, we estimate that there is little or no volatilization of NH4NO3 for samples with mean temperatures below 5 ∘C, but there is a possibility for nitrate loss of up to 30 % in the warmest sampling periods.
After the first five sample periods, an experimental active sampling system for NO2 and NOx was added downstream of the three-stage filter pack. This system consisted of one or two custom cartridges packed with Maxxam Analytics' resin to selectively collect NO2, and one- or two-stage filter packs containing two identical Maxxam Analytics' impregnated filters designed to collect NOx (mostly NO due to upstream collection of NO2). Oxygen isotopes in NO2 and NOx were not measured since we could not rule out oxygen isotope exchange during the extraction process; however, concentrations meeting the quality control (QC) criteria (Savard et al., 2017) are presented for reference in Table S1.
Here we report on oxygen isotopes in the simultaneously sampled HNO3 and , along with co-sampled in rain and snow samples. Note that precipitation events did not occur regularly (see Fig. S1), so that the number of aqueous samples collected was fewer than the gas and particulate samples. Both the air and precipitation samplers were only active when the wind direction was from the desired source sector and the wind speed was greater than 0.55 m s−1 (2 km h−1). Four identical air sampling systems operated simultaneously at each site, with samples pooled when necessary to provide sufficient filter loadings for isotope analysis and, when possible, measured separately to estimate sampling precision. In contrast to the four gas–particle sampling systems, there was a single precipitation collector at each site, and therefore external precision was not determined for precipitation samples. Individual sample deployment times ranged from 5 to 113 days, and total air sampling time within the wind direction sectors ranged from 21 to 360 h (Table S1). The variable cumulative periods reflected the frequency of the wind flow from the targeted source sectors and the amount of time required to obtain sufficient mass loadings on the filters.
Two or three replicate samples for most species were pooled at Genesee and Vauxhall, the first two sampling sites, subject to the requirement that sampled air volumes be within 15 % of each other, thereby eliminating samples that experienced flow problems. Flow issues were primarily due to pump failure, likely caused by cycling the pumps on and off frequently in early samples. Therefore, for later samples the protocol was changed such that the pumps remained on and valves were used to switch the pumps between sampling lines and non-sampling tubing based on the wind sector. At the sites sampled later in the Edmonton area, improvements to the laboratory analytical procedure allowed for smaller sample amounts and eliminated the need for sample pooling.
2.3 Analytical procedures
Nitric acid from nylon filters was extracted using 10 mL of 0.01 M solution of NaCl. Particulate NO3 from Teflon filters was extracted in two portions of 6 mL of ultrapure water (ELGA). To reduce possible evaporation, filters were placed in an ultrasonic bath with ice. The extractions were performed during 1 h and samples were left for 48 h in a fridge to insure the complete extractions. The solutions were decanted and a small portion (1–2 mL) was used to determine concentrations. The remaining extracts were stored in the fridge for subsequent isotope analysis. The blanks from both filters were treated the same way.
Concentration of nitrates in Teflon and Nylon filter extracts and in precipitation samples were determined at the Institut national de la recherche scientifique – Eau, Terre, Environnement (INRS-ETE). The determinations used an automated QuikChem 8000 FIA+ analyzer (Lachat Instruments), equipped with an ASX-260 series autosampler. The detection limit for the method with sulfanilamide (31-107-04-1-A) was 0.03 µmol L−1 of –N. Nitrite concentrations were also measured in the extracts. Nitrite concentrations above the detection limit (1.1 µmol L−1 of –N) were found in a handful of samples at Terrace Heights. These samples were excluded from the reported data.
We characterized the Δ17O, δ18O and δ15N ratios of HNO3, and , along with the δ15N values of NH3, wNH4, pNH4 and NOx (all N isotopic results are in Savard et al., 2017). The present article deals solely with the δ18O and Δ17O values obtained for the three nitrate species. We treated the samples using the chemical conversion and thermal decomposition of N2O protocols, providing the ability to simultaneously analyze low-concentration N- and O-containing species (Smirnoff et al., 2012).
A notable challenge in the analysis of the filter-based atmospheric samples is their small extraction volumes. Only 10–12 mL of extract solution was normally available for the measurement of concentrations and isotopic analysis. In addition, the concentrations of these low volume samples were also low (7.1–21.4 µmol L−1 of –N). Therefore, not all samples could be diluted to produce volumes sufficient for reduction of to NO2 and subsequent conversion to N2O, the final product before isotope analysis. Samples with an initial concentration below 2.3 µmol L−1 could not be treated individually and were combined to produce volumes sufficient for analyses (same sampling period but combination of collected parallel samples).
The preparation steps involved conversion of nitrate-containing samples into nitrite () using a custom-made cadmium column. The final preparation step involved using sodium azide to ultimately produce N2O (McIlvin and Altabet, 2005; Smirnoff et al., 2012). All extracted N2O was analyzed using a pre-concentrator (PreCon, Thermo Finnigan MAT) including a furnace with “gold” wires, online with an isotope ratio mass spectrometer (Delta V Plus, Thermo Electron; Kaiser et al., 2007; Smirnoff et al., 2012). The utilized approach allows the spectrum of δ15N, Δ17O and δ18O values from O-bearing N-species to be determined in samples containing as little as 37.5 nmol of N (15 mL final solution). Extracts from filter blanks were processed in the same way. The blanks from nylon filters were not detectable. Peak heights from the blanks resulting from Teflon filters were detected and always below 10 % of sample peaks, having a negligible effect (within the analytical precision). The USGS-34, USGS-35 and USGS-32 nitrate reference materials were used and processed exactly the same way as the samples, i.e., converted from nitrate to nitrite, then to N2O. The laboratory analytical precision (average of replicates) determined during the present study was 0.6 ‰ for δ18O and Δ17O values in gaseous (n=12) and solid nitrates (n=20). For wNO3, analytical replicates gave 0.6 ‰ and 0.5 ‰, for δ18O (n=3) and Δ17O (n=4) values, respectively. The Δ17O values are defined as , relative to Vienna Standard Mean Ocean Water (VSMOW).
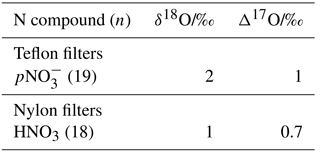
Table 2Isotopic reproducibility (modified median absolute deviation) established using two to four parallel active CAPMoN sampling set-ups in seven separate sampling periods, resulting in (n) total samples.
3.1 Isotopic reproducibility when using the CAPMoN filter pack sampling system
Data obtained from at least two of the four identical CAPMoN sample collection streams at each sampling site were used to calculate the reproducibility of each isotopic value measured. With four or fewer samples collected during each sampling period, a non-parametric approach was deemed most appropriate. Therefore, for each of the 18 sampling periods a median isotopic value was calculated, then the 2 to 4 absolute deviations from this median were calculated (Tables 2, S1). Although there were 4 replicates in 18 periods, the pooling of simultaneously collected samples and the QC steps described earlier reduced the total number of replicates for each compound (Table 3). The median absolute deviation (MAD) for each compound was then calculated from the 15–38 absolute deviations. Finally, for comparability with the more familiar standard deviation, the MAD was scaled using the standard 0.6745 divisor to give the modified median absolute deviation (M.MAD), a scaled parameter that will be equal to the standard deviation in the event of which the distribution is Gaussian (Randles and Wolfe, 1979; Sirois and Vet, 1999). This suite of parallel tests indicates that all measured species show coherent and reproducible Δ17O and δ18O results, with the M.MAD varying between 0.7 ‰ and 2 ‰ (Table 2). These estimations encompass the precision of the entire method, including errors due to sampling, chemical treatments and instrumental analysis.
Table 3Average oxygen isotopic ratios for sampled as gas (HNO3), w (precipitation) and p (particulate matter) relative to VSMOW.
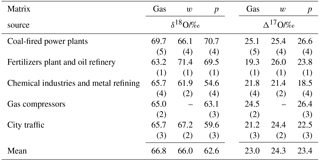
(n): number of sampling periods characterized.
A potential complication of the air sampling method can arise if there was significant volatilization of NH4NO3 on the particle filter into HNO3 and NH3, with subsequent collection on the downstream gas filters. This could result in equilibrium isotopic fractionation between the particle and gaseous components, which would become artificially high and low, respectively, with more fractionation at higher temperatures (summer) relative to lower temperatures (winter) when volatilization is minimal (Keck and Wittmaack, 2005). We find the isotopic values (Δ17O and δ18O) to be generally higher during winter than during summer (see Sect. 3.4). Moreover, the minus HNO3 δ18O differences are negative during summer (see Sect. 3.6), opposite to the expected isotopic artefact if particulate volatilization were the dominant factor in determining the particle–gas isotopic differences (the same was concluded for the δ15N values in NH3 and NH4; Savard et al., 2017). We therefore conclude that, while volatilization may occur in the summer samples, other isotope effects must be larger in order to lead to the observed differences. In addition, volatilization would cause mass-dependent fractionation and would not affect the 17O anomaly; therefore, Δ17O values remain robust indicators of chemical pathways in this situation. Finding that the sampling protocols are adequate for isotopic work is in agreement with a previous study using a comparable method that found minimal fractionation for and HNO3 (Elliott et al., 2009).
Table 4Compilation of triple oxygen isotopic ranges obtained for atmospheric and emitted nitrates.
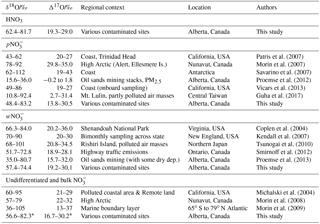
Note: isotopic values rounded to the whole number are from published graphs (except for precise O values in Morin et al., 2007). ∗ Calculated using weighted averages of HNO3 and pNO3 isotopic results.
3.2 Concentrations and isotopic ratios of nitrates in Alberta samples
The range of HNO3–N concentrations measured by the filters (from 0.01 to 0.15 µg m−3; average of 0.06) is slightly lower than that of –N (from 0.02 to 0.35 µg m−3; average of 0.12). For context, the median concentrations at all CAPMoN sites, which represent non-urban areas across Canada, range from 0.02 to 0.25 µg m−3 for HNO3–N and from 0.007 to 0.45 µg m−3 for –N (Cheng and Zhang, 2017), with the higher values at sites affected by regional and transboundary pollution. Background sites for this region are sparse, but concentrations at Cree Lake in neighbouring Saskatchewan were the lowest in Canada reported up to 2011 (Cheng and Zhang, 2017), and 2014–2016 measurements at Wood Buffalo National Park on the northern Alberta border revealed similar average concentrations of 0.02 µg m−3 of –N for both HNO3 and (preliminary internal data). Therefore, the lowest concentrations in our samples approached average background concentrations, while the highest were 20 or more times higher than the regional background. The range of –N concentrations of the samples was 10.71–34.29 µmol L−1. For comparison, volume-weighted mean annual concentrations of nitrate at the remote CAPMoN site to the north (Snare Rapids) for 2011–2014 were approximately 5.00 µmol L−1 of –N, while at the most polluted site in southern Ontario (Longwoods) the volume-weighted mean concentration was approximately 21.43 µmol L−1 (Environment and Climate Change Canada, 2018a). It should be pointed out that precipitation ion concentrations vary significantly with precipitation amount, so the short samples collected here are not necessarily representative of annual volume-weighted means.
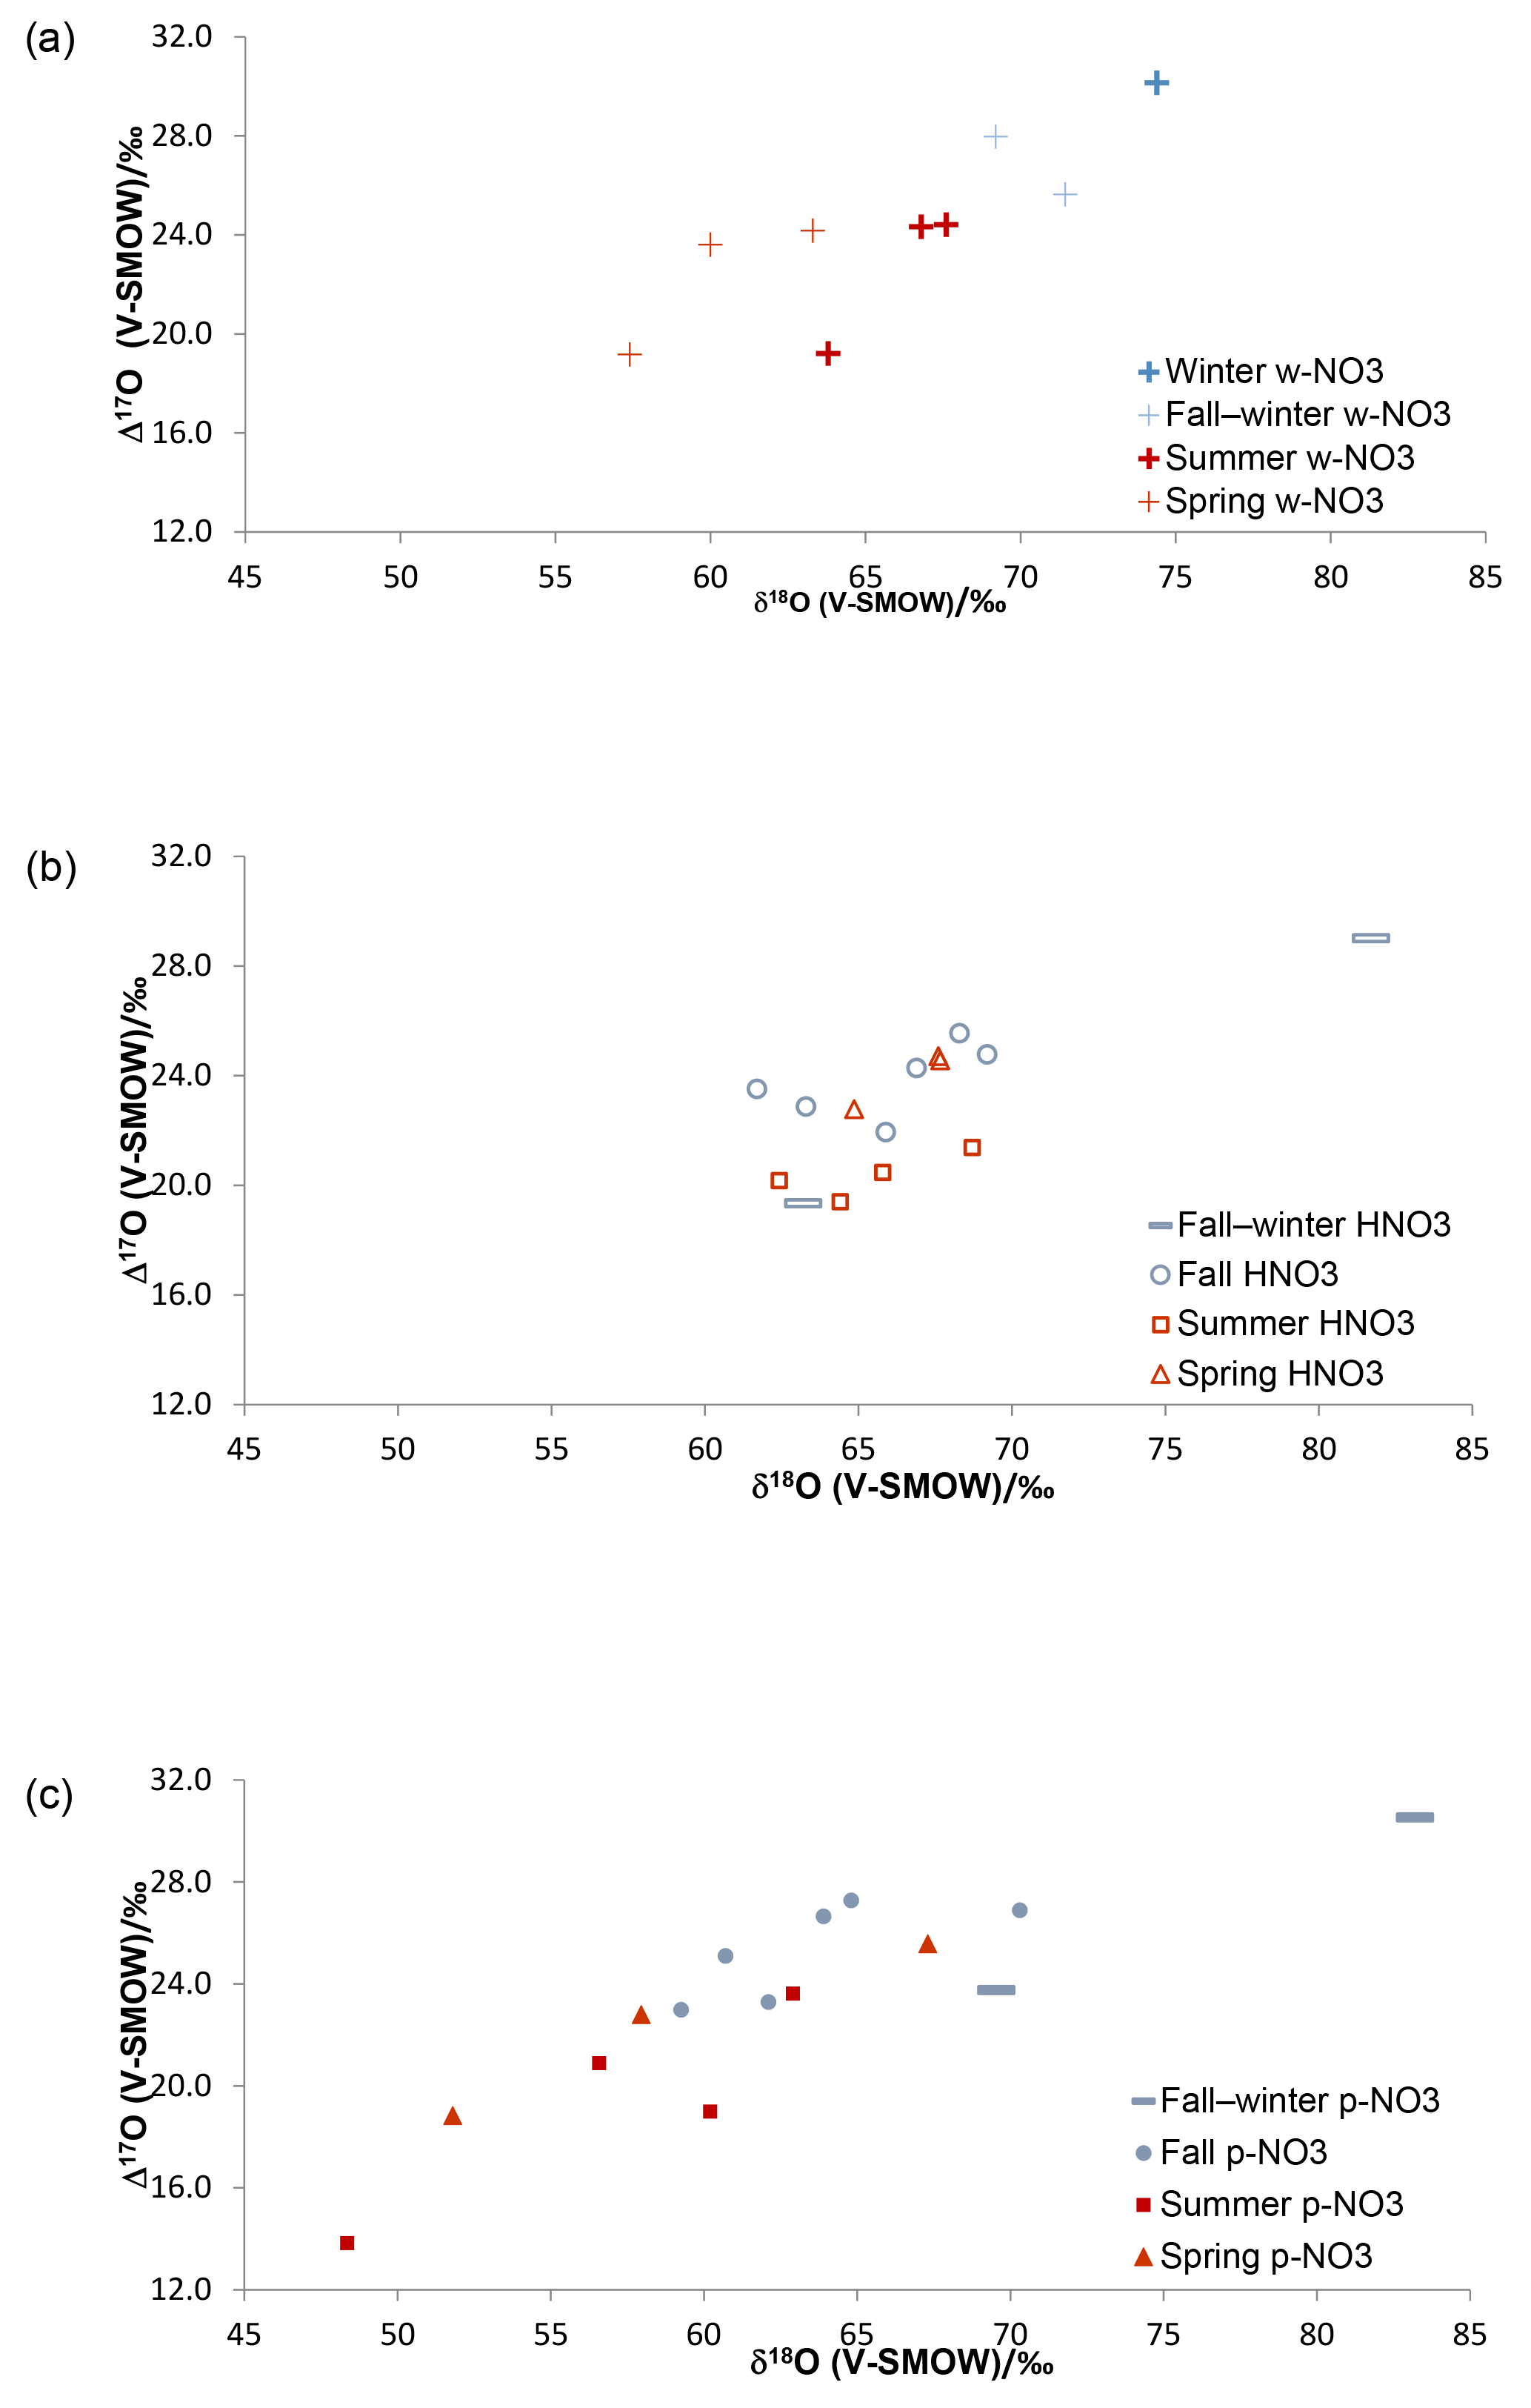
Figure 2Triple O isotopic results obtained for simultaneously collected atmospheric HNO3 (a), (b) and (c), in Alberta, identified by sampling periods (cold months – blue; warm months – red).
The average δ18O and Δ17O values of HNO3 (gas), w- and show no apparent systematic ordering (Tables 3, S1 and S2), in contrast to what was found for δ15N values in the same samples (Savard et al., 2017). As expected, there is no systematic tendency when looking at the samples collected from the anthropogenic sources: CFPPs HNO3 and have the highest δ18O and Δ17O averages, but not the highest delta values for values; chemical industries show the lowest δ18O and Δ17O averages for w- and pNO3, but not for HNO3. Though the number of samples was limited, values were roughly correlated with the weighted average Δ17O values of pNO3 and HNO3 in samples covering the same time periods, consistent with scavenging of both HNO3 and pNO3 by wet deposition. This observation indicates that the oxygen isotopes in the three nitrate species are not predominantly source dependent (see also Fig. S3), as previously suggested in the literature (Michalski et al., 2003).
Considering all nitrate species, the Alberta δ18O and Δ17O values range between +48.4 and +83.2 ‰, and between 13.8 ‰ and 30.5 ‰, respectively (Tables 4, S1, Fig. S4). These ranges indicate that ozone partly transferred its isotopic anomaly to nitrates during NOx cycling and oxidation (nitrate derived through combustion in O2 would show δ18O and Δ17O values of 23.5 ‰ and 0 ‰, respectively). When examining the existing δ18O and Δ17O data for w- and in the literature, the ranges for our mid-latitude samples are within those previously reported (Table 4). The worldwide compilation of documented data is broadening the δ18O range of atmospheric previously suggested to be between 60 ‰ and 95 ‰ (Hastings et al., 2003; Kendall et al., 2007).
Table 5Main reactions producing atmospheric nitrates (Zel'dovich, 1946; Lavoie et al., 1970; Erisman and Fowler, 2003; Michalski et al., 2003; Morino et al., 2006; Morin et al., 2007; Stroud, 2008; Michalski et al., 2014). Reactions (R1) and (R9–R12) can occur any time.
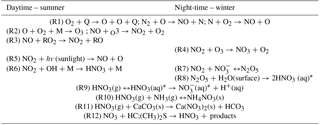
Q is a stable molecule of high energy; M is either O2 or N2; RO2 stands for both HO2 and alkyl peroxy. HC stands for hydrocarbons. ∗This aqueous nitrate may be on a particle.
Previous studies that report triple isotope oxygen results in atmospheric samples are scarce (Table 4). The HNO3 range documented here is within the broad spectrum of values compiled for remote to contaminated sites. Elliott et al. (2009) reported HNO3 oxygen results for δ18O values only, with a range of +51.6 ‰ to +94.0 ‰ (mean of 77.4), with simultaneously sampled values between +45.2 ‰ and +92.7 ‰ (mean of 75.2). Those ranges are broader than the HNO3 and values obtained in the present study.
3.3 The δ18O and Δ17O trends in nitrates from cold and warm sampling periods
The δ18O and Δ17O ranges for HNO3 identified by sampling period are narrower than those of the simultaneously collected (Fig. 2; Table S1), suggesting that there are additional mechanisms affecting HNO3, or that pNO3 is derived from different pathways with more variation in isotopic signatures. Overall, the Δ17O and δ18O results for HNO3, and clearly show higher δ18O and Δ17O values during cold periods relative to warm periods (Fig. 2), with the exception of HNO3 δ18O values, which were similar in cold and warm periods. The collection of several samples lasted over periods overlapping fall and winter and, in such cases, the results are labelled as covering the two seasons; note that for many fall cases, the average sampling temperatures were below 0 ∘C (Table S3). Nevertheless, plotting by sampling period can be regarded as a general repartition of results between warm and cold months, which show lower and higher isotopic values, respectively, in both the w- and .
A series of reactions listed in Table 5 summarizes the main atmospheric processes taking place during the production of nitrates in contaminated air masses. First, during anthropogenic combustion of fossil fuels, NOx (NO and NO2) is produced through reactions of air N2 with atmospheric O2 at high temperatures (Reaction R1; Table 5). Then, NOx cycles between NO and NO2 through a series of reactions involving sunlight (Reaction R5), O3 (Reactions R2, R4) and peroxy (HO2) or alkyl peroxy (RO2) radicals (Reaction R3; Morin et al., 2007; Fang et al., 2011; Michalski et al., 2014; here we use RO2 to refer collectively to HO2 and RO2).
The oxidation of NOx (specifically NO2) to HNO3 further incorporates additional O atoms from different oxidants (Reactions R6–R8; Table 5). Production of nitrate via Reaction (R6) is restricted to daytime (since OH is generated through photochemistry), whereas production through Reactions (R4), (R7) and (R8) dominates at night. In addition, N2O5 is thermally unstable, so the contribution of the R4-R7-R8 pathway is larger during winter than during summer. Additionally, in the heterogeneous hydrolysis of N2O5 (Reaction R8), HNO3 is likely to be retained on the reaction particle as due to its hygroscopicity (Seinfeld and Pandis, 2006). We have neglected contributions from BrO cycling due to the location far from the coast, and from reactions of NO3 with hydrocarbons (Reaction R12) since they are predicted to have a minimal contribution to nitrate formation in this region (Alexander et al., 2009). Finally, HNO3 in the gas phase can be irreversibly scavenged by wet surfaces or precipitation (Reaction R9) and calcium carbonate on particles (Reaction R11), and can equilibrate with solid ammonium nitrate where there is excess ammonia available (Reaction R10).
It has been previously suggested that the δ18O and Δ17O values of w- and formed during summer are lower than those during winter due to a higher contribution from the N2O5 path (Reactions R4, R7–R8) during that season (e.g., Hastings et al., 2003; Morin et al., 2008). As an early take on the data identified by sampling periods, the w- and and Δ17O data presented here follow the same patterns for warm and cold months (Fig. 2). In contrast, the less commonly studied HNO3 shows similar δ18O values during warm and cold seasons, but summer Δ17O values mostly lower than the fall–winter, fall and spring ones.
Table 6Correlation coefficients (r) of isotopic deltas with meteorological parameters and concentration (or ratio) of co-contaminants. In bold are the significant correlation coefficients, equal or above the 95 % significance value.
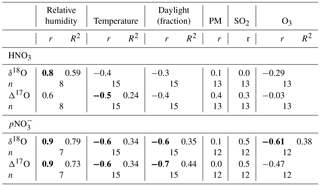
3.4 Correlations with meteorological parameters and co-pollutants
The distribution and proportion of HNO3 and in polluted air masses can vary daily and seasonally with temperature, relative humidity (RH) and concentration of co-contaminants (Morino et al., 2006). For that reason, we compared the isotopic ratios of the HNO3 and pNO3 samples (n of wNO3 too low) with meteorological and air quality parameters measured routinely at nearby monitoring stations where available (Table S3). We found that the and HNO3 δ18O and Δ17O values correlate with RH, with pNO3 values showing stronger statistical links than HNO3 (Table 6). The N2O5 hydrolysis reaction (Reaction R8) rate increases with humidity (Kane et al., 2001), which may explain this positive correlation. Significant inverse relationships exist between temperature and , and HNO3Δ17O. These negative links likely arise since N2O5 is more stable under cold conditions, leading to a higher contribution of R8. The stronger links with may be due to Reaction (R8) taking place on surfaces (such as particles) with liquid water, which is likely to retain the HNO3 as rather than release it to the gas phase. Therefore, in winter, R8 may contribute more to than to HNO3(g). Moreover, the highest δ18O and Δ17O values for both and HNO3 were found for fall–winter samples collected at high RH (76 %) and low temperature (−10 ∘C). In contrast, the lowest isotopic values were found for samples with similar proportions of HNO3 and , and sampled during moderately humid (60–63 %) and warm (8–20 ∘C) periods. The accompanying shift in δ18O and Δ17O differences between pNO3 and HNO3 will help infer the mechanisms that dominate during the cold and warm periods (Sect. 4.2).
Concentrations of oxidants, co-contaminants (e.g., aerosols) and NOx influence the dominance and rates of the discussed reactions (Brown et al., 2006; Michalski et al., 2014). However, while temperature, RH and O3 are well captured within a 5 km radius, other pollutant measurements like continuous SO2, PM2.5 and NOx can have large gradients near sources; therefore it is not surprising that no correlations were found with SO2 or PM2.5 measured at sites 4–5 km away (Table 6). Surprisingly, only the and δ18O values correlated with the fraction of each sample collected during daylight hours (i.e., between the sunrise and sunset times on the day at the middle of each sampling period, either at Edmonton or Lethbridge), which was expected for HNO3 as well due to the daytime-only OH pathway. However, daylight hours do not take into account light intensity, which can significantly influence the oxidation rate through this pathway and consequently both the δ18O and Δ17O values.
3.5 Comparison with high-latitude
An interesting aspect of the Alberta cold-period Δ17O ranges is that they compare relatively well with the range obtained for the Canadian Arctic (Fig. 4), during winter, when night-time conditions and the N2O5 pathway prevail without interruption (Morin et al., 2008; for comparison with HNO3 values see Fig. S4). This observation supports the suggestion that the N2O5 pathway produces around 90 % of nitrates during mid-latitudinal cold months (Michalski et al., 2003; Sect. 4.1). The δ18O ranges of cold months are similar in Alberta and in the Arctic. This similarity goes against previous suggestions that at higher latitudes, nitrate δ18O annual means should be higher than at mid-latitudes due to local ambient conditions and atmospheric chemistry affecting the proportions of species involved in producing nitrate (Morin et al., 2009), namely, the sole influence of the N2O5 pathway during the Arctic winter (Fang et al., 2011).
The Δ17O departure between the Alberta and Arctic winter parallel lines is about 3 ‰. Such a difference is slightly larger than the one calculated for winter at 80 and 40∘ N latitudes (about 2 ‰; Morin et al., 2008). In contrast, the warm months and summer data sets for Alberta and the Arctic, respectively, show different isotopic ranges (Fig. 5), possibly due to the plume effects described later (Sect. 4.3). Moreover, contrary to a previous suggestion, the winter–summer difference in nitrate Δ17O values is similar at the mid- and high-latitudinal sites (about 6 ‰ here, and 5 ‰ in Morin et al., 2008). This similarity is likely coincidental as it may reflect the fact that within-plume chemistry may lower the Δ17O values of NOx in the sampled anthropogenic plumes in Alberta (see Sect. 4.3 for details), whereas the seasonal departure in Arctic samples comes from the oxidation to nitrate through the dominant OH and N2O5 pathways during summer and winter, respectively. Finally, the Δ17O averages for the Alberta summer and winter results approximately fit within ranges predicted for the studied area by global modelling (Alexander et al., 2009), suggesting that global modelling of nitrate distribution worldwide is promising.
3.6 Isotopic differences between HNO3 and
As far as the isotopic characteristics are concerned, an important feature to keep in mind is that the HNO3 of central and southern Alberta has distinct properties relative to simultaneously sampled . In practical terms, the relationships between the simultaneously sampled HNO3 and are of four types (Fig. 3): (i) HNO3 δ18O and Δ17O are both lower than ; (ii) HNO3 has lower Δ17O but higher δ18O values than ; (iii) HNO3 has higher δ18O values and similar Δ17O ones relative to ; and (iv) HNO3 has higher δ18O and Δ17O values than (Fig. 3).
The fall–winter isotopic results belong to group (i), fall results to groups (i), (ii) and (iii), and the spring and summer results to groups (ii), (iii) and (iv) (Fig. 3). Elliott et al. (2009) reported simultaneously sampled and HNO3 in the northeastern United States with similar seasonal changes of δ18O differences (no Δ17O measurement). The HNO3 δ18O values were generally similar or lower than the values during winter and fall, and slightly to much higher during spring and summer, with the spring and fall –HNO3 relationships being roughly intermediate between the winter and summer ones. The average δ18O difference of minus HNO3 reported between winter and summer (15 ‰) by Elliott et al. (2009) agrees with the difference for fall–winter and summer obtained here (12 ‰).
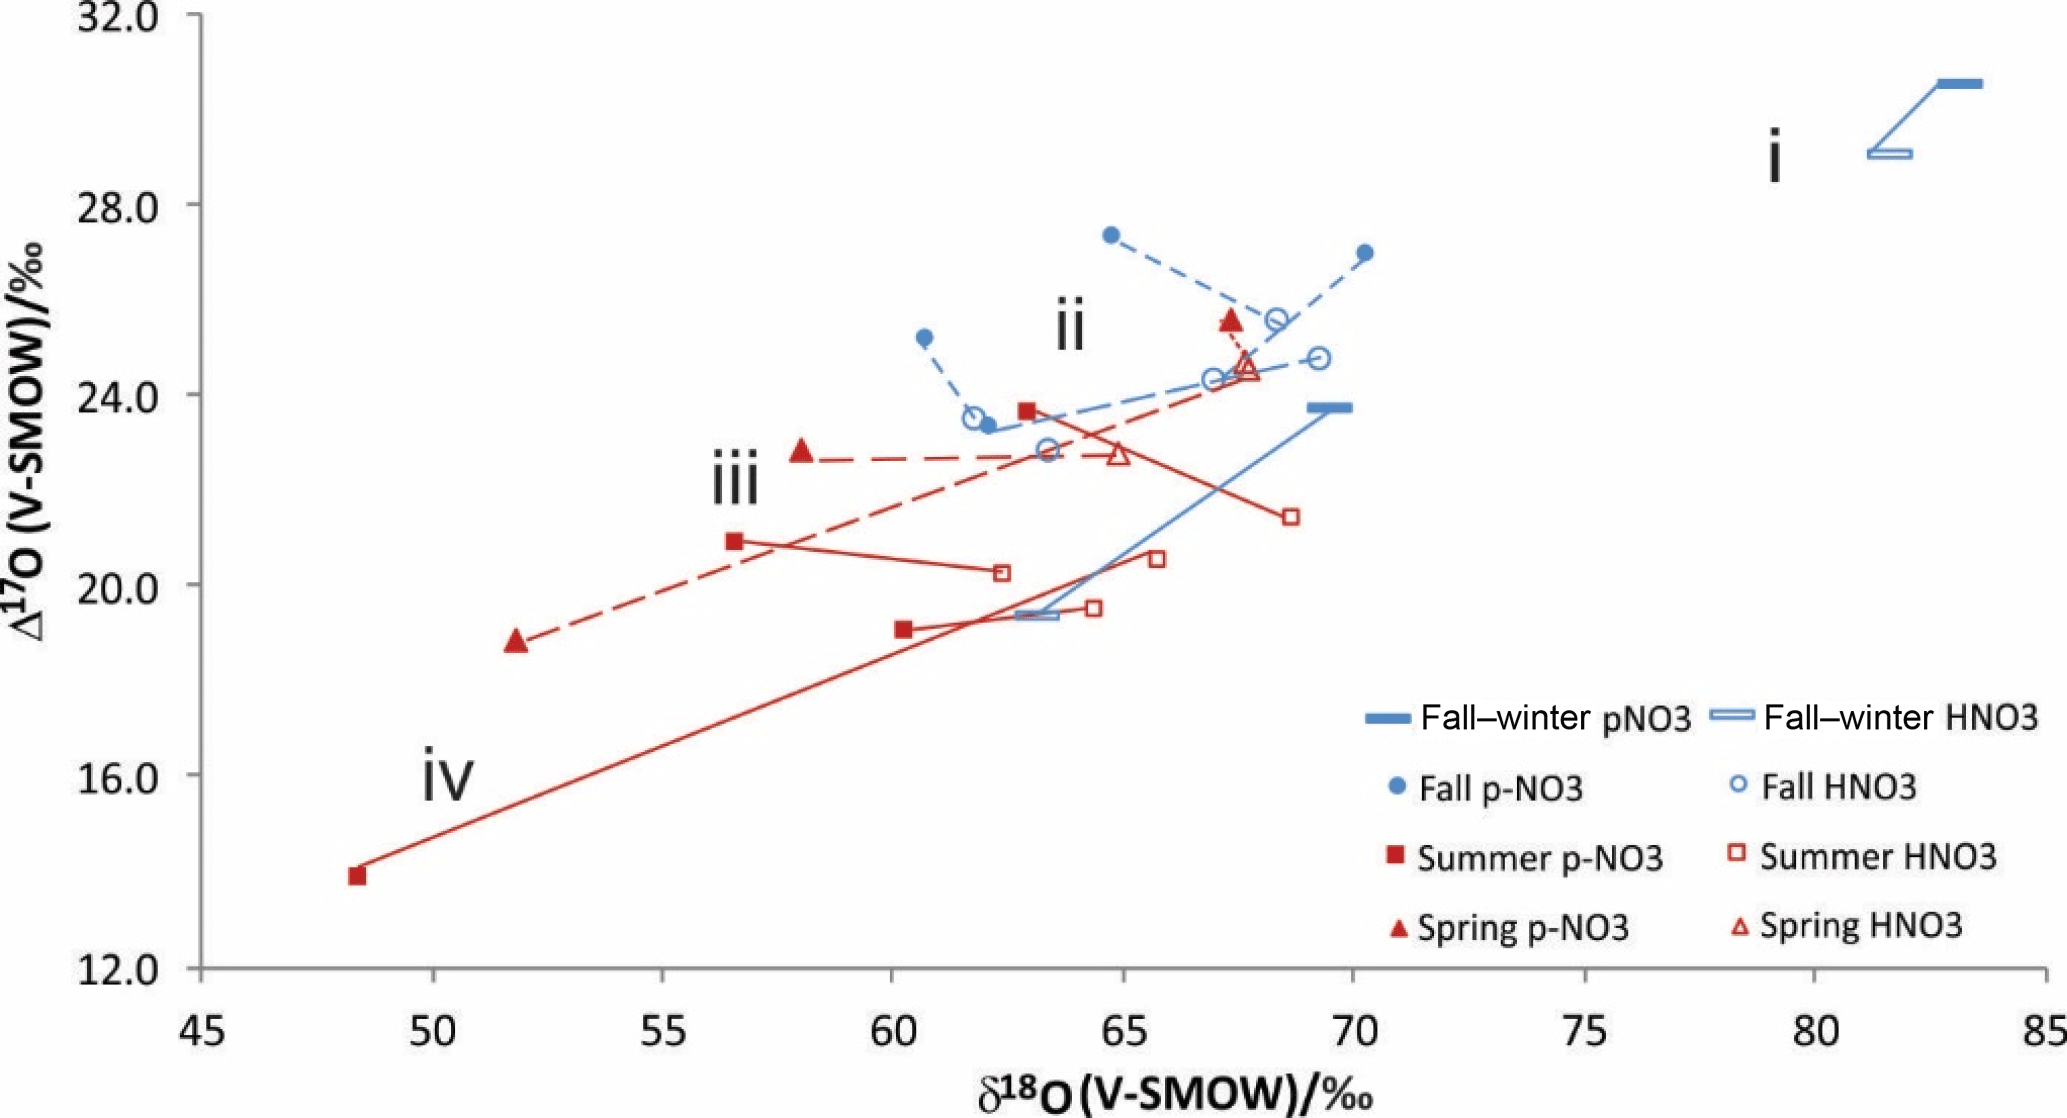
Figure 3Line-connected δ18O and Δ17O values for simultaneously collected HNO3 (empty symbols) and (solid symbols) from cold (blue) and warm (red) sampling periods.
The marked shifts in isotopic differences between the separately analyzed HNO3 and reported here likely reflect changes in the dominant reactions and processes leading to the production of the two nitrates (see Sect. 4.2). Analyzing them separately provides additional granularity that may be used to elucidate further details of the production and loss of nitrate species downwind from a NOx source.
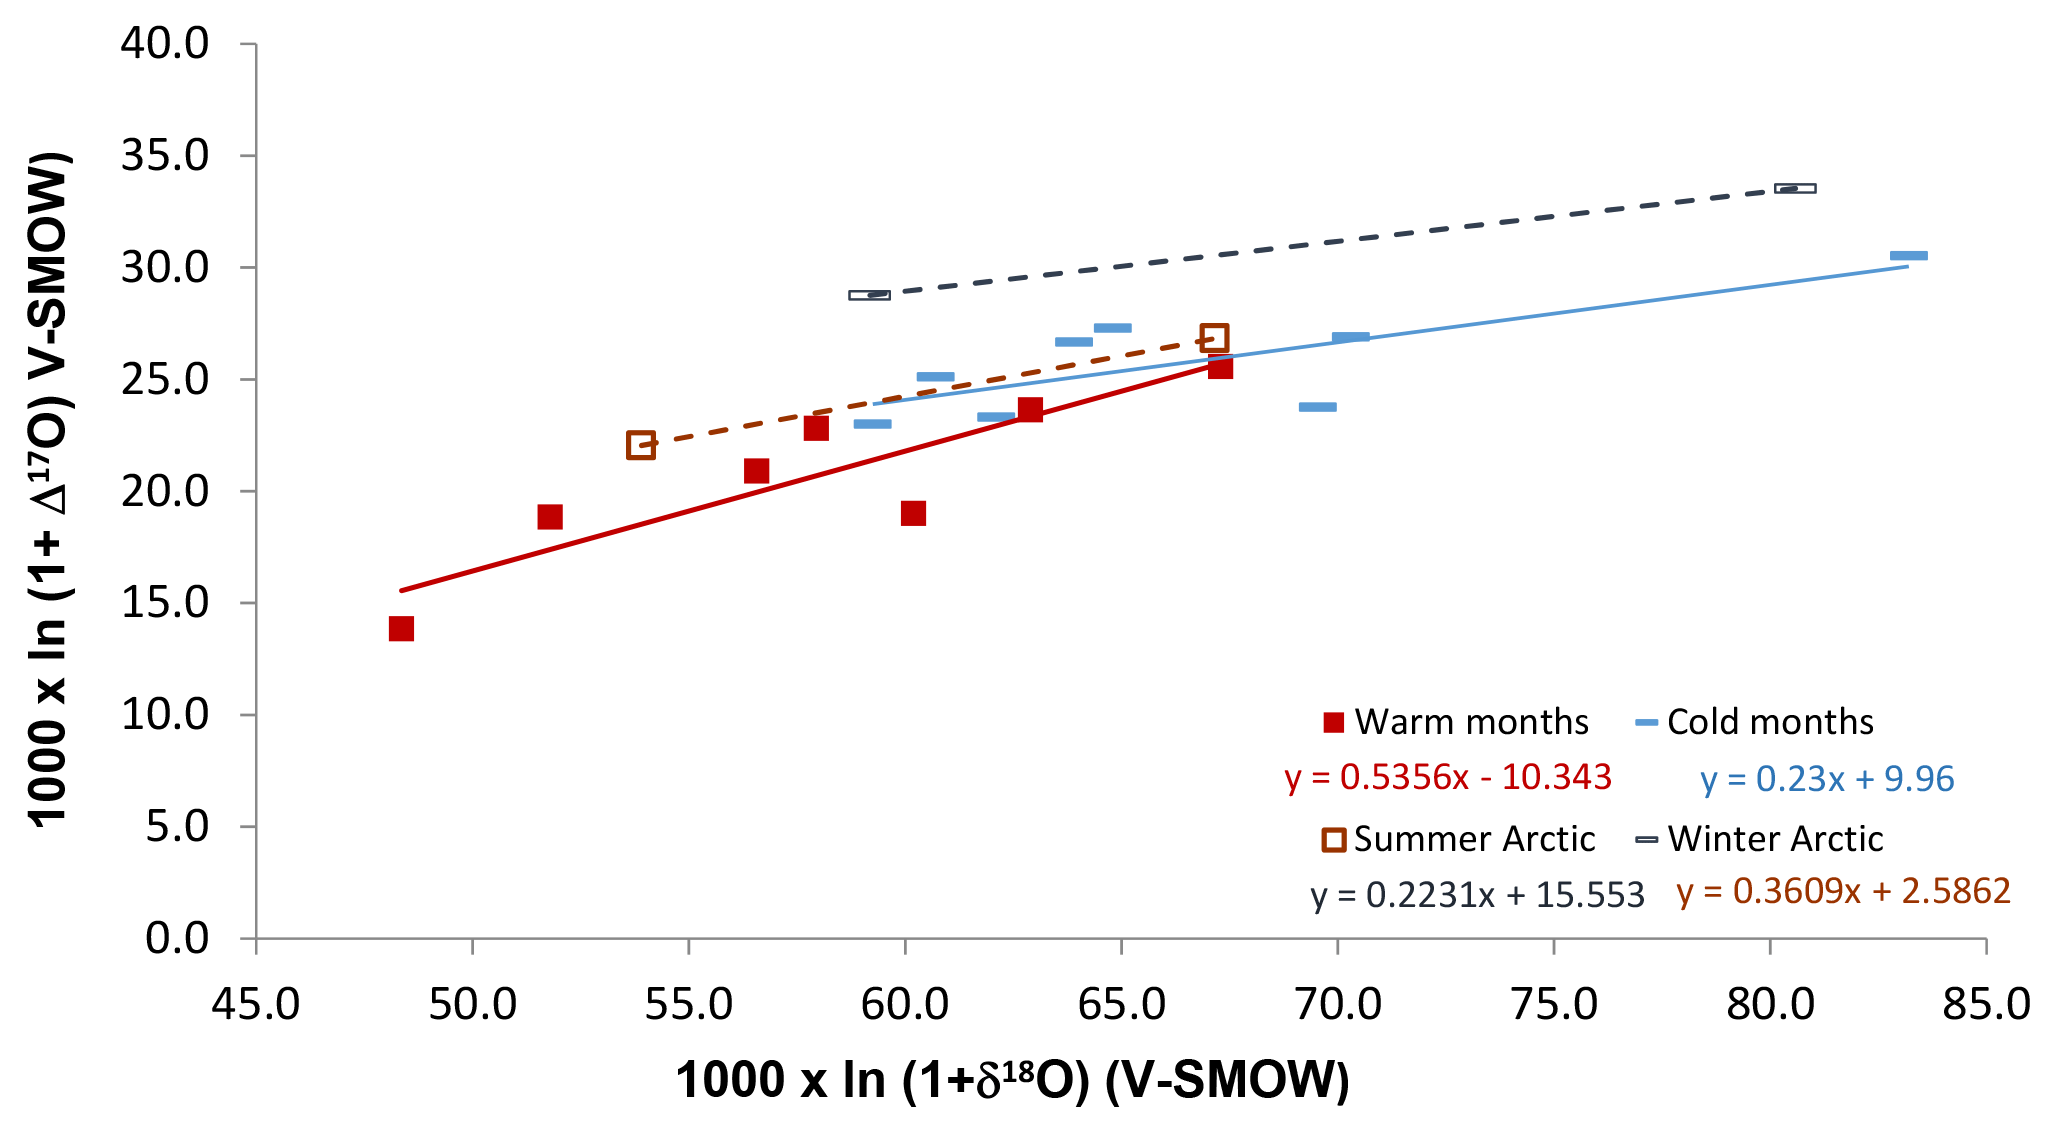
Figure 4Isotopic results for identified by sampling periods (solid lines), compared with summer and winter trends obtained for Arctic sites (dashed lines; derived from ln (1+ δ) in Morin et al., 2008).
4.1 Estimation of Δ17O values of NOx precursor to the studied nitrates – highlighting oxidation mechanisms
In the present subsection, we estimate the Δ17O values of NO2 involved during the production of the Alberta nitrates based on the observed nitrate values and discuss the implications of these estimations. Generally, winter to summer isotopic differences are thought to be due to the high oxygen isotopic values of N2O5 due to interaction with O3 (Johnston and Thiemens, 1997; Michalski et al., 2003; Morin et al., 2008; Vicars et al., 2012) and low values of OH in isotopic equilibrium with atmospheric H2O (Dubey et al., 1997). According to Table 5, the first reaction pathway produces nitrates via R4-R7-R8 with two-thirds of the O atoms coming from NO2, one-sixth from O3 and one-sixth from H2O, while the second produces nitrates via Reaction (R6) with two out of three O atoms coming from NO2 and one-third from OH (e.g., Michalski et al., 2003). Using these proportions with the Alberta Δ17O values of and HNO3 in weighted averages allows us to make a rough estimation of the maximum and minimum Δ17O values of NO2 oxidized to nitrates in the air masses sampled. The calculations assume the O from O3 contributes a signal of ∼39 ‰ as was recently measured (Vicars and Savarino, 2014) and that Δ17O of OH and H2O are zero. The estimated NO2 Δ17O values for fall–winter (34 ‰–45 ‰ daytime, 25 ‰–36 ‰ night-time) and for summer (25 ‰–34 ‰ for daytime; 15 ‰–24 ‰ for night-time) represent the extremes, assuming daytime oxidation takes place 100 % through the OH pathway and night-time oxidation takes place entirely through the N2O5 pathway. One should keep in mind that the Alberta results are for nitrates collected during multi-week sampling periods. Each nitrate sample therefore contains a mixture of O from the pathways operating during daytime (Reaction R6) and night-time (Reactions R4-R7-R8) a priori. Assuming a 50 % contribution from each pathway for summer, we generate values ranging from 20 ‰ to 29 ‰. Alternatively, assuming domination of the N2O5 pathway during winter (90 %; Michalski et al., 2014), the range is 26 ‰–37 ‰. Fall and spring values should fit between these summer and winter estimated ranges. The estimated NO2 Δ17O ranges indicate that the potential parent NO2 had a smaller 17O anomaly than O3 (39 ‰; Vicars and Savarino, 2014) or NO2 in isotopic equilibrium with O3 alone (45 ‰; Michalski et al., 2014) in all possible scenarios.
Two mechanisms could be responsible for the Δ17O differences between these estimates and NO2 in isotopic equilibrium with O3. One is the competition of Reaction (R3) with Reaction (R2) in oxidizing NO to NO2, since RO2 will decrease the Δ17O values relative to an ozone-only equilibrium. The relative reaction rates of Reactions (R2) and (R3) have previously been presumed to control the NO2 isotopic composition (e.g., Alexander et al., 2009) based on the assumption of isotopic steady state. A larger contribution of RO2 is expected in the NO2 precursors for summer relative to winter, since biogenic VOCs that are major sources of RO2 radicals are much higher in the summer (e.g., Fuentes and Wang, 1999). This suggestion is consistent with the lower Δ17O ranges in summer reported here. A second possibility is that the nitrates were formed from some NOx that did not reach an isotopic steady state with O3, retaining some of its original signature (assumed to be Δ17O=0 ‰). Most studies have assumed that an isotopic steady state is established between O3 and NO2 within a few minutes after emission of NOx from a combustion source – or at least, that nitrate formation is negligible before NOx isotopic equilibrium is reached. However, recent modelling by Michalski et al. (2014) suggests that isotopic equilibration of NOx with O3 could take from several minutes up to a few hours at the relatively low O3 concentrations in rural Alberta. At the measured average wind speeds on site of 8–19 km h−1, transit times from the nearest sources to observation sites are estimated to be 9–55 min. While the fraction of NOx converted to nitrate in this transit time may be small, these are large sources of NOx in an area with very low background nitrates. For example, a plume containing 10 nmol mol−1 of NO2 mixing with background air with 0.1 pmol mol−1 of OH (Howell et al., 2014) would produce HNO3 via Reaction (R6) at a rate of 0.011 µg m−3 min−1 of –N at T=7 ∘C (Burkholder et al., 2015), or an equivalent amount of a typical nitrate sample in 10 min (Table S1). Even if equilibration with O3 is established within a few minutes, the nitrate produced in the interim can constitute a substantial fraction of the sample collected nearby. Therefore, the nitrates measured at our sites may partly derive from NOx that had not yet reached an isotopic steady state with O3. These two mechanisms are not exclusive and could both contribute to lower NOx, and therefore nitrate, Δ17O values.
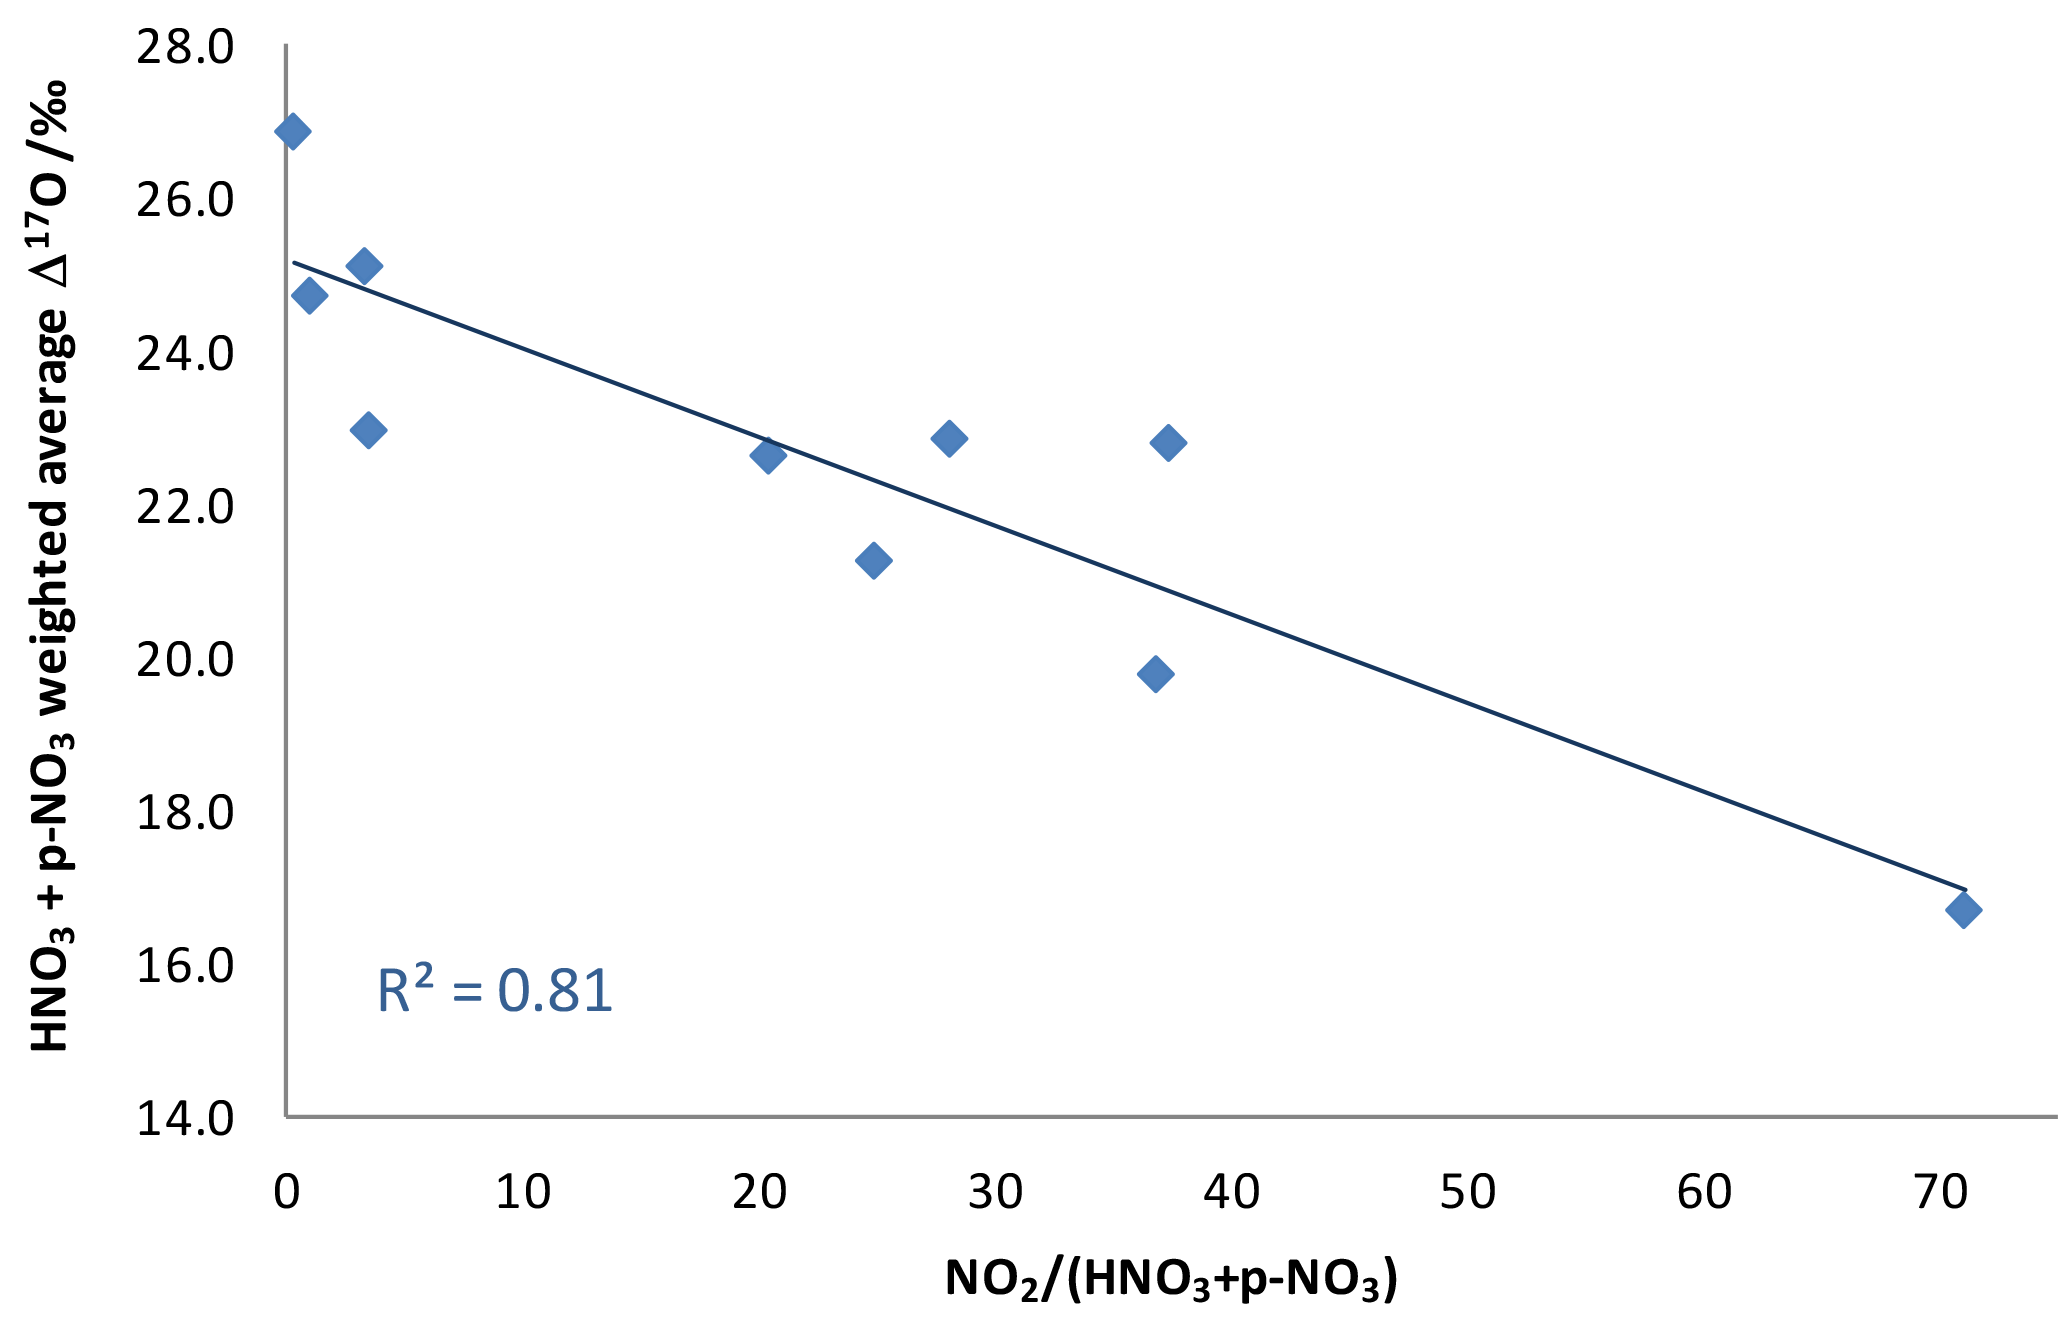
Figure 5Weighted Δ17O average for the sum of dry nitrates as a function of NO2 concentration divided by pNO3 plus HNO3 concentrations, a ratio indicative of the maturity of a plume.
An additional piece of evidence suggests that the NOx plumes themselves, rather than ambient conditions, are the source of low-Δ17O nitrates in these samples. There is a strong correlation between the total nitrate Δ17O values and the maturity of the plume as expressed by the NO2 concentration divided by the sum of HNO3 and concentrations (Fig. 5). This observation is consistent with the unequilibrated NO2 hypothesis. However, it does not rule out the possible contribution of RO2, since VOC releases from the NOx sources could lead to elevated RO2 concentrations in the plume.
4.2 Causes of shifts in HNO3 to isotopic differences
A challenging question is as follows: why do the HNO3 to isotopic differences shift seasonally (Fig. 3)? One factor that may influence the relationship between HNO3 and is the mass-dependent isotopic equilibrium between NH4NO3 and HNO3 (Reaction R10); however, this mechanism would result in higher δ18O in and unchanged Δ17O values and, therefore, cannot be solely responsible for any of the observed patterns (Fig. 3). Alternately, the trend for cold months (trend i) could be due to the fact that the heterogeneous N2O5 pathway is likely to produce more than HNO3(g), which would result in a higher contribution from ozone and explain why δ18O and Δ17O values are both higher in . A previous study addressing why on coarse particles is more enriched than on fine particles invoked a similar explanation (Patris et al., 2007).
For some of the spring and summer samples, both δ18O and Δ17O values were lower in than in HNO3 (trend iv). Therefore the mechanism above cannot dominate the fractionation; nor can a mass-dependent process be responsible. We suggest a different fractionation process because HNO3 dry-deposits to surfaces more rapidly than (Zhang et al., 2009; Benedict et al., 2013), which would create the discussed isotopic shifts in the situation where NO2 has low Δ17O values in a fresh plume. The first nitrates formed in the plume shortly after emission from the NOx source have low δ18O and Δ17O values, either because NOx has not yet reached an isotopic steady state with O3 or because it reacted with 17O-poor RO2 present in the plume due to VOC emissions. Those nitrates that form as or that partition to remain in the plume for longer than HNO3, which is removed from the plume rapidly upon contact with vegetation or other surfaces. As the plume travels, the NOx becomes more enriched, and the newly formed nitrates take on higher δ18O and Δ17O values. However, collected further downwind will derive from a mixture of low-δ18O and -Δ17O formed earlier, plus high-δ18O and -Δ17O formed more recently, while HNO3 will have a larger proportion formed more recently and will therefore have higher δ18O and Δ17O values. The fact that we find the lowest isotopic values in summer samples collected from various anthropogenic sources at distances less than 16 km supports this suggestion (Table 1).
The above two mechanisms that we propose to explain the shifts in HNO3 to pNO3 isotopic differences between cold and warm sampling periods – a differential N2O5 contribution resulting in higher Δ17O values in than in HNO3, and a differential deposition resulting in lower Δ17O values in pNO3 – would essentially compete against each other, with local conditions and chemistry influencing the results. In winter, when the N2O5 pathway is most important, the first mechanism dominates, as supported by the observation that concentrations are higher during that season (trend i). Conversely, in summer, when the N2O5 pathway is less important and dry deposition is likely faster due to absence of snow cover, higher surface wetness and high leaf areas, the second mechanism is more important (trend iv). The local reactant concentrations, wind speeds and radiative fluxes (which control the time to reach an isotopic equilibrium) would also be factors in the second mechanism. We find intermediate trends (ii, iii) in the transitional seasons, as expected. In addition to these non-mass-dependent fractionation processes, mass-dependent fractionation in formation and loss of nitrate likely contributes to the observed δ18O differences. For instance, kinetic fractionation may be involved in the production of trend iii.
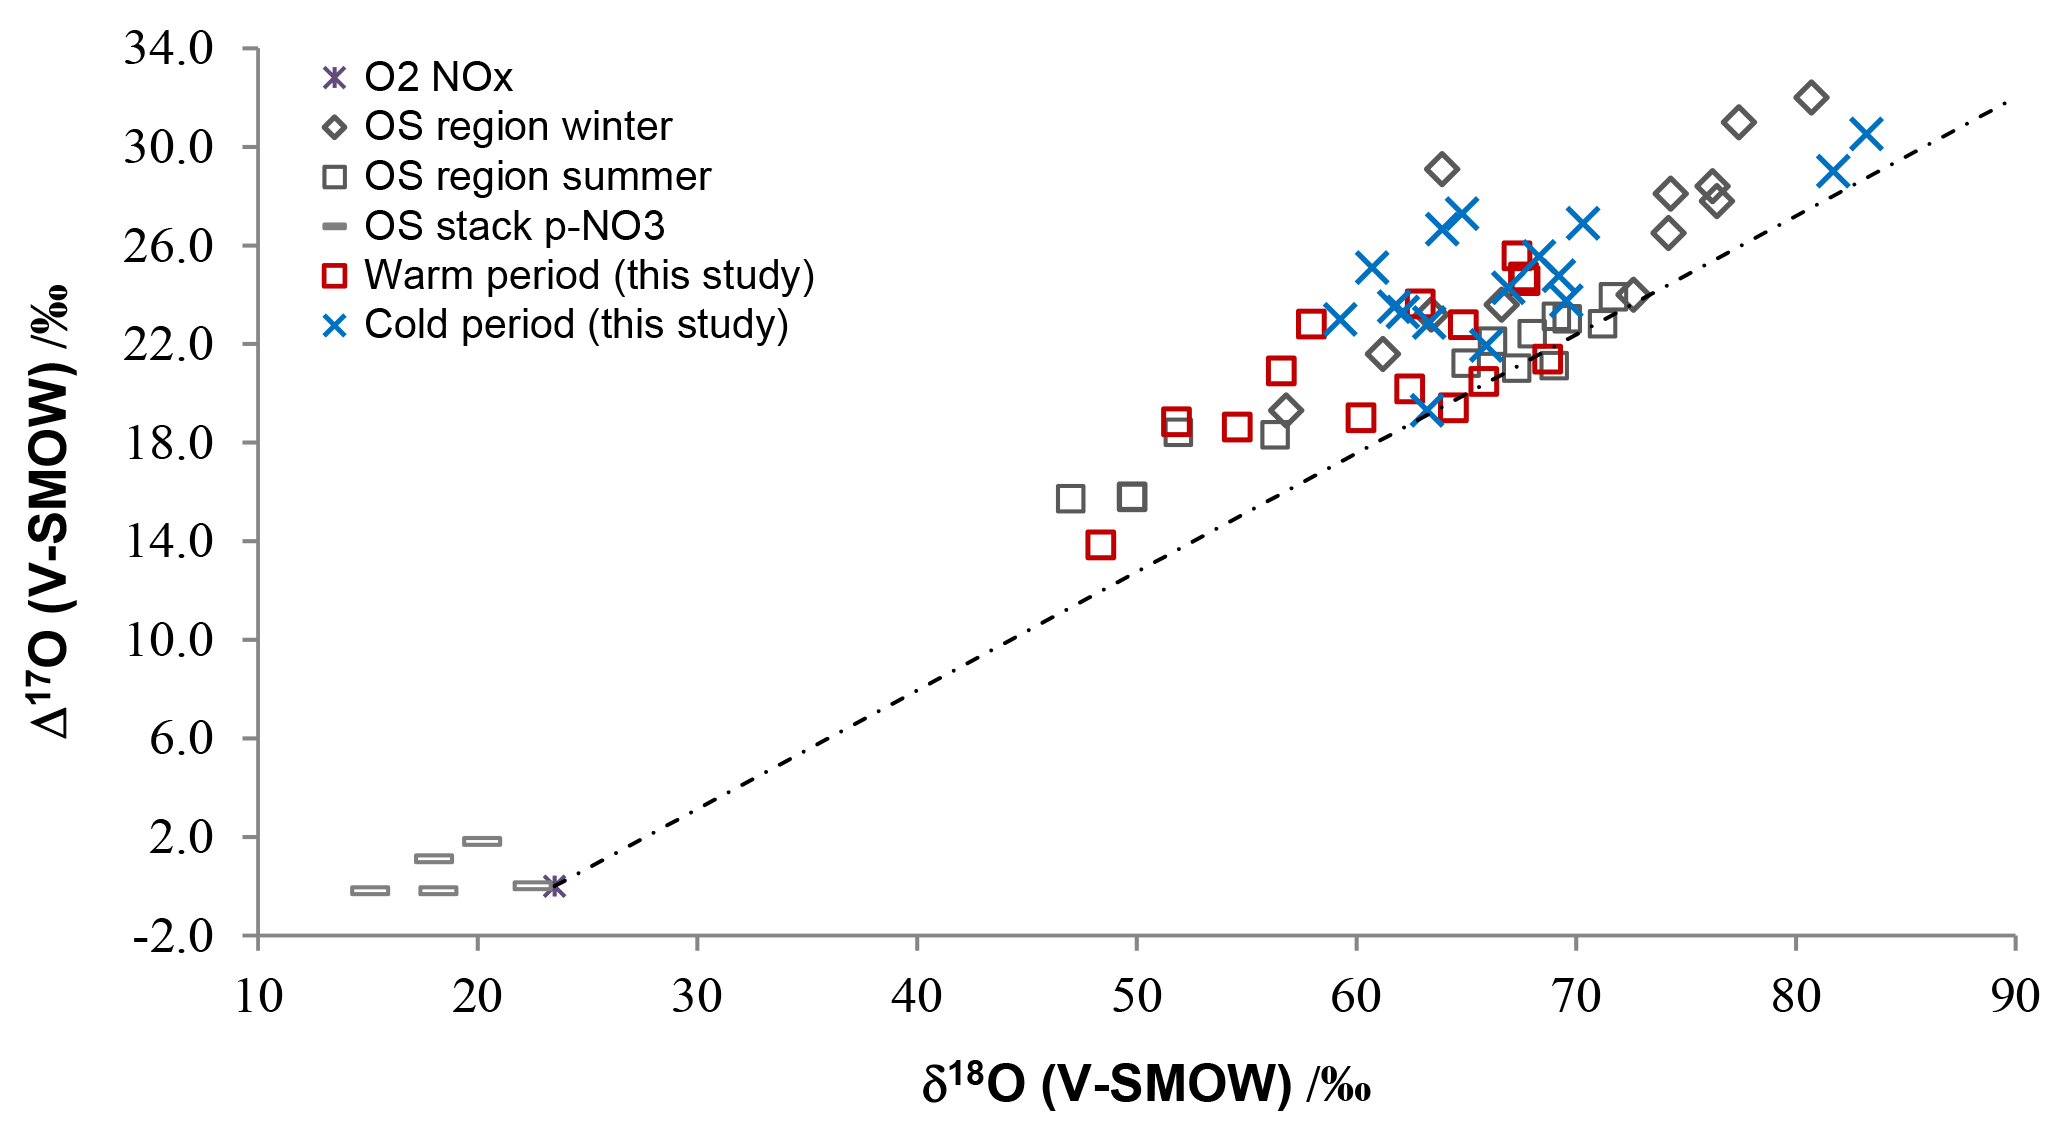
Figure 6Isotopic ratios for atmospheric , and HNO3 samples in cold and warm periods from central and southern Alberta (this study), compared with previously published winter and summer bulk and throughfall deposition samples from the oil sands (OS) region from northern Alberta (Proemse et al., 2013), and in-stack emissions data for an OS upgrader located in the same region (Proemse et al., 2012). The grey dotted line connects NOx from theoretical combustion with O2 isotopic composition and at isotopic equilibrium with tropospheric O3 (Michalski et al., 2014).
In summary, examining the isotopic relationship of HNO3 to (Fig. 3) reveals the complexity of anthropogenic NOx oxidation mechanisms. The lower isotopic values relative to the HNO3 values during warm months may reflect differential removal rates from plumes containing NO2 temporarily low in 17O.
4.3 Low δ18O and Δ17O trends in global w- and – implications for polluted air masses
Atmospheric nitrates measured in central and southern Alberta were sampled downwind of well-identified anthropogenic sources to verify the potential role of emitted NOx isotopic signals through to final nitrate isotopic ratios (primarily N isotopes; see Savard et al., 2017). As expected, the measured oxygen isotopes of the various nitrate groups are consistent with exchange with O3 and oxidation through the well-known OH and N2O5 oxidation paths. However, NO2 not in isotopic equilibrium with O3, and/or NO reacted with RO2, may have significantly influenced the overall results. Co-contaminants in the emissions and sampling plumes at short distances from the sources may have favoured these two mechanisms, and quantifying RO2 and/or HO2 would help distinguish between the two mechanisms. Meanwhile, our results raise the following question: are these overall effects observable in triple oxygen isotopes of nitrates from other polluted sites?
The full Δ17O and δ18O ranges for , and HNO3 (between 13.8 ‰ and 20.5 ‰ and 48.4 ‰ and 83.2 ‰; Table 4) compare well with the isotopic ranges obtained for bulk deposition samples collected downwind from oil sands mining operations in the lower Athabasca region farther north in Alberta (Proemse et al., 2013). Moreover, the isotopic values in cold and warm months delineated here essentially overlap with the data sets of winter and summer from the lower Athabasca region (Fig. 6). This correspondence exists despite the slightly different climatic conditions (Fig. S1) and very different sampling methods (bulk/throughfall deposition samples using open ion exchange resin collectors vs. wind-sector-specific active sampling on filters and precipitation-only collectors). Notably, many points carry relatively low δ18O and Δ17O values.
Previous work in the Athabasca region reported very low δ18O and near-zero Δ17O values for sampled directly within oil sands industrial stacks, i.e., in the emissions measured in-stack and diluted with ambient air (Proemse et al., 2012). These values are very close to those of O2. Similar isotopic signatures are very likely produced in source emissions of NOx in the studied Edmonton and Vauxhall areas (e.g., CFPPs, gas compressors, industries). This source signature may persist into pNO3 collected close to the sources. Within the first few hours in the atmosphere (less, in polluted areas), the NOx δ18O and Δ17O values rapidly increase due to isotope exchange with O3 (Reactions R2, R3, R5 and O3 formation, Table 5; Michalski et al., 2014) and reach isotopic equilibrium. Though the e-folding lifetime for NOx oxidation to nitrates may be longer than these few hours, depending on the NOx∕VOC ratio, only a fraction of the oxidized source NOx will create a measurable contribution to the ambient nitrate where the background air is very low in nitrate. This is likely the case in the oil sands region, where Proemse et al. (2013) reported the lowest Δ17O values within 12 km of the emission sites, and where direct stack emissions of were ∼5000 times lower than NOx emissions (Wang et al., 2012).
In a methodological test study, we obtained low values for sampled near a high traffic volume highway in Ontario, Canada (Smirnoff et al., 2012). Low δ18O and Δ17O values in atmospheric nitrates during warm months (65 and 20 ‰ or less, respectively) have been reported for other parts of the world as well (Table 4). Authors of these studies have invoked peroxy radicals to account for low δ18O values in from a polluted city (Fang et al., 2011), in from Taiwan collected partly from air masses influenced by pollutants (Guha et al., 2017) and from a polluted coastal site in California (Michalski et al., 2004; Patris et al., 2007; Table 4). However, sampling in these three other regions did not use collection restricted to air masses transported from targeted anthropogenic sources. So uncertainties persist regarding the ultimate sources of nitrates with low isotopic values.
Although a few low values are also reported for seemingly non-polluted areas of the Arctic and Antarctic regions (unknown cause; Morin et al., 2008, 2009) and of coastal California (Patris et al., 2007), the information from the literature integrated with the interpretation proposed for the Alberta low δ18O and Δ17O values in summer nitrates may reflect the involvement of air masses that include nitrates from oxidation of NO2 with light isotopes in plumes. In such cases, while not ruling out a higher contribution from RO2 oxidation of NO, it is also possible that significant portions of the collected nitrate were formed before the NOx–O3 isotopic equilibrium was reached (see Sect. 4.1). Keeping in mind that other hydrocarbon and halogen pathways may play a role in determining the isotopic nitrate characteristics in other parts of the world, we propose that, in general, the warm periods' isotopic ranges appear to be lower in polluted areas. Given these points, our nitrate δ18O and Δ17O may reflect relative proximity to anthropogenic N emitters in general. Further research work on plume NOx to nitrates chemical mechanisms may help to validate this suggestion. In the future, the assumption of an NOx isotopic steady state with O3 should be explored, given recent findings (Michalski et al., 2014), the critical importance of NOx isotope characteristics on resulting nitrate isotopic values (Alexander et al., 2009) and the suggestion regarding the evolution of NOx– signals in fresh anthropogenic plumes (present study).
The HNO3, wNO3 and pNO3 from anthropogenic sources in central and southern Alberta, simultaneously collected with wind-sector-based conditional sampling systems, produced δ18O and Δ17O trends confirming the previous contention that regional ambient conditions (e.g., light intensity, oxidant concentrations, RH, temperature) dictate the triple isotopic characteristics and oxidation pathways of nitrates.
The gaseous form of nitrate (HNO3), having distinct isotopic characteristics relative to the wet and particulate forms, implies that understanding nitrate formation and loss requires the nitrate species to be characterized individually. Particulate in these samples generally shows higher δ18O and Δ17O values than HNO3 in the fall–winter period as the heterogeneous N2O5 pathway favours the production of . In contrast, HNO3 has higher δ18O and Δ17O values during warm periods, which we propose is due to faster dry deposition rates relative to in the event that low-Δ17O NO2 is oxidized in the plume. The mechanisms conferring nitrate with relatively low isotopic values, whether oxidation before the NOx–O3 equilibrium is reached or higher contributions from RO2, are likely to be observed in anthropogenic polluted air masses. An interesting deduction arising from this interpretation and from a comparison with nitrate isotopes from other polluted areas of the world is that relatively low δ18O and Δ17O values may reflect nitrates produced from undifferentiated anthropogenic NOx emissions.
Future research should explore the assumption of NOx isotopic equilibration with O3, given the critical importance of NOx isotopes on resulting nitrate isotopic values. More field sampling, including additional on-site oxidant data, and state-of-the-art isotopic analyses of all tropospheric nitrate species as well as NOx are required for refining our understanding of atmospheric nitrate worldwide. This endeavour is fundamental for developing effective emission reduction strategies towards improving future air quality.
All data interpreted and discussed in the article are presented in the Supplement (Tables S1, S2 and S3).
The supplement related to this article is available online at: https://doi.org/10.5194/acp-18-10373-2018-supplement.
MMS contributed scientific leadership and expertise in isotope geochemistry, integrated and interpreted all data, and wrote most of the article. ASC contributed expertise in atmospheric chemistry and isotope geochemistry, participated in all aspects of the interpretation, and greatly helped in the writing of the article. RV was responsible for designing and supervising the air sampling missions. AS was responsible for conducting the air sample preparation and their isotopic analyses and insuring the QA and QC of the produced results.
The authors declare that they have no conflict of interest.
The authors are grateful for the technical support provided by
Marie-Christine Simard and Jade Bergeron of the Geological Survey of Canada
and by Syed Iqbal, Rachel Mintz, Daniel McLennan, Matthew Parsons, Mike Shaw
and Amy Hou of Environment and Climate Change Canada, and for the constructive
pre-submission review by Geneviève Bordeleau from the Geological
Survey of Canada and Felix Vogel and Jason O'Brien from ECCC. This research
has been financially supported by the Clean Air Regulatory Agenda of
Environment and Climate Change Canada and the Environmental Geoscience
program of Natural Resources Canada (NRCan contribution number: 20170310).
The first author dedicates this research article to Pauline Durand for her
support.
Edited by: Jan Kaiser
Reviewed by: three anonymous referees
Alexander, B., Hastings, M. G., Allman, D. J., Dachs, J., Thornton, J. A., and Kunasek, S. A.: Quantifying atmospheric nitrate formation pathways based on a global model of the oxygen isotopic composition (Δ17O) of atmospheric nitrate, Atmos. Chem. Phys., 9, 5043–5056, https://doi.org/10.5194/acp-9-5043-2009, 2009.
Anlauf, K. G., Fellin, P., Wiebe, H. A., Schiff, H. I., Mackay, G. I., Braman, R. S., and Gilbert, R.: A comparison of three methods for measurement of atmospheric nitric acid and aerosol nitrate and ammonium, Atmos. Environ., 19, 325–333, https://doi.org/10.1016/0004-6981(85)90100-3, 1985.
Anlauf, K. G., Wiebe, H. A., and Fellin, P.: Characterization of Several Integrative Sampling Methods for Nitric Acid, Sulphur Dioxide and Atmospheric Particles, JAPCA J. Air Waste Ma., 36, 715–723, https://doi.org/10.1080/00022470.1986.10466107, 1986.
Appel, B. R., Tokiwa, Y., and Haik, M.: Sampling of nitrates in ambient air, Atmos. Environ., 15, 283–289, https://doi.org/10.1016/0004-6981(81)90029-9, 1981.
Benedict, K. B., Carrico, C. M., Kreidenweis, S. M., Schichtel, B., Malm, W. C., and Collett Jr., J. L.: A seasonal nitrogen deposition budget for Rocky Mountain National Park, Ecol. Appl., 23, 1156–1169, https://doi.org/10.1890/12-1624.1, 2013.
Brown, S. S., Ryerson, T. B., Wollny, A. G., Brock, C. A., Peltier, R., Sullivan, A. P., Weber, R. J., Dubé, W. P., Trainer, M., Meagher, J. F., Fehsenfeld, F. C., and Ravishankara, A. R.: Variability in nocturnal nitrogen oxide processing and its role in regional air quality, Science, 311, 67–70, https://doi.org/10.1126/science.1120120, 2006.
Burkholder, J. B., Sander, S. P., Abbatt, J., Barker, J. R., Huie, R. E., Kolb, C. E., Kurylo, M. J., Orkin, V. L., Wilmouth, D. M., and Wine, P. H.: Chemical Kinetics and Photochemical Data for Use in Atmospheric Studies, Evaluation No. 18, Jet Propulsion Laboratory, Pasadena, CA, USA, JPL Publication 15-10, 2015.
Cheng, I. and Zhang, L.: Long-term air concentrations, wet deposition, and scavenging ratios of inorganic ions, HNO3, and SO2 and assessment of aerosol and precipitation acidity at Canadian rural locations, Atmos. Chem. Phys., 17, 4711–4730, https://doi.org/10.5194/acp-17-4711-2017, 2017.
Coplen, T. B., Böhlke, J. K., and Casciotti, K.: Using dual-bacterial denitrification to improve d15N determinations of nitrates containing mass-independent 17O, Rapid Commun. Mass Sp., 18, 245–250, 2004.
Dahal, B. and Hastings, M. G.: Technical considerations for the use of passive samplers to quantify the isotopic composition of NOx and NO2 using the denitrifier method, Atmos. Environ., 143, 60–66, 2016.
Dubey, M. K., Mohrschladt, R., Donahue, N. M., and Anderson, J. G.: Isotope specific kinetics of hydroxyl radical (OH) with water (H2O): Testing models of reactivity and atmospheric fractionation, J. Phys. Chem. A, 101, 1494–1500, 1997.
Elliott, E. M., Kendall, C., Boyer, E. W., Burns, D. A., Lear, G. G., Golden, H. E., Harlin, K., Bytnerowicz, A., Butler, T. J., and Glatz, R.: Dual nitrate isotopes in dry deposition: Utility for partitioning NOx source contributions to landscape nitrogen deposition, J. Geophys. Res.-Biogeo., 114, G04020, https://doi.org/10.1029/2008JG000889, 2009.
Environment and Climate Change Canada: Air Pollutant Emission Inventory Online Data Query, available at: http://www.ec.gc.ca/inrp-npri/donnees-data/ap/index.cfm?lang=En, last access: 15 December 2016.
Environment and Climate Change Canada: Canadian Air and Precipitation Monitoring Network (CAPMoN), available at: http://donnees.ec.gc.ca/data/air/monitor/monitoring-of-atmospheric-precipitation-chemistry/major-ions/, last access: 17 May 2018a.
Environment and Climate Change Canada: National Pollutant Release Inventory, available at: https://www.canada.ca/en/environment-climate-change/services/national-pollutant-release-inventory/tools-resources-data.html, last access: 22 May 2018b.
Erisman, J. W. and Fowler, D.: Oxidized and reduced nitrogen in the atmosphere, Knowledge for Sustainable Development, An Insight into the Encyclopedia of Life Support Systems, Volumes I, II, III, UNESCO Publishing-Eolss Publishers, Oxford, UK, 2003.
Fang, Y. T., Koba, K., Wang, X. M., Wen, D. Z., Li, J., Takebayashi, Y., Liu, X. Y., and Yoh, M.: Anthropogenic imprints on nitrogen and oxygen isotopic composition of precipitation nitrate in a nitrogen-polluted city in southern China, Atmos. Chem. Phys., 11, 1313–1325, https://doi.org/10.5194/acp-11-1313-2011, 2011.
Fuentes, J. D. and Wang, D.: On the seasonality of isoprene emissions from a mixed temperate forest, Ecol. Appl., 9, 1118–1131, https://doi.org/10.1890/1051-0761(1999)009[1118:OTSOIE]2.0.CO;2, 1999.
Guha, T., Lin, C. T., Bhattacharya, S. K., Mahajan, A. S., Ou-Yang, C. F., Lan, Y. P., Hsu, S. C., and Liang, M. C.: Isotopic ratios of nitrate in aerosol samples from Mt. Lulin, a high-altitude station in Central Taiwan, Atmos. Environ., 154, 53–69, https://doi.org/10.1016/j.atmosenv.2017.01.036, 2017.
Hastings, M. G., Sigman, D. M., and Lipschultz, F.: Isotopic evidence for source changes of nitrate in rain at Bermuda, J. Geophys. Res.-Atmos., 108, ACH 22-21–ACH 22-12, 2003.
Howell, S. G., Clarke, A. D., Freitag, S., McNaughton, C. S., Kapustin, V., Brekovskikh, V., Jimenez, J.-L., and Cubison, M. J.: An airborne assessment of atmospheric particulate emissions from the processing of Athabasca oil sands, Atmos. Chem. Phys., 14, 5073–5087, https://doi.org/10.5194/acp-14-5073-2014, 2014.
IPCC: Fifth Assessment Report (AR5), available at: https://www.ipcc.ch/report/ar5/ (last access: 11 September 2017), 2013.
Johnston, J. C. and Thiemens, M. H.: The isotopic composition of tropospheric ozone in three environments, J. Geophys. Res.-Atmos., 102, 25395–25404, 1997.
Kaiser, J., Hastings, M. G., Houlton, B. Z., Röckmann, T., and Sigman, D. M.: Triple oxygen isotope analysis of nitrate using the denitrifier method and thermal decomposition of N2O, Anal. Chem., 79, 599–607, https://doi.org/10.1021/ac061022s, 2007.
Kane, S. M., Caloz, F., and Leu, M. T.: Heterogeneous uptake of gaseous N2O5 by (NH4)2SO4, NH4HSO4, and H2SO4 aerosols, J. Phys. Chem. A, 105, 6465–6470, https://doi.org/10.1021/jp010490x, 2001.
Keck, L. and Wittmaack, K.: Effect of filter type and temperature on volatilisation losses from ammonium salts in aerosol matter, Atmos. Environ., 39, 4093–4100, https://doi.org/10.1016/j.atmosenv.2005.03.029, 2005.
Kendall, C., Elliott, E. M., and Wankel, S. D.: Tracing Anthropogenic Inputs of Nitrogen to Ecosystems, in: Stable Isotopes in Ecology and Environmental Science, Blackwell Publishing, Mailden, MA, USA, 2nd edn., 375–449, 2007.
Lavoie, G. A., Heywood, J. B., and Keck, J. C.: Experimental And Theoretical Study Of Nitric Oxide Formation In Internal Combustion Engines, M.I.T.-Dept. Mech. Eng.-Fluid Mechanics Laboratory Publ., 69–10, 1969.
Liang, M. C. and Yung, Y. L.: Sources of the oxygen isotopic anomaly in atmospheric N2O, J. Geophys. Res.-Atmos., 112, D13307, https://doi.org/10.1029/2006JD007876, 2007.
McIlvin, M. R. and Altabet, M. A.: Chemical conversion of nitrate and nitrite to nitrous oxide for nitrogen and oxygen isotopic analysis in freshwater and seawater, Anal. Chem., 77, 5589–5595, 2005.
Michalski, G., Scott, Z., Kabiling, M., and Thiemens, M. H.: First measurements and modeling of Δ17O in atmospheric nitrate, Geophys. Res. Lett., 30, 14–11, 2003.
Michalski, G., Meixner, T., Fenn, M., Hernandez, L., Sirulnik, A., Allen, E., and Thiemens, M.: Tracing Atmospheric Nitrate Deposition in a Complex Semiarid Ecosystem Using Δ17O, Environ. Sci. Tech., 38, 2175–2181, https://doi.org/10.1021/es034980+, 2004.
Michalski, G., Bhattacharya, S. K., and Girsch, G.: NOx cycle and the tropospheric ozone isotope anomaly: an experimental investigation, Atmos. Chem. Phys., 14, 4935–4953, https://doi.org/10.5194/acp-14-4935-2014, 2014.
Morin, S., Savarino, J., Bekki, S., Gong, S., and Bottenheim, J. W.: Signature of Arctic surface ozone depletion events in the isotope anomaly (Δ17O) of atmospheric nitrate, Atmos. Chem. Phys., 7, 1451–1469, https://doi.org/10.5194/acp-7-1451-2007, 2007.
Morin, S., Savarino, J., Frey, M. M., Yan, N., Bekki, S., Bottenheim, J. W., and Martins, J. M. F.: Tracing the origin and fate of NOx in the arctic atmosphere using stable isotopes in nitrate, Science, 322, 730–732, https://doi.org/10.1126/science.1161910, 2008.
Morin, S., Savarino, J., Frey, M. M., Domine, F., Jacobi, H. W., Kaleschke, L., and Martins, J. M. F.: Comprehensive isotopic composition of atmospheric nitrate in the Atlantic Ocean boundary layer from 65∘ S to 79∘ N, J. Geophys. Res.-Atmos., 114, https://doi.org/10.1029/2008JD010696, D05303, 2009.
Morino, Y., Kondo, Y., Takegawa, N., Miyazaki, Y., Kita, K., Komazaki, Y., Fukuda, M., Miyakawa, T., Moteki, N., and Worsnop, D. R.: Partitioning of HNO3 and particulate nitrate over Tokyo: Effect of vertical mixing, J. Geophys. Res.-Atmos., 111, D15215, https://doi.org/10.1029/2005JD006887, 2006.
Patris, N., Cliff, S. S., Quinn, P. K., Kasem, M., and Thiemens, M. H.: Isotopic analysis of aerosol sulfate and nitrate during ITCT-2k2: Determination of different formation pathways as a function of particle size, J. Geophys. Res.-Atmos., 112, D23301, https://doi.org/10.1029/2005JD006214, 2007.
Proemse, B. C., Mayer, B., Chow, J. C., and Watson, J. G.: Isotopic characterization of nitrate, ammonium and sulfate in stack PM2.5 emissions in the Athabasca Oil Sands Region, Alberta, Canada, Atmos. Environ., 60, 555–563, https://doi.org/10.1016/j.atmosenv.2012.06.046, 2012.
Proemse, B. C., Mayer, B., Fenn, M. E., and Ross, C. S.: A multi-isotope approach for estimating industrial contributions to atmospheric nitrogen deposition in the Athabasca oil sands region in Alberta, Canada, Environ. Pollut., 182, 80–91, https://doi.org/10.1016/j.envpol.2013.07.004, 2013.
Randles, R. H. and Wolfe, D. A.: Introduction to the theory of nonparametric statistics, Wiley, New York, USA, 1979.
Rolph, G. D.; Real-time Environmental Applications and Display sYstem (READY), available at: http://www.ready.noaa.gov, last access: 19 January 2017.
Savard, M. M., Cole, A., Smirnoff, A., and Vet, R.: δ15N values of atmospheric N species simultaneously collected using sector-based samplers distant from sources – Isotopic inheritance and fractionation, Atmos. Environ., 162, 11–22, https://doi.org/10.1016/j.atmosenv.2017.05.010, 2017.
Savarino, J., Kaiser, J., Morin, S., Sigman, D. M., and Thiemens, M. H.: Nitrogen and oxygen isotopic constraints on the origin of atmospheric nitrate in coastal Antarctica, Atmos. Chem. Phys., 7, 1925–1945, https://doi.org/10.5194/acp-7-1925-2007, 2007.
Savarino, J., Bhattacharya, S. K., Morin, S., Baroni, M., and Doussin, J. F.: The NO+O3 reaction: A triple oxygen isotope perspective on the reaction dynamics and atmospheric implications for the transfer of the ozone isotope anomaly, J. Chem. Phys., 128, 194303, https://doi.org/10.1063/1.2917581, 2008.
Seinfeld, J. H. and Pandis, S. N.: Atmospheric chemistry and physics, Wiley, Hoboken, NJ, USA, 2006.
Sickles Ii, J. E., Hodson, L. L., McClenny, W. A., Paur, R. J., Ellestad, T. G., Mulik, J. D., Anlauf, K. G., Wiebe, H. A., Mackay, G. I., Schiff, H. I., and Bubacz, D. K.: Field comparison of methods for the measurement of gaseous and particulate contributors to acidic dry deposition, Atmos. Environ. A-Gen., 24, 155–165, https://doi.org/10.1016/0960-1686(90)90451-R, 1990.
Sickles Ii, J. E., Hodson, L. L., and Vorburger, L. M.: Evaluation of the filter pack for long-duration sampling of ambient air, Atmos. Environ., 33, 2187–2202, https://doi.org/10.1016/S1352-2310(98)00425-7, 1999.
Sirois, A. and Fricke, W.: Regionally representative daily air concentrations of acid-related substances in Canada; 1983–1987, Atmos. Environ. A-Gen., 26, 593–607, https://doi.org/10.1016/0960-1686(92)90172-H, 1992.
Sirois, A. and Vet, R.: The Precision of Precipitation Chemistry Measurements in the Canadian Air and Precipitation Monitoring Network (CAPMoN), Environ. Monit. Assess., 57, 301–329, https://doi.org/10.1023/a:1006035129393, 1999.
Smirnoff, A., Savard, M. M., Vet, R., and Simard, M. C.: Nitrogen and triple oxygen isotopes in near-road air samples using chemical conversion and thermal decomposition, Rapid Commun. Mass Sp., 26, 2791–2804, https://doi.org/10.1002/rcm.6406, 2012.
Spicer, C. W., Howes Jr., J. E., Bishop, T. A., Arnold, L. H., and Stevens, R. K.: Nitric acid measurement methods: An intercomparison, Atmos. Environ., 16, 1487–1500, https://doi.org/10.1016/0004-6981(82)90071-3, 1982.
Stein, A., Draxler, R., Rolph, G., Stunder, B., Cohen, M., and Ngan, F.: NOAA's HYSPLIT atmospheric transport and dispersion modeling system, B. Am. Meteorol. Soc., 96, 2059–2077, 2015.
Stroud, C. A., Abbatt, J., Leiming, Z., Flagg, D., and Makar, P.: Atmospheric processes, chap. 2 – Draft version, in: Canadian smow Science Assessment, Environment Canada publisher, Ottawa, Ontario, Canada, 2008.
Thiemens, M. H.: Mass-independent isotope effects in planetary atmospheres and the early solar system, Science, 283, 341–345, https://doi.org/10.1126/science.283.5400.341, 1999.
Tsunogai, U., Komatsu, D. D., Daita, S., Kazemi, G. A., Nakagawa, F., Noguchi, I., and Zhang, J.: Tracing the fate of atmospheric nitrate deposited onto a forest ecosystem in Eastern Asia using Δ17O, Atmos. Chem. Phys., 10, 1809–1820, https://doi.org/10.5194/acp-10-1809-2010, 2010.
Vicars, W. C. and Savarino, J.: Quantitative constraints on the 17O-excess (Δ17O) signature of surface ozone: Ambient measurements from 50∘ N to 50∘ S using the nitrite-coated filter technique, Geochim. Cosmochim. Ac., 135, 270–287, https://doi.org/10.1016/j.gca.2014.03.023, 2014.
Vicars, W. C., Bhattacharya, S. K., Erbland, J., and Savarino, J.: Measurement of the 17O-excess (Δ17O) of tropospheric ozone using a nitrite-coated filter, Rapid Commun. Mass Sp., 26, 1219–1231, https://doi.org/10.1002/rcm.6218, 2012.
Vicars, W. C., Morin, S., Savarino, J., Wagner, N. L., Erbland, J., Vince, E., Martins, J. M. F., Lerner, B. M., Quinn, P. K., Coffman, D. J., Williams, E. J., and Brown, S. S.: Spatial and diurnal variability in reactive nitrogen oxide chemistry as reflected in the isotopic composition of atmospheric nitrate: Results from the CalNex 2010 field study, J. Geophys. Res.-Atmos., 118, 10567–10588, https://doi.org/10.1002/jgrd.50680, 2013.
Wang, X. L., Watson, J. G., Chow, J. C., Kohl, S. D., Chen, L. W. A., Sodeman, D. A., Legge, A. H., and Percy, K. E.: Measurement of Real-World Stack Emissions with a Dilution Sampling System, Dev. Environm. Sci., 171–192, 2012.
Zel'dovich, Y. B.: The Oxidation of Nitrogen in Combustion and Explosions, Acta Physicochimica, 21, 577–628, 1946.
Zhang, L., Vet, R., O'Brien, J. M., Mihele, C., Liang, Z., and Wiebe, A.: Dry deposition of individual nitrogen species at eight Canadian rural sites, J. Geophys. Res.-Atmos., 114, D02301, https://doi.org/10.1029/2008JD010640, 2009.