the Creative Commons Attribution 4.0 License.
the Creative Commons Attribution 4.0 License.
 | 05 Jan 2026
Resolving the roles of soot and dust in cirrus cloud ice formation at regional and global scales: insights from parcel and climate modeling
Paul Ginoux
Atmospheric aerosols can serve as ice-nucleating particles (INPs), influencing cirrus cloud formation and properties. While mineral dust is recognized as an effective INP, the role of soot remains less explored, limiting climate impact assessments. Here we use cloud parcel model simulations to examine the competitive ice nucleation behavior of soot and dust, alongside homogeneous nucleation. These process-level simulations reveal that dust dominates heterogeneous ice nucleation at colder temperatures (T<210 K), whereas soot becomes increasingly more important at warmer temperatures, particularly when dust concentrations are low. To evaluate their global-scale implications, we integrate these results into the GFDL AM4-MG2 climate model. We find that dust shapes the baseline spatial and seasonal ice crystal number concentration (ICNC) patterns, while soot (represented in the model as black carbon, BC) enhances global-mean ICNC by ∼ 5 %. However, BC-driven increases in ICNC can be much larger in the upper troposphere (500–250 hPa), reaching up to 90 %. The strongest enhancements are found during boreal spring across Eurasia and the Maritime Continent, and during austral spring over South America and the South Atlantic. Radiatively, BC INPs can enhance the annual global longwave cloud radiative effect by approximately 0.24 W m−2 and cause statistically significant net warming in both polar regions during their respective winters. These results highlight the coupled roles of dust and soot in cloud ice formation, underscoring the need to assess the impacts of rising wildfire emissions on atmospheric ice processes and associated climate effects.
- Article
(11794 KB) - Full-text XML
-
Supplement
(10597 KB) - BibTeX
- EndNote


Cirrus are high-level clouds composed primarily of ice crystals, with typical formation altitudes between 8 and 17 km (Lynch et al., 2002). With extensive global coverage of ∼ 30 % in the midlatitudes and up to ∼ 80 % in tropical regions, cirrus clouds have a significant impact on the Earth's climate system and radiation budget (Baran, 2012; Heymsfield et al., 2017). Unlike low-level clouds which typically exert a cooling effect, cirrus clouds are often associated with a net warming of the climate system as they allow most shortwave solar radiation to pass through while efficiently trapping outgoing longwave radiation (Gasparini and Lohmann, 2016; Storelvmo et al., 2013). However, the magnitude and even the sign of their radiative impact are highly uncertain and poorly constrained (Lynch et al., 2002; Heymsfield et al., 2017). This uncertainty stems largely from the limited understanding of aerosol-cloud interactions, particularly the processes by which aerosols serve as ice nucleating particles (INPs) to alter cloud abundance and radiative properties (Singh et al., 2024; Masson-Delmotte et al., 2021; Li et al., 2024; Lynch et al., 2002; Wang et al., 2014).
Ice nucleating particles are aerosols that facilitate ice formation under conditions where it would otherwise not occur (Hoose and Möhler, 2012; Murray et al., 2012; Li et al., 2024). In the absence of INPs, pure water vapor requires temperatures below −38 °C and a relative humidity with respect to ice (RHice) around 150 % to form ice crystals through homogeneous nucleation (Koop et al., 2000). The presence of INPs, however, can modify the interfacial water structure and dynamic properties at the particle surface, thereby lowering the energy barrier for the phase transition and enabling ice to form at higher temperatures or lower ice supersaturation levels through heterogeneous nucleation (Li and Bourg, 2023a, b, 2024). This, in turn, can significantly alter the optical and physical properties of clouds, creating a complex interplay between aerosols, clouds, and climate (Kärcher, 2017; Li et al., 2024; Gasparini and Lohmann, 2016). For example, previous studies have shown that within an optimal range of INP concentrations, cirrus clouds formed predominantly by INP-induced heterogeneous nucleation can contain fewer but larger ice crystals, resulting in shorter lifetimes and a reduced warming effect compared to those formed by homogeneous nucleation (Kärcher and Lohmann, 2003; Storelvmo et al., 2013; Mitchell and Finnegan, 2009). However, despite general consensus on the critical role of INPs (e.g. dust) in modulating cirrus cloud properties, identifying the effective INP types and accurately assessing their climate impacts remain controversial and can vary significantly between different studies (Penner et al., 2015; Gasparini and Lohmann, 2016; Storelvmo et al., 2013).
Among various types of potentially important INPs, soot (also known as black carbon, BC) continues to be one of the most debated components. This debate stems from widely conflicting results reported across multiple scales by laboratory experiments, in-situ measurements, and remote sensing retrievals. For example, laboratory results are generally divergent, with some studies indicating that soot can be an effective INP and its efficiency depends on factors including morphology, particle size, surface oxidation, and prior exposure to water vapor (Kulkarni et al., 2016; Gao et al., 2022; Hoose and Möhler, 2012; Testa et al., 2024). In situ aircraft measurements have previously reported that particles from biomass burning such as black carbon are significantly underrepresented in ice residues, leading to the conclusion that effective ice-nucleating elemental carbon particles are of low abundance in the cirrus regime (Cziczo et al., 2013). However, lidar observations have demonstrated that wildfire smoke can trigger cirrus formation (Mamouri et al., 2023). And recent aircraft measurements by NASA’s Atmospheric Tomography Missions (ATom) have shown that biomass burning particles in the remote troposphere are dilute but ubiquitous, accounting for approximately one-quarter of the accumulation-mode aerosol number and one-fifth of the aerosol mass (Schill et al., 2020). Since mineral dust aerosols have been well known as efficient INPs and often coexist with soot (Li and Ginoux, 2025; Deboudt et al., 2010), it is plausible that competition for ice nucleation between dust and soot occurs in mixed aerosol plumes. Mineral dust aerosols are generally more efficient than soot aerosols as INPs, and condensation on ice crystals depletes water vapor. The coexistence of dust and soot and the competitive microphysical processes may mask the signal of soot in certain measurements, contributing to observed inconsistencies. Together, these observations raise an important question: could soot play a significant role in cirrus cloud formation and influence Earth’s radiative budget?
Numerical simulations are promising tools to address this question by providing complementary insights into the role of INPs, connecting observations across different scales, and helping to resolve controversies by linking laboratory processes to cloud-scale dynamics and large-scale climate feedbacks. For example, laboratory measurements are typically conducted under well-controlled conditions of relative humidity, temperature, and pressure (Li et al., 2024). However, in the real atmosphere, clouds develop through the ascent and expansion of air parcels under variable and often complex meteorological conditions (Heymsfield et al., 2017). To bridge the gap between laboratory studies and in situ cloud observations, cloud parcel models with a Lagrangian framework can be used to simulate the evolution of an individual air parcel as it ascends and descends through the atmosphere. These models explicitly track aerosol activation, competitive ice nucleation among different aerosol species, condensational and depositional growth, and ice crystal sedimentation. By resolving these microphysical processes, parcel models can predict the meteorological and microphysical evolution of an ice cloud column for a given vertical wind profile, thereby providing a process-level link between laboratory-derived ice nucleating kinetics and real-world cloud formation (Lin et al., 2002; Fan et al., 2017; Kärcher et al., 2022). Similarly, to connect cloud-scale processes to global climate feedbacks, insights from parcel models can be used to inform and constrain cloud microphysics parameterizations within large-scale climate models (Fan et al., 2019). By representing the complex, non-linear interactions between clouds and the broader climate system, climate models can provide crucial insights for assessing the ultimate impact of INPs and cirrus clouds on the Earth’s radiative budget at a global scale. However, a significant gap remains in this modeling framework. To date, there are very few parcel models that explicitly consider competitive ice nucleation between dust and soot, which limits our understanding of soot’s behavior in realistic mixed-aerosol environments (Lin et al., 2002; Fan et al., 2017; Kärcher et al., 2022; Yun and Penner, 2012). Moreover, existing climate model studies that include soot effects often rely on oversimplified empirical representations, assuming a constant fraction of ice activation at a given temperature and humidity (Zhu and Penner, 2020; Beer et al., 2024; Barahona et al., 2010). Such parameterizations do not adequately capture subgrid-scale cloud processes, where the actual aerosol abundance and competition can strongly influence ice nucleation efficiency. In addition, most existing climate modeling studies primarily focus on the global impacts of soot, without providing a detailed perspective on its regional effects, especially in regions where soot is a dominant aerosol component (Zhu and Penner, 2020; Beer et al., 2024).
To address the aforementioned knowledge gaps, this study presents a systematic framework that combines laboratory data with parcel and climate modeling to provide insights into the roles of soot and dust as INPs and their resulting climate impacts. First, we use a cloud parcel model driven by laboratory-derived ice nucleation active site density parameterization to simulate the competition between dust- and soot-induced heterogeneous nucleation and homogeneous nucleation. Rather than prescribing a fixed ice-active fraction at a given temperature and supersaturation, this setup enables us to predict ice crystal number concentrations (ICNC) across a range of aerosol compositions, concentrations, pressure levels, temperature regimes, and updraft velocities representative of cirrus cloud formation. We then incorporate the parcel model results into the GFDL climate model to examine their impacts on the global distribution of ice crystal number concentrations and their interactions with radiation. To assess model performance, these outputs are evaluated against a suite of observational data, including in-situ aircraft measurements and lidar observations. Furthermore, we examine the regional impacts of dust and soot INPs in areas such as the Tibetan Plateau and the South American outflow region to characterize the associated seasonal and spatial variability. Overall, this integrated approach aims to reduce uncertainties in representing the roles of soot and dust in cirrus cloud formation and their broader climatic implications.
2.1 Parcel model description
2.1.1 Numerical set-up
A comprehensive set of over 5.5 million cloud parcel model simulations was performed to investigate a wide range of conditions relevant to cirrus formation. The parcel model is based on the framework of Fan et al. (2017), but it was adapted to specifically simulate cirrus clouds by applying environmental conditions typical for cirrus formation (De La Torre Castro et al., 2023; Barahona et al., 2017; Fu et al., 2017). The cirrus cloud simulations in this study assume a constant updraft velocity ranging from 0.1 to 100 cm s−1 discretized into 40 bins. The cloud layer is set to a thickness of 300 m; the cloud base pressure is prescribed at values of 100, 200, 300 and 400 hPa; and the cloud base temperature varies between 190 and 233 K, in 3 K increments. To examine aerosol-cloud interactions, four distinct aerosol types were simulated: soot, dust, sulfate, and sea salt. A total of 15 mass concentrations of soot and dust were specified, ranging from 1 to 10 000 ng m−3, corresponding to number concentrations of 4.0×10⁵ to 4.0×10⁹ m−3 for soot and 4.2×10³ to 4.2×10⁷ m−3 for dust. For sulfate and sea salt, three mass concentrations were specified, ranging from 10 to 1000 ng m−3, corresponding to number concentrations of 1.3×10⁶ to 1.3×10⁸ m−3 for sulfate and 3.5×10⁴ to 3.5×10⁶ m−3 for sea salt. The parcel model computes pressure (P) and temperature (T) as an air parcel ascends from its initial state under adiabatic conditions, with the initial relative humidity relative to ice (RHice) is set to 1.1. For temperatures below 233.15 K (i.e., −40 °C), this corresponds to relative humidity with respect to water (RHw) values below ∼ 0.75. Additionally, the model calculates RHice, RHw, and the number concentrations and sizes of droplets and ice crystals during the parcel expansion. The simulation parameters are summarized in Supplement Table S1. We note that in the parcel model, dry aerosols are distributed into prescribed size bins, while activated droplets and ice crystals are tracked individually in a Lagrangian framework. This approach explicitly resolves particle size distributions and captures the detailed microphysical evolution of droplets and ice crystals.
In the parcel model, both homogeneous and heterogeneous nucleation processes are considered (Hoose and Möhler, 2012). Homogeneous nucleation rate is calculated below 238 K following the theory detailed in Koop et al. (2000) for deliquescent sulfate and sea salt aerosols, as well as liquid droplets formed when the diffusion of water molecules to deliquescent aerosols leads to rapid growth, reaching the critical supersaturation over water (Pruppacher et al., 1998). Heterogeneous nucleation is considered for dust and soot aerosols both above and below 238 K, incorporating both deposition nucleation and condensation-immersion freezing modes (Alpert and Knopf, 2016; Ullrich et al., 2017, 2019). While recent studies suggest that sulfate (Bertozzi et al., 2024), sea salt (DeMott et al., 2016; Wagner et al., 2018), organics (Li et al., 2024; Wolf et al., 2020), and nitrate (Wagner et al., 2020) aerosols may also act as effective INPs at cirrus conditions promoting heterogeneous ice nucleation, substantial uncertainties remain. Given the scope of this study, which aims to refine the representation of soot and dust ice nucleation, these additional heterogeneous pathways are not explicitly included in the current parcel model. A more comprehensive evaluation of different parameterization schemes incorporating these additional aerosol species would be beneficial in future studies. For the aerosol species considered in this study, lognormal size distribution is assumed. Soot and sulfate aerosols are each represented by a single accumulation mode, with geometric mass mean diameters of 200 and 400 nm, and geometric standard deviations (σg) of 1.7 and 2.0, respectively. Dust and sea salt aerosols are represented by two modes: accumulation and coarse. For dust, 30 % of the total mass is assigned to the accumulation mode, while for sea salt, 20 % is allocated to this mode. The geometric mass mean diameters for the accumulation and coarse modes are set to 800 nm and 2 µm, respectively, with σg=2.0 for both modes. We note that a fixed aerosol size distribution is used in this study, although varying the size and shape of the distribution could potentially influence the results. The choice of fixed size parameters is primarily to maintain consistency with the bulk aerosol scheme in the host climate model, the Geophysical Fluid Dynamics Laboratory’s Atmosphere Model version 4.0 with two-moment Morrison-Gettelman cloud microphysical parameterization (GFDL AM4-MG2), where only the aerosol mass concentration is prognosed, and the mean particle size and geometric standard deviation are prescribed. This bulk representation is a common practice in global climate models (GCMs), including those participating in CMIP5 and CMIP6. We acknowledge that aerosol size can influence activation and ice nucleation processes; however, given the large uncertainties in observed size distributions and to ensure consistency with GCM representations, our parcel model experiments also adopt prescribed, fixed size parameters. The effects of varying aerosol size will be explored in future studies once a fully coupled aerosol microphysics scheme becomes available, which is currently under active development at GFDL.
Once ice crystals form, their subsequent growth is modeled by molecular diffusion and habit evolution, using the two-axis oblate or prolate spheroid method (Sulia and Harrington, 2011; Pruppacher et al., 1998). The accommodation coefficient for the condensation of water vapor is set as 0.7, with a value of 0.1 used in sensitivity tests. Ice crystals exceeding a mass-equivalent spherical diameter of 200 µm are excluded from further growth or sublimation, representing their gravitational settling out of the air parcel, as discussed in Fan et al. (2017). Evaporation of liquid droplets and sublimation of ice occur when the air becomes subsaturated. The effects of hydrometeor collision and accretion are not considered in this study. In the parcel model, as the air parcel ascends to the cloud top, the activated INP numbers are computed using a time step of 1 s. Meanwhile, the ice crystal growth is calculated on an integration time step of 0.02 s, and the pressure, temperature, relative humidity (with respect to both ice and water), as well as the sizes of droplets and ice crystals, are updated every 0.02 s. The integration time step was chosen based on sensitivity analyses to ensure numerical convergence of the model results. We note that a critical ice number concentration must be defined to determine when a cirrus cloud starts to form. In our parcel model, rather than explicitly tracking cirrus formation, we calculate the ice-nucleated number fractions for dust and soot as a function of ice supersaturation and temperature as discussed in Sect. 2.1.2.
2.1.2 Representation of dust and soot INPs
Heterogeneous ice nucleation, including deposition and immersion freezing, occurs on solid aerosol particles at temperatures both below and above 238 K (Hoose and Möhler, 2012). Deposition nucleation occurs below water saturation if water vapor molecules diffuse to aerosol surface and are accommodated (Hoose and Möhler, 2012). Immersion freezing occurs when cloud droplet freezing is catalyzed at the liquid-solid interface (Hoose and Möhler, 2012). It also occurs near water saturation as water condenses in pores and cavities, and subsequently freezes (Marcolli, 2014; Wagner et al., 2016). The treatment of immersion freezing on mineral dust particles is based on the activity based immersion freezing model (ABIFM) (Alpert and Knopf, 2016). The ABIFM is based on the classical nucleation theory, and formulates the ice nucleation rate as a function of the water activity. The immersion freezing of soot aerosol is neglected in the parcel model (Cziczo et al., 2013). The treatment of deposition nucleation on mineral dust and soot aerosols is based on the parameterizations of Ullrich et al. (2017), which represent the ice nucleation efficiency in terms of the ice nucleation active surface site (INAS) density. The number of ice crystals formed by deposition nucleation for a monodisperse aerosol population is given by
where Naer is the number concentration of ice nucleating aerosol particles (cm−3), Saer is the aerosol surface area (cm2/particle), and ns is the INAS density (cm−2). For a polydisperse aerosol population, the total number of ice crystals is calculated by summing up those calculated for each size bin.
The deposition nucleation ns isolines for desert dust show a minimum in the ice saturation ratio–temperature (Si−T) diagram at temperatures around 200 K. At temperatures below this minimum, the required Si increases as temperature decreases (a negative slope), which can be explained by classical nucleation theory. Conversely, at temperatures above this minimum, the required Si increases as temperature increases (a positive slope), a behavior likely associated with pore condensation and freezing. The deposition nucleation ns isolines for soot exhibit a similar shape with a minimum near 220 K, but they are shifted toward higher Si values, particularly for soot with higher organic carbon content (Ullrich et al., 2017). The deposition nucleation is suppressed by sulfate or other soluble coatings. To account for this reduction in nucleation efficiency, the ns values are scaled by a factor of 0.05 for dust and 0.01 for soot (Ullrich et al., 2019). The detailed formulations of the INAS density, homogeneous and heterogeneous nucleation rates, and ice crystal growth used in this study are detailed in Supplement Sect. S1. Because soot is represented as black carbon in climate models, we hereafter refer to it as black carbon (BC) for consistency.
2.2 Climate model description
2.2.1 Host model and microphysics scheme
The simulations in this study are performed with AM4-MG2 (Guo et al., 2021), which is based on the Geophysical Fluid Dynamics Laboratory’s fourth-generation atmospheric general circulation model, AM4.0 (Zhao et al., 2018a, b). For aerosol representation, AM4-MG2 uses the bulk aerosol scheme embedded in AM4.0, which generates aerosol fields from multiple emission sources, consistent with Zhao et al. (2018a, b). Briefly, AM4.0 simulates the mass distribution of five aerosol species: sulfate, dust, black carbon, organic aerosols, and sea salt. Dust and sea salt are represented with five size bins spanning radii from 0.1 to 10 µm, while the other aerosol types follow prescribed lognormal distribution in accumulation mode. Aerosol concentrations are calculated based on their emissions (including precursor emissions), chemical production (e.g., sulfate and secondary organic aerosols), transport by advection, and removal processes such as dry and wet (rainout and washout) deposition, as well as convection, as described in detail for AM3 by Donner et al. (2011) and Naik et al. (2013).
For cloud microphysics representation, AM4-MG2 replaces the original Rotstayn–Klein (RK) cloud microphysics scheme in AM4.0 with the two-moment Morrison–Gettelman (MG2) scheme, which includes prognostic precipitation (Gettelman and Morrison, 2015a; Gettelman et al., 2015b) as implemented in Guo et al. (2021, 2022, 2025). The model explicitly prognoses both the mass mixing ratios and number concentrations for four hydrometeor types: cloud water, cloud ice, rain, and snow. The treatment of ice nucleation is critical for modeling both mixed-phase and ice clouds, as it serves as the primary source of ice crystal number concentration. For mixed-phase clouds, a temperature- and dust-dependent ice nucleation scheme is applied (Fan et al., 2019), while for cirrus clouds, the nucleated ice number concentration is derived from parcel model simulations described in Sect. 2.1. Assuming that ice crystals follow Gamma size distributions, their mean size is determined from the ice crystal number and mass concentrations. The nucleation of ice crystals is coupled with the depletion of water vapor and the release of latent heat, both of which are represented in the MG2 scheme (Morrison and Gettelman, 2008; Gettelman and Morrison, 2015a). Furthermore, to ensure consistency between the prognostic treatments of ice crystal number and mass concentrations, AM4-MG2 includes the detrainment of ice number concentration from convection to large-scale clouds, following the approach of Kristjansson et al. (2000). The model also considers the shortwave and longwave radiative effects of precipitating hydrometeors (rain and snow). In addition, AM4-MG2 includes the semi-direct effect of all absorbing aerosols, with BC as the primary contributor and additional contributions from dust and, to a lesser extent, organic aerosols. In AM4-MG2, this semi-direct effect arises from aerosol absorption of solar radiation, which heats the atmosphere both within and outside clouds and can promote cloud evaporation. The model supports both all-sky and clear-sky radiative calculations, and in all cases the semi-direct effect is represented through absorption-induced atmospheric heating.
AM4-MG2 uses the Finite-Volume Cubed-Sphere (FV3) hydrostatic dynamical core (Harris et al., 2020; Lin, 2004), 18 shortwave bands with updated CH4, N2O, and H2O continuum absorption, and revised formulations for H2O, CO2, and O2 (Paynter and Ramaswamy, 2014). Longwave radiation is calculated using the simplified exchange approximation (Schwarzkopf and Fels, 1991). Convection is parameterized using a “double-plume” scheme, representing coexisting deep plumes (penetrating up to the tropopause) and shallow plumes (generally below 500 hPa), with different lateral mixing rates (Bretherton et al., 2004). The orographic gravity wave drag parameterization accommodates arbitrary topography (Garner, 2018), and the non-orographic component follows Alexander and Dunkerton (1999). Planetary boundary layers are treated using the Lock scheme (Lock et al., 2000), which accounts for down-gradient turbulent diffusion in both convective and stratocumulus regimes. Large-scale cloud fraction is prognosed following Tiedtke (1993). Additional details on AM4-MG2 are provided in Guo et al. (2021, 2022).
2.2.2 Implementation of parcel model results
To integrate the process-level insights from the parcel model into the global climate model, we compiled the results from the 5.5 million parcel simulations into a multi-dimensional lookup table. This table parameterizes the number concentration of ice crystals nucleated on dust (Ni,dust) and black carbon (Ni,BC) as a function of seven input variables: updraft velocity, pressure, temperature, and the mass concentrations of dust, soot, sulfate, and sea salt. Within the GCM at each time step (i.e., the physical timestep of 30 min), this lookup table is queried to determine Ni,dust and Ni,BC when the ambient temperature is below 233.15 K (i.e. −40 °C). This threshold was chosen as it aligns with the upper limit of the parcel model's temperature range and focuses the parameterization on conditions relevant to cirrus formation. A mixed interpolation scheme is used: the GCM interpolates linearly for pressure and temperature, and logarithmically for updraft velocity and the aerosol mass concentrations. We note that in certain cases, the model-simulated pressure, temperature, updraft velocity, or aerosol mass concentration may exceed the range represented in the lookup table. In such cases, the model constrains these variables to the nearest upper or lower limit of the table rather than performing extrapolation. This approach is justified because INP concentrations are physically negligible near the lower boundaries and approach saturation near the upper boundaries. This treatment also ensures numerical stability by avoiding potential artifacts from extrapolation.
2.2.3 Simulation set-up
Using the above-mentioned framework, we performed Atmospheric Model Intercomparison Project (AMIP) simulations with GFDL AM4-MG2, in which observed sea surface temperature and sea ice were prescribed. AM4-MG2 was run on a cubed-sphere grid with each face containing 96×96 points, corresponding to a nominal horizontal resolution of ∼ 100 km. The model has 33 vertical levels extending from the surface to around 1 hPa, with a physical time step of 30 min and a dynamic core acoustic time step of 2.5 min.
The simulation was initialized in 2000 and run to the end of 2005, with the first year treated as model spin-up, and the following 5 years of 2001–2005 for analysis. We note that a five-year period is sufficient to capture stable features of ice crystal and aerosol climatology over 2001–2005. However, as noted by previous findings (Loeb et al., 2018, 2009), radiation-related variables such as the cloud radiative effect (CRE) exhibit strong variability and might require longer integrations to reduce noisy spatial patterns. To examine and ensure the robustness of our radiation analysis, we extended the simulations to 2020 and analyzed the full 20-year dataset for radiation as a comparison with the 2001–2005 analysis. In the main manuscript, radiation results in Sect. 3.4 are presented for 2001–2020, and the analysis for 2001–2005 is included in the Supplement. As will be noted, the two analyses lead to consistent conclusions for radiation, though the extended period provides more variability and more statistically robust results.
3.1 Parcel model simulations and process analysis of ICNC
3.1.1 ICNC depdendence on meteorological conditions
Figure 1 provides a comprehensive overview of the parcel model simulated ice crystal number concentration (ICNC) as a function of key meteorological and aerosol parameters. The results presented are for simulations initialized at a constant cloud base pressure of 300 hPa, with background mass concentrations of 0.1 µg m−3 for both sea salt and sulfate aerosols, which allows for a systematic evaluation of how ICNC responds to changes in cloud base temperature (T), updraft velocity (w), and the mass concentrations of dust (Cm,dust) and black carbon (Cm,BC).
The primary meteorological drivers, temperature and updraft velocity, exert strong and systematic control over ice formation. As shown in Fig. 1, the total ice crystal number concentration (Ni,tot, solid lines) is highly sensitive to w, increasing by several orders of magnitude as w increases from 1 cm s−1 (top row) to 50 cm s−1 (bottom row). This behavior reflects the fact that stronger updrafts lead to greater cooling rates, which in turn produce higher peak supersaturations–conditions that activate a larger number and broader spectrum of INPs. In contrast, the relationship between Ni,tot and temperature is non-monotonic. Beginning at the lowest temperatures, Ni,tot initially increases with rising temperature, reaches a maximum, and then declines as temperature continues to rise. This pattern arises from the competition between two opposing processes. Since all simulations are initialized at the same relative humidity with respect to ice, the amount of water vapor available for ice formation is constrained by the low saturation vapor pressure at very cold temperatures. As temperature increases, more water vapor becomes available, supporting the formation of a larger number of ice crystals. However, at higher temperatures, the thermodynamic favorability for ice nucleation diminishes, reducing the number of activated INPs. The interaction between increasing water vapor availability and declining nucleation efficiency gives rise to a peak in ICNC at intermediate temperatures ∼ 200 K. This peak shifts to lower temperatures with increasing updraft velocity, as stronger updrafts make water vapor less of a limiting factor at colder conditions. Furthermore, the magnitude of the peak ICNC increases substantially with higher INP concentrations (e.g., as Cm,dust increases), reflecting the greater number of available nucleation sites.
These relationships are further detailed by the supplementary figures. The parameter space maps in Fig. S1 comprehensively visualize these trends, confirming that the sensitivity to updraft velocity and the non-monotonic dependence on temperature are robust features across the full range of pressures studied. The ICNC dependence on updraft velocity w is explicitly detailed in Fig. S2, which shows a near-log-linear increase in ICNC with w, although the slope of this log-log relationship slightly decreases at high updraft velocities (e.g., w>50 cm s−1). This plateauing effect suggests that as updrafts become very strong, the system transitions from being limited by the availability of water vapor to being limited by the finite number of available INPs. Finally, the dependence of Ni,tot on cloud base pressure (P) is shown in Fig. S3, where a clear positive relationship between ICNC and cloud base pressure P emerges for a given temperature and updraft. This relationship is approximately linear, but modulated by both the available water vapor and the number of INPs.
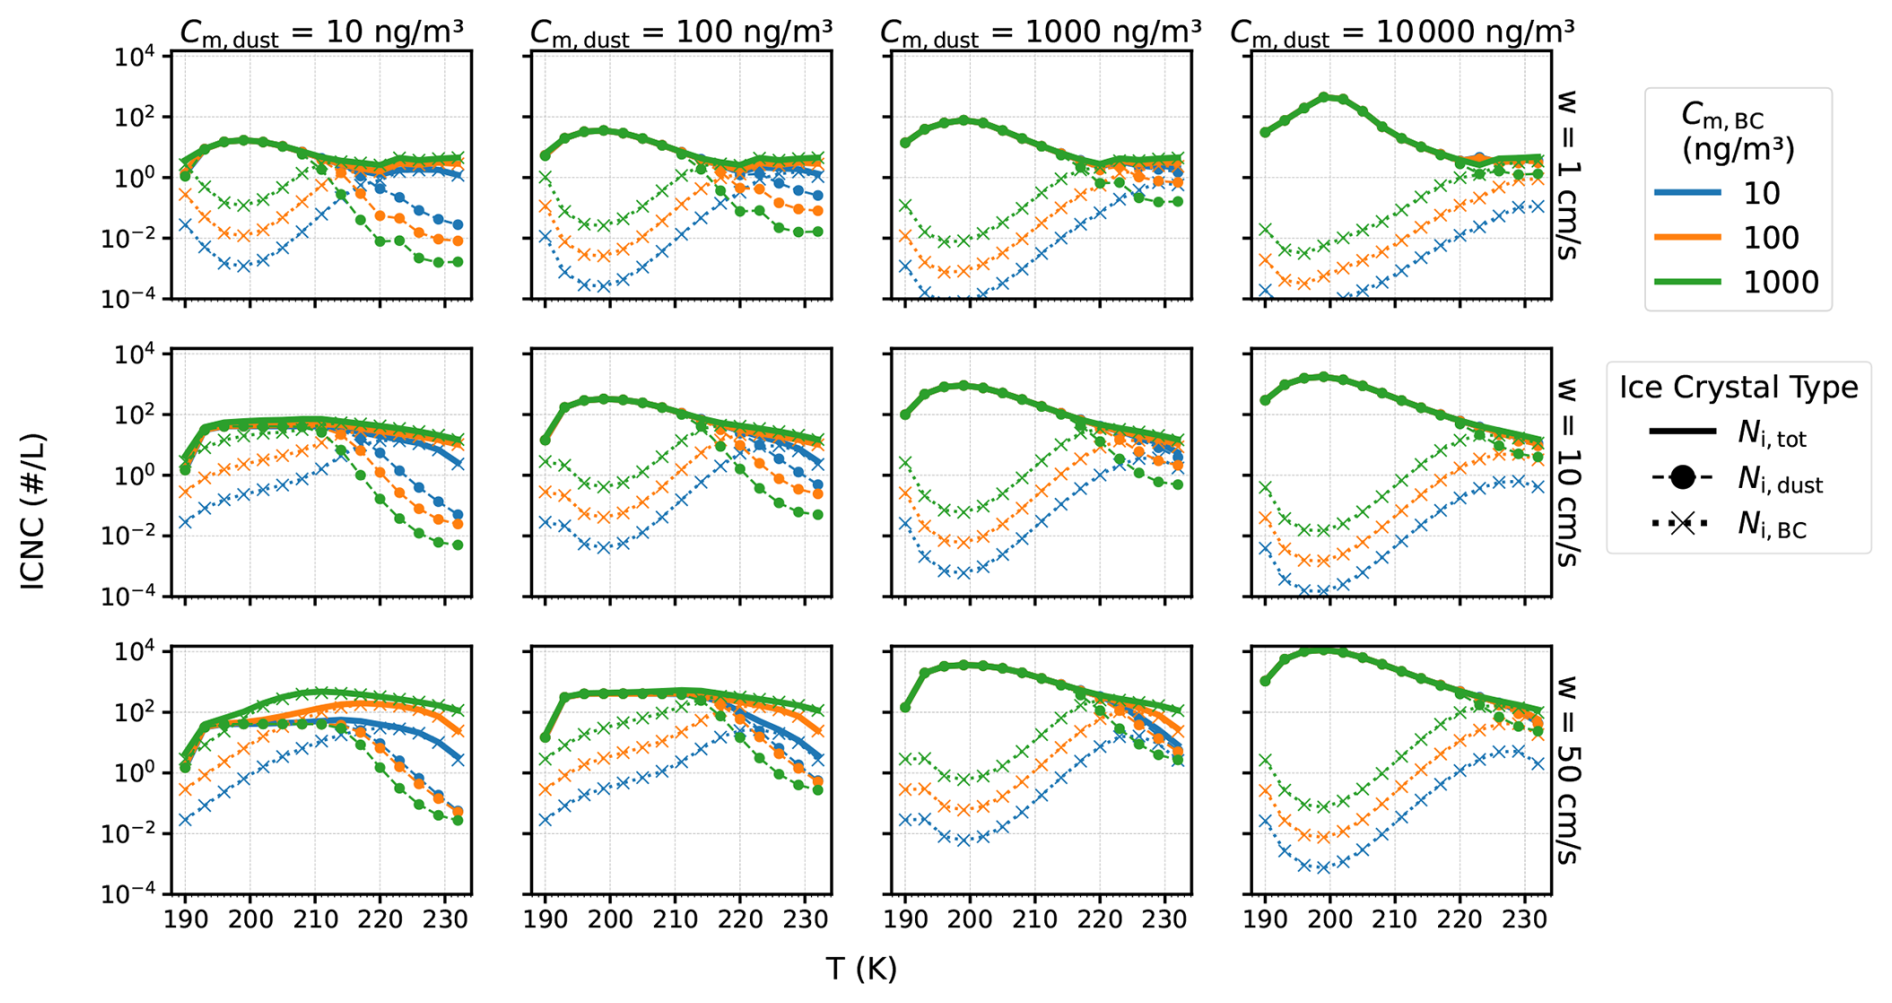
Figure 1Parcel model simulations of ice crystal number concentration (ICNC) as a function of cloud base temperature (T). All simulations were initialized with a cloud base pressure of 300 hPa and background mass concentrations of 0.1 µg m−3 for both sea salt and sulfate aerosols. Columns represent varying initial dust mass concentrations (, 100, 1000, and 10 000 ng m−3), while rows correspond to different updraft velocities (w=1, 10, and 50 cm s−1). Within each panel, line color denotes BC mass concentration (Cm,BC): blue (10 ng m−3), orange (100 ng m−3), and green (1000 ng m−3). Solid lines show total ice crystal number concentration (Ni,tot), while circle-dashed and cross-dashed lines indicate contributions from dust (Ni,dust) and soot (Ni,BC), respectively.
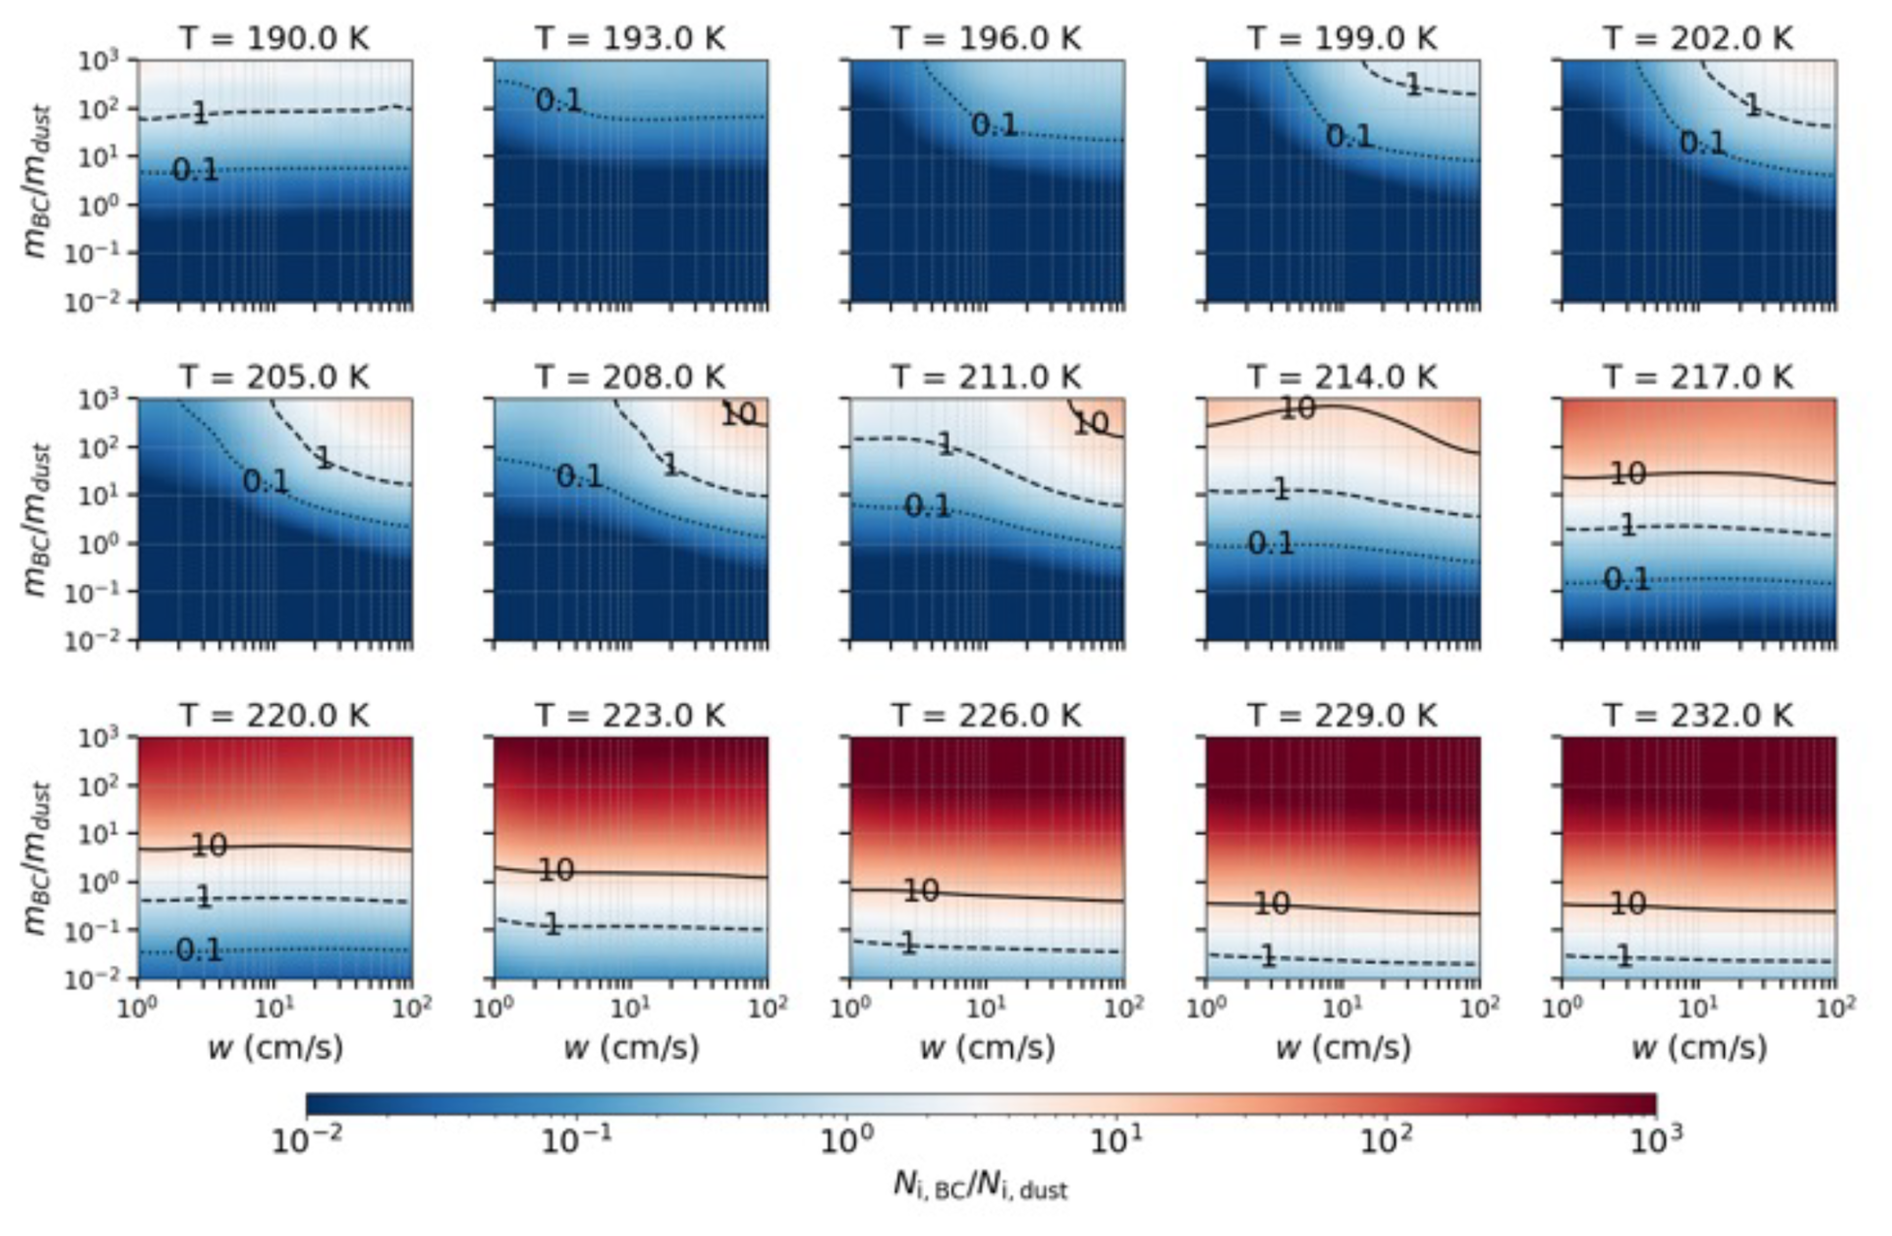
Figure 2The relative importance of BC versus dust INPs, quantified by the ratio (color scale). The ratio is shown as a function of updraft velocity (w) and the initial aerosol mass ratio (). Each panel corresponds to a different initial temperature from 190 to 232 K. Isolines mark where the nucleation ratio is 0.1, 1, and 10. All simulations were conducted with the same cloud base pressure (300 hPa) and fixed background aerosol concentrations of 0.1 µg m−3 for both sea salt and sulfate.
3.1.2 ICNC dependence on aerosol composition
The composition of the aerosol population is a fundamental determinant of the ICNC, with different species playing distinct and competitive roles as summarized in Figs. 1 and S1. The contribution from dust (Ni,dust) is most prominent at colder temperatures (T<210 K), where it serves as a primary source of ice crystals. This is consistent with the underlying INAS parameterization used in the model, which shows the peak in dust's INAS density occurs around 200 K. As a result, Ni,dust and consequently Ni,tot scale strongly with the initial dust mass concentration (Cm,dust) in this colder temperature regime. In contrast, BC acts as a more efficient INP at warmer temperatures (T>215 K), where its INAS density peaks near 220 K. However, a local minimum in Ni,BC is evident near 200 K in Fig. 1, which is attributable to strong competition for available water vapor from dust particles at dust's peak activity temperature. Despite this competition, the sensitivity of BC nucleation to updraft is slightly stronger than that of dust, as indicated by the steeper slope of the Ni,BC curve in Fig. S2, allowing it to become a major contributor when high supersaturations are achieved. We note that although homogeneous nucleation contributes less than 1 % of Ni,tot in most of our simulations, it is not entirely negligible under warmer conditions (typically at temperatures above 230 K) and when dust and BC concentrations are low. In such environments, the fraction of ice crystals formed by homogeneous nucleation, defined as , can reach values as high as ∼ 96 %. The dependence of fhomo on INP concentration, temperature, and updraft velocity under selected simulation conditions is illustrated in Figs. S4 and S5.
To characterize the competition between dust and BC INPs, we analyze the ratio of ice crystals formed on each aerosol type (). Figure 2 maps this ice number ratio as a function of the initial aerosol mass ratio () and updraft velocity (w) at a cloud base pressure of 300 hPa for a range of temperatures. The results reveal that the competitive balance is highly sensitive to the thermodynamic conditions. Consistent with the temperature-dependent active site densities in the model, BC is a more effective INP at warmer temperatures (T>215 K), where it can dominate ice formation even at moderate mass ratios (e.g., ), particularly at high updrafts. Conversely, at colder temperatures (T<210 K), dust becomes the more prominent INP, requiring a substantially higher BC mass fraction and updraft velocity for BC to contribute equally to the ICNC, as shown by the shift in the contour.
The modulating effect of pressure on this competition is detailed in Fig. S6, which plots the isolines of the ratio for four different ambient pressures. The solid line, representing a ratio of 1.0, marks the critical boundary where the dominant INP type switches. Within any given temperature panel, this boundary shifts to lower and w values as pressure increases from 100 hPa to 400 Pa. This indicates that BC becomes a relatively more effective competitor to dust at higher ambient pressures, a trend that is also visualized in the full parameter space maps shown for 100, 200, and 400 hPa in Figs. S7–9. This pressure dependence again is linked to the greater water vapor mass available at higher pressures for a fixed relative humidity, which may preferentially benefit the activation of BC over dust. In contrast, the sensitivity of this competitive balance to the background concentrations of sea salt and sulfate is negligible. As shown in Figs. S10–11, varying these background aerosol concentrations results in almost no change to the activation isolines. In summary, these findings collectively demonstrate that the relative importance of BC and dust as INPs is not fixed but is a complex function of their mass ratio, the updraft velocity, and the ambient temperature and pressure, with little dependence on the background soluble aerosol concentrations.
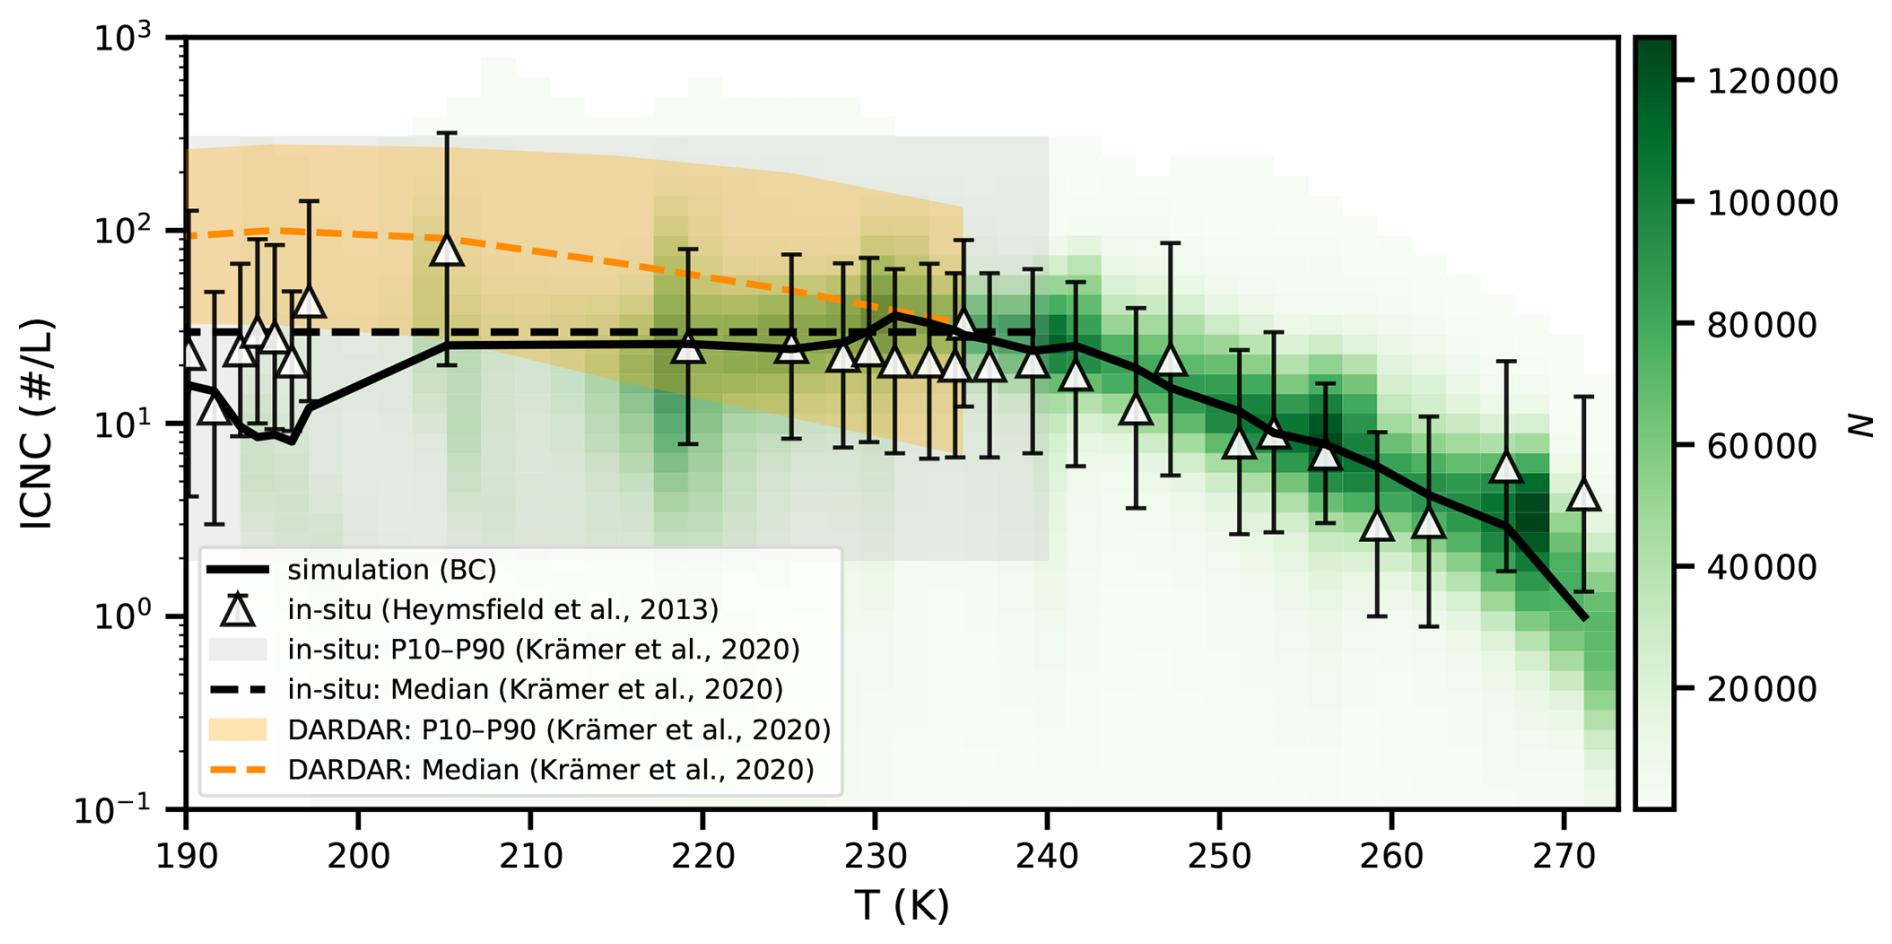
Figure 3Comparison of the parameter space of simulated and observed ice crystal number concentration (ICNC; L−1) as a function of temperature (T). The green background color represents the data-point density (N) from the AM4-MG2 simulation with black carbon as ice-nucleating particles, averaged monthly and aggregated globally across pressure levels and time segments for the period 2001–2005. The black solid line shows the median of the simulated ICNC values in 2 K temperature bins. For comparison, observational data are also shown. The black triangles with error bars represent the median and uncertainty of in-situ measurements from various regions summarized by Heymsfield et al. (2013). The gray shaded region and black dashed line denote the 10th–90th percentiles and median, respectively, compiled from in-situ observations across multiple regions by Krämer et al. (2020). The orange shaded region and orange dashed line represent the 10th–90th percentiles derived from 10 years of global DARDAR satellite retrievals tabulated by Krämer et al. (2020).
3.2 Climate model simulations and ICNC climatology
3.2.1 Temperature dependence of simulated ICNC
Figure 3 compares the parameter space of ice crystal number concentration (ICNC) as a function of temperature (T) from AM4-MG2 simulations and observations. The simulation results are monthly mean ICNC values from runs that include black carbon as ice-nucleating particles, averaged and aggregated globally across pressure levels and time segments for the period 2001–2005. The black solid line shows the median of the simulated ICNC in 2 K temperature bins, while the underlying green shading represents the density of data points within each grid cell. Observational data are drawn from three sources: (1) ICNC measurements compiled by Heymsfield et al. (2013) from multiple in situ campaigns across different regions and time periods, shown as black triangles with error bars for the median and uncertainties; (2) the 10th–90th percentiles and median of in situ observations compiled by Krämer et al. (2020), shown as a gray shaded region with a black dashed line; and (3) statistics derived from 10 years of global DARDAR satellite retrievals, also reported by Krämer et al. (2020), shown as an orange shaded region with a dashed line.
The simulated ICNC median spans a range of approximately 1–50 L−1 and shows good agreement with in situ observations (gray triangles and shaded percentile range), particularly in the temperature range of 213.15 to 273.15 K (i.e., −60 to 0 °C). This agreement indicates nice model performance when treating black carbon as ice-nucleating particles. At temperatures below 200 K, however, the model slightly underestimates ICNC compared to both in-situ medians and DARDAR retrievals. This discrepancy can be attributed to several potential factors, including: (1) contributions from additional INPs neglected in the model; (2) an overly steep negative slope in the U-shaped ns curves at very low temperatures, where parameters are under-constrained by laboratory observations (Ullrich et al., 2017); and (3) the reduced detectability of thin cirrus clouds at these temperatures in both DARDAR and in situ measurements (Kramer et al., 2020). However, as indicated by the temperature histogram in Fig. S12, data coverage in the −80 to −70 °C range is relatively sparse, suggesting that this bias has only limited influence on the overall climatology. Figure S12 also reveals that the difference in ICNC between simulations with and without BC as INPs () is on the order of 1 L−1 across the cirrus temperature range of 193.15 to 233.15 K (i.e., −80 to −40 °C)
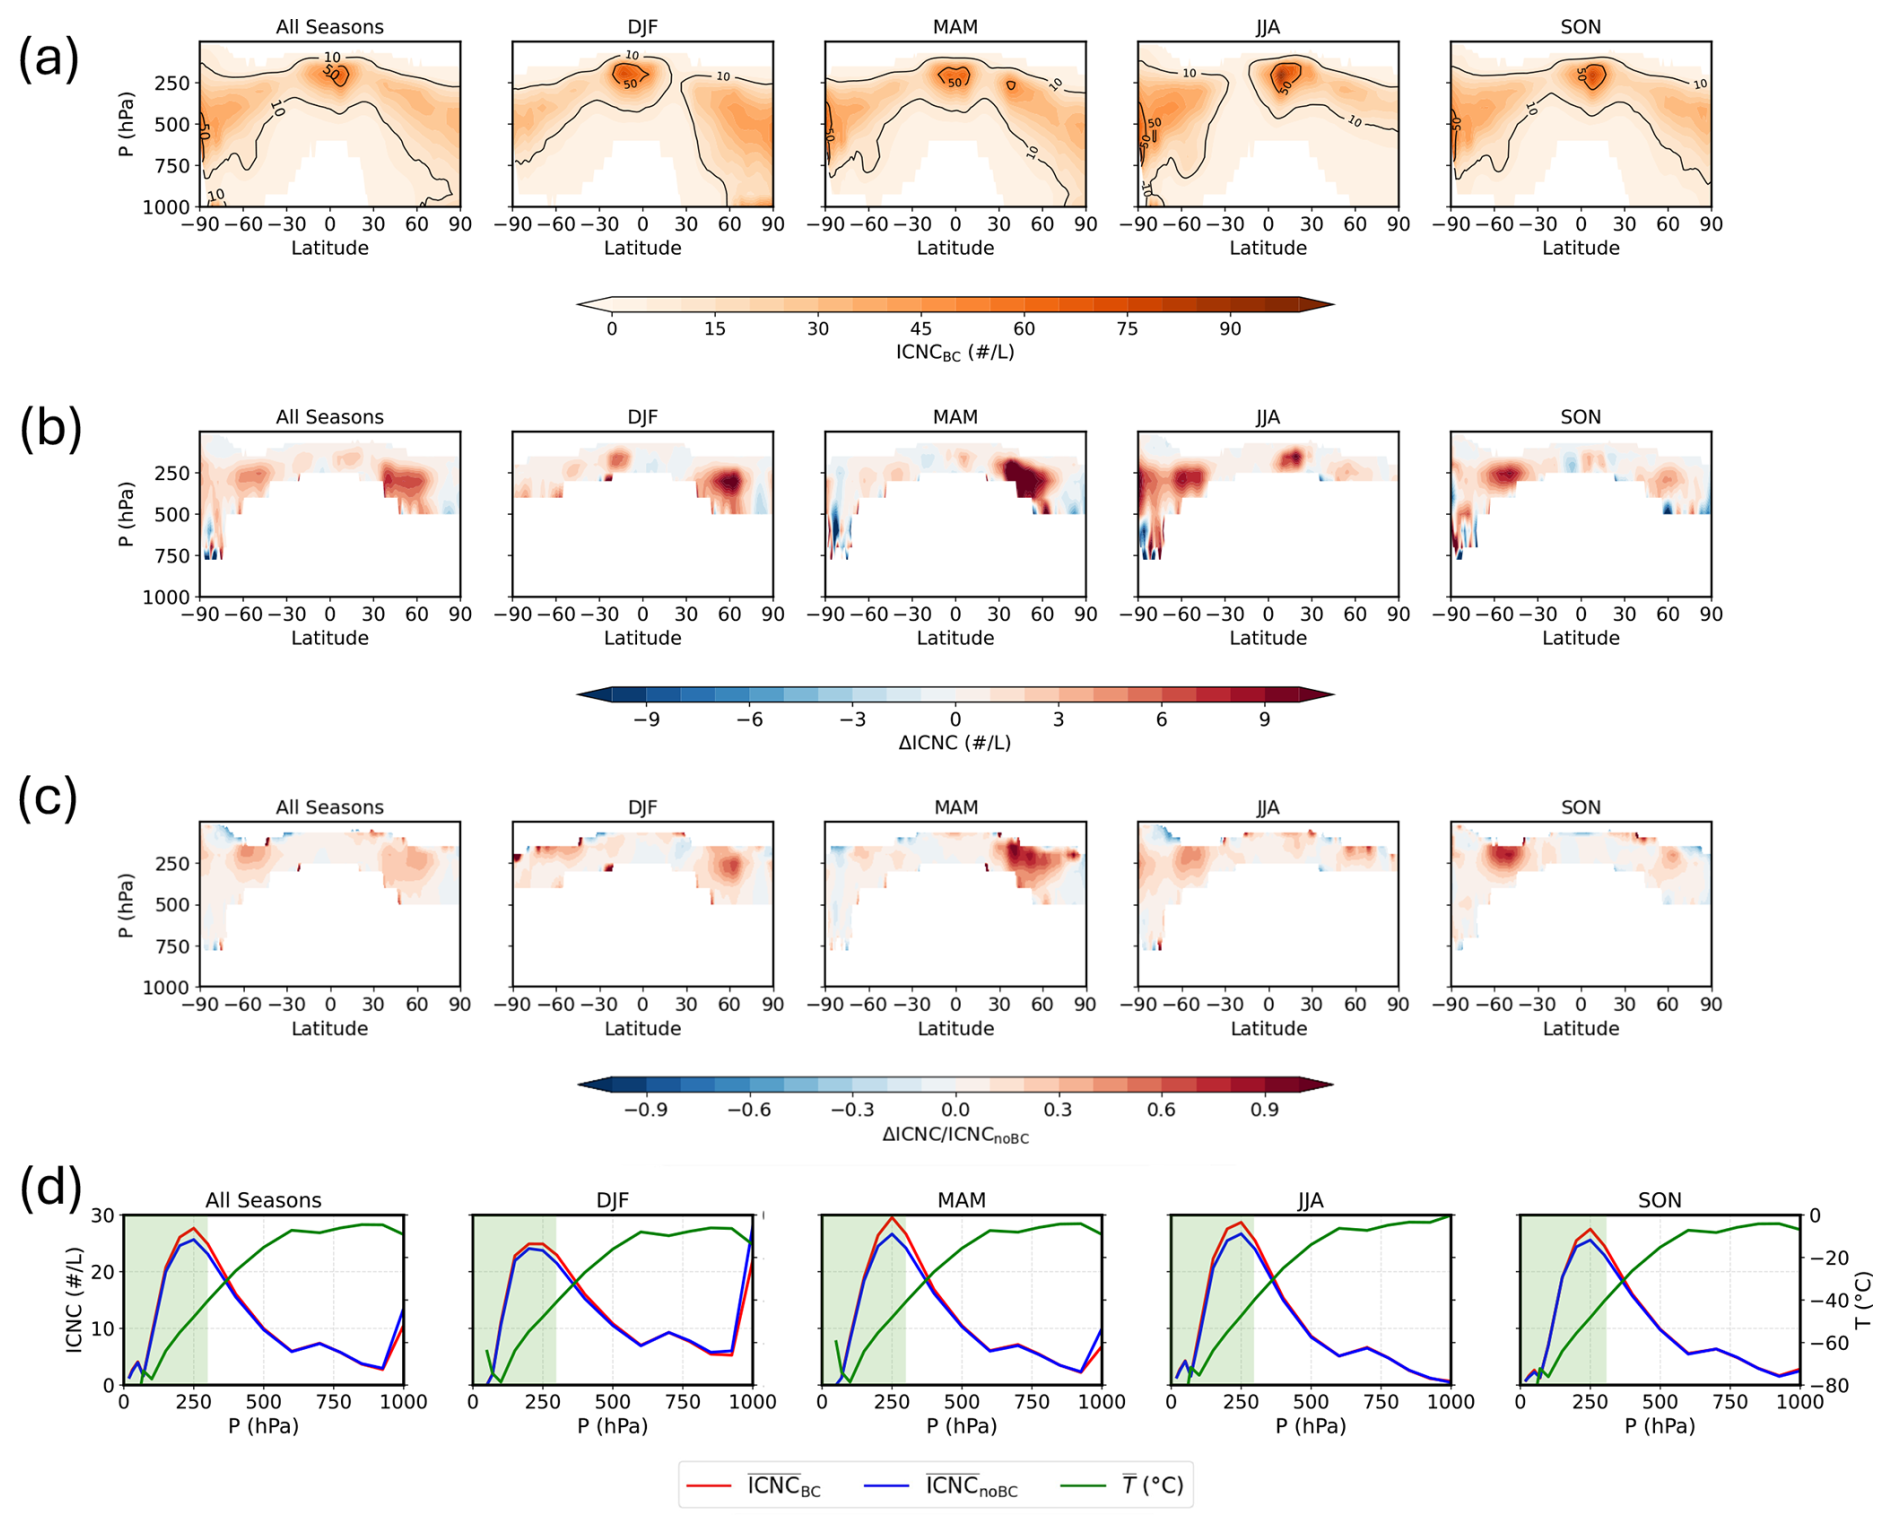
Figure 4(a) Seasonal zonal mean of the ice crystal number concentration (ICNC; # L−1) from GCM simulations with black carbon (BC) treated as ice-nucleating particles (ICNCBC). The x-axis shows latitude, and the y-axis shows pressure (P; hPa). Each panel corresponds to a different season: annual average (All Seasons), December–January–February (DJF), March–April–May (MAM), June–July–August (JJA), and September–October–November (SON). (b) Seasonal zonal mean of the difference in ICNC (# L−1) between simulations with and without BC as INPs (ΔICNC = ICNCBC – ICNCnoBC) at C. The x- and y-axes are the same as in panel (a). (c) Relative change in ICNC compared to simulations without BC as INPs, expressed as the ratio at °C. (d) Global-mean profiles of ice crystal number concentration (ICNC) and temperature, plotted using dual y-axes as a function of pressure. The left y-axis shows the globally averaged ICNC (# L−1) from GCM simulations with BC as INPs (BC, red solid line) and without BC as INPs (noBC, blue solid line). The right y-axis shows the corresponding global-mean temperature profile (green solid line). The shaded area indicates pressure levels where temperatures fall below −40 °C.
3.2.2 Zonal mean distribution and seasonal cycle
Figure 4a shows the seasonal and zonal mean distribution of ICNC from the AM4-MG2 simulation with BC treated as INPs. For context, the corresponding seasonal and zonal mean distributions for BC and dust are provided in Fig. S13. As shown in Fig. 4a, the ICNC concentrations exceeding ∼ 10 L−1 occur in the upper troposphere. The vertical location of this ICNC maximum exhibits a distinct arch-like pattern with latitude: it occurs at higher pressures (around 500 hPa) in the subpolar regions and rises to lower pressures (approximately 200 hPa) in the tropics. The latitudinal position of this maximum varies seasonally. During the equinox seasons (MAM and SON), the peak concentration is centered near the equator. It shifts into the Southern Hemisphere subtropics during Northern Hemisphere winter (DJF), and moves decisively into the Northern Hemisphere subtropics during boreal summer (JJA).
The impact of including BC as INPs on ICNC is illustrated in Fig. 4b, which shows the absolute difference in ICNC (ΔICNC) between the simulation with BC (ICNCBC) and the one without (ICNCnoBC) at T<233.15 K (i.e., °C). The primary effect of BC INPs is a notable increase in ICNC, with enhancements reaching up to 10 L−1, primarily located in the upper troposphere between approximately 500 and 250 hPa. This region of enhancement is spatially co-located with the ICNC maxima shown in panel (a), indicating that BC most strongly amplifies ice crystal formation in regions where conditions are already favorable for ice nucleation. Figure 4c displays the relative enhancement, defined as at °C. The relative enhancement spatially coincides with the absolute differences, reaching over 50 % in many regions and exceeding 90 % locally during the MAM season near 40° N and during SON season near 50° S. We note that on the global average, the enhancement induced by BC INPs is around 5 %, suggesting that while its overall effect is moderate, the localized impact of BC acting as INPs can be substantial. We note that some regions in Fig. 4b show a modest decrease in ICNC. This reduction is likely attributable to an indirect dynamical–microphysical feedback: enhanced ice formation at higher altitudes in the BC INP simulation depletes water vapor, limiting its downward transport and suppressing local ice nucleation at lower levels (resulting in a negative ΔICNC). Furthermore, decreases in ICNC may occur in regimes dominated by homogeneous nucleation – specifically where dust concentrations are insufficient for heterogeneous nucleation and soot is absent.
Figure 4d provides a global-mean perspective, showing profiles of ICNC and temperature as a function of pressure level to illustrate the overall impact of BC and its relationship with atmospheric conditions. The green solid line represents the globally averaged temperature profile, while the green shaded area marks the pressure levels where temperatures fall below C. Across all seasons, the globally averaged ICNC from the simulation with BC treated as INPs (red solid line) is consistently higher than that from the simulation without BC (blue solid line) in the upper troposphere, particularly within regions colder than −40 °C. This confirms the widespread enhancement effect of ICNC by BC seen in panel (b). The maximum difference between the BC and noBC simulations occurs near 250 hPa, which also corresponds well with the zonal-mean maxima shown in panel (b). This pressure level is associated with a global-mean temperature of approximately −40 to −60 °C, a range that is optimal for cirrus cloud formation.
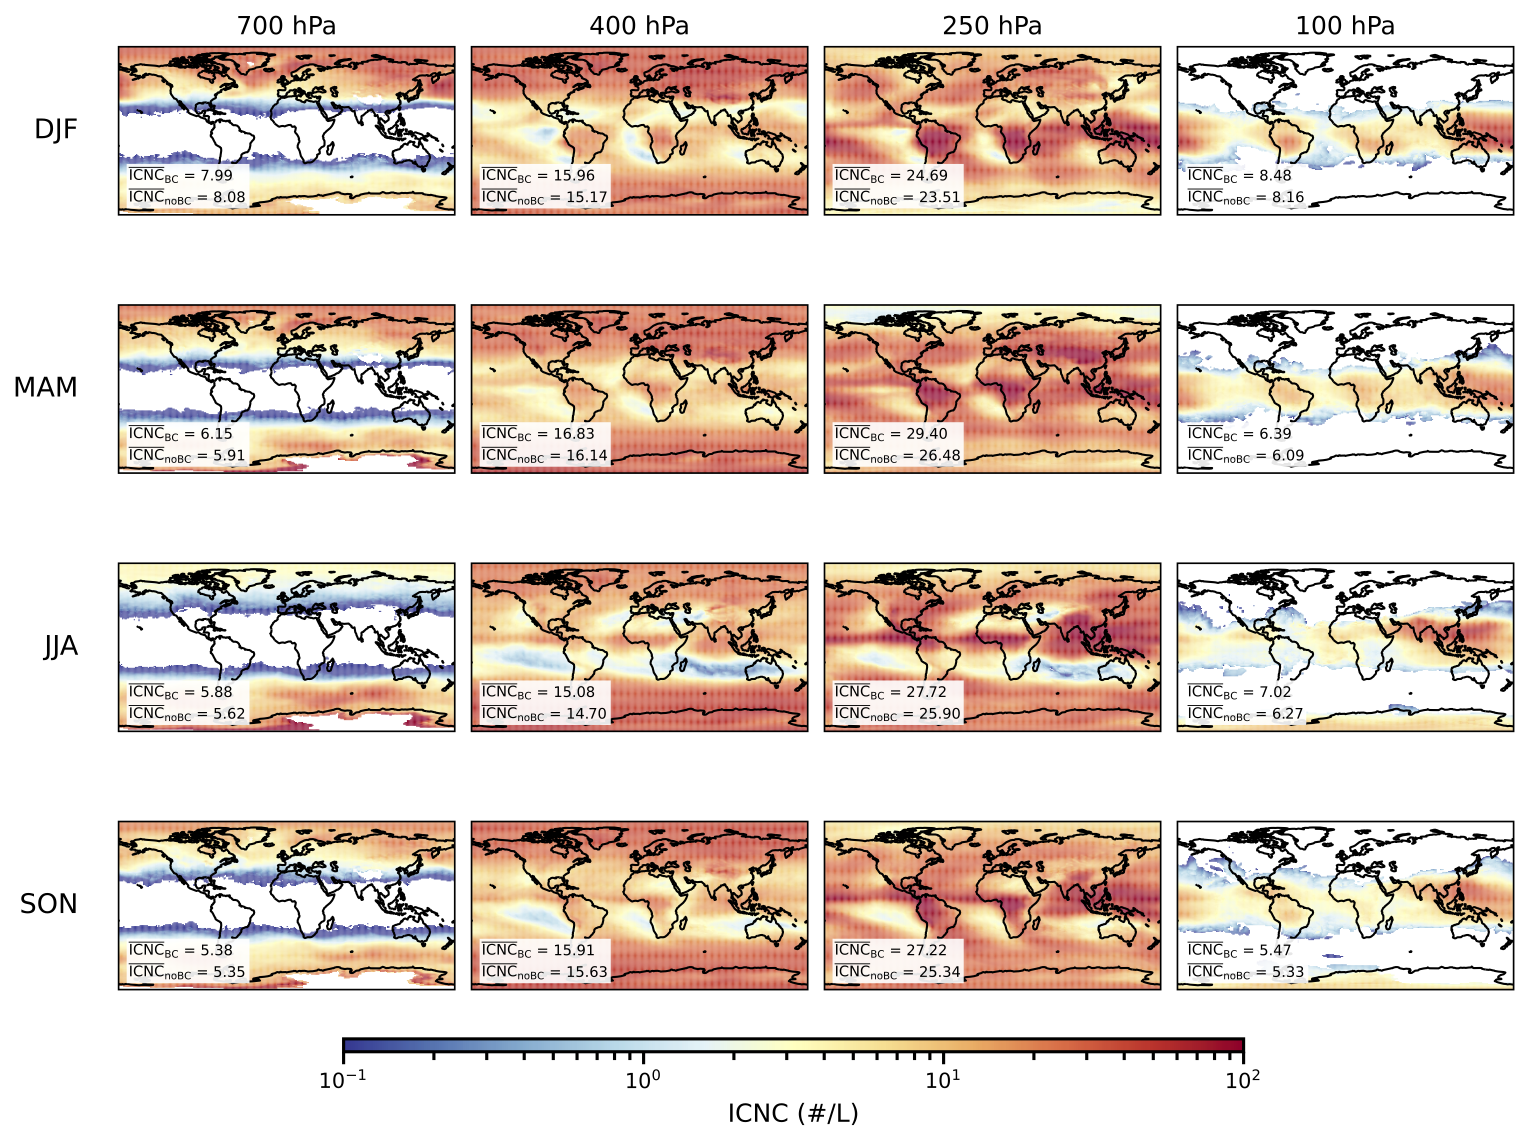
Figure 5Seasonal global maps of ICNC at various pressure levels, from AM4-MG2 simulations where BC is treated as INPs. Text inset on each map provides the area-weighted global mean ICNC (L−1) for simulations with and without BC as INPs at the certain pressure level.
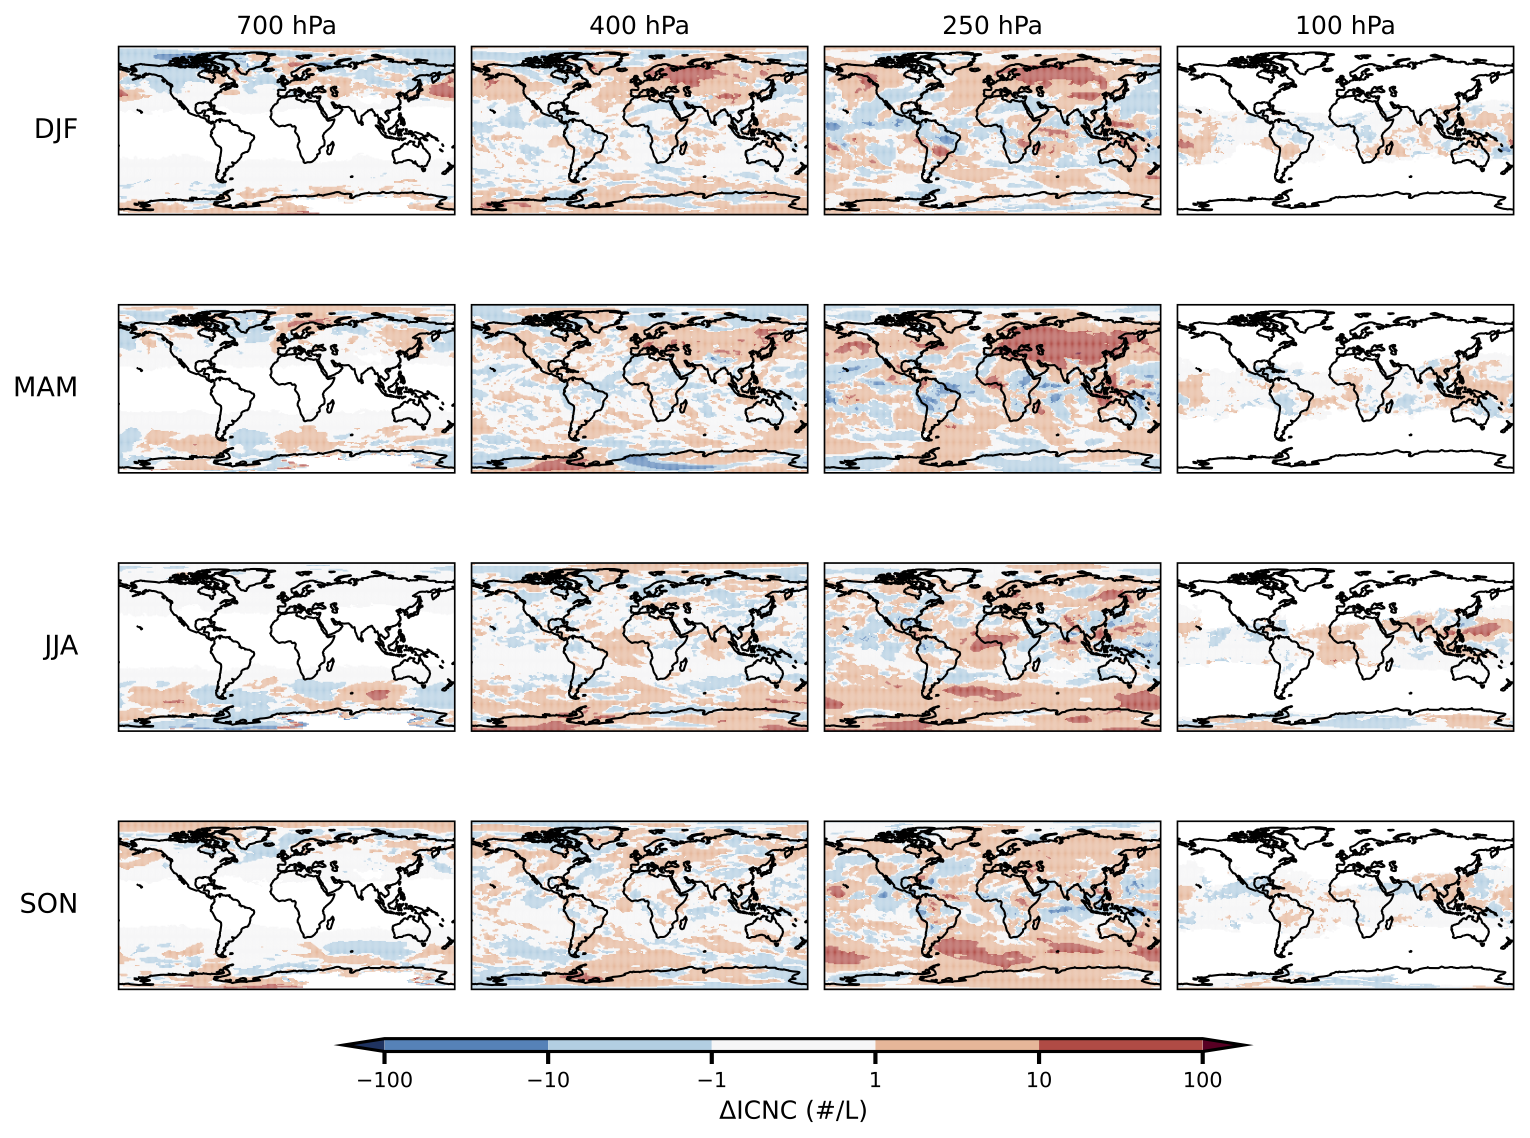
Figure 6Difference in ICNC (L−1) between simulations with and without BC as INPs (ΔICNC = ICNCBC − ICNCnoBC) at different pressure levels and seasons.
3.2.3 Geographical distribution and regional hotspots
Figures 5 and 6 present the geographical distribution of ICNC and the BC-induced ICNC change (ΔICNC), respectively, at selected pressure levels for different seasons. The inset text on each map in Fig. 5 displays the area-weighted global mean ICNC for simulations with and without BC as INPs, offering a quantitative comparison. Consistent with the previous zonal mean analysis, these maps confirm that the global mean ICNC peaks around the 250 hPa pressure level across all seasons, with average concentrations around 25 L−1 and local concentrations reaching up to approximately 100 L−1. The geographical enhancement due to BC, illustrated in Fig. 6, reveals that its impact is highly regional and strongly influenced by specific meteorological systems. In the Northern Hemisphere, the most pronounced enhancement occurs during the MAM season, across extensive regions of Eurasia and the Maritime Continent. In these regions, the enhancement exceeds 10 L−1, and the relative enhancement can locally surpass 50 %, consistent with the zonal mean analysis in Fig. 4. In the Southern Hemisphere, a distinct pattern emerges during the SON season, where a significant enhancement appears over South America and the adjacent South Atlantic Ocean, extending into the Southern Ocean. Here, the relative increase in ICNC also locally exceeds 50 %.
3.3 Case studies: analysis of cloud ice formation in selected regions
This section provides a detailed analysis of cloud ice formation in two regions: the Tibetan Plateau and the South American Outflow Region. These regions were selected because they represent the hotspots of BC-induced ice nucleation enhancement in the Northern and Southern Hemispheres, respectively. By focusing on these climatically and geographically distinct regions, we can assess how the impact of BC on cloud ice formation is modulated by different seasonal aerosol regimes and atmospheric conditions.
3.3.1 Tibetan Plateau
The first region selected for detailed analysis is the Tibetan Plateau (TP), which spans approximately from 25 to 45° N latitude and 65 to 105° E longitude. The TP is a critical region for climate research because it serves as the ”Water Tower of Asia”, strongly influences regional climate, and is experiencing accelerated warming at nearly twice the global average (Liu and Chen, 2000; Wei et al., 2025). During the Spring (March–April–May, MAM) season, the TP lies within the most prominent regions of BC-induced ICNC enhancement in the Northern Hemisphere, as identified in Fig. 6. These factors underscore the importance of studying its cloud and ice processes, which are explored in detail in Fig. 7.
Figure 7a presents the spatial distribution of ICNC over the TP during the MAM season at various pressure levels. The top row shows that the highest ICNC values in the BC-included simulation are concentrated over the plateau at mid-to-upper tropospheric levels (e.g., 400 and 250 hPa), with values approaching 100 L−1. The impact of BC is quantified in the subsequent rows. The absolute difference (ΔICNC, middle row) reveals that the BC-induced enhancement is most prominent over the northern and central parts of the plateau, with increases exceeding 20 L−1 in some areas around 250 hPa. This corresponds well with the regions of high background ICNC. The relative enhancement (, bottom row) further highlights this impact, showing that BC can increase the local ICNC by over 50 % across large areas of the plateau.
The seasonal evolution of these processes, spatially averaged over the TP, is detailed in the time series plots in Fig. 7. The simulated mean ICNC (Fig. 7b, blue line) exhibits a broad seasonal high with a bimodal structure: a first peak in spring (MAM) and a second in summer (JJA). Crucially, the ice water path (IWP, Fig. 7d) follows this same bimodal pattern, confirming that the changes in crystal number translate directly to changes in total ice mass. This bimodal structure appears to be driven by the sequential influence of the two dominant aerosol types shown in Fig. 7c. The first ICNC and IWP peak aligns with the peak in dust concentration during the pre-monsoon spring, while the second aligns with the peak in BC concentration during the summer monsoon.
Interestingly, the impact of BC on ICNC (ΔICNC, green line in Fig. 7b) is strongest during the first ICNC peak in April, which coincides with the seasonal maximum in IWP, not during the summer when BC concentrations are highest. This indicates that the peak enhancement from BC is not driven by its maximum concentration alone, but rather by the optimal overlap of multiple factors in spring: (1) thermodynamic environment that strongly favors ice nucleation, with rising water vapor and cold atmospheric temperatures; (2) a competitive aerosol regime with a relatively sufficient amount of BC compared to dust, which allows BC to act as an effective INP without being completely out-competed for available water vapor by the more abundant dust particles. Together, these conditions enable BC to exert a stronger influence on the total ice crystal population in April.
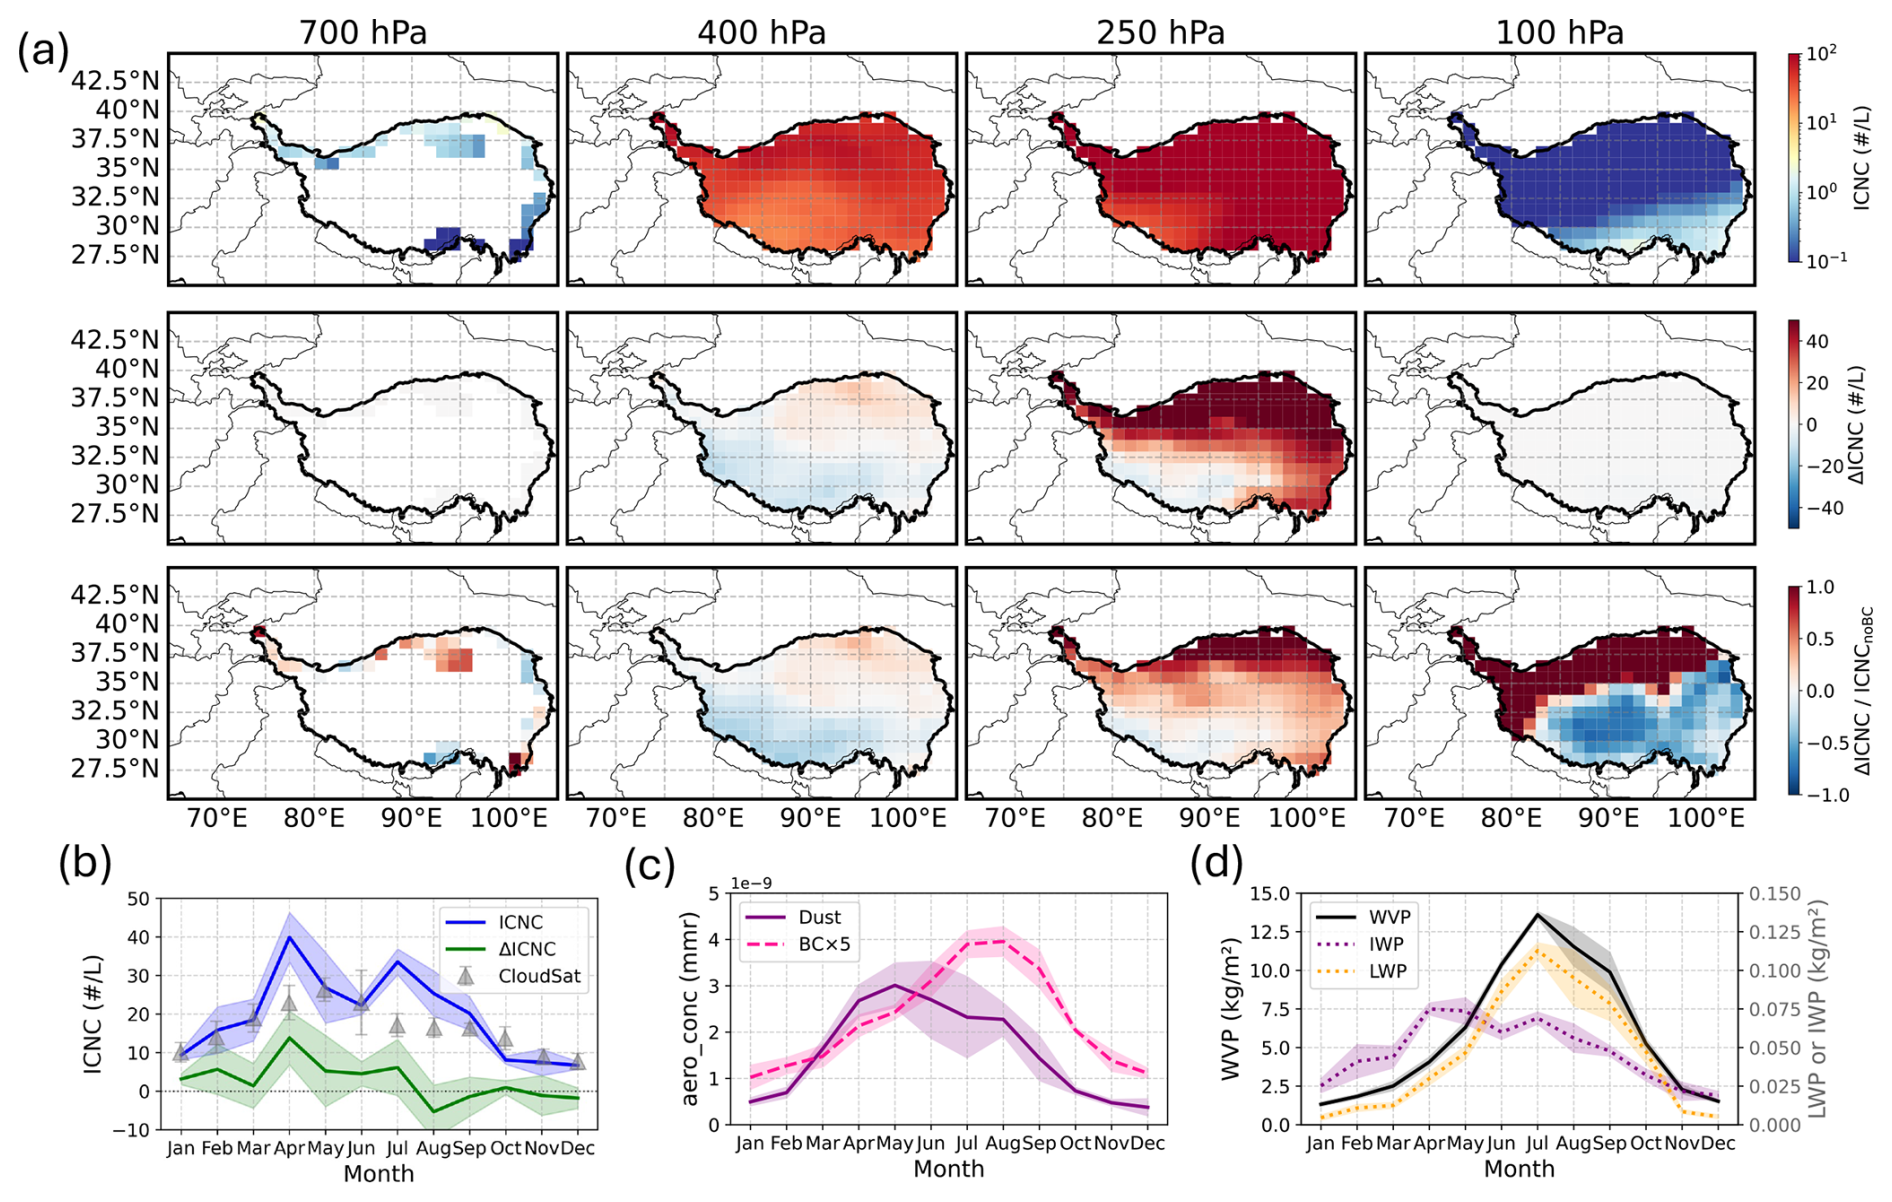
Figure 7(a) Spatial distribution of ICNC during the spring (MAM) season over the Tibetan Plateau (TP). The first row shows the ICNC from the simulation including BC as INPs at various pressure levels. The second row displays the absolute difference in ICNC (ΔICNC) between the simulations with and without BC as INPs. The third row illustrates the relative enhancement due to BC, calculated as . In all maps, the TP region is outlined by a thick black boundary. (b) Seasonal cycle of mean ICNC (blue line) and the mean change due to BC INPs (ΔICNC, green line), spatially averaged over the TP and vertically averaged over altitudes where ice exists. The gray triangles show ICNC values from CloudSat averaged over 14 years reported by Chen et al. (2024). (c) Seasonal cycle of aerosol mass mixing ratios (mmr) averaged over the TP between 700 and 100 hPa. The solid purple line shows the dust concentration, while the dashed pink line shows the BC concentration. Note that the BC concentration has been multiplied by a factor of 5 for improved visibility. (d) Seasonal cycle of column-integrated water path variables averaged over the TP. The plot shows the water vapor path (WVP, solid black line), ice water path (IWP, dotted purple line), and liquid water path (LWP, dotted orange line). Shaded regions in (b), (c) and (d) represent the standard deviation (±1σ) for each variable.
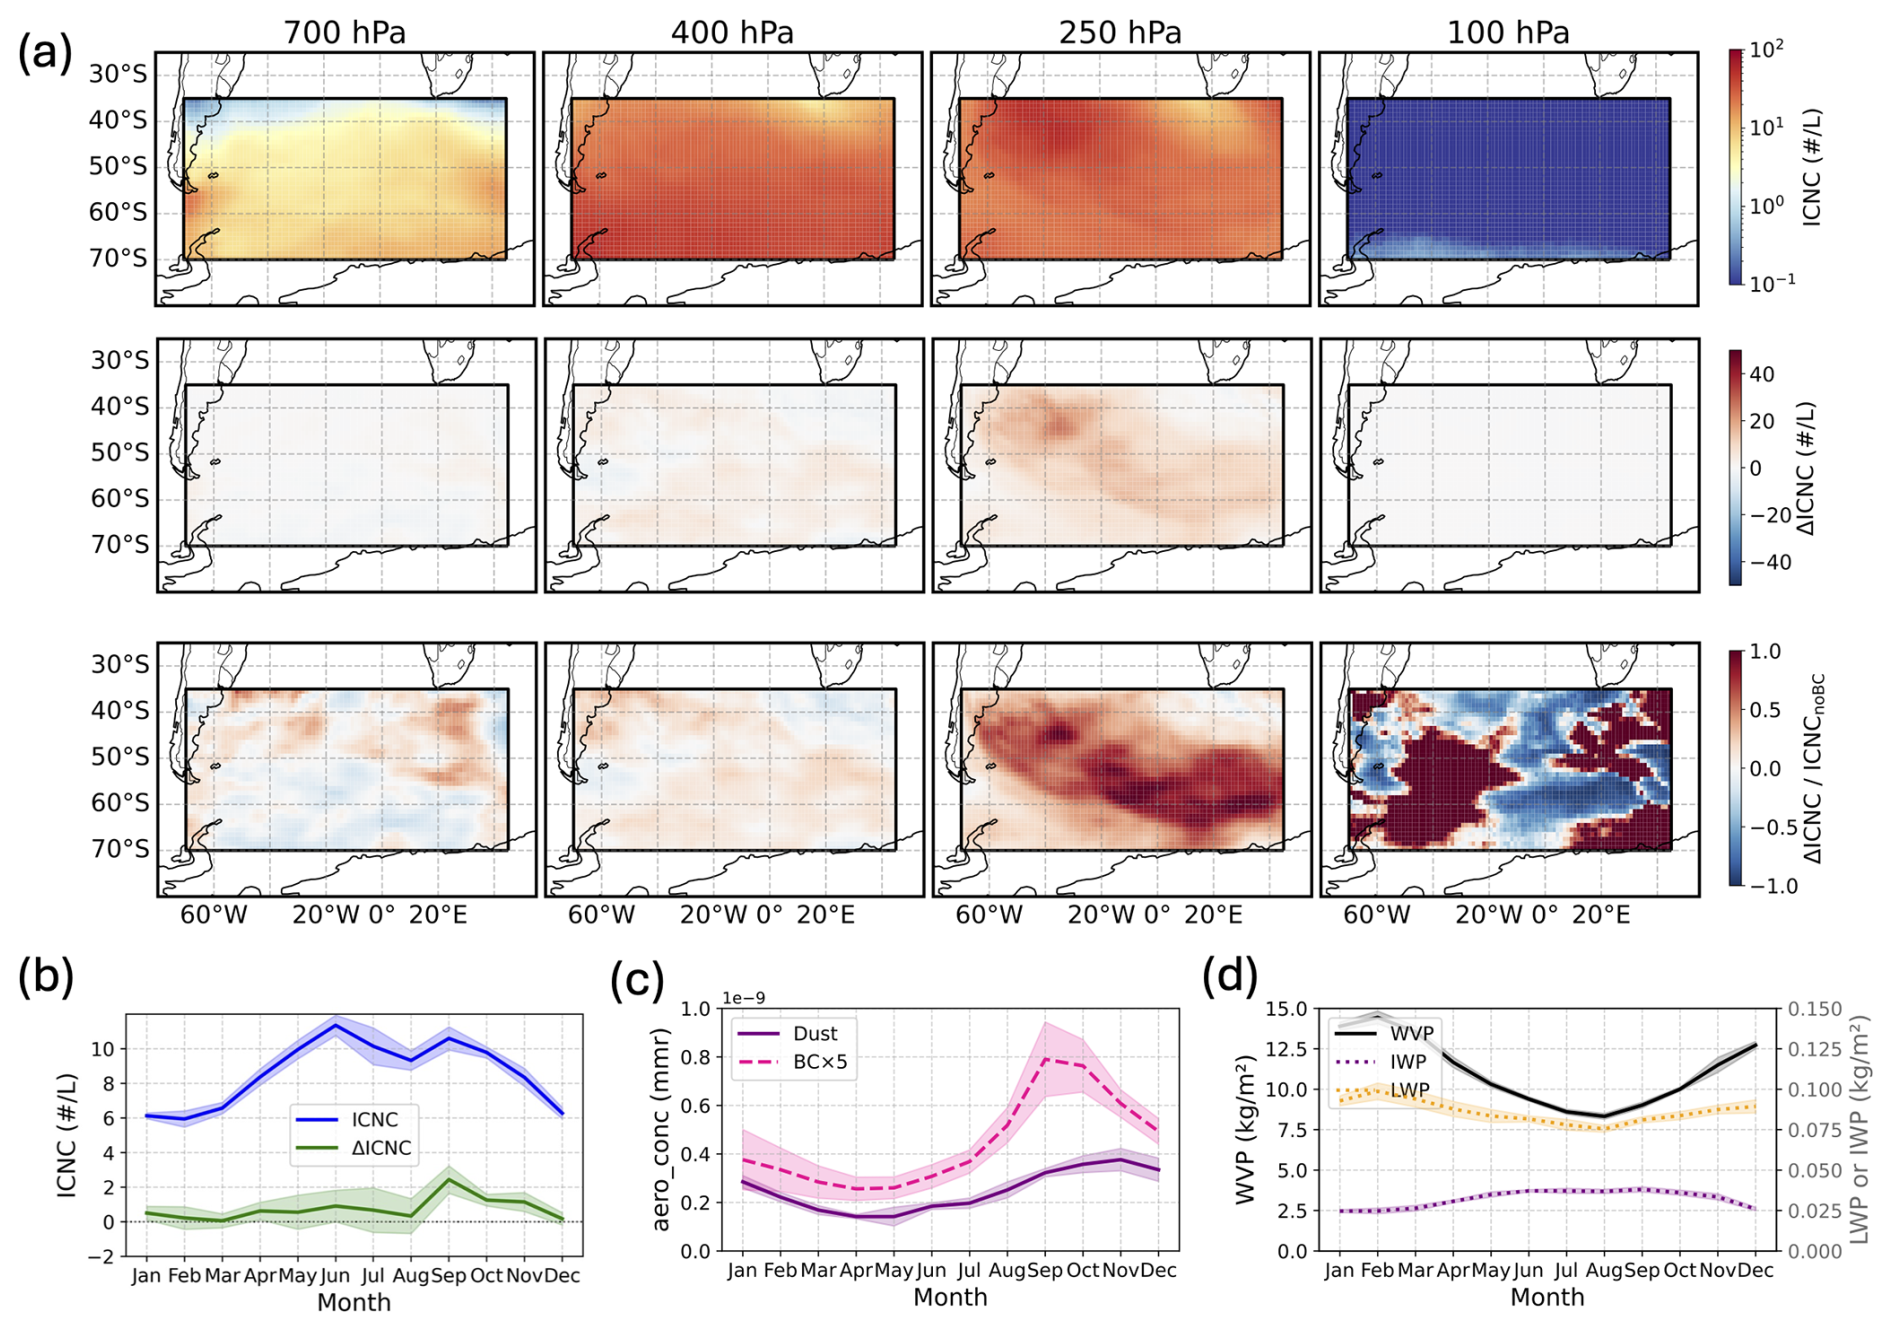
Figure 8(a) Spatial distribution of ICNC during the austral spring (SON) season over the South American outflow region (SAOR). The first row shows the ICNC from the simulation including BC as INPs at various pressure levels. The second row displays the absolute difference in ICNC (ΔICNC) between the simulations with and without BC as INPs. The third row illustrates the relative enhancement due to BC, calculated as . In all maps, the SAOR region is outlined by a thick black boundary. (b) Seasonal cycle of mean ICNC (blue line) and the mean change due to BC INPs (ΔICNC, green line), spatially averaged over the SAOR and vertically averaged over altitudes where ice exists. (c) Seasonal cycle of aerosol mass mixing ratios (mmr) averaged over the SAOR between 700 and 100 hPa. The solid purple line shows the dust concentration, while the dashed pink line shows the BC concentration. Note that the BC concentration has been multiplied by a factor of 5 for improved visibility. (d) Seasonal cycle of column-integrated water path variables averaged over SAOR. The plot shows the water vapor path (WVP, solid black line), ice water path (IWP, dotted purple line), and liquid water path (LWP, dotted orange line). Shaded regions in (b), (c) and (d) represent the standard deviation (±1σ) for each variable.
3.3.2 The South American outflow region
The second region chosen for analysis is the South American Outflow Region (SAOR), defined here from 35 to 75° S and 70° W to 45° E. This region is of particular interest as it is strongly influenced by seasonal biomass burning from the South American continent. As shown in Fig. 6, the SAOR is the most prominent area of BC-induced ICNC enhancement in the Southern Hemisphere, particularly during the austral spring (September–October–November, SON). The underlying processes are examined in Fig. 8.
Figure 8a illustrates the spatial characteristics of ICNC in the SAOR during the SON season. The highest ICNC values in the BC-included simulation are concentrated in a large plume extending from the coast of South America eastward over the South Atlantic Ocean (see also Fig. 5a), with the highest concentrations found around 250 and 400 hPa. The impact of BC is most evident in the relative enhancement (, bottom row), which shows a widespread increase of over 50 % across the core of the outflow plume at 250 hPa.
The seasonal cycle in the SAOR, spatially averaged, presents a distinct narrative from that of the TP. The simulated mean ICNC (Fig. 8b, blue line) exhibits a bimodal structure, with a first peak in the austral winter (June) and a second, sharper peak in the austral spring (September). This bimodal pattern is also reflected in the IWP (Fig. 8d). A key feature of this region, in contrast to the TP, is that the LWP is substantially larger than the IWP, indicating a persistent mixed-phase or predominantly liquid cloud environment. These two ICNC peaks appear to be driven by different dominant nucleation mechanisms. The first peak in June occurs when aerosol concentrations are at their annual minimum (Fig. 8c). This suggests that the high ICNC during this period is likely driven by homogeneous freezing of liquid droplets in a relatively clean, cold environment. The second peak in September, however, aligns perfectly with the dramatic seasonal peak in BC concentration from biomass burning. This indicates a shift to a regime where heterogeneous nucleation on BC particles becomes an important pathway for ice formation. The specific impact of BC (ΔICNC, green line in Fig. 8b) confirms this interpretation. The enhancement from BC is negligible during the winter but rises sharply to a maximum in September, perfectly in sync with the BC aerosol peak. This demonstrates that while the region supports ice formation year-round, the unique, additional contribution of BC is tightly controlled by the seasonal biomass burning cycle, temporarily making it the primary driver of heterogeneous ice nucleation in the region.
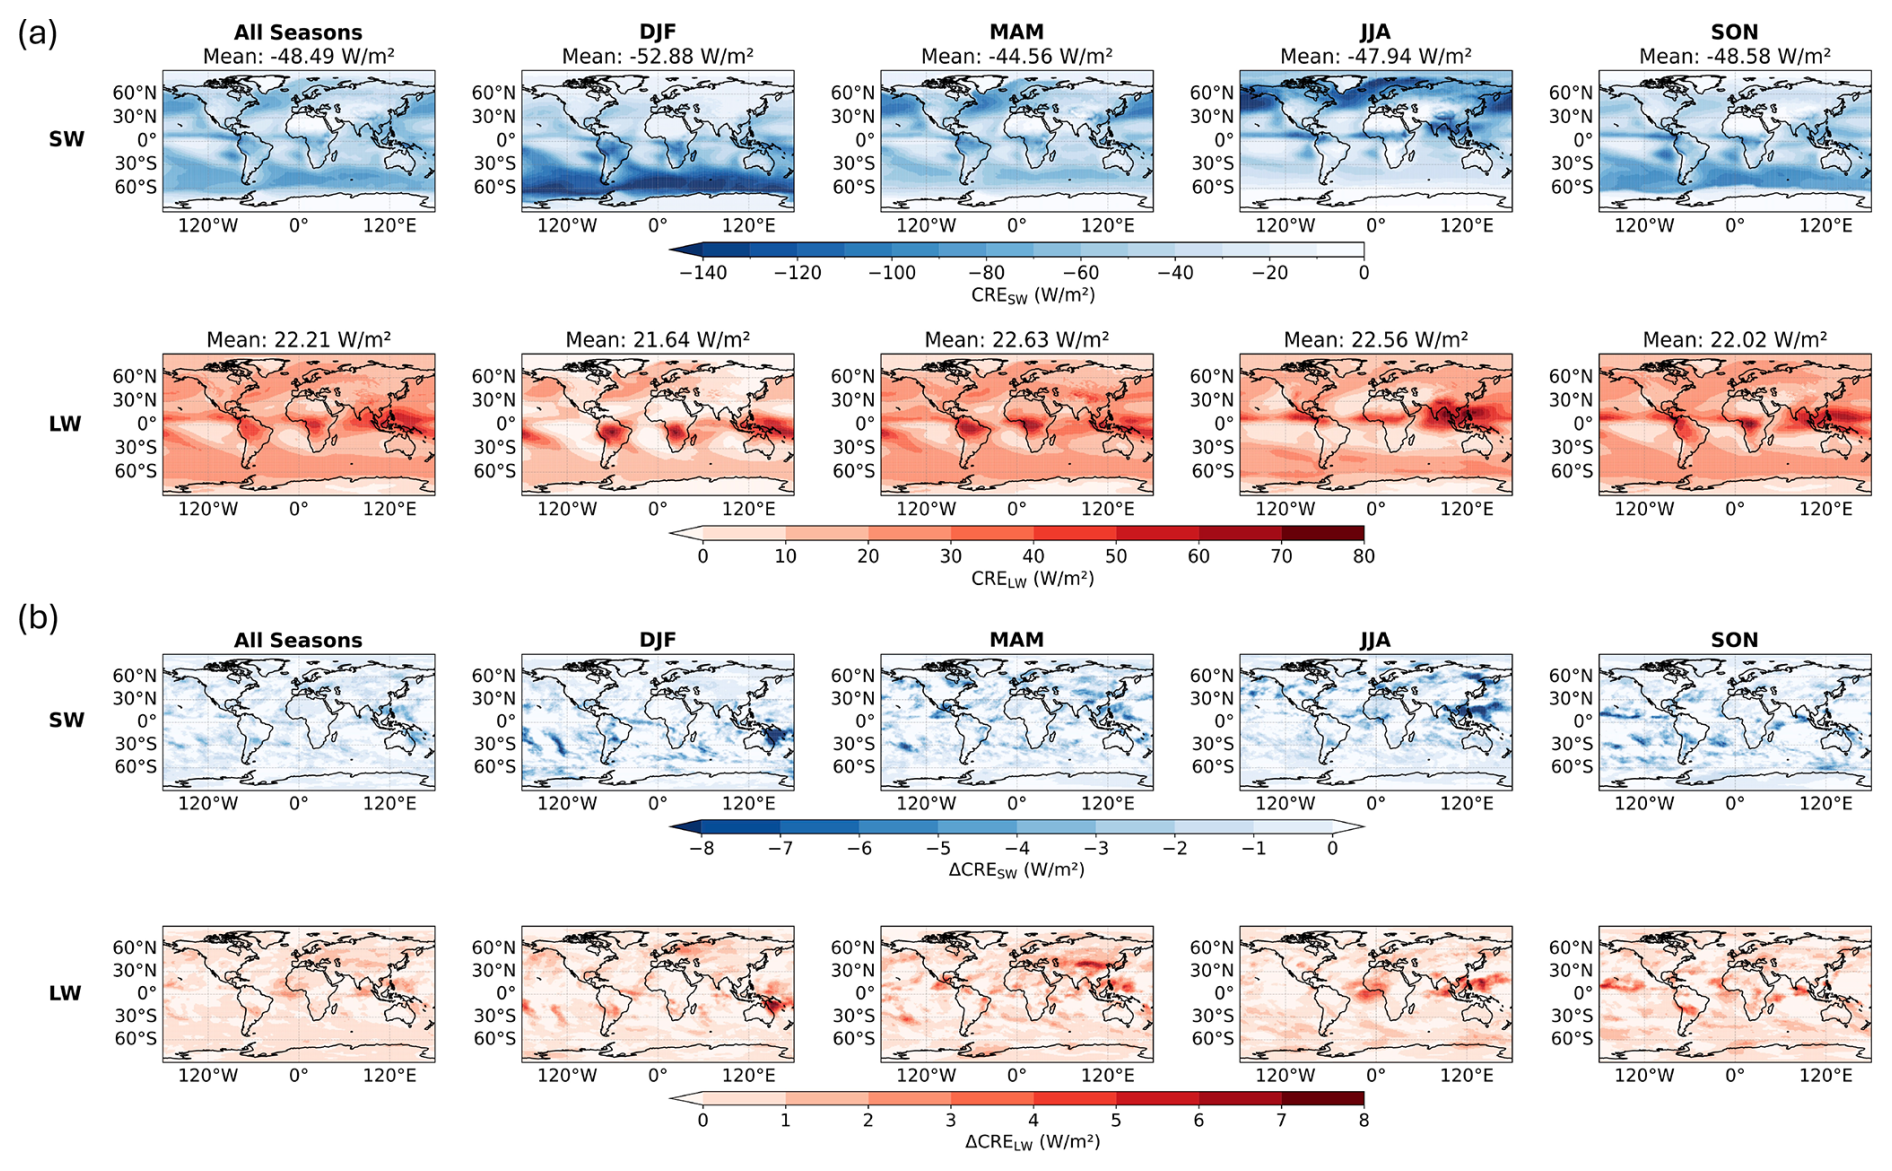
Figure 9Cloud Radiative Effect (CRE) and its response to BC as INPs at the top of the atmosphere (TOA) computed over 2001–2020. (a) Seasonal mean shortwave (CRESW, upper panel) and longwave (CRELW, lower panel) total cloud radiative effects from simulations that include BC INPs. Negative values (blue) indicate a net cooling effect by clouds, while positive values (red) indicate a net warming effect. (b) The difference in CRE (ΔCRE) caused by BC INPs, calculated as the difference between simulations with and without BC (ΔCRE = CREBC − CREnoBC). The upper and lower panels show the shortwave (ΔCRESW) and longwave (ΔCRELW) components, respectively. Here, negative values signify that BC enhances radiative cooling, while positive values signify an enhancement of radiative warming.
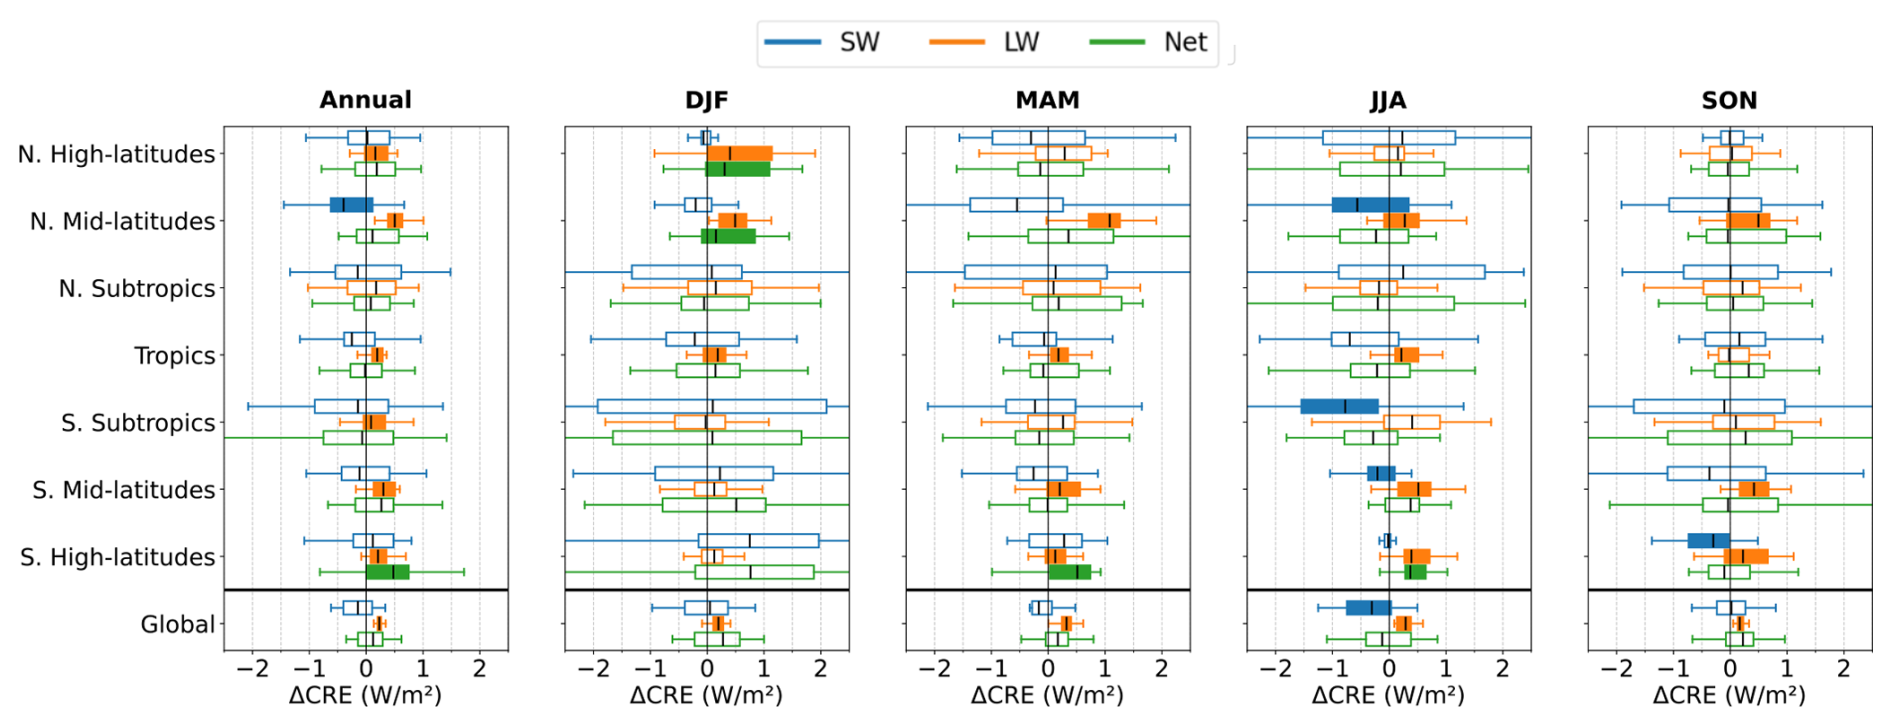
Figure 10Cloud Radiative Effect (CRE) and its response to BC as INPs at the top of the atmosphere (TOA) computed over 2001–2020. Box plots of annual and seasonal ΔCRE across different latitudinal regions, spatially averaged within each region and computed over a 20-year period. The regions shown are the N. High-latitudes (60–90° N), N. Mid-latitudes (35–60° N), N. Subtropics (23.5–35° N), Tropics (23.5° S–23.5° N), S. Subtropics (23.5–35° S), S. Mid-latitudes (35–60° S), S. High-latitudes (60–90° S), and the Global mean. Filled boxplots indicate that the mean ΔCRE is statistically significant different from 0 (p<0.05).
3.4 Impact on radiation
As noted in Methodology Sect. 2.2.3, some previous studies noted that radiation-related variables, such as the cloud radiative effect (CRE), might exhibit noisy spatial patterns and require longer integrations to reduce them (Loeb et al., 2018, 2009). Hence, for cloud radiative effect analysis in this section, we extended our simulation from 2005 to 2020 and analyzed both the radiation results from 2000–2005 and 2000–2020 as a comparison. This analysis was performed to examine both the sensitivity of the radiation statistics to the length of the analysis period and the robustness of our conclusions regarding statistical significance. In this section, the radiation results presented will be from the 20-year simulation (2000–2020), unless otherwise noted. The 5-year default analysis is shown in Supplement Figs. S14 and S15, and will be discussed in brackets when presenting the 20-year results. As will be shown, the 5-year and 20-year analyses yield consistent results, although the 20-year data show greater variability.
Figure 9a shows the geographical distribution of simulated seasonal and annual mean total cloud radiative effect (CRE), separated into its shortwave (CRESW) and longwave (CRELW) components at the top of the atmosphere (TOA) over 2001–2020 (see Fig. S14a for 2001–2005). The CRE is calculated as the difference between clear-sky and all-sky radiative fluxes at the top of the atmosphere. Specifically, CRESW is defined as the difference between clear-sky and all-sky upwelling shortwave radiation (swuptoa,clr − swup), where negative values indicate a cooling effect from clouds reflecting incoming solar radiation. CRELW is defined as the difference in outgoing longwave radiation (olrclr − olr), where positive values represent a warming effect due to clouds trapping outgoing longwave radiation. As shown in Fig. 9a, CRESW is negative globally, indicating a cooling effect from cloud-reflected solar radiation. This effect is most pronounced over the midlatitude storm tracks and tropical convective regions, with an annual global mean of −48.49 W m−2 (5-year: −48.61 W m−2). Strong seasonal variability is observed, with the greatest cooling occurring during DJF season, reaching −52.88 W m−2 (5-year: −52.92 W m−2). In contrast, CRELW is consistently positive, signifying a warming effect. This warming is strongest over regions with extensive high-altitude cloud cover, such as the tropical warm pool. The annual global mean CRELW is 22.21 W m−2 (5-year: 22.29 W m−2), with minimal seasonal variation. We note that compared with observations, the model exhibits systematic biases, producing a weaker global mean LW CRE and a stronger SW CRE as documented in Guo et al. (2025). Despite these biases, the 5-year and 20-year simulations show consistent results, differing only slightly.
Figure 9b illustrates the impact of BC as INPs on CRE, quantified as ΔCRE = CREBC − CREnoBC over 2001–2020 (see Fig. S14b for 2001–2005). A negative ΔCRESW means that BC INPs enhance the cloud cooling effect from solar reflection, while a positive ΔCRELW indicates an enhanced warming effect from trapping longwave radiation. The spatial patterns of maximum longwave warming (ΔCRELW) and maximum shortwave cooling (ΔCRESW) are highly correlated. These regions of strong radiative response directly correspond with the areas showing the largest change in ICNC, as presented in Fig. 6. This collocation provides a consistent signal linking the impact of BC on cloud microphysics to the subsequent changes in radiative properties. The strongest effects occur at the previously identified ICNC hotspots, where BC-induced cloud radiative cooling can exceed −8 W m−2 (5-year: −10 W m−2), and localized warming can reach +8 W m−2 (5-year: +10 W m−2).
A statistical analysis of the regional and seasonal ΔCRE is shown in Fig. 10 (see Fig. S15 for 2001–2005). The globe is divided into seven latitude bands: Northern High Latitudes (60–90° N), Northern Midlatitudes (35–60° N), Northern Subtropics (23.5–35° N), Tropics (23.5° S–23.5° N), Southern Subtropics (23.5–35° S), Southern Midlatitudes (35–60° S), and Southern High Latitudes (60–90° S). For each band, the radiation data are first spatially averaged by month and then aggregated by season. Boxplots illustrate the distribution of the seasonally and spatially averaged annual ΔCRE in the shortwave (blue), longwave (orange), and net (green) components. Filled boxplots indicate that the mean ΔCRE is statistically significant different from zero (p<0.05). As indicated in Fig. 10, although the cloud radiative effect induced by BC INPs (ΔCRE) is subject to the well-documented uncertainties of aerosol-cloud interactions, our simulations reveal several statistically significant patterns. Globally, the longwave component (ΔCRELW) shows a consistent warming signal that is statistically significant across all seasons. This longwave component results in an annual global mean warming of 0.24 ± 0.06 W m−2 (5-year: 0.23 ± 0.04 W m−2), with seasonal means of 0.19, 0.31, 0.27, and 0.18 W m−2 (5-year: 0.21, 0.30, 0.23, 0.18 W m−2) for DJF, MAM, JJA, and SON, respectively. On a global scale, the short- and long-wave radiative effects due to BC-nucleated ice crystals nearly cancel over an annual cycle. In contrast, distinct regional patterns emerge for the net effect, particularly in the high latitudes. A key finding is the statistically significant net warming effect induced by BC INPs (ΔCREnet>0, p<0.05) that occurs during the polar winter of each hemisphere (consistent with the 5-year analysis). In the Northern High Latitudes (N. High-latitudes) during the DJF season, the positive ΔCRELW (warming) outweighs the negative ΔCRESW (cooling) (consistent with the 5-year analysis). Similarly, in the Southern High Latitudes (S. High-latitudes) during the JJA season, a statistically significant net warming is also observed (consistent with the 5-year analysis). These findings highlight the importance of BC as INPs in modulating the polar climate, particularly during the coldest and darkest seasons. Detailed spatial patterns of the relative changes in CRESW and CRELW, as well as the net CRE difference induced by BC INPs (ΔCREnet), are presented in Figs. S16 and S17.
The role of soot as INPs in cirrus cloud formation has been a long-standing source of uncertainty, complicating efforts to accurately represent aerosol-cloud interactions in climate models. This study employed a dual-scale modeling approach, combining detailed process-level simulations from a cloud parcel model with global simulations from the AM4-MG2 climate model, to systematically investigate the competitive ice nucleation between dust and BC and quantify its large-scale impacts.
Our parcel model simulations, spanning over 5 million unique scenarios, revealed that the competition between dust and BC is a complex function of the full thermodynamic state and aerosol loading. We found that BC is a more effective INP at warmer cirrus temperatures (T>215 K), while dust dominates at colder temperatures (T<210 K), a behavior consistent with the temperature-dependent active site densities of each species. The relative importance of each INP type is determined by a sensitive interplay between their mass ratio, the updraft velocity, and the ambient pressure, which modulates water vapor availability and thus the competitive balance.
When these process-level insights were incorporated into the AM4-MG2 climate model, the resulting simulations of ICNC showed strong agreement with in-situ and satellite-derived climatologies. While treating BC as INPs resulted in a modest global annual mean ICNC increase of approximately 5 %, its impact was highly concentrated in specific regions and seasons, with local enhancements exceeding 90 %. Significant “hotspots” of BC-induced ICNC enhancement were identified over extensive regions of Eurasia and the Maritime Continent during the Northern Hemisphere spring (MAM), and over South America and the South Atlantic during the Southern Hemisphere spring (SON). Our analysis of these regions, particularly the Tibetan Plateau and the South American biomass burning outflow, confirmed that these enhancements are driven by the seasonal overlap of high BC concentrations with favorable meteorological conditions.
The climatic consequences of these microphysical changes are significant. The inclusion of BC as INPs produces a statistically significant global annual mean longwave cloud radiative warming of W m−2. This warming is not uniformly distributed but is most pronounced in the regional ICNC enhancement hotspots. Notably, our results show a statistically significant net warming in the high latitudes during their respective polar winters.
In summary, this work demonstrates that while dust remains a critical INP, soot from sources such as biomass burning and fossil fuel combustion plays a significant and geographically distinct role in cirrus formation and regional climate than is often assumed. The findings underscore the necessity of moving beyond simplified parameterizations and incorporating detailed, process-based representations of aerosol competition in ice nucleation into climate models. Accurately capturing the effects of BC as an INP is crucial for understanding regional climate dynamics and for projecting the future climate impacts of rising wildfire emissions and other anthropogenic aerosol sources. It should also be noted that other parameterizations for the ice-nucleating ability of dust and soot exist beyond those applied in this study, and alternative formulations may yield different results. Future collaborative efforts to intercompare parameterizations and quantify their impacts on simulated cirrus properties would therefore be valuable. Moreover, recent studies suggest that sulfate (Bertozzi et al., 2024), sea salt (DeMott et al., 2016; Wagner et al., 2018), organics (Li et al., 2024; Wolf et al., 2020), and nitrate (Wagner et al., 2020) aerosols may also act as effective INPs at cirrus conditions promoting heterogeneous ice nucleation. A more comprehensive evaluation of different parameterization schemes incorporating these additional aerosol species would be beneficial in future studies.
The AM4-MG2 source code used in this study can be found at https://github.com/NOAA-GFDL/AM4/tree/MG2_xanadu_2020.02.01 (last access: 22 December 2025) and is also archived at https://doi.org/10.5281/zenodo.4313356 (Guo et al., 2020). The data presented in this study are available upon request by email (contact: Xiaohan Li, xiaohanl@princeton.edu).
The supplement related to this article is available online at https://doi.org/10.5194/acp-26-95-2026-supplement.
XL: Conceptualization, Methodology, Investigation, Formal Analysis, Software, Data Curation, Visualization, Writing. SF: Supervision, Conceptualization, Methodology, Software, Data Curation, Review and Editing. HG: Conceptualization, Methodology, Software, Review and Editing. PG: Supervision, Conceptualization, Review and Editing.
The contact author has declared that none of the authors has any competing interests.
Publisher's note: Copernicus Publications remains neutral with regard to jurisdictional claims made in the text, published maps, institutional affiliations, or any other geographical representation in this paper. The authors bear the ultimate responsibility for providing appropriate place names. Views expressed in the text are those of the authors and do not necessarily reflect the views of the publisher.
This research was supported by the National Oceanic and Atmospheric Administration, U.S. Department of Commerce under Award NA23OAR4320198. The statements, findings, conclusions, and recommendations are those of the authors and do not necessarily reflect the views of the National Oceanic and Atmospheric Administration, or the U.S. Department of Commerce. The authors would like to thank Fabien Paulot, Larry Horowitz, John Dunne, Ming Zhao, Jing Feng and two anonymous reviewers for insightful suggestions and discussions on this manuscript.
This research has been supported by the National Oceanic and Atmospheric Administration (grant no. NA23OAR4320198).
This paper was edited by Ivy Tan and reviewed by two anonymous referees.
Alexander, M. J. and Dunkerton, T. J.: A spectral parameterization of mean-flow forcing due to breaking gravity waves, Journal of the Atmospheric Sciences, 56, 4167–4182, https://doi.org/10.1175/1520-0469(1999)056<4167:ASPOMF>2.0.CO;2, 1999. a
Alpert, P. A. and Knopf, D. A.: Analysis of isothermal and cooling-rate-dependent immersion freezing by a unifying stochastic ice nucleation model, Atmos. Chem. Phys., 16, 2083–2107, https://doi.org/10.5194/acp-16-2083-2016, 2016. a, b
Barahona, D., Rodriguez, J., and Nenes, A.: Sensitivity of the global distribution of cirrus ice crystal concentration to heterogeneous freezing, Journal of Geophysical Research: Atmospheres, 115, D23213, https://doi.org/10.1029/2010JD014273, 2010. a
Barahona, D., Molod, A., and Kalesse, H.: Direct estimation of the global distribution of vertical velocity within cirrus clouds, Scientific Reports, 7, 6840, https://doi.org/10.1038/s41598-017-07038-6, 2017. a
Baran, A. J.: From the single-scattering properties of ice crystals to climate prediction: A way forward, Atmospheric Research, 112, 45–69, 2012. a
Beer, C. G., Hendricks, J., and Righi, M.: Impacts of ice-nucleating particles on cirrus clouds and radiation derived from global model simulations with MADE3 in EMAC, Atmos. Chem. Phys., 24, 3217–3240, https://doi.org/10.5194/acp-24-3217-2024, 2024. a, b
Bertozzi, B., Wagner, R., Höhler, K., Saathoff, H., Möhler, O., and Leisner, T.: Influence of the neutralization degree on the ice nucleation ability of ammoniated sulfate particles, Journal of Geophysical Research: Atmospheres, 129, e2023JD040078, https://doi.org/10.1029/2023JD040078, 2024. a, b
Bretherton, C. S., McCaa, J. R., and Grenier, H.: A new parameterization for shallow cumulus convection and its application to marine subtropical cloud-topped boundary layers, Part I: Description and 1D results, Mon. Weather Rev., 132, 864–882, https://doi.org/10.1175/1520-0493(2004)132<0864:ANPFSC>2.0.CO;2, 2004. a
Chen, J., Xu, J., Wu, Z., Meng, X., Yu, Y., Ginoux, P., DeMott, P. J., Xu, R., Zhai, L., Yan, Y., Zhao, C., Li, S. M., Zhu, T., and Hu, M.: Decreased dust particles amplify the cloud cooling effect by regulating cloud ice formation over the Tibetan Plateau, Science Advances, 10, eado0885, https://doi.org/10.1126/sciadv.ado0885, 2024. a
Cziczo, D. J., Froyd, K. D., Hoose, C., Jensen, E. J., Diao, M., Zondlo, M. A., Smith, J. B., Twohy, C. H., and Murphy, D. M.: Clarifying the dominant sources and mechanisms of cirrus cloud formation, Science, 340, 1320–1324, 2013. a, b
De La Torre Castro, E., Jurkat-Witschas, T., Afchine, A., Grewe, V., Hahn, V., Kirschler, S., Krämer, M., Lucke, J., Spelten, N., Wernli, H., Zöger, M., and Voigt, C.: Differences in microphysical properties of cirrus at high and mid-latitudes, Atmos. Chem. Phys., 23, 13167–13189, https://doi.org/10.5194/acp-23-13167-2023, 2023. a
Deboudt, K., Flament, P., Choël, M., Gloter, A., Sobanska, S., and Colliex, C.: Mixing state of aerosols and direct observation of carbonaceous and marine coatings on African dust by individual particle analysis, Journal of Geophysical Research: Atmospheres, 115, https://doi.org/10.1029/2010JD013921, 2010. a
DeMott, P. J., Hill, T. C. J., McCluskey, C. S., Prather, K. A., Collins, D. B., Sullivan, R. C., Ruppel, M. J., Mason, R. H., Irish, V. E., Lee, T., Hwang, C. Y., Rhee, T. S., Snider, J. R., McMeeking, G. R., Dhaniyala, S., Lewis, E. R., Wentzell, J. J. B., Abbatt, J., Lee, C., Sultana, C. M., Ault, A. P., Axson, J. L., Diaz Martinez, M., Venero, I., Santos-Figueroa, G., Stokes, M. D., Deane, G. B., Mayol-Bracero, O. L., Grassian, V. H., Bertram, T. H., Bertram, A. K., Moffett, B. F., and Franc, G. D.: Sea spray aerosol as a unique source of ice nucleating particles, Proceedings of the National Academy of Sciences, 113, 5797–5803, 2016. a, b
Donner, L. J., Wyman, B. L., Hemler, R. S., Horowitz, L. W., Ming, Y., Zhao, M., Golaz, J.-C., Ginoux, P., Lin, S.-J., Schwarzkopf, M. D., Austin, J., Alaka, G., Cooke, W. F., Delworth, T. L., Freidenreich, S. M., Gordon, C. T., Griffies, S. M., Held, I. M., Hurlin, W. J., Klein, S. A., Knutson, T. R., Langenhorst, A. R., Lee, H.-C., Lin, Y., Magi, B. I., Malyshev, S. L., Milly, P. C. D., Naik, V., Nath, M. J., Pincus, R., Ploshay, J. J., Ramaswamy, V., Seman, C. J., Shevliakova, E., Sirutis, J. J., Stern, W. F., Stouffer, R. J., Wilson, R. J., Winton, M., Wittenberg, A. T., and Zeng, F.: The dynamical core, physical parameterizations, and basic simulation characteristics of the atmospheric component AM3 of the GFDL global coupled model CM3, Journal of Climate, 24, 3484–3519, 2011. a
Fan, S., Knopf, D. A., Heymsfield, A. J., and Donner, L. J.: Modeling of aircraft measurements of ice crystal concentration in the Arctic and a parameterization for mixed-phase cloud, Journal of the Atmospheric Sciences, 74, 3799–3814, 2017. a, b, c, d
Fan, S., Ginoux, P., Seman, C. J., Silvers, L. G., and Zhao, M.: Toward improved cloud-phase simulation with a mineral dust and temperature-dependent parameterization for ice nucleation in mixed-phase clouds, Journal of the Atmospheric Sciences, 76, 3655–3667, 2019. a, b
Fu, Y., Chen, Y., Li, R., Qin, F., Xian, T., Yu, L., Zhang, A., Liu, G., and Zhang, X.: Lateral boundary of cirrus cloud from CALIPSO observations, Scientific reports, 7, 14221, https://doi.org/10.1038/s41598-017-14665-6, 2017. a
Gao, K., Zhou, C.-W., Meier, E. J. B., and Kanji, Z. A.: Laboratory studies of ice nucleation onto bare and internally mixed soot–sulfuric acid particles, Atmos. Chem. Phys., 22, 5331–5364, https://doi.org/10.5194/acp-22-5331-2022, 2022. a
Garner, S. T.: Ground-Truth Model Evaluation of Subgrid Orographic Base-Flux Parameterization, Journal of the Atmospheric Sciences, 75, 3653–3670, 2018. a
Gasparini, B. and Lohmann, U.: Why cirrus cloud seeding cannot substantially cool the planet, Journal of Geophysical Research: Atmospheres, 121, 4877–4893, 2016. a, b, c
Gettelman, A. and Morrison, H.: Advanced Two-Moment Bulk Microphysics for Global Models, Part I: Off-Line Tests and Comparison with Other Schemes, J. Climate, 28, 1268–1287, https://doi.org/10.1175/JCLI-D-14-00103.1, 2015a. a, b
Gettelman, A., Morrison, H., Santos, S., Bogenshutz, P., and Caldwell, P. M.: Advanced Two-Moment Bulk Microphysics for Global Models. Part II: Global Model solutions and Aerosol-Cloud Interactions, J. Climate, 28, 1288–1306, https://doi.org/10.1175/JCLI-D-14-00102.1, 2015b. a
Guo, H., Ming, Y., Fan, S., Zhou, L., Harris, L., Zhao, M., Robinson, T., and Ramirez, U.: NOAA-GFDL/AM4: MG Cloud Microphysics update with FMS 2020.02 (MG2_xanadu_2020.02.01), Zenodo [code], https://doi.org/10.5281/zenodo.4313356, 2020. a
Guo, H., Ming, Y., Fan, S., Zhou, L., Harris, L., and Zhao, M.: Two-Moment Bulk Cloud Microphysics With Prognostic Precipitation in GFDL's Atmosphere Model AM4.0: Configuration and Performance, Journal of Advances in Modeling Earth Systems, 13, e2020MS002453, https://doi.org/10.1029/2020MS002453, 2021. a, b, c
Guo, H., Ming, Y., Fan, S., Zhou, L., Harris, L., and Zhao, M.: Performance of Two-Moment Stratiform Microphysics With Prognostic Precipitation in GFDL’s CM4.0, Journal of Advances in Modeling Earth Systems, 13, e2022MS003111, https://doi.org/10.1029/2022MS003111, 2022. a, b
Guo, H., Silvers, L. G., Paynter, D., Dong, W., Fan, S.-M., Jing, X., Kramer, R. J., Rand, K., Suzuki, K., Zhang, Y., and Zhao, M.: Assessing clouds in GFDL’s AM4.0 with different microphysical parameterizations using the satellite simulator package COSP, Earth and Space Science, 12, e2024EA004053, https://doi.org/10.1029/2024EA004053, 2025. a, b
Harris, L., Zhou, L., Chen, X., and Chen, J.-H.: The GFDL Finite-Volume Cubed-Sphere Dynamical Core, NOAA Technical Memorandum, OAR GFDL, Princeton, NJ, https://doi.org/10.25923/7h88-c534, 2020. a
Heymsfield, A. J., Schmitt, C., and Bansemer, A.: Ice cloud particle size distributions and pressure-dependent terminal velocities from in situ observations at temperatures from 0 to -86 °C, Journal of the Atmospheric Sciences, 70, 4123–4154, 2013. a, b
Heymsfield, A. J., Krämer, M., Luebke, A., Brown, P., Cziczo, D. J., Franklin, C., Lawson, P., Lohmann, U., McFarquhar, G., Ulanowski, Z., and Van Tricht, K.: Cirrus clouds, Meteorological Monographs, 58, 2–1, 2017. a, b, c
Hoose, C. and Möhler, O.: Heterogeneous ice nucleation on atmospheric aerosols: a review of results from laboratory experiments, Atmos. Chem. Phys., 12, 9817–9854, https://doi.org/10.5194/acp-12-9817-2012, 2012. a, b, c, d, e, f
Kärcher, B.: Cirrus clouds and their response to anthropogenic activities, Current Climate Change Reports, 3, 45–57, 2017. a
Kärcher, B. and Lohmann, U.: A parameterization of cirrus cloud formation: Heterogeneous freezing, Journal of Geophysical Research: Atmospheres, 108, https://doi.org/10.1029/2002JD003220, 2003. a
Krämer, M., Rolf, C., Spelten, N., Afchine, A., Fahey, D., Jensen, E., Khaykin, S., Kuhn, T., Lawson, P., Lykov, A., Pan, L. L., Riese, M., Rollins, A., Stroh, F., Thornberry, T., Wolf, V., Woods, S., Spichtinger, P., Quaas, J., and Sourdeval, O.: A microphysics guide to cirrus – Part 2: Climatologies of clouds and humidity from observations, Atmos. Chem. Phys., 20, 12569–12608, https://doi.org/10.5194/acp-20-12569-2020, 2020. a, b, c, d
Kärcher, B., DeMott, P., Jensen, E., and Harrington, J.: Studies on the competition between homogeneous and heterogeneous ice nucleation in cirrus formation, Journal of Geophysical Research: Atmospheres, 127, e2021JD035805, https://doi.org/10.1029/2021JD035805, 2022. a, b
Koop, T., Luo, B., Tsias, A., and Peter, T.: Water activity as the determinant for homogeneous ice nucleation in aqueous solutions, Nature, 406, 611–614, 2000. a, b
Kristjansson, J. E., Edwards, J. M., and Mitchell, D. L.: Impact of a new scheme for optical properties of ice crystals on climates of two GCMs, J. Geophys. Res., 105, 10063–10079, 2000. a
Kulkarni, G., China, S., Liu, S., Nandasiri, M., Sharma, N., Wilson, J., Aiken, A. C., Chand, D., Laskin, A., Mazzoleni, C., Pekour, M., Shilling, J., Shutthanandan, V., Zelenyuk, A., and Zaveri, R. A.: Ice nucleation activity of diesel soot particles at cirrus relevant temperature conditions: Effects of hydration, secondary organics coating, soot morphology, and coagulation, Geophysical Research Letters, 43, 3580–3588, 2016. a
Li, X. and Bourg, I. C.: Microphysics of liquid water in sub-10 nm ultrafine aerosol particles, Atmos. Chem. Phys., 23, 2525–2556, https://doi.org/10.5194/acp-23-2525-2023, 2023a. a
Li, X. and Bourg, I. C.: Phase state, surface tension, water activity, and accommodation coefficient of water–organic clusters near the critical size for atmospheric new particle formation, Environmental Science and Technology, 57, 13092–13103, 2023b. a
Li, X. and Bourg, I. C.: Hygroscopic Growth of Adsorbed Water Films on Smectite Clay Particles, Environmental Science and Technology, 58, 1109–1118, 2024. a
Li, X. and Ginoux, P.: An empirical parameterization to separate coarse and fine mode aerosol optical depth over land, Geophysical Research Letters, 52, e2024GL114397, https://doi.org/10.1029/2024GL114397, 2025. a
Li, X., Wolf, M., Shen, X., Steinke, I., Lai, Z., Niu, S., China, S., Shrivastava, M., Zhang, Z., Gold, A., Surratt, J. D., Bourg, I. C., Cziczo, D. J., Burrows, S. M., and Zhang, Y.: Quantifying and Modeling the Impact of Phase State on the Ice Nucleation Abilities of 2-Methyltetrols as a Key Component of Secondary Organic Aerosol Derived from Isoprene Epoxydiols, Environmental Science and Technology, 58, 22678–22690, 2024. a, b, c, d, e, f
Lin, R.-F., Starr, D. O., DeMott, P. J., Cotton, R., Sassen, K., Jensen, E., Kärcher, B., and Liu, X.: Cirrus parcel model comparison project. Phase 1: The critical components to simulate cirrus initiation explicitly, Journal of the atmospheric sciences, 59, 2305–2329, 2002. a, b
Lin, S.-J.: A “vertically Lagrangian” finite-volume dynamical core for global models, Monthly Weather Review, 132, 2293–2307, 2004. a
Liu, X. and Chen, B.: Climatic warming in the Tibetan Plateau during recent decades, International Journal of Climatology: A Journal of the Royal Meteorological Society, 20, 1729–1742, 2000. a
Lock, A. P., Brown, A. R., Bush, M. R., Martin, G. M., and Smith, R. N. B.: A new boundary layer mixing scheme, Part I: Scheme description and single-column model tests, Mon. Weather Rev., 128, 3187–3199, 2000. a
Loeb, N. G., Wielicki, B. A., Wong, T., and Parker, P. A.: Impact of data gaps on satellite broadband radiation records, Journal of Geophysical Research: Atmospheres, 114, https://doi.org/10.1029/2008JD011183, 2009. a, b
Loeb, N. G., Doelling, D. R., Wang, H., Su, W., Nguyen, C., Corbett, J. G., Liang, L., Mitrescu, C., Rose, F. G., and Kato, S.: Clouds and the earth’s radiant energy system (CERES) energy balanced and filled (EBAF) top-of-atmosphere (TOA) edition-4.0 data product, Journal of climate, 31, 895–918, 2018. a, b
Lynch, D. K., Sassen, K., Starr, D. O., and Stephens, G.: Cirrus, Oxford University Press, ISBN 0-19-513072-3, 2002. a, b, c
Mamouri, R.-E., Ansmann, A., Ohneiser, K., Knopf, D. A., Nisantzi, A., Bühl, J., Engelmann, R., Skupin, A., Seifert, P., Baars, H., Ene, D., Wandinger, U., and Hadjimitsis, D.: Wildfire smoke triggers cirrus formation: lidar observations over the eastern Mediterranean, Atmos. Chem. Phys., 23, 14097–14114, https://doi.org/10.5194/acp-23-14097-2023, 2023. a
Marcolli, C.: Deposition nucleation viewed as homogeneous or immersion freezing in pores and cavities, Atmos. Chem. Phys., 14, 2071–2104, https://doi.org/10.5194/acp-14-2071-2014, 2014. a
Masson-Delmotte, V., Zhai, P., Pirani, A., Connors, S. L., Péan, C., Berger, S., Caud, N., Chen, Y., Goldfarb, L., Gomis, M. I., Huang, M., Leitzell, K., Lonnoy, E., Matthews, J. B. R., Maycock, T. K., Waterfield, T., Yelekçi, O., Yu, R., and Zhou, B.: Climate Change 2021: The Physical Science Basis. Contribution of Working Group I to the Sixth Assessment Report of the Intergovernmental Panel on Climate Change, Cambridge University Press, Cambridge, UK and New York, NY, USA, 2391 pp., https://doi.org/10.1017/9781009157896, 2021. a
Mitchell, D. L. and Finnegan, W.: Modification of cirrus clouds to reduce global warming, Environmental Research Letters, 4, 045102, https://doi.org/10.1088/1748-9326/4/4/045102, 2009. a
Morrison, H. and Gettelman, A.: A new two-moment bulk stratiform cloud microphysics scheme in the Community Atmosphere Model, version 3 (CAM3). Part I: Description and numerical tests, Journal of Climate, 21, 3642–3659, 2008. a
Murray, B., O'sullivan, D., Atkinson, J., and Webb, M.: Ice nucleation by particles immersed in supercooled cloud droplets, Chemical Society Reviews, 41, 6519–6554, 2012. a
Naik, V., Horowitz, L. W., Fiore, A. M., Ginoux, P., Mao, J., Aghedo, A. M., and Levy, H.: Impact of preindustrial to present-day changes in short-lived pollutant emissions on atmospheric composition and climate forcing, Journal of Geophysical Research: Atmospheres, 118, 8086–8110, 2013. a
Paynter, D. J. and Ramaswamy, V.: Investigating the impact of the shortwave water vapor continuum upon climate simulations using GFDL global models, Journal of Geophysical Research: Atmospheres, 119, 10720–10737, https://doi.org/10.1002/2014JD021881, 2014. a
Penner, J. E., Zhou, C., and Liu, X.: Can cirrus cloud seeding be used for geoengineering?, Geophysical Research Letters, 42, 8775–8782, 2015. a
Pruppacher, H. R., Klett, J. D., and Wang, P. K.: Microphysics of clouds and precipitation, Boston: Kluwer Academic Publishers, ISBN 0792342119, 1998. a, b
Schill, G. P., Froyd, K. D., Bian, H., Kupc, A., Williamson, C., Brock, C. A., Ray, E., Hornbrook, R. S., Hills, A. J., Apel, E. C., Chin, M., Colarco, P. R., and Murphy, D. M.: Widespread biomass burning smoke throughout the remote troposphere, Nature Geoscience, 13, 422–427, 2020. a
Schwarzkopf, D. M. and Fels, S.: The simplified exchange method revisited: An accurate, rapid method for computation of infrared cooling rates and fluxes, Journal of Geophysical Research, 96, 9075–9096, 1991. a
Singh, D. K., Sanyal, S., and Wuebbles, D. J.: Understanding the role of contrails and contrail cirrus in climate change: a global perspective, Atmos. Chem. Phys., 24, 9219–9262, https://doi.org/10.5194/acp-24-9219-2024, 2024. a
Storelvmo, T., Kristjansson, J. E., Muri, H., Pfeffer, M., Barahona, D., and Nenes, A.: Cirrus cloud seeding has potential to cool climate, Geophysical Research Letters, 40, 178–182, 2013. a, b, c
Sulia, K. J. and Harrington, J. Y.: Ice aspect ratio influences on mixed-phase clouds: Impacts on phase partitioning in parcel models, Journal of Geophysical Research: Atmospheres, 116, D21309, https://doi.org/10.1029/2011JD016298, 2011. a
Testa, B., Durdina, L., Alpert, P. A., Mahrt, F., Dreimol, C. H., Edebeli, J., Spirig, C., Decker, Z. C. J., Anet, J., and Kanji, Z. A.: Soot aerosols from commercial aviation engines are poor ice-nucleating particles at cirrus cloud temperatures, Atmos. Chem. Phys., 24, 4537–4567, https://doi.org/10.5194/acp-24-4537-2024, 2024. a
Tiedtke, M.: Representation of clouds in large-scale models, Mon. Weather Rev., 121, 3040–3061, 1993. a
Ullrich, R., Hoose, C., Möhler, O., Niemand, M., Wagner, R., Höhler, K., Hiranuma, N., Saathoff, H., and Leisner, T.: A new ice nucleation active site parameterization for desert dust and soot, Journal of the Atmospheric Sciences, 74, 699–717, 2017. a, b, c
Ullrich, R., Hoose, C., Cziczo, D. J., Froyd, K. D., Schwarz, J. P., Perring, A. E., Bui, T. V., Schmitt, C. G., Vogel, B., Rieger, D., Leisner, T., and Möhler, O.: Comparison of modeled and measured ice nucleating particle composition in a cirrus cloud, Journal of the Atmospheric Sciences, 76, 1015–1029, 2019. a, b
Wagner, R., Kiselev, A., Möhler, O., Saathoff, H., and Steinke, I.: Pre-activation of ice-nucleating particles by the pore condensation and freezing mechanism, Atmos. Chem. Phys., 16, 2025–2042, https://doi.org/10.5194/acp-16-2025-2016, 2016. a
Wagner, R., Kaufmann, J., Möhler, O., Saathoff, H., Schnaiter, M., Ullrich, R., and Leisner, T.: Heterogeneous ice nucleation ability of NaCl and sea salt aerosol particles at cirrus temperatures, Journal of Geophysical Research: Atmospheres, 123, 2841–2860, 2018. a, b
Wagner, R., Bertozzi, B., Höpfner, M., Höhler, K., Möhler, O., Saathoff, H., and Leisner, T.: Solid ammonium nitrate aerosols as efficient ice nucleating particles at cirrus temperatures, Journal of Geophysical Research: Atmospheres, 125, e2019JD032248, 2020. a, b
Wang, M., Liu, X., Zhang, K., and Comstock, J. M.: Aerosol effects on cirrus through ice nucleation in the Community Atmosphere Model CAM5 with a statistical cirrus scheme, Journal of Advances in Modeling Earth Systems, 6, 756–776, 2014. a
Wei, Y., Wang, Y., Lu, Z., Huang, Y., and Huang, F.: Upper troposphere warming amplification over Tibetan Plateau, Journal of Climate, 38, 5335–5348, https://doi.org/10.1175/JCLI-D-24-0567.1, 2025. a
Wolf, M. J., Zhang, Y., Zawadowicz, M. A., Goodell, M., Froyd, K., Freney, E., Sellegri, K., Rösch, M., Cui, T., Winter, M., Lacher, L., Axisa, D., DeMott, P. J., Levin, E. J. T., Gute, E., Abbatt, J., Koss, A., Kroll, J. H., Surratt, J. D., and Cziczo, D. J.: A biogenic secondary organic aerosol source of cirrus ice nucleating particles, Nature Communications, 11, 4834, https://doi.org/10.1038/s41467-020-18424-6, 2020. a, b
Yun, Y. and Penner, J. E.: Global model comparison of heterogeneous ice nucleation parameterizations in mixed phase clouds, Journal of Geophysical Research: Atmospheres, 117, D07203, https://doi.org/10.1029/2011JD016506, 2012. a
Zhao, M., Golaz, J.-C., Held, I. M., Guo, H., Balaji, V., Benson, R., Chen, J.-H., Chen, X., Donner, L. J., Dunne, J. P., Dunne, K., Durachta, J., Fan, S.-M., Freidenreich, S. M., Garner, S. T., Ginoux, P., Harris, L. M., Horowitz, L. W., Krasting, J. P., Langenhorst, A. R., Liang, Z., Lin, P., Lin, S.-J., Malyshev, S. L., Mason, E., Milly, P. C. D., Ming, Y., Naik, V., Paulot, F., Paynter, D., Phillipps, P., Radhakrishnan, A., Ramaswamy, V., Robinson, T., Schwarzkopf, D., Seman, C. J., Shevliakova, E., Shen, Z., Shin, H., Silvers, L. G., Wilson, J. R., Winton, M., Wittenberg, A. T., Wyman, B., and Xiang, B.: The GFDL global atmosphere and land model AM4. 0/LM4.0- Part I: Simulation characteristics with prescribed SSTs, Journal of Advances in Modeling Earth Systems, 10, 691–734, 2018a. a, b
Zhao, M., Golaz, J.-C., Held, I. M., Guo, H., Balaji, V., Benson, R., Chen, J.-H., Chen, X., Donner, L. J., Dunne, J. P., Dunne, K., Durachta, J., Fan, S.-M., Freidenreich, S. M., Garner, S. T., Ginoux, P., Harris, L. M., Horowitz, L. W., Krasting, J. P., Langenhorst, A. R., Liang, Z., Lin, P., Lin, S.-J., Malyshev, S. L., Mason, E., Milly, P. C. D., Ming, Y., Naik, V., Paulot, F., Paynter, D., Phillipps, P., Radhakrishnan, A., Ramaswamy, V., Robinson, T., Schwarzkopf, D., Seman, C. J., Shevliakova, E., Shen, Z., Shin, H., Silvers, L. G., Wilson, J. R., Winton, M., Wittenberg, A. T., Wyman, B., and Xiang, B.: The GFDL global atmosphere and land model AM4, 0/LM4.0 – Part II: Model description, sensitivity studies, and tuning strategies, Journal of Advances in Modeling Earth Systems, 10, 735–769, 2018b. a, b
Zhu, J. and Penner, J. E.: Radiative forcing of anthropogenic aerosols on cirrus clouds using a hybrid ice nucleation scheme, Atmos. Chem. Phys., 20, 7801–7827, https://doi.org/10.5194/acp-20-7801-2020, 2020. a, b