the Creative Commons Attribution 4.0 License.
the Creative Commons Attribution 4.0 License.
 | 13 Jan 2026
Global perspectives on nitrate aerosol dynamics: a comprehensive sensitivity analysis
Alexandros Milousis
Susanne M. C. Scholz
Hendrik Fuchs
Alexandra P. Tsimpidi
Vlassis A. Karydis
In recent years, nitrate aerosols have become a dominant component of atmospheric composition, surpassing sulfate in both concentration and climatic impact. However, accurately simulating nitrate remains a major challenge for global models due to complex formation mechanisms and strong regional variability. This study investigates key factors influencing nitrate aerosol formation to improve simulation accuracy in polluted regions. Using the EMAC climate–chemistry model and the ISORROPIA II thermodynamic module, we assess the effects of grid resolution, emission inventories, chemical kinetics, thermodynamic assumptions, and aerosol scavenging processes. Model predictions are evaluated against PM2.5 and PM1 nitrate observations from filter networks and aerosol mass spectrometer campaigns across Europe, North America, East Asia, and India. Results show that PM2.5 nitrate is generally overestimated, especially in East Asia (up to a factor of three), while PM1 nitrate is underestimated, particularly at urban-downwind sites. Higher grid resolution, adjusted N2O5 uptake, and updated emissions (e.g., CMIP6) improve PM2.5 predictions but do not consistently enhance PM1 accuracy. Seasonal and diurnal biases are most pronounced in Europe, where the model fails to capture observed nitrate variability. Sensitivity tests show limited impact on the total tropospheric nitrate burden (within 25 %). A combined configuration using high grid resolution, reduced N2O5 uptake, and the HTAPv3 emission inventory improves PM2.5 predictions in low-concentration periods and U.S. networks, but PM1 biases persist regionally. These findings highlight the difficulty of achieving consistent improvements across aerosol size modes and diverse geographic regions.
- Article
(6696 KB) - Full-text XML
-
Supplement
(4073 KB) - BibTeX
- EndNote


Aerosols are a critical and complex component of the Earth's climate system due to the complexity of their chemical composition and the many changes they undergo during their atmospheric lifetime. The composition of anthropogenic aerosols, influenced by the diverse precursor gases emitted by anthropogenic activities, plays a pivotal role in shaping climate and air quality. Of particular concern are aerosols with a diameter of less than 2.5 µm (PM2.5), which have been linked to a significant global mortality rate, estimated to exceed four million deaths per year (Chowdhury et al., 2022; Im et al., 2023). Furthermore, anthropogenic aerosols have a significant impact on the Earth's energy balance by causing a net cooling effect that tends to mask the warming induced by greenhouse gases (Storelvmo et al., 2016; Glantz et al., 2022; Nair et al., 2023). Among the various types of anthropogenic aerosols, sulfates (SO) have become the dominant type in terms of mass concentrations, with a tropospheric burden that is more than twice as high as that of nitrates (NO) (Bellouin et al., 2011; Myhre et al., 2013; Karydis et al., 2016). However, numerous studies have indicated a shift in this regime, with nitrates challenging the dominance of sulfates in several key regions of the polluted northern hemisphere (Tsimpidi et al., 2025), including Europe (Lanz et al., 2010; Aksoyoglu et al., 2017), the USA (Walker et al., 2012), and East Asia (Wang et al., 2013; Li et al., 2020a). This phenomenon can be attributed to the strict restrictions on sulfur dioxide (SO2) emissions worldwide, which have not always been accompanied by a corresponding reduction in nitrogen oxide (NOx) emissions, and particularly ammonia (NH3), which has increased in recent decades (Warner et al., 2017; Van Damme et al., 2021; Beaudor et al., 2025). Nitrate aerosols are of particular importance because they can influence atmospheric chemistry through heterogeneous reactions with dust and sea salt (Karydis et al., 2016; Kok et al., 2023), which also lead to more acidic conditions in aerosols (Karydis et al., 2021). Additionally, nitrate aerosols have been shown to affect climate through a direct radiative effect that leads to cooling (Myhre et al., 2013; Hauglustaine et al., 2014; Klingmüller et al., 2019; Milousis et al., 2025). Furthermore, nitrate aerosols influence the properties of clouds and other aerosol species, resulting in a complex indirect radiative effect (Klingmüller et al., 2020; Milousis et al., 2025). Consequently, the precise representation of nitrate aerosols in global chemistry climate models (CCM) becomes increasingly important, as they are projected to have the most substantial impact on climate and air quality by the end of the century.
However, this task presents several challenges. Nitrate aerosol formation is highly sensitive to the levels of its precursors (Karydis et al., 2011), therefore, their accurate representation in models is an essential starting point for realistic simulation of nitrate aerosols. Furthermore, nitrate aerosols are inherently semi-volatile, which means that partitioning between the gas and particle phases is a complicated process as equilibrium conditions must be met, which in turn complicates the calculations (Seinfeld and Pandis, 2016). To ensure the reliability of model predictions, it is imperative that they accurately represent the equilibrium between the gas and particle phases, which depends on various atmospheric conditions. Humidity and temperature have been identified as key factors in determining this equilibrium, while atmospheric acidity has been shown to play a crucial role in regulating partitioning processes (Ansari and Pandis, 2000; Guo et al., 2016; Pye et al., 2020). The complexity of the system is further increased by the interaction of nitrate aerosols with other important aerosol species, such as sea salt and mineral dust. The inclusion of these pathways can be critical for accurate predictions (Karydis et al., 2010; Karydis et al., 2016; Kakavas and Pandis, 2021). The complex nature of nitrate aerosols often leads to discrepancies between model estimates and observations, with models frequently predicting higher mass concentrations. For instance, overestimations of approximately 2 µg m−3 have been found in Europe (Jones et al., 2021; Milousis et al., 2024), with biases reaching a factor of 5 or more in some cases (Chen et al., 2018). Analogous findings have been documented in the US (Walker et al., 2012; Zakoura and Pandis, 2018, 2019; Jones et al., 2021), while model simulations in East Asia have exhibited even greater biases (Miao et al., 2020; Milousis et al., 2024), with Xie et al. (2022) noting that approximately 60 % of studies modeling particle concentrations in China overpredicted particulate nitrate levels. The potential causes of such biases can be categorized into several groups, covering a range of physicochemical processes and model characteristics.
A fundamental reason for discrepancies between model predictions and observations, as well as between predictions made by different models, is the grid resolution employed. A high spatial resolution (i.e., a substantial number of simulated grid cells with reduced size) facilitates the capture of chemical interactions that precursors undergo and their various removal processes with a high degree of precision. Conversely, a low spatial resolution may result in oversimplifications. It is important to note that the increased complexity of the representation is associated with higher computational costs. However, the use of high spatial resolution has been shown to reduce biases in predicted nitrate aerosol concentrations by 60 %–80 % (Metzger et al., 2002; Zakoura and Pandis, 2018, 2019). Furthermore, Schaap et al. (2004) and Heald et al. (2012) note that in certain cases, the use of high resolution is essential to ensure the accurate representation of observational data by the model.
Another source of discrepancies between model and measurement results is the accuracy of the emission inventories in the model. Specifically in the case of nitrate aerosols, the presence of ammonia (NH3) emissions is critical in determining their concentrations. In regions where there is an excess of ammonia, it forms ammonium nitrate (NH4NO3) after having neutralized sulfuric acid (H2SO4) and reacting with nitric acid (HNO3) (Seinfeld and Pandis, 2016). The main sources of NH3 emissions are associated with agricultural activities, and the accuracy of their representation in emission inventories is not always ensured (Nair and Yu, 2020). This is due to the influence of various factors. These include the variety of agricultural practices and management techniques used, as well as the land changes induced by agricultural activities in general (Sutton et al., 2013; Ge et al., 2020). These factors make it difficult to ensure consistent accuracy regarding NH3 emissions. Additionally, the distinct characteristics of soil types and climates across different regions can substantially influence emission factors (Reis et al., 2009; Nair and Yu, 2020), a critical consideration in the development of a global inventory. For instance, Zhang et al. (2017) have highlighted that numerous prior NH3 emission inventories in China employed emission factors determined for Europe. In addition, the diurnal and seasonal variability of NH3 emissions must be considered in global inventories to ensure representability (Pinder et al., 2006; Hendriks et al., 2016). These considerations are equally relevant to the representation of other precursor gases, such as NOx and SO2, which are also crucial for particulate nitrate formation (Tsimpidi et al., 2007, 2008, 2012).
The thermodynamic state of the aerosol is another factor that plays an important role in the accuracy of model predictions. Typically, thermodynamic equilibrium models can assume that the particle can only exist as a supersaturated aqueous solution throughout its lifetime (metastable conditions), or they can calculate its deliquescence into a solid state as the ambient relative humidity decreases (stable conditions). The choice of the thermodynamic state can lead to differences in the acidity of the aerosol, which, in turn, can affect the prediction of concentrations for species such as nitrate, as less acidic conditions favor its partitioning into the aerosol phase and vice versa (Nenes et al., 2020). Previous studies have examined the impact of the thermodynamic state assumption on aerosol concentration predictions and have demonstrated that the choice is region dependent. For instance, a stable state has been shown to yield more realistic predictions when simulating arid and desert regions (Karydis et al., 2016). Furthermore, Fountoukis et al. (2009) and Karydis et al. (2010) found that stable thermodynamic conditions are more consistent with observations when the ambient relative humidity (RH) is below 50 %. Conversely, Ansari and Pandis (2000) found that metastable thermodynamic conditions are more suitable for regions with intermediate relative humidity (RH) and low aerosol concentrations. However, no significant differences were observed between these two assumptions for high aerosol concentrations. Guo et al. (2016) determined that metastable thermodynamic conditions are more representative of areas exhibiting characteristics analogous to those observed in the Northeastern US. In contrast, Milousis et al. (2024) found minimal differences between the two assumptions for major inorganic pollutant concentrations (i.e., nitrate, sulfate, and ammonium aerosols, as well as mineral cations) on a global scale. However, even small differences in nitrate mass concentrations can lead to significant variations in aerosol optical depth (AOD), primarily due to hygroscopic growth. Under the metastable assumption aerosol particles retain water even at low relative humidity (RH), which can lead to enhanced hygroscopic growth in regions where low RH conditions are common, such as arid or desert areas. This additional water increases particle size and refractive index, thereby enhancing their ability to scatter shortwave radiation and, to a lesser extent, absorb longwave radiation. As a result, AOD can increase even when changes in dry aerosol mass are relatively minor. However, the relationship between particle growth and AOD is not strictly linear, as larger particles may also experience enhanced deposition and coagulation rates, which can reduce the overall aerosol number concentration (Klingmüller et al., 2020; Milousis et al., 2025). This reduction in number can partially offset the AOD increase expected from hygroscopic growth. It is also important to emphasize that in polluted regions, where nitrate contributes more significantly to total AOD, differences in aerosol water content and hygroscopic growth between the stable and metastable assumptions are expected to be minimal. This is because RH in such regions is typically high and both assumptions predict similar levels of aerosol water content under these conditions (Milousis et al., 2024).
Another factor influencing model predictions of nitrate aerosols is the chemistry of dinitrogen pentoxide (N2O5), which is particularly important for the nocturnal production of nitrate particles. Specifically, N2O5, a compound derived from the oxidation of NOx species, undergoes heterogeneous hydrolysis on particle surfaces in the presence of sufficient amounts of water, resulting in the formation of HNO3, a pivotal precursor of nitrate aerosols. This heterogeneous pathway has been shown to dominate the nighttime production of HNO3, potentially accounting for up to 50 % of particulate nitrate production in polluted areas during both winter (Liu et al., 2020) and summer (Qu et al., 2019). The hydrolysis reaction is predominantly governed by a corresponding uptake coefficient which represents the probability that a collision between an N2O5 molecule and an aerosol particle leads to a reaction. While many models use a single average value, the reaction is strongly influenced by ambient conditions such as temperature, relative humidity, aerosol water content, and available surface area. Consequently, some studies suggest the utilization of different values in models depending on the prevalent conditions of the examined region. For instance, Wang et al. (2020a) proposed a significantly lower value than the conventional value utilized in CCMs (0.02) to better align with conditions observed in Beijing. A similar suggestion was made by Phillips et al. (2016) for semi-rural regions in Germany, with the intent of providing more precise estimates of particulate nitrate, and this is supported by a number of studies in various parts of the US as well (Bertram et al., 2009; Brown et al., 2009; Chang et al., 2011; Chang et al., 2016). The significance of N2O5 chemistry is particularly pronounced in regions exhibiting activities that contribute to elevated NOx concentrations. This effect is further exacerbated in areas characterized by intrusions of particles, such as mineral dust and/or sea salt, which facilitate heterogeneous reactions. Regions with high concentrations of hydrophilic particles in the accumulation mode, where the surface area available for interactions peaks, are especially significant when assessing the uptake coefficient.
Furthermore, model predictions of nitrate aerosols can be strongly influenced by the model treatment of their wet deposition and, specifically, the manner in which cloud acidity affects the dissolution of HNO3. Specifically, in less acidic conditions, elevated in-cloud dissolution of HNO3 is observed to achieve overall electroneutrality, leading to increased particulate nitrate production (Seinfeld and Pandis, 2016; Tilgner et al., 2021). Therefore, it is essential that a model accurately represents in-cloud properties, as the pH conditions in regions with different characteristics will be more accurately captured. This, in turn, will facilitate a more comprehensive understanding of nitrate formation processes.
This study aims to investigate the sensitivity of the simulated nitrate aerosol concentration to several parameters on a global scale. For this purpose, the global atmospheric chemistry-climate model EMAC was used, with different configurations and parameterizations covering all the aspects mentioned above that influence the prediction of particulate nitrate concentrations. The model performance was evaluated against network stations and campaign derived observations of NO in the PM2.5 and PM1 size ranges. The aim is not to identify a single dominant sensitivity factor that universally improves model performance, but to assess which configurations have the greatest impact under specific conditions.
2.1 Model setup
The model utilized in this study is the EMAC global chemistry and climate model (Jöckel et al., 2006). EMAC comprises a series of submodels, which are interconnected via the Modular Earth Submodel System (MESSy) (Jöckel et al., 2005) to the base (core) model, namely the fifth generation European Center Hamburg general circulation model (ECHAM5) (Roeckner et al., 2006). The gas phase chemistry is simulated by the submodel MECCA (Sander et al., 2019) with a simplified scheme similar to that used in the Chemistry Climate Model Initiative (CCMI), as described by Jöckel et al. (2016). The liquid phase chemistry is simulated by the submodel SCAV (Tost et al., 2006), which is also responsible for the wet deposition treatment of trace gases and aerosols. The submodel DRYDEP (Kerkweg et al., 2006b) addresses the dry deposition of trace gases and aerosols, while the submodel SEDI (Kerkweg et al., 2006b) handles the gravitational sedimentation of aerosols. The GMXe submodel (Pringle et al., 2010a, b) simulates aerosol microphysical processes and the gas-to-particle partitioning of inorganic species. For more detailed information on these processes, the reader is referred to Sect. 2.2. The ORACLE submodel (Tsimpidi et al., 2014, 2018) is responsible for simulating the composition and chemical evolution of all organic aerosol species. The microphysical processes of clouds are simulated by the CLOUD submodel (Roeckner et al., 2006), using the two-moment microphysical scheme for liquid and ice clouds of Lohmann and Ferrachat (2010), while considering a physically based treatment for the processes related to the activation of liquid droplets (Karydis et al., 2017) and ice crystals (Bacer et al., 2018). In this study, all simulations performed were nudged towards the actual meteorology using ERAI data (Dee et al., 2011), and concern the period 2009–2018, with the first year being used as the model spin-up period.
The spatial resolution used in all simulations, except for two sensitivity cases (see Sect. 2.3), corresponds to T63L31, which has a grid resolution of 1.875° ×1.875° and covers vertical altitudes up to 25 km, divided into 31 layers. The database of anthropogenic emissions in terms of aerosols and their precursors, utilized by all simulations apart from the related sensitivity cases (see Sect. 2.3), was derived from the CAMS inventory (Inness et al., 2019). This database undergoes real time assimilation based variational bias correction, by the scheme of Dee and Uppala (2009) where biases are estimated during the analysis by including bias parameters in the control vector of the dataset. Biomass burning emissions were taken from the GFEDv4.1 database (Randerson et al., 2017). The natural emissions of NH3, originating from soil and oceanic volatilization, were obtained from the GEIA database (Bouwman et al., 1997). It should be noted that studies have identified a tendency of this database to overestimate oceanic NH3 emissions (Paulot et al., 2015) and to over-simplify soil-related NH3 sources by relying on a single-factor approach (Reis et al., 2009). The biogenic soil emissions of NO were calculated online during runtime using the algorithm of Yienger and Levy (1995). Lightning production of NOx is also calculated online by the LNOx submodel (Tost et al., 2007a) based on the parameterization of Grewe et al. (2001). The emissions of SO2 from volcanic eruptions are obtained from the AEROCOM database (Dentener et al., 2006). Sea salt emissions are calculated online according to the parameterization of Guelle et al. (2001), which utilizes precalculated lookup tables to determine the wind speed-dependent mass and particle number fluxes for the accumulation and coarse mode sizes, which applies for sea salt aerosols. For more detailed information on the calculation of the lookup tables, the reader is referred to Stier et al. (2005) and Kerkweg et al. (2006a). The AIRSEA submodel (Pozzer et al., 2006) calculates oceanic emissions of dimethyl sulfide (DMS) online. Additionally, dust emission fluxes are calculated online using the parameterization of Astitha et al. (2012). This method considers both the meteorological information of each grid cell (temperature and relative humidity) and the various friction velocity thresholds above which dust particle suspension occurs. The mineral dust composition is determined by the bulk composition, and the mineral ions Na+, Ca2+, K+ and Mg2+ are estimated as a fraction of the total dust emission flux based on the chemical composition of the soil in each grid cell (Karydis et al., 2016; Klingmüller et al., 2018).
2.2 Inorganic aerosol partitioning
In this study, all calculations related to the thermodynamics of inorganic aerosols, as well as their phase partitioning process, are performed by ISORROPIA II v2.3 (Fountoukis and Nenes, 2007), which is a thermodynamic module integrated into the GMXe submodel. ISORROPIA II v2.3 treats the chemical system of K+–Ca2+–Mg2+–NH–Na+–SO–NO–Cl−–H2O aerosols and has the ability to simulate either a stable thermodynamic state, where aerosols are allowed to precipitate into solid salts, or a metastable state, where aerosols remain in a supersaturated aqueous solution, retaining some amount of aerosol water even at relative humidities below the crystallization threshold. The first case is used for the base case assumption of this study, along with all other sensitivity simulations, apart from one (Sect. 2.3). The stable state is generally considered more suitable for global scale simulations since it can represent better the large arid and semi-arid regions, such as deserts, where low RH conditions prevail throughout the year. ISORROPIA II v2.3 is a slightly updated version of ISORROPIA II that concerns more accurate predictions of aerosol pH near neutral conditions (Song et al., 2018). However, this affects only a small number of calculations in the different compositional sub-regimes of ISORROPIA II. Specifically, in some cases, NH3 evaporation was not considered in the aerosol pH calculations, resulting in values that approached neutrality. However, this had a negligible effect on both the predicted NH3 and the inorganic aerosol concentrations. The ISORROPIA II v2.3 model utilizes Bromley's formula (Bromley, 1973) to calculate the binary activity coefficients for multicomponent mixtures. For specific component pairs, it employs the Kusik-Meissner relationship (Kusik and Meissner, 1978), which incorporates the temperature dependence of Meissner and Peppas (1973). Further insights can be found in Fountoukis and Nenes (2007).
In the GMXe submodel, aerosol size is described by seven lognormal size modes, four of which are assigned to a soluble fraction and the remaining three to an insoluble fraction. The soluble fraction includes the nucleation, Aitken, accumulation, and coarse size modes, while the insoluble fraction includes only the latter three (Pringle et al., 2010a, b). In the aerosol partitioning process, kinetic limitations must be considered, as only sizes smaller than coarse mode can reach equilibrium within the timeframe of one model time step (10 min for this study). Consequently, the partitioning calculations are performed in two stages. Initially, the amount of gas phase species that can kinetically condense to the particle phase within this timeframe is calculated according to the diffusion limited condensation theory of Vignati et al. (2004). Subsequently, the partitioning between the gas and particle phases is estimated by assuming instantaneous equilibrium for all aerosol size modes, as the ISORROPIA II v2.3 routines are called separately for each one. Finally, the transfer of material between the soluble and insoluble modes is calculated by GMXe after the partitioning calculations have been completed. This transfer can occur in two ways: by coagulation, where two particles of different modes collide and the resulting particle is in the soluble mode; or if substantial soluble material has condensed onto an insoluble particle, the latter is transferred to the soluble mode (Pringle et al., 2010a, b). To estimate aerosol mass concentrations within the PM1 and PM2.5 size ranges, the volume fraction of each lognormal mode falling below the respective size thresholds (i.e., < 1 µm for PM1 and < 2.5 µm for PM2.5) is computed following Seinfeld and Pandis (2016). These volume fractions are then used to derive the mass concentrations of individual aerosol components (e.g., nitrate) within each size range.
2.3 Sensitivity configuration details
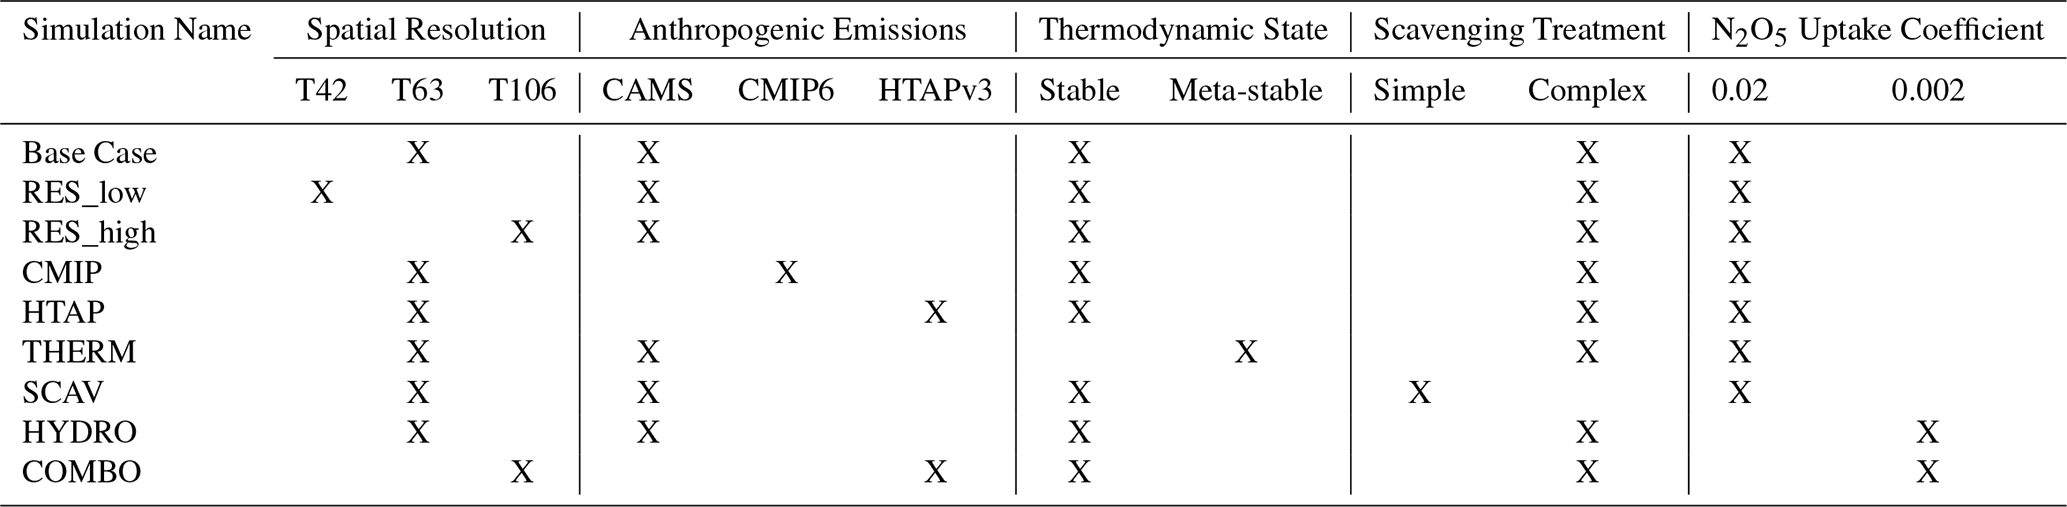
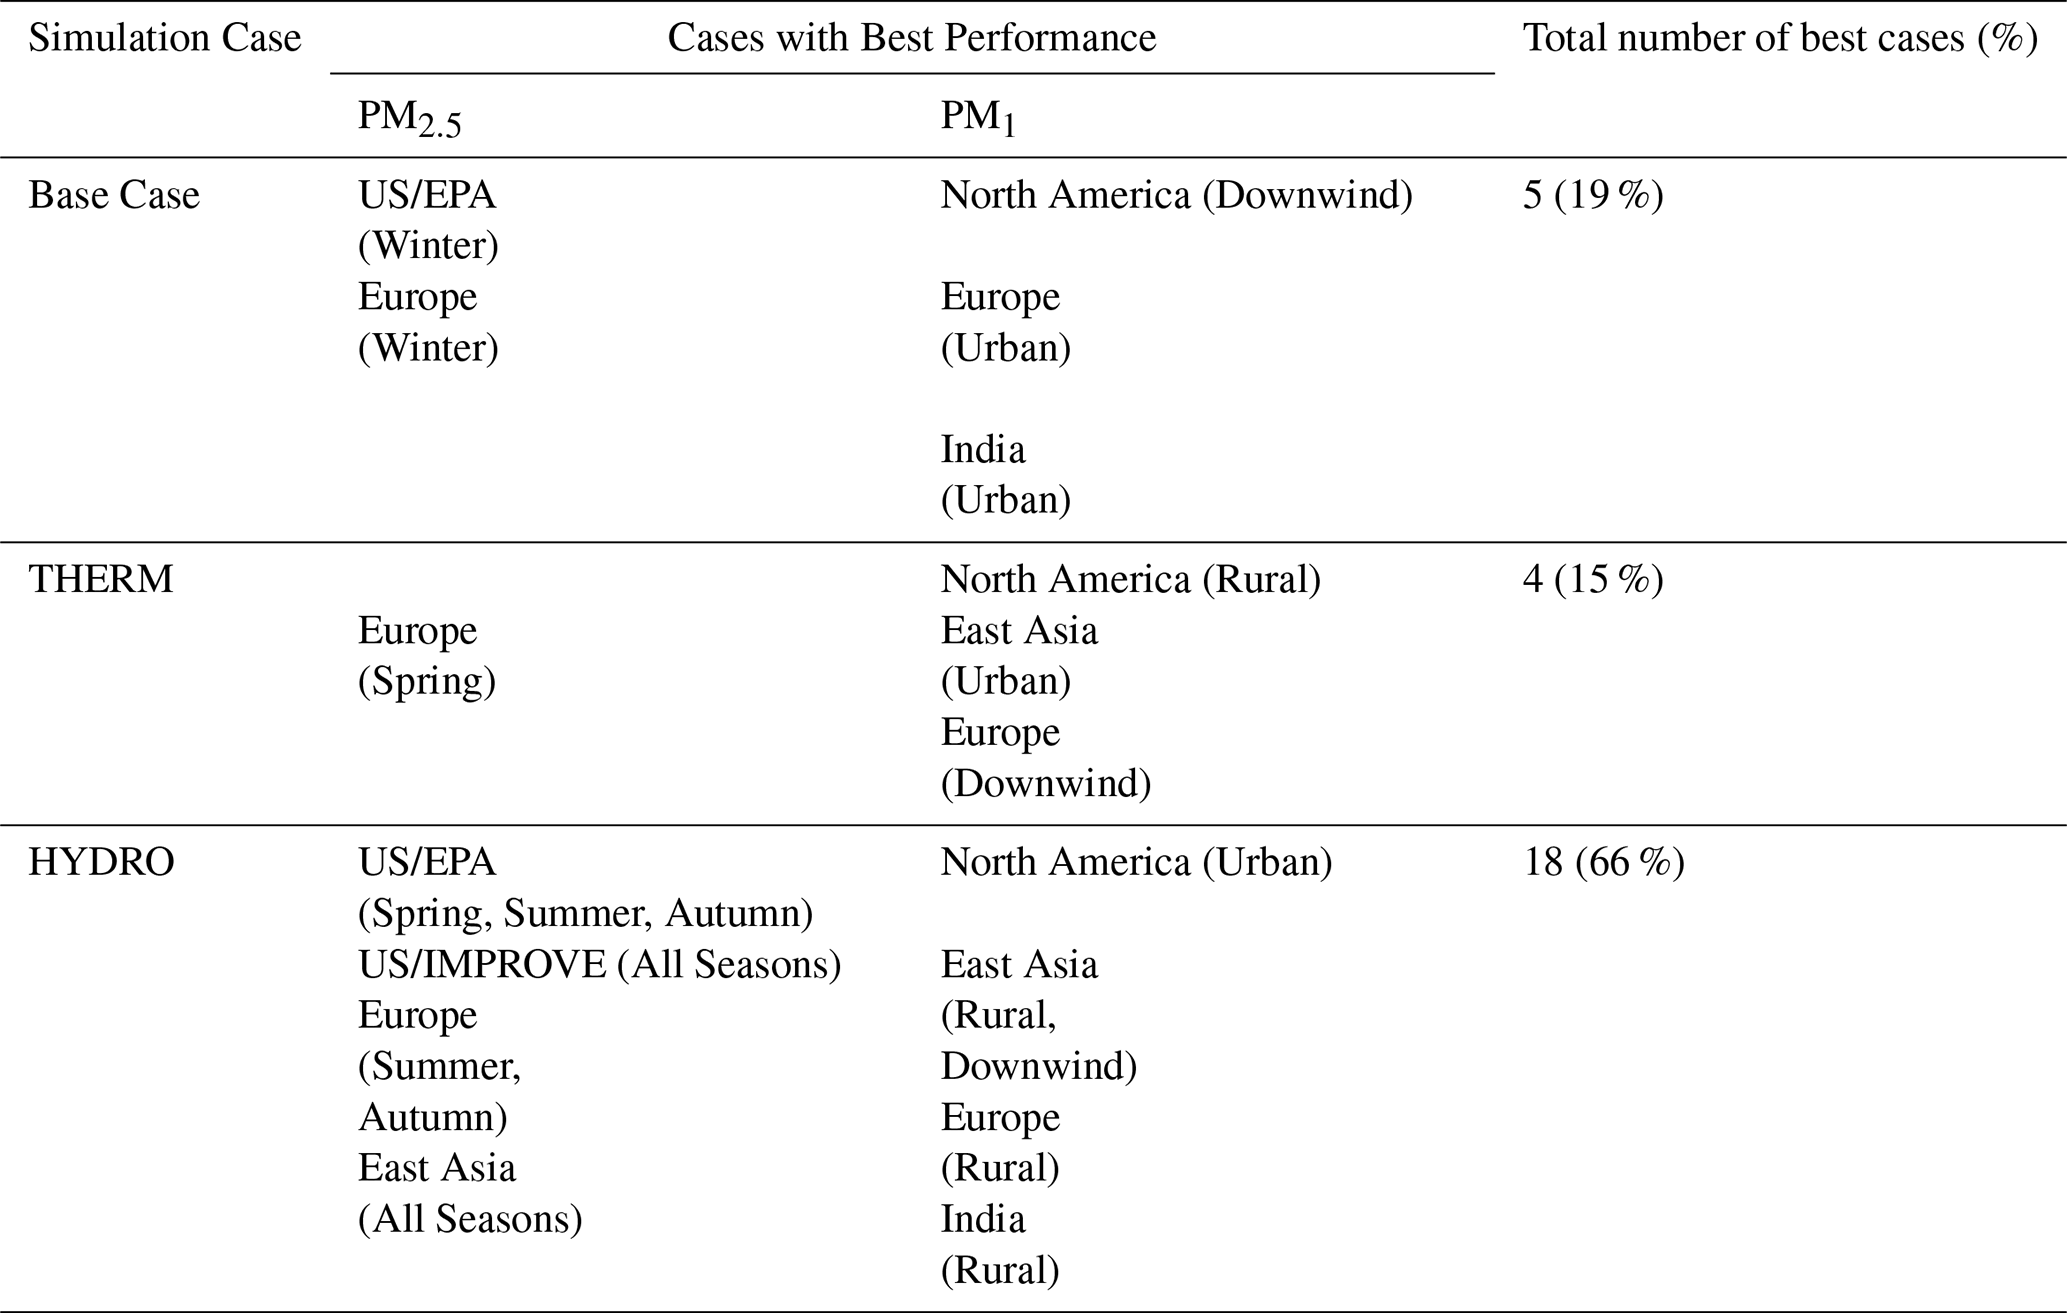
A total of nine simulations were performed (base case and eight sensitivity cases) to cover all aspects that influence the model predictions of particulate nitrate concentrations, as discussed in Sect. 1, and whose configurations are summarized in Table 1. All simulations cover the period from 2009 to 2018, with the first year designated as the model spin-up period. The primary objective is to assess which model configurations most accurately reproduce observed PM2.5 and PM1 concentrations in the most polluted regions of the world, under varying seasonal and environmental conditions (e.g., rural, urban, urban downwind regions). In all the sensitivity cases, except the last one, only a single configuration parameter was altered at a time (Table 1), allowing for a clear attribution of any changes in model–observation bias to that specific modification. The base case simulation was performed using the following combination of configurations. A T63L31 spatial resolution (1.875° ×1.875° grid) with anthropogenic emissions provided by the CAMS database is used. The aerosols' thermodynamic state was assumed to be stable, i.e., it was permitted to precipitate into solid salts at low relative humidity (RH). Aerosol scavenging is addressed by a comprehensive mechanism encompassing over 150 chemical reactions for the liquid phase, in addition to the online calculation of the in-cloud and precipitation pH (Tost et al., 2006, 2007b). The uptake coefficient of N2O5 hydrolysis is 0.02 according to the parameterization proposed by Evans and Jacob (2005).
Table 1Configurations used in the base case and all sensitivity simulations.
In the first two sensitivity model runs (RES_low and RES_high), only the spatial grid resolution was changed. The change involved the adoption of a lower resolution, characterized by a reduction in the number of grid cells, and a higher resolution, marked by an increase in the number of grid cells. Notably, the vertical resolution was maintained at 31 layers, consistent with the base case. The lower spatial resolution is the T42L31 resolution, which corresponds to a 2.813°×2.813° grid and the higher spatial resolution is the T106L31 resolution, which corresponds to a 1.125° ×1.125° grid.
The other two sensitivity model runs (CMIP and HTAP) employed distinct emission inventories regarding anthropogenic emissions of aerosols and trace gases yet utilized the grid resolution of the base case. Specifically, the “CMIP” model run utilized the CMIP6 database (O'Neill et al., 2016), while the “HTAP” model run employed the HTAPv3 database (Crippa et al., 2023). These inventories apply different bias correction methodologies, primarily involving scaling and harmonization based on national inventories and/or temporal extrapolation to align with historically observed emission trends (Feng et al., 2020; Crippa et al., 2023). Post-hoc evaluations are also commonly conducted, where biases are identified and reported following model–observation comparisons. It is important to note that all three emission inventories (CAMS, CMIP6, and HTAPv3) provide monthly mean values for the simulation period, thereby incorporating seasonal and monthly variability directly into the model input fluxes. Additionally, the model accounts for temporal emission patterns by adjusting emissions based on the date and time of day, capturing expected peaks in anthropogenic activity such as weekday and rush hour traffic.
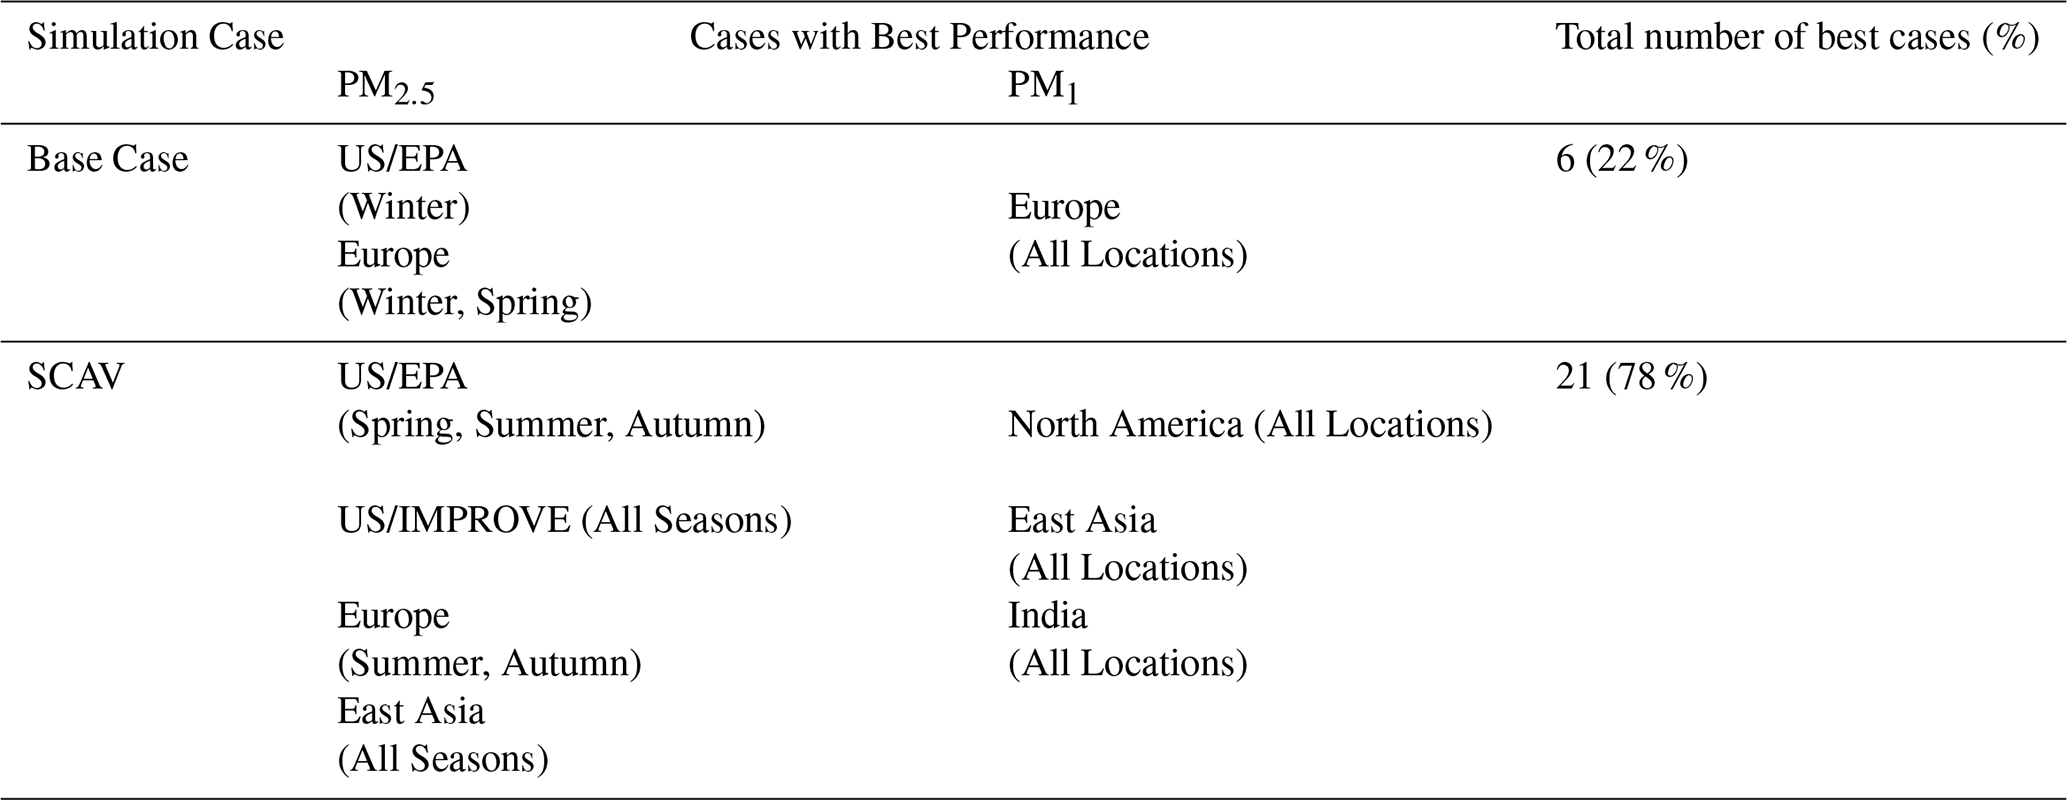
An additional sensitivity model run was performed in which only the thermodynamic state of the aerosol was altered (THERM). In this run, the metastable assumption was implemented, meaning aerosols are prevented from forming solids, even at extremely low RH values, allowing them to persist in a supersaturated aqueous phase. Additionally, a sensitivity model run was conducted in which only the scavenging treatment was modified (SCAV) employing a simplified mechanism where the gas-to-particle phase partitioning follows the effective Henry's Law coefficients approach. Furthermore, aqueous phase chemistry, specifically the oxidation of sulfur from S(IV) to S(VI), was not considered in the calculation of cloud acidity. Instead, a fixed pH value of 5 was prescribed for both in-cloud and precipitation conditions (Tost et al., 2007b). This value is based on observational data from hill-cap and orographic clouds across the U.S., Europe, and other regions, which report pH values ranging from approximately 3.6 to 7, with many clustered around 5 (Feinberg et al., 2019). While not perfect, a pH of 5 serves as a reasonable mid-range estimate in cases where a full dynamic cloud chemistry treatment is not computationally feasible. We emphasize, however, that this fixed pH assumption is applied only in the “SCAV” sensitivity test. In all other simulations, cloud and precipitation pH is calculated interactively at each model time step based on comprehensive chemical speciation and dissociation reactions.
Another sensitivity simulation (HYDRO) focused exclusively on the treatment of N2O5 hydrolysis, and more specifically the uptake coefficient considered. In this run, a reduced uptake coefficient of 0.002 (an order of magnitude lower than the base case value of 0.02) was applied to assess whether this adjustment could improve model performance in key regions of interest. Recent studies indicate that the default value (γ=0.02) may lead to excessive nitrate aerosol formation, particularly over East Asia (Wang et al., 2017; Li et al., 2020b), a region known to be challenging for accurate model representation. Several regional studies recommend a range of average uptake coefficients spanning from 0.002 to 0.02 (Chang et al., 2016; Phillips et al., 2016; Wang et al., 2020a). The lower bound of this range was selected for this sensitivity test.
The final sensitivity simulation (COMBO) was developed to assess the cumulative impact of combining multiple parameter changes that had individually shown beneficial effects in previous sensitivity tests. Unlike the other simulations, which altered one parameter at a time, the COMBO setup was designed to explore whether integrating several favorable configurations would lead to improved overall model performance or reveal non-linear interactions. The initial COMBO configuration included the lower N2O5 uptake coefficient, higher spatial resolution, and the CMIP6 emission inventory, each selected based on their statistical performance. However, this combination resulted in unrealistically low nitrate PM concentrations, likely due to the low precursor emissions in CMIP6 (see Figs. S18 and S19 and Tables S31 and S32 in the Supplement), and was therefore excluded from the main analysis. The simplified scavenging scheme, despite its statistical improvements, was also omitted due to its unrealistic assumption of a fixed cloud and precipitation pH. The final COMBO configuration presented in this study includes the HYDRO case (with the lower N2O5 uptake coefficient for improved nighttime nitrate production), the RES_high case (for enhanced spatial resolution), and the HTAP emission inventory (which integrates global coverage with regional detail based on EDGARv6 and national inventories). This combination was selected not only for its statistical performance but also for its physical realism. The thermodynamic and scavenging treatments in the COMBO simulation remained consistent with those of the base case. The rationale behind each configuration choice is supported by the sensitivity results and corresponding performance metrics, as discussed in Sect. 4.5.
2.4 Emission uncertainty
The emission inventories used for the base-case simulation (CAMS), and for the two sensitivity simulations (CMIP6 and HTAPv3) have been extensively evaluated in previous studies using intercomparison analyses, satellite and ground-based observations, and post-hoc methodologies. Evaluations of the CAMS inventory are available in Granier et al. (2019), Elguindi et al. (2020), Wang et al. (2020b), Kuenen et al. (2022), and Soulie et al. (2024); for CMIP6 in Smith et al. (2015), Hoesly et al. (2018), and Elguindi et al. (2020); and for HTAPv3 in Crippa et al. (2023). Specific assessments of certain pollutant emissions, such as NH3, have also been reported (Luo et al., 2022; Ding et al., 2024). These studies highlight several shortcomings and sources of uncertainty in the reporting of key precursor species for particulate nitrate formation.
For the CAMS inventory, notable issues include outdated emission factors for shipping, underestimation of emission fluxes in urban centers and developing regions due to the choice of sectoral proxies and smoothing of emission peaks for NOx. For SO2, major weaknesses include poor coverage of non-point sources, temporal lags of a few years, and failure to capture post-2015 emission reductions over Asia. For NH3, coarse temporal extrapolations, inaccuracies in livestock density and activity, seasonal biases, and poor representation of fertilizer processes are key limitations. NH3 emissions reportedly have global uncertainties of ∼ 80 %, with underprediction particularly in tropical regions. In the CMIP6 inventory, biases in NOx emissions arise from infrequent updates of vehicle fleet age, and temporal lags lead to overestimation of NOx and SO2 fluxes in rapidly changing regions. Outdated assumptions regarding sulfur content in fuels further affect SO2 estimates. NH3 remains the least constrained species, with regional biases due to non-dynamic agricultural proxies and coarse extrapolations to match historical trends. For the HTAPv3 database, which integrates various regional inventories, the adoption of their respective biases is a key limitation. Similar shortcomings to those in CAMS and CMIP6 are present, including outdated transport inventories, fleet age information for NOx, and sulfur content for industrial and energy-sector SO2 emissions. NH3 exhibits the highest uncertainties, potentially reaching 100 %, largely due to misrepresented process-level proxies (e.g., agricultural or livestock practices) that introduce seasonal biases. Integration of multiple databases can also generate artificial flux gradients at regional boundaries.
Simulated concentrations of key aerosol precursor species relevant to particulate nitrate formation (i.e., NOx, NH3, O3, and SO2) were evaluated for all three emission inventories used in this study. Model outputs were compared against surface measurements from multiple monitoring networks, including AMoN (Ammonia Monitoring Network, 2026), EPA CASTNET (Clean Air Status and Trends Network), EMEP (European Monitoring and Evaluation Programme, 2026), CPCB (Central Pollution Control Board, India, 2026), and NNDMN (National Nitrogen Deposition Monitoring Network, China; Xu et al., 2019). The comparisons for each inventory are presented in Figs. S2–S13, and statistical evaluations of model performance are summarized in Tables S1–S12, using metrics such as Mean Absolute Gross Error (MAGE), Mean Bias (MB), Normalized Mean Error (NME), Normalized Mean Bias (NMB), and Root Mean Square Error (RMSE). Overall, model performance varies substantially by species, region, and inventory. For O3, all three inventories yield broadly comparable seasonal biases, with CAMS and CMIP6 generally producing modest overestimations in North America and Europe and larger positive biases in South Asia, while HTAPv3 produces slightly lower mean concentrations in some regions. For NOx, CMIP6 systematically produces the lowest concentrations, leading to negative biases across all examined regions, whereas HTAPv3 tends to overestimate NOx. CAMS overestimates NOx in Europe and East Asia but underestimates it in South Asia and North America. For NH3, large uncertainties in emissions are reflected in consistently high NME and NMB values for all inventories, with CAMS substantially overestimating spring and summer concentrations in Europe, while CMIP6 and HTAPv3 generally underestimate NH3. For SO2, all inventories tend to underestimate concentrations, particularly in Europe, consistent with known limitations in reporting non-point and industrial sources. Overall, the comparative evaluation highlights that differences in simulated precursor concentrations among the three inventories align with their known structural characteristics and uncertainties, and these differences can propagate into the modeled nitrate aerosol responses examined in this study.
3.1 Surface concentrations and PM2.5 fraction
The mean surface concentrations of PM2.5 NO, and the fraction of PM2.5 NO (i.e., the fraction of PM2.5 NO mass in respect to the total aerosol NO mass) are shown in Fig. 1 for the entire period from 2010 to 2018. The maximum values of 14 µg m−3 are predicted over the Indian subcontinent and the East Asian region, with Central Europe showing concentrations of ∼ 5 µg m−3 for the period average, while Turkey and Eastern USA show mostly concentrations of ∼ 3 µg m−3 (Fig. 1a). With respect to the size fraction, PM2.5 accounts for more than 80 % of the total aerosol nitrate concentrations over the polluted northern hemisphere and up to 70 % over South America, the southern part of Africa and Australia (Fig. 1b). The interaction of nitric acid with coarse mineral dust and sea salt particles results in smaller PM2.5 size fractions. A 30 % contribution is observed over the Southern Ocean, while the Arabian Peninsula region has the lowest predicted NO PM2.5 fraction, with a value of less than 20 %. Over the Western Sahara and the dust outflow directed towards South America, the PM2.5 nitrate fraction is around 60 %.
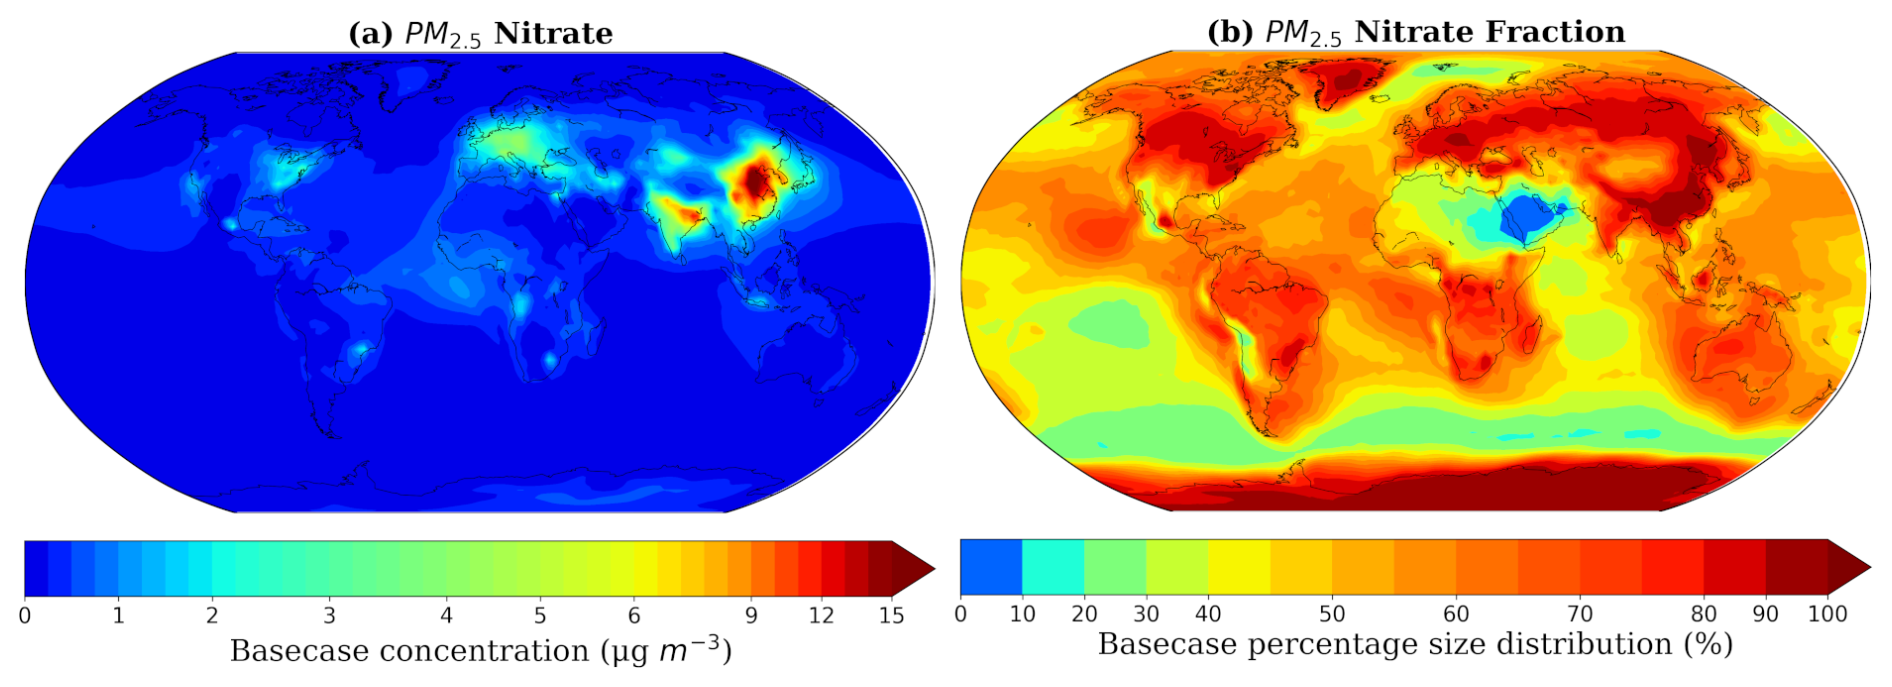
Figure 1Annual mean (a) surface concentrations and (b) fraction of PM2.5 NO for the period 2010–2018 as simulated with EMAC from the base case.
3.2 Comparison of base case model results with PM2.5 observations
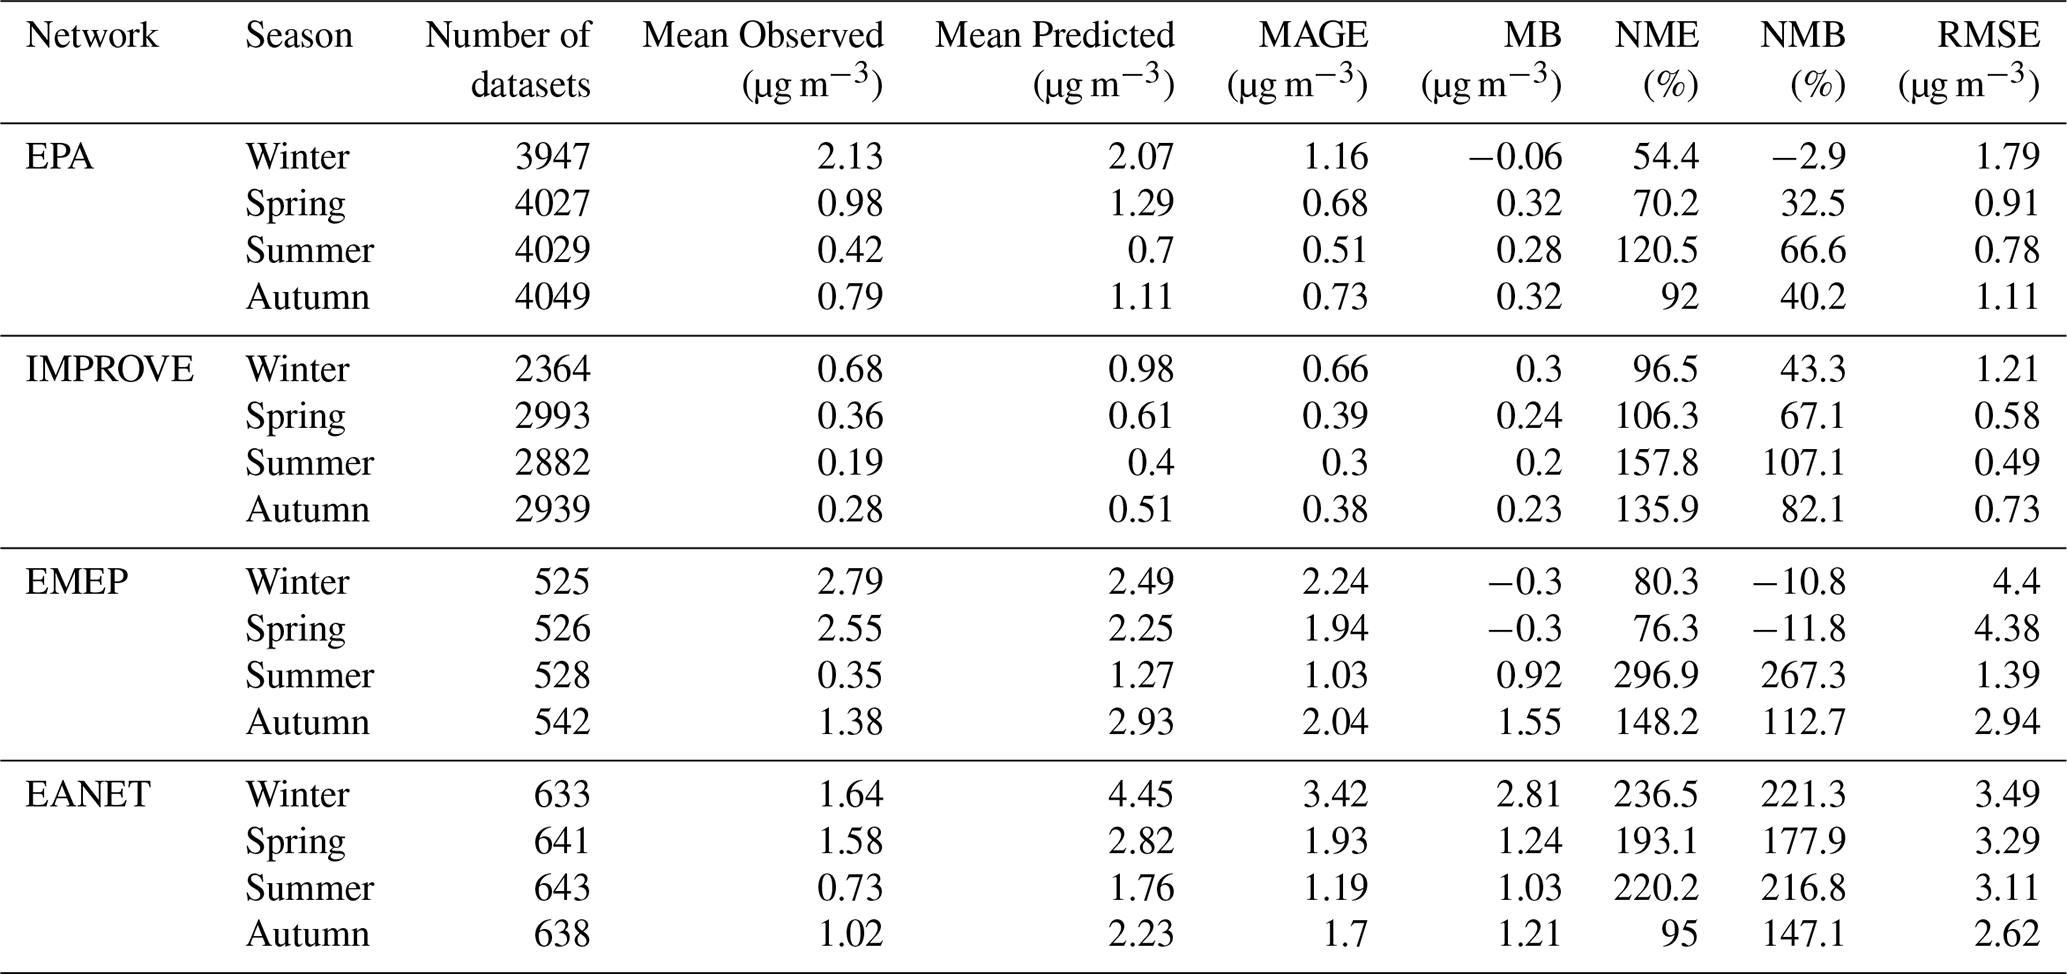
The PM2.5 aerosol observations of nitrate, sulfate, and ammonium are obtained from four networks that cover regions with the highest levels of anthropogenic activity in the polluted northern hemisphere. These networks include the EPA CASTNET network (U.S. Environmental Protection Agency Clean Air Status and Trends Network, 2026) and the IMPROVE network (Interagency Monitoring of Protected Visual Environments, 2026), which collectively encompass 152 stations for particulate nitrate across the United States. Notably, IMPROVE predominantly focuses on rural and remote regions, while EPA primarily covers urban areas. The EMEP network (European Monitoring and Evaluation Programme Air Pollutant Monitoring Data) includes nine stations for particulate nitrate, covering the European region. Additionally, the EANET network (The Acid Deposition Monitoring Network in East Asia, 2026) covers parts of East Asia with 33 stations. The locations of all stations can be found in Fig. S1a. The above networks provide monthly measurements for the entire period under consideration in this study. For PM2.5 nitrate measurements, a comparison with model predictions is presented in the form of surface concentration maps, where the observations from each station are overlaid on the model concentration maps (Fig. 2). Seasonal mean comparisons are shown as scatter plots in Fig. 3, while additional comparisons for sulfate and ammonium are presented in Figs. S15 and S16. Statistical evaluations of model performance are summarized in Table 2 for PM2.5 nitrate, and in Tables S13 and S14 for the remaining aerosol components. The metrics used are the same as for the precursor emissions evaluation described in Sect. 2.3.
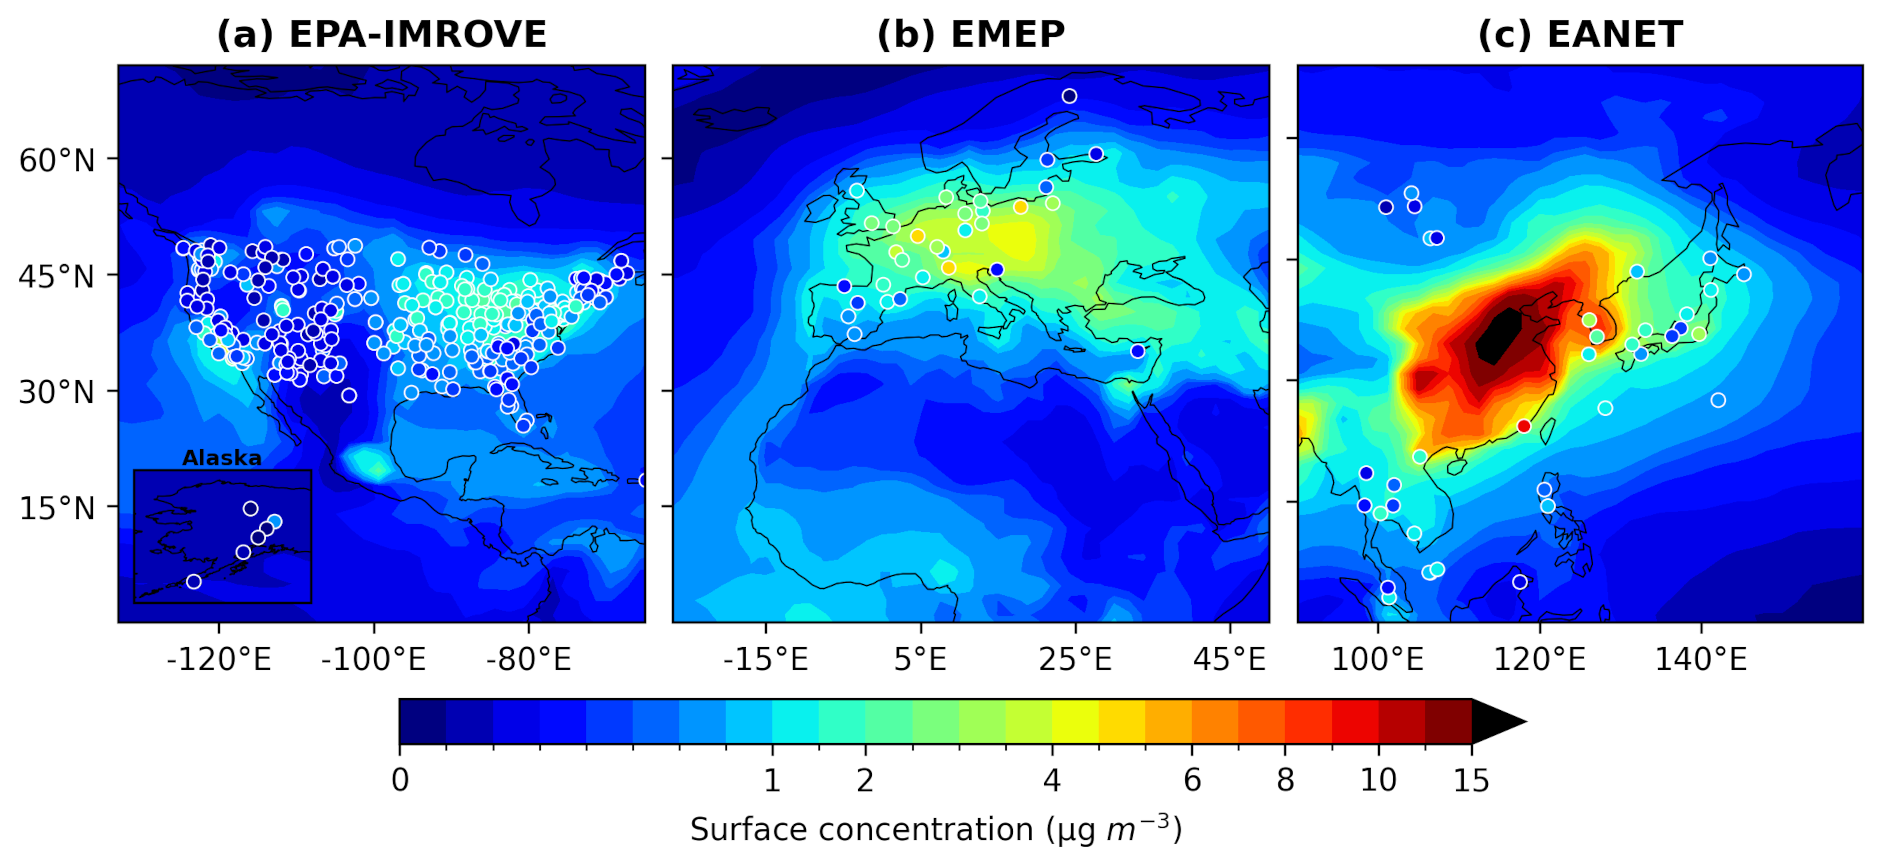
Figure 2Average surface concentrations of PM2.5 NO for the period 2010–2018 as simulated by EMAC from the base case (shaded contours) versus observations of the same species from the (a) EPA-IMPROVE, (b) EMEP and (c) EANET networks (colored circles).
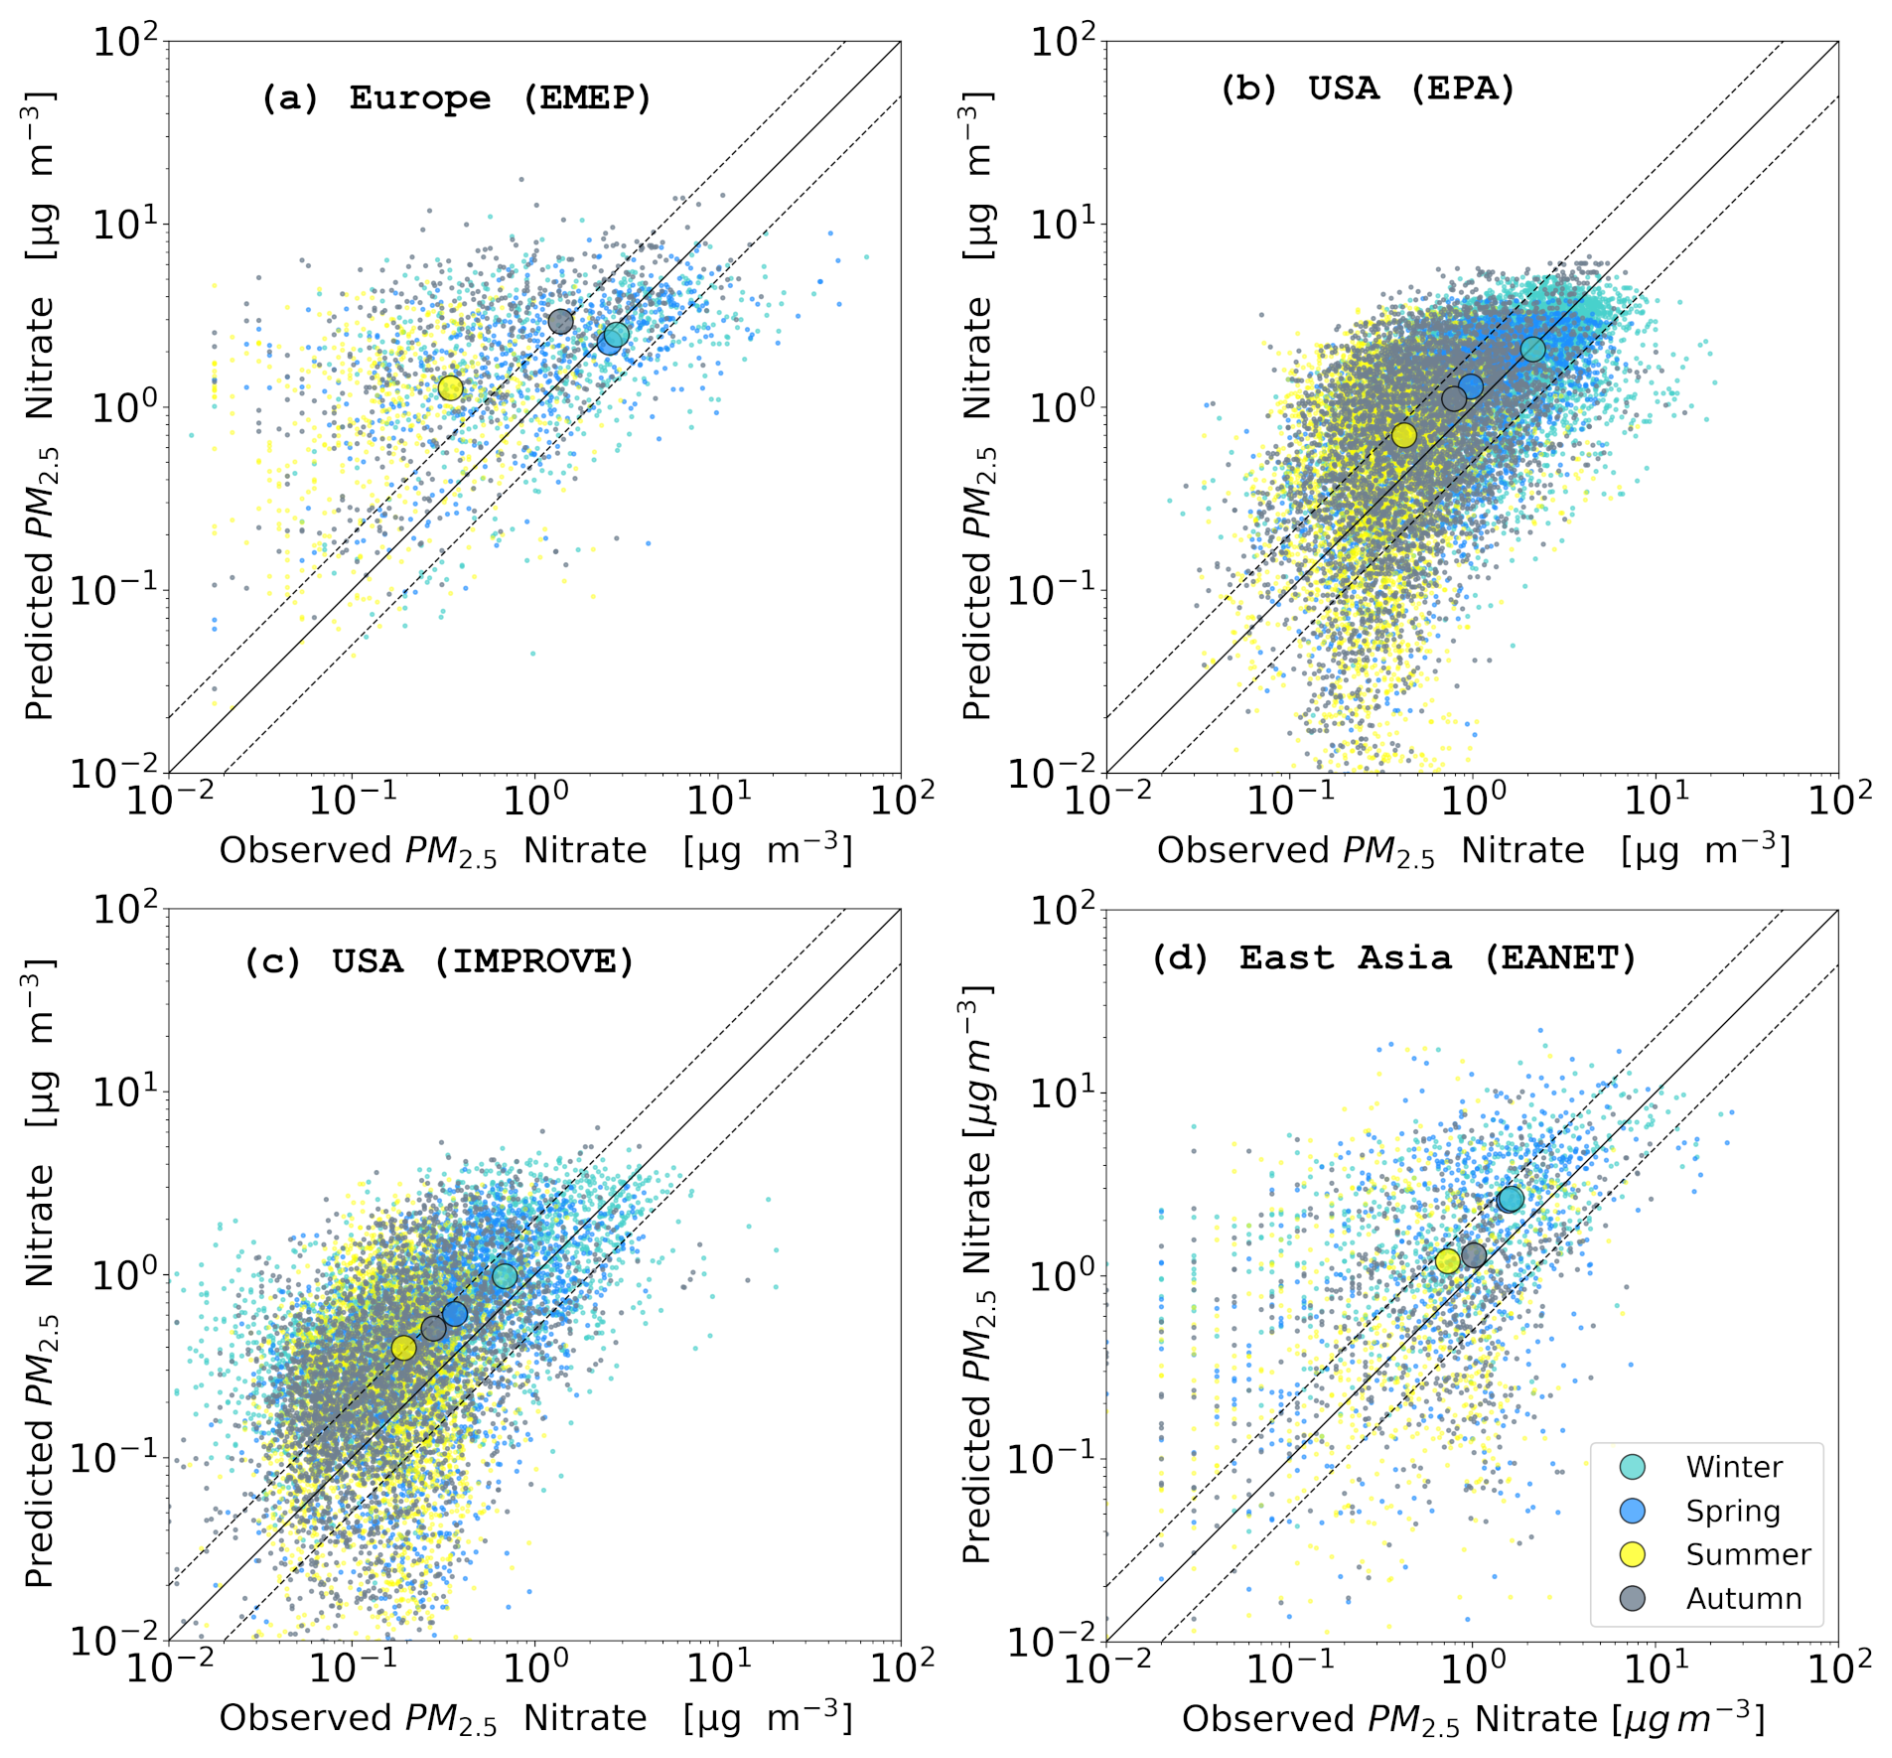
Figure 3Scatterplots comparing the seasonal mean surface concentrations of PM2.5 NO as simulated by EMAC from the Base Case with observations from the networks of (a) EMEP, (b) EPA, (c) IMPROVE and (d) EANET. Light blue points indicate values in winter, blue points in spring, yellow points in summer and grey points in autumn. The enlarged dots indicate the mean seasonal values.
Table 2Seasonal statistical evaluation of EMAC simulated PM2.5 NO surface concentrations from the base case against observations during 2010–2018. The metrics used include the Mean Absolute Gross Error (MAGE), Mean Bias (MB), Normalized Mean Error (NME), Normalized Mean Bias (NMB) and Root Mean Square Error (RMSE).
As illustrated in Fig. 2a, the model can well reproduce the measurements with a high agreement for most stations in the USA, particularly those situated in the Midwestern region and along the Southern East Coast. However, discrepancies of approximately 1 µg m−3 (model overprediction) are evident over the Central East stations, and discrepancies of approximately 2 µg m−3 are observed for the larger areas of New York and Northern California. Seasonal mean comparisons (Fig. 3b and c) indicate that winter is the best-represented season for both the EPA and IMPROVE networks, while summer exhibits the largest deviations. This seasonal behavior is statistically reflected primarily in the normalized mean bias error scores (Table 2). Overall, both networks in the USA show strong statistical performance, with absolute biases generally below 0.5 µg m−3. However, normalized mean error values remain elevated, particularly in comparison with the IMPROVE network.
In Europe, the model tends to overpredict lower observed concentrations, particularly over the Iberian Peninsula, the Baltic region, and Croatia (∼ 3 µg m−3 difference). In contrast, it more accurately captures higher concentrations over regions such as the UK and central and western Europe, although some overestimations remain in areas like Germany and Switzerland (Fig. 2b). Seasonal average discrepancies between model and observations are more pronounced in summer than in winter (Fig. 3a), which may be partly attributed to increased volatilization of nitrate from nylon filters at higher temperatures (Ames and Malm, 2001; Yu et al., 2005; Docherty et al., 2011). Another factor that contributes to this behavior is the overestimation of the NH3 and especially NO2 emissions in the CAMS inventory, which is more evident during summer months (Figs. S5 and S8). The statistical performance across the European region is mixed, with a tendency toward underprediction in winter and spring, and overprediction in summer and autumn. Model–observation differences often exceed 2 µg m−3, and normalized performance metrics show substantial deviations, particularly during the warmer seasons.
In East Asia, the discrepancy between model predictions and observations is particularly pronounced. The model overestimates nitrate concentrations in Japan, Vietnam, and Thailand by up to 2 µg m−3, similar to the overprediction observed in parts of Europe. However, in Korea, model values are approximately three times higher than observed concentrations (Fig. 2c). Conversely, in the Xiamen region, the model underpredicts nitrate levels, with discrepancies reaching up to 5 µg m−3. Unlike the patterns seen in Europe and the USA, the largest discrepancies in East Asia occur during winter, followed by summer and spring (Fig. 3d), a trend also reflected in the statistical performance scores (Table 2). No clear seasonal pattern emerges when comparing NO2 and NH3 emissions from the CAMS inventory against observations in East Asia (Figs. S5 and S8). Moreover, since evaporation artifacts are less relevant during colder seasons, the overprediction of particulate nitrate in winter and spring is likely linked to missing heterogeneous sulfate production pathways in the model's chemical mechanism. These pathways are known to play a significant role during cold, humid haze events in East Asia (He et al., 2014; Guo et al., 2014; Wang et al., 2016; Cheng et al., 2016; Zhang et al., 2018). The resulting underestimation of particulate sulfate (Fig. S16) leaves excess free NH3 available to form particulate nitrate, contributing to the observed bias. Overall, the model shows the most pronounced overpredictions in East Asia during winter and spring across all networks, while its behavior in summer and autumn more closely resembles the performance seen in Europe.
3.3 Comparison of base case model results with PM1 observations
The aerosol observations of PM1 are derived from AMS measurements obtained during field campaigns in the Northern Hemisphere from 2010 to 2018. The measurement durations of these campaigns ranged from one to six months and included rural, urban, and urban-downwind locations. The campaign and types of locations can be seen in Fig. S1b. Further details regarding the locations of the field campaigns, including their duration, can be found in Tsimpidi et al. (2016, 2025). As the field observations (in contrast to the network measurements) are not continuous but rather fragmented into different time periods for each field campaign location, the comparison is presented in the form of scatter plots that compare the model and the measured values depending on the location type (see Fig. 4). A scatter plot comparison of the seasonal means is shown in Fig. S17. The statistical evaluation involves the regions of the USA, East Asia, Europe, and India, using the same metrics as above. The results are presented in Table 3.
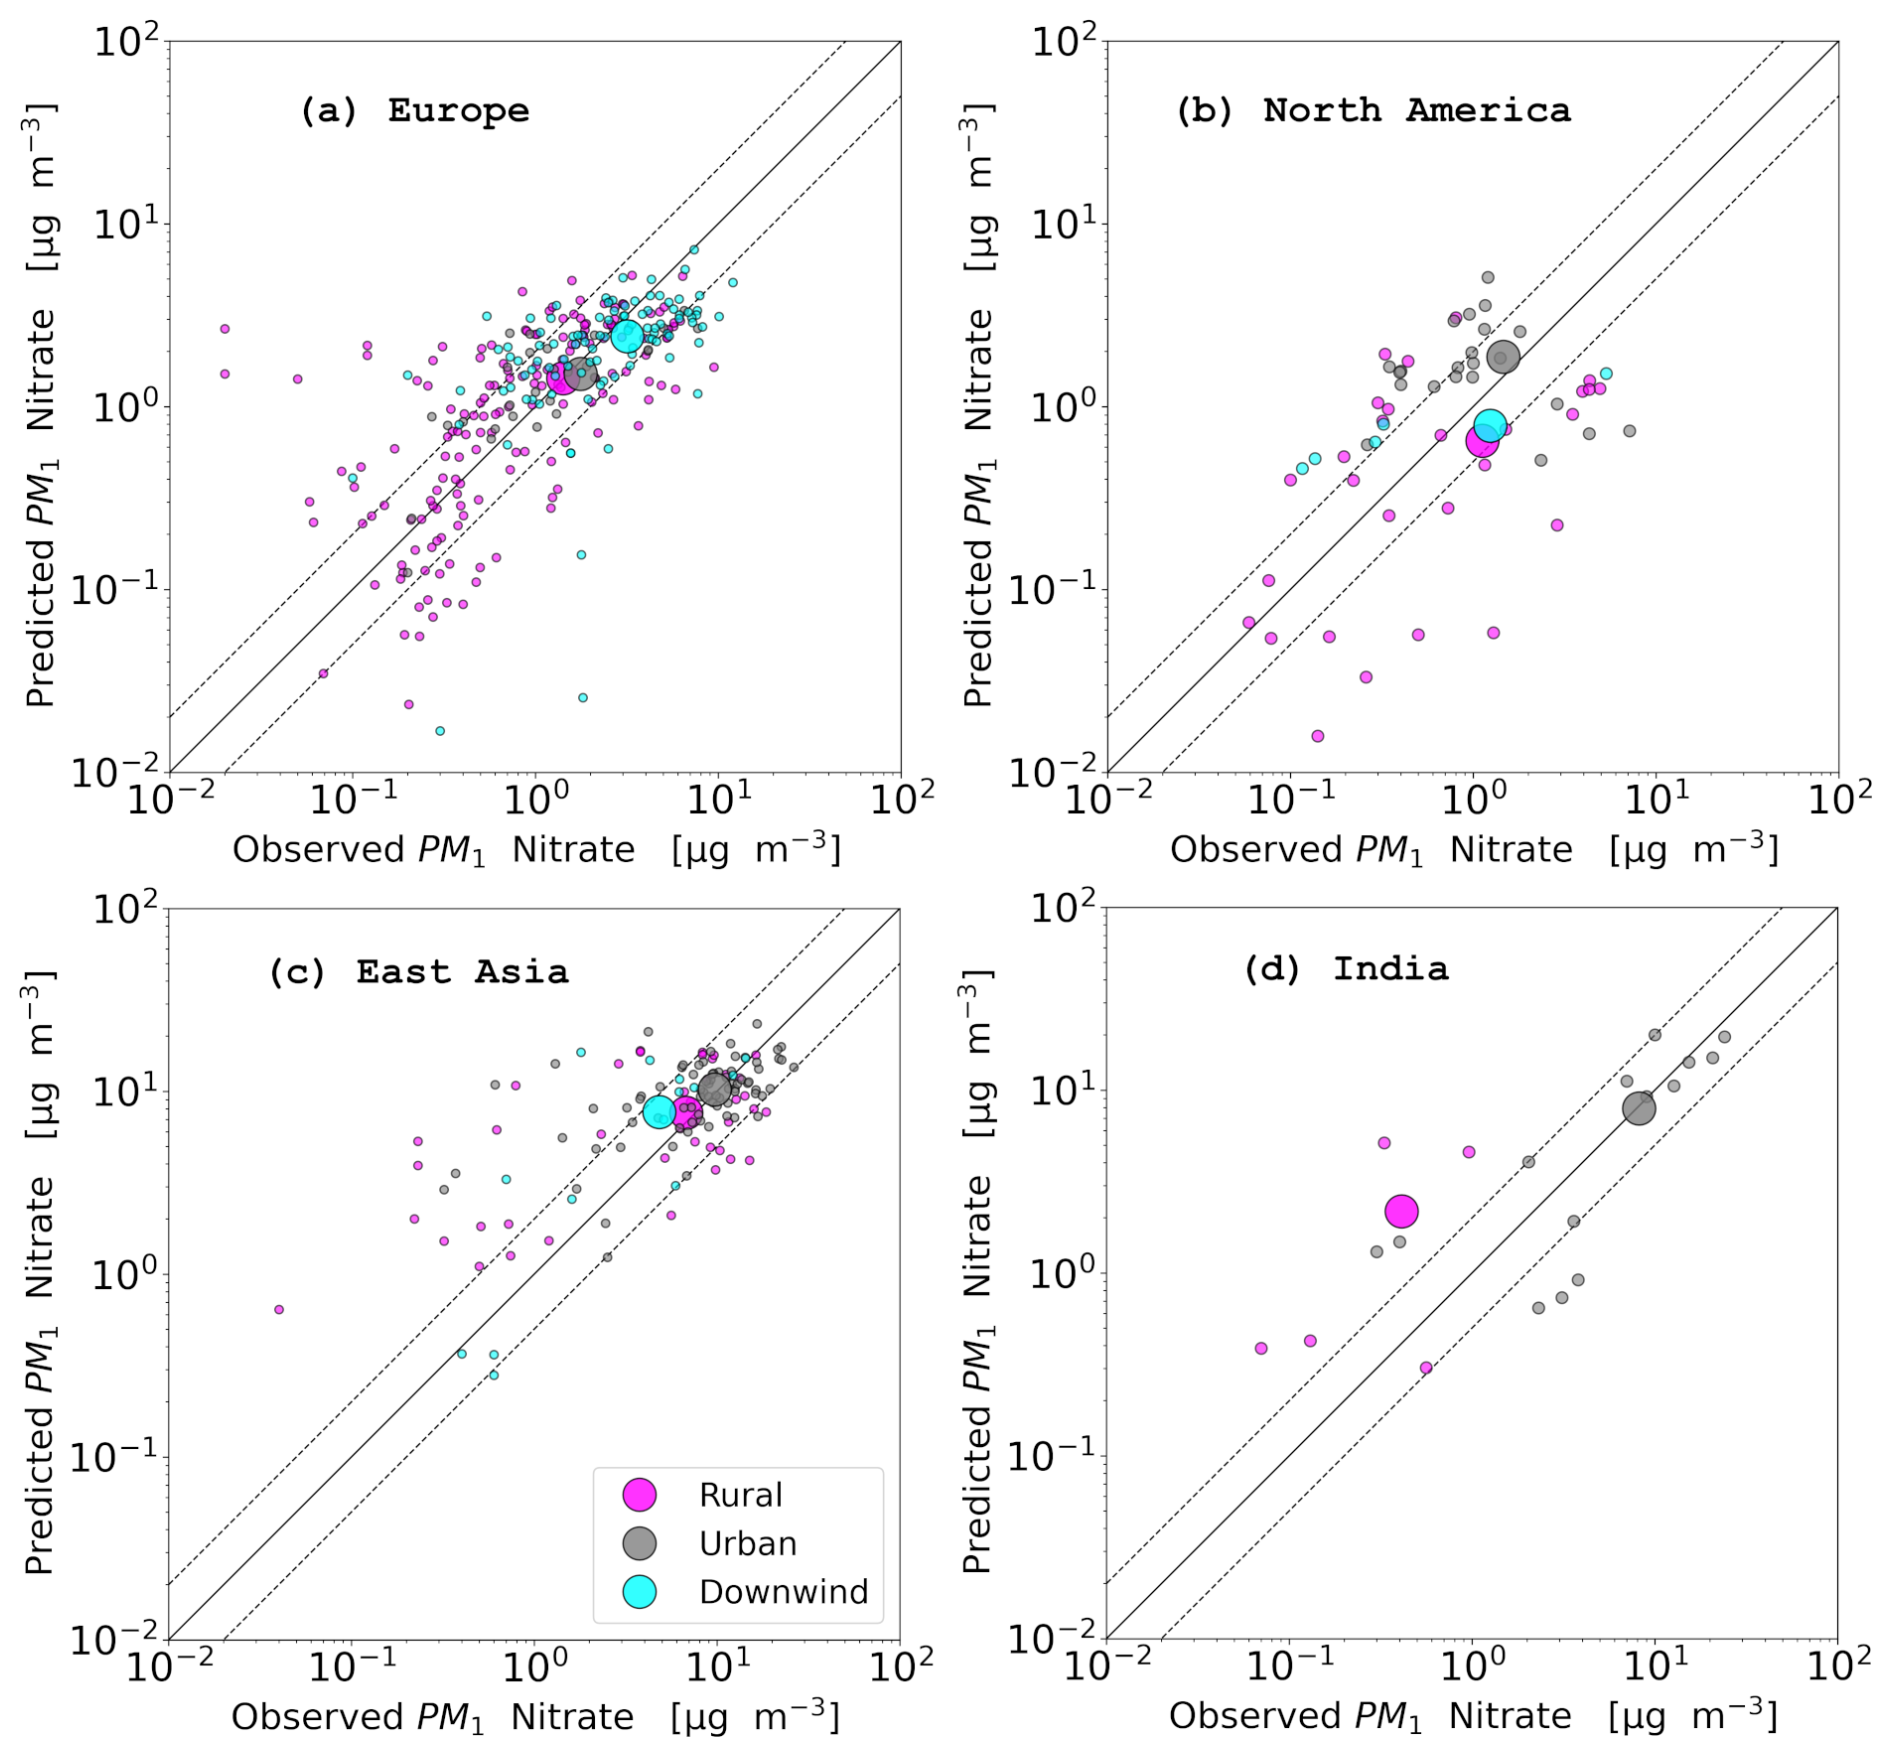
Figure 4Scatterplots comparing monthly mean surface concentrations of PM1 NO as simulated by EMAC from the base case and measured by AMS instruments in field campaigns in the regions of (a) Europe, (b) North America, (c) East Asia and (d) India. Enlarged dots indicate the 2010–2018 period averages from all locations. Also shown are the 1:1 line (solid) as well as the 2:1 and 1:2 lines (dashed).
Table 3Statistical evaluation of EMAC simulated PM1 NO surface concentrations from the base case against observations during 2010–2018. The metrics used include the Mean Absolute Gross Error (MAGE), Mean Bias (MB), Normalized Mean Error (NME), Normalized Mean Bias (NMB) and Root Mean Square Error (RMSE).
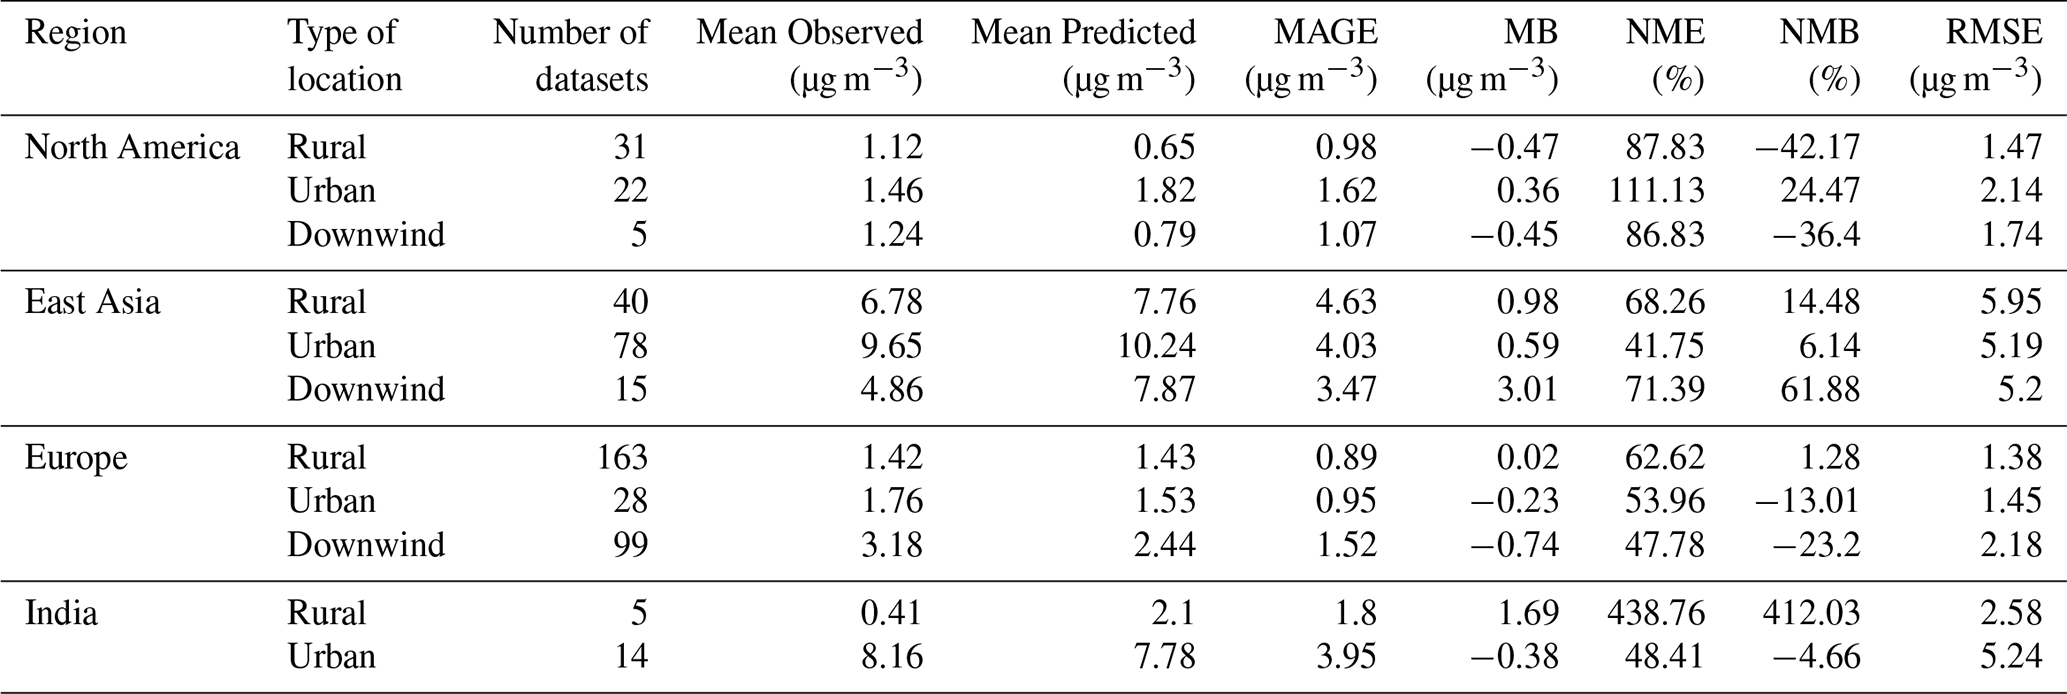
Table 4Agreement rates between the base case simulation and the grid resolution sensitivity model runs, regarding the accuracy of PM2.5 and PM1 nitrate predictions, based on their root mean square error scores.
As shown in Fig. 4a, the model can reproduce the average PM1 values over rural and urban locations in Europe with a high accuracy, although there is considerable variation at specific locations. On the other hand, it underpredicts PM1 nitrate in urban-downwind locations (up to 50 %). In North America, the underprediction of average values is slightly stronger for urban-downwind and particularly for rural locations (Fig. 4b) with average values for urban sites showing better agreement. In East Asia, the model shows similar accuracy to Europe in urban and rural locations, but with a significantly lower number of outliers (Fig. 4c). However, the average urban-downwind values in this region exhibit an overprediction of slightly more than 50 %. In India, the model's estimation of average urban values aligns closely with measurements, while the model significantly overestimates average rural values by a factor of 4 (Fig. 4d).
In contrast to the comparison of PM2.5 concentrations, most of the metrics indicate that PM1 aerosol observations in Europe are better reproduced. The USA shows low mean bias values and high scatter, as evidenced by normalized bias and error metrics. Conversely, East Asia shows higher absolute differences. The model has the worst performance for India, particularly in rural areas where there is a substantial discrepancy between the modeled and observed values. Overall, the model demonstrates a higher degree of accuracy in predicting PM1 concentrations in both rural and urban locations as compared to urban-downwind areas.
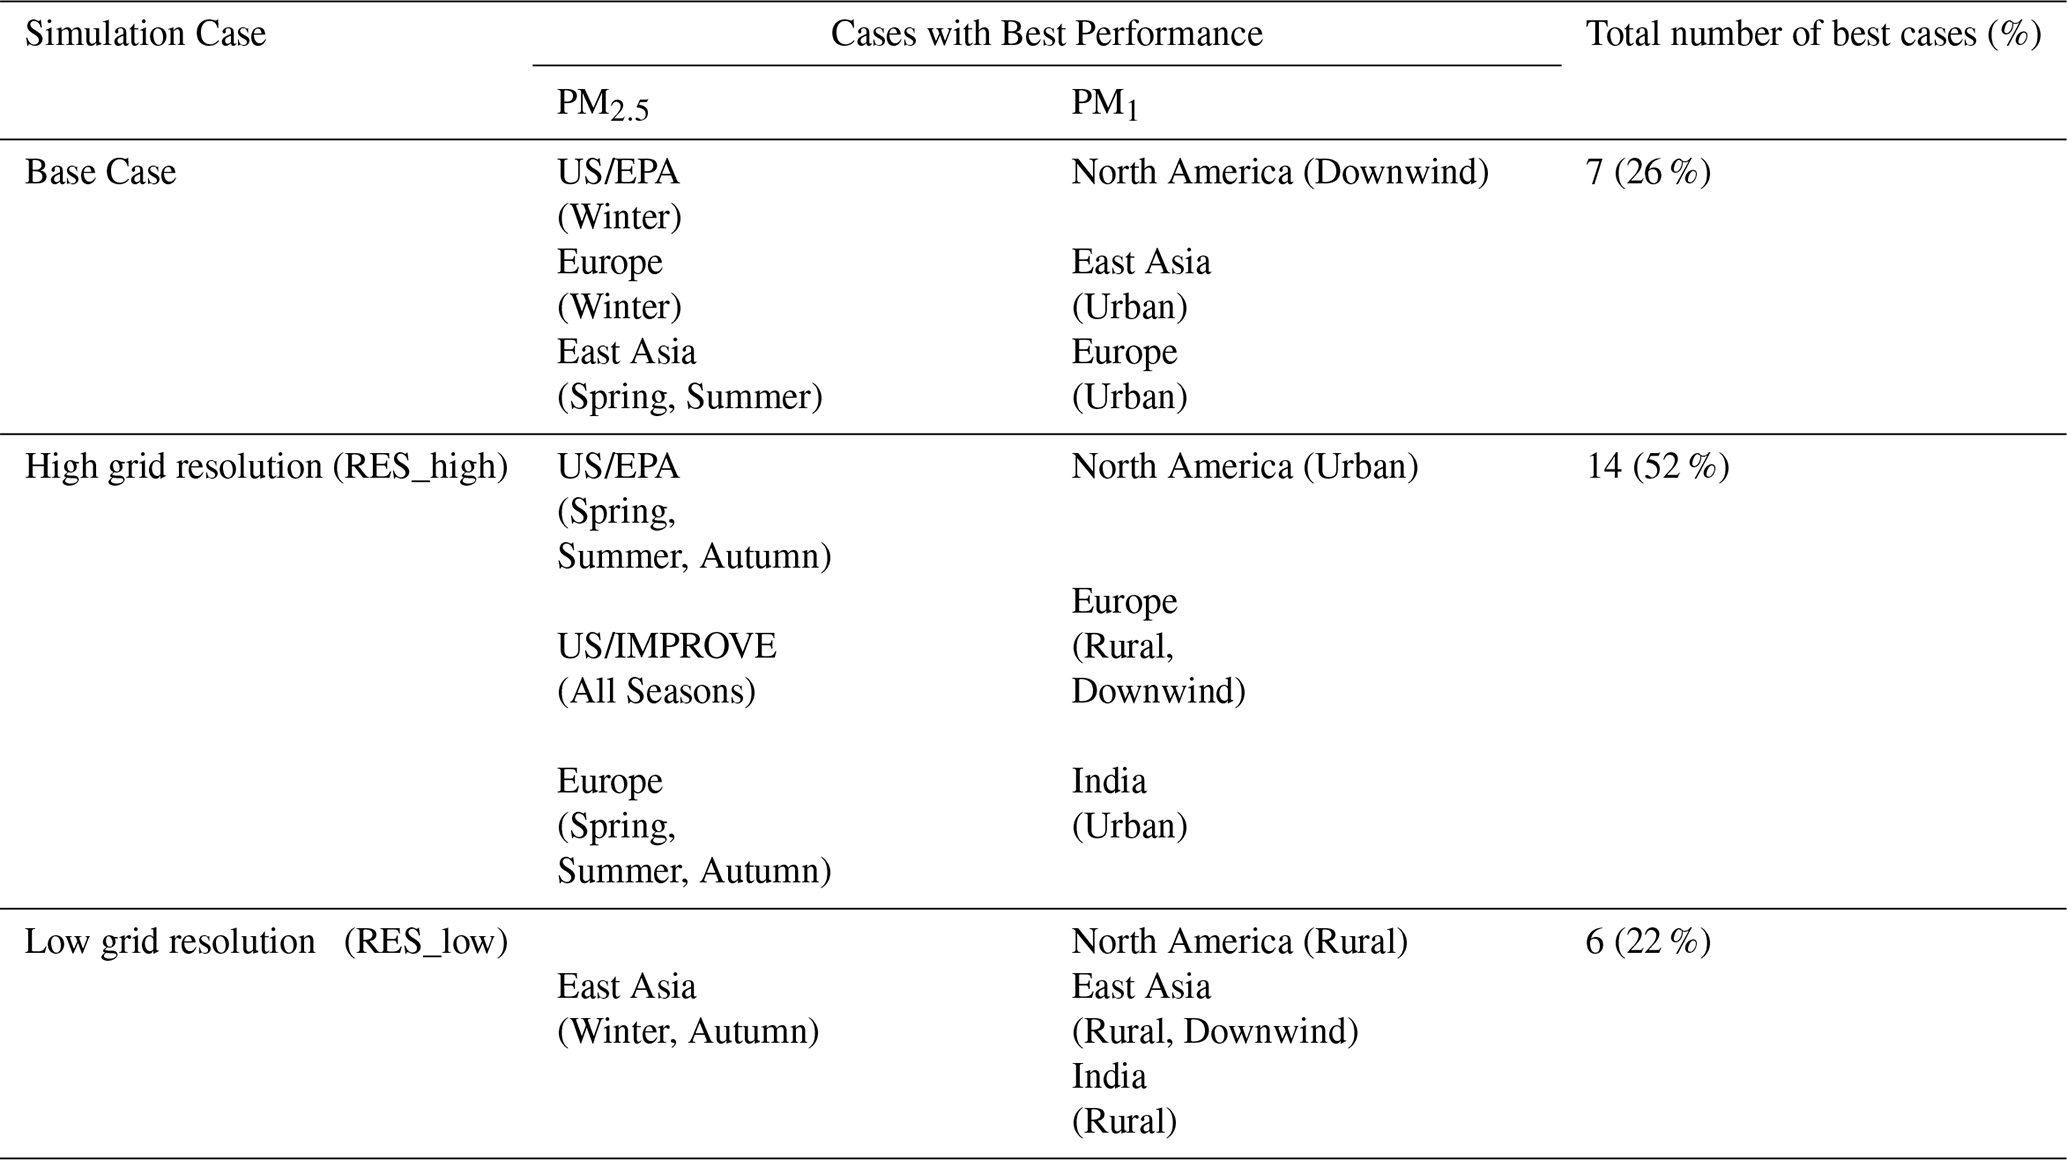
Seasonal comparisons of PM2.5 concentrations, as well as PM1 concentrations across different types of measurement sites, are presented in Figs. 6 and 7, respectively, with results grouped by region and expressed in terms of mean bias relative to observations. Additionally, the performance of each sensitivity simulation is directly compared to the base case in terms of its ability to more accurately reproduce PM2.5 and PM1 concentrations across all examined regions, seasons, and site types. The ranking is based on root mean square error (RMSE), which provides a robust measure of model performance by accounting for both bias and variance. These rankings are summarized in Tables 4–8, while full statistical results for each sensitivity test are available in Tables S15–S30.
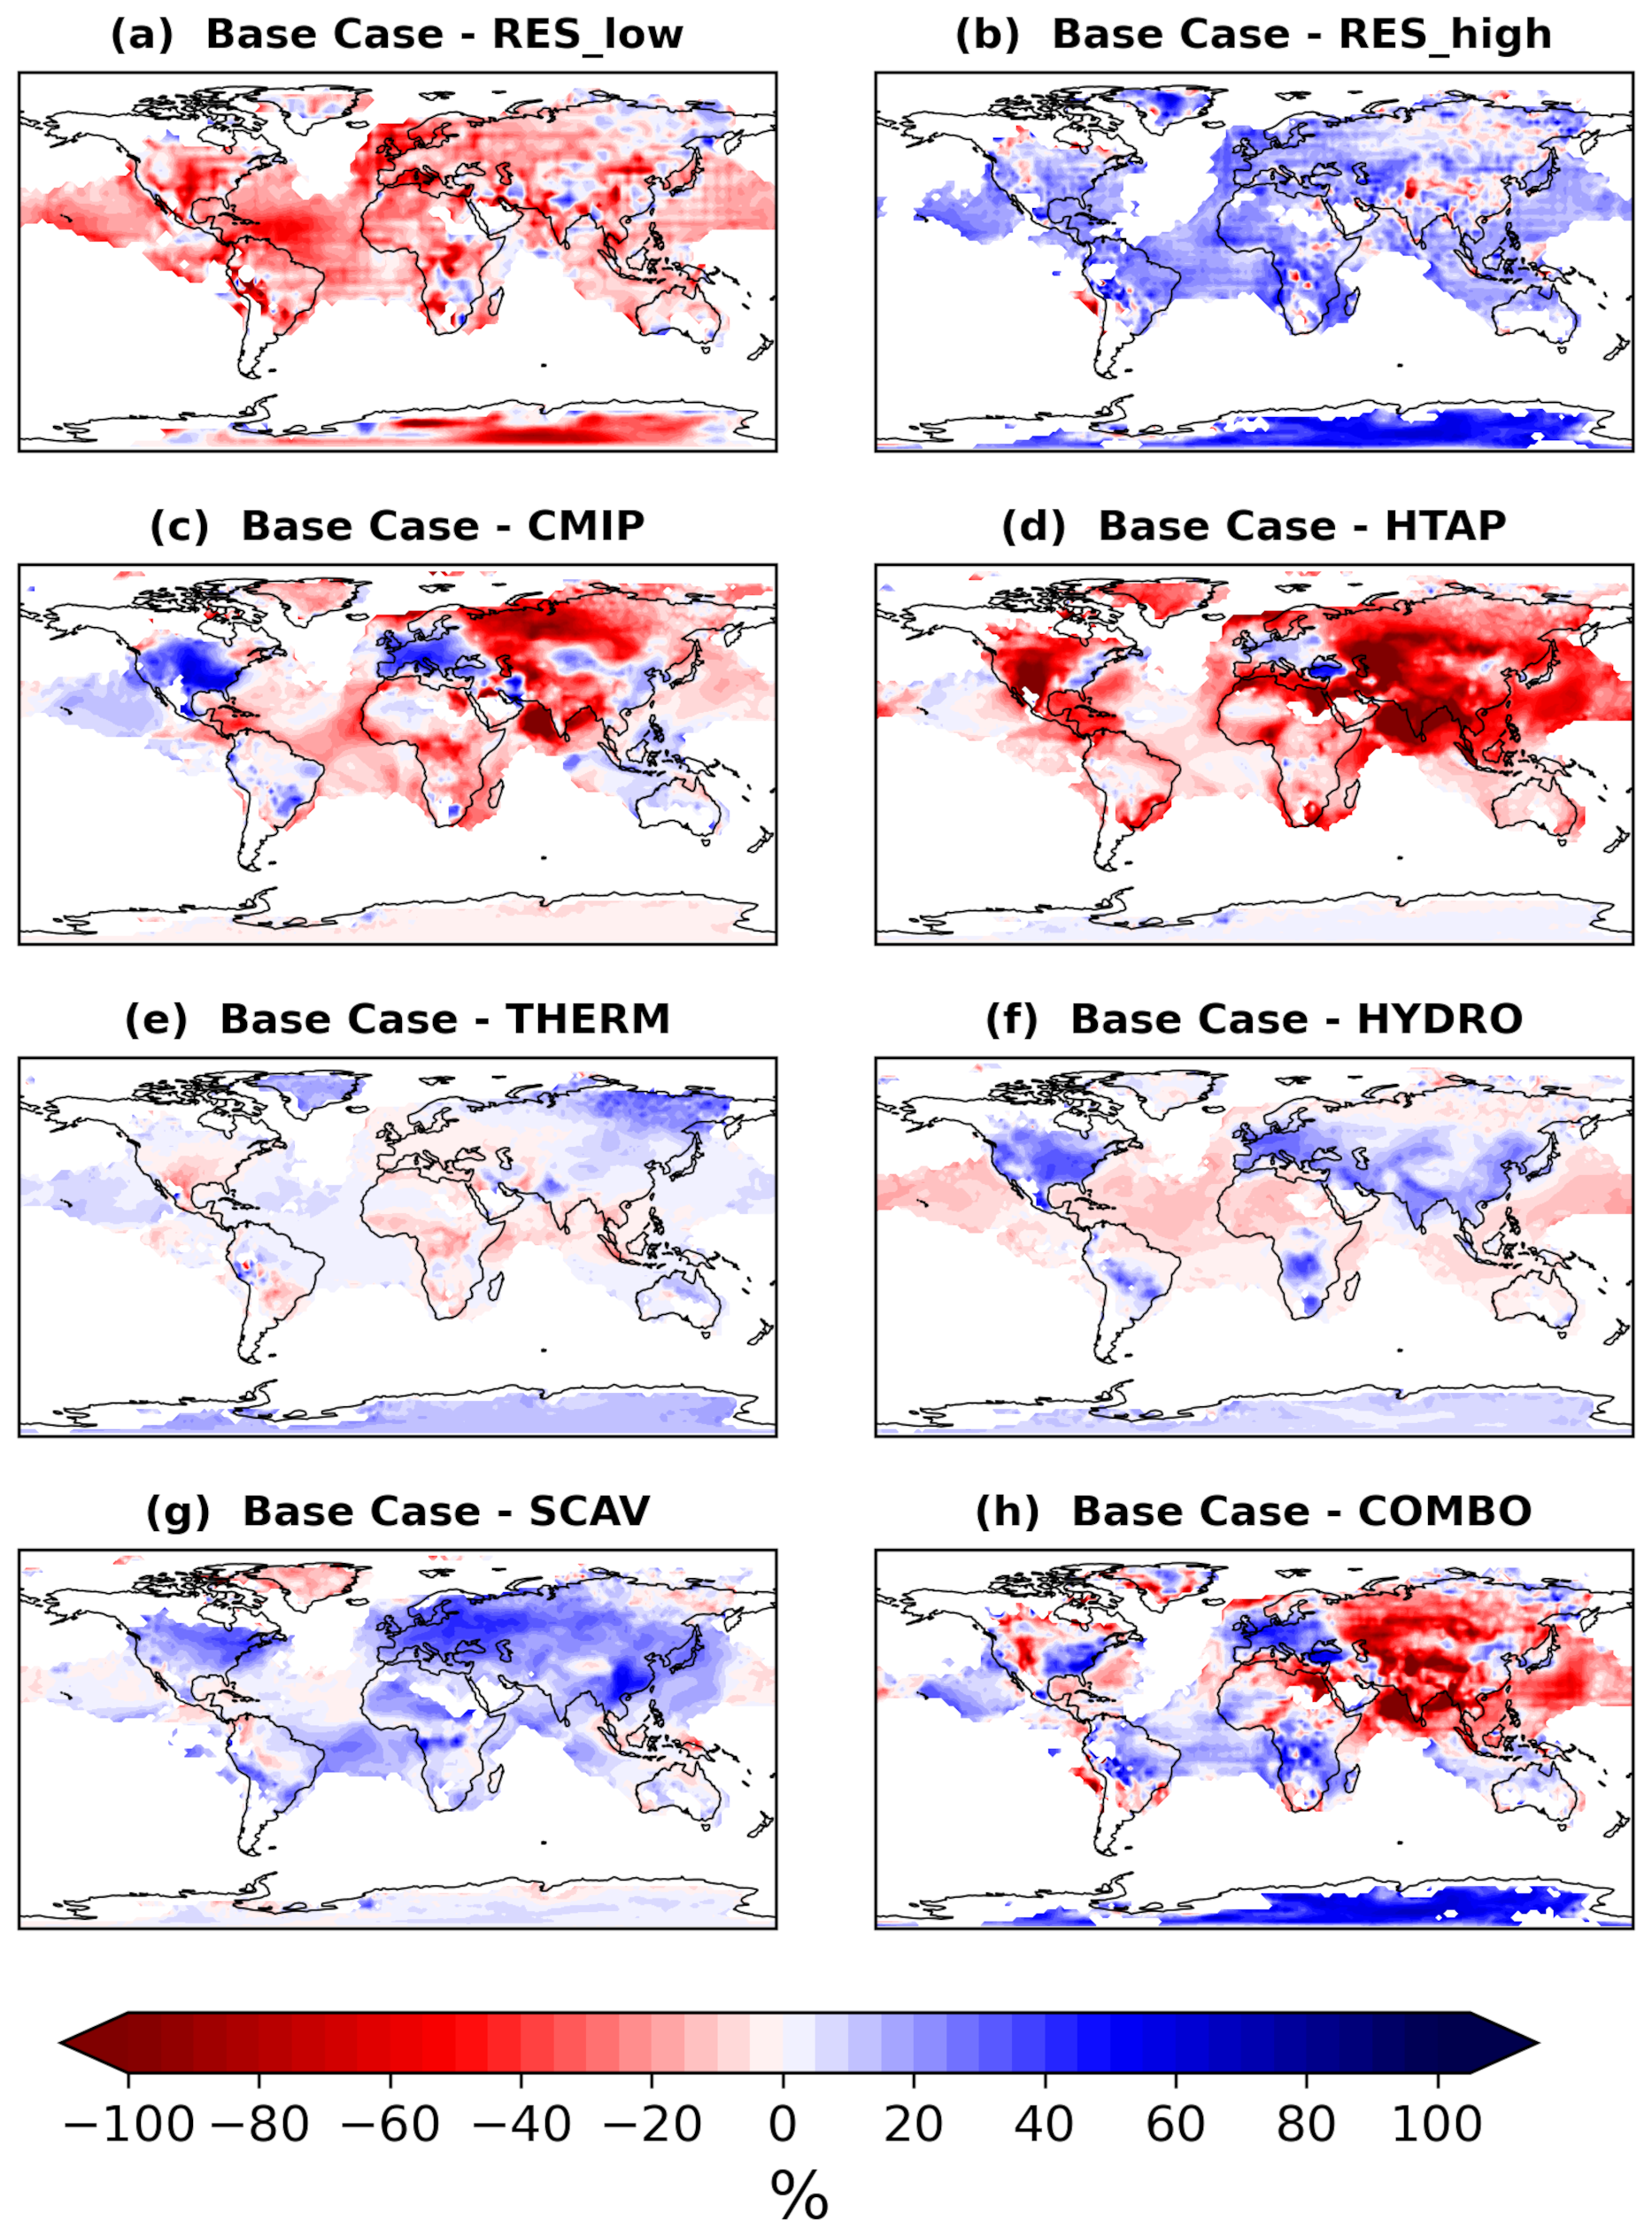
Figure 5Percentage changes of the EMAC-simulated average surface concentrations of PM2.5 NO for the period of 2010–2018 between the base case model run and the (a) “RES_low” case (b) “RES_high” case, (c) “CMIP” case, (d) “HTAP” case, (e) “THERM” case, (f) “HYDRO” case, (g) “SCAV” case and (h) “COMBO” case model runs. Negative values in red indicate higher concentrations by the respective sensitivity case and positive values in blue indicate the opposite.
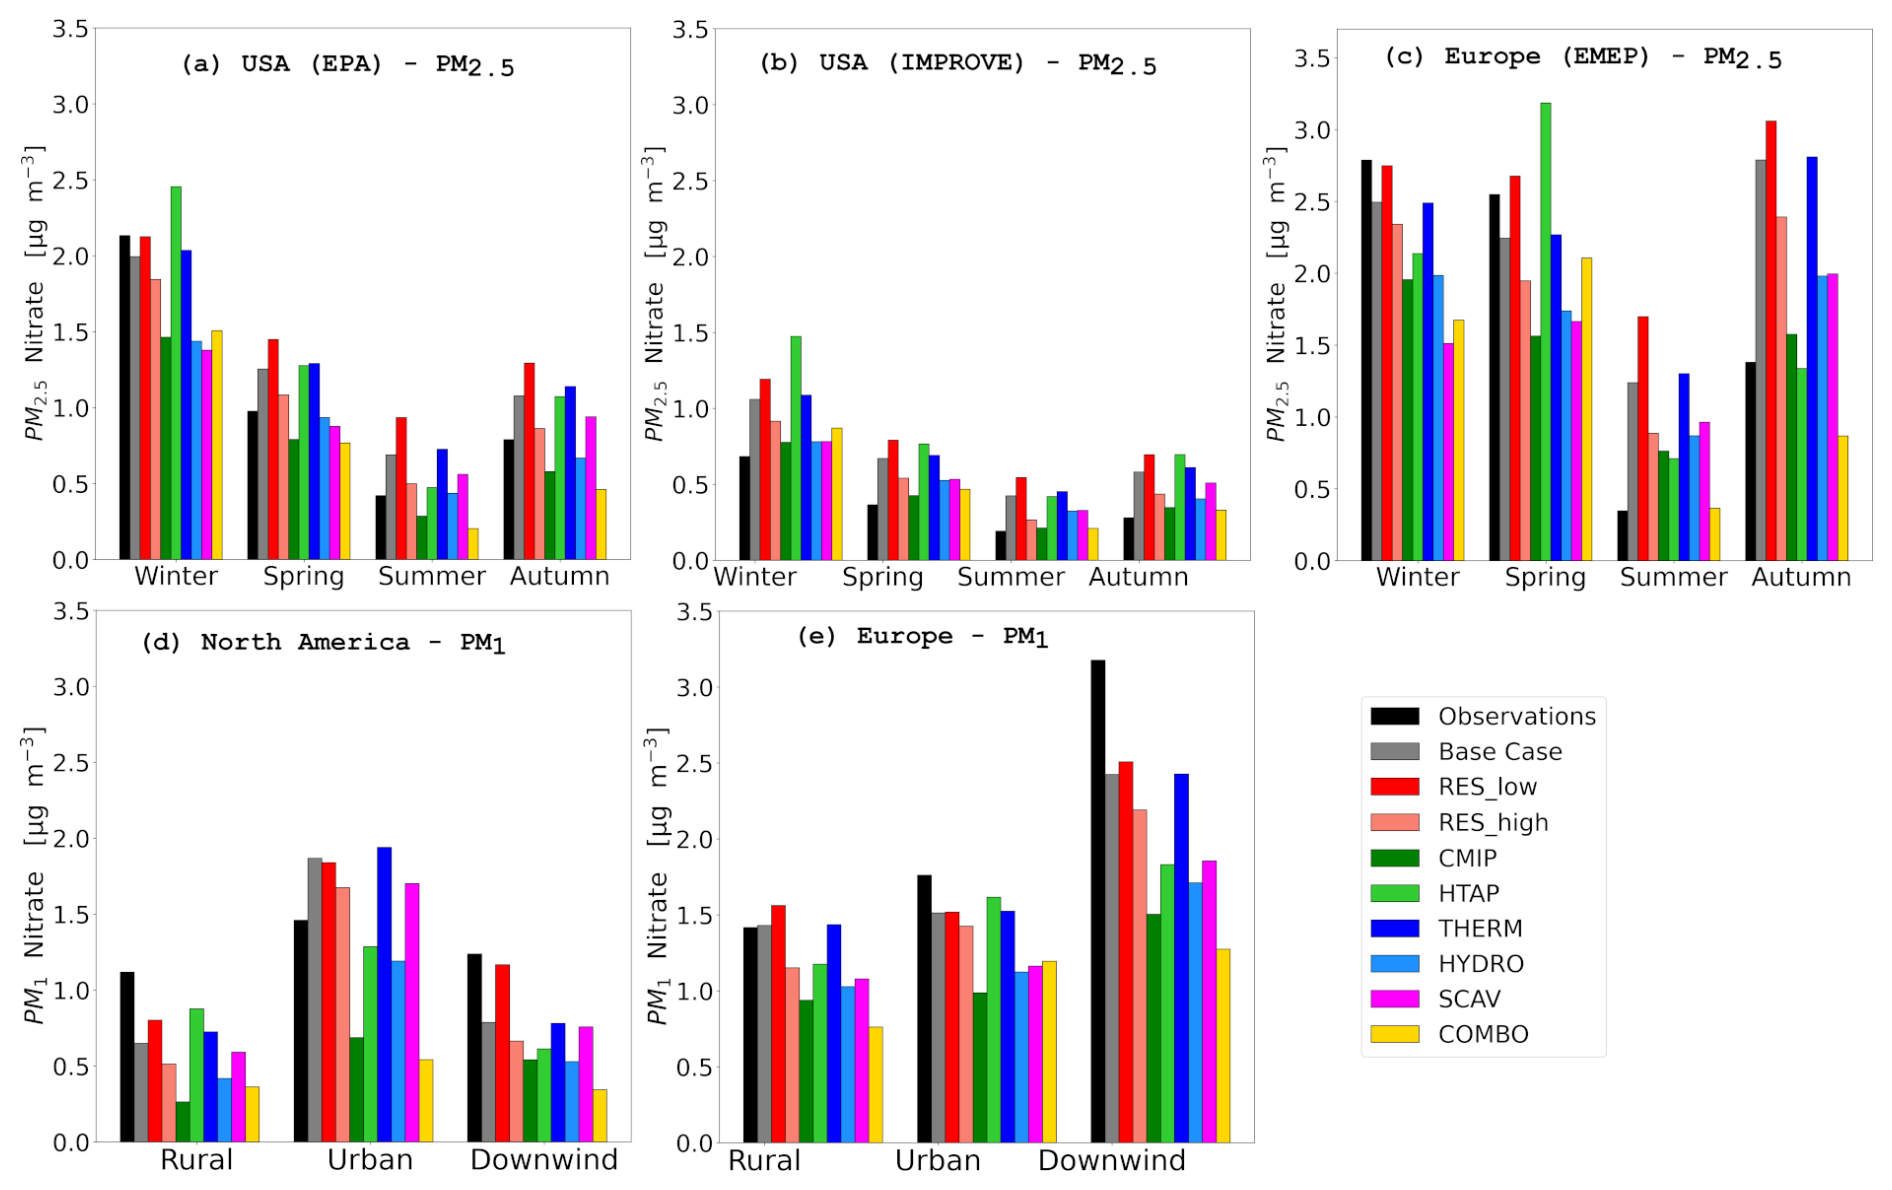
Figure 6Average seasonal surface concentrations of PM2.5 NO measured (black bars) and predicted from the base case and all sensitivity cases (colored bars) for the networks of (a) EPA, (b) IMPROVE and (c) EMEP during winter, spring, summer and autumn. Average PM1 NO surface concentrations measured by AMS instruments in field campaigns (black bars) and predicted by the base case and all sensitivity cases (colored bars) for the regions of (d) North America and (e) Europe divided into rural, urban and urban-downwind locations.
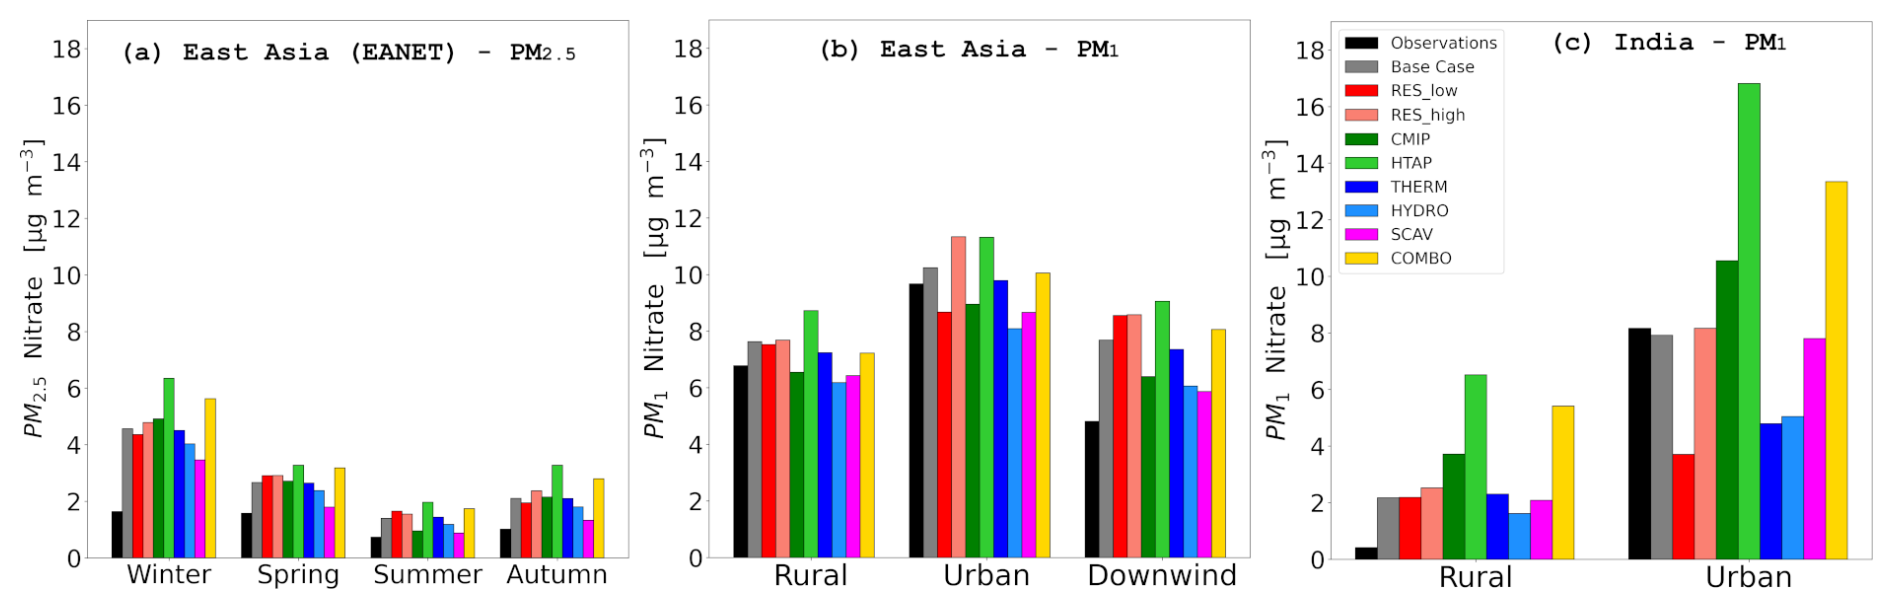
Figure 7Average seasonal surface concentrations of PM2.5 NO measured (black bars) and predicted from the base case and all sensitivity cases (colored bars) for the network of (a) EANET during winter, spring, summer and autumn. Average PM1 NO surface concentrations measured by AMS instruments in field campaigns (black bars) and predicted by the base case and all sensitivity cases (colored bars) for the regions of (a) East Asia and (b) India divided into rural, urban and urban-downwind locations.
4.1 Sensitivity to the model spatial resolution
4.1.1 Lower Grid Resolution
Employing a coarser grid resolution generally predicts higher surface PM2.5 nitrate concentrations than the base case (Fig. 5a). The largest differences (up to 80 %) are observed for North America, followed by Europe (∼ 30 %). In East Asia, changes are more localized, with some areas even exhibiting up to 15 % lower values, while the Himalayan Plateau in India shows reductions of approximately 50 %. The higher simulated aerosol nitrate concentrations in the coarse-resolution case result from the spatial dilution of NOx emissions during the re-gridding process. When high-resolution emission inventories are aggregated onto coarser model grids, localized emission hotspots (e.g., urban or industrial plumes) are spread over a larger area. This leads to artificially elevated NOx levels in regions that would otherwise be relatively clean. During nighttime, the excess NO2 in these areas reacts with background O3 to form NO3, which subsequently reacts with additional NO2 to produce N2O5. The N2O5 then undergoes heterogeneous hydrolysis on aerosol surfaces, forming HNO3 and enhancing nighttime nitrate aerosol formation (Zakoura and Pandis, 2018).
When evaluated against observational datasets, the lower-resolution sensitivity simulation results in increased overprediction biases for PM2.5 nitrate compared to the base case, for most seasons in the US and European networks (Fig. 6a–c). This trend is also reflected in the corresponding statistical metrics (Table S15). However, notable exceptions are the spring and winter over Europe and the winter for EPA network over US, where the RES_low simulation shows better agreement with observations, improving the underprediction bias seen in the base case. Similar behavior is observed in winter and autumn when compared with the EANET network, where the RES_low configuration marginally enhances model performance (Fig. 7a and Table S15). Overall, summer proves to be the most problematic season for this sensitivity, with overprediction biases reaching factors of 3 to 4 – especially in relation to EMEP observations, but also evident in the U.S. networks. Nevertheless, in terms of mean bias, the RES_low simulation improves winter predictions in three out of the four observational networks, with the IMPROVE network being the only exception.
For PM1 nitrate concentrations, the lower-resolution simulation improves the underprediction bias of the base case over rural locations in North America (Fig. 6d). While similar improvements are observed at urban-downwind sites, this comes at the cost of substantially higher MAGE and NME values (Table S16). When evaluating overall model performance using the RMSE, the base case performs better in urban-downwind regions of North America. Similarly, in urban and urban-downwind locations across Europe the lower-resolution case slightly reduces mean bias, but the improvement is offset by significantly elevated MAGE and NME scores (Table S16), resulting in poorer overall performance compared to the base case. The RES_low configuration also fails to improve predictions over rural European sites (Fig. 6e). In contrast, model predictions over rural locations in East Asia and India are improved by the lower-resolution simulation, while performance over urban areas in these regions deteriorates (Fig. 7b and c). Overall, the use of a lower grid resolution proves to be more effective for simulating PM1 nitrate concentrations over rural locations (Table 4), but performs worse over urban sites, as indicated by most statistical metrics (Table S16).
4.1.2 Higher Grid Resolution
In contrast to the results of the low grid resolution, simulations employing a higher grid resolution have yielded reduced surface PM2.5 nitrate concentrations in comparison to the base case (Fig. 5b), except over East Asia. The differences in nitrate concentrations can reach up to 50 % across North America, Europe, and India. A comparison of the high-resolution model run with PM2.5 nitrate observations, reveals that it was in fact able to improve the model performance compared to the base case, reducing the overprediction tendency (Table S17). This was true across all seasons in the IMPROVE, EPA, and EMEP networks, except the seasons which the model already slightly underpredicted nitrate concentrations, i.e. winter in EPA and winter and spring in EMEP (Fig. 6a–c). This suggests that higher spatial resolution is generally more effective at capturing periods of lower nitrate concentrations (i.e. summer) over these regions. Interestingly the use of a higher grid resolution, although not greatly impactful on the model predictions regarding the EANET network, did not yield any improvement in performance compared to observations (Fig. 7a). Overall, the “RES_high” case presents a struggle to improve on winter period comparisons, except for the IMPROVE network.
For PM1 nitrate observations, the high grid resolution provides lower concentrations worsening the underestimation of the base case simulation in most locations of North America and Europe (Fig. 6d–e), but at the same time decreasing the scatter of the predictions and the NME values (Table S18). The only exception is a modest improvement of the overprediction over urban locations in North America (Fig. 6d and Table S18). In East Asia, rural concentrations are nearly identical to the base case, but urban and urban-downwind sites are overpredicted, particularly the latter, where concentrations are nearly double the observed values and that increases the already existing bias (Fig. 7b). In India, the high-resolution simulation results in increased PM1 nitrate concentrations over urban areas, shifting from an underprediction in the base case (NMB = −5 %) to a slight overprediction (NMB = 4 %). Rural sites also show a marginal increase in overprediction (Fig. 7c).
4.1.3 Ranking
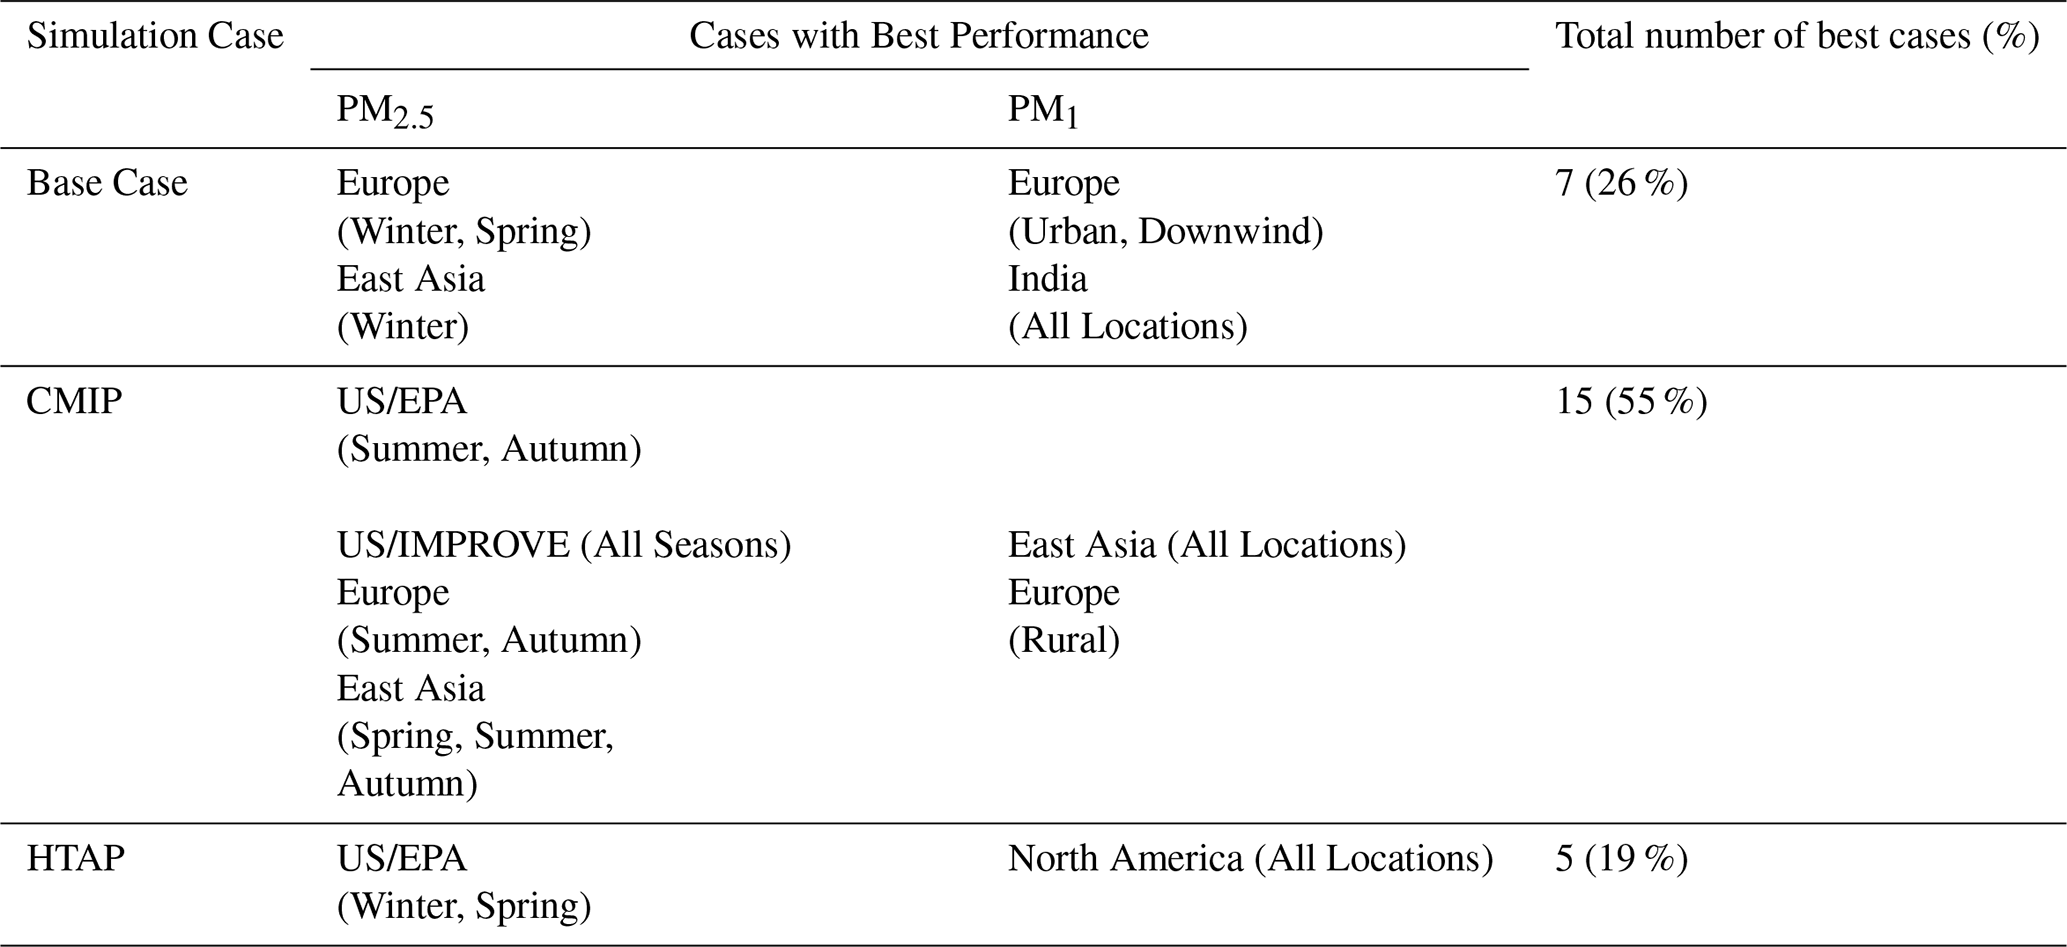
The statistical ranking among the three simulations utilizing different grid resolutions reveals that the higher resolution case dominantly outperforms the other two concerning accurate PM2.5 nitrate predictions over most regions and seasons (Table 4). Concerning the accuracy of the PM1 predictions on the other hand, the statistical ranking is evenly spread among the three configurations with the use of a lower grid resolution providing higher agreement with the observations over rural locations, while the higher grid resolution improves the performance mostly over urban locations (Table 4).
4.2 Sensitivity to anthropogenic emission inventories
4.2.1 CMIP6
The application of the CMIP6 anthropogenic emission inventory for the simulation of surface PM2.5 nitrate concentrations provides lower concentrations in most regions, except for India (Fig. 5c). The most significant reductions in surface PM2.5 nitrate concentrations are observed in North America and Europe (50 %–60 %). East Asia exhibits a comparatively smaller reduction, ranging from 10 % to 20 %. Conversely, India exhibits an increase in PM2.5 nitrate levels ranging from 30 % to 40 %. These regional differences are primarily driven by variations in surface emission fluxes between the CMIP6 and CAMS inventories. CMIP6 reports significantly lower NOx emissions, and to a lesser extent NH3 emissions, over North America and Europe (Fig. S14b, e), which contributes to the stronger reductions in nitrate aerosol levels in those regions. Conversely, the increase in nitrate concentrations over India is attributed to higher NH3 emissions in the CMIP6 inventory. In East Asia, despite the lower NOx and NH3 emissions in CMIP6, the reduction in nitrate concentrations is less pronounced. This is due to the presence of some locally elevated NH3 emissions and lower SO2 emissions in the CMIP6 inventory (Fig. S14h), which together moderate the extent of nitrate reduction in the region.
Comparison with PM2.5 nitrate observations reveals notable discrepancies. For the EPA network, CMIP6 leads to significant reductions in predicted concentrations, resulting in a consistent negative bias across all seasons (Fig. 6a), though statistical improvements are observed during all seasons except winter (Table S19). In the IMPROVE network, CMIP6 yields predictions closely aligned with observations throughout the year (Fig. 6b), improving model performance (Tables 5 and S19). The reduced PM2.5 nitrate levels over the U.S. are primarily due to lower NO emissions in CMIP6 (Fig. S6b), while NH3 emissions are slightly higher (Fig. S9b). For EMEP observations, CMIP6 leads to greater underestimations in winter and spring, while summer and autumn predictions show improved bias and statistical performance (Fig. 6c, Table S19). These reductions are linked to both lower NOx and NH3 emissions over Europe in the CMIP6 inventory (Figs. S6a, S9a). In East Asia, EANET observations show that CMIP6 slightly improves the existing overprediction bias (Fig. 7a, Table S19) and performs best across all seasons except winter (Table 5), driven by lower NOx and NH3 emissions (Figs. S6d, S9d).
Table 5Agreement rates between the base case simulation and the anthropogenic emission database sensitivity model runs, regarding the accuracy of PM2.5 and PM1 nitrate predictions, based on their root mean square error scores.
For PM1 nitrate, AMS field campaign data reveal stronger underprediction biases in North America and Europe compared to the base case (Fig. 6d–e). CMIP6 produces the lowest average estimates among all configurations for urban sites in Europe and rural sites in North America, with urban-downwind sites underpredicted by nearly a factor of two. In East Asia, CMIP6 shows better agreement with observations, with very low underprediction (NMB< 10 %) for both urban and rural locations (Table S20). In India, CMIP6 results in a ∼ 25 % overprediction in urban areas and a much larger discrepancy in rural areas, up to a factor of 10 (Fig. 7c). This is primarily driven by overestimated NH3 emissions, which outweigh the underestimation of NO2 (Figs. S6c, S9c).
4.2.2 HTAPv3
The simulation using the HTAPv3 anthropogenic emission inventory generally predicts higher PM2.5 nitrate concentrations than the base case (Fig. 5d). Notably, Europe and the eastern United States constitute exceptions, exhibiting 20 %–30 % lower concentrations compared to the base case model. This reduction is primarily driven by the lower NH3 surface emission fluxes in HTAPv3 relative to CAMS, particularly over Europe, which offsets the generally higher NOx emissions in the same inventory (Fig. S14c, f). In other regions, particularly western North America and India, the predicted concentrations are up to 100 % higher than in the base case model, with values in East Asia showing increases of 60 %–80 %. This is primarily due to the combination of elevated NOx and NH3 emissions and reduced SO2 emissions in HTAPv3, especially over East Asia (Fig. S14c, f, i), which together enhance nitrate formation in that region.
A comparison of model results with filter-based PM2.5 nitrate observations reveal substantial regional and seasonal variability. In the U.S., the HTAPv3 sensitivity simulation produces higher concentrations than the base case during winter for the EPA network and during all seasons except summer for the IMPROVE network (Fig. 6a, b). This behavior is likely driven by the overestimation of NOx emissions in the HTAPv3 inventory relative to observations (Fig. S7b), while NH3 emissions do not show a consistent pattern (Fig. S10b). For EPA, PM2.5 nitrate levels are significantly lower than the base case in summer, which represents a statistical improvement (Table S21). Predictions for spring and autumn remain largely unchanged. For EMEP observations in Europe, the HTAPv3 simulation shows a stronger underestimation of winter concentrations but a weaker overestimation in summer compared to the base case (Fig. 6c). During autumn, HTAPv3 shows the best agreement with observations among all emission sensitivity runs, with a NMB of −2 %. In spring, it results in a moderate overprediction (NMB = 27 %), in contrast to the base case, which underpredicts concentrations during the same season (NMB = −12 %). As in the U.S., discrepancies in Europe are primarily driven by NOx emissions, which are generally overestimated in HTAPv3 (Fig. S7a), while NH3 emissions tend to be underestimated (Fig. S10a). For EANET observations in East Asia, HTAPv3 leads to substantial overpredictions, ranging from a factor of 2 in spring and summer to a factor of 4 in winter and autumn. This simulation yields the highest average PM2.5 nitrate concentrations among all sensitivity runs (Fig. 7a). The emission behavior in this region is similar to the U.S. and Europe, with NOx and NH3 emissions contributing to the discrepancies (Figs. S7d, S10d).
When evaluated against PM1 nitrate concentrations from AMS field campaigns, HTAPv3 shows nearly 20 % underprediction at rural sites in Europe and a 40 % underprediction at urban-downwind locations (Fig. 6d). Nevertheless, this configuration performs well in urban areas across Europe and in both rural and urban locations in North America, showing the best agreement with observations and improved statistical performance compared to the base case (Fig. 6e, Table S22). However, urban-downwind sites in the US remain significantly underpredicted, with discrepancies approaching 50 %, similar to the base case. In East Asia and India, the HTAPv3 simulation struggles to reproduce observations, showing the highest overpredictions among all model configurations across all site types (Fig. 7b, c). In India, the overprediction is particularly severe, reaching up to a factor of 15 in rural areas, despite NH3 emissions being underestimated on average (Fig. S10c). This is likely due to the rural campaign sites coinciding with NH3 emission hotspots, which are elevated even compared to the CAMS inventory (Fig. S14f). In urban areas, predicted concentrations are approximately twice the observed value, driven by the overestimation of NOx emissions (Fig. S7c).
4.2.3 Ranking
A statistical comparison of the configurations using different anthropogenic emission inventories shows that CMIP6 provides the highest overall accuracy for PM2.5 predictions (Table 5). However, its performance during winter is relatively weak, being outscored in three of the four observational networks. No consistent pattern emerges regarding observational site types in the PM1 prediction accuracy, but at the same time each database clearly displays distinct regional strengths. Specifically, CAMS performs best in Europe and India, CMIP6 in East Asia and HTAPv3 in North America.
4.3 Sensitivity to the model treatment of the aerosol thermodynamic state and chemistry
4.3.1 Metastable state
The simulation assuming a metastable thermodynamic state (aerosols do not precipitate into solid salts at low humidity) indicates only minor discrepancies in surface PM2.5 nitrate concentrations compared to the base case (Fig. 5e). Concentrations exhibit a 10 %–15 % increase in North America and Europe, while in the Himalayan Plateau, they decrease by up to 30 %, and in East Asia, they are slightly lower.
When evaluated against PM2.5 observations, the metastable state performs nearly identically to the stable state (i.e., base case) across all observational networks, both in terms of average seasonal concentrations (Figs. 6a, b, c and 7a) and statistical metrics (Table S23). Based on performance ranking, the “THERM” case shows optimal results only for the spring season in the EMEP network, although the differences compared to the base case are marginal.
For observations of PM1 nitrate concentrations, the metastable configuration results are nearly identical to the base case model run in Europe and North America for all location types (Fig. 6d–e). In North America, rural concentrations are slightly higher in the metastable run, bringing them closer to observed values (Table S24). A similar pattern is observed in East Asia, where the metastable assumption produces concentrations comparable to the base case across all site types (Fig. 7b), with marginal improvements for urban locations (Table S24). In India, the metastable and base case results show no difference in rural areas, but values are underpredicted by about 40 % in urban areas due to the use of the metastable state assumption (Fig. 7c). This discrepancy is associated with the combination of moderate temperatures and low relative humidity at these locations, which hinder the partitioning of nitrate into the aerosol phase in the metastable assumption (Ansari and Pandis, 2000; Milousis et al., 2024). These factors contribute to the model-measurement discrepancies, particularly in urban areas with elevated nitrate aerosol concentrations.
4.3.2 Lower N2O5 uptake coefficient for hydrolysis
The simulation that incorporated a lower uptake coefficient for N2O5 hydrolysis consistently yielded lower surface PM2.5 nitrate concentrations in all regions when compared to the base case model (Fig. 5f). The simulation indicates a 20 % decrease in East Asia and a 40 % decrease in Europe and North America, reflecting the suppression of nitrate formation via the hydrolysis pathway.
A comparison of the model simulation using a lower N2O5 uptake coefficient with PM2.5 observations in the U.S. reveals a tendency to underpredict concentrations from the EPA network during winter, with a stronger bias than the base case. However, this configuration shows improved agreement with observations for the remainder of the year, as well as across all seasons for the IMPROVE network (Fig. 6a–b; Table S25). In Europe, the performance of the “HYDRO” model run is mixed: it results in a stronger underprediction than the base case during winter and spring, but its predictions for summer and autumn are considerably more consistent with EMEP measurements (Fig. 6c). For EANET observations, the “HYDRO” simulation provides better agreement than both the base and “THERM” cases (Fig. 7a).
For PM1 nitrate concentrations, the sensitivity case with a lower N2O5 uptake coefficient exhibits a pronounced underprediction bias across all location types in North America and Europe (Fig. 6d–e). The only exception is urban sites in North America, where this configuration shows a statistical improvement over the base case, with significantly reduced absolute and normalized mean errors (Table S26). In East Asia, model–observation comparisons vary notably. The “HYDRO” run shows a modest underprediction at urban (NMB = −16 %) and rural (NMB = −8 %) sites, in contrast to the overprediction observed in the base case. It also reduces the overprediction bias for urban-downwind locations, resulting in better overall agreement with observations (Fig. 7b; Table S26). In India, the “HYDRO” case yields the lowest overprediction for rural sites among all sensitivity runs, although concentrations remain substantially higher than observed up to a factor of 4 (Fig. 7c). For urban areas, the reduced N2O5 uptake coefficient leads to a significant underprediction of approximately 40 %.
4.3.3 Ranking
According to the statistical ranking in Table 6, using a lower N2O5 uptake coefficient in the EMAC model (0.002 instead of the default 0.02) is a key factor in improving its ability to simulate PM2.5 nitrate aerosol concentrations. This improvement is reflected not only in reduced average biases but also in better overall statistical performance. The enhancement is especially notable in East Asia and the U.S. networks. Furthermore, predictions of PM1 nitrate concentrations over rural areas improve in three out of the four regions examined, indicating that the “HYDRO” configuration better captures nighttime nitrate aerosol formation, which dominates in such environments. In contrast, daytime production pathways appear to be more influential in urban areas.
Table 6Agreement rates between the base case simulation and the aerosol thermodynamic state and chemistry model runs, regarding the accuracy of PM2.5 and PM1 nitrate predictions, based on their root mean square error scores.
4.4 Sensitivity to the scavenging treatment
4.4.1 Simplified scavenging treatment
The implementation of a simplified scavenging treatment for the gas phase aerosol precursors in the model (Sect. 2.3) yields substantially reduced surface PM2.5 nitrate concentrations compared to the base case (Fig. 5g). The largest differences are found for Europe and East Asia, where concentrations are reduced by approximately 60 %. Comparatively, North America exhibits a reduction of approximately 30 %, while India experiences a decline of around 10 %–20 %. These lower concentrations can be attributed to the high wet deposition fluxes in the simplified mechanism, which neglects gas-phase diffusion limitations and assumes an equilibrium between the gas and aerosol phases (Tost et al., 2007b). Additionally, the prescribed pH of 5 for clouds and precipitation is less acidic than typical for polluted regions (Feinberg et al., 2019), further enhancing nitrate scavenging.
A comparison of the “SCAV” case with observations reveals the strongest underprediction of EMEP measurements in winter among all sensitivity scenarios (NMB = −46 %), with spring values also underestimated by approximately 35 %, compared to a positive bias of around 10 % in the base case. However, overprediction biases during summer and autumn are significantly reduced relative to the base case (Fig. 6c). For the EPA network, the “SCAV” case shows a modest underprediction in winter (NMB = −33 %) and spring (NMB = −7 %), while concentrations in the other seasons are slightly overpredicted. Overall, the results are more consistent with observations than those of the base case (Fig. 6a; Table S27). A similar pattern is observed for the IMPROVE network (Fig. 6b), with the simplified scavenging treatment yielding improved statistical scores and reduced overpredictions throughout the year (Table S27). For EANET observations, the “SCAV” simulation produces lower concentrations than the base case across all seasons, reducing the overprediction bias by approximately 50 %. Overall, this sensitivity run demonstrates smaller discrepancies and improved statistical performance across East Asia compared to the base case (Table S27).
Regarding PM1 nitrate concentrations, the simplified scavenging treatment underpredicts observations more than the base case across all location types in Europe (Fig. 6e). In North America, it results in underpredictions of approximately 50 % for rural sites and 40 % for urban-downwind sites. However, for urban locations, the overprediction bias is slightly reduced compared to the base case, offering a modest improvement (Fig. 6d; Table S28). In East Asia, the “SCAV” case shows a smaller overprediction for urban-downwind sites (∼ 25 %) and nearly matches observed values at rural sites (Fig. 7b). Urban sites, however, exhibit a slight underprediction (∼ 10 %). In India, the “SCAV” sensitivity run does not significantly alter the estimates compared to the base case for either urban or rural locations (Fig. 7c). This is likely due to the high NH3 levels in the region, which bring actual cloud and precipitation pH closer to the prescribed value of 5, thereby minimizing the impact of the scavenging parameterization.
4.4.2 Ranking
The statistical ranking in Table 7 indicates that the simplified approach to wet deposition significantly improves PM2.5 prediction performance, despite relying on higher precipitation and cloud pH values than those typically observed (Feinberg et al., 2019). The regions and seasons where score improvements occur align with those observed in the “HYDRO” case (Table 6). The improvement is also evident in PM1 predictions, with the “SCAV” case outperforming the base case across all regions and location types except in Europe.
Table 7Agreement rates between the base case simulation and the scavenging treatment model run, regarding the accuracy of PM2.5 and PM1 nitrate predictions, based on their root mean square error scores.
4.5 Sensitivity to multiple key beneficial parameters
4.5.1 Overview of sensitivity analyses on aerosol nitrate concentrations
The sensitivity analyses revealed that certain individual configurations consistently improved model performance across both PM2.5 and PM1 nitrate size modes. Specifically, the use of a lower N2O5 uptake coefficient and a simplified wet scavenging scheme appeared to be the most impactful factors. The reduced uptake coefficient hindered the nighttime nitrate formation, improving PM2.5 predictions across most regions and seasons, particularly in East Asia where elevated aerosol water content and particle concentrations amplify this effect. It also improved predictions at rural PM2.5 stations in the U.S. (IMPROVE network) and brought rural PM1 nitrate estimates closer to observations in other regions. The simplified scavenging scheme, which increases wet deposition fluxes (Tost et al., 2007b), significantly reduced the overprediction bias of PM2.5 nitrate seen in the base case. Its performance was similarly strong for PM1 predictions, except in Europe. However, its assumption of a fixed cloud and precipitation pH (set to 5) is not globally realistic.
Grid resolution had a more variable impact. While higher resolution improved PM2.5 predictions, lower resolution performed comparably well for PM1 nitrate. The choice of anthropogenic emission inventory also played a critical role. The CMIP6 inventory, with lower precursor emissions, reduced the overprediction bias in PM2.5 nitrate and led to notable statistical improvements. However, regarding the PM1 nitrate predictions, this choice proved to be heavily region dependent, with the CAMS database providing increased agreement for the regions of Europe and India, the CMIP6 database doing so for East Asia and the HTAPv3 database for observations in North America.
4.5.2 Rationale Behind the COMBO Configuration
As outlined in Sect. 2.3, the COMBO simulation was designed to assess whether combining individually beneficial configurations would lead to further improvements in model performance and reveal non-linear interactions. Each sensitivity test previously modified only one parameter at a time. The COMBO setup aimed to evaluate the cumulative impact of multiple changes.
The initial COMBO design included the “HYDRO” case (lower N2O5 uptake coefficient), the “CMIP” case (CMIP6 emissions), and the “RES_high” case (higher spatial resolution). The choice of higher resolution was not only due to its better performance rankings, but also due to its ability to avoid distortion of nitrate precursor fields (Zakoura and Pandis, 2018) and better capture rapid gas-to-particle conversion near emission sources. However, this initial configuration produced unrealistically low PM2.5 and PM1 nitrate concentrations (Figs. S18 and S19 and Tables S31 and S32), likely due to the combined effect of reduced precursor emissions in CMIP6 inventory, the enhanced grid resolution and the inhibition of nighttime particulate nitrate production.
To address this, the final COMBO setup retained the “HYDRO” and “RES_high” configurations but replaced CMIP6 with the HTAPv3 emission inventory. HTAPv3 offers improved spatial accuracy by integrating regional inventories and is based on the latest version of the EDGAR database (v6). This revised COMBO configuration was selected based on both statistical performance and physical realism.
4.5.3 Combined parameter effects
The combined sensitivity simulation (COMBO), integrating the configurations of the “RES_high”, “HTAP”, and “HYDRO” cases, produced notable deviations in simulated surface PM2.5 nitrate concentrations compared to the base case (Fig. 5h). Significant reductions (60 %–80 %) were observed over the North China Plain, the Eastern U.S., and Europe. In contrast, concentrations increased over the Western U.S., Central Asia, and India.
When evaluated against PM2.5 observations, the “COMBO” case showed overall better statistical performance (Table S29). In the U.S., average concentrations are underpredicted by the COMBO case throughout the year for the EPA network (Fig. 6a), compared to the overprediction of the base case. For the IMPROVE network, the overprediction bias present in the base case was substantially reduced, and all seasons were more accurately represented with low MB values (Fig. 6b; Table S29). In Europe, the performance against the EMEP network was less consistent. While autumn bias was reduced, winter and spring predictions showed stronger underprediction than the base case, but with lower mean error (Fig. 6c; Table S29). Notably, the average summer concentrations, historically difficult for the model to replicate, were closely matched by the “COMBO” simulation (MB = 0.02 µg m−3). In East Asia, however, comparison with EANET observations revealed a decline in model performance, with increased overprediction bias across all seasons (Fig. 7a; Table S29).
Performance against PM1 observations was generally less favorable. In Europe, the “COMBO” case showed the strongest underprediction for rural sites (47 %) and urban-downwind sites (60 %), while also worsening the urban underprediction bias of the base case (31 %) (Fig. 6e). Similar patterns were observed in North America, with underpredictions exceeding 60 % across all site types (Fig. 6d). In East Asia, urban concentrations were comparable to the base case, with slight improvements at rural sites and a minor reduction in bias at urban-downwind locations (Fig. 7b; Table S30). In India, the “COMBO” case inherited the strong overprediction bias from the HTAP configuration, resulting in elevated concentrations in both rural and urban areas (Fig. 7c).
4.5.4 Ranking
Overall, the combined configuration, incorporating higher spatial resolution, a lower N2O5 uptake coefficient, and the HTAPv3 emission inventory, demonstrated strong potential for improving PM2.5 nitrate predictions, particularly during low-concentration periods (e.g., European summer) and across U.S. networks (Table 8). These results suggest that pairing an updated emission inventory with regionally detailed characteristics with high grid resolution and physically justified model parameters can substantially enhance performance. However, the same synergy was less effective for PM1 predictions, where regional imbalances, such as underprediction in Europe and persistent overprediction in India, limited the overall benefit. This highlights the challenge of achieving consistent improvements across both size modes and diverse geographic regions.
Table 8Agreement rates between the base case simulation and the combined parameters model run, regarding the accuracy of PM2.5 and PM1 nitrate predictions, based on their root mean square error scores.
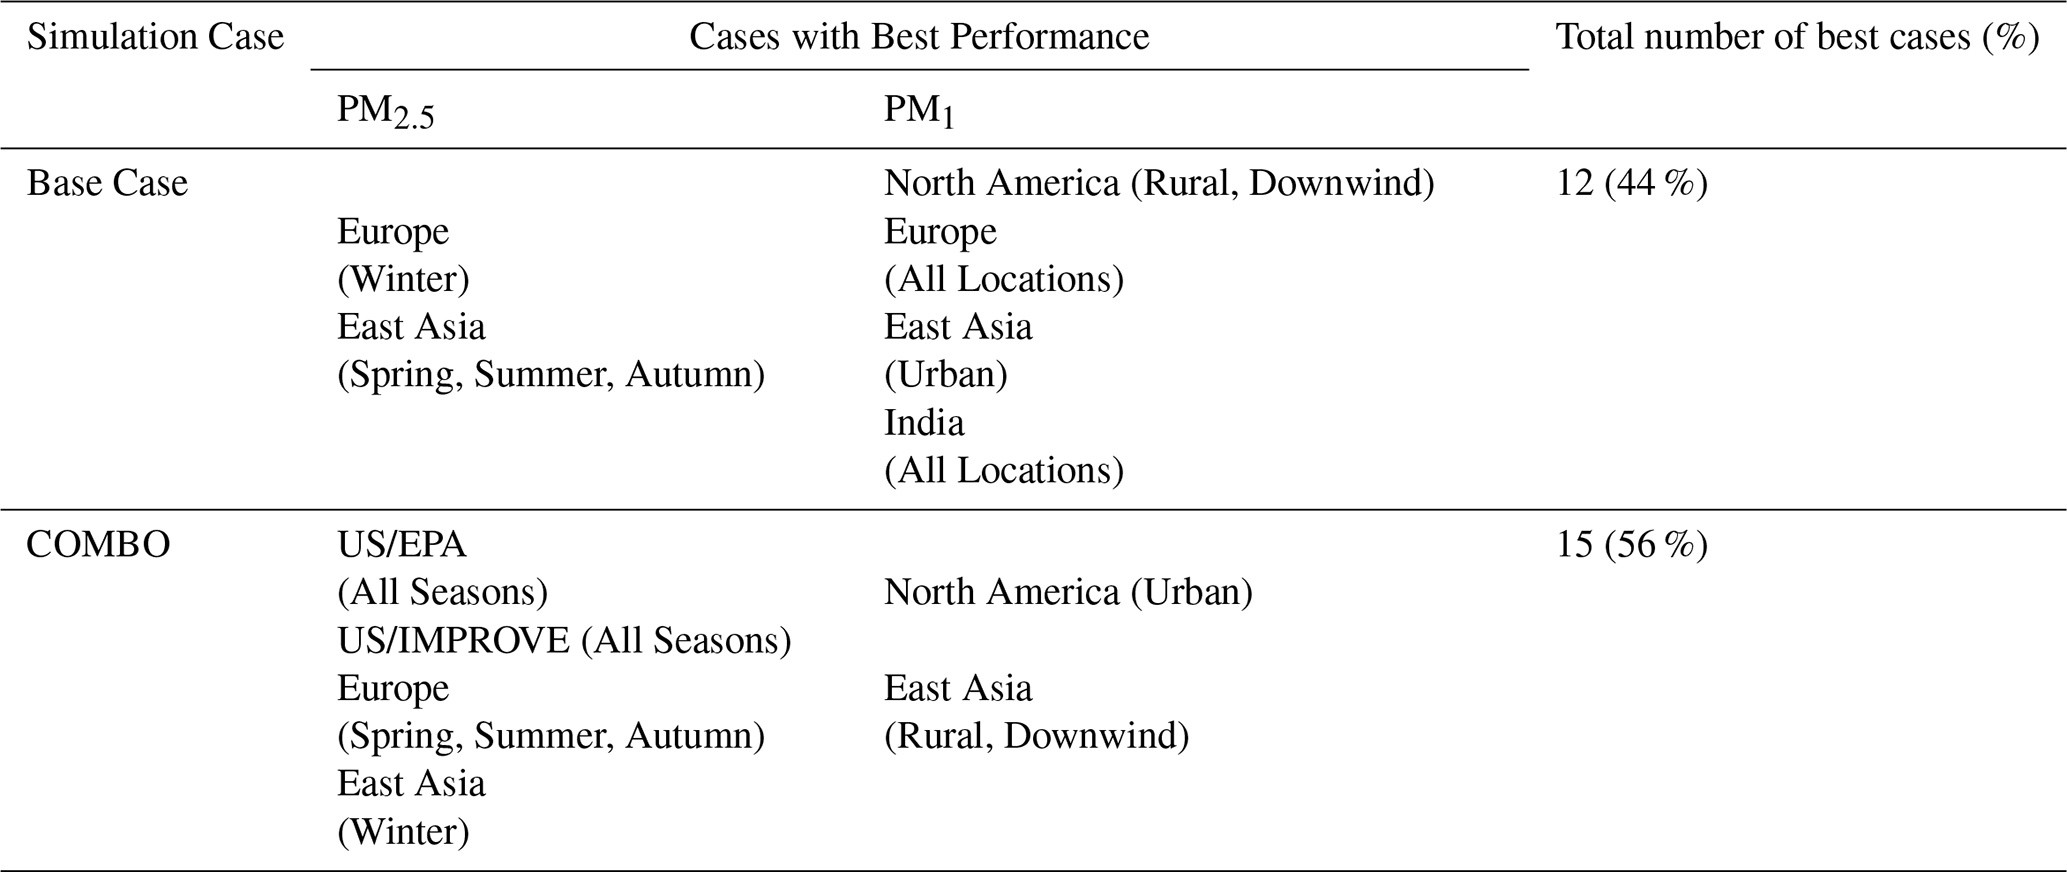
The availability of continuous time series data from monitoring networks for PM2.5 nitrate concentrations facilitates a comparison of seasonal patterns across different model sensitivities and regions. Conversely, the PM1 measurements, which were campaign-based and characterized by varying durations, lack the capability to facilitate a comparable seasonal analysis. Consequently, a selection of stations measuring PM1 nitrate concentrations in Europe was chosen, as the model in this region had difficulty in reproducing observed concentrations for this size mode. These stations, which provide hourly measurements, facilitate a detailed comparison of the diurnal variation of modeled and observed data. Finally, this section includes an analysis of the total tropospheric burden of nitrate aerosols. This analysis compares estimates from all sensitivity cases to assess their global-scale implications. This multi-scale approach aims to highlight the temporal dynamics and atmospheric significance of nitrate aerosols in relation to different modeling configurations.
5.1 Seasonal variation of PM2.5 concentrations
Figure 8 presents the seasonal patterns of PM2.5 predictions from model sensitivity runs and measurements obtained from observational networks in the specified regions. For the EMEP network, all sensitivity simulations consistently underpredicted the PM2.5 concentrations from February to April, with the largest discrepancies observed in March, ranging from 40 % for the “COMBO” case to 55 % for the case using a simplified scavenging treatment. It is noteworthy that the “HTAP” case is the only model run that accurately reproduces this period, including the peak concentration observed in the measurements in March. This peak in March concentrations is primarily due to a few EMEP stations reporting unusually high monthly mean PM2.5 nitrate concentrations (exceeding 35 µg m−3). Specifically, the Ispra station in Italy recorded such a peak in 2012, while three stations in France (Guipry, Verneuil, and Revin) reported similarly high values in March 2013 and 2014. These high concentrations are likely linked to local emissions, particularly from residential heating and livestock, which are often underrepresented in emission inventories during colder months (Tichý et al., 2023). Additionally, the spatial mismatch between point-based observations and grid-averaged model outputs may further contribute to the discrepancy. The fact that only the “HTAP” simulation captures these peaks supports the conclusion that the underestimation can be attributed to local emission inaccuracies in the other inventories. Conversely, from April to December, most sensitivity cases exhibit an overprediction of observed concentrations, except for the “HTAP” and “COMBO” cases after October. The latter is the only configuration that successfully captures the observed summer minimum. The most pronounced overestimations are observed in the run with the lower spatial resolution as well as the base and “THERM” cases, with concentrations reaching up to twice the observed levels in October. In contrast, the “CMIP” and “HYDRO” cases exhibit smaller discrepancies between model and measurement, with model overestimations of approximately 40 %. While all model cases captured the general seasonal cycle, the “HTAP” and “COMBO” cases did not capture the exact timing of the second maximum, which was shifted two months earlier and showed a stronger post-summer decline compared to the other model runs. The results of the “CMIP” case, followed by the “RES_high” and “HYDRO” cases, give the closest agreement with observations, particularly at low nitrate concentrations. Overall, the magnitude of model overpredictions is most pronounced during summer and early autumn. The discrepancies between model predictions and observations for this network can be partly attributed to the evaporation of semi-volatile nitrate aerosols from sampling filters under warm conditions (Ames and Malm, 2001; Docherty et al., 2011). This effect is amplified by the use of nylon filters in EMEP samplers, which are known to increase evaporation rates (Yu et al., 2005).
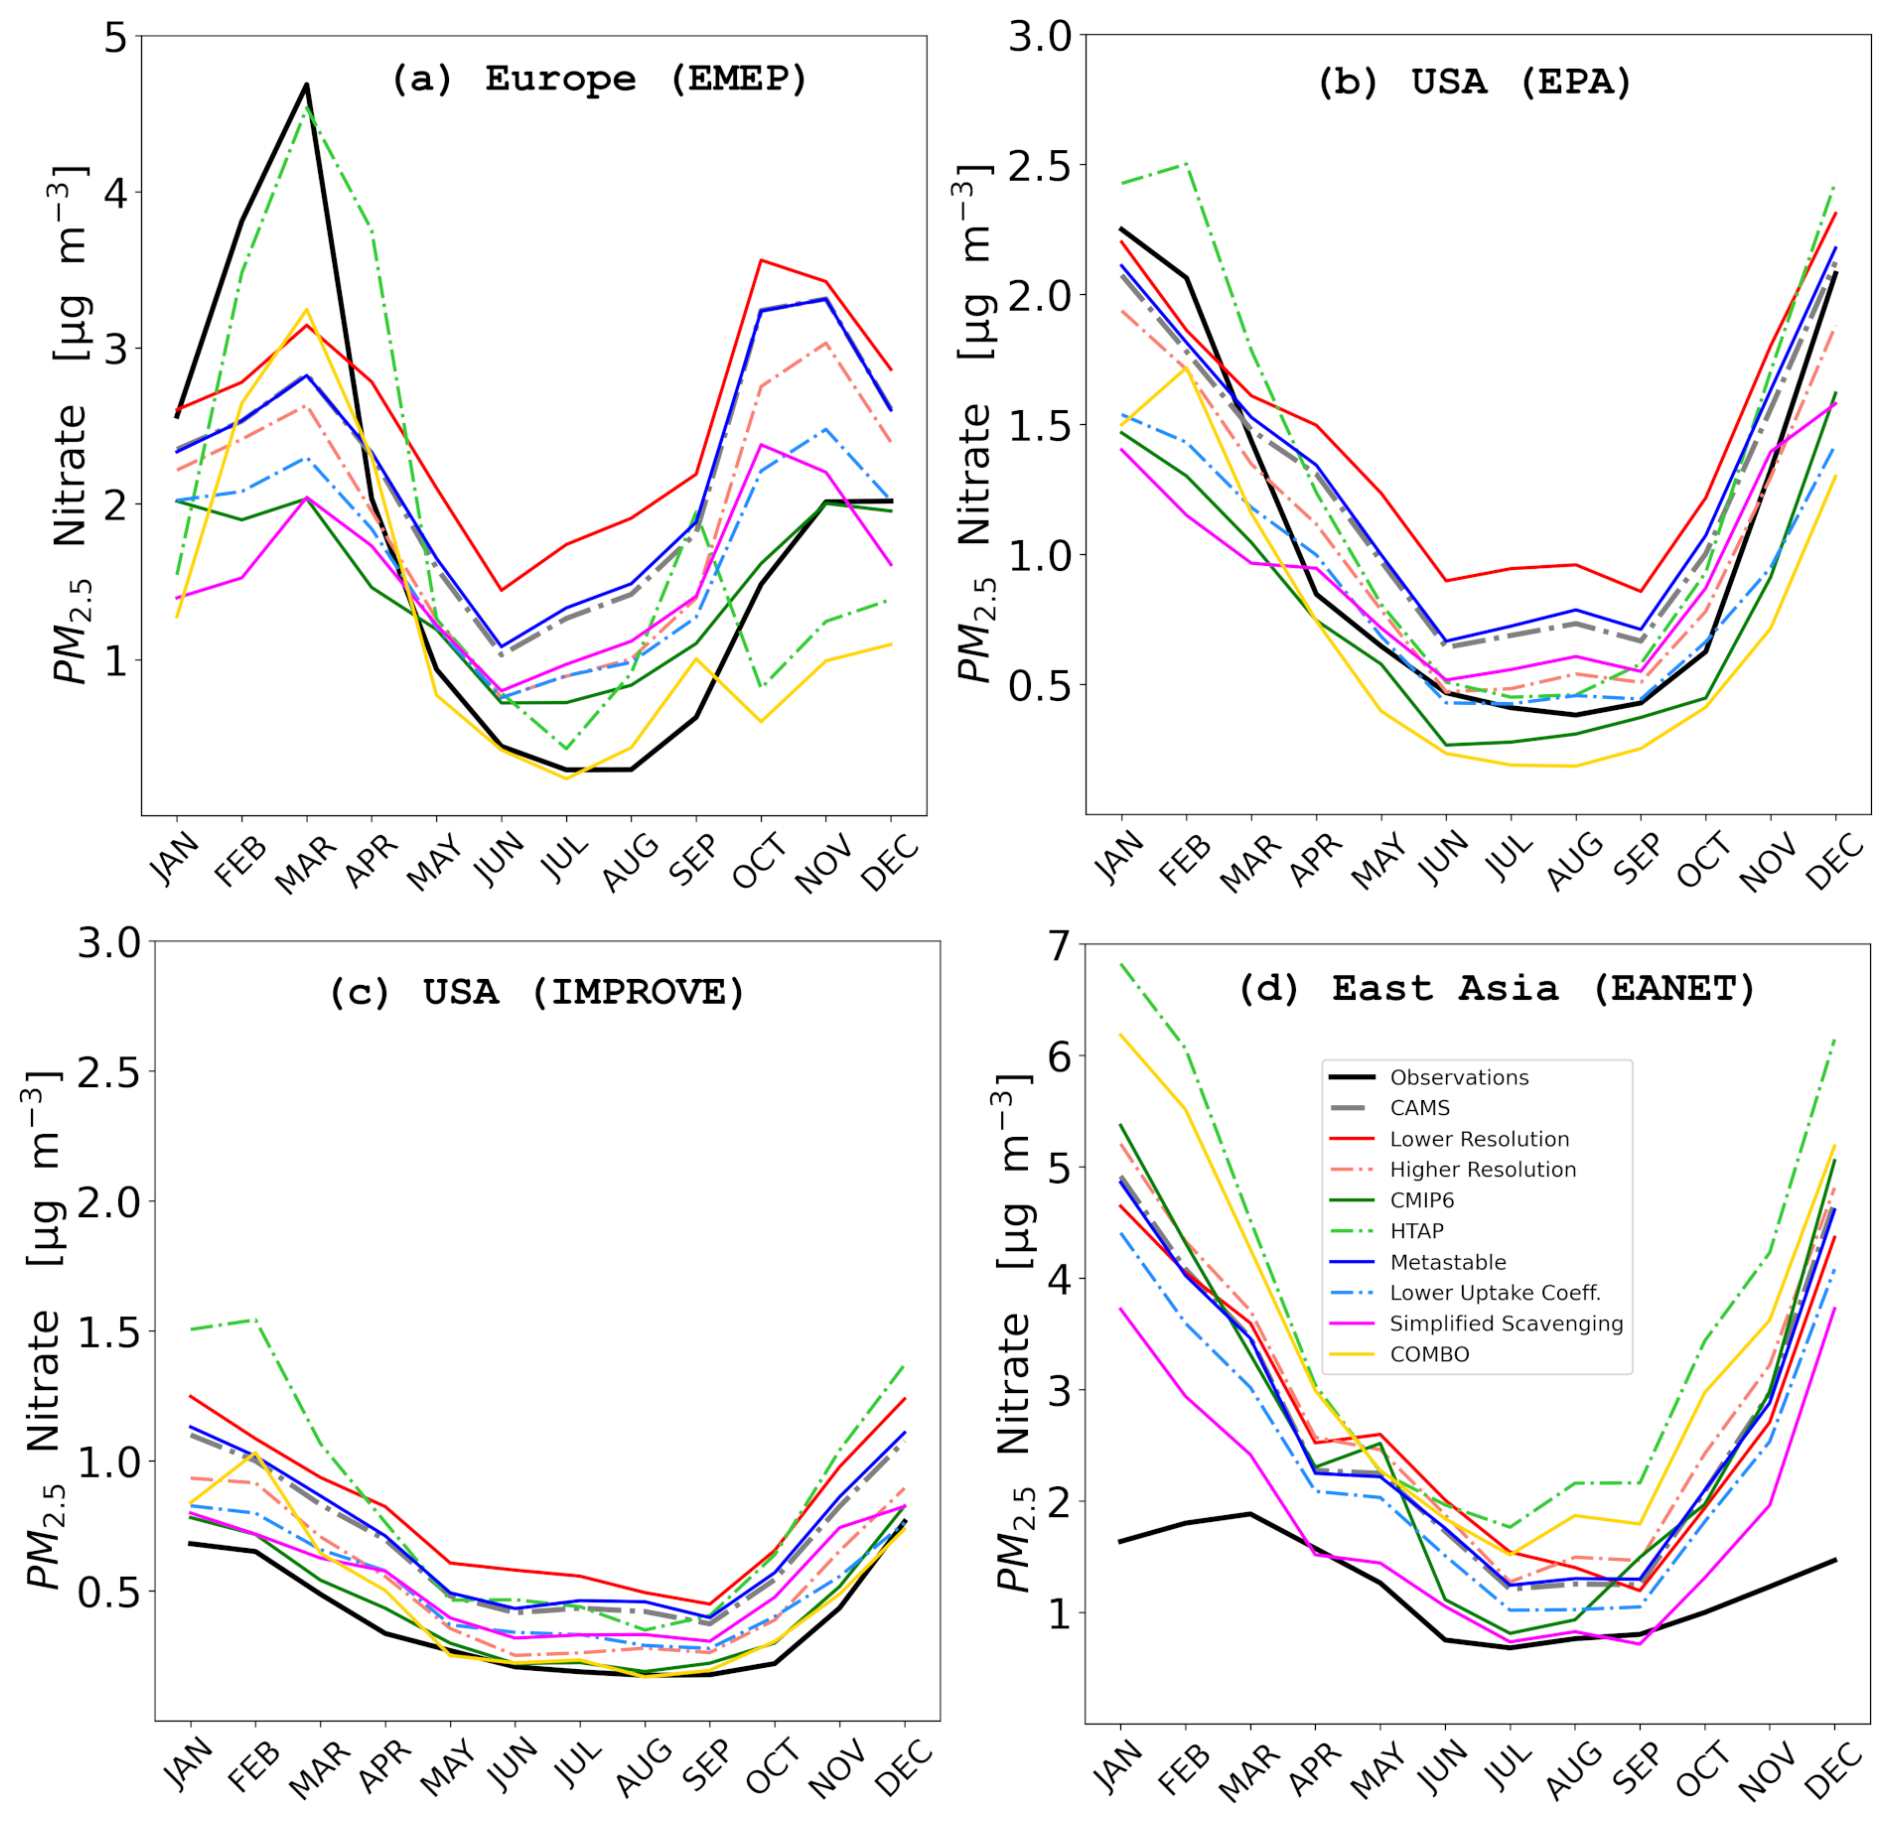
Figure 8Seasonal variation of measured (black lines) and predicted (colored lines) PM2.5 NO surface concentrations from the base case and all sensitivity model cases for the networks of (a) EMEP, (b) EPA, (c) IMPROVE and (d) EANET.
A similar seasonal pattern is observed in the USA when comparing model outputs to EPA measurements, with underpredictions of observed values from January to April and overpredictions from April to December. Exceptions include the “CMIP” and “HTAP” cases. The “COMBO” run shows the strongest underprediction from April onwards, with discrepancies reaching nearly a factor of 4.5 at the beginning and end of the year. In contrast, the lower-resolution case reveals the most substantial overprediction, with concentrations surpassing observations by a factor of 2 in August. The sensitivity model runs with different anthropogenic emission inventories demonstrate contrasting behaviors, with the HTAPv3 consistently overpredicting the measured concentrations and the CMIP6 underpredicting them. Despite these biases, the seasonal variation is adequately captured in all model cases, with the high-resolution and “HYDRO” model runs demonstrating the most optimal overall performance. As in Europe, the largest overprediction biases occur during warmer months, likely influenced by evaporation losses from filter samplers under high temperatures. For the IMPROVE network, all model cases exhibit overpredictions of PM2.5 concentrations throughout the year, with more pronounced discrepancies observed during colder months. During these months, the “HTAP” scenario shows differences up to a factor of 2.5 in February and a factor of 2 in December, while the low-resolution scenario shows comparable deviations in spring and summer. Among the sensitivity runs, “CMIP” provides the best agreement from January to April, followed by the “COMBO” case from May to December, highlighting their strength in replicating periods with lower average nitrate concentrations.
The EANET network shows a similar seasonal variability to the IMPROVE network, with all model cases consistently predicting higher concentrations than observed throughout the year, while broadly reproducing the observed seasonality. The most pronounced overpredictions occur during the cold months, with the HTAPv3 emission inventory exhibiting the most significant deviations of up to a factor of 3.5 in January. These wintertime biases cannot be attributed to filter evaporation artifacts, as in other regions, but are more likely due to missing heterogeneous chemical pathways in the model. Such pathways – important for sulfate formation during haze and dust events – are especially relevant for PM2.5 due to its larger particle size (Elser et al., 2016; Ma et al., 2017; Zheng et al., 2022). Their absence leads to an underestimation of sulfate aerosol (Fig. S6), leaving excess free ammonia (NH3) available to form nitrate, thus contributing to its overprediction. This effect is further amplified by high relative humidity, which is more common in colder months, explaining the seasonal pattern. Among the sensitivity cases, the “SCAV” run shows the best overall agreement with observations, maintaining deviations within 10 % from April to September, suggesting that the intricate aerosol scavenging process included in the base case may potentially underestimate the wet deposition fluxes of particulate nitrate in this region. The “CMIP” case also performs well, particularly during the spring and summer periods, with the “HYDRO” case also reducing model-observation biases throughout the year and particularly for lower concentration periods.
5.2 Diurnal variation of PM1 concentrations
Figure 9 presents a comparison of the diurnal variation of the simulated PM1 nitrate concentrations from the base case and sensitivity model runs against hourly observations from seven European stations. At Birkenes, most simulation cases can capture the observed diurnal pattern, with concentrations peaking in the early morning and decreasing in the late evening. However, the low-resolution case deviates significantly, with concentrations that are twice the observed values. The high-resolution case results are closest to the observations, suggesting that a higher grid resolution is more effective in capturing the variations in aerosol nitrate concentrations induced by anthropogenic activities during the day. Conversely, the “SCAV” model run exhibited the most significant underprediction, reaching a factor of 2.
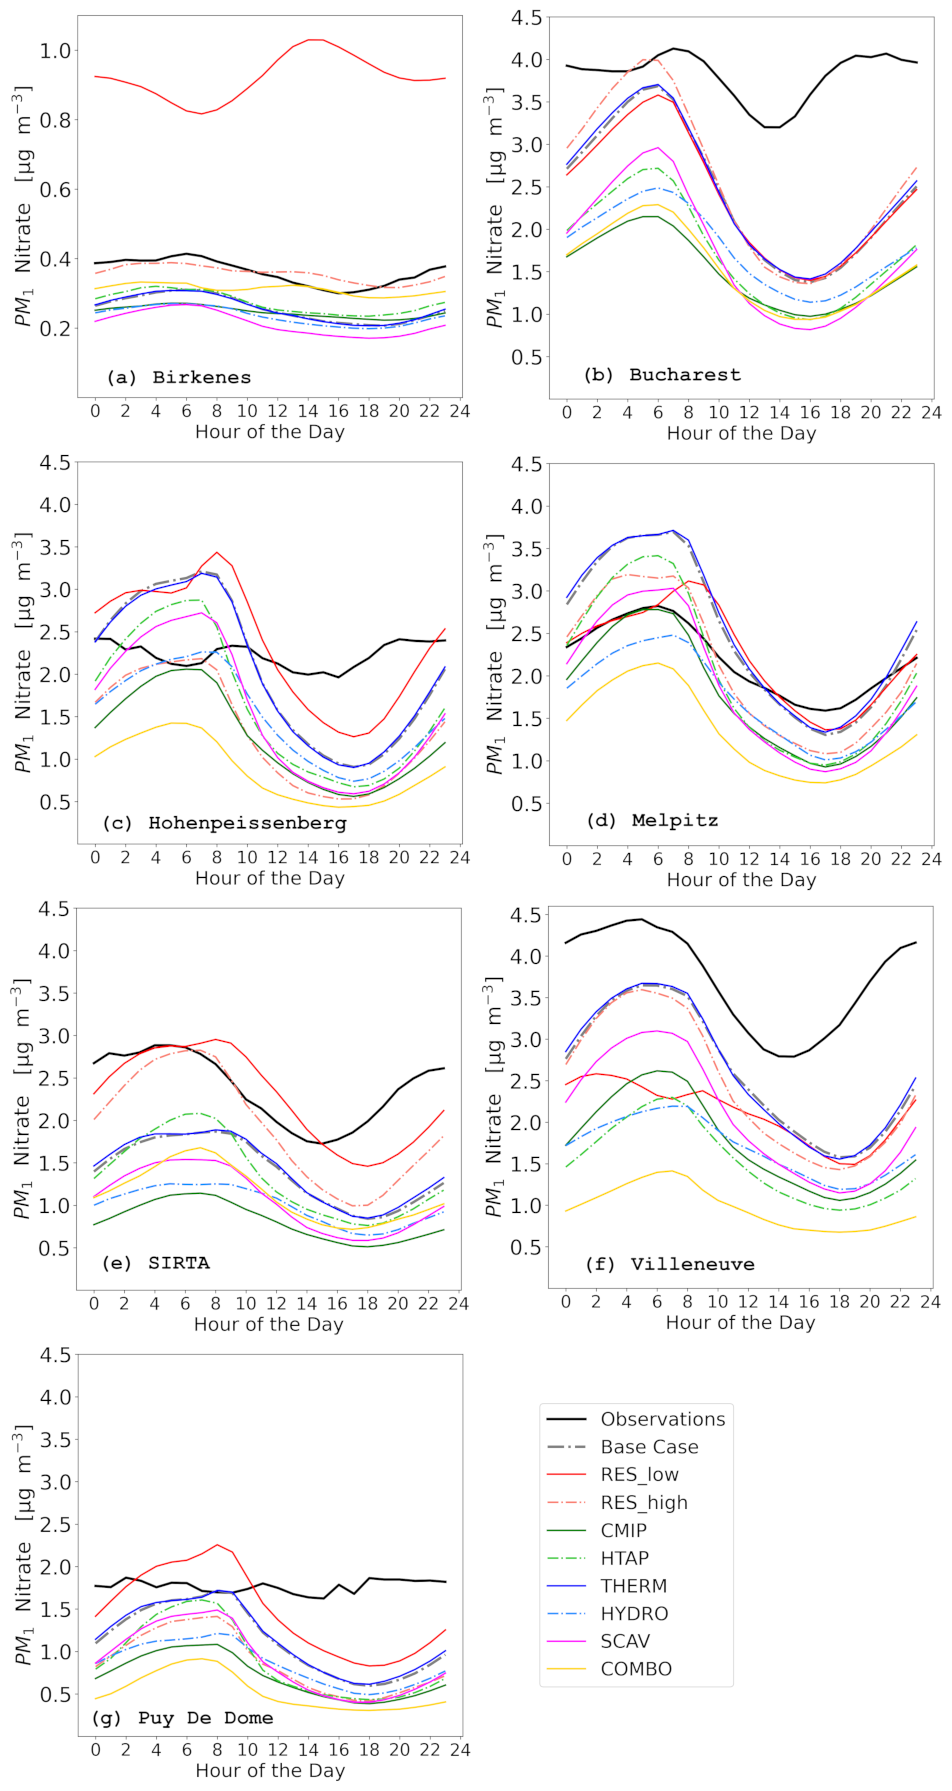
Figure 9Diurnal evolution of measured (black lines) and predicted (colored lines) PM1 NO surface concentrations from the base case model and all model sensitivity cases for the stations at (a) Birkenes, (b) Bucharest, (c) Hohenpeissenberg, (d) Melpitz, (e) SIRTA, (f) Puy De Dôme and (g) Villeneuve.
In Bucharest, the model sensitivities yielded a comparable morning peak, albeit smaller than the observed value, occurring approximately two hours earlier than the observed peak. Although an evening minimum of PM1 nitrate is predicted at a similar time, the model significantly underpredicts afternoon concentrations, with the discrepancy being twice as large as that for the morning values. The simulation with the high-resolution had the best performance compared to the other cases for this station, which has a diurnal pattern similar to the previous station, followed by the base and metastable state assumption. The “SCAV” case demonstrates the most significant diurnal variability among the rest of the sensitivities, exhibiting a pronounced decrease in concentrations during the transition from day to night.
At Hohenpeissenberg, the model results fail to reproduce the observed early morning minimum, except for the high-resolution, “HYDRO”, and “CMIP” cases. Predicted late morning maxima and afternoon minima are lower than the observations in most cases. During the early morning hours, the three abovementioned cases demonstrate the smallest discrepancies with the observations, while the low-resolution exhibits a stronger agreement in the afternoon due to a less pronounced decline in the modeled concentrations. The “COMBO” case exhibits the largest overall discrepancies, underpredicting measurements throughout the day, most notably by slightly more than a factor of 2 in the late afternoon. The elevation of the station, 300 m above the surrounding area, serves to reduce the influence of anthropogenically influenced air masses, thereby reducing the variability observed in the hourly values. However, this is not reflected in the model results.
At Melpitz, the observed diurnal pattern is well reproduced by the model results. In most sensitivity cases, morning values are marginally higher than observed values, while evening values are slightly lower. The CMIP6 emissions demonstrate the most accurate morning values among the diverse model runs, while the base and “THERM” cases exhibit more precise evening concentration predictions compared to the others. The lower-resolution run demonstrates the most overall agreement with observations throughout the day, attributable to the less pronounced maximum and minimum peaks. In contrast, the “COMBO” case exhibits the least agreement for this station.
For the SIRTA station, the model results adequately capture the diurnal pattern, though the evening minimum values are predicted three hours later than observed. The lower- and higher-resolution cases demonstrated an enhanced representation of the morning maximum compared to the other cases, while the lower spatial resolution exhibited superior prediction of the evening minimum compared to all other sensitivities. This case also demonstrated a less pronounced transition from daytime to nighttime values, similar to the previous comparison. The other model sensitivity cases underpredict the observations, with discrepancies ranging from 40 % (HTAP case) to a factor of 3 (CMIP case).
At Puy De Dôme, the model results fail to reproduce the diurnal variation of the observations. As this station is located on one of the highest peaks of the Chaîne des Puy, the station is representative of the regional atmospheric conditions. This characteristic is evidenced by the absence of a pronounced diurnal variation in PM1 levels, in contrast to what is observed in more polluted locations such as Bucharest and SIRTA. Morning concentrations are slightly overestimated only by the low-resolution case (by 29 %), while all other configurations tend to underpredict. Evening values are consistently underestimated across all sensitivities, while observations showing nearly constant levels during that period. The lower-resolution run exhibits the least deviation from observations in the afternoon, while the base and “THERM” cases demonstrate more accurate performance in the early morning.
At Villeneuve, the observed diurnal pattern is generally well reproduced by the model results, except for a three-to-four-hour delay in the observed evening minimum. It is evident that all cases exhibit an underprediction of the observed concentrations, with the most pronounced discrepancies observed in the “COMBO” sensitivity case, reaching up to a factor of 4, and the least significant discrepancies observed in the base and “THERM” cases, at approximately 60 %.
The analysis indicates that the grid resolution is the most critical factor in reproducing the diurnal variability of PM1 nitrate concentrations in Europe. For stations exhibiting regional characteristics (Hohenpeissenberg, Melpitz, and Puy De Dôme), the lower spatial resolution provides optimal predictions during the day, while it more accurately captures evening and nighttime values. The observed discrepancy during nighttime hours can be attributed to the distortion of NOx fields resulting from the larger grid cells. This distortion leads to elevated nitrate radical concentrations and increased nitrate aerosol production during nighttime hours, a process that has the greatest impact on rural areas (Zakoura and Pandis, 2018). Consequently, the low-resolution case results in increased nighttime concentrations that approximate the observed values. The base case and metastable state assumption demonstrate satisfactory performance across all stations, while the use of a lower N2O5 uptake coefficient provides minimal improvement compared to the base case. For the sensitivity model runs employing different emission inventories, the HTAPv3 outperforms the CMIP6; however, the agreement between modeled values and observations remains less than that for the base case. Finally, the simulation that combined multiple sensitivity factors resulted in the largest underprediction between model predictions and observations across most stations.
Table 9Names, locations and data availability of the stations used for the comparison of diurnal PM1 NO concentrations. The location type of each station is also categorized as rural (RUR) or urban-downwind (DW) locations.
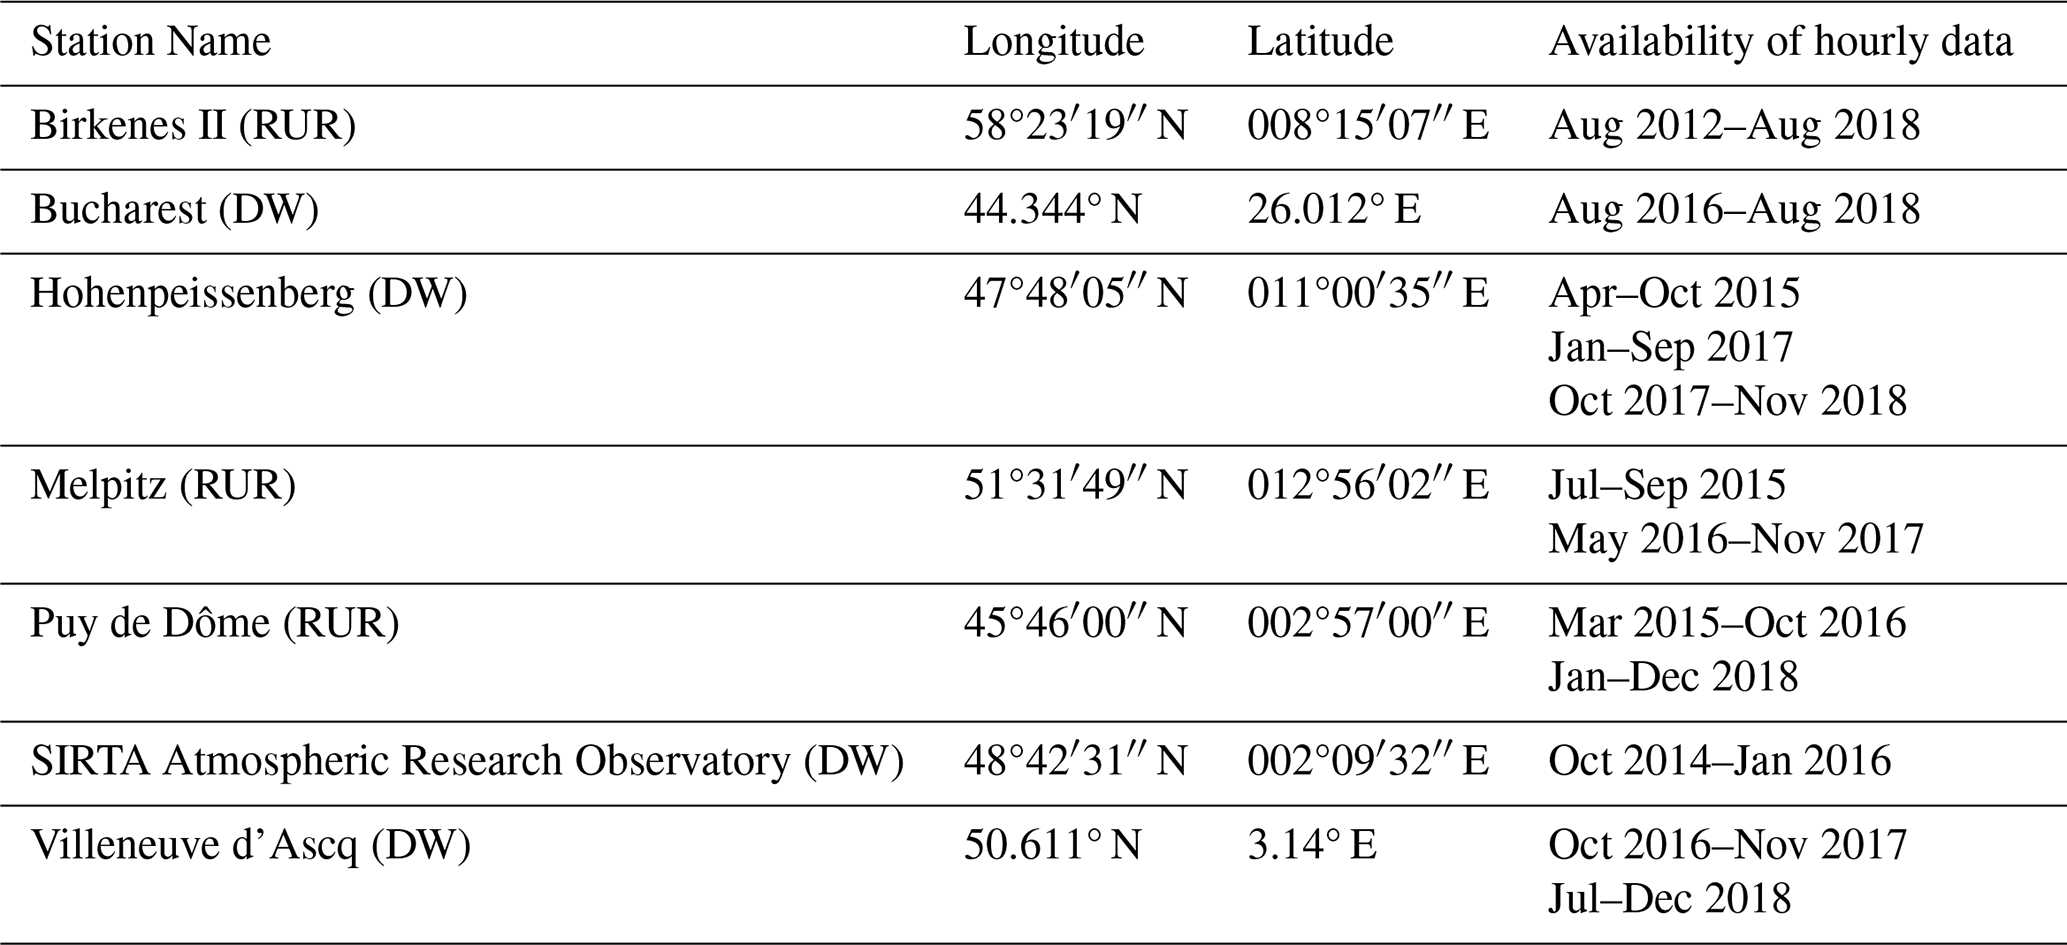
Overall, accurately capturing the diurnal variation of PM1 nitrate concentrations remains a persistent modeling challenge. A primary contributing factor is the diurnal cycle of precursor emissions. While standard emission inventories generally lack sub-daily temporal resolution, the EMAC model addresses this limitation by applying hourly scaling factors (Kerkweg et al., 2006a). These scaling factors are based on predefined temporal profiles that vary by region and sector and are typically derived from observational data or detailed inventories. This approach enables a more realistic representation of the daily variability in emissions of key precursors such as NOx and NH3 throughout the day. Another important factor is the model's ability to represent the diurnal evolution of the Planetary Boundary Layer (PBL), particularly during the day-to-night transition. This is crucial for simulating pollutant dispersion. The ECHAM5 core (Roeckner et al., 2006), which resolves PBL dynamics, interacts with time-varying emissions to influence the vertical distribution and mixing of aerosols and their precursors. This coupling is especially important for simulating nitrate formation, which is highly sensitive to both chemical and meteorological conditions. The impact of these dynamics is more pronounced when comparing model predictions with observations from high-altitude stations. At such elevations, the diurnal variation in PBL height is typically less pronounced due to reduced sensitivity to surface heating and cooling, and the influence of orography. In contrast, lower-altitude sites experience more significant PBL fluctuations driven by local heating rates. However, the model's coarse spatial resolution limits its ability to resolve fine-scale orographic features. As a result, the relatively stable PBL heights observed at isolated high-altitude stations are not adequately represented in the model.
5.3 Tropospheric burden of particulate nitrate
The global tropospheric burden of aerosol nitrate, defined as the total amount (in Tg) present in the Earth's troposphere and averaged over the entire period from 2010 to 2018, simulated by the base case and the sensitivity model runs is presented in Table S33 and Fig. 10. The base case estimates a burden of 0.7 Tg, closely matching the multi-model average of 0.63 Tg reported by Bian et al. (2017). The “RES_low” case gives the highest burden of 0.89 Tg, representing a 27 % increase compared to the base case estimate. This is attributable to larger grid cells, which have a distorting effect on NOx concentration fields over broader regions, leading to elevated nocturnal production of particulate nitrate. Conversely, the “RES_high” case exhibits the lowest burden of 0.53 Tg, a 24 % decrease compared to the base case estimate, attributed to the more accurate reproduction of NOx concentration fields by this sensitivity and the reduced nocturnal production of particulate nitrate.
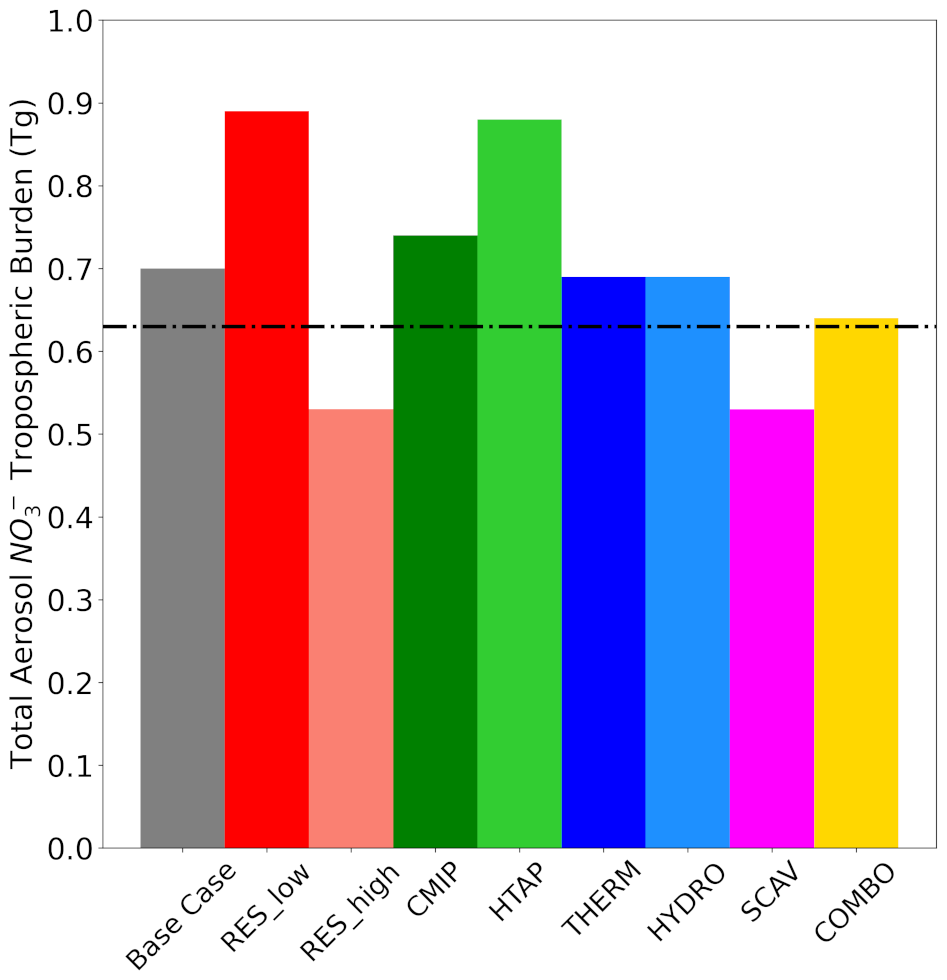
Figure 10Bar chart showing the average tropospheric burden of total aerosol NO predicted from the base case and all sensitivity cases for the period 2010–2018. The dashed horizontal line shows the average tropospheric burden from 9 models taken from Bian et al. (2017), which is equal to 0.63 Tg.
The “CMIP” case estimates a burden close to the base case (0.74 Tg), while the “HTAP” model run produces a higher burden of 0.88 Tg, driven by the higher NOx emissions compared to the base case across all examined regions (Fig. S8c). The “THERM” and “HYDRO” cases both yielded burdens of 0.69 Tg, indicating a minimal impact of the aerosol thermodynamic state assumption, as well as the N2O5 uptake coefficient for hydrolysis on the nitrate aerosol burden. The 'SCAV' case estimates a lower burden of 0.53 Tg due to the increased wet deposition rates from the simplified scavenging approach. This result is consistent with the results reported by Tost et al. (2007b), who calculated increased deposition rates using analogous simplifications and assumptions, including a prescribed pH of 5 for rain and clouds. Finally, the “COMBO” case, combining multiple parameter adjustments, yields a burden of 0.64 Tg, closely matching the multi-model average reported by Bian et al. (2017). These results suggest that integrating factors that reduce surface-level nitrate concentrations (e.g., higher model resolution and lower N2O5 uptake coefficients) with those that enhance them (e.g., the HTAPv3 emissions inventory) can lead to improved model performance not only at the surface but also throughout the troposphere.
This study investigated the impact of diverse atmospheric modeling components on the accuracy of the simulated surface concentrations of nitrate aerosols. A series of sensitivity scenarios were developed to assess the impact of grid resolution, anthropogenic emission inventories, aerosol thermodynamic assumptions, uptake coefficient for N2O5 hydrolysis and scavenging treatments, both individually and in combination, on model predictions. A comparative analysis was conducted against PM2.5 filter observations and PM1 AMS measurements, focusing on polluted regions within the Northern Hemisphere. The findings indicated that accurately replicating observed PM2.5 and PM1 concentrations requires a nuanced approach, as no single model configuration consistently yielded the best results for all conditions and regions. A concise overview of the most influential improvements associated with each parameter change, ranked according to their impact on model predictions, is presented in Table 10.
Table 10Model parameter perturbations ranked according to their significance in improving PM nitrate estimates. The most significant improvements by region, season, and location, along with the associated statistical enhancements, are also reported. The perturbations and the model base case setup are defined in Table 1.
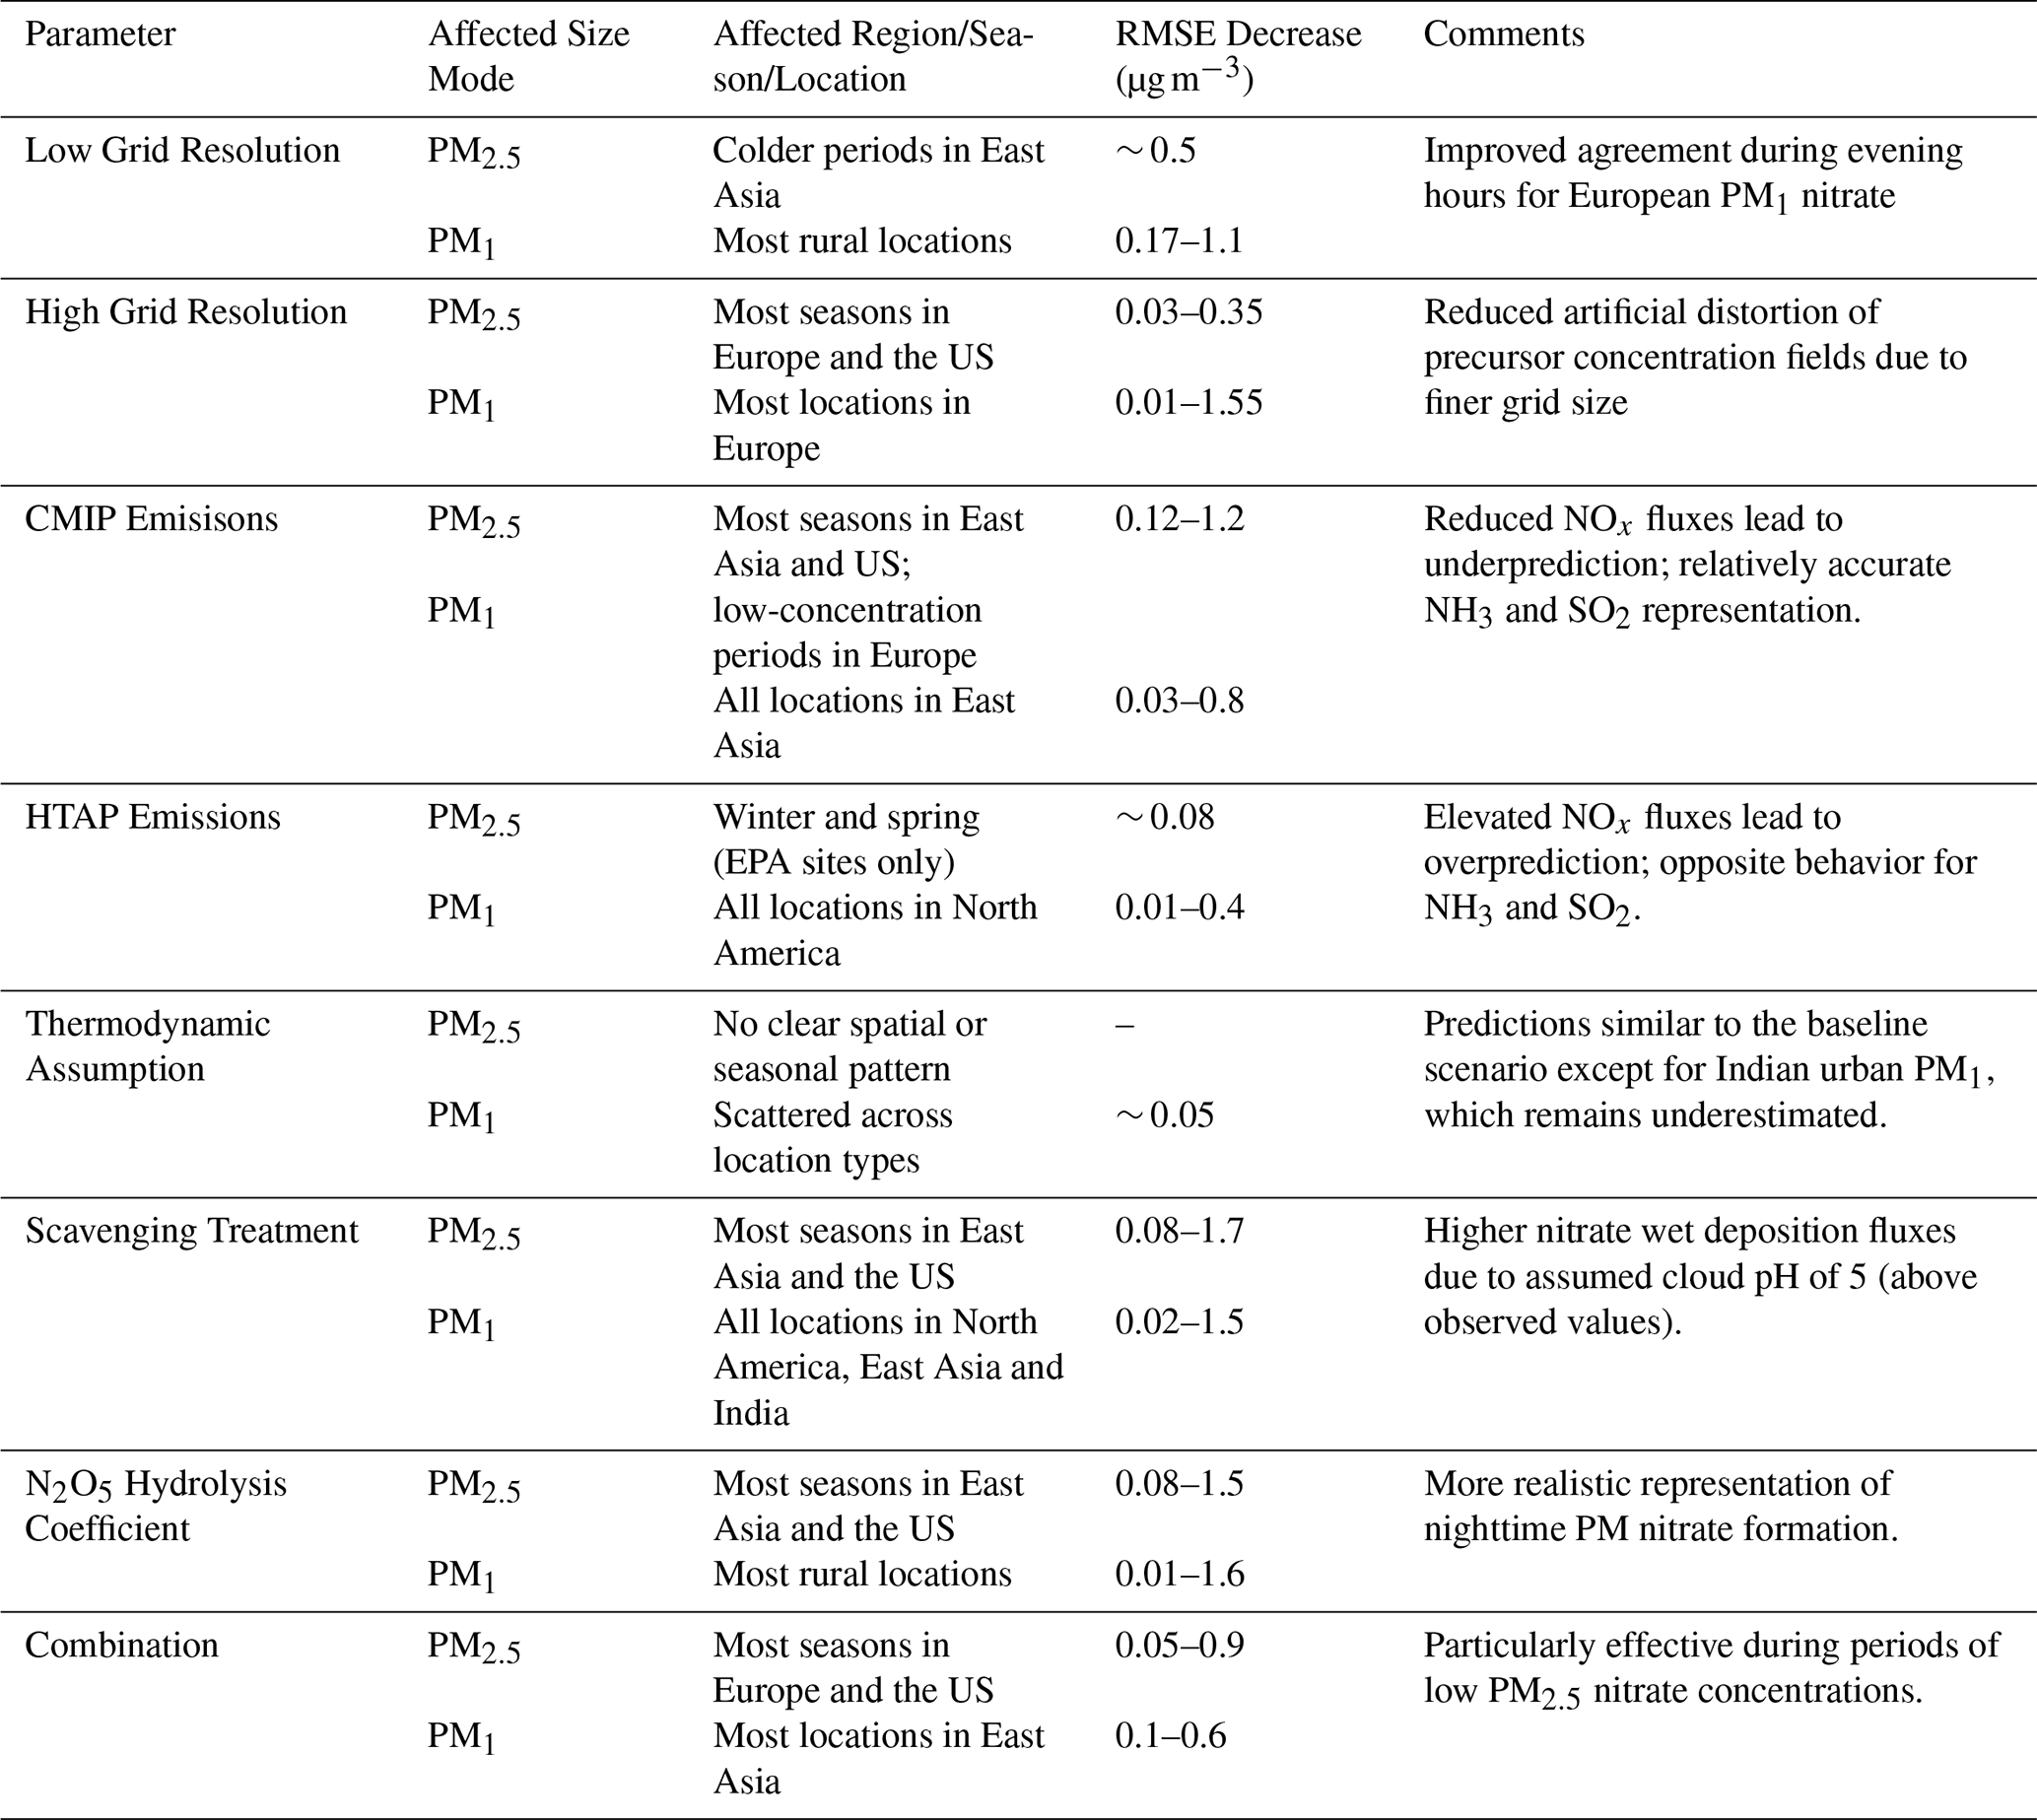
For PM2.5 observations, the model performed best in the USA region, with the lowest overall bias and error metrics for all sensitivity simulations. In East Asia, the model consistently overpredicted concentrations in all configurations, although percentage differences were often moderate. Conversely, Europe proved to be a particularly difficult region for the model to reproduce, with both under- and over-predictions of nitrate concentrations relative to observations, a pattern that showed significant seasonal variation. In particular, the simulated nitrate overprediction in Europe peaked during the summer. This discrepancy can be partially attributed to measurement artifacts under warm conditions, particularly the enhanced volatilization of semi-volatile nitrate aerosols during sampling, due to the use of nylon filters. This overprediction was also observed in North America when compared with nitrate observations from the EPA network. Conversely, the model showed increased discrepancies with IMPROVE and EANET network observations during the colder periods. In East Asia, these discrepancies are primarily attributed to the absence of sulfate formation pathways via heterogeneous chemistry in the model. Sulfate production typically peaks during cold and humid conditions associated with haze events. The resulting underestimation of sulfate during these periods leads to excess free NH3 that remains available to form ammonium nitrate. Despite these challenges, the configurations that showed consistent improvement over the base case predictions regarding bias, error ranking and overall statistical performance were the use of a higher grid resolution, the CMIP6 emission inventory, a lower N2O5 hydrolysis coefficient, a simplified scavenging mechanism and the configuration that combined multiple parameter adjustments (i.e., high grid resolution, reduced N2O5 uptake, and the HTAPv3 emission inventory). All these factors were particularly effective in reproducing periods with the lowest observed average concentrations (i.e. summer) as well as most seasons in the US region networks.
For PM1 observations, the model performance varied significantly by the location type and region. In general, simulated urban nitrate was in best agreement with observations in all regions. In contrast, urban-downwind locations posed the greatest challenge to the model, with underprediction biases evident in Europe and North America, while the opposite behavior was observed for East Asia. Overall, rural observations were underpredicted in North America and strongly overpredicted in India. On average, the base case showed satisfactory agreement with most observations for the regions of Europe and East Asia. In contrast to the PM2.5 comparison, it was challenging to identify specific model configurations that consistently outperformed the base case in terms of predicted nitrate concentrations or statistical metrics. Nevertheless, configurations incorporating a lower N2O5 hydrolysis coefficient and a simplified scavenging scheme generally ranked higher in terms of agreement. Additionally, the choice of emission inventory and grid resolution proved to be equally important factors in improving model accuracy. Specifically, the model runs that used the CAMS database provided the best representation of particulate nitrate concentrations for Europe, the model runs that used the HTAPv3 database were most accurate for observations in North America, while the model runs that used the CMIP6 database best captured values in East Asia. Interestingly, lower-resolution simulations were equally effective as higher-resolution ones in reproducing PM1 nitrate concentrations, particularly in rural areas. This suggests that spatial resolution alone does not guarantee improved performance.
An analysis of the diurnal variation of PM1 nitrate concentrations observed at European stations showed that most model configurations effectively captured the general diurnal patterns of observations at most stations, except for remote stations that lacked significant diurnal variation. However, the model results systematically over-emphasized the evening minima and showed a strong decrease in concentration after midday. This behavior was not reflected in the observations, leading to under-predictions of the afternoon and evening observations. The choice of grid resolution proved to have the most significant impact on the predicted diurnal patterns. The high-resolution configuration showed a higher accuracy during the morning hours, while the lower-resolution configuration showed a better ability to capture afternoon and evening values. Among the emission inventories, the use of the CAMS database provided the most reliable estimates for PM1 nitrate particle concentrations over Europe.
Finally, regarding the tropospheric nitrate aerosol burden, the base case, the metastable aerosol state assumption, the lower uptake coefficient for N2O5 hydrolysis, and the use of the CMIP6 emissions database resulted in values that were close to the multi-model average value of 0.63 Tg reported by Bian et al. (2017). However, the combined configuration yielded an almost identical value, slightly outperforming the individual scenarios. In contrast, simulations using reduced grid resolution and the HTAPv3 emissions database resulted in estimates that were approximately 25 % higher than the base case. These increases reflect the influence of coarser spatial resolution, leading to diluted precursor fields, and elevated nitrate precursor emissions in the HTAPv3 dataset. Conversely, the scenarios where a higher grid resolution and a simplified aerosol scavenging treatment were used estimated burdens approximately 25 % lower compared to the base case, attributable to the finer spatial resolution and increased wet deposition, respectively.
In conclusion, this study underscores the complexity of accurately modeling nitrate aerosols. The findings highlight the importance of selecting appropriate configurations based on regional and seasonal conditions, with high-resolution grids, region-dependent emissions and adjusted uptake coefficients for N2O5 hydrolysis being pivotal in improving the model performance. Nevertheless, the pronounced variability across regions and seasons shows the need for a flexible and adaptable approach to improving atmospheric modeling of particulate nitrate concentrations.
The usage of MESSy (Modular Earth Submodel System) and access to the source code is licensed to all affiliates of institutions which are members of the MESSy Consortium. Institutions can become a member of the MESSy Consortium by signing the “MESSy Memorandum of Understanding”. More information can be found on the MESSy Consortium website: http://www.messy-interface.org (last access: 22 May 2024). The code used in this study has been based on MESSy version 2.55 and is archived with a restricted access DOI (https://doi.org/10.5281/zenodo.8379120, The MESSy Consortium, 2023). The data produced in the study is available from the authors upon request.
The supplement related to this article is available online at https://doi.org/10.5194/acp-26-571-2026-supplement.
AM and VAK wrote the paper with contributions from APT, HF and SMC. VAK and APT planned the research. AM performed the simulations and analyzed the results, assisted by VAK and APT. APT and SMCS provided the observational data. All the authors discussed the results and contributed to the paper.
The contact author has declared that none of the authors has any competing interests.
Publisher's note: Copernicus Publications remains neutral with regard to jurisdictional claims made in the text, published maps, institutional affiliations, or any other geographical representation in this paper. The authors bear the ultimate responsibility for providing appropriate place names. Views expressed in the text are those of the authors and do not necessarily reflect the views of the publisher.
This article is part of the special issue “The Modular Earth Submodel System (MESSy) (ACP/GMD inter-journal SI)”. It is not associated with a conference.
This work was supported by the project FORCeS funded from the European Union's Horizon 2020 research and innovation program under grant agreement No. 821205. The work described in this paper has received funding from the Initiative and Networking Fund of the Helmholtz Association through the project “Advanced Earth System Modelling Capacity (ESM)”. The authors gratefully acknowledge the Earth System Modelling Project (ESM) for funding this work by providing computing time on the ESM partition of the supercomputer JUWELS (Alvarez, 2021) at the Jülich Supercomputing Centre (JSC).
This research has been supported by the EU Horizon 2020 (grant no. 821205).
The article processing charges for this open-access publication were covered by the Forschungszentrum Jülich.
This paper was edited by Ken Carslaw and Chul Han Song and reviewed by two anonymous referees.
Aksoyoglu, S., Ciarelli, G., El-Haddad, I., Baltensperger, U., and Prévôt, A. S. H.: Secondary inorganic aerosols in Europe: sources and the significant influence of biogenic VOC emissions, especially on ammonium nitrate, Atmos. Chem. Phys., 17, 7757–7773, https://doi.org/10.5194/acp-17-7757-2017, 2017.
Alvarez, D.: JUWELS cluster and booster: Exascale pathfinder with modular supercomputing architecture at juelich supercomputing Centre, J. Large-Scale Res. Facil., 7, A183–A183, https://doi.org/10.17815/jlsrf-7-183, 2021.
Ames, R. B. and Malm, W. C.: Comparison of sulfate and nitrate particle mass concentrations measured by IMPROVE and the CDN, Atmos. Environ., 35, 905–916, https://doi.org/10.1016/S1352-2310(00)00369-1, 2001.
AMoN: Ammonia Monitoring Network, https://nadp.slh.wisc.edu/networks/ammonia-monitoring-network/, last access: 9 January 2026.
Ansari, A. S. and Pandis, S. N.: The effect of metastable equilibrium states on the partitioning of nitrate between the gas and aerosol phases, Atmos. Environ., 34, 157–168, https://doi.org/10.1016/S1352-2310(99)00242-3, 2000.
Astitha, M., Lelieveld, J., Abdel Kader, M., Pozzer, A., and de Meij, A.: Parameterization of dust emissions in the global atmospheric chemistry-climate model EMAC: impact of nudging and soil properties, Atmos. Chem. Phys., 12, 11057–11083, https://doi.org/10.5194/acp-12-11057-2012, 2012.
Bacer, S., Sullivan, S. C., Karydis, V. A., Barahona, D., Krämer, M., Nenes, A., Tost, H., Tsimpidi, A. P., Lelieveld, J., and Pozzer, A.: Implementation of a comprehensive ice crystal formation parameterization for cirrus and mixed-phase clouds in the EMAC model (based on MESSy 2.53), Geosci. Model Dev., 11, 4021–4041, https://doi.org/10.5194/gmd-11-4021-2018, 2018.
Beaudor, M., Vuichard, N., Lathière, J., and Hauglustaine, D. A.: Future Trends of Global Agricultural Emissions of Ammonia in a Changing Climate, J. Adv. Model. Earth Sy., 17, e2023MS004186, https://doi.org/10.1029/2023MS004186, 2025.
Bellouin, N., Rae, J., Jones, A., Johnson, C., Haywood, J., and Boucher, O.: Aerosol forcing in the Climate Model Intercomparison Project (CMIP5) simulations by HadGEM2-ES and the role of ammonium nitrate, J. Geophys. Res.-Atmos., 116, https://doi.org/10.1029/2011JD016074, 2011.
Bertram, T. H., Thornton, J. A., Riedel, T. P., Middlebrook, A. M., Bahreini, R., Bates, T. S., Quinn, P. K., and Coffman, D. J.: Direct observations of N2O5 reactivity on ambient aerosol particles, Geophys. Res. Lett., 36, https://doi.org/10.1029/2009GL040248, 2009.
Bian, H., Chin, M., Hauglustaine, D. A., Schulz, M., Myhre, G., Bauer, S. E., Lund, M. T., Karydis, V. A., Kucsera, T. L., Pan, X., Pozzer, A., Skeie, R. B., Steenrod, S. D., Sudo, K., Tsigaridis, K., Tsimpidi, A. P., and Tsyro, S. G.: Investigation of global particulate nitrate from the AeroCom phase III experiment, Atmos. Chem. Phys., 17, 12911–12940, https://doi.org/10.5194/acp-17-12911-2017, 2017.
Bouwman, A. F., Lee, D. S., Asman, W. A., Dentener, F. J., Van Der Hoek, K. W., and Olivier, J. G. J.: A global high-resolution emission inventory for ammonia, Global Biogeochem. Cy., 11, 561–587, https://doi.org/10.1029/97GB02266, 1997.
Bromley, L. A.: Thermodynamic properties of strong electrolytes in aqueous solutions, AIChE J., 19, 313–320, https://doi.org/10.1002/aic.690190216, 1973.
Brown, S. S., Dubé, W. P., Fuchs, H., Ryerson, T. B., Wollny, A. G., Brock, C. A., Bahreini, R., Middlebrook, A. M., Neuman, J. A., Atlas, E., and Roberts, J. M.: Reactive uptake coefficients for N2O5 determined from aircraft measurements during the Second Texas Air Quality Study: Comparison to current model parameterizations, J. Geophys. Res.-Atmos., 114, https://doi.org/10.1029/2008JD011679, 2009.
Chang, W. L., Bhave, P. V., Brown, S. S., Riemer, N., Stutz, J., and Dabdub, D.: Heterogeneous atmospheric chemistry, ambient measurements, and model calculations of N2O5: A review, Aerosol Sci. Tech., 45, 665–695, https://doi.org/10.1080/02786826.2010.551672, 2011.
Chang, W. L., Brown, S. S., Stutz, J., Middlebrook, A. M., Bahreini, R., Wagner, N. L., Dubé, W. P., Pollack, I. B., Ryerson, T. B., and Riemer, N.: Evaluating N2O5 heterogeneous hydrolysis parameterizations for CalNex 2010, J. Geophys. Res.-Atmos., 121, 5051–5070, https://doi.org/10.1002/2015JD024737, 2016.
Chen, Y., Wolke, R., Ran, L., Birmili, W., Spindler, G., Schröder, W., Su, H., Cheng, Y., Tegen, I., and Wiedensohler, A.: A parameterization of the heterogeneous hydrolysis of N2O5 for mass-based aerosol models: improvement of particulate nitrate prediction, Atmos. Chem. Phys., 18, 673–689, https://doi.org/10.5194/acp-18-673-2018, 2018.
Cheng, Y., Zheng, G., Wei, C., Mu, Q., Zheng, B., Wang, Z., Gao, M., Zhang, Q., He, K., Carmichael, G., Pöschl, U., and Su, H.: Reactive nitrogen chemistry in aerosol water as a source of sulfate during haze events in China, Sci. Adv., 2, e1601530, https://doi.org/10.1126/sciadv.1601530, 2016.
Chowdhury, S., Pozzer, A., Haines, A., Klingmueller, K., Münzel, T., Paasonen, P., Sharma, A., Venkataraman, C. and Lelieveld, J.: Global health burden of ambient PM2.5 and the contribution of anthropogenic black carbon and organic aerosols, Environ. Int., 159, 107020, https://doi.org/10.1016/j.envint.2021.107020, 2022.
CPCB: Central Pollution Control Board, https://cpcb.nic.in/, last access: 9 January 2026.
Crippa, M., Guizzardi, D., Butler, T., Keating, T., Wu, R., Kaminski, J., Kuenen, J., Kurokawa, J., Chatani, S., Morikawa, T., Pouliot, G., Racine, J., Moran, M. D., Klimont, Z., Manseau, P. M., Mashayekhi, R., Henderson, B. H., Smith, S. J., Suchyta, H., Muntean, M., Solazzo, E., Banja, M., Schaaf, E., Pagani, F., Woo, J.-H., Kim, J., Monforti-Ferrario, F., Pisoni, E., Zhang, J., Niemi, D., Sassi, M., Ansari, T., and Foley, K.: The HTAP_v3 emission mosaic: merging regional and global monthly emissions (2000–2018) to support air quality modelling and policies, Earth Syst. Sci. Data, 15, 2667–2694, https://doi.org/10.5194/essd-15-2667-2023, 2023.
Dee, D. P. and Uppala, S.: Variational bias correction of satellite radiance data in the ERA-Interim reanalysis, Q. J. Roy. Meteor. Soc., 135, 1830–1841, https://doi.org/10.1002/qj.493, 2009.
Dee, D. P., Uppala, S. M., Simmons, A. J., Berrisford, P., Poli, P., Kobayashi, S., Andrae, U., Balmaseda, M. A., Balsamo, G., Bauer, P., Bechtold, P., Beljaars, A. C. M., van de Berg, L., Bidlot, J., Bormann, N., Delsol, C., Dragani, R., Fuentes, M., Geer, A. J., Haimberger, L., Healy, S. B., Hersbach, H., Hólm, E. V., Isaksen, L., Kållberg, P., Köhler, M., Matricardi, M., McNally, A. P., Monge-Sanz, B. M., Morcrette, J. J., Park, B. K., Peubey, C., de Rosnay, P., Tavolato, C., Thépaut, J. N., and Vitart, F.: The ERA-Interim reanalysis: configuration and performance of the data assimilation system, Q. J. Roy. Meteor. Soc., 137, 553–597, https://doi.org/10.1002/qj.828, 2011.
Dentener, F., Kinne, S., Bond, T., Boucher, O., Cofala, J., Generoso, S., Ginoux, P., Gong, S., Hoelzemann, J. J., Ito, A., Marelli, L., Penner, J. E., Putaud, J.-P., Textor, C., Schulz, M., van der Werf, G. R., and Wilson, J.: Emissions of primary aerosol and precursor gases in the years 2000 and 1750 prescribed data-sets for AeroCom, Atmos. Chem. Phys., 6, 4321–4344, https://doi.org/10.5194/acp-6-4321-2006, 2006.
Ding, J., van der A, R., Eskes, H., Dammers, E., Shephard, M., Wichink Kruit, R., Guevara, M., and Tarrason, L.: Ammonia emission estimates using CrIS satellite observations over Europe, Atmos. Chem. Phys., 24, 10583–10599, https://doi.org/10.5194/acp-24-10583-2024, 2024.
Docherty, K. S., Aiken, A. C., Huffman, J. A., Ulbrich, I. M., DeCarlo, P. F., Sueper, D., Worsnop, D. R., Snyder, D. C., Peltier, R. E., Weber, R. J., Grover, B. D., Eatough, D. J., Williams, B. J., Goldstein, A. H., Ziemann, P. J., and Jimenez, J. L.: The 2005 Study of Organic Aerosols at Riverside (SOAR-1): instrumental intercomparisons and fine particle composition, Atmos. Chem. Phys., 11, 12387–12420, https://doi.org/10.5194/acp-11-12387-2011, 2011.
Elguindi, N., Granier, C., Stavrakou, T., Darras, S., Bauwens, M., Cao, H., Chen, C., Denier van der Gon, H. A. C., Dubovik, O., Fu, T. M., Henze, D. K., Jiang, Z., Keita, S., Kuenen, J. J. P., Kurokawa, J., Liousse, C., Miyazaki, K., Müller, J.-F., Qu, Z., Solmon, F., and Zheng, B.: Intercomparison of Magnitudes and Trends in Anthropogenic Surface Emissions From Bottom-Up Inventories, Top-Down Estimates, and Emission Scenarios, Earth's Future, 8, e2020EF001520, https://doi.org/10.1029/2020EF001520, 2020.
Elser, M., Huang, R.-J., Wolf, R., Slowik, J. G., Wang, Q., Canonaco, F., Li, G., Bozzetti, C., Daellenbach, K. R., Huang, Y., Zhang, R., Li, Z., Cao, J., Baltensperger, U., El-Haddad, I., and Prévôt, A. S. H.: New insights into PM2.5 chemical composition and sources in two major cities in China during extreme haze events using aerosol mass spectrometry, Atmos. Chem. Phys., 16, 3207–3225, https://doi.org/10.5194/acp-16-3207-2016, 2016.
European Monitoring and Evaluation Programme (EMEP): EBAS database online, https://emep-ccc.nilu.no, last access: 9 January 2026.
Evans, M. J. and Jacob, D. J.: Impact of new laboratory studies of N2O5 hydrolysis on global model budgets of tropospheric nitrogen oxides, ozone, and OH, Geophys. Res. Lett., 32, https://doi.org/10.1029/2005GL022469, 2005.
Feinberg, A., Sukhodolov, T., Luo, B.-P., Rozanov, E., Winkel, L. H. E., Peter, T., and Stenke, A.: Improved tropospheric and stratospheric sulfur cycle in the aerosol–chemistry–climate model SOCOL-AERv2, Geosci. Model Dev., 12, 3863–3887, https://doi.org/10.5194/gmd-12-3863-2019, 2019.
Feng, L., Smith, S. J., Braun, C., Crippa, M., Gidden, M. J., Hoesly, R., Klimont, Z., van Marle, M., van den Berg, M., and van der Werf, G. R.: The generation of gridded emissions data for CMIP6, Geosci. Model Dev., 13, 461–482, https://doi.org/10.5194/gmd-13-461-2020, 2020.
Fountoukis, C. and Nenes, A.: ISORROPIA II: a computationally efficient thermodynamic equilibrium model for K+–Ca2+–Mg2+––Na+–––Cl−–H2O aerosols, Atmos. Chem. Phys., 7, 4639–4659, https://doi.org/10.5194/acp-7-4639-2007, 2007.
Fountoukis, C., Nenes, A., Sullivan, A., Weber, R., Van Reken, T., Fischer, M., Matías, E., Moya, M., Farmer, D., and Cohen, R. C.: Thermodynamic characterization of Mexico City aerosol during MILAGRO 2006, Atmos. Chem. Phys., 9, 2141–2156, https://doi.org/10.5194/acp-9-2141-2009, 2009.
Ge, X., Schaap, M., Kranenburg, R., Segers, A., Reinds, G. J., Kros, H., and de Vries, W.: Modeling atmospheric ammonia using agricultural emissions with improved spatial variability and temporal dynamics, Atmos. Chem. Phys., 20, 16055–16087, https://doi.org/10.5194/acp-20-16055-2020, 2020.
Glantz, P., Fawole, O. G., Ström, J., Wild, M., and Noone, K. J.: Unmasking the effects of aerosols on greenhouse warming over Europe, J. Geophys. Res.-Atmos., 127, e2021JD035889, https://doi.org/10.1029/2021JD035889, 2022.
Granier, C., Darras, S., Denier van Der Gon, H., Jana, D., Elguindi, N., Bo, G., Michael, G., Marc, G., Jalkanen, J.-P., Kuenen, J., Liousse, C., Quack, B., Simpson, D., and Sindelarova, K.: The Copernicus Atmosphere Monitoring Service global and regional emissions (April 2019 version), Copernicus Atmosphere Monitoring Service [data set], https://doi.org/10.24380/d0bn-kx16, 2019.
Grewe, V., Brunner, D., Dameris, M., Grenfell, J. L., Hein, R., Shindell, D., and Staehelin, J.: Origin and variability of upper tropospheric nitrogen oxides and ozone at northern mid-latitudes, Atmos. Environ., 35, 3421–3433, https://doi.org/10.1016/S1352-2310(01)00134-0, 2001.
Guelle, W., Schulz, M., Balkanski, Y., and Dentener, F.: Influence of the source formulation on modeling the atmospheric global distribution of sea salt aerosol, J. Geophys. Res.-Atmos., 106, 27509–27524, https://doi.org/10.1029/2001JD900249, 2001.
Guo, H., Sullivan, A. P., Campuzano-Jost, P., Schroder, J. C., Lopez-Hilfiker, F. D., Dibb, J. E., Jimenez, J. L., Thornton, J. A., Brown, S. S., Nenes, A., and Weber, R. J.: Fine particle pH and the partitioning of nitric acid during winter in the northeastern United States, J. Geophys. Res.-Atmos., 121, 10355–10376, https://doi.org/10.1002/2016JD025311, 2016.
Guo, S., Hu, M., Zamora, M. L., Peng, J., Shang, D., Zheng, J., Du, Z., Wu, Z., Shao, M., Zeng, L., Molina, M. J., and Zhang, R.: Elucidating severe urban haze formation in China, P. Natl. Acad. Sci. USA, 111, 17373–17378, https://doi.org/10.1073/pnas.1419604111, 2014.
Hauglustaine, D. A., Balkanski, Y., and Schulz, M.: A global model simulation of present and future nitrate aerosols and their direct radiative forcing of climate, Atmos. Chem. Phys., 14, 11031–11063, https://doi.org/10.5194/acp-14-11031-2014, 2014.
He, H., Wang, Y., Ma, Q., Ma, J., Chu, B., Ji, D., Tang, G., Liu, C., Zhang, H., and Hao, J.: Mineral dust and NOx promote the conversion of SO2 to sulfate in heavy pollution days, Sci. Rep., 4, 4172, https://doi.org/10.1038/srep04172, 2014.
Heald, C. L., Collett Jr., J. L., Lee, T., Benedict, K. B., Schwandner, F. M., Li, Y., Clarisse, L., Hurtmans, D. R., Van Damme, M., Clerbaux, C., Coheur, P.-F., Philip, S., Martin, R. V., and Pye, H. O. T.: Atmospheric ammonia and particulate inorganic nitrogen over the United States, Atmos. Chem. Phys., 12, 10295–10312, https://doi.org/10.5194/acp-12-10295-2012, 2012.
Hendriks, C., Kranenburg, R., Kuenen, J. J. P., Van den Bril, B., Verguts, V., and Schaap, M.: Ammonia emission time profiles based on manure transport data improve ammonia modelling across north western Europe. Atmos. Environ., 131, 83–96, https://doi.org/10.1016/j.atmosenv.2016.01.043, 2016.
Hoesly, R. M., Smith, S. J., Feng, L., Klimont, Z., Janssens-Maenhout, G., Pitkanen, T., Seibert, J. J., Vu, L., Andres, R. J., Bolt, R. M., Bond, T. C., Dawidowski, L., Kholod, N., Kurokawa, J.-I., Li, M., Liu, L., Lu, Z., Moura, M. C. P., O'Rourke, P. R., and Zhang, Q.: Historical (1750–2014) anthropogenic emissions of reactive gases and aerosols from the Community Emissions Data System (CEDS), Geosci. Model Dev., 11, 369–408, https://doi.org/10.5194/gmd-11-369-2018, 2018.
Im, U., Bauer, S. E., Frohn, L. M., Geels, C., Tsigaridis, K., and Brandt, J.: Present-day and future PM2.5 and O3-related global and regional premature mortality in the EVAv6.0 health impact assessment model, Environ. Res., 216, 114702, https://doi.org/10.1016/j.envres.2022.114702, 2023.
Inness, A., Ades, M., Agustí-Panareda, A., Barré, J., Benedictow, A., Blechschmidt, A.-M., Dominguez, J. J., Engelen, R., Eskes, H., Flemming, J., Huijnen, V., Jones, L., Kipling, Z., Massart, S., Parrington, M., Peuch, V.-H., Razinger, M., Remy, S., Schulz, M., and Suttie, M.: The CAMS reanalysis of atmospheric composition, Atmos. Chem. Phys., 19, 3515–3556, https://doi.org/10.5194/acp-19-3515-2019, 2019.
Interagency Monitoring of Protected Visual Environment (IMPROVE): Federal Land Manager Environmental Database, http://vista.cira.colostate.edu/Improve/improve-data/, last access: 9 January 2026.
Jöckel, P., Sander, R., Kerkweg, A., Tost, H., and Lelieveld, J.: Technical Note: The Modular Earth Submodel System (MESSy) – a new approach towards Earth System Modeling, Atmos. Chem. Phys., 5, 433–444, https://doi.org/10.5194/acp-5-433-2005, 2005.
Jöckel, P., Tost, H., Pozzer, A., Brühl, C., Buchholz, J., Ganzeveld, L., Hoor, P., Kerkweg, A., Lawrence, M. G., Sander, R., Steil, B., Stiller, G., Tanarhte, M., Taraborrelli, D., van Aardenne, J., and Lelieveld, J.: The atmospheric chemistry general circulation model ECHAM5/MESSy1: consistent simulation of ozone from the surface to the mesosphere, Atmos. Chem. Phys., 6, 5067–5104, https://doi.org/10.5194/acp-6-5067-2006, 2006.
Jöckel, P., Tost, H., Pozzer, A., Kunze, M., Kirner, O., Brenninkmeijer, C. A. M., Brinkop, S., Cai, D. S., Dyroff, C., Eckstein, J., Frank, F., Garny, H., Gottschaldt, K.-D., Graf, P., Grewe, V., Kerkweg, A., Kern, B., Matthes, S., Mertens, M., Meul, S., Neumaier, M., Nützel, M., Oberländer-Hayn, S., Ruhnke, R., Runde, T., Sander, R., Scharffe, D., and Zahn, A.: Earth System Chemistry integrated Modelling (ESCiMo) with the Modular Earth Submodel System (MESSy) version 2.51, Geosci. Model Dev., 9, 1153–1200, https://doi.org/10.5194/gmd-9-1153-2016, 2016.
Jones, A. C., Hill, A., Remy, S., Abraham, N. L., Dalvi, M., Hardacre, C., Hewitt, A. J., Johnson, B., Mulcahy, J. P., and Turnock, S. T.: Exploring the sensitivity of atmospheric nitrate concentrations to nitric acid uptake rate using the Met Office's Unified Model, Atmos. Chem. Phys., 21, 15901–15927, https://doi.org/10.5194/acp-21-15901-2021, 2021.
Kakavas, S. and Pandis, S. N.: Effects of urban dust emissions on fine and coarse PM levels and composition, Atmos. Environ., 246, 118006, https://doi.org/10.1016/j.atmosenv.2020.118006, 2021.
Karydis, V. A., Tsimpidi, A. P., Fountoukis, C., Nenes, A., Zavala, M., Lei, W. F., Molina, L. T., and Pandis, S. N.: Simulating the fine and coarse inorganic particulate matter concentrations in a polluted megacity, Atmos. Environ., 44, 608–620, https://doi.org/10.1016/j.atmosenv.2009.11.023, 2010.
Karydis, V. A., Tsimpidi, A. P., Lei, W., Molina, L. T., and Pandis, S. N.: Formation of semivolatile inorganic aerosols in the Mexico City Metropolitan Area during the MILAGRO campaign, Atmos. Chem. Phys., 11, 13305–13323, https://doi.org/10.5194/acp-11-13305-2011, 2011.
Karydis, V. A., Tsimpidi, A. P., Pozzer, A., Astitha, M., and Lelieveld, J.: Effects of mineral dust on global atmospheric nitrate concentrations, Atmos. Chem. Phys., 16, 1491–1509, https://doi.org/10.5194/acp-16-1491-2016, 2016.
Karydis, V. A., Tsimpidi, A. P., Bacer, S., Pozzer, A., Nenes, A., and Lelieveld, J.: Global impact of mineral dust on cloud droplet number concentration, Atmos. Chem. Phys., 17, 5601–5621, https://doi.org/10.5194/acp-17-5601-2017, 2017.
Karydis, V. A., Tsimpidi, A. P., Pozzer, A., and Lelieveld, J.: How alkaline compounds control atmospheric aerosol particle acidity, Atmos. Chem. Phys., 21, 14983–15001, https://doi.org/10.5194/acp-21-14983-2021, 2021.
Kerkweg, A., Sander, R., Tost, H., and Jöckel, P.: Technical note: Implementation of prescribed (OFFLEM), calculated (ONLEM), and pseudo-emissions (TNUDGE) of chemical species in the Modular Earth Submodel System (MESSy), Atmos. Chem. Phys., 6, 3603–3609, https://doi.org/10.5194/acp-6-3603-2006, 2006a.
Kerkweg, A., Buchholz, J., Ganzeveld, L., Pozzer, A., Tost, H., and Jöckel, P.: Technical Note: An implementation of the dry removal processes DRY DEPosition and SEDImentation in the Modular Earth Submodel System (MESSy), Atmos. Chem. Phys., 6, 4617–4632, https://doi.org/10.5194/acp-6-4617-2006, 2006b.
Klingmüller, K., Metzger, S., Abdelkader, M., Karydis, V. A., Stenchikov, G. L., Pozzer, A., and Lelieveld, J.: Revised mineral dust emissions in the atmospheric chemistry–climate model EMAC (MESSy 2.52 DU_Astitha1 KKDU2017 patch), Geosci. Model Dev., 11, 989–1008, https://doi.org/10.5194/gmd-11-989-2018, 2018.
Klingmüller, K., Lelieveld, J., Karydis, V. A., and Stenchikov, G. L.: Direct radiative effect of dust–pollution interactions, Atmos. Chem. Phys., 19, 7397–7408, https://doi.org/10.5194/acp-19-7397-2019, 2019.
Klingmüller, K., Karydis, V. A., Bacer, S., Stenchikov, G. L., and Lelieveld, J.: Weaker cooling by aerosols due to dust–pollution interactions, Atmos. Chem. Phys., 20, 15285–15295, https://doi.org/10.5194/acp-20-15285-2020, 2020.
Kok, J. F., Storelvmo, T., Karydis, V. A., Adebiyi, A. A., Mahowald, N. M., Evan, A. T., He, C. L., and Leung, D. M.: Mineral dust aerosol impacts on global climate and climate change, Nat. Rev. Earth Environ., 4, 71–86, https://doi.org/10.1038/s43017-022-00379-5, 2023.
Kuenen, J., Dellaert, S., Visschedijk, A., Jalkanen, J.-P., Super, I., and Denier van der Gon, H.: CAMS-REG-v4: a state-of-the-art high-resolution European emission inventory for air quality modelling, Earth Syst. Sci. Data, 14, 491–515, https://doi.org/10.5194/essd-14-491-2022, 2022.
Kusik, C. L. and Meissner, H. P.: Electrolyte Activity Coefficients in Inorganic Processing, AIChE Symp. Series, 173, 14–20, 1978.
Lanz, V. A., Prévôt, A. S. H., Alfarra, M. R., Weimer, S., Mohr, C., DeCarlo, P. F., Gianini, M. F. D., Hueglin, C., Schneider, J., Favez, O., D'Anna, B., George, C., and Baltensperger, U.: Characterization of aerosol chemical composition with aerosol mass spectrometry in Central Europe: an overview, Atmos. Chem. Phys., 10, 10453–10471, https://doi.org/10.5194/acp-10-10453-2010, 2010.
Li, S., Zhang, F., Jin, X., Sun, Y., Wu, H., Xie, C., Chen, L., Liu, J., Wu, T., Jiang, S., and Cribb, M.: Characterizing the ratio of nitrate to sulfate in ambient fine particles of urban Beijing during 2018–2019, Atmos. Environ., 237, 117662, https://doi.org/10.1016/j.atmosenv.2020.117662, 2020a.
Li, Z., Xie, P., Hu, R., Wang, D., Jin, H., Chen, H., Lin, C., and Liu, W.: Observations of N2O5 and NO3 at a suburban environment in Yangtze river delta in China: Estimating heterogeneous N2O5 uptake coefficients, J. Environ. Sci., 95, 248–255, https://doi.org/10.1016/j.jes.2020.04.041, 2020b.
Liu, L., Bei, N., Hu, B., Wu, J., Liu, S., Li, X., Wang, R., Liu, Z., Shen, Z. and Li, G.: Wintertime nitrate formation pathways in the north China plain: Importance of N2O5 heterogeneous hydrolysis, Environ. Pollut., 266, 115287, https://doi.org/10.1016/j.envpol.2020.115287, 2020.
Lohmann, U. and Ferrachat, S.: Impact of parametric uncertainties on the present-day climate and on the anthropogenic aerosol effect, Atmos. Chem. Phys., 10, 11373–11383, https://doi.org/10.5194/acp-10-11373-2010, 2010.
Luo, Z., Zhang, Y., Chen, W., Van Damme, M., Coheur, P.-F., and Clarisse, L.: Estimating global ammonia (NH3) emissions based on IASI observations from 2008 to 2018, Atmos. Chem. Phys., 22, 10375–10388, https://doi.org/10.5194/acp-22-10375-2022, 2022.
Ma, Q., Wu, Y., Zhang, D., Wang, X., Xia, Y., Liu, X., Tian, P., Han, Z., Xia, X., Wang, Y., and Zhang, R.: Roles of regional transport and heterogeneous reactions in the PM2.5 increase during winter haze episodes in Beijing, Sci. Total Environ., 599–600, 246–253, https://doi.org/10.1016/j.scitotenv.2017.04.193, 2017.
Meissner, H. P. and Peppas, N. A.: Activity coefficients – aqueous solutions of polybasic acids and their salts, AIChE J., 19, 806–809, https://doi.org/10.1002/aic.690190419, 1973.
Metzger, S., Dentener, F., Krol, M., Jeuken, A., and Lelieveld, J.: Gas/aerosol partitioning 2. Global modeling results, J. Geophys. Res.-Atmos., 107, ACH-17, https://doi.org/10.1029/2001JD001103, 2002.
Miao, R., Chen, Q., Zheng, Y., Cheng, X., Sun, Y., Palmer, P. I., Shrivastava, M., Guo, J., Zhang, Q., Liu, Y., Tan, Z., Ma, X., Chen, S., Zeng, L., Lu, K., and Zhang, Y.: Model bias in simulating major chemical components of PM2.5 in China, Atmos. Chem. Phys., 20, 12265–12284, https://doi.org/10.5194/acp-20-12265-2020, 2020.
Milousis, A., Tsimpidi, A. P., Tost, H., Pandis, S. N., Nenes, A., Kiendler-Scharr, A., and Karydis, V. A.: Implementation of the ISORROPIA-lite aerosol thermodynamics model into the EMAC chemistry climate model (based on MESSy v2.55): implications for aerosol composition and acidity, Geosci. Model Dev., 17, 1111–1131, https://doi.org/10.5194/gmd-17-1111-2024, 2024.
Milousis, A., Klingmüller, K., Tsimpidi, A. P., Kok, J. F., Kanakidou, M., Nenes, A., and Karydis, V. A.: Impact of mineral dust on the global nitrate aerosol direct and indirect radiative effect, Atmos. Chem. Phys., 25, 1333–1351, https://doi.org/10.5194/acp-25-1333-2025, 2025.
Myhre, G., Samset, B. H., Schulz, M., Balkanski, Y., Bauer, S., Berntsen, T. K., Bian, H., Bellouin, N., Chin, M., Diehl, T., Easter, R. C., Feichter, J., Ghan, S. J., Hauglustaine, D., Iversen, T., Kinne, S., Kirkevåg, A., Lamarque, J.-F., Lin, G., Liu, X., Lund, M. T., Luo, G., Ma, X., van Noije, T., Penner, J. E., Rasch, P. J., Ruiz, A., Seland, Ø., Skeie, R. B., Stier, P., Takemura, T., Tsigaridis, K., Wang, P., Wang, Z., Xu, L., Yu, H., Yu, F., Yoon, J.-H., Zhang, K., Zhang, H., and Zhou, C.: Radiative forcing of the direct aerosol effect from AeroCom Phase II simulations, Atmos. Chem. Phys., 13, 1853–1877, https://doi.org/10.5194/acp-13-1853-2013, 2013.
Nair, A. A. and Yu, F.: Quantification of atmospheric ammonia concentrations: A review of its measurement and modeling, Atmosphere, 11, 1092, https://doi.org/10.3390/atmos11101092, 2020.
Nair, H. R. C. R., Budhavant, K., Manoj, M. R., Andersson, A., Satheesh, S. K., Ramanathan, V., and Gustafsson, Ö.: Aerosol demasking enhances climate warming over South Asia, NPJ Clim. Atmos. Sci., 6, 39, https://doi.org/10.1038/s41612-023-00367-6, 2023.
Nenes, A., Pandis, S. N., Weber, R. J., and Russell, A.: Aerosol pH and liquid water content determine when particulate matter is sensitive to ammonia and nitrate availability, Atmos. Chem. Phys., 20, 3249–3258, https://doi.org/10.5194/acp-20-3249-2020, 2020.
O'Neill, B. C., Tebaldi, C., van Vuuren, D. P., Eyring, V., Friedlingstein, P., Hurtt, G., Knutti, R., Kriegler, E., Lamarque, J.-F., Lowe, J., Meehl, G. A., Moss, R., Riahi, K., and Sanderson, B. M.: The Scenario Model Intercomparison Project (ScenarioMIP) for CMIP6, Geosci. Model Dev., 9, 3461–3482, https://doi.org/10.5194/gmd-9-3461-2016, 2016.
Paulot, F., Jacob, D. J., Johnson, M. T., Bell, T. G., Baker, A. R., Keene, W. C., Lima, I. D., Doney, S. C., and Stock, C. A.: Global oceanic emission of ammonia: Constraints from seawater and atmospheric observations, Global Biogeochem. Cy., 29, 1165–1178, https://doi.org/10.1002/2015GB005106, 2015.
Phillips, G. J., Thieser, J., Tang, M., Sobanski, N., Schuster, G., Fachinger, J., Drewnick, F., Borrmann, S., Bingemer, H., Lelieveld, J., and Crowley, J. N.: Estimating N2O5 uptake coefficients using ambient measurements of NO3, N2O5, ClNO2 and particle-phase nitrate, Atmos. Chem. Phys., 16, 13231–13249, https://doi.org/10.5194/acp-16-13231-2016, 2016.
Pinder, R. W., Adams, P. J., Pandis, S. N., and Gilliland, A. B.: Temporally resolved ammonia emission inventories: Current estimates, evaluation tools, and measurement needs, J. Geophys. Res.-Atmos., 111, https://doi.org/10.1029/2005JD006603, 2006.
Pozzer, A., Jöckel, P., Sander, R., Williams, J., Ganzeveld, L., and Lelieveld, J.: Technical Note: The MESSy-submodel AIRSEA calculating the air-sea exchange of chemical species, Atmos. Chem. Phys., 6, 5435–5444, https://doi.org/10.5194/acp-6-5435-2006, 2006.
Pringle, K. J., Tost, H., Message, S., Steil, B., Giannadaki, D., Nenes, A., Fountoukis, C., Stier, P., Vignati, E., and Lelieveld, J.: Description and evaluation of GMXe: a new aerosol submodel for global simulations (v1), Geosci. Model Dev., 3, 391–412, https://doi.org/10.5194/gmd-3-391-2010, 2010a.
Pringle, K. J., Tost, H., Metzger, S., Steil, B., Giannadaki, D., Nenes, A., Fountoukis, C., Stier, P., Vignati, E., and Lelieveld, J.: Corrigendum to “Description and evaluation of GMXe: a new aerosol submodel for global simulations (v1)” published in Geosci. Model Dev., 3, 391–412, 2010, Geosci. Model Dev., 3, 413–413, https://doi.org/10.5194/gmd-3-413-2010, 2010b.
Pye, H. O. T., Nenes, A., Alexander, B., Ault, A. P., Barth, M. C., Clegg, S. L., Collett Jr., J. L., Fahey, K. M., Hennigan, C. J., Herrmann, H., Kanakidou, M., Kelly, J. T., Ku, I.-T., McNeill, V. F., Riemer, N., Schaefer, T., Shi, G., Tilgner, A., Walker, J. T., Wang, T., Weber, R., Xing, J., Zaveri, R. A., and Zuend, A.: The acidity of atmospheric particles and clouds, Atmos. Chem. Phys., 20, 4809–4888, https://doi.org/10.5194/acp-20-4809-2020, 2020.
Qu, Y., Chen, Y., Liu, X., Zhang, J., Guo, Y., and An, J.: Seasonal effects of additional HONO sources and the heterogeneous reactions of N2O5 on nitrate in the North China Plain, Sci. Total Environ., 690, 97–107, https://doi.org/10.1016/j.scitotenv.2019.06.436, 2019.
Randerson, J. T., van der Werf, G. R., Giglio, L., Collatz, G. J., and Kasibhatla, P. S.: Global Fire Emissions Database, Version 4.1 (GFEDv4), ORNL DAAC [data set], Oak Ridge, Tennessee, USA, https://doi.org/10.3334/ORNLDAAC/1293, 2017.
Reis, S., Pinder, R. W., Zhang, M., Lijie, G., and Sutton, M. A.: Reactive nitrogen in atmospheric emission inventories, Atmos. Chem. Phys., 9, 7657–7677, https://doi.org/10.5194/acp-9-7657-2009, 2009.
Roeckner, E., Brokopf, R., Esch, M., Giorgetta, M., Hagemann, S., Kornblueh, L., Manzini, E., Schlese, U., and Schulzweida, U.: Sensitivity of simulated climate to horizontal and vertical resolution in the ECHAM5 atmosphere model, J. Climate, 19, 3771–3791, https://doi.org/10.1175/JCLI3824.1, 2006.
Sander, R., Baumgaertner, A., Cabrera-Perez, D., Frank, F., Gromov, S., Grooß, J.-U., Harder, H., Huijnen, V., Jöckel, P., Karydis, V. A., Niemeyer, K. E., Pozzer, A., Riede, H., Schultz, M. G., Taraborrelli, D., and Tauer, S.: The community atmospheric chemistry box model CAABA/MECCA-4.0, Geosci. Model Dev., 12, 1365–1385, https://doi.org/10.5194/gmd-12-1365-2019, 2019.
Schaap, M., van Loon, M., ten Brink, H. M., Dentener, F. J., and Builtjes, P. J. H.: Secondary inorganic aerosol simulations for Europe with special attention to nitrate, Atmos. Chem. Phys., 4, 857–874, https://doi.org/10.5194/acp-4-857-2004, 2004.
Seinfeld, J. H. and Pandis, S. N.: Atmospheric chemistry and physics: from air pollution to climate change, John Wiley and Sons, ISBN 1118947401, 2016.
Smith, S. J., Zhou, Y., Kyle, P., Wang, H., and Yu, H.: A community emissions data system (CEDS): emissions for CMIP6 and beyond, in: Proceedings of the 2015 International Emission Inventory Conference, San Diego, CA, USA, PNNL-SA-109670, 12–16, 2015.
Song, S., Gao, M., Xu, W., Shao, J., Shi, G., Wang, S., Wang, Y., Sun, Y., and McElroy, M. B.: Fine-particle pH for Beijing winter haze as inferred from different thermodynamic equilibrium models, Atmos. Chem. Phys., 18, 7423–7438, https://doi.org/10.5194/acp-18-7423-2018, 2018.
Soulie, A., Granier, C., Darras, S., Zilbermann, N., Doumbia, T., Guevara, M., Jalkanen, J.-P., Keita, S., Liousse, C., Crippa, M., Guizzardi, D., Hoesly, R., and Smith, S. J.: Global anthropogenic emissions (CAMS-GLOB-ANT) for the Copernicus Atmosphere Monitoring Service simulations of air quality forecasts and reanalyses, Earth Syst. Sci. Data, 16, 2261–2279, https://doi.org/10.5194/essd-16-2261-2024, 2024.
Stier, P., Feichter, J., Kinne, S., Kloster, S., Vignati, E., Wilson, J., Ganzeveld, L., Tegen, I., Werner, M., Balkanski, Y., Schulz, M., Boucher, O., Minikin, A., and Petzold, A.: The aerosol-climate model ECHAM5-HAM, Atmos. Chem. Phys., 5, 1125–1156, https://doi.org/10.5194/acp-5-1125-2005, 2005.
Storelvmo, T., Leirvik, T., Lohmann, U., Phillips, P. C., and Wild, M.: Disentangling greenhouse warming and aerosol cooling to reveal Earth's climate sensitivity, Nat. Geosci., 9, 286–289, https://doi.org/10.1038/ngeo2670, 2016.
Sutton, M. A., Reis, S., Riddick, S. N., Dragosits, U., Nemitz, E., Theobald, M. R., Tang, Y. S., Braban, C. F., Vieno, M., Dore, A. J., Mitchell, R. F., Wanless, S., Daunt, F., Fowler, D., Blackall, T. D., Milford, C., Flechard, C. R., Loubet, B., Massad, R., Cellier, P., Personne, E., Coheur, P. F., Clarisse, L., Van Damme, M., Ngadi, Y., Clerbaux, C., Skjøth, C. A., Geels, C., Hertel, O., Wichink Kruit, R. J., Pinder, R. W., Bash, J. O., Walker, J. T., Simpson, D., Horváth, L., Misselbrook, T. H., Bleeker, A., Dentener, F., and de Vries, W.: Towards a climate-dependent paradigm of ammonia emission and deposition, Philos. T. Roy. Soc. B, 368, https://doi.org/10.1098/rstb.2013.0166, 2013.
The Acid Deposition Monitoring Network in East Asia: EANET Data on the Acid Deposition in the East Asian Region, https://monitoring.eanet.asia/document/public/index, last access: 9 January 2026.
The MESSy Consortium: The Modular Earth Submodel System (2.55.2_842-isorropia-light), Zenodo [code], https://doi.org/10.5281/zenodo.8379120, 2023.
Tichý, O., Eckhardt, S., Balkanski, Y., Hauglustaine, D., and Evangeliou, N.: Decreasing trends of ammonia emissions over Europe seen from remote sensing and inverse modelling, Atmos. Chem. Phys., 23, 15235–15252, https://doi.org/10.5194/acp-23-15235-2023, 2023.
Tilgner, A., Schaefer, T., Alexander, B., Barth, M., Collett Jr., J. L., Fahey, K. M., Nenes, A., Pye, H. O. T., Herrmann, H., and McNeill, V. F.: Acidity and the multiphase chemistry of atmospheric aqueous particles and clouds, Atmos. Chem. Phys., 21, 13483–13536, https://doi.org/10.5194/acp-21-13483-2021, 2021.
Tost, H., Jöckel, P., Kerkweg, A., Sander, R., and Lelieveld, J.: Technical note: A new comprehensive SCAVenging submodel for global atmospheric chemistry modelling, Atmos. Chem. Phys., 6, 565–574, https://doi.org/10.5194/acp-6-565-2006, 2006.
Tost, H., Jöckel, P., and Lelieveld, J.: Lightning and convection parameterisations – uncertainties in global modelling, Atmos. Chem. Phys., 7, 4553–4568, https://doi.org/10.5194/acp-7-4553-2007, 2007a.
Tost, H., Jöckel, P., Kerkweg, A., Pozzer, A., Sander, R., and Lelieveld, J.: Global cloud and precipitation chemistry and wet deposition: tropospheric model simulations with ECHAM5/MESSy1, Atmos. Chem. Phys., 7, 2733–2757, https://doi.org/10.5194/acp-7-2733-2007, 2007b.
Tsimpidi, A. P., Karydis, V. A., and Pandis, S. N.: Response of inorganic fine particulate matter to emission changes of sulfur dioxide and ammonia: The eastern United States as a case study, J. Air Waste Manage. Assoc., 57, 1489–1498, https://doi.org/10.3155/1047-3289.57.12.1489, 2007.
Tsimpidi, A. P., Karydis, V. A., and Pandis, S. N.: Response of Fine Particulate Matter to Emission Changes of Oxides of Nitrogen and-Anthropogenic Volatile Organic Compounds in the Eastern United States, J. Air Waste Manage. Assoc., 58, 1463–1473, https://doi.org/10.3155/1047-3289.58.11.1463, 2008.
Tsimpidi, A. P., Trail, M., Hu, Y. T., Nenes, A., and Russell, A. G.: Modeling an air pollution episode in northwestern United States: Identifying the effect of nitrogen oxide and volatile organic compound emission changes on air pollutants formation using direct sensitivity analysis, J. Air Waste Manage. Assoc., 62, 1150–1165, https://doi.org/10.1080/10962247.2012.697093, 2012.
Tsimpidi, A. P., Karydis, V. A., Pozzer, A., Pandis, S. N., and Lelieveld, J.: ORACLE (v1.0): module to simulate the organic aerosol composition and evolution in the atmosphere, Geosci. Model Dev., 7, 3153–3172, https://doi.org/10.5194/gmd-7-3153-2014, 2014.
Tsimpidi, A. P., Karydis, V. A., Pandis, S. N., and Lelieveld, J.: Global combustion sources of organic aerosols: model comparison with 84 AMS factor-analysis data sets, Atmos. Chem. Phys., 16, 8939–8962, https://doi.org/10.5194/acp-16-8939-2016, 2016.
Tsimpidi, A. P., Karydis, V. A., Pandis, S. N., and Lelieveld, J.: Global-scale combustion sources of organic aerosols: sensitivity to formation and removal mechanisms, Atmos. Chem. Phys., 17, 7345–7364, https://doi.org/10.5194/acp-17-7345-2017, 2017.
Tsimpidi, A. P., Karydis, V. A., Pozzer, A., Pandis, S. N., and Lelieveld, J.: ORACLE 2-D (v2.0): an efficient module to compute the volatility and oxygen content of organic aerosol with a global chemistry–climate model, Geosci. Model Dev., 11, 3369–3389, https://doi.org/10.5194/gmd-11-3369-2018, 2018.
Tsimpidi, A. P., Scholz, S. M. C., Milousis, A., Mihalopoulos, N., and Karydis, V. A.: Aerosol composition trends during 2000–2020: in-depth insights from model predictions and multiple worldwide near-surface observation datasets, Atmos. Chem. Phys., 25, 10183–10213, https://doi.org/10.5194/acp-25-10183-2025, 2025.
U.S. Environmental Protection Agency Clean Air Markets Division: Clean Air Status and Trends Network (CASTNET), https://www.epa.gov/castnet, last access: 9 January 2026.
Van Damme, M., Clarisse, L., Franco, B., Sutton, M. A., Erisman, J. W., Wichink Kruit, R., van Zanten, M., Whitburn, S., Hadji-Lazaro, J., Hurtmans, D., Clerbaux, C., and Coheur, P.-F.: Global, regional and national trends of atmospheric ammonia derived from a decadal (2008–2018) satellite record, Environ. Res. Lett., 16, 055017, https://doi.org/10.1088/1748-9326/abd5e0, 2021.
Vignati, E., Wilson, J., and Stier, P.: M7: An efficient size-resolved aerosol microphysics module for large-scale aerosol transport models, J. Geophys. Res.-Atmos., 109, https://doi.org/10.1029/2003JD004485, 2004.
Walker, J. M., Philip, S., Martin, R. V., and Seinfeld, J. H.: Simulation of nitrate, sulfate, and ammonium aerosols over the United States, Atmos. Chem. Phys., 12, 11213–11227, https://doi.org/10.5194/acp-12-11213-2012, 2012.
Wang, G., Zhang, R., Gomez, M. E., Yang, L., Zamora, M. L., Hu, M., Lin, Y., Peng, J., Guo, S., Meng, J., Li, J., Cheng, C., Hu, T., Ren, Y., Wang, Y., Gao, J., Cao, J., An, Z., Zhou, W., Li, G., Wang, J., Tian, P., Marrero-Ortiz, W., Secrest, J., Du, Z., Zheng, J., Shang, D., Zeng, L., Shao, M., Wang, W., Huang, Y., Wang, Y., Zhu, Y., Li, Y., Hu, J., Pan, B., Cai, L., Cheng, Y., Ji, Y., Zhang, F., Rosenfeld, D., Liss, P. S., Duce, R. A., Kolb, C. E., and Molina, M. J.: Persistent sulfate formation from London Fog to Chinese haze, P. Natl. Acad. Sci. USA, 113, 13630–13635, https://doi.org/10.1073/pnas.1616540113, 2016.
Wang, H., Chen, X., Lu, K., Tan, Z., Ma, X., Wu, Z., Li, X., Liu, Y., Shang, D., Wu, Y., and Zeng, L.: Wintertime N2O5 uptake coefficients over the North China Plain, Sci. Bull., 65, 765–774, https://doi.org/10.1016/j.scib.2020.02.006, 2020a.
Wang, Y., Zhang, Q. Q., He, K., Zhang, Q., and Chai, L.: Sulfate-nitrate-ammonium aerosols over China: response to 2000–2015 emission changes of sulfur dioxide, nitrogen oxides, and ammonia, Atmos. Chem. Phys., 13, 2635–2652, https://doi.org/10.5194/acp-13-2635-2013, 2013.
Wang, H., Lu, K., Chen, X., Zhu, Q., Chen, Q., Guo, S., Jiang, M., Li, X., Shang, D., Tan, Z., Wu, Y., Wu, Z., Zou, Q., Zheng, Y., Zeng, L., Zhu, T., Hu, M., and Zhang, Y.: High N2O5 Concentrations Observed in Urban Beijing: Implications of a Large Nitrate Formation Pathway, Environ. Sci. Technol. Lett., 4, 416–420, https://doi.org/10.1021/acs.estlett.7b00341, 2017.
Wang, Y., Ma, Y.-F., Eskes, H., Inness, A., Flemming, J., and Brasseur, G. P.: Evaluation of the CAMS global atmospheric trace gas reanalysis 2003–2016 using aircraft campaign observations, Atmos. Chem. Phys., 20, 4493–4521, https://doi.org/10.5194/acp-20-4493-2020, 2020b.
Warner, J. X., Dickerson, R. R., Wei, Z., Strow, L. L., Wang, Y., and Liang, Q.: Increased atmospheric ammonia over the world's major agricultural areas detected from space, Geophys. Res. Lett., 44, 2875–2884, https://doi.org/10.1002/2016GL072305, 2017.
Xie, X., Hu, J., Qin, M., Guo, S., Hu, M., Wang, H., Lou, S., Li, J., Sun, J., Li, X. and Sheng, L.: Modeling particulate nitrate in China: Current findings and future directions, Environ. Int., 166, 107369, https://doi.org/10.1016/j.envint.2022.107369, 2022.
Xu, W., Zhang, L., and Liu, X.: A database of atmospheric nitrogen concentration and deposition from a nationwide monitoring network in China, figshare [data set], https://doi.org/10.6084/m9.figshare.7451357.v5, 2019.
Yienger, J. J. and Levy, H.: Empirical model of global soil-biogenic NOx emissions, J. Geophys. Res.-Atmos., 100, 11447–11464, https://doi.org/10.1029/95JD00370, 1995.
Yu, X. Y., Lee, T., Ayres, B., Kreidenweis, S. M., Collett, J. L., and Malm, W.: Particulate Nitrate Measurement Using Nylon Filters, J. Air Waste Manage. Assoc., 55, 1100–1110, https://doi.org/10.1080/10473289.2005.10464721, 2005.
Zakoura, M. and Pandis, S. N.: Overprediction of aerosol nitrate by chemical transport models: The role of grid resolution, Atmos. Environ., 187, 390–400, https://doi.org/10.1016/j.atmosenv.2018.05.066, 2018.
Zakoura, M. and Pandis, S. N.: Improving fine aerosol nitrate predictions using a Plume-in-Grid modeling approach, Atmos. Environ., 215, 116887, https://doi.org/10.1016/j.atmosenv.2019.116887, 2019.
Zhang, R., Sun, X., Shi, A., Huang, Y., Yan, J., Nie, T., Yan, X., and Li, X.: Secondary inorganic aerosols formation during haze episodes at an urban site in Beijing, China, Atmos. Environ., 177, 275–282, https://doi.org/10.1016/j.atmosenv.2017.12.031, 2018.
Zhang, X., Wu, Y., Liu, X., Reis, S., Jin, J., Dragosits, U., Van Damme, M., Clarisse, L., Whitburn, S., Coheur, P. F., and Gu, B.: Ammonia emissions may be substantially underestimated in China, Environ. Sci. Technol., 51, 12089–12096, https://doi.org/10.1021/acs.est.7b02171, 2017.
Zheng, F., Dong, F., Zhou, L., Chen, Y., Yu, J., Luo, X., Zhang, X., Lv, Z., Xia, X., and Xue, J.: Research Progress on Heterogeneous Reactions of Pollutant Gases on the Surface of Atmospheric Mineral Particulate Matter in China, Atmosphere, 13, 1283, https://doi.org/10.3390/atmos13081283, 2022.
- Abstract
- Introduction
- Methodology
- Evaluation of the Base Case Predictions for particulate NO
- Evaluation of different model setups in predicting observed PM2.5 and PM1 NO concentrations
- Temporal Variability and Tropospheric Burden of NO
- Conclusions
- Code and data availability
- Author contributions
- Competing interests
- Disclaimer
- Special issue statement
- Acknowledgements
- Financial support
- Review statement
- References
- Supplement