the Creative Commons Attribution 4.0 License.
the Creative Commons Attribution 4.0 License.
 | 09 Jan 2026
Comment on “Thermal infrared observations of a western United States biomass burning aerosol plume” by Sorenson et al. (2024)
Michael D. Fromm
Sorenson et al. (2024) studied fresh smoke plumes from the proximal Dixie fire in northern California and concluded that the smoke cooled the air and Earth surface below the smoke by shielding of incoming solar radiation. The so-attributed cooling was immediate, sudden and on par with diurnal temperature variations. This comment takes issue with their conclusions, reasoning, and method. By examining the same case and others, it is shown that the observed cooling within the smoke plume is caused by plume particulates sufficiently large to intercept and thereby alter upwelling thermal infrared radiation. The evidence presented is the same satellite and radar data employed by Sorenson et al. (2024), but expanded with temporal animations. A key element of the new analysis is the demonstration of smoke-associated cooling at nighttime, a circumstance decoupled from the solar-shielding explanation. The refutation of the proposed solar-shield-cooling in fresh smokes is an essential refinement of the constraints on the radiative cause-effect in such conditions.
- Article
(3456 KB) - Full-text XML
- Corresponding article
-
Supplement
(85494 KB) - BibTeX
- EndNote


Sorenson et al. (2024) (Hereafter S24) have claimed observational evidence of a direct Earth-surface cooling effect approaching 25 K by a fresh, dense biomass-burning smoke plume. They primarily attribute the cooling to “plume-induced surface insolation reduction,” a shielding of incoming solar radiation by optically dense smoke. They clarify, defend, and elaborate on their thesis in replies to community and reviewer comments (Sorenson, 2024a, b, c, d).
S24's analysis targets the Dixie fire in northern California, between 20–23 July 2021. Their specific focus is on the Dixie-fire plume in close proximity to the flaming source, i.e. at distances less than ∼ 100 km. S24's central data item for determining this large – and sudden – cooling under smoke comes from polar-orbiting and geostationary satellite-based broadband visible reflectance and window infrared (IR) brightness temperature (BT) measurements. S24 mention two additional potential causes of apparent smoke-plume surface cooling as inferred by depressed window BT: (1) large-particle exhaust such as pyrometeors (McCarthy et al., 2019) or pyrocumulus hydrometeors, and (2) absorption by gaseous emissions such as H2O. Yet their analysis leads them to largely dismiss these causes and settle on the visible solar shielding explanation. The main implication of S24's work is that there is a longwave component to smoke radiative forcing. Their association of window IR cooling with optically thick smoke prompts S24 to suggest that “brightness temperature at the thermal IR channels may also be used as another indirect measurement of AOD when aerosol optical depth is over the detection limit of the traditional aerosol retrieval methods.”
Given the uncertainty with respect to the cause of window IR BT depressions in some near-source wildfire plumes which appear from space to be nothing more than optically thick plain smoke (suggested by their monochromatic grayness or tan true color), S24 raise the valid question regarding the particulate composition within. This puzzle is addressed herein with a refutation of S24's conclusion of visible shielding of solar radiation. Herein, contradictory evidence is presented specific to the Dixie fire during the timeframe of S24's analysis. Additional Dixie-fire dates and other fire events are also presented.
The topic brought to light by S24 and further developed herein stands as an important science challenge: full understanding of the physical nature of near-source wildfire particulate emissions. Quantifying the wildfire smoke source term is a quest of measurement campaigns such as NASA's upcoming INjected Smoke and PYRocumulonimbus Experiment (INSPYRE) (https://espo.nasa.gov/inspyre, last access: 18 June 2025). It is essential to have an accurate satellite-data framework for evaluating suborbital remote and in situ measurements of freshly emitted dense smoke.
It is necessary at this point to clarify some terminology central to S24 and this commentary. “Skin temperature” will refer to Earth-surface temperature. Given near unity Earth-surface emissivity, skin temperature is approximately what weather satellite broadband window IR BT represents in clear-sky conditions albeit with a minor correction for water vapor absorption (Schmit et al., 2018). “Surface air temperature,” routinely measured in situ at 2 m height, is a second metric central to S24. Although the two quantities are obviously physically related, it is essential to distinguish them. For example, Schmit et al. (2018) cautioned that geostationary operational environmental satellite (GOES) window BT is not necessarily representative of 2 m surface air temperature.
In the following sections, this comment addresses and contests specific aspects of S24's analysis, presents a discussion, and offers concluding remarks.
In Sect. 3.1, S24 introduced a multispectral reflectance image analysis in pursuit of evidence consistent with coarse-giant size particles responsible for the depressed window IR BT within the Dixie smoke plume. They presented a snapshot of the Dixie plume in the early afternoon of 22 July (13:10 local time, 21:10 UTC), afforded by Aqua MODIS. See their Fig. 1. This analysis entailed a focus on mapped MODIS true-color reflectance in combination with images of reflectance at 1.6 and 2.1 µm (S24 Fig. 1), in concert with argumentation about aerosol microphysics and expectations for the wavelength dependence of top-of-atmosphere (TOA) reflectance. S24 presented the image snapshot view with a statistical analysis of Dixie-plume reflectance and window IR depression in comparison to that of nearby smoke-free clear-sky conditions. They concluded that the lack of a visual and statistical signal of enhanced reflectance at 2.1 µm supported their determination that coarse or larger particles were not driving the plume's window IR BT depressions.
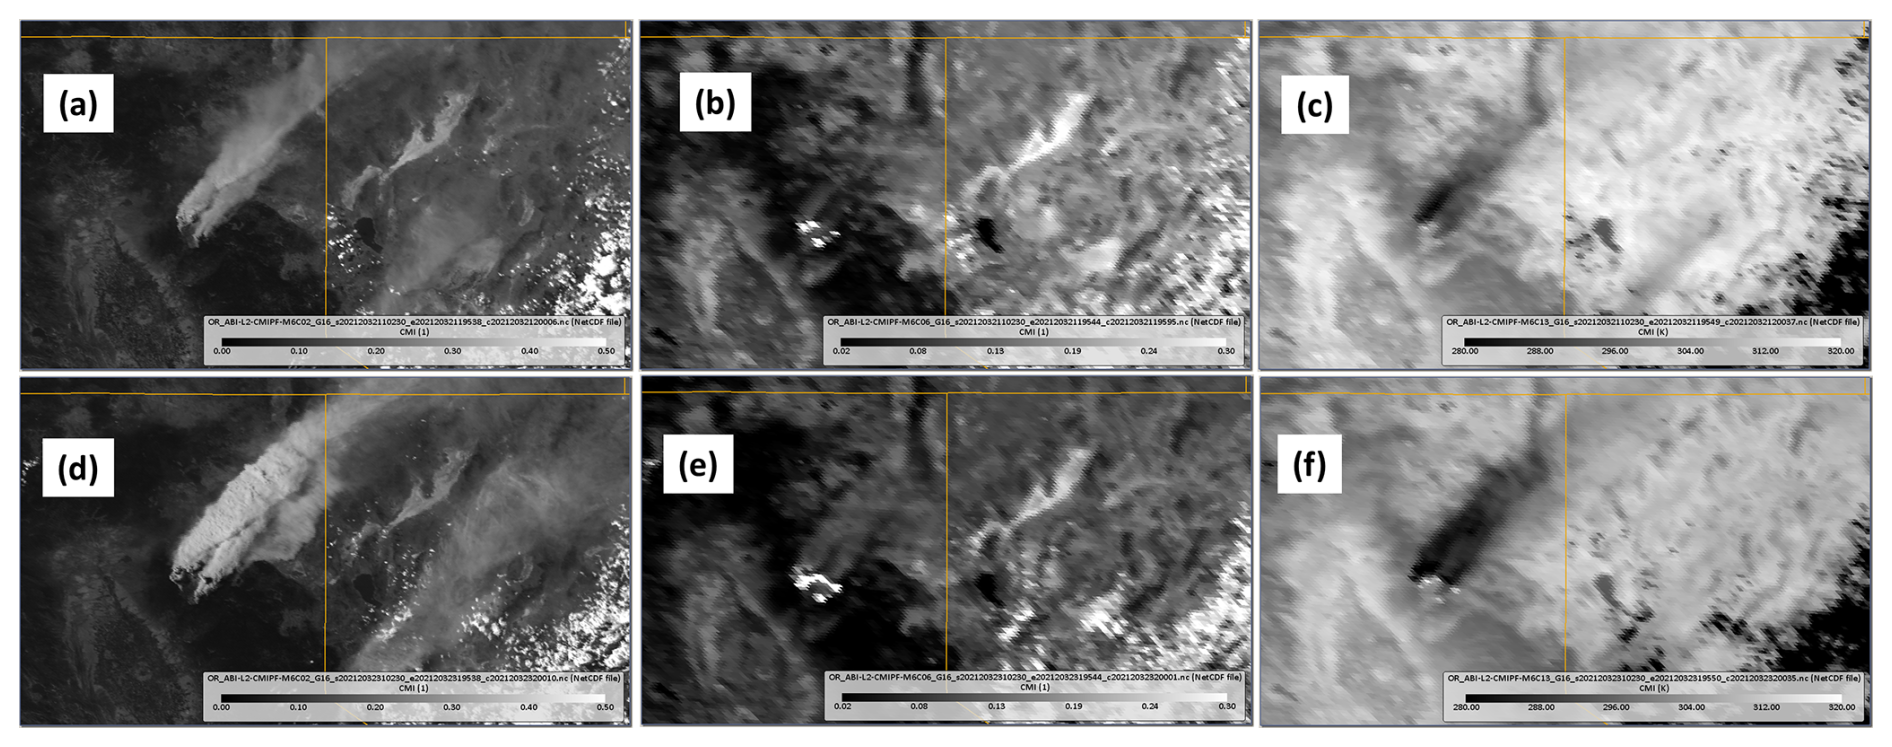
Figure 1GOES East multi-spectral images focused on northern California's Dixie fire and plume, 22 July 2021. Top row, 21:10 UTC; bottom row, 23:10 UTC. Left column, 0.64 µm “red”channel reflectance. Middle column, 2.2 µm channel shortwave-IR reflectance. Right column, 10.3 µm “clean” window brightness temperature (BT). See the various color-bar legends for the reflectance (unitless) and BT (K) ranges.
This comment finds S24's analysis to be incomplete and misleading. For one thing, a single snapshot such as S24's Fig. 1 may not adequately represent an evolving wildfire/plume dynamic. Moreover, the early afternoon setting precedes the typical diurnal maximum in wildfire energy and extreme pyroconvection (Zhang et al., 2012; Fromm et al., 2010). Hence, Aqua MODIS sampling is insufficient for drawing conclusions about a changing emissions scenario as portrayed in S24's central Figs. 2 and 6), or in general.
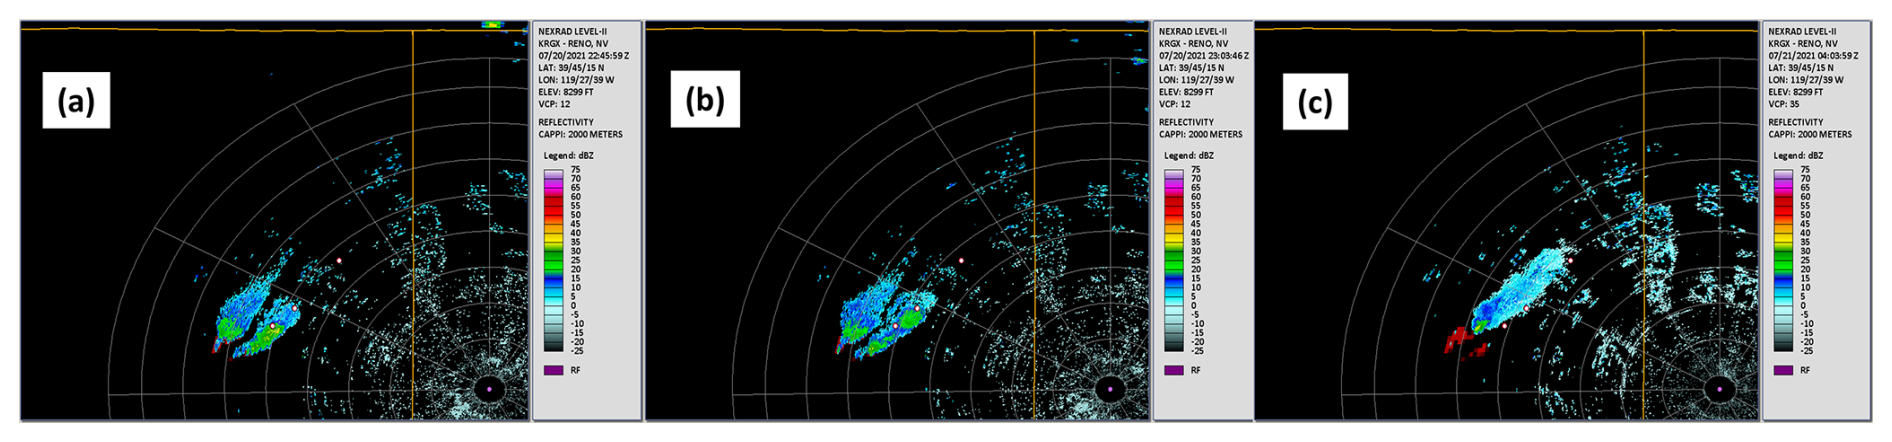
Figure 2Reno, Nevada NEXRAD (site ID KRGX, purple dot mark) 2 km constant altitude plan position indicator (CAPPI) image for 20 July 2021. The two southwestward red-white dots are at S24's Fig. 2 orange- and green-dot locations. The marker toward the northeast represents S24's Fig. 3j plume-reflectivity edge. (a) 22:46 UTC. (b) 23:04 UTC. (c) 04:05 UTC 21 July (post sunset).
This comment presents an analysis of GOES 16 2.2 µm reflectance imagery surrounding the Aqua MODIS sample in S24's Fig. 1. Enhanced shortwave infrared (SWIR) reflectance is demonstrated in Fig. 1, images of 0.64 and 2.2 µm reflectance, and 10.3 µm BT on 22 July at 21:10 UTC (Aqua time) and two hours later, 23:10 UTC. The evolution of the visible and SWIR reflectance enhancements is clarified with animations between 19:00 UTC (∼ 2 h pre-MODIS) and 23:50 UTC. See Movies S01 and S02 in the Supplement. The snapshots and especially the animation show the spread of visible smoke from the Dixie Fire past the Nevada and Oregon border, also portrayed by S24's Fig. 1. Within the visible plume, window BT depressions consistent with S24's analysis are evident (Fig. 1c, f). The addition of the 2.2 µm reflectance snapshots and animation reveal that as the afternoon progresses, plume signals develop and advance within the visible-channel plume footprint, almost to the state border. It appears from the animation that Aqua time approximately represents the apparent onset of SWIR reflectance enhancements. Qualitatively, these animation sequences can be viewed as showing thickening of visible optical depth, occasional pyrocumulus, and temporal increase in smoke particle size near the fire source as inferred from the lag in the onset of SWIR reflectance. Similarly, one can infer a decrease in particle size toward the downwind extent of the plume where the SWIR signal degrades relative to the visible reflectance.
In S24's Sect. 3.1 they present a “final test of the potential impacts of pyrometeors and hydrometeors on the observed TIR cooling.” Here they use NEXRAD radar from two sites, Beale Air Force Base (KBBX) and Reno (KRGX). They acknowledge the presence of plume particles sufficiently large and/or concentrated to create widespread radar echoes from the fire to far downwind (S24 Fig. 3j), yet they “conclude that pyrometeors and hydrometeors are not the primary cause of the thermal infrared (TIR) cooling signal.” This comment takes issue with their analysis and interpretation, addressing two aspects of the radar analysis.
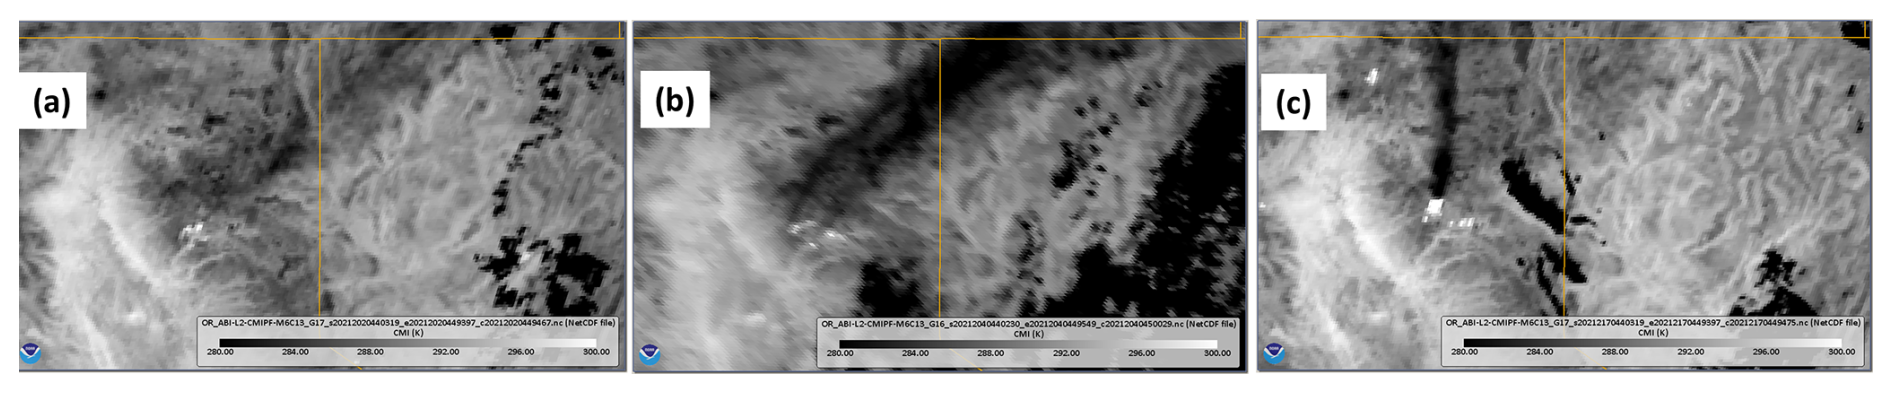
Figure 3Dixie-fire area post-sunset (04:40 UTC) GOES “clean” window (10.3 µm) IR BT images. (a) 21 July, GOES West. (b) 23 July, GOES East. (c) 5 August, GOES West.
First, S24's important Fig. 2 and surrounding discussion focus on three points close to the Dixie plume source, two within the plume's influence (orange and green spots in their Fig. 2) and one outside (blue). Note that the orange and green points are roughly 32 and 44 km downstream of the fire source, respectively. The window IR BT depressions of the plume points relative to the outside point (S24 Fig. 2g) are central evidence for their insolation-shielding argument as opposed to ash/cloud effect on window IR BT. Except for a brief, strong BT dip at the orange point – attributed to a pyrocumulus cloud – the entirety of the strong, sudden, and multi-hour cooling at the orange and green points is considered most likely to be the result of insolation shielding. However, when one compares S24's Figs. 2 and 3, it is obvious that plume echoes completely cover the orange and green spots. The radar data are later than S24's brief pyrocumulus by more than an hour yet echoes between ∼ 2–6 km altitude cover the orange and green points as well as a much wider area.
S24 dismiss the elevated, downwind-edge echoes in their Fig. 3k, l as having “next to no reflectivity.” The distance from their Fig. 3j–l downwind spot to the upwind echo edge is ∼ 92 km; indeed a considerable spread of plume particles from the fire source. Moreover, the echoes are ∼ 125 km from the KRGX radar. At least two radar-centric factors are in play that determine the areal sensitivity to the Dixie plume. One is beam-broadening, which will limit both KBBX and KRGX sensitivity to the far downrange plume features. In the case of KBBX, noted by S24 to be situated in a valley (67 m a.s.l.), its orientation with respect to the Dixie fire is in the direction of mountain peaks between ∼ 1500 and 2000 m, so that beam blocking obscures low-elevation views of the far downrange plume. Given that the Dixie-fire plume's window IR BT depressions extend far downwind from the source (S24 Fig. 3c) and beyond KBBX and KRGX traceability, it is reasonable then to conclude that Dixie plume particles persist far from the source beyond where cloud-particle echoes are “next to no reflectivity.” It must also be noted that the GOES SWIR reflectance (S24 Fig. 3b) enhancement has spread far northeast of the Dixie fire and beyond the radar detection range. See the Supplement, Movies S03 and S24's Fig. 3b.
A more comprehensive visualization of the Dixie fire cloud is offered in the Supplement, Movie S04, three snapshots from which are shown in Fig. 2. The animation is for 20 July (local time), from early afternoon to post sunset. The data portrayal is 2 km constant altitude plan position indicator (CAPPI). The background layer is GOES 17 3.9 µm Dixie fire hotspots in red shades. Dot markers, from southwest to northeast, are S24's Fig. 2 orange and green spots, and S24's distant-echo spot (Their Fig. 3j–l), respectively. The animation shows Dixie-plume echoes spreading to all three points on two occasions, the first in late afternoon and the second spanning beyond sunset (∼ 03:40 UTC). The snapshots in Fig. 2a, b capture the pyrocumulus cloud encroaching on S24's orange point and later the green point, corresponding roughly to the initial, sudden window IR BT dips in S24 Fig. 2. Figure 2c illustrates a continuous swath of echoes from near the Dixie fire to spots more than 90 km downwind.
Hence cloud-size particulates are independently confirmed in a pattern matching the evolving satellite visible and window IR features near and far downwind of the Dixie fire. Given that weather-radar particle-size sensitivity is orders of magnitude weaker than that for thermal IR radiometer sensors, it is not surprising that these radar illustrations represent a subset of the entire Dixie smoke cloud.
Section 3.4 of S24 is a “cross-check” of their conclusion that smoke shielding of insolation causes significant window IR cooling. Their cross check is an examination of a nighttime satellite image of Dixie fire smoke fortuitously illuminated by moonlight (S24 Fig. 7b). The evidently widespread, thick smoke is unaccompanied by a discernible window IR BT depression (their Fig. 7e), unlike the afternoon conditions the day before and after (their Fig. 7a, c, d, f). They considered this cross-check as determinative of insolation-shielding as the prime factor of the observed daytime window IR cooling under smoke.
This comment refutes this methodology and conclusion. In this challenge, the Dixie fire plume on the two dates studied by S24 is exploited, as well as an additional date in the Dixie fire's life: 5 August 2021. The challenge herein also introduces a different wildfire event, that of the northwest USA wildfire outbreak in September 2020 (Abatzoglou et al., 2021; Mass et al., 2021). The analysis centers on post-sunset animations of GOES window BT. Animations of window IR BT are vastly preferable to single snapshots considering expectations of a weak IR signal imposed on a topographically variable surface. The Dixie-fire dates are 21, 23 July, and 5 August 2021. Each run from 03:40–07:00 UTC. They are provided in the Supplement (Movies S05, S06, and S07). Snapshot images roughly 1 h post sunset are shown in Fig. 3. Dixie fire hotspots are plainly evident as the cluster of “hot” (white) pixels. Emissions emanating from this hotspot cluster stand out in each animation. Evidence of the window IR plume signature is the apparent northeastward (21 and 23 July) and northward (5 August) flow against a static background representing clear-sky conditions. On all three nights the Dixie plume is straightforwardly evident. On 21 July, the IR plume is weak relative to that on 23 July and 5 August, but it is still discernable as far away from the source as northwestern Nevada and southern Oregon. With the visual training afforded by the animations, the stand-alone snapshots are seen to be sufficient proof of the smoke in window IR on 23 July and 5 August (Fig. 3b–c). However, this is not the case for 21 July (Fig. 3a); the snapshot's plume-related cool-BT features are neither strong nor widespread enough to stand out against the topography-generated BT mottling. This may be the case for the 23 July situation S24 exhibited in their Fig. 7b, e. It is also possible that by the time of the nighttime imagery in S24's Fig. 7 that the overall particle size within the Dixie smoke had declined to the point of being transparent in the longwave window. Regardless, the GOES animation Movie S06 makes clear a nighttime signature of smoke preceding the S24 sampling.
This comment draws attention to the 5 August animation (Movie S07), which captures a second active fire in far northern California. This is the Antelope fire, which started on 1 August (https://www.fire.ca.gov/incidents/2021, last access: 23 April 2025). The animation reveals even subtle window IR BT depressions flowing north from the fire. Hence both Dixie and Antelope stand as evidence for particle-driven “cool” top-of-atmosphere emissions.
A fourth example of nighttime window IR BT depression in smoke is presented in Movie S08. The situation is on 9 September 2020, a few days after widespread fires had ignited from western Washington State through Oregon (Abatzoglou et al., 2021; Mass et al., 2021), adding to an already active fire landscape in northern and central California. Movie S08 shows window IR BT plumes emanating from at least 7 hot fires in California and Oregon. Although not shown, nighttime visible imagery (akin to S24's image in Fig. 7b) for 9 September 2020 confirms widespread smoke from these fires. Strikingly evident is the advance of the window IR plume signature flowing well off the Oregon coast over the Pacific Ocean, far from the flaming sources. This example provides incontrovertible proof of a particulate-based driver of window IR “cooling” as opposed to the insolation-shielding explanation of S24.
The four examples above of nighttime window IR BT depression linked to wildfire sources proves that the solar-shielding explanation of S24 is inadequate to explain all such observed conditions, day or night.
S24 examined daytime conditions on 22 July 2021 to “test the impact of the smoke plumes on surface conditions.” On this day, 2 m air temperature was recorded at two stations representing near-fire dense smoke and distant faint smoke. Dense smoke was present over the near-fire site (ASOS station O05) from sunrise onward (not shown). S24's Fig. 6b reveals that the surface temperatures at both stations were equal at sunrise but gradually diverged throughout the day. This is predictable for a smoke-shrouded site as compared to one in nearly clear-sky condition throughout the day. Utilizing the ASOS data (S24; https://mesonet.agron.iastate.edu/request/download.phtml?network=AWOS, last access: 19 February 2025), the AAT-O05 temperature difference is calculated at all mutual reporting times between 13:55 and 23:55 UTC, and then the average hourly change thereof. The result is 1.29 K h−1. The maximum AAT-O05 surface-temperature difference, +9.78 K at 23:55 UTC, occurs after 9 h of gradual relative cooling under the dense smoke.
The ASOS station O05 2 m air temperature is compared with GOES 16 “clean” window BT in Fig. 4. Between 13:55 and 23:59 UTC 22 July, the GOES pixel matched with O05's coordinates is plotted in red; the ASOS value in blue. For approximately 3 h in morning sunlight both GOES and ASOS temperatures increase while the GOES BT exceeds the 2 m ASOS temperature. Thereafter the BT flattens then diminishes while the 2 m temperature increases until peaking at 23:00 UTC, when the ASOS-GOES difference peaks at 16 K. Considering the relation between ASOS AAT and O05 surface temperature as opposed to the ASOS O05-GOES BT relation, it is apparent that GOES BT is not a proxy for skin temperature throughout the day, and certainly decoupled from 2 m air temperature. The question then arises as to what is causing the window IR BT to diverge from skin-temperatures at this location and time?
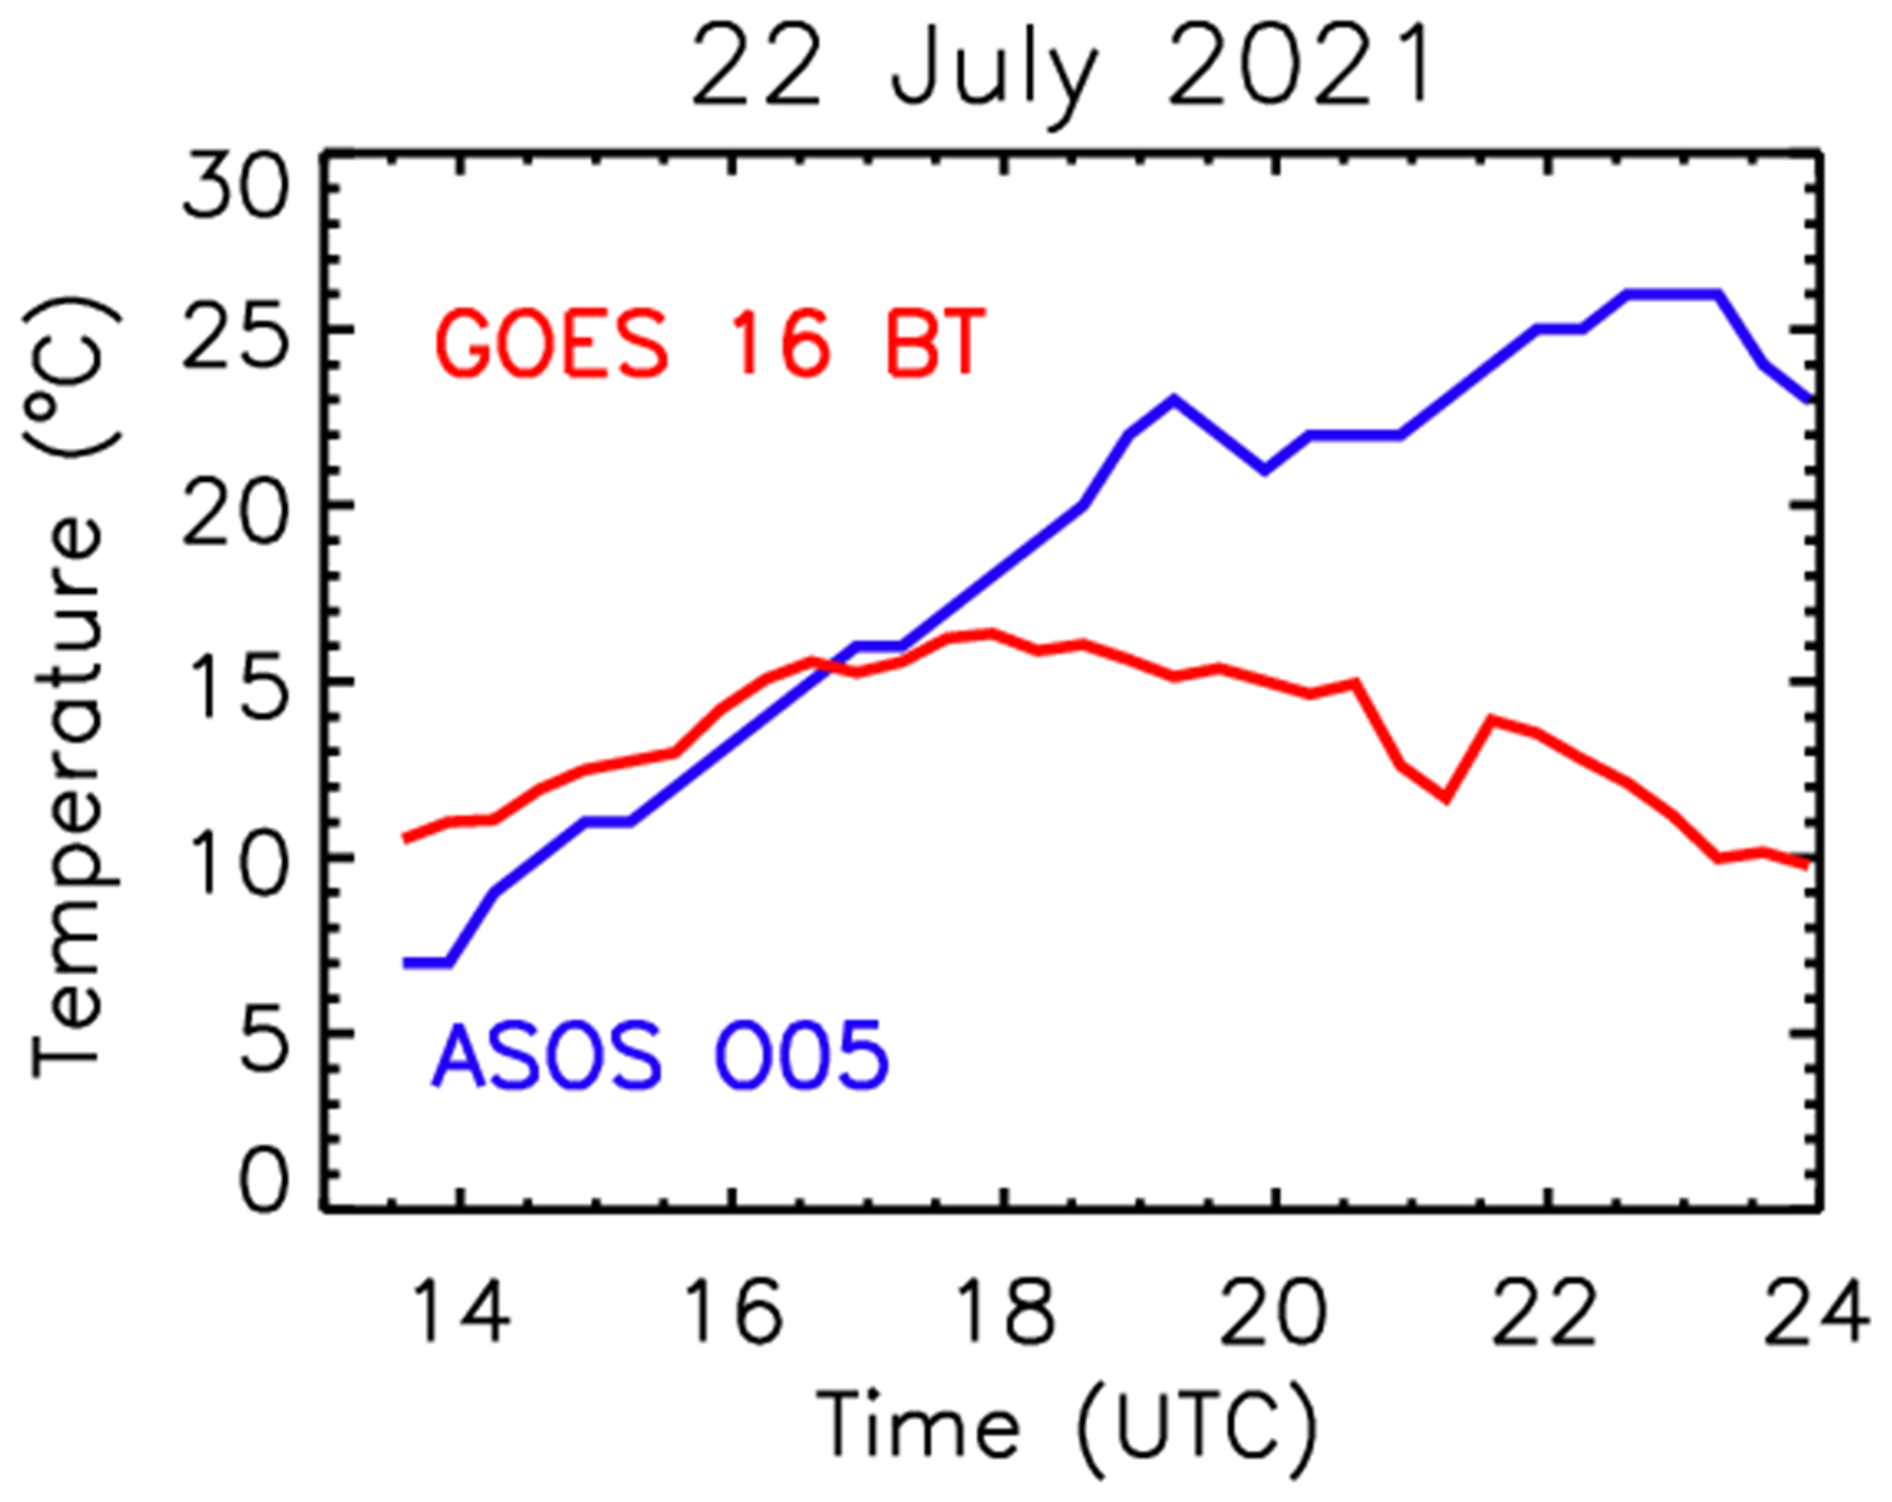
Figure 4ASOS station O05 temperature and GOES 16 window BT time series, daytime 22 July. The ASOS data (blue line) are the same as in S24's Fig. 6. Red line, BT for the GOES pixel (at 40.282° N, 121.241° W) closest to O05 (40.2824° N, 121.241° W) location.
That question is addressed with NEXRAD data, as S24 did for 20 July. The focus is on ASOS O05. Figure 5 is a map of KBBX reflectivity at 14:00 UTC. The radar data are displayed on the 3 km CAPPI cross-section. The underlying layer in Fig. 5 is GOES 16 3.9 µm BT, highlighting the Dixie Fire hot spots in bright red. Station O05 is ∼ 26 km from the Dixie fire as measured from the station to the upwind edge of the radar echoes. Echoes form a swath originating over the Dixie fire and extending north northeast beyond O05. An animation of the 3 km CAPPI reflectivity from 13:30–23:59 UTC (Movie S09) reveals that Dixie fire particulate emissions are continuous while spreading to and beyond O05 regularly. In the afternoon hours (when the GOES window BT declines from peak values) reflectivity values increase appreciably while the detectible smoke cloud extends far beyond O05. Accompanying Movie S09 is Movie S10, GOES 16 clean window IR BT animated between 13:30 and 23:59 UTC 22 July. The domain is broadened to include the distant ASOS station AAT, marked along with O05. The fixed, narrow BT color scale allows discernment of the Dixie-fire IR-sensible emission onset and spread. To the eye, the IR signal of the Dixie plume begins between 16:00–17:00 UTC, local morning. The BT plume intensifies throughout the day and extends beyond the California/Nevada border by late afternoon. Considering the radar animation, it is apparent that the window BT depression within the Dixie plume is attributable to particulates sufficiently large to intercept terrestrial longwave emissions.
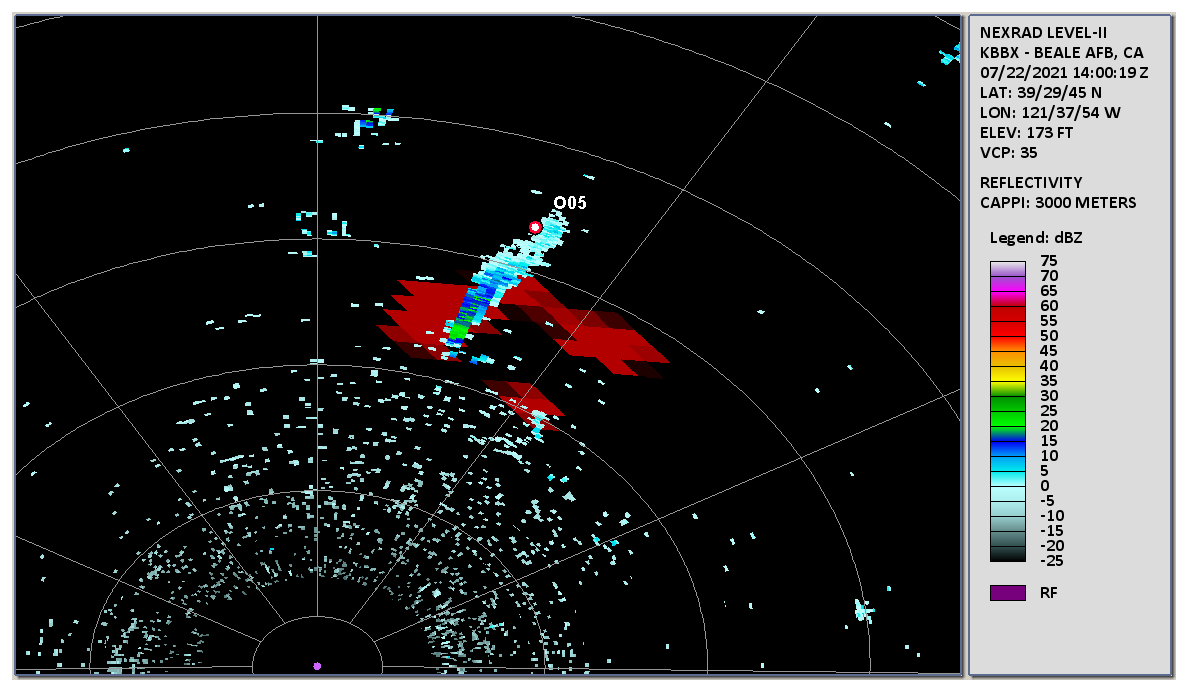
Figure 5Beale Air Force Base (site ID KBBX) NEXRAD 3 km CAPPI reflectivity, 22 July, 14:00 UTC. Radar location, purple dot. Range rings start at 10 km, thereafter 25 km spacing. Background layer: GOES 3.9 µm BT; red pixels signify the Dixie fire hot spots. ASOS station O05 is marked with a dot and annotated.
S24 cite appropriate literature on other case studies showing the relationship between optically dense wildfire smoke plumes and surface cooling. Some of these earlier works (e.g. Westphal and Toon, 1991; Robock, 1991) were in service of providing observational evidence in support of Nuclear Winter theory (e.g. Robock et al., 2007). All of the cited literature involved cases of aged, mesoscale or synoptic-scale smoke plumes that persisted over the study regions for days or longer. The S24 scenario of nascent smoke in close proximity to the source fire is quite different than the cited cases. S24 raise the valid question as to the determinant of the sensible window BT depressions observed in some examples of supposed “dry” smoke exhausted by nearby energetic fires. S24's examples from California's Dixie fire in July 2021 are a recurring phenomenon, as acknowledged in their work and in the presentation herein.
S24 showed evidence of sudden window IR BT reduction exceeding 10 °C, e.g. their Fig. 2g. Focusing solely on the green spot's BT evolution (avoiding the orange point's pyrocumulus signal), there is a BT reduction of ∼ 19 °C within one hour. Visible reflectance jumped simultaneously. I.e. sky conditions over the green point went from clear to dense smoke between ∼ 22:00 and 23:00 UTC. Simply considering Earth-surface radiative inertia, it would seem physically implausible for skin temperature to drop so suddenly and greatly solely as a consequence of smoke visible AOD ramping up as depicted in S24 Fig. 2g.
Optically dense wildfire smoke plumes are intuitively known for their tan/brown hue in true color satellite imagery and gray in monochromatic visible imagery owing to their absorptive carbonaceous content. It is natural to interpret these shades as “dry,” i.e. plain smoke and thereby infer a certain microphysical/radiative character. However, S24 draw attention to the counter-intuitive nature of certain dense smokes that appear to embody some cloudlike IR characteristics. Such conditions are still poorly understood in terms of the smoke-plume composition. However, there is a subset of plain-looking smoke plumes for which there is strong evidence of comingled cloud material.
It has been established that pyrocumulonimbus-injected plumes can counter-intuitively manifest as both opaque aerosol and H2O cloud. The term “smoke cloud” is introduced for this situation. The smoke cloud has a strong, cold window IR BT signature and the visible appearance of plain smoke, i.e brownish or gray in true color or monochromatic imagery, respectively (Fromm and Servranckx, 2003; Fromm et al., 2005, 2008). It is therefore conceivable for this peculiar condition to manifest within certain fresh, vigorous smoke plumes, especially ones pockmarked with capping pyrocumulus turrets (i.e. whitish cloud appearance). In this case the “cloud” material within the smoky looking plume is likely composed of pyrometeors (McCarthy et al., 2019), cloud particles, or a blend. This is the case for the Dixie fire plumes analyzed by S24 and others presented herein.
S24 attribute window IR cooling to fine-mode smoke abruptly “shutting off” insolation (Sorenson, 2024c), characterizing the “drastic” effect with BT-depression values between 10 and 25 K. This range is on par with the observed clear-sky diurnal BT range shown in their Fig. 2. They do not provide an adequate physical explanation for the rapid and strong window IR BT decline they attribute to smoke shadowing. While it is reasonable to expect negative forcing on skin and near-surface air temperature by virtue of plume (or cloud) insolation shielding, sudden cooling on par with or exceeding the full diurnal temperature/BT cycle is irreconcilable with empirical Earth-surface response to solar radiation. Put simply, sudden onset of cloudiness or a dense plume does not typically drive 20+ K skin- or air-temperature reductions
It is important to recognize that weather radar data are inherently subject to range-dependent sensitivity degradation due to beam broadening. Convolving this effect with radar wavelength/particle-size sensitivity, it is expected that certain portions of a smoke cloud will fall below detectability thresholds in comparison to the inherently near uniform satellite-sampling in combination with window IR wavelength sensitivity to sub-millimeter particles. In short, the absence of radar echoes does not imply no particles. Smoke clouds are preferentially discerned by satellite in the window IR while near-range active radar remote sensing confirms the “cloud” qualification.
The most concise distillation of S24's conclusions is given in their abstract: “… clear signals in water vapor and TIR channels suggest that both co-transported water vapor injected to the middle to upper troposphere and surface cooling by the reduction of surface radiation by the plume are more significant, with the surface cooling effect of smoke aloft being the most dominant.” The water-vapor-injection argument is not supportable. S24 present no observational support for pyrogenic injection to the middle or upper troposphere. Indeed, their messaging explicitly excludes the scenario of such deep pyroconvection except for an isolated pyrocumulus cloud on 20 July (local time) briefly perturbing GOES window IR BT. Implicit in S24's argumentation is that the overall smoke plume's effect on IR BT is that there is little to no evidence of cloud-size particles therein. This argument limits the injection height to levels below cloud condensation levels, i.e., to the lower troposphere. Hence it is illogical to imply mid- to upper-tropospheric transport of the smoke plume by virtue of involving such upper-level water vapor signals.
This comment was inspired by the publication of Sorenson et al. (2024), who addressed the admittedly curious condition of apparently dry smoke plumes freshly emitted from wildfires accompanied by thermal IR absorption. S24's proposition is that opaque, supposedly dry smokes can dramatically cool the Earth surface by effectively shutting off insolation.
Their case studies and two new ones were presented wherein an alternate, intuitive explanation is manifest. It was revealed that in fact particulate matter within the fresh plumes is responsible for the IR absorption in every case. The most convincing evidence is thermal IR absorption in the smoke at night from the same fire (Dixie) S24 studied. S24's position is that their scenario would only apply to daytime.
In addition to S24's July 2021 Dixie fire episodes, another approximately two weeks later was introduced. Once again deploying GOES thermal IR image animations, it was shown that nighttime IR smoke emissions from Dixie as well as a second fire (Antelope) were present. Finally, a remarkable nighttime scenario from September 2020 in the northwest USA was presented. On this occasion, IR emissions spewed from at least 7 fires in Oregon and California, emissions that were evident even over the distant Pacific Ocean.
In addition to deploying GOES image data, NEXRAD reflectivity data were examined, as in S24. It was shown that particulate-generated-reflectivity enhancements were present where S24 reported solar-shielding-attributed cooling at two weather stations. Arguments were presented for the value of radar data for smoke-plume detection and also the various limitations of these data relative to satellite broadband imagery.
The GOES analysis also consisted of visible and shortwave IR reflectance views, as in S24. Animations from midday to evening improved the plume-detection capability and revealed multispectral reflectance enhancements indicative of sufficiently large smoke particles, countering S24's assessment that SWIR reflectance was absent and by extension, no indication of coarse-mode particles.
The subject of smoke composition in fresh, dense plumes is ripe for future exploration. McCarthy et al. (2019)'s revelation of pyrometeors is a starting point for pondering and diagnosing the particulate composition and microphysics of smoke plumes that represent the source condition for a host of science questions. Future measurement campaigns such as NASA's INjected Smoke and PYRocumulonimbus Experiment (INSPYRE) (https://espo.nasa.gov/inspyre, last access: 23 April 2025) have science aims including characterizing the smoke-plume source term. It is essential to have an accurate foundational construct for the physical properties of freshly emitted dense smoke. This reinterpretation of S24's conclusions is thereby offered.
ASOS data were retrieved from https://mesonet.agron.iastate.edu/request/download.phtml (Iowa Environmental Mesonet of Iowa State University, 2025).
GOES image data are part of the NOAA Big Data initiative: https://registry.opendata.aws/noaa-goes/ (NOAA Big Data initiative, 2025). They were accessed via the NOAA Weather and Climate Toolkit: https://www.ncdc.noaa.gov/wct/ (last access: 23 April 2025).
The supplement related to this article is available online at https://doi.org/10.5194/acp-26-515-2026-supplement.
The author has declared that there are no competing interests.
Publisher's note: Copernicus Publications remains neutral with regard to jurisdictional claims made in the text, published maps, institutional affiliations, or any other geographical representation in this paper. The authors bear the ultimate responsibility for providing appropriate place names. Views expressed in the text are those of the authors and do not necessarily reflect the views of the publisher.
MDF is grateful to Gerald Nedoluha, who provided helpful suggestions for the manuscript.
Support for this work was entirely from US Naval Research Lab base program.
This paper was edited by Stelios Kazadzis and reviewed by Sophie Vandenbussche and one anonymous referee.
Abatzoglou, J. T., Rupp, D. E., O'Neill, L. W., and Sadegh, M.: Compound extremes drive the western Oregon wildfires of September 2020, Geophys. Res. Lett., 48, https://doi.org/10.1029/2021GL092520, 2021.
Fromm, M. D. and Servranckx, R.: Transport of forest fire smoke above the tropopause by supercell convection, Geophys. Res. Lett., 30, 1542, https://doi.org/10.1029/2002GL016820, 2003.
Fromm, M., Bevilacqua, R., Servranckx, R., Rosen, J., Thayer, J. P., Herman, J., and Larko, D.: Pyro-cumulonimbus injection of smoke to the stratosphere: Observations and impact of a super blowup in northwestern Canada on 3–4 August 1998, J. Geophys. Res., 110, D08205, https://doi.org/10.1029/2004JD005350, 2005.
Fromm, M., Torres, O., Diner, D., Lindsey, D., Vant Hull, B., Servranckx, R., Shettle, E. P., and Li, Z.: Stratospheric impact of the Chisholm pyrocumulonimbus eruption: 1. Earth-viewing satellite perspective, J. Geophys. Res.-Atmos., 113, D08202, https://doi.org/10.1029/2007JD009153, 2008.
Fromm, M., Lindsey, D. T., Servranckx, R., Yue, G., Trickl, T., Sica, R., Doucet, P., and Godin-Beekmann, S.: The untold story of pyrocumulonimbus, B. Am. Meteorol. Soc., 91, 1193–1209, https://doi.org/10.1175/2010BAMS3004.1, 2010.
Iowa Environmental Mesonet of Iowa State University: ASOS-AWOS-METAR Data, Iowa State University [data set], https://mesonet.agron.iastate.edu/request/download.phtml, last access: 23 April 2025.
Mass, C. F., Ovens, D., Conrick, R., and Saltenberger, J.: The september 2020 wildfires over the Pacific Northwest, Weather and Forecasting, 36, 1843–1865, 2021.
McCarthy, N., Guyot, A., Dowdy, A., and McGowan, H.: Wildfire and Weather Radar: A Review, J. Geophys. Res.-Atmos., 124, 266–286, https://doi.org/10.1029/2018JD029285, 2019.
NOAA Big Data initiative: NOAA Geostationary Operational Environmental Satellites (GOES) 16, 17, 18 & 19, aws [data set], https://registry.opendata.aws/noaa-goes/, last access: 23 April 2025.
Robock, A.: Surface cooling due to forest fire smoke, J. Geophys. Res., 96, 20869–20878, https://doi.org/10.1029/91JD02043, 1991.
Robock, A., Oman, L., and Stenchikov, G. L.: Nuclear winter revisited with a modern climate model and current nuclear arsenals: Still catastrophic consequences, J. Geophys. Res., 112, D13107, https://doi.org/10.1029/2006JD008235, 2007.
Schmit, T. J., S. S. Lindstrom, J. J. Gerth, M. M. Gunshor: Applications of the 16 spectral bands on the Advanced Baseline Imager (ABI), J. Operational Meteor., 6, 33–46, 2018.
Sorenson, B. T., Reid, J. S., Zhang, J., Holz, R. E., Smith Sr., W. L., and Gumber, A.: Thermal infrared observations of a western United States biomass burning aerosol plume, Atmos. Chem. Phys., 24, 1231–1248, https://doi.org/10.5194/acp-24-1231-2024, 2024.
Sorenson, B.: Author Comment 1, Reply on CC1, https://doi.org/10.5194/egusphere-2023-218-AC1, 2024a.
Sorenson, B.: Author Comment 2, Reply on RC1, https://doi.org/10.5194/egusphere-2023-218-AC2, 2024b.
Sorenson, B.: Author Comment 3, Reply on RC2, https://doi.org/10.5194/egusphere-2023-218-AC3, 2024c.
Sorenson, B.: Author Comment 4, Reply on RC3, https://doi.org/10.5194/egusphere-2023-218-AC4, 2024d.
Westphal, D. L. and Toon, O. B.: Simulations of microphysical, radiative, and dynamical processes in a continental-scale forest fire smoke plume, J. Geophys. Res.-Atmos., 96, 22379–22400, https://doi.org/10.1029/91JD01956, 1991.
Zhang, X., Kondragunta, S., Ram, J., Schmidt, C., and Huang, H.-C: Near-real-time global biomass burning emissions product from geostationary satellite constellation, J. Geophys. Res., 117, D14201 https://doi.org/10.1029/2012JD017459, 2012.