the Creative Commons Attribution 4.0 License.
the Creative Commons Attribution 4.0 License.
 | 09 Jan 2026
Measurement report: New particle formation and aerosol properties at a newly founded atmospheric observatory at the Finnish Baltic Sea coast
Maija Peltola
Roseline Thakur
Kurt Spence
Janne Lampilahti
Ronja Mäkelä
Sasu Karttunen
Ekaterina Ezhova
Sami Haapanala
Aki Vähä
Juha Kangasluoma
Tommy Chan
Pauli Paasonen
Joanna Norkko
Alf Norkko
Markku Kulmala
Aerosol formation is an important contributor to climate in different environments. Coastal ecosystems are of special interest, since their habitat types and species can be highly diverse which can lead to high variability in fluxes of aerosol precursor vapours. Here, we present the first results from an atmospheric observatory established in 2022 at the Tvärminne Zoological Station (TZS) on the southern coast of Finland as a part of the Centre for Coastal Ecosystem and Climate Change Research (CoastClim). This work is focused on new particle formation (NPF) and how it is influenced by the coastal environment. NPF occurred at TZS roughly as often as at the well-established boreal forest site Hyytiälä, 230 km north-north-east of TZS. However, only one-third of the events occurred during the same days at both stations. Similarly to Hyytiälä, NPF events were most likely to be observed when clean air masses from the Norwegian Sea pass over the boreal forest region. To understand the special characteristics of aerosol formation at the coast, we also studied local intermediate ion formation (LIIF), which can tell us about aerosol formation potential in the vicinity of the measurement site. LIIF was more abundant over the continent compared to the marine sector and it was favoured by low condensation sink and sunny dry conditions. This study presents an overview of aerosol size distributions at TZS and provides a basis for future work, which will aim to understand the sources of coastal aerosol precursors and their links to coastal ecology and biogeochemistry.
- Article
(12742 KB) - Full-text XML
- BibTeX
- EndNote


Aerosol particles are an essential part of the atmosphere, known not only for their adverse health effects, but also for their uncertain direct and indirect climate effects (Masson-Delmotte et al., 2021). Aerosol size distribution and chemical composition are essential, since they define the number of aerosols that can act as cloud condensation nuclei (CCN) under different conditions. Thus, they influence the radiative properties of clouds and further on, the radiative balance of the Earth. The majority of global CCN are produced by new particle formation (NPF) in the atmosphere (Gordon et al., 2017). In NPF, aerosols are formed in the atmosphere through gas-to-particle conversion. These gases have various sources, ranging from vegetation to human activities, and typically they need to go through chemical reactions in the atmosphere before their volatility becomes low enough for them to contribute to NPF. One important factor governing aerosol formation is the pre-existing particle population that acts as a sink for both condensing vapours and the small freshly formed particles. The source of condensing vapours thus needs to be large enough for particles to survive and grow to climate relevant size ranges.
Even though the oceans cover over 70 % of the globe, most NPF studies have been conducted over continental regions (Kerminen et al., 2018). Recent research has highlighted the role of marine aerosols for the radiative properties of clouds (Rosenfeld et al., 2019) and the importance of marine aerosol observations in constraining climate models (Regayre et al., 2020). Marine secondary aerosol has been of interest since Charlson et al. (1987) first proposed that dimethyl sulfide emitted by phytoplankton could influence the climate by forming aerosols. This hypothesis boosted research on atmosphere-biosphere interactions in marine environments (Quinn and Bates, 2011), and recent studies have found evidence of NPF occurring within the marine boundary layer (Zheng et al., 2021; Peltola et al., 2022). More advanced measurement techniques have also uncovered new chemical mechanisms that can form aerosols in marine environments. These mechanisms include chemical compounds such as amines (Brean et al., 2021) and ammonia (Jokinen et al., 2018) together with sulfuric acid, as well as organics (Mayer et al., 2020; Zheng et al., 2020), and iodine species (Sipilä et al., 2016; He et al., 2021). Despite these recent advances, further studies on marine NPF are still needed.
Apart from several studies from Mace Head at the Irish coast and few studies from other locations strongly influenced by tidal processes (McFiggans et al., 2004; O'Connor et al., 2008; Grose et al., 2007; Furneaux et al., 2010; Sipilä et al., 2016), most marine NPF studies have focused on open ocean (O'Dowd et al., 2010; Brean et al., 2021; Zheng et al., 2021; Peltola et al., 2022) or polar conditions (Zheng et al., 2021; Baccarini et al., 2020, 2021; Beck et al., 2021; Schmale et al., 2021), while coastal areas remain less studied. Coastal zones are of special interest due to their highly diverse habitat types and species as well as significant influence from human activities. Coastal zones are also often characterized by dynamic phenomena such as coastal upwelling and downwelling that can induce strong changes in the coastal water properties, including nutrient transport, temperature, and salinity (e.g., Lehmann and Myrberg, 2008). More complexity is added to the coastal atmosphere interactions by the heterogeneity of surface forcing, which can lead to e.g. sea and land breezes. The Baltic Sea coast is a great example of an anthropogenically influenced coastal environment, because it has been impacted by eutrophication for a long time (Andersen et al., 2017). Measurements at the Baltic Sea coast have already shown a high variability of greenhouse gas emissions both seasonally and between habitat types (Roth et al., 2022). Contrary to open oceans where CO2 fluxes are driven by temperature and concentration of dissolved inorganic carbon (Gallego et al., 2018), the carbon fluxes at the coastal Baltic Sea are dominated by biogeochemical processes and can be influenced by run-off of organic matter from land (Honkanen et al., 2024).
To fully evaluate the interactions between coastal areas and climate, it is not enough to only study greenhouse gases, but we need to also understand the role of aerosol formation in these areas since aerosols can have both cooling and warming effects on climate and these effects are highly uncertain. This relates to the concept of CarbonSink+, which accounts for both carbon sink and potential for local aerosol formation when estimating the climate impacts of various ecosystems (Kulmala et al., 2020; Ke et al., 2025). CarbonSink+ uses relatively simple calculations to evaluate the full climatic impacts of an ecosystem. This includes not only estimating the carbon uptake but also taking into account albedo changes, CO2 fertilisation, and aerosol induced diffuse radiation enhancement. The concept highlights the need to consider the aerosol forming potential of an ecosystem to be able to fully evaluate its climate impacts.
Coastal areas can be a mixing spot of aerosol precursors from the sea and land. For example de Jonge et al. (2024) have shown that having aerosol precursors both from the sea and the land can boost CCN production. Past research in the Baltic Sea has identified cyanobacterial blooms as a source of iodic acid that formed new particles (Thakur et al., 2022). This was however connected to air masses coming from the open Baltic Sea and coastal contribution could not be partitioned from the open sea contribution. Aerosol measurements in the Finnish archipelago site, Utö, located 100 km west of Tvärminne, showed that while new particle formation is observed at the site, the source of particle forming vapours seems to be either transport from boreal forest or shipping emissions whereas the Baltic Sea itself seems to be inhibiting particle formation (Hyvärinen et al., 2008). One way to study the new particle formation potential in different locations is to focus on local aerosol production, which can be studied by examining the concentrations of freshly formed 2–2.3 nm particles which must have formed close to the measurement location since they have not yet grown to larger sizes (Kulmala et al., 2024; Tuovinen et al., 2024). This is known as local intermediate ion formation (LIIF) and we use this approach also in this study.
The best way to tackle the challenges related to understanding coastal climate interactions is through multidisciplinary collaboration and long-term measurements. As a part of the Centre for Coastal Ecosystem and Climate Change Research (CoastClim, https://www.coastclim.org/, last access: 18 December 2025), we have recently established permanent atmospheric observations at the Tvärminne Zoological Station, located in a nature reserve at the southern coast of Finland, where marine measurements have been conducted for nearly a century (see e.g., Goebeler et al., 2022). This observatory conducts comprehensive atmospheric measurements spanning from greenhouse and trace gases to chemical composition of volatile organic compounds and their oxidation products to aerosols ranging in size from clusters to coarse mode. In the future the atmospheric parameters will also be connected to continuous measurements of seawater properties, enabling us to directly measure the interactions between the coastal ecosystem and climate.
In this work we show the first results from the aerosol measurements of a newly founded coastal station with a focus on understanding NPF and the effects that the coastal environment and meteorological conditions have on particle formation at this site. First, we study the NPF event frequency at the station and compare it to a boreal forest site. Then we focus on more local phenomena and study intermediate ions that have formed in the vicinity of the station. We compare the concentrations of these ions in marine and continental wind sectors to understand how the environment influences particle formation. We also study the effect of meteorological parameters and trace gas concentrations on particle and local intermediate ion formation.
2.1 Measurements
This paper is focused on aerosol and ion data measured at the Tvärminne Zoological Station, a research station founded in 1902 and located at the southern coast of Finland (TZS, Fig. 1). The station is somewhat remote since it is in a nature reserve and the nearest town, Hanko, is approximately 16 km west of the station and has a population of only around 8000 people. In 2022, we started a new atmospheric observatory at the station. The observatory for aerosol, ion, and aerosol precursor measurements consists of two trailers at the coast, less than 10 m from the sea, and one container located 160 m north-west from the trailers further inland. The observatory also includes greenhouse gas observations and flux measurements using an eddy covariance system located on a small nearby island 130 m east from the trailers (Fig. A1). The observatory is described in detail by Thakur et al. (2025).
Our analysis is focused on data from a Neutral cluster and Air Ion Spectrometer (NAIS, Airel Ltd, Mirme and Mirme, 2013), located in one of the trailers at the coast (Fig. A1). The NAIS was first installed at the station on 26 February 2022. Initially the instrument was installed near the main building of the station, 300 m north-east from the final measurement location in the trailer at the coast. There it ran until 11 April 2022 and after a short break it was installed at the final location at the coast on 1 June 2022. Here we use its measurement from 26 February 2022 to 15 June 2024. The NAIS measures the size distribution of 2.5–42 nm particles and 0.8–42 nm negative and positive ions. The total particle size distribution is measured with the NAIS in both positive and negative modes, but here we used only the negative mode. We also used NAIS data from the Hyytiälä Forest Station (see e.g., Manninen et al., 2009), located 230 km north-north-east from Tvärminne and 150 km east of the nearest sea coast (Fig. 1), for the same time period to understand how our coastal observatory compares to this well-established boreal forest station.
In addition to the NAIS data, we use gas and particle data measured in the container located further inland. These data include data from a custom-made Differential Mobility Particle Sizer (DMPS, e.g. Aalto et al., 2001) for the size distribution of 10–800 nm particles and a TSI Aerodynamic Particle Sizer 3321 (APS) for 500 nm–20 µm particles. These data were available 22 May to 29 June 2023 and 1 February to 24 June 2024. For trace gas measurements, we used a Teledyne API T-400 ozone analyser, Teledyne API T300U carbon monoxide analyser, Teledyne API T200UP NO-NO2 analyser and a Thermo Scientific 43i-TLE sulfur dioxide analyser. The gas analyser data are available starting from 22 December 2022 for SO2 and from 30 January 2022 for the other gas analysers. In this paper data until 24 June 2024 is used. Apart from the NOX analyser, which had technical issues related to on-site calibration, these were all calibrated on-site. Meteorological data were collected at the flux measurement island. Out of meteorological measurements we use wind data measured at 4.2 m height with a METEK uSonic-3 Scientific as well as ambient temperature and relative humidity measured at 4.0 m height with Vaisala HMP155 at and total irradiance measured at 3 m height with Delta-T SPN1 sunshine pyranometer. The data described here and used in this publication have been made publicly available (Peltola et al., 2025).
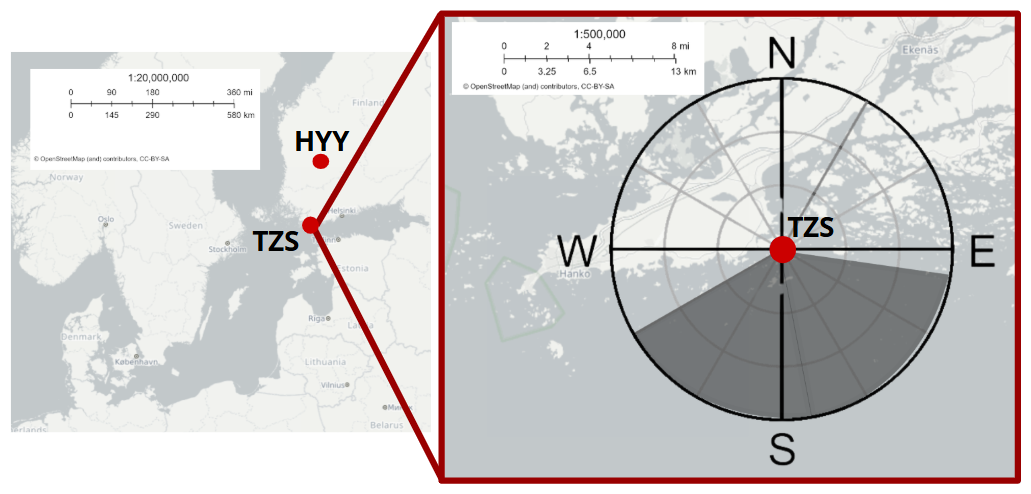
Figure 1Map of the location of Tvärminne Zoological Station (TZS) and Hyytiälä Forest Station (HYY). The grey shaded area in the zoomed-in figure indicates the marine wind sector used in this work. The maps are modified from maps prepared using European Union's Copernicus Land Monitoring Service.
2.2 Data analysis
A simple way to understand how often new particle formation events (NPFE) occur is to classify each day based on the particle size distributions observed during that day. For this we used the NPFE classification criteria described by Dal Maso et al. (2005). In this classification, each day is classified either as a clear new particle formation day (Classes I and II), a non-event day, or undefined day when it is not clear if particle formation occurs or not. Class I and II events require observing nucleation mode (<25 nm) particles and the growth of that mode. Observing this requires the meteorological conditions to be somewhat homogeneous over long distances. Because of this requirement these NPFE can also be called regional events. The difference between Classes I and II is that for Class II events, the new aerosol mode diameter or concentration is fluctuating, making it difficult to define a growth rate for the event, whereas for Class I events, growth rate determination is possible. On undefined days either nucleation mode particles are observed for more than an hour, but they do not grow in size, or there is a growing Aitken mode (25–100 nm). On non-event days, no new <25 nm particle mode lasting more than an hour nor growth in Aitken mode is found.
To determine NPFEs at Tvärminne and Hyytiälä, we used the NAIS size distribution data (total particle concentration measured with the negative polarity) from each respective site. After removing days with missing or partially missing data or instrument malfunctions, Tvärminne had 735 and Hyytiälä 714 d of NAIS data, with 655 d where both stations simultaneously had complete data.
For rest of the data analysis in this work, we averaged data from particle and gas measurements over 30 min to be able to compare variables with different time resolution. In most of the analysis we divided the data into marine and continental wind sectors. This was done based on the wind direction measured on the flux measurement island. This simple approach was chosen to get a picture of how aerosol formation is influenced by whether the air mass was last travelling over the sea or land. If the wind direction was from the sea (100–240°) the data were considered marine and if the wind direction was from the continent (<100 or >240°) the data were considered as continental (see Fig. 1). With this division, 46 % of the data were considered marine data.
Appendix Fig. A2 shows the statistical distribution of wind direction at the station during different seasons. The most notable difference between the seasons is that during the spring and summer winds from the south-west (190–230°) are more dominant than during the autumn and winter. In the autumn and winter the wind direction is more evenly distributed, but the wind speeds are higher when they are coming from the west and south-west compared to the opposite direction. Higher wind speeds in the marine sector are expected for this location during the winter season (Tammelin et al., 2013) and they are overall typical during the winter in Finland (Riuttanen et al., 2013).
The local wind direction can be influenced by e.g. sea or land breeze and wind channelling between the islands of the archipelago, but these effects cannot be separated with this data set. The wind sector division can indicate whether the air mass last travelled over land or sea, which provides insights about the effects of local phenomena in these different environments, as such phenomena occur over short time scales. Analysing trace gas data (see Appendix B) showed that carbon monoxide and sulphur dioxide had lower concentrations in the marine sector while ozone and nitrogen oxides had higher concentrations in marine air. On the other hand, the marine sector had higher concentrations of accumulation and coarse mode particles (see Results section). Even though in the marine sector the air has most recently passed over the sea, over the course of the previous days it has likely crossed over land in continental Europe and been influenced by anthropogenic sources then. The air in the continental sector, on the other hand, has recently crossed over land, but in some cases this interaction has been brief. If the air comes from the northwestern direction, it has previously travelled over the North Sea and the free tropospheric air in these air masses can be very clean. Neither of the sectors is thus completely “marine” or “continental” and the names were chosen to reflect only the most recent air mass history.
Despite being simple, the wind sector division can be especially suitable for studying local effects such as local intermediate ion formation (LIIF) at the coast. It was recently highlighted that LIIF can be studied by focusing on 2–2.3 nm negative ions since in this size range the particles have been freshly formed but have not yet grown to larger sizes, meaning that they must have originated close to the measurement location (Kulmala et al., 2024; Tuovinen et al., 2024). This means that even if the wind direction is somewhat local it should still tell if the air mass last passed over the sea or the continent. This is why we focus our analysis on 2–2.3 nm negative ions. In addition to this narrow size range that indicates local particle production, we show results for negative cluster ions (sub-2 nm), intermediate ions (2–7 nm), and larger ions (7–25 nm) that are still within the nucleation mode. Sub-2 nm ions contain large molecular ions and clusters of molecular ions (Chen et al., 2016) and their concentrations are driven by factors such as pre-existing particle population and ionisation rate (Sulo et al., 2022). Concentrations of intermediate ions, on the other hand, depend on if there are enough condensable vapours to grow sub-2 nm particles to larger sizes before they are lost by coagulation. To be observed in the 7–25 nm size range, newly formed particles typically need several hours to grow. Negative ion data from the NAIS was used to calculate all of these concentrations. Additionally, we used data from the DMPS and APS for aerosols in nucleation (10–25 nm), Aitken (25–100 nm), accumulation (100–1000 nm), and coarse mode particles (1000–20 000 nm). APS data were used for sizes starting from 600 nm and DMPS for smaller particles.
Size distribution data were used also for the calculation of condensation sink (CS). Condensation sink represents the total surface area of the particle population that acts as a sink for condensing vapours. The sink was calculated using sulfuric acid as the condensable species as described by (Kulmala et al., 2001). For this we combined data from NAIS (3–40 nm), DMPS (40–650 nm) and APS (>650 nm) to obtain the full size distribution.
3.1 Occurrence of new particle formation events
To understand how aerosol formation at a coastal site differs from a continental site, we compared new particle formation event (NPFE) frequencies in Tvärminne and the well-studied boreal forest station Hyytiälä. For this we used the Dal Maso et al. (2005) criteria described in the Sect. 2.2. Figure 2 summarises the results of NPFE classification for both stations and shows the seasonal distribution of the events. In total, Tvärminne had 9.3 % clear NPFE days (Class I 1.5 % and Class II 7.8 %) while Hyytiälä had 8.2 % clear NPFE days (Class I 1.1 % and Class II 7.1 %). For undefined days, the fraction was 23.8 % for Tvärminne and 17.3 % for Hyytiälä, leaving 66.9 % and 74.4 % of the days as non-event days for Tvärminne and Hyytiälä, respectively. As seen in Fig. 2, both stations show similar seasonal patterns with a peak in event frequencies in April and a smaller peak in the early autumn. Although the average event frequencies we report here are lower than, e.g., earlier Hyytiälä measurements (Nieminen et al., 2014) the spring and early autumn maxima were similarly observed. The lower event frequency observed here compared to previous literature can be explained by several factors: (1) they used DMPS, not NAIS data, and (2) different years can have different event frequencies, depending on meteorological conditions etc., and (3) classifying events manually can subjective. The NPF event frequency detected in Tvärminne is close to what has been reported earlier for Utö, located in the outer archipelago approximately 100 km from Tvärminne (Hyvärinen et al., 2008).
Despite the similarities in event fractions and seasonal patterns at the two stations, only 37 % of the events were observed on the same days at both stations. An inspection of air mass back trajectories calculated with HYSPLIT (Stein et al., 2015; Rolph et al., 2017) for Class I and II events observed in Tvärminne suggests that air mass history is likely to explain these differences (Appendix Fig. A3). During the clear regional NPFE days, the air masses arrived to Tvärminne primarily from north or north-west whereas on non-event days the air mass back trajectories could be from any direction. Similarly, previous results from Hyytiälä show that NPFE typically occur when air masses come from the north-northwest (280–30°) (Nieminen et al., 2014). When the air masses come from this direction, the air has typically crossed over the Norwegian Sea and the Scandinavian Mountains and it is clean compared to other directions, and this clean air favours NPF (Riuttanen et al., 2013).
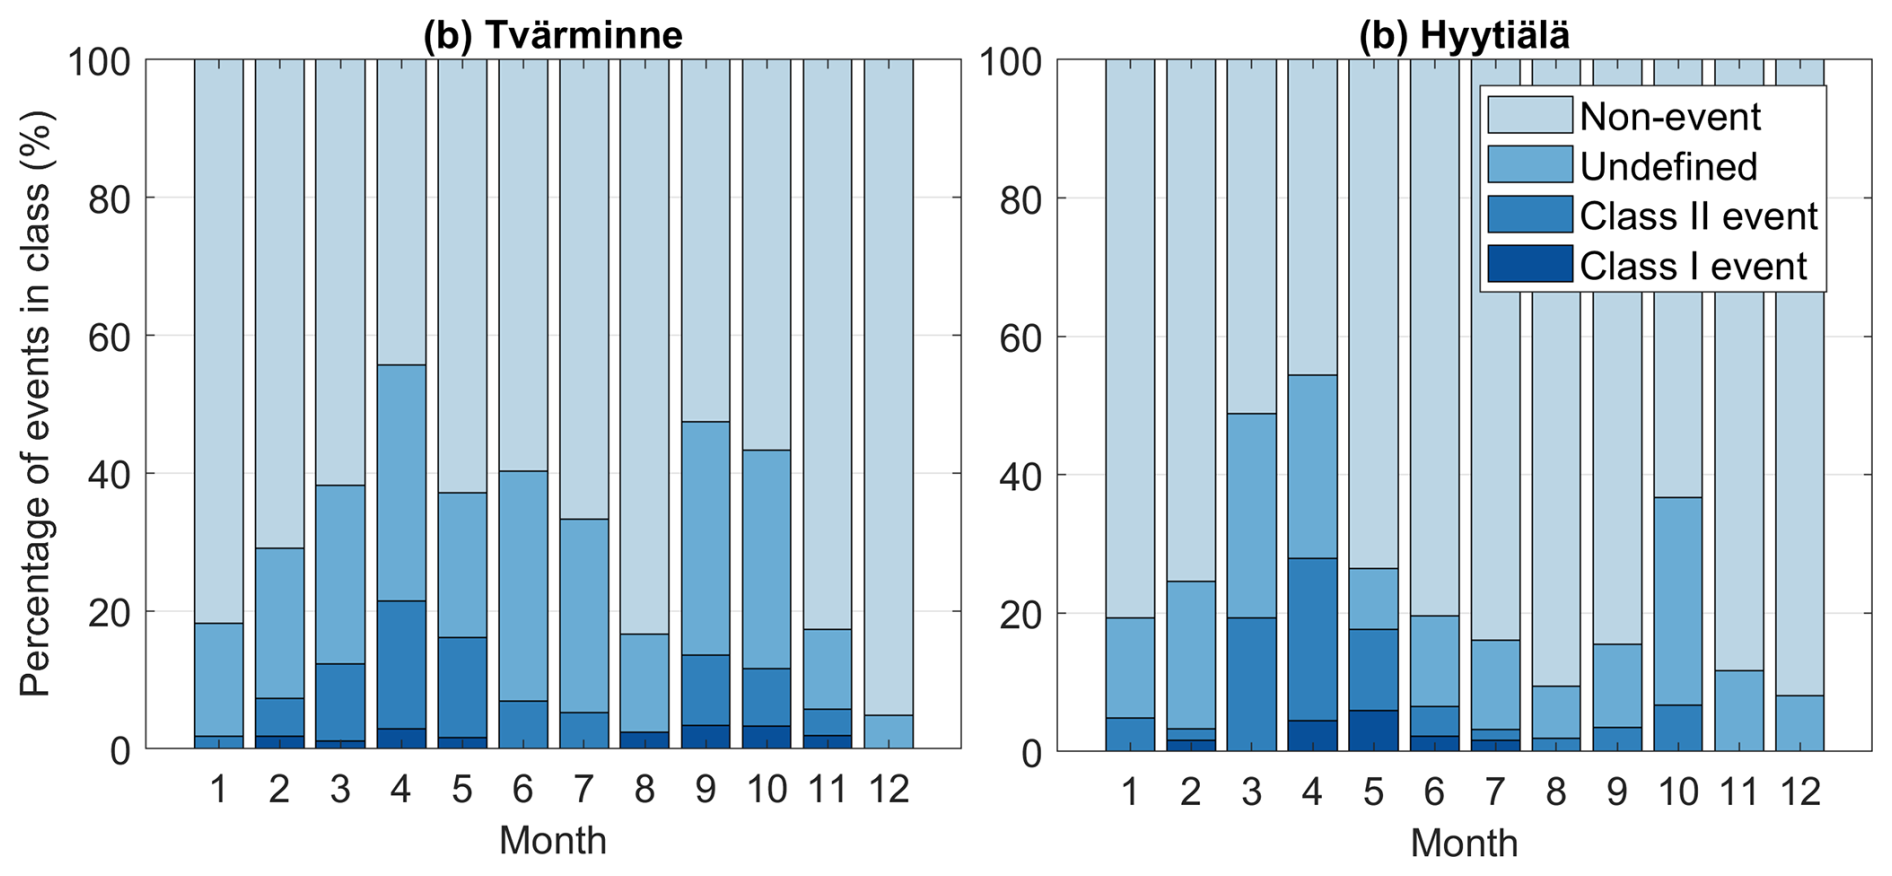
Figure 2The seasonal cycle of the contributions of different new particle formation event classes in each month for (a) Tvärminne and (b) Hyytiälä.
3.2 Effect of marine and continental air masses on ion concentrations
To better understand NPF in Tvärminne and the influence of the coastal environment on NPF processes, we explored aerosol data of different size ranges and compared aerosol concentrations from the marine and continental wind sectors. When comparing the median ion concentrations in the two wind sectors, sub-2 nm ions had 39 %, and 2–2.3 nm ions 22 % higher concentrations in continental air. For larger ions the differences were smaller, with both 2–7 and 7–25 nm ions having 12 % higher concentrations in continental air. Observing higher concentrations of <25 nm negative ions in the continental air is in line with the results that NPFE's were observed when the air mass back trajectories arrived from north-west.
Figure 3 shows the diurnal cycles of negative ions in different size ranges. For sub-2 nm ions, the continental air has higher median concentrations throughout the day. This is sensible, since over land radon can increase ion production (Chen et al., 2016) compared to marine conditions. In the continental wind sector highest sub-2 nm ion concentrations are observed during the night and early morning. This is likely due to less mixing during the night. In the marine air, no clear diurnal pattern is observed. This is reasonable as over the sea ionisation happens primarily by cosmic radiation which has no diurnal pattern. For example, Komppula et al. (2007) have estimated that while in Hyytiälä cosmic radiation accounts for 30 % of ion production, in Utö, which is located in the outer archipelago, 100 km west of Tvärminne, cosmic radiation can account for 60 %–70 % of ion production.
For 2–2.3 nm ions, the differences between the air masses are less clear, with the differences in the median concentrations in continental and marine air being statistically insignificant during 10:00–13:30 and 18:00–19:30 h (time zone used throughout the paper is UTC+2). During other times the continental air had higher concentrations. For the full range of intermediate ions (2–7 nm) the continental air has statistically significantly higher medians than the marine air all times but 12:00–13:30 h, when the concentrations are more variable and the confidence interval of the median is larger. In this size range the highest 90th percentiles are observed around or after midday which is in line with typical NPFE times.
For the larger 7–25 nm ions the differences between the wind sectors are less clear, with continental air having statistically significantly higher concentrations only during 06:00–07:30 and after 12 h. Having clearer differences in concentrations after midday is sensible considering that events happen mainly over land and in the afternoon particles produced by NPF have grown past 7 nm.
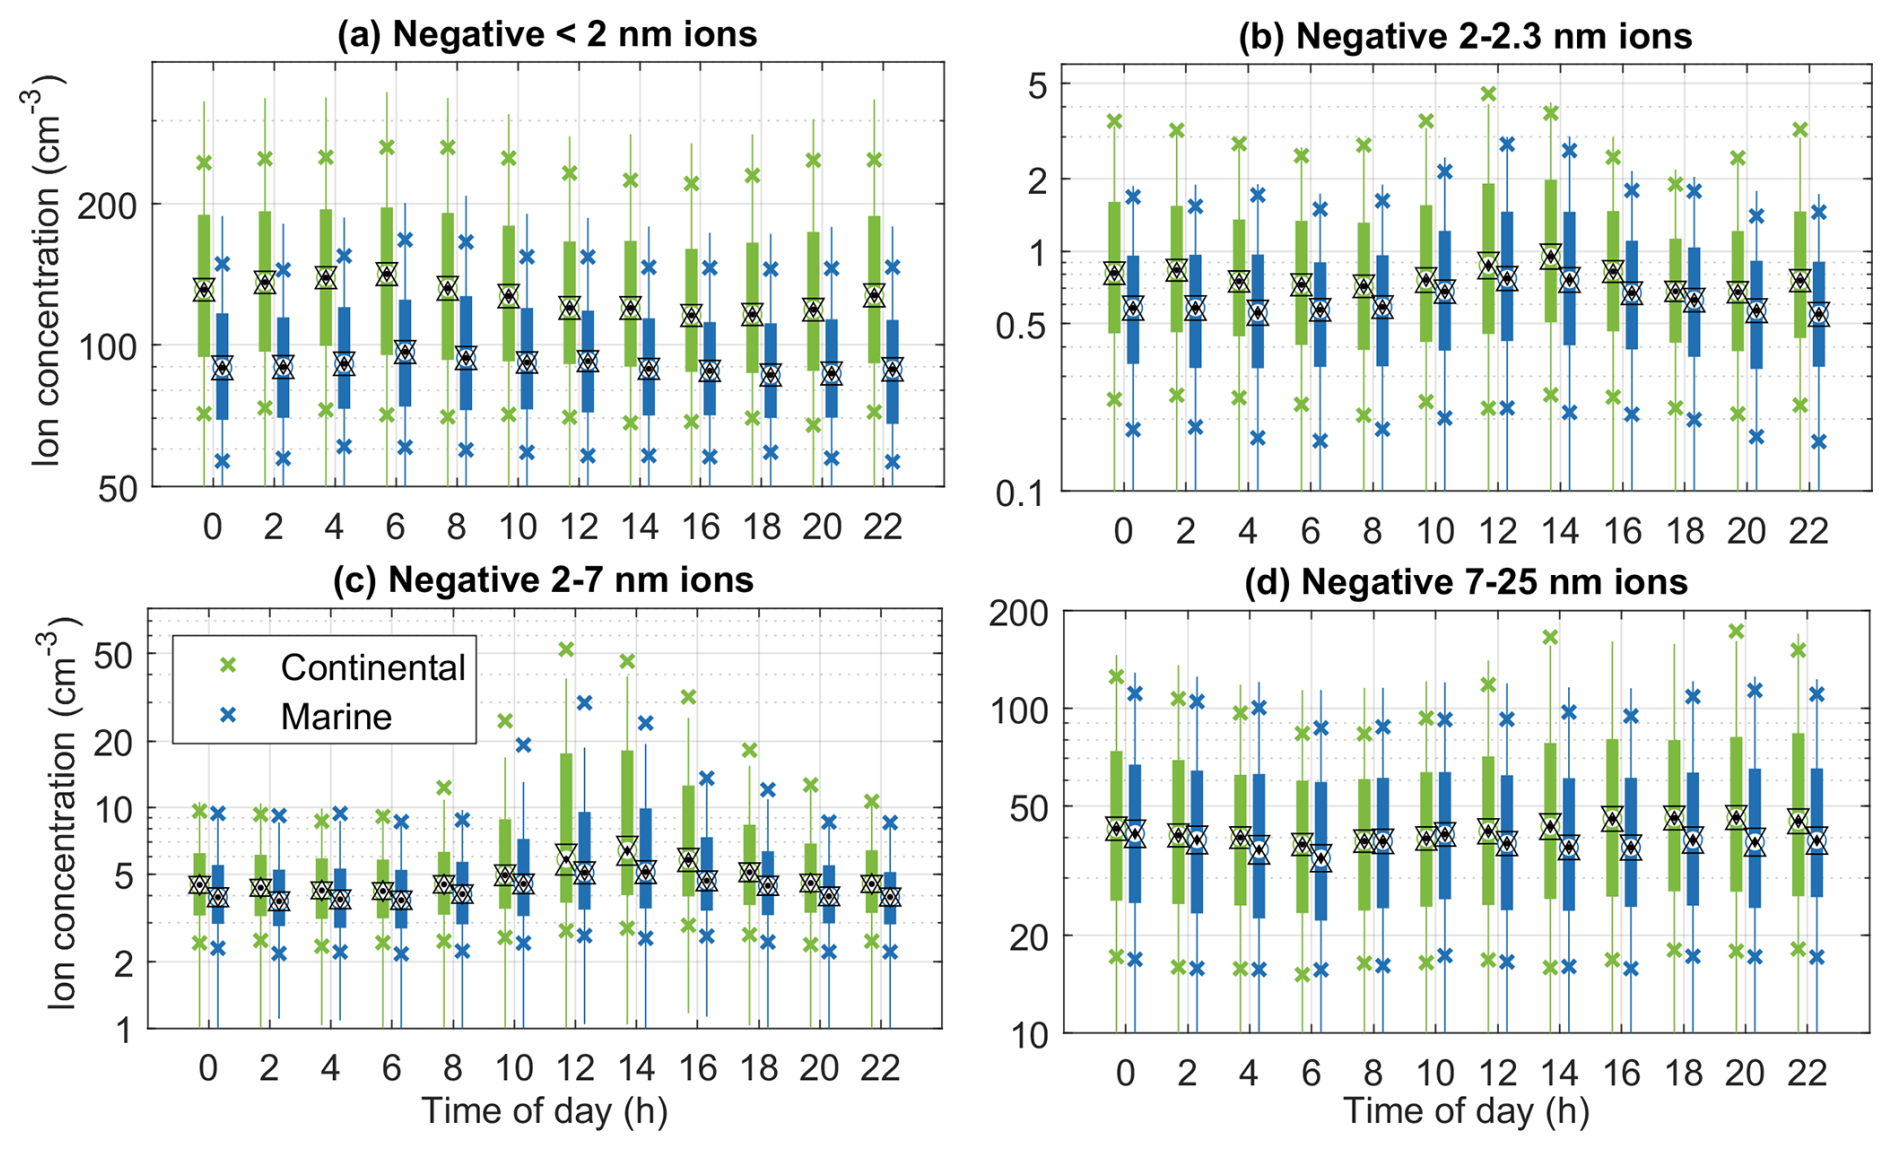
Figure 3Diurnal cycles of negative ions in different size ranges for marine and continental wind sectors. The black dots indicate the medians, the triangles indicate the confidence interval of the medians, the boxes the 25th–75th percentiles, the crosses the 10th and 90th percentiles, and the whiskers cover approximately 99.3 % of the data.
Comparing the diurnal cycles during different seasons (Appendix Figs. A4–A7) shows that the afternoon maximum in the 2–2.3 and 2–7 nm ion concentrations is more pronounced during the spring and summer compared to autumn and winter. This can also be expected, considering that there is more radiation in the summer and NPF occurrence peaked in the spring. Other clear differences between seasons include clearer diurnal cycle for sub-2 nm ions in the spring and less clear diurnal cycles and differences in air masses for all size ranges in the winter compared to other seasons. In the winter there is less NPFE's and variations in boundary layer height are smaller so these results are expected.
Figure 4 shows the seasonal cycles for ions in the same size bins as Fig. 3. The seasonal cycles are weak and vary between size ranges. For sub-2 nm ions the highest concentrations are observed in both wind sectors in the autumn (Fig. 4a) with continental concentrations higher throughout the seasons. The seasonal cycle is somewhat similar to that observed by Sulo et al. (2022) for Hyytiälä, with maximum cluster ion concentrations in the autumn.
The intermediate ion size ranges (2–2.3 and 2–7 nm) have weak seasonal cycles with higher concentrations from late spring until early autumn compared to the rest of the year. Somewhat similar seasonal trends can be observed for the larger 7–25 nm ions. These trends are similar to the seasonal cycle that was observed for NPFE's.
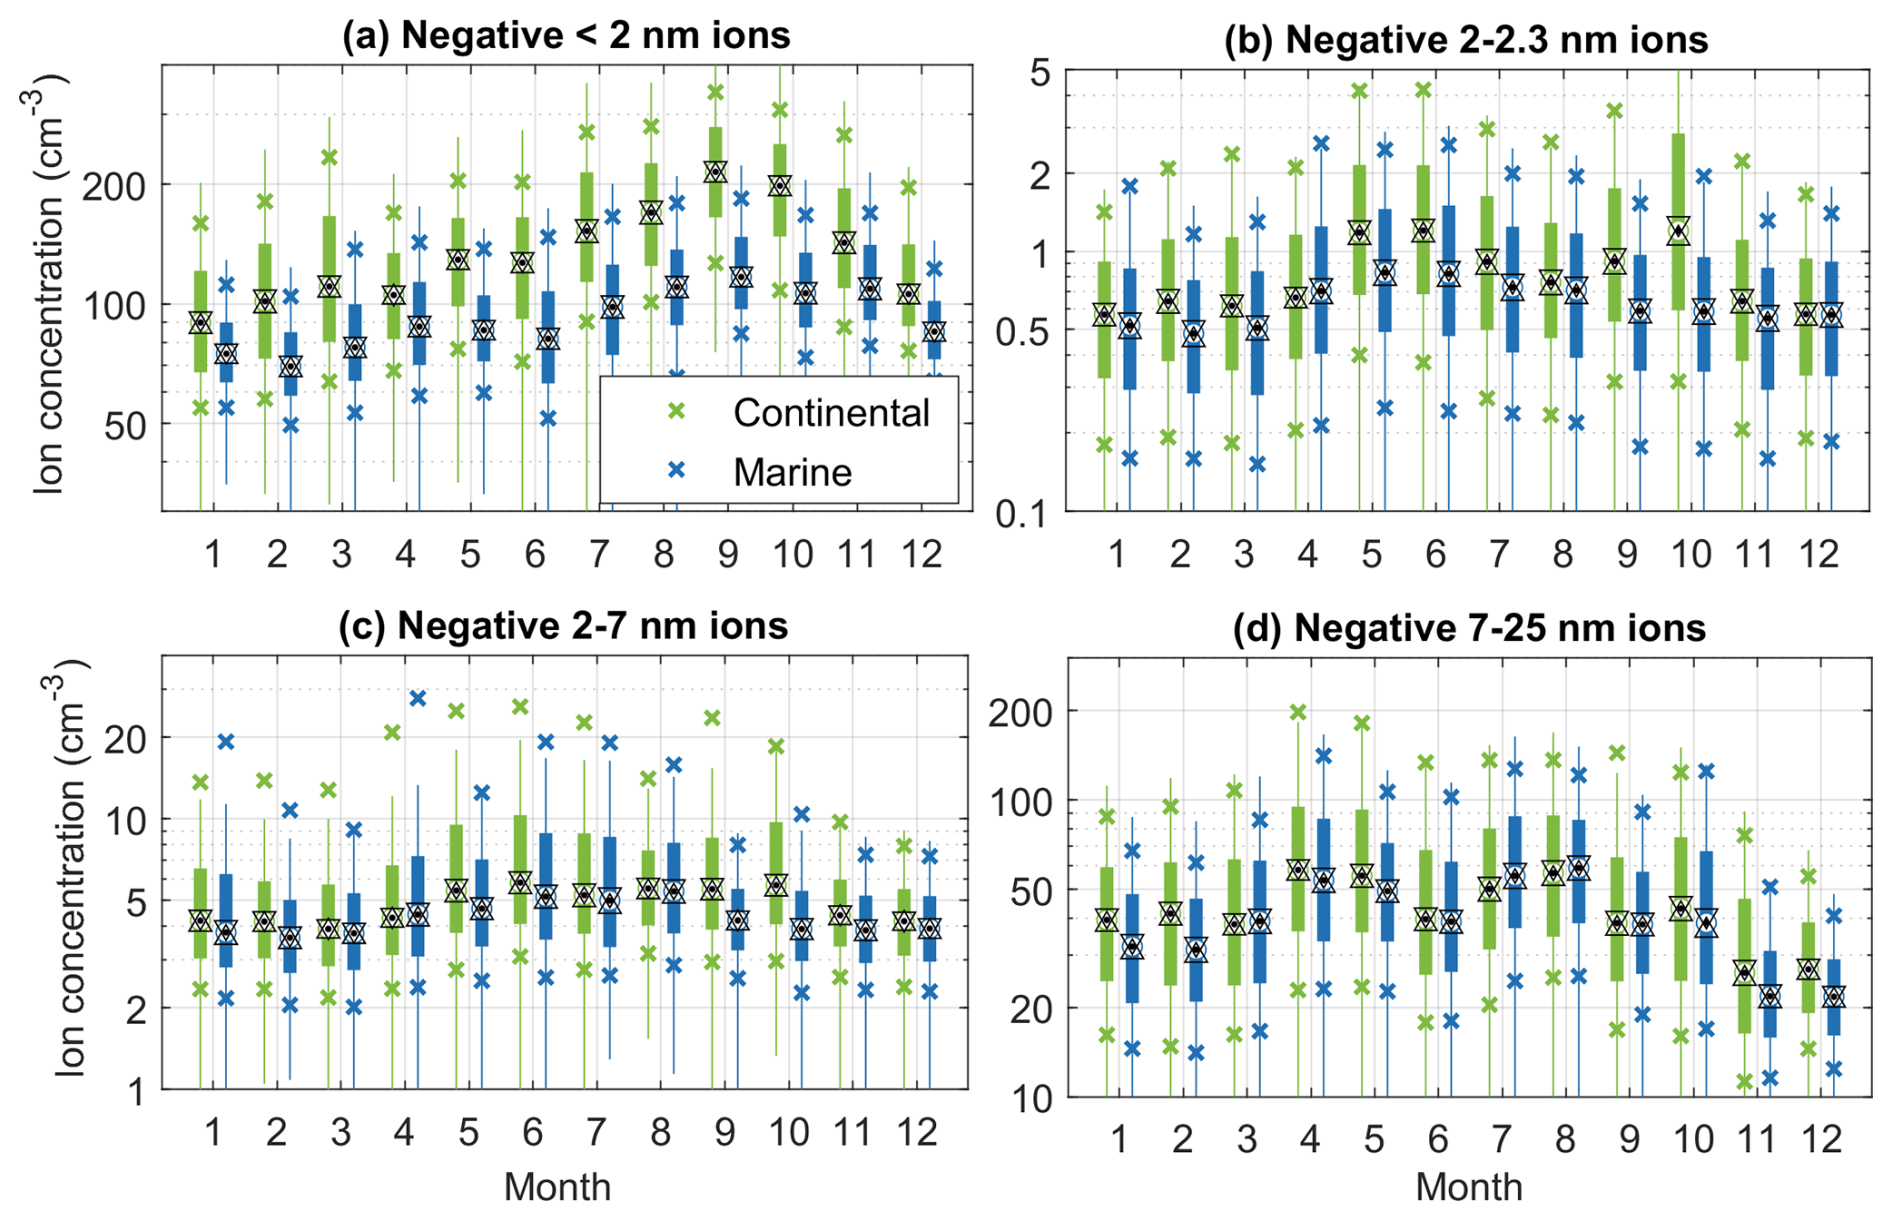
Figure 4Seasonal cycles of ions in different size ranges for marine and continental wind sectors. The black dots indicate the medians, the triangles indicate the confidence interval of the medians, the boxes the 25th–75th percentiles, the crosses the 10th and 90th percentiles, and the whiskers cover approximately 99.3 % of the data.
Overall, these results show that more locally and regionally produced particles are observed when the wind direction is from the continent. The particle production is most intense during the day and in the spring and autumn. In the next sections we explore the effects of environmental conditions such as pre-existing particle population and meteorological parameters on NPF.
3.3 Effect of environmental conditions on particle formation
In this section we study the effects of condensation sink, meteorological parameters and trace gases on new particle formation observed in Tvärminne.
3.3.1 Effect of pre-existing particle population
Since particle formation depends on the relative strength of sources and sinks, we first explore the general shape of the particle size distribution in the two wind sectors, as well as the effect of condensation sink (CS). The size distribution can reveal us differences in how much new particles are formed and how far from the site this occurs. As condensation sink is dependent on the total surface area of the particles and the surface area is proportional to the square of particle diameter, size distribution data can also reveal information on the condensation sink. Figure 5 shows the average size distribution from all the particle instruments when DMPS data were available (22 May to 29 June 2023 and 2 January to 24 June 2024). From this figure and Appendix Fig. A8, we can see that the number concentrations of negative ions and particles are higher in the continental wind sector in size ranges up to 30–40 nm. This is likely explained by NPF over the continent. From approximately 40 to 5000 nm marine air has slightly higher concentrations than continental air. The reason for this could be related to more long-range transported particles or sea spray in air masses coming from the marine sector.
One notable aspect in Fig. 5 is that the particle concentrations measured with NAIS are higher than those measured with the DMPS. This is expected since NAIS is known to show higher particle concentrations compared to DMPS systems (Kangasluoma et al., 2020). This discrepancy does not influence interpretation of the results in this analysis.
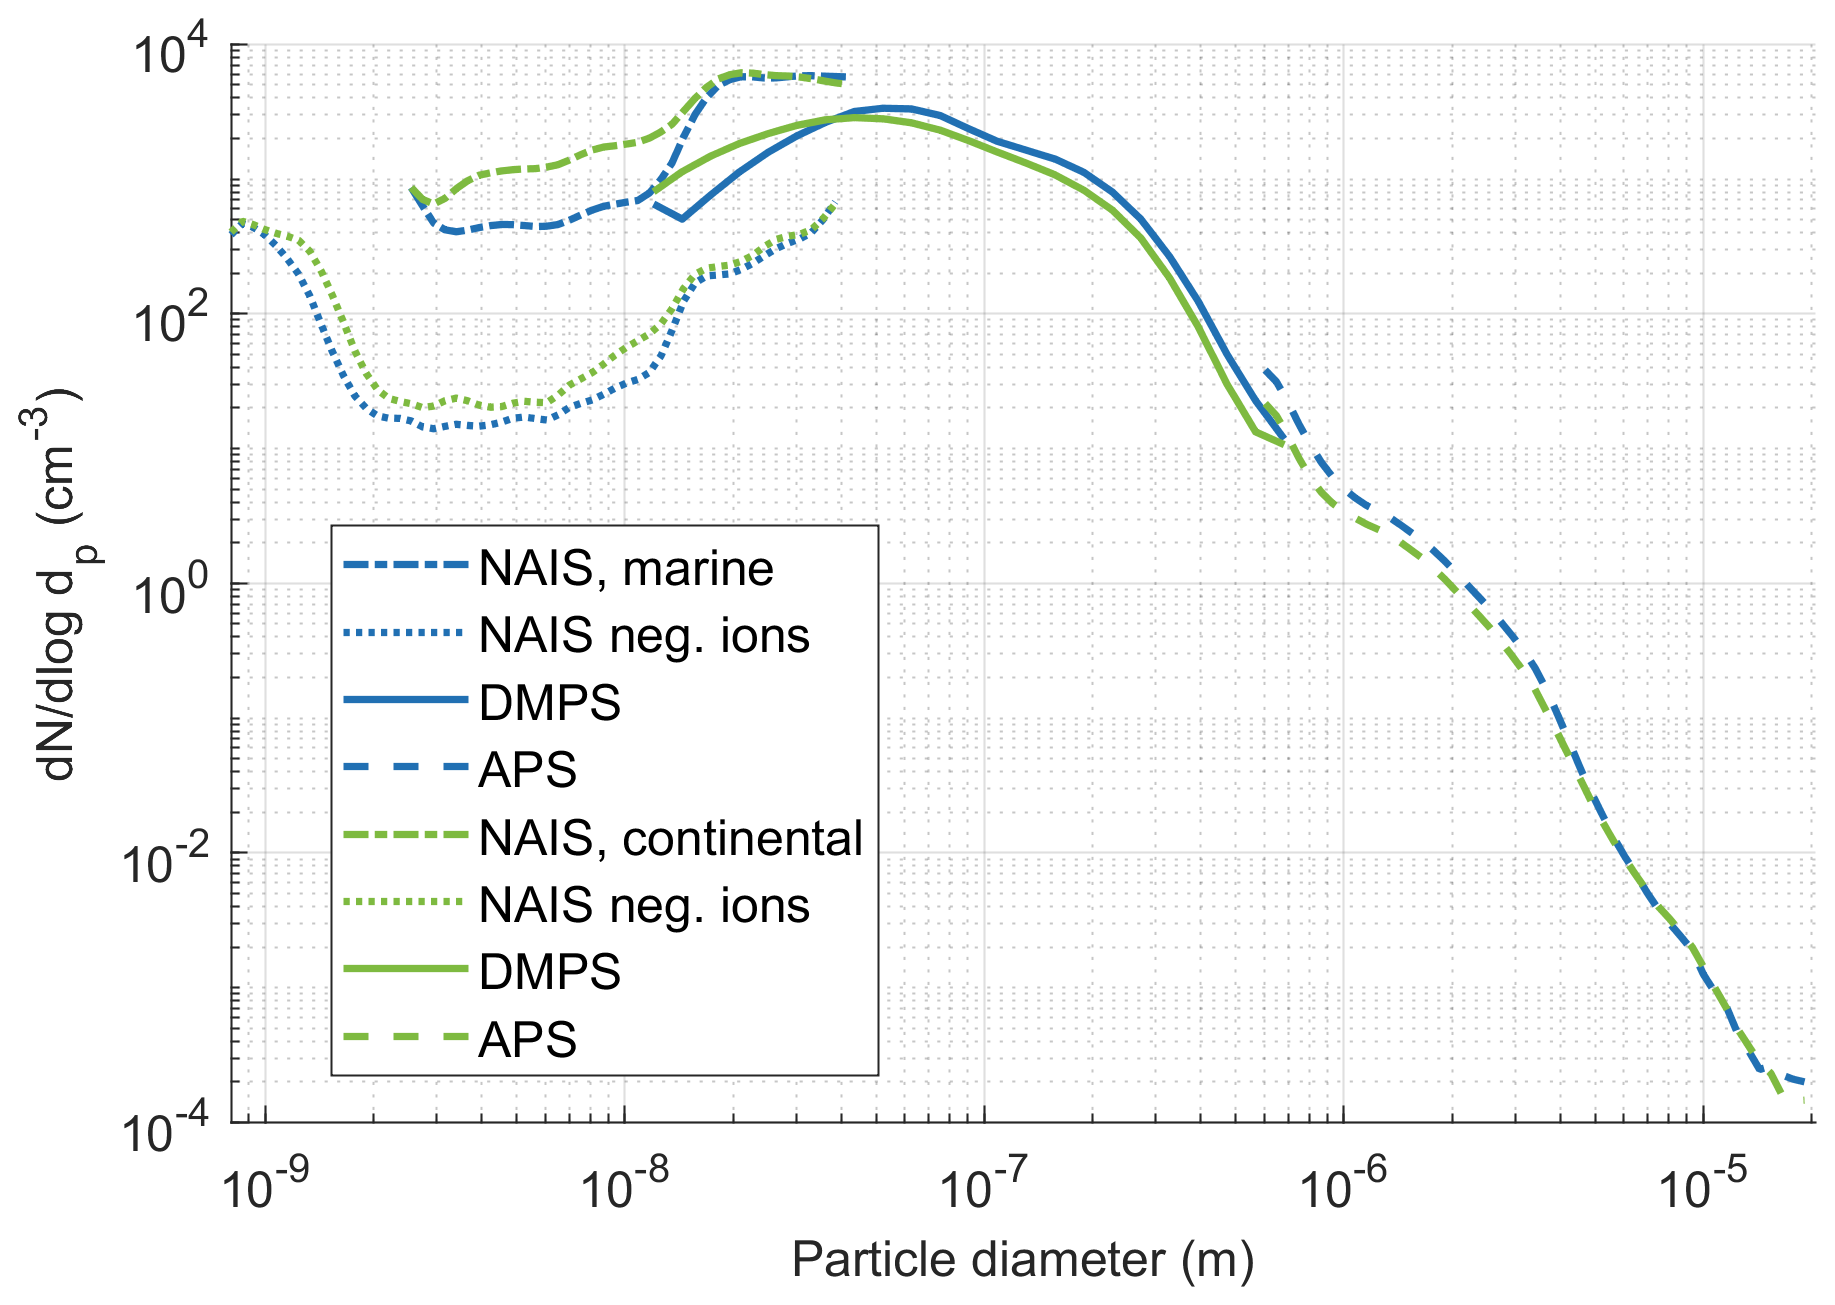
Figure 5Average size distribution from all instruments when DMPS data is available (22 May to 29 June 2023 and 1 February to 24 June 2024). All blue lines are for the marine wind sector and all the green lines for the continental wind sectors whereas the different line styles are for different instruments as indicated by the legend.
Figure 6 illustrates the diurnal cycles of particle concentrations measured with the DMPS and APS in nucleation (10–25 nm), Aitken (25–100 nm), accumulation (100–1000 nm), and coarse (1000–20 000 nm) modes. The differences seen between the wind sectors in different size ranges are in line with the previous results. In the nucleation mode the continental air has clearly higher concentrations than marine air during the day (08:00–17:30 h), like the negative ions.
In Aitken mode continental air has lower concentrations than marine air around midday (10:00–13:30 h) while rest of the day the differences are statistically insignificant. A similar but stronger pattern is seen for accumulation mode particles, which have lower concentrations in continental air for most of the day with the differences being clearest around midday. These lower concentrations in the continental wind sector are likely related to clean air masses coming from the north-west and are one of the main reasons why particle formation is being favoured in this wind sector. This effect is the most pronounced during the day, when the mixed layer height increases and clean air from the free troposphere dilutes aerosol concentrations in the mixed layer. The increase in the mixed layer height has been shown to favor NPF (e.g., Wu et al., 2021) and may explain why we see the highest nucleation mode particle concentrations around the same time. Having higher accumulation mode concentrations in the marine wind sector is also in line with work by Engler et al. (2007) whose source analysis for the Finnish archipelago site Utö showed central to northeast Europe and Great Britain as source areas of higher concentrations of accumulation mode particles.
As can be expected in a location far from major pollution sources, coarse mode particle concentrations were low. For example, previous work at the Hyytiälä Forest Station, also away from major anthropogenic sources, has observed a 1.2 cm−3 mean number concentration of coarse mode particles (Aalto et al., 2001), while here the hourly medians of coarse mode concentrations were below 1 cm−3 in both wind sectors. During the day the two wind sectors had similar concentrations whereas during the night the marine sector had higher concentrations.
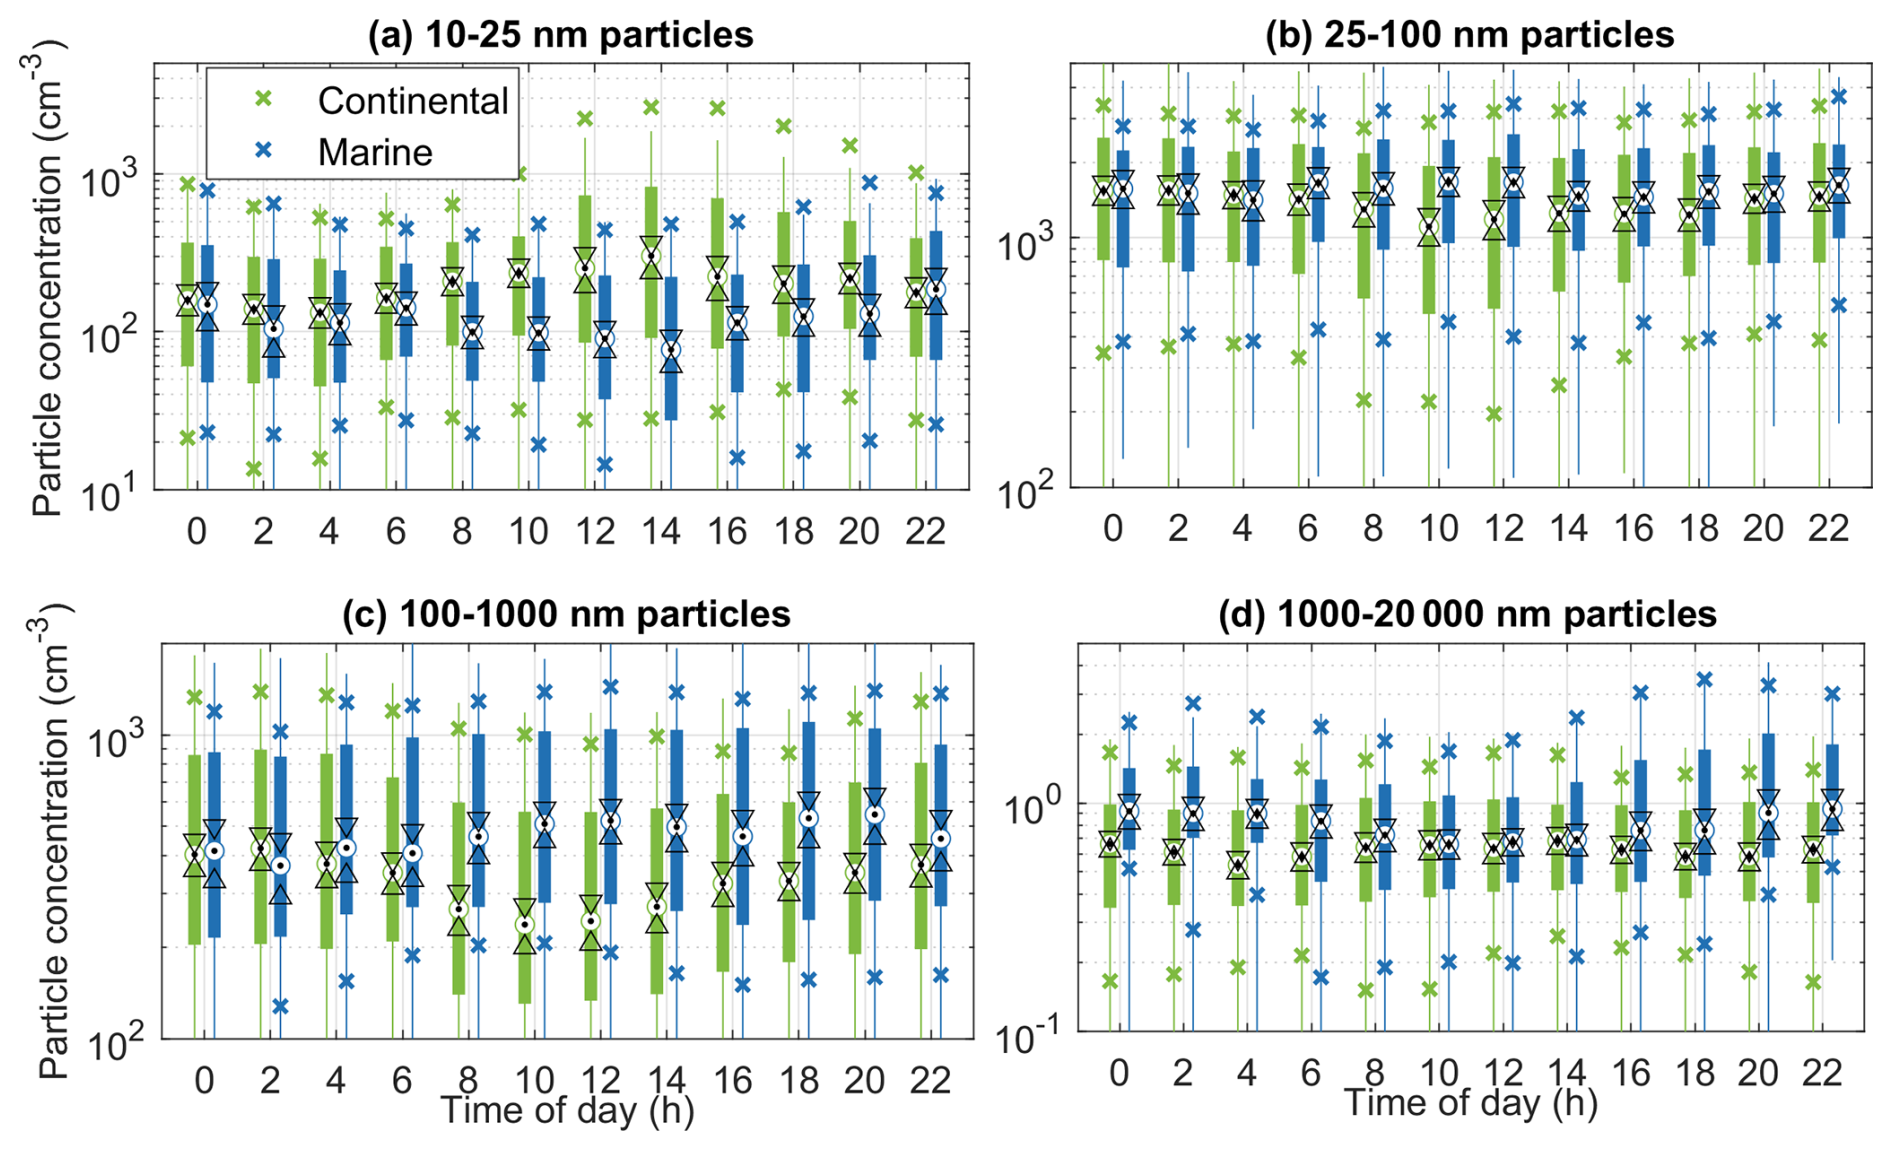
Figure 6Diurnal cycles of 10–20 000 nm particles in different size ranges for coastal and continental air. The black dots indicate the medians, the triangles indicate the confidence interval of the medians, the boxes the 25th–75th percentiles, the crosses the 10th and 90th percentiles, and the whiskers cover approximately 99.3 % of the data.
Figure 7 shows the diurnal cycle for the calculated condensation sink. Condensation sink was unsurprisingly higher in marine air (particularly between 06:00 and 20:00 h) because (1) condensation sink depends on total particle surface area, (2) total aerosol surface area is dominated by the accumulation mode (having both high number and large size), (3) marine air had higher concentrations of accumulation mode particles (Fig. 6c), and (4) we have already seen that there were fewer NPFE with marine air which means that condensation sink should be higher. The median CS for the period when data from all particle instruments was available is s−1 and the ratio of median CS in marine wind sector divided by median of CS in continental wind sector is 1.34. The difference in condensation sink between the two air masses is clear during the day (08:00–17:30 h), which is likely due to boundary layer dynamics, i.e. increase in boundary layer height during the day diluting particle concentrations in the continental wind sector. Over land, the boundary layer height varies over the day more than over the sea, and as explained earlier, the free troposphere air that gets mixed to the continental boundary layer is likely very clean when the air masses come from the north west. In the marine sector, even if the boundary layer height varies, the air that gets mixed lower is not necessarily cleaner as it has potentially travelled over continental Europe some days earlier.
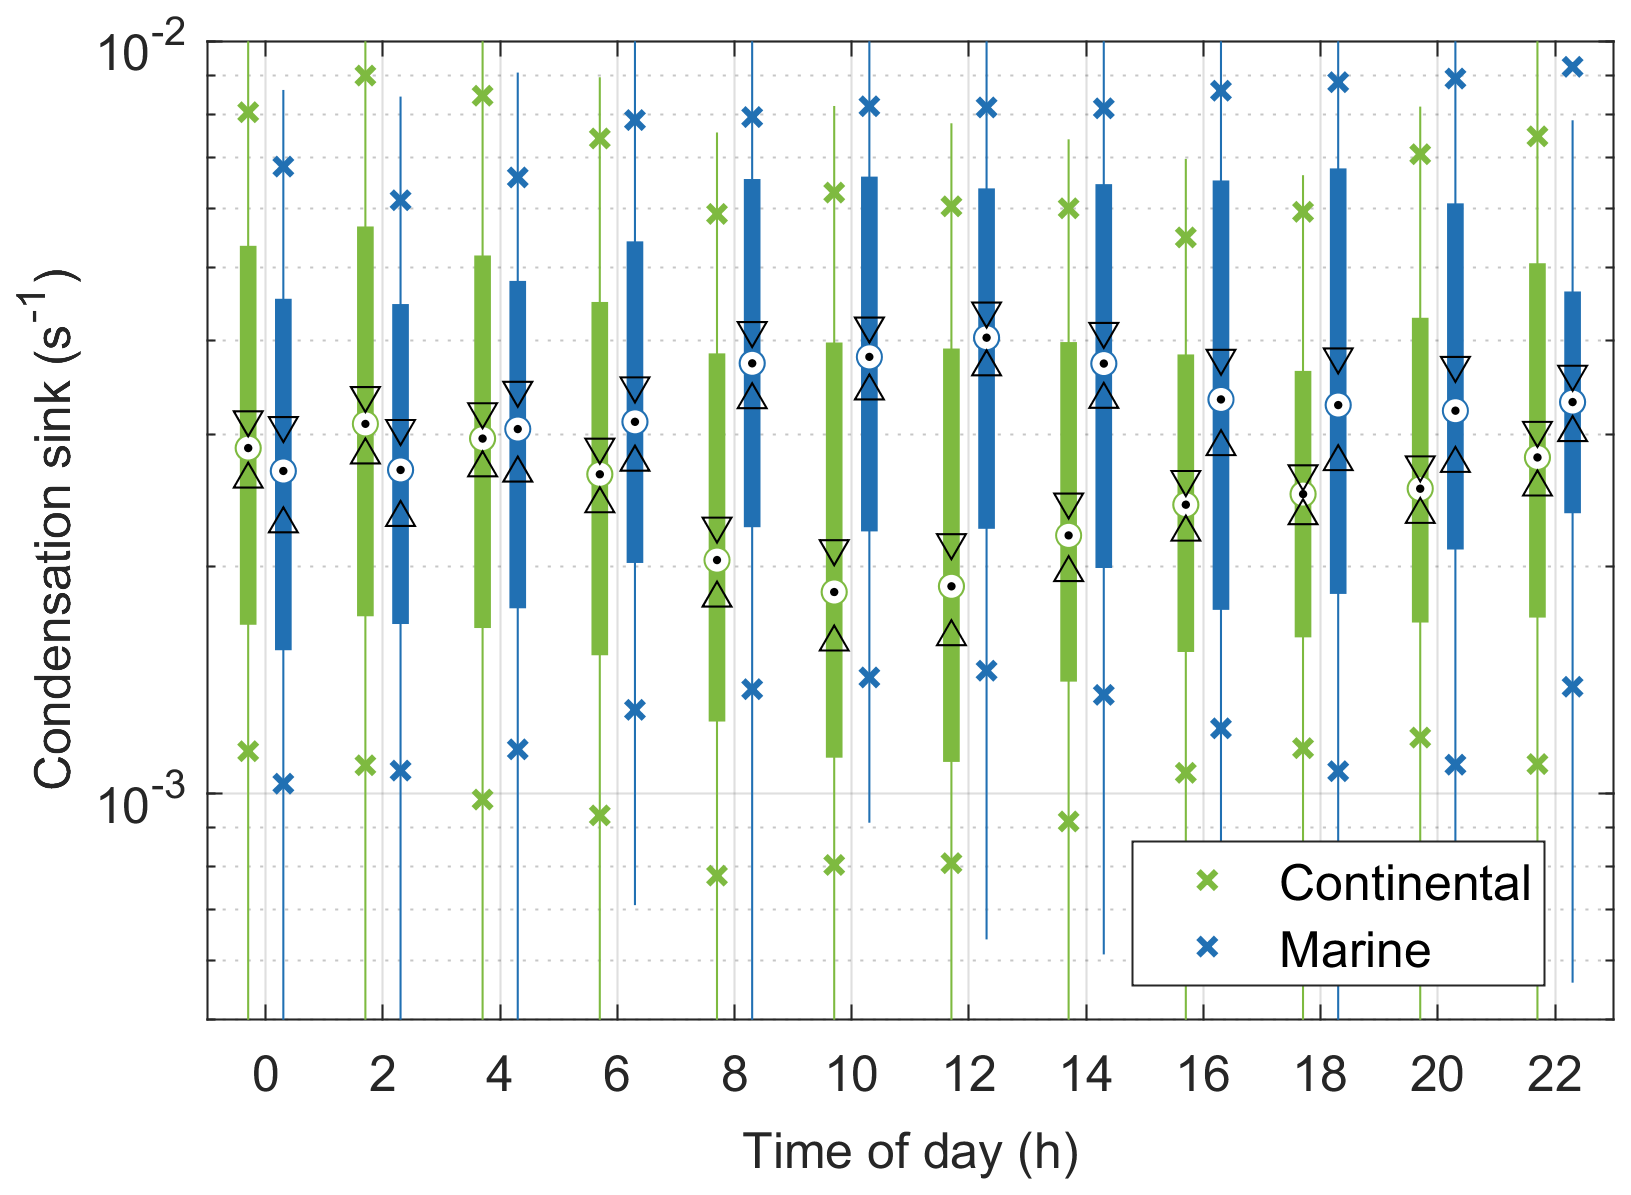
Figure 7The diurnal cycle of condensation sink when data from all particle instruments is available (22 May–29 June 2023 and 2 January–24 June 2024). The black dots indicate the medians, the triangles indicate the confidence interval of the medians, the boxes the 25th–75th percentiles, the crosses the 10th and 90th percentiles, and the whiskers cover approximately 99.3 % of the data.
Since DMPS and APS data were available only for part of the time, we calculated the diurnal cycle for NAIS data for this time period separately (Fig. A9). The diurnal cycles and wind sector differences of ions during this time period are similar to those observed for the whole data set in Fig. 3. The differences in median intermediate ion concentrations between the two wind sectors during this period are smaller than the differences in condensation sink during daytime. Condensation sink is thus one of the key players in particle formation at this location, but not the only factor.
These results support previous research for Hyytiälä that has shown that NPFE's are favoured when clean air masses come from the north-western wind sector having crossed the Norwegian Sea and Scandinavian Mountains and later land over Finland (Riuttanen et al., 2013). The results also show that one of the factors favouring NPF during the day in the continental sector is the reduction in CS related to boundary layer dynamics.
3.3.2 Influence of meteorology and trace gases
To better understand the phenomena influencing particle formation at the observatory, we studied the effect of local meteorological conditions and trace gas levels on particle formation. Here, we focus first on the 2–2.3 nm negative ions and meteorological conditions. The general behaviour of trace gases is described in Appendix Sect. B in order to keep the focus of the main text on aerosols.
Figure 8 shows the average 2–2.3 nm ion concentration (representing local intermediate ion formation) binned with mean wind direction, together with wind speed, total incident radiation and relative humidity. All the plots show that there are more ions when the wind direction is from the north-west (240–360°) as we already showed that NPF is most likely to occur in air masses from this direction (Fig. A3). There are also more ions when wind speeds are high, total incident radiation is high and relative humidity is low. Since sunny conditions favour photochemistry and drive NPF, and relative humidity is often anti-correlated with radiation due to potential cloudy or rainy conditions, we see an anti-correlation of relative humidity with 2–2.3 nm ion concentrations. These results are in line with previous work done at Hyytiälä (e.g., Hamed et al., 2011; Dada et al., 2018) and other boreal forest sites (Garmash et al., 2024).
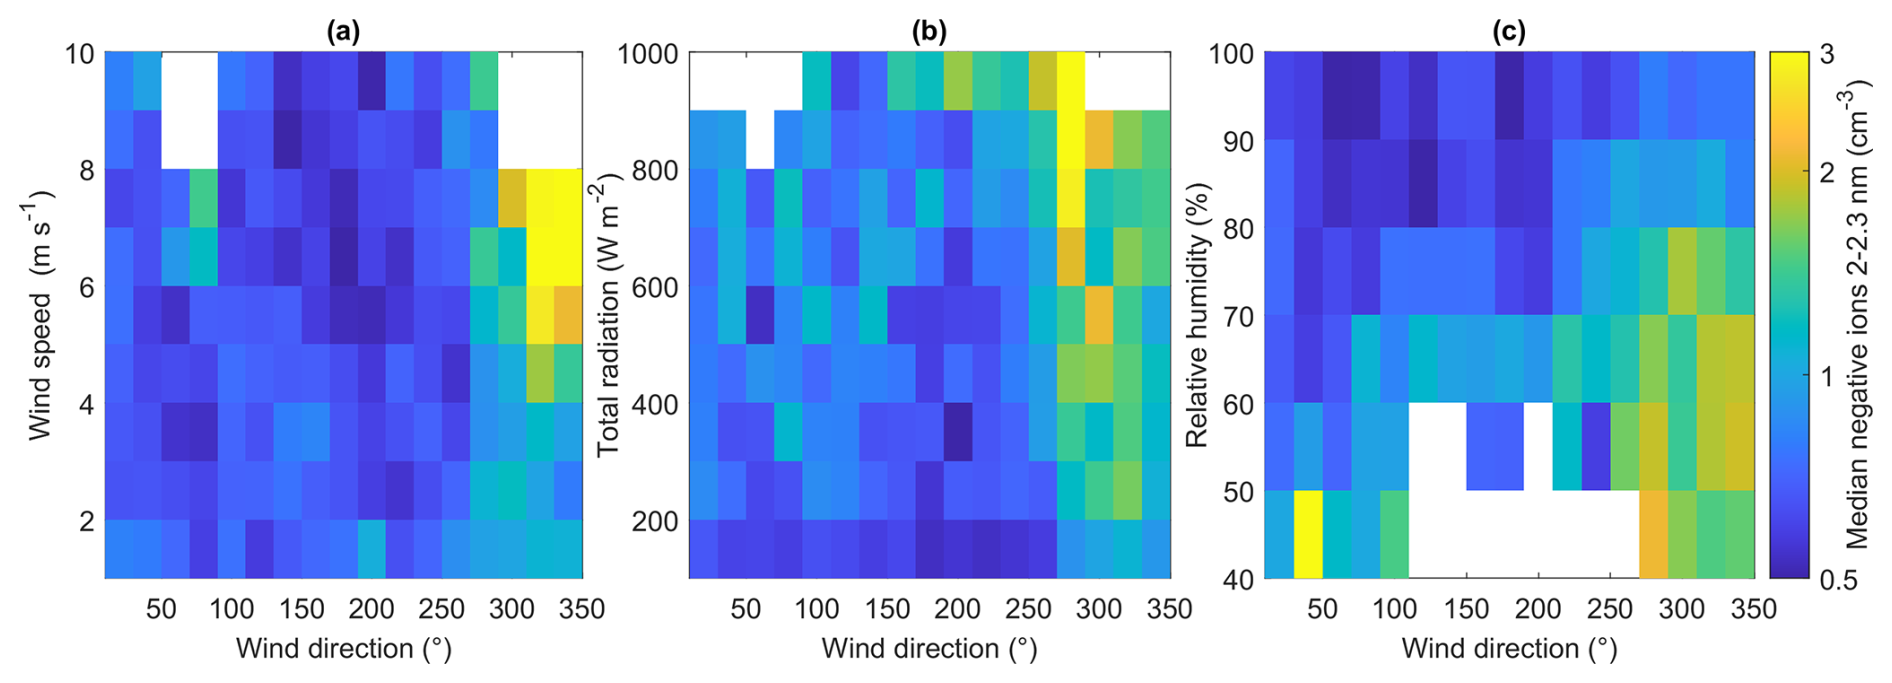
Figure 8This figure illustrates how the 2–2.3 nm negative ion concentrations vary as a function of wind direction and other meteorological variables by plotting the median ion concentration in a given wind direction and (a) wind speed, (b) total radiation and (c) relative humidity bins. The colour of each square shows the median concentration of 2–2.3 nm negative ions in that wind direction and (a) wind speed, (b) total radiation and (c) relative humidity range.
As noted in the previous section, the condensation sink can be one of the factors explaining higher 2–2.3 nm negative ion concentrations in continental air compared to marine air. Figure A10 shows the average condensation sink in wind direction and wind speed bins. It indicates that the condensation sink is at its highest when wind speed is low (below 5 m s−1) and the wind direction from south-east. The lowest sink values are observed when wind speed is above 4 m s−1 and from north-west. This is largely opposite to what was seen for the 2–2.3 nm ions, indicating again that low condensation sink favours the formation of 2–2.3 nm ions.
To further study the relationship of 2–2.3 nm negative ions and different variables, Fig. 9 shows the correlations of 2–2.3 nm ions with air temperature, total radiation, relative humidity, and ozone separately for the marine and continental wind sectors. The correlations are overall weak, but have similar directions in both of the wind sectors. Positive correlations are observed with temperature, total incident radiation, and ozone, whereas relative humidity has a negative correlation with ion concentrations as we saw in Fig. 8. Positive correlations with radiation and temperature are in line with Fig. 8. Ozone can act as an oxidiser of VOCs and thus influence NPF, but it is also produced by radiation, so it is difficult to to distinguish its role from that of photochemistry.
We also analysed these results limiting the data to only summer daytime data (Appendix Fig. A11) to limit the effect of different seasons and time of day since different processes can influence ion formation in different seasons. With this filter, the 2–2.3 nm ions and temperature are negatively correlated. This could be related to warmer air masses being more aged and thus having higher condensation sink that limits the production of new particles (see e.g. air mass analysis done for Hyytiälä by Räty et al., 2023). Another reason for this could be lower volatilities of particle precursor vapours in colder air, which could favour condensation under these conditions (e.g., Stolzenburg et al., 2018).
With radiation, 2–2.3 nm ions in the continental wind sector still had a positive correlation, but in marine air there was no significant correlation (p>0.05). The correlations with relative humidity remained negative and were slightly stronger in both wind sectors with the filtered data compared to the whole data set. With ozone there were no statistically significant correlations in either of the wind sectors.
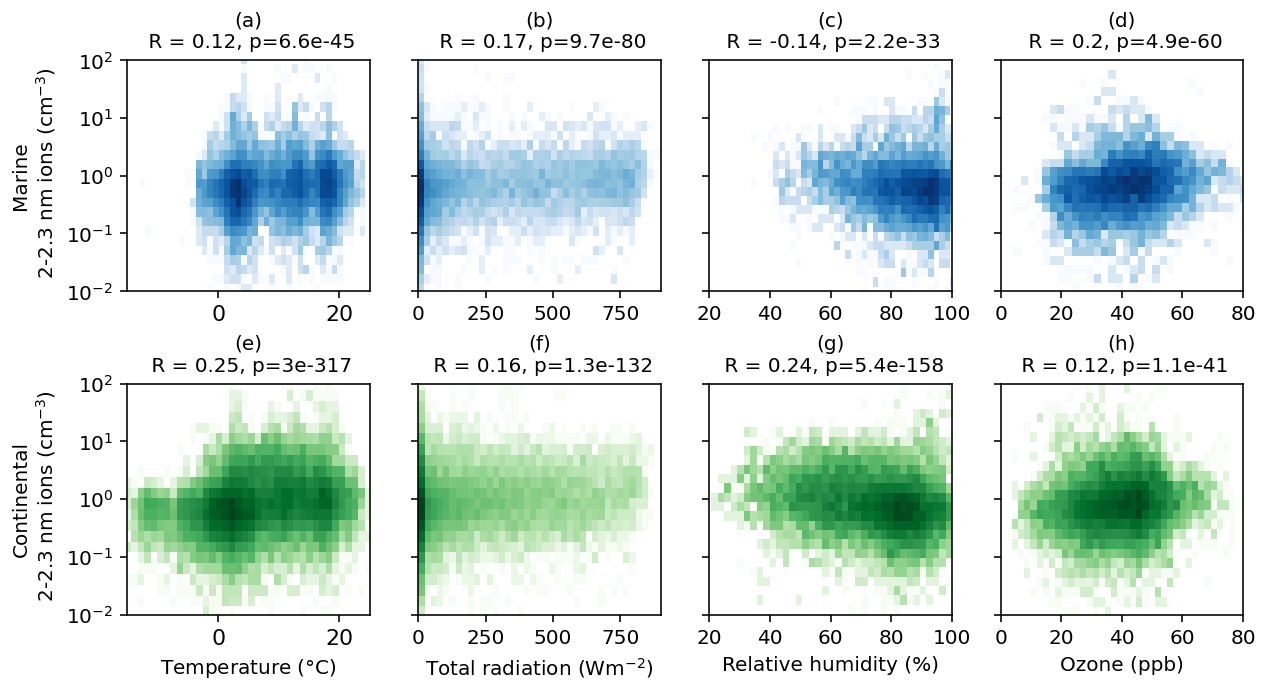
Figure 9Concentration of 2–2.3 nm ions as a function of temperature (a, e), total radiation (b, f), relative humidity (c, g), and ozone (d, h) in marine (blue, upper panels) and continental (green, lower panels) wind sectors. The transparency of the colour indicates the relative number of data points with more data where the colour is dark.
To further understand the data, correlation coefficients were calculated for ions in different size ranges (<2, 2–2.3, 2–7, 7–25 nm), meteorological conditions (wind speed, temperature, radiation, relative humidity), and trace gases (CO, O3, SO2, NOX). This was done separately for the whole data set (Fig. A12), only for marine air (Fig. A13), only for continental air (Fig. A14), and only for summer (June–August) day-time (10–15 h) data (Fig. A15).
For the whole data set (Fig. A12), the observed correlations are primarily weak. Apart from sub-2 nm and 7–25 nm ions which correlate very weakly negatively with each other (), the ions in different size ranges have positive correlations with each other which is sensible since for example 2–2.3 nm is a subset of 2–7 nm ions and if these ions grow larger they can reach the 7–25 nm size range. All the size ranges have weak positive correlations with temperature and radiation and negative correlations with RH. This is in line with the previously presented results.
Focusing on the relationship of ions and trace gases, ions in sub-7 nm size ranges have negative correlations with NOX, which is reasonable since the NOX has higher concentrations in the marine air and marine CS was higher, suppressing NPF. The larger 7–25 nm ions have weak positive correlations with all the trace gases but CO. The 7–25 nm ions represent more aged particles that have sources further away from the station and they can have sources over land just like the trace gases. Ozone has weak positive correlations also with the ions in the intermediate ion classes (2–2.3 and 2–7 nm). This was already seen in the scatter plots of 2–2.3 nm ions and ozone. Here we can see that ozone has even stronger correlations with temperature and radiation and as ozone itself is formed through photochemistry, the positive correlation with ozone and ions can also just be explained with both ozone and particles being formed in warm sunny conditions.
If the data set is limited to only marine (Fig. A13) or only continental (Fig. A14) wind sectors, the trends are largely similar to what was seen with the whole data set. When looking at only daytime data (Fig. A15), the correlations with temperature, radiation, and ozone get stronger, but the trends are still similar. If the data are limited to only summertime and day data (Fig. A16), some of the correlations between particles and temperature or radiation turn weakly negative and positive correlations between ozone and particles are no longer observed. This would support the assumption that the previously observed correlation between the ions and ozone was caused by the fact that they are both produced in warm and sunny conditions. This is also in line with the results shown earlier for the 2–2.3 nm ions that indicated that particle formation is not favoured by higher temperatures but just more likely to occur during the day when photochemistry plays a role and temperatures are in general higher.
To summarise, particle formation in Tvärminne is favoured by high total incident radiation and low relative humidity. The trace gas analysis suggested that higher levels of most trace gases are related to higher condensation sink that inhibited particle formation. Ozone was an exception to this since both ozone and particles are typically formed in sunny conditions.
Here we reported the first results of new particle formation and aerosol physical properties at a new coastal atmospheric observatory in Tvärminne, Southern Finland. We showed that new particle formation events (NPFE) occur at the coast approximately as often as at the boreal forest station Hyytiälä, located 230 km north-north-east of Tvärminne. These regional NPFE occurred when air masses arrived from the north-west and crossed over land. Northwestern air masses have also been connected to regional NPFE before in Hyytiälä as these air masses are typically clean and have low concentrations of pre-existing particles that could inhibit NPF.
Further analysis focused on understanding the local effects of the coast and for this we compared two wind sectors, one where the winds were coming from the sea and another where the winds were coming from the continent. The results of this analysis were in line with the NPFE analysis and showed the concentrations of ions and particles in nucleation mode size ranges (2–25 nm) were higher when the winds were from the continent, particularly from the north-west. Studying local intermediate ion formation (LIIF) showed that in the near vicinity of the measurement site, more particles were formed over the continent than over the sea.
One factor favouring NPF in the continental wind sector was the clean air likely transported from the Norwegian Sea. This led to lower condensation sink in the continental wind sector especially during the day when clean air was likely mixed down from the free troposphere and that favoured the occurrence of NPFE. Overall, NPF was favoured by high radiation levels and low relative humidity which is in line with previous research from other stations. These correlations were however low, so more research is needed to better understand the driving factors of NPF at the station.
Overall, our results are well in line with previous research from the thoroughly investigated Hyytiälä boreal forest site. Although clear differences were seen between the continental and marine wind sectors, more research is needed to distinguish how potential coastal sources can influence aerosol formation processes at the Baltic Sea coast and further downwind away from the coast. This will require not only deeper understanding of the local meteorology and coastal oceanographical processes, but also information about the chemical composition of aerosols and their precursors. The new coastal atmospheric observatory founded in Tvärminne has a key role in understanding these coastal ecosystem atmosphere interactions as we are conducting long-term measurements of thousands of different parameters, ranging from aerosols and trace gases described in this paper, to advanced online mass spectrometry of atmospheric chemistry, as well as green house gas fluxes and sea water properties. These continuous measurements are complimented by lab experiments on topics such as sea-atmosphere fluxes of climatically relevant gases from different ecosystems under different climate conditions. Deep understanding of local meteorological conditions and modelling work are needed to understand how different components interact. All of this work is planned together with experts on coastal biogeochemistry and biodiversity so that eventually we can combine our results to understand how the coastal ecosystem interacts with climate. Long-term measurements are a key to observing how these interactions change over time as the climate changes.
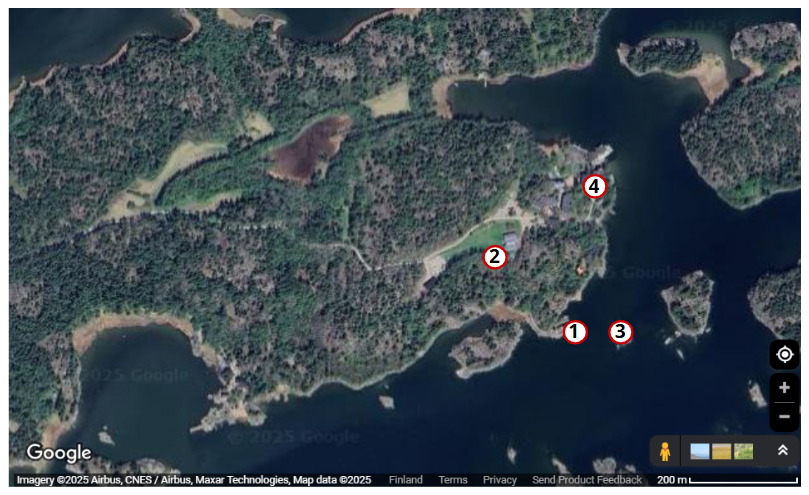
Figure A1The locations of 1. trailers including the NAIS, 2. the container with trace gas measurements, DMPS, and APS, 3. flux measurement island where meteorological data are measured, and 4. the main building of the station.
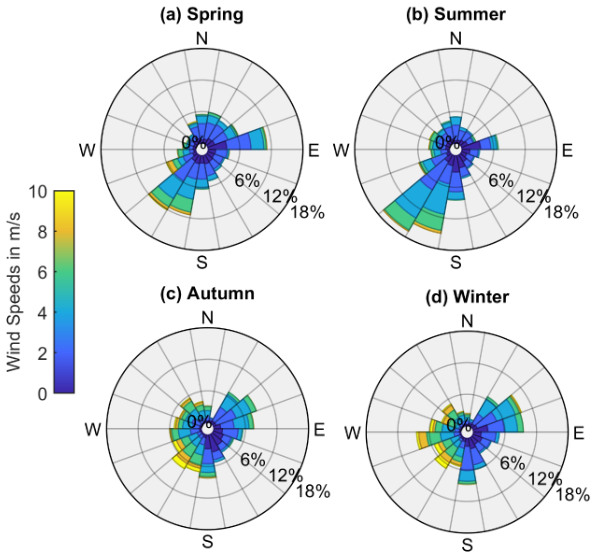
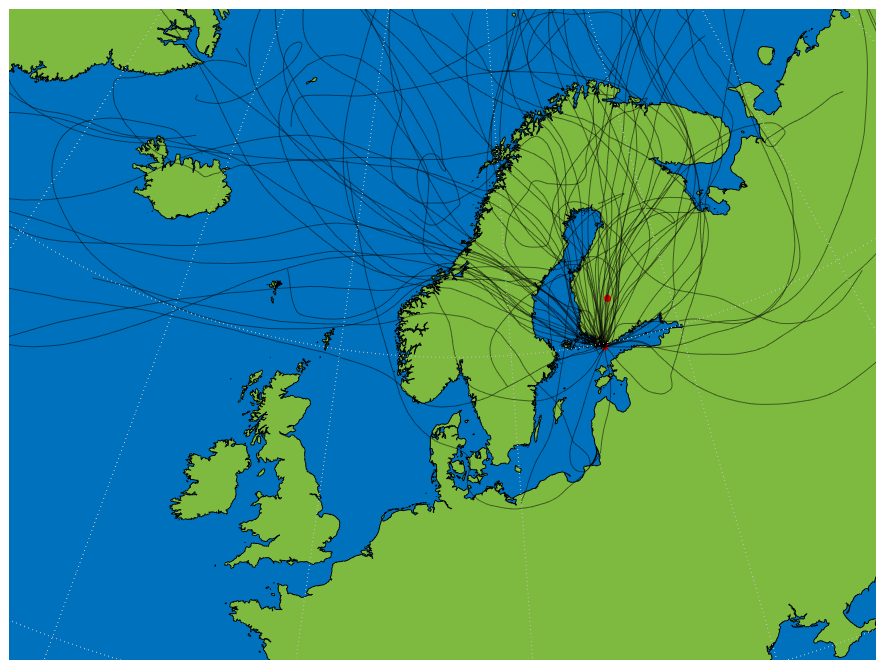
Figure A3Each black line is a 96 h air mass back trajectory for one Class I or II event day at 12 h for Tvärminne.
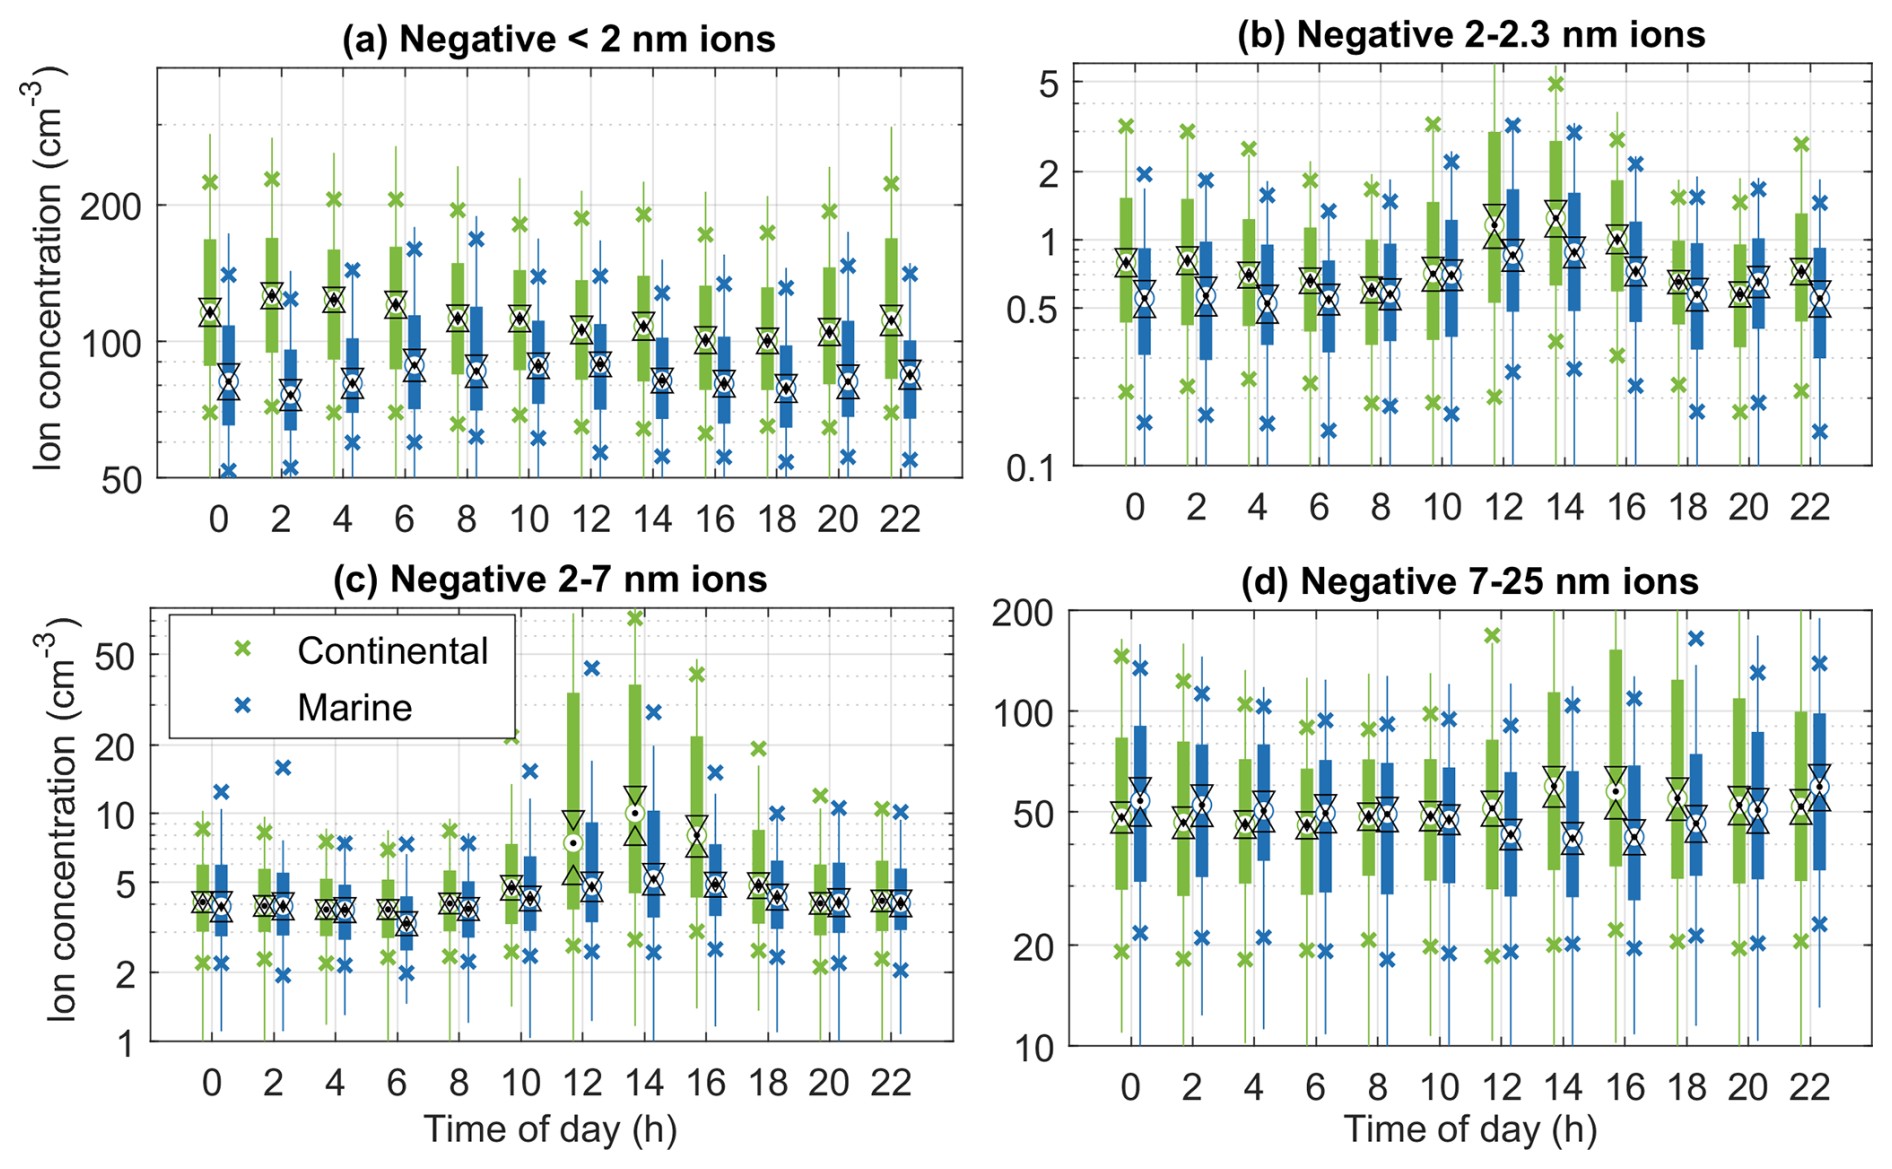
Figure A4Diurnal cycles of ions in different size ranges for coastal and continental air in the spring (March–May). The black dots indicate the medians, the triangles indicate the confidence interval of the medians, the boxes the 25th–75th percentiles, the crosses the 10th and 90th percentiles, and the whiskers cover approximately 99.3 % of the data.
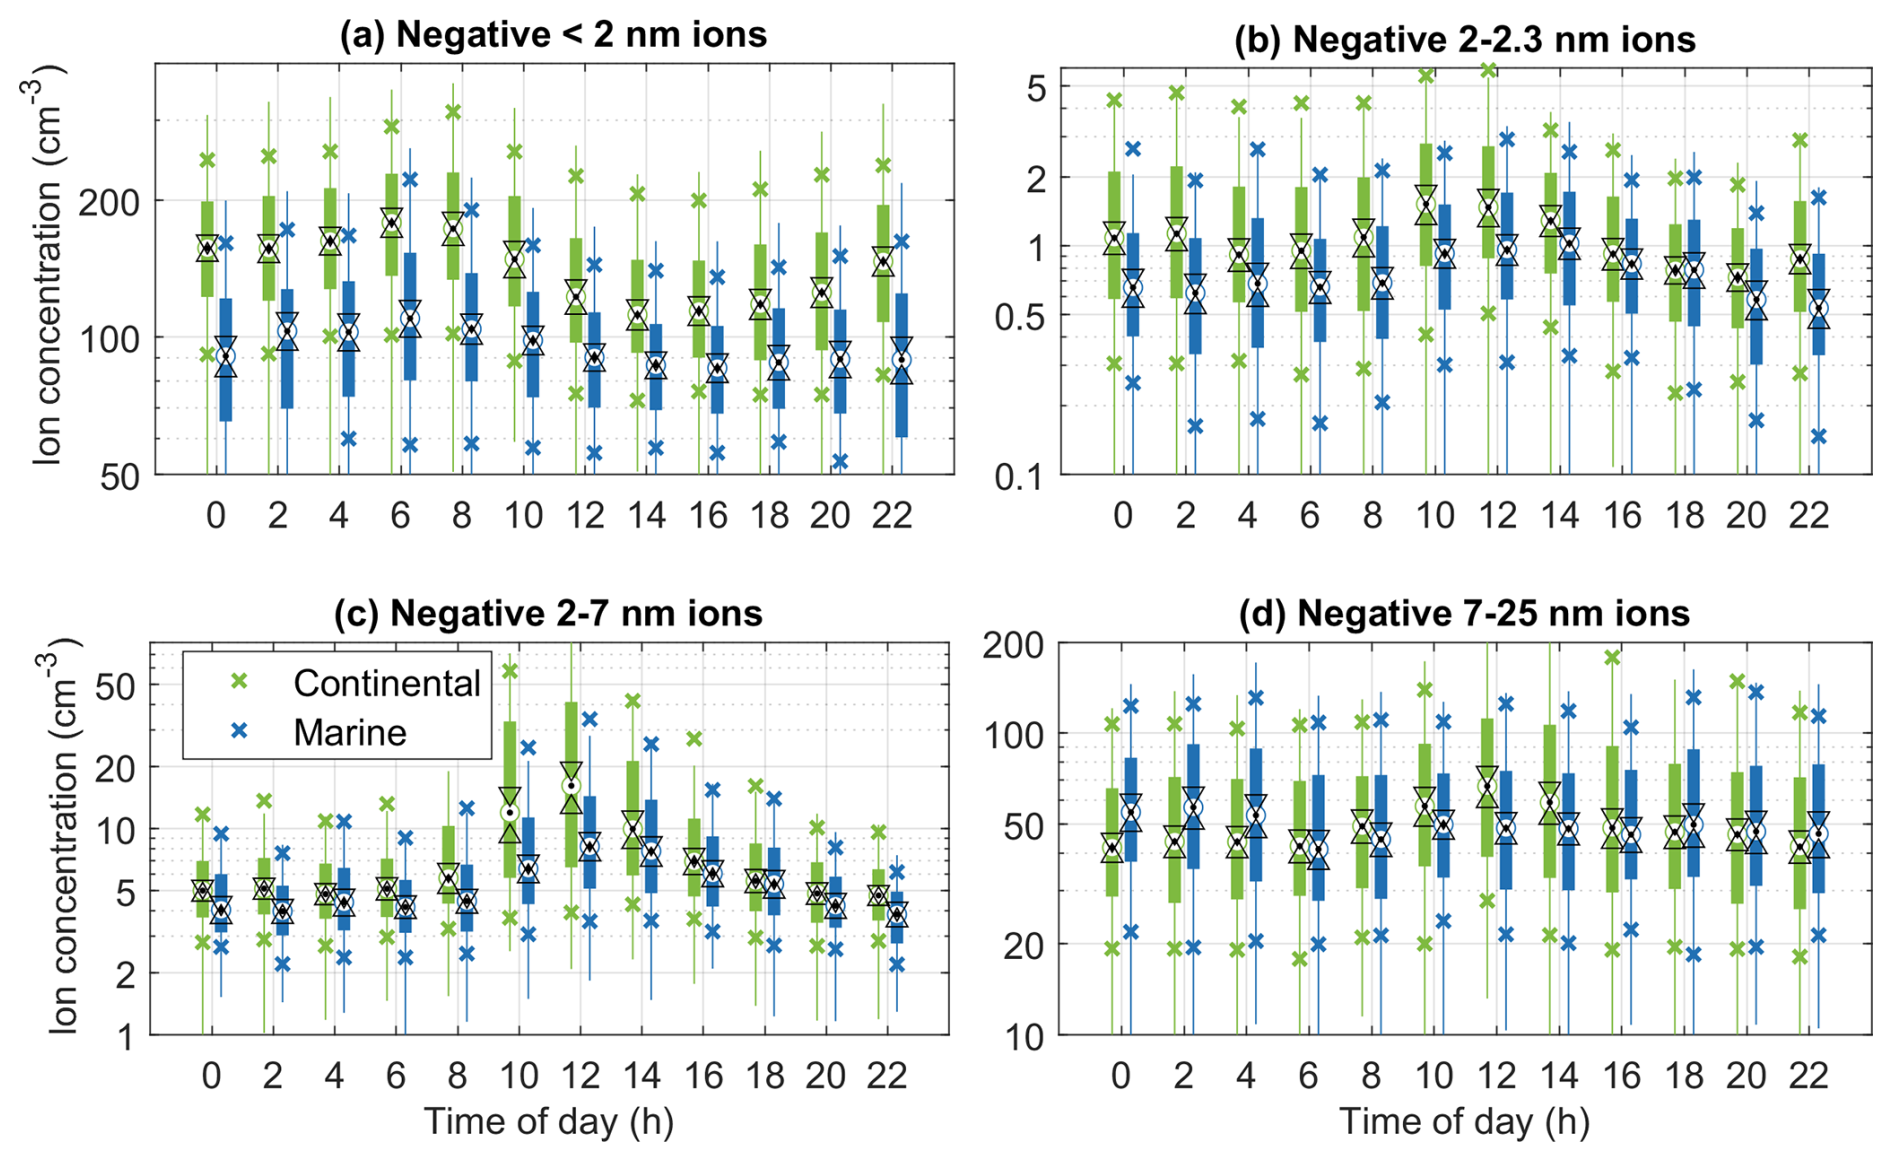
Figure A5Diurnal cycles of ions in different size ranges for coastal and continental air in the summer (June–August). The black dots indicate the medians, the triangles indicate the confidence interval of the medians, the boxes the 25th–75th percentiles, the crosses the 10th and 90th percentiles, and the whiskers cover approximately 99.3 % of the data.
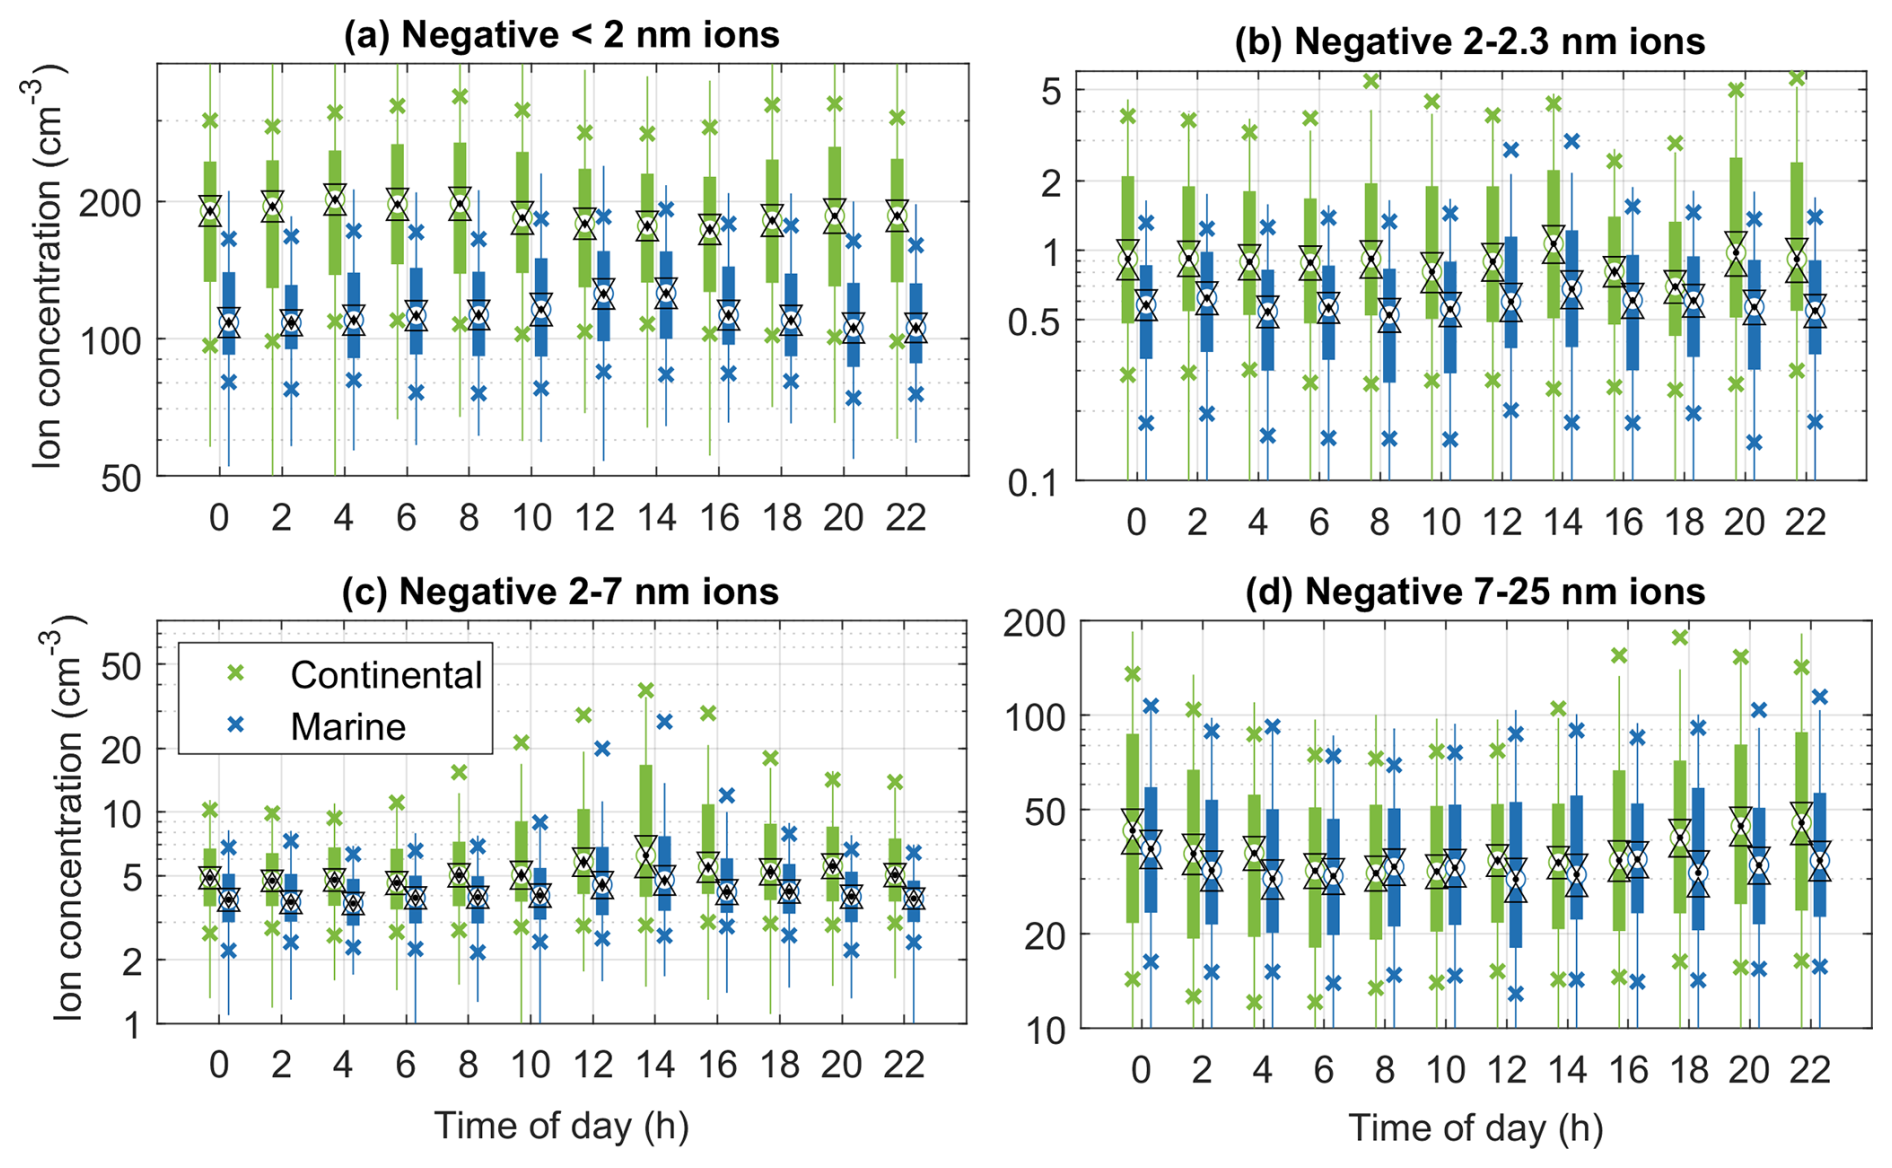
Figure A6Diurnal cycles of ions in different size ranges for coastal and continental air in the autumn (September–November). The black dots indicate the medians, the triangles indicate the confidence interval of the medians, the boxes the 25th–75th percentiles, the crosses the 10th and 90th percentiles, and the whiskers cover approximately 99.3 % of the data.
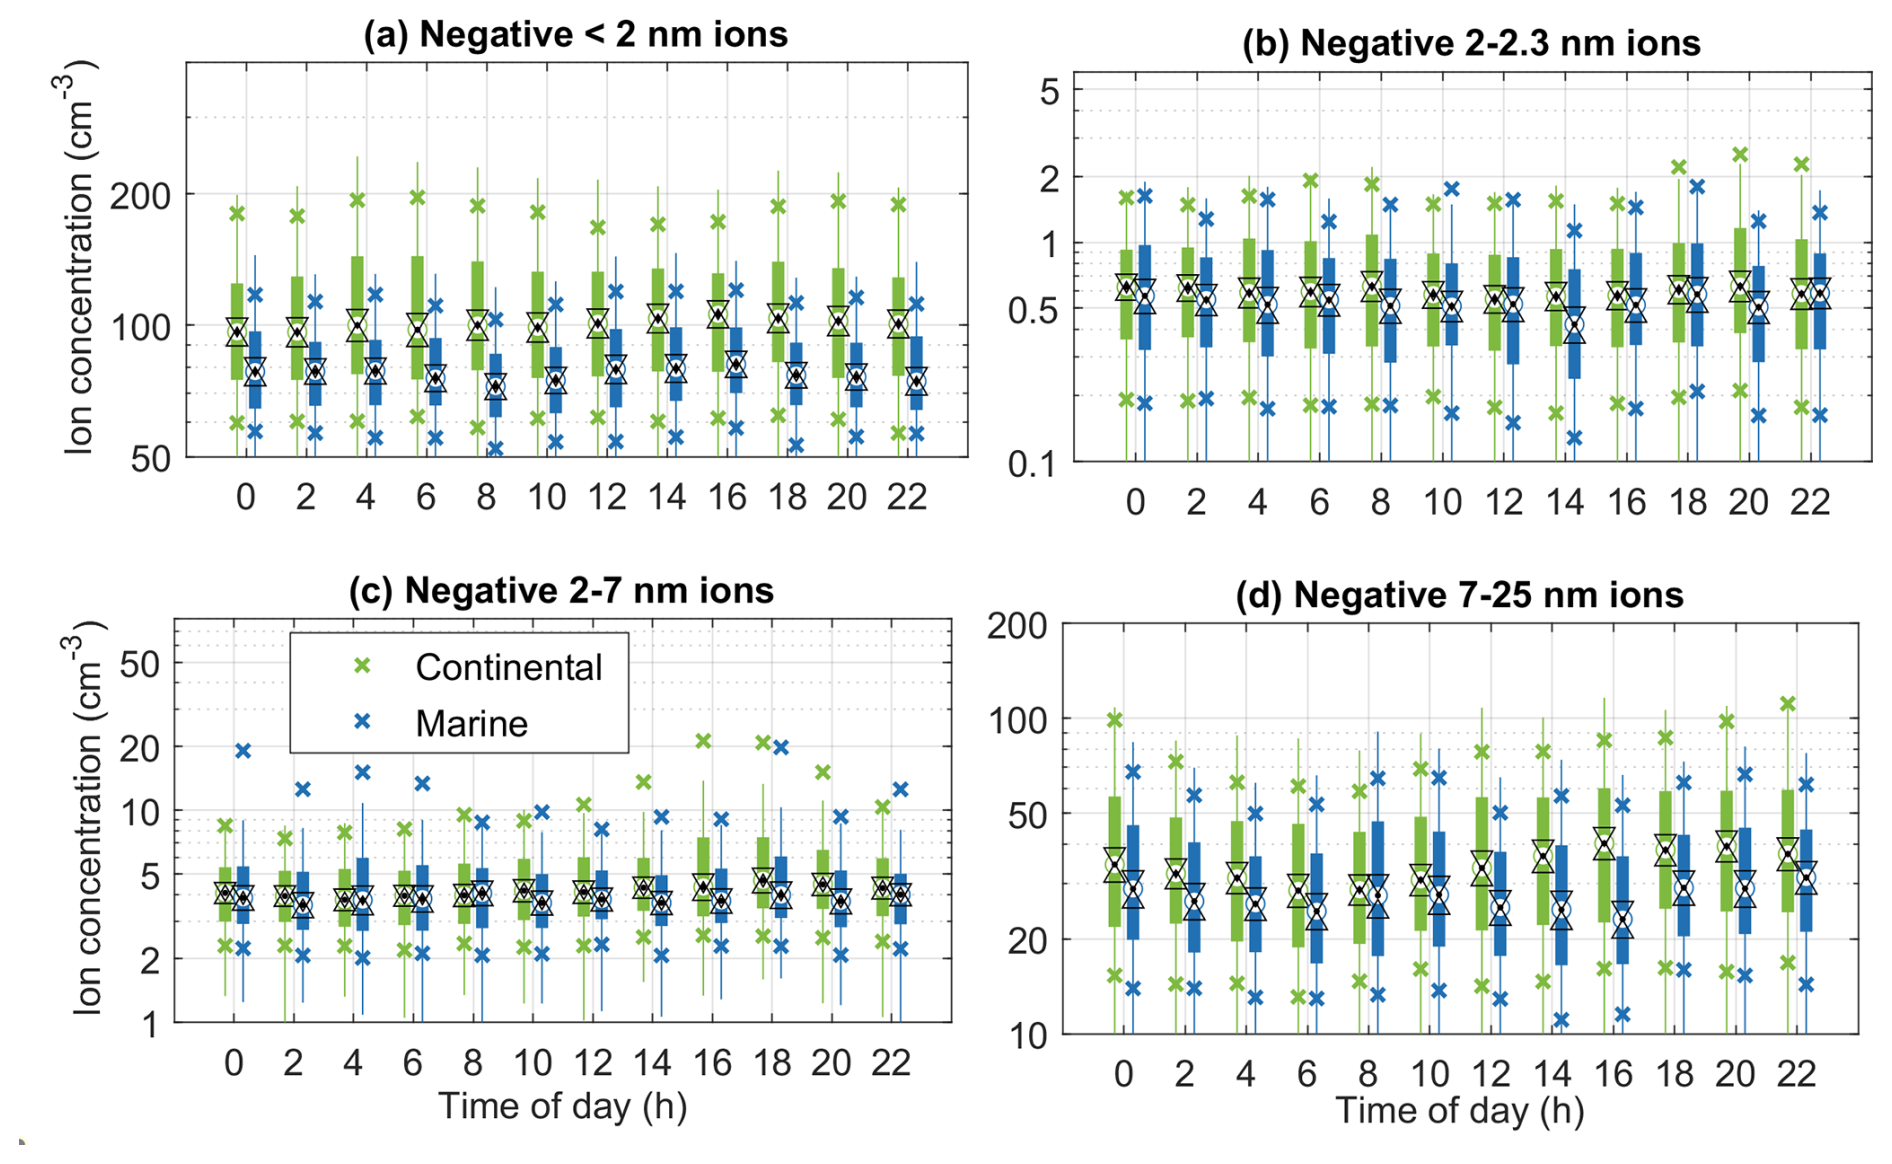
Figure A7Diurnal cycles of ions in different size ranges for coastal and continental air in the winter (December–February). The black dots indicate the medians, the triangles indicate the confidence interval of the medians, the boxes the 25th–75th percentiles, the crosses the 10th and 90th percentiles, and the whiskers cover approximately 99.3 % of the data.
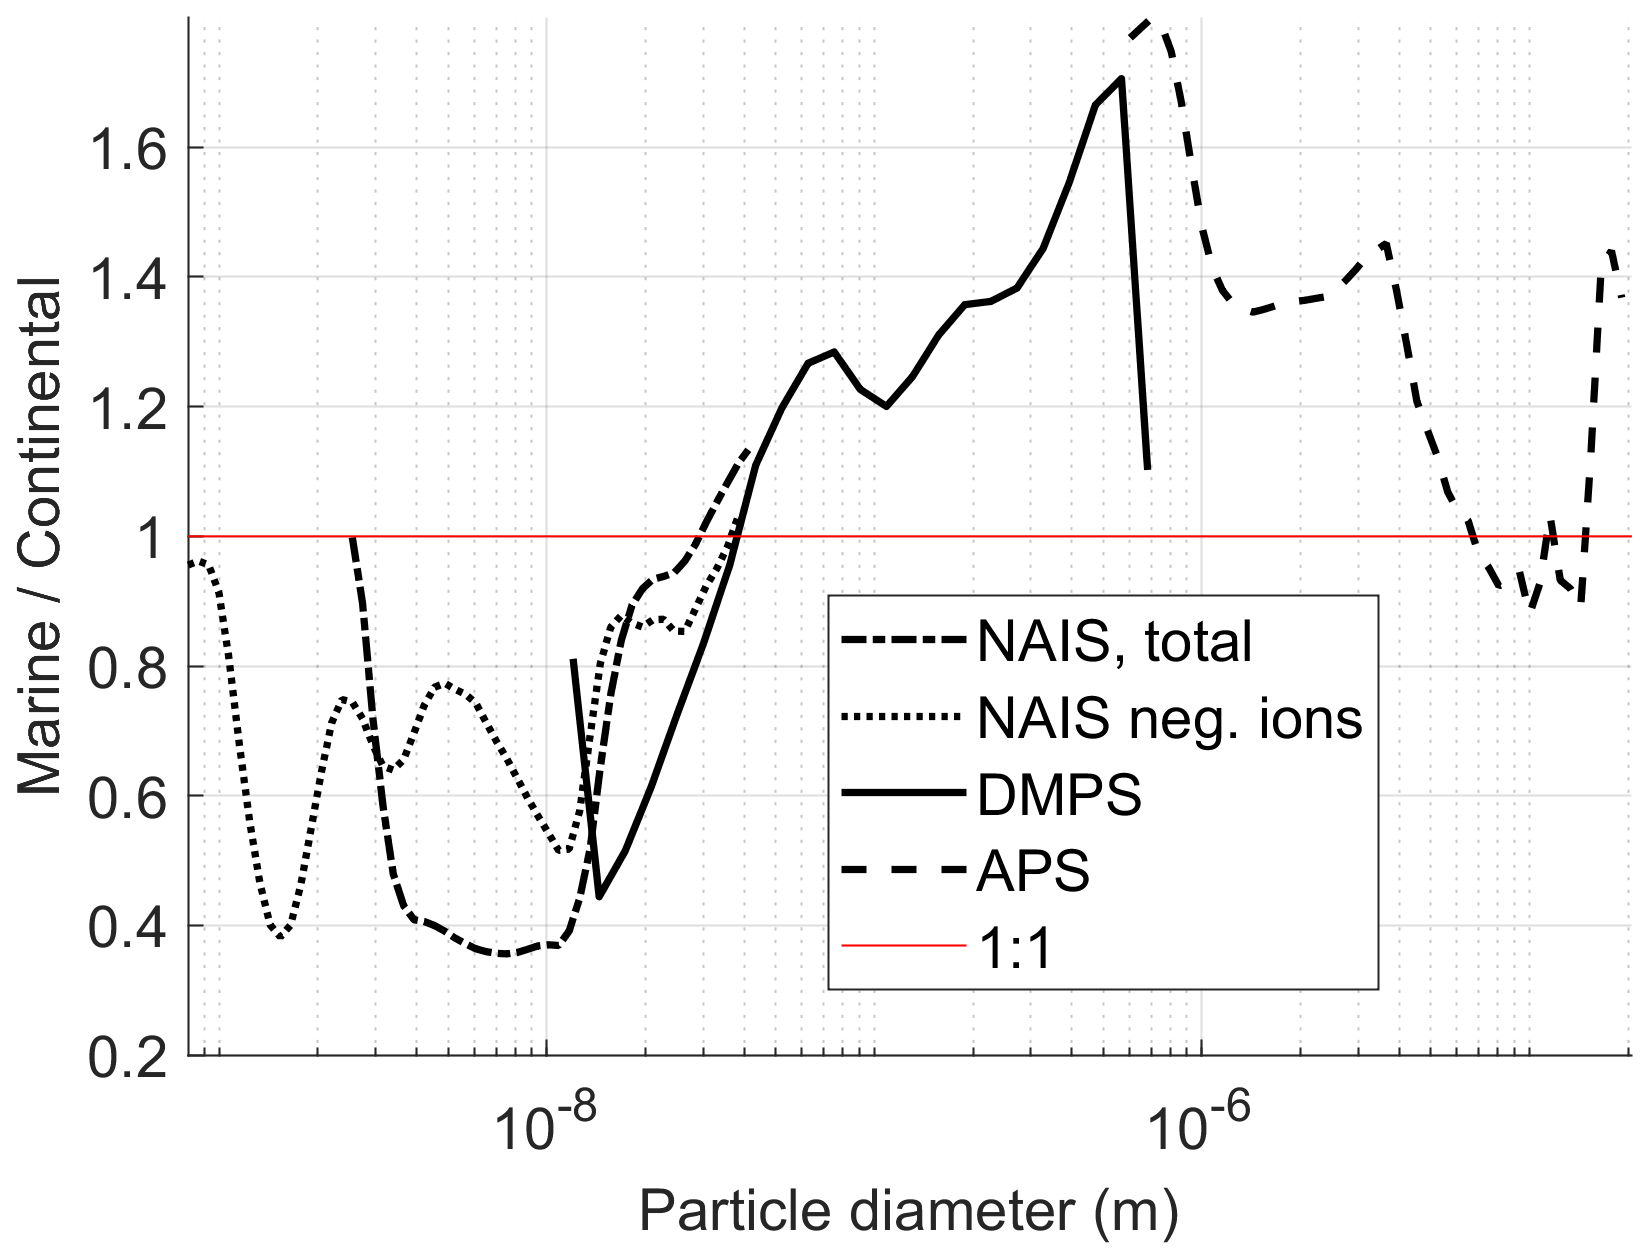
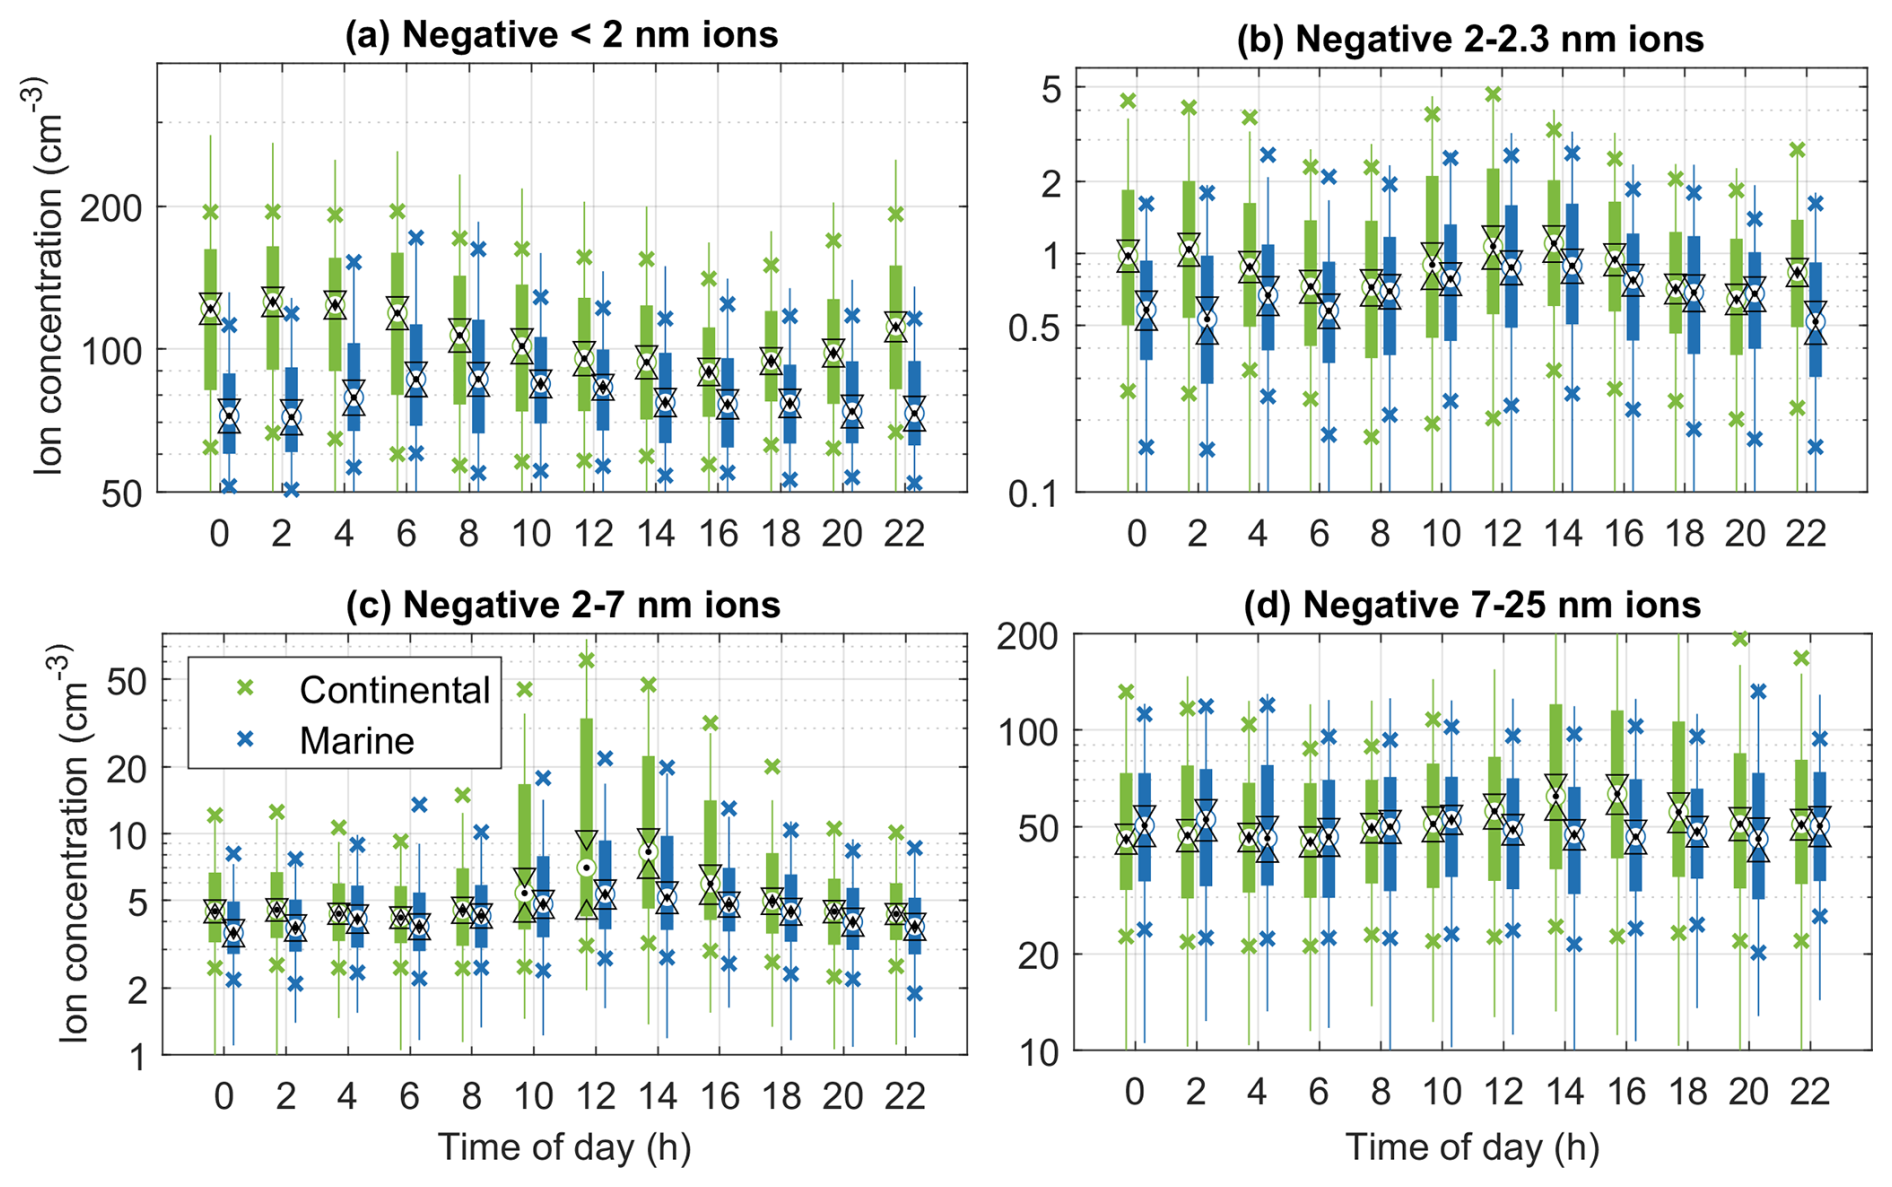
Figure A9Diurnal cycles of ions in different size ranges for coastal and continental air when DMPS data is available. The black dots indicate the medians, the triangles indicate the confidence interval of the medians, the boxes the 25th–75th percentiles, the crosses the 10th and 90th percentiles, and the whiskers cover approximately 99.3 % of the data.
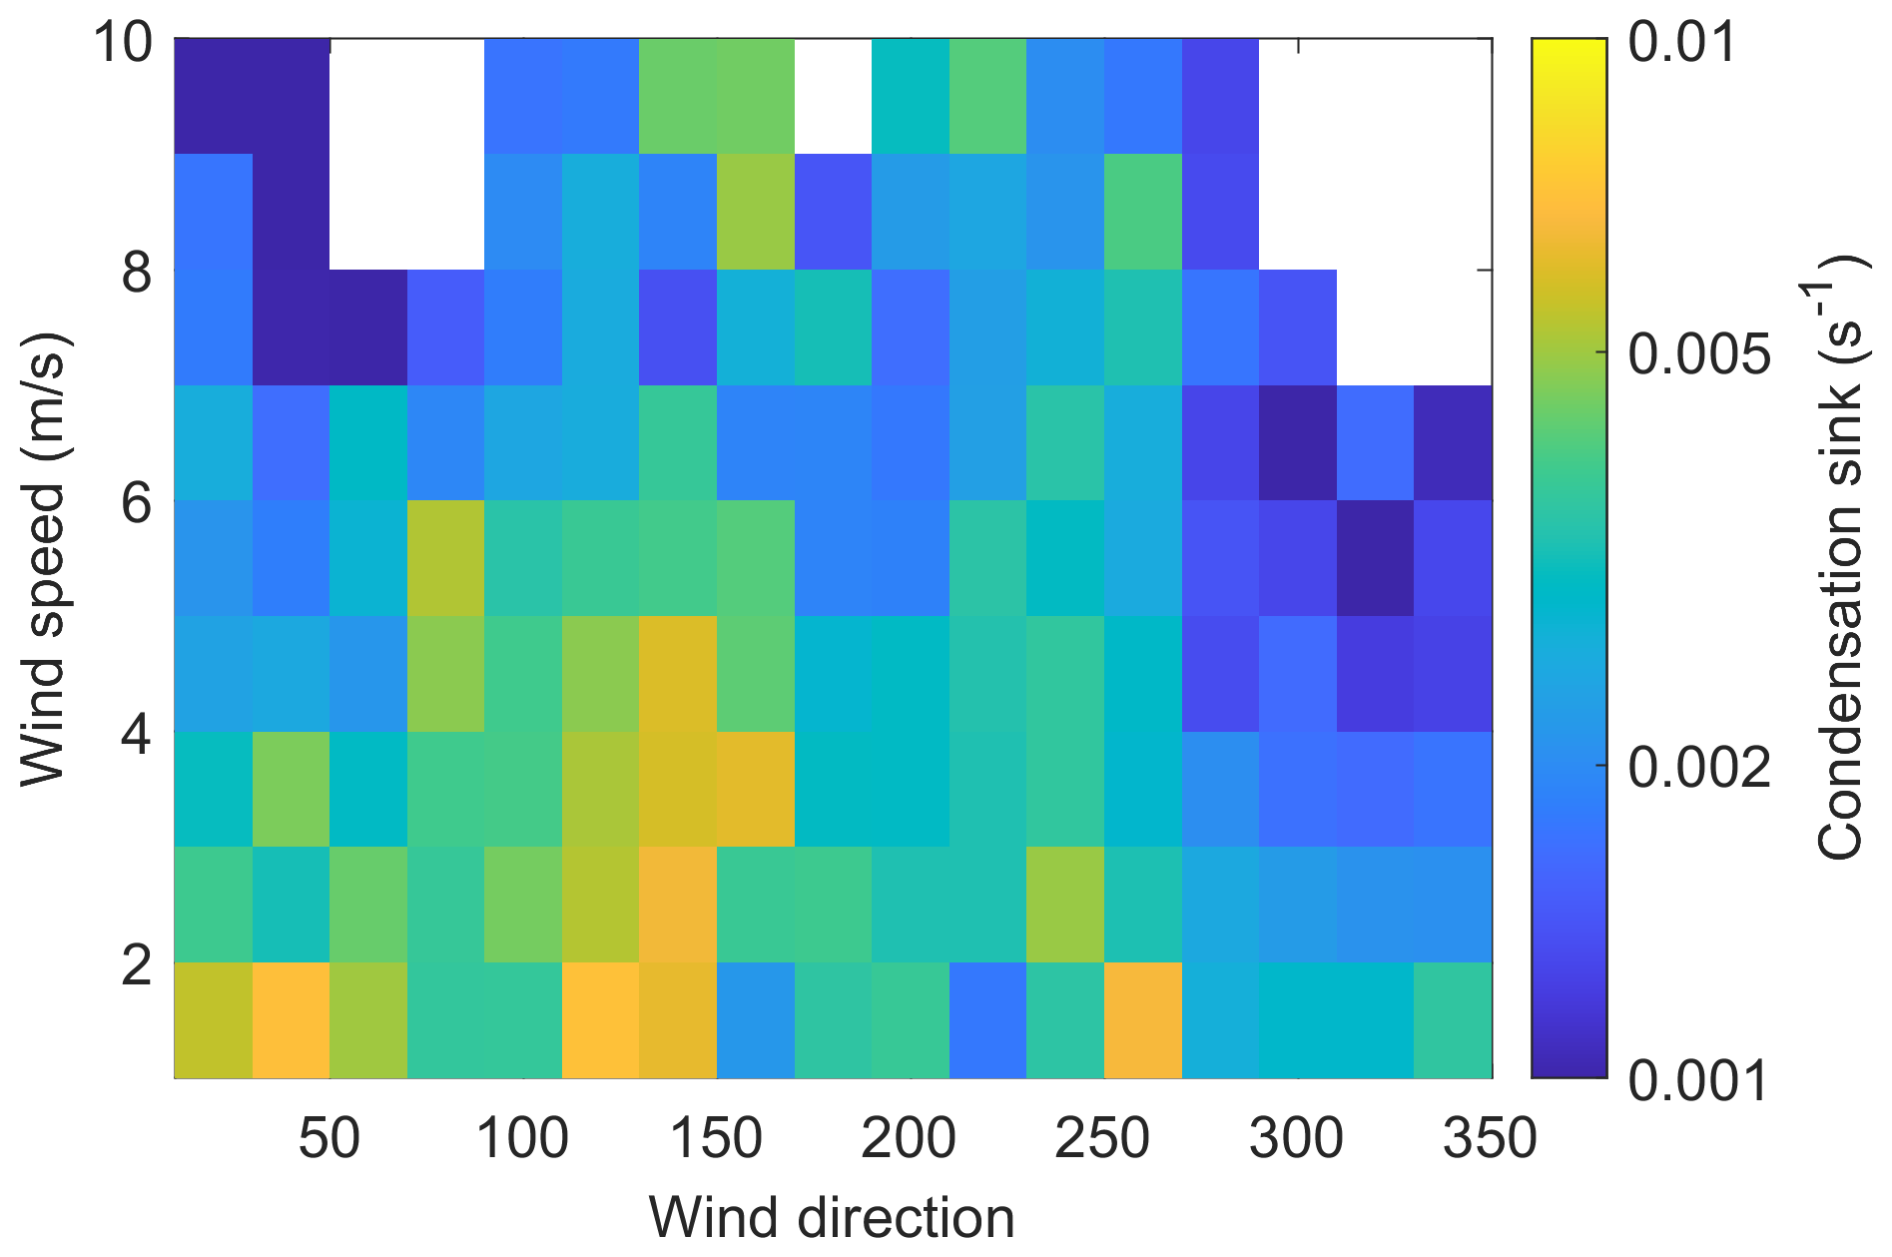
Figure A10Average condensation sink in wind direction and wind speed bins. Note that the data are included only if the wind speed and direction bin has at least 10 data points and the condensation sink data are available only when data from all particle instruments is available (22 May–29 June 2023 and 2 January–24 June 2024).
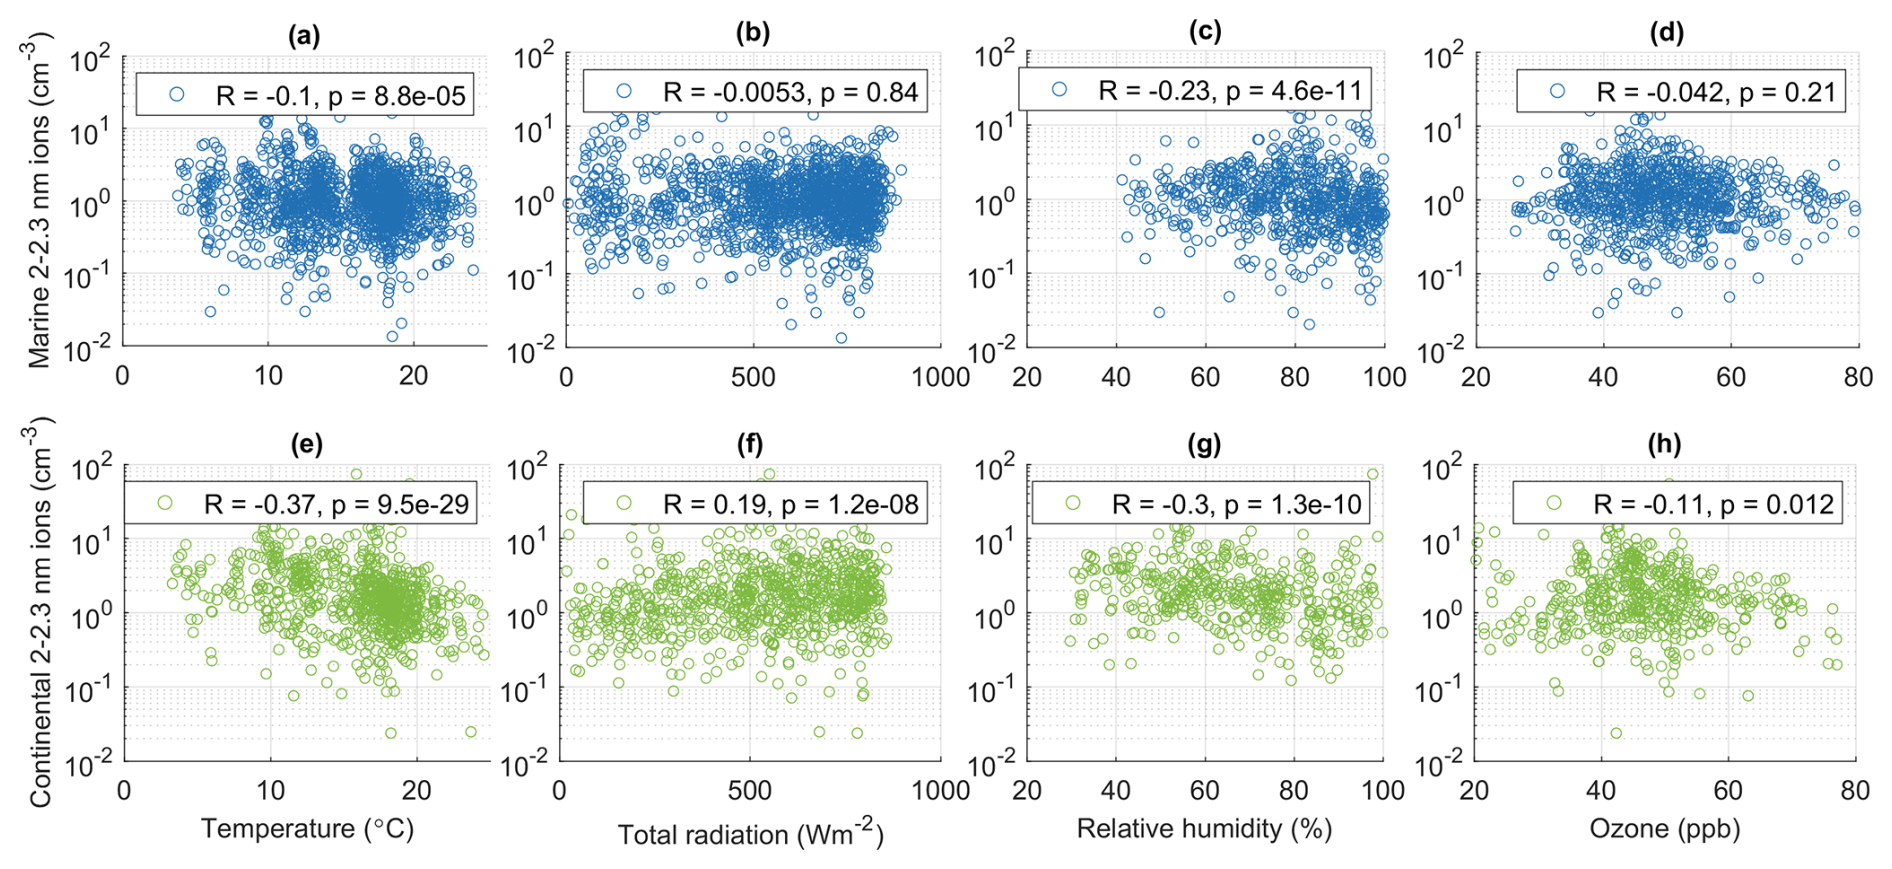
Figure A11Concentration of 2–2.3 nm ions as a function of (a) temperature, (b) total radiation, (c) relative humidity, and (d) ozone only including data from summer and 10:00–15:00 h. The upper panel with blue data points contain data only from the marine wind sector and the lower panels with green data points data from the continental wind sector.
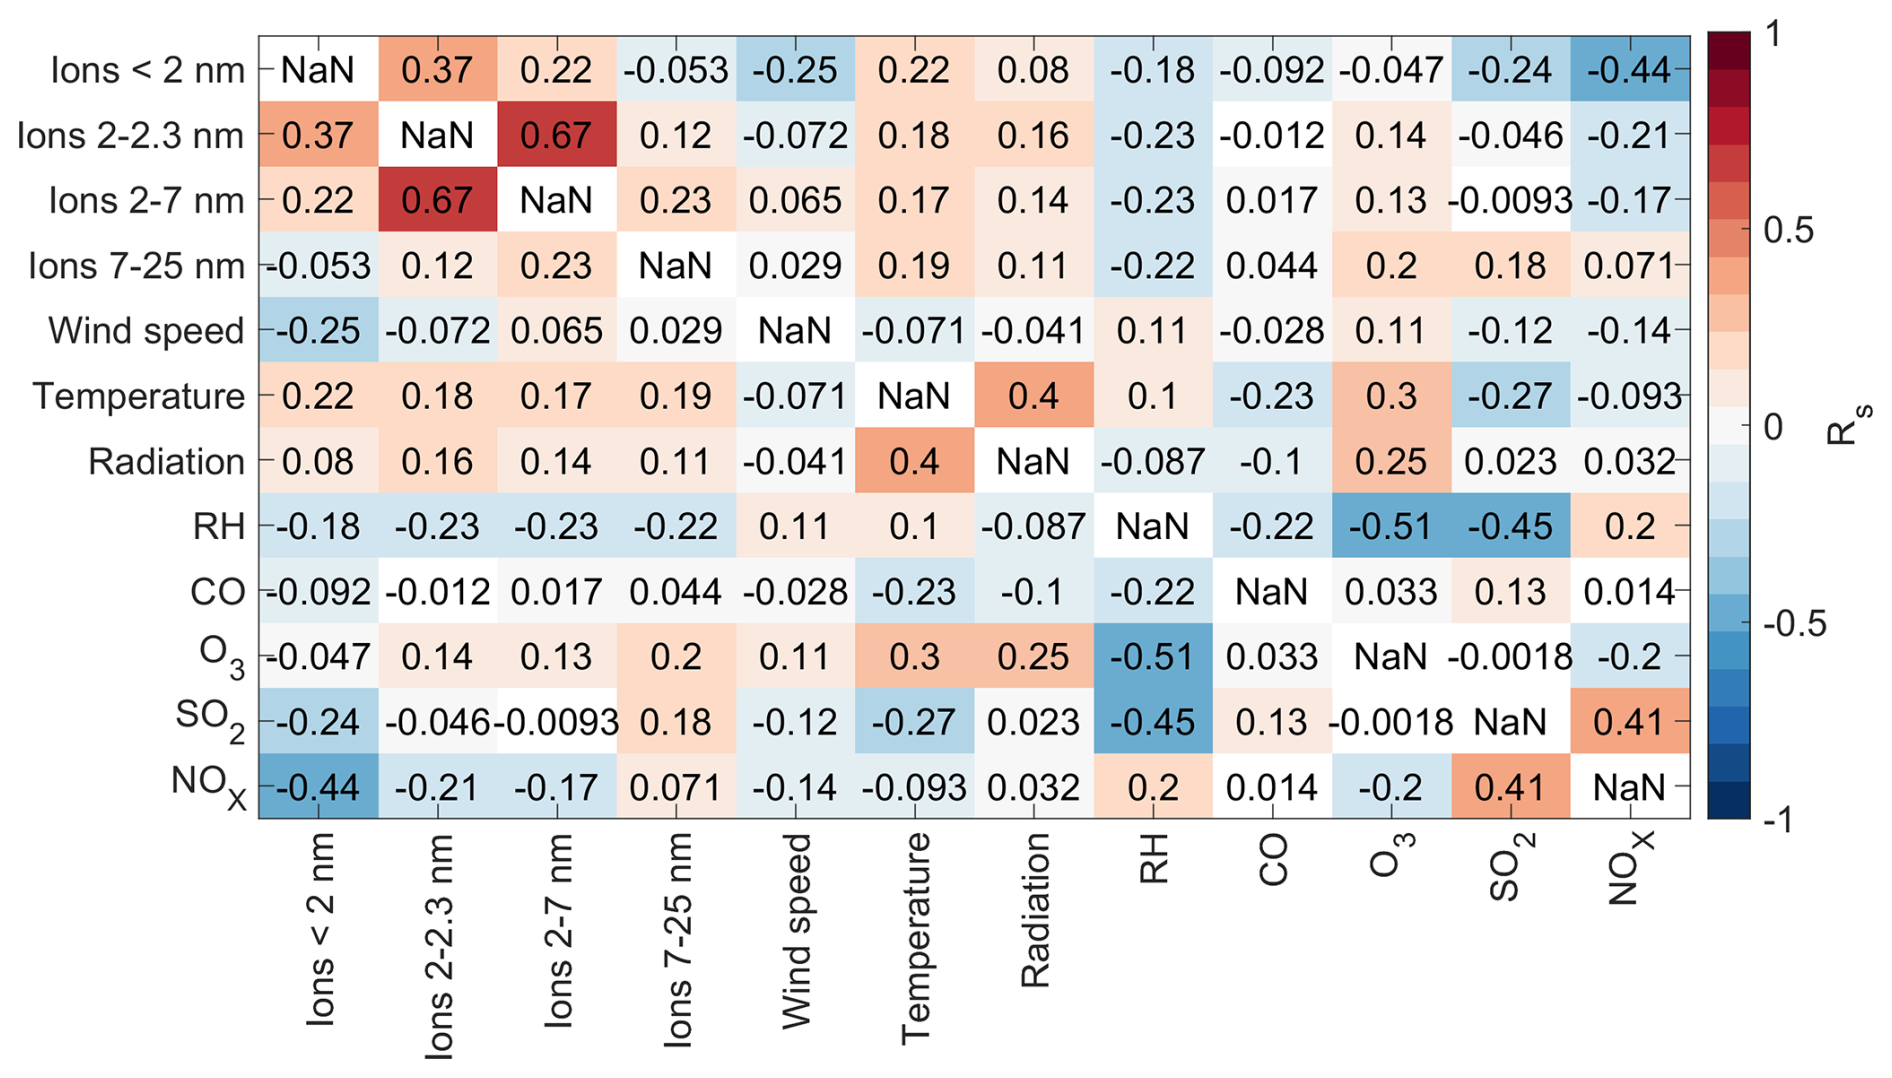
Figure A12Spearman correlation coefficients between different variables for the whole dataset. Each square corresponds to the correlation coefficient between the variables on the x- and y-axes and the colour indicates the strength of the correlation with the square being white if the p-value was above 0.05.
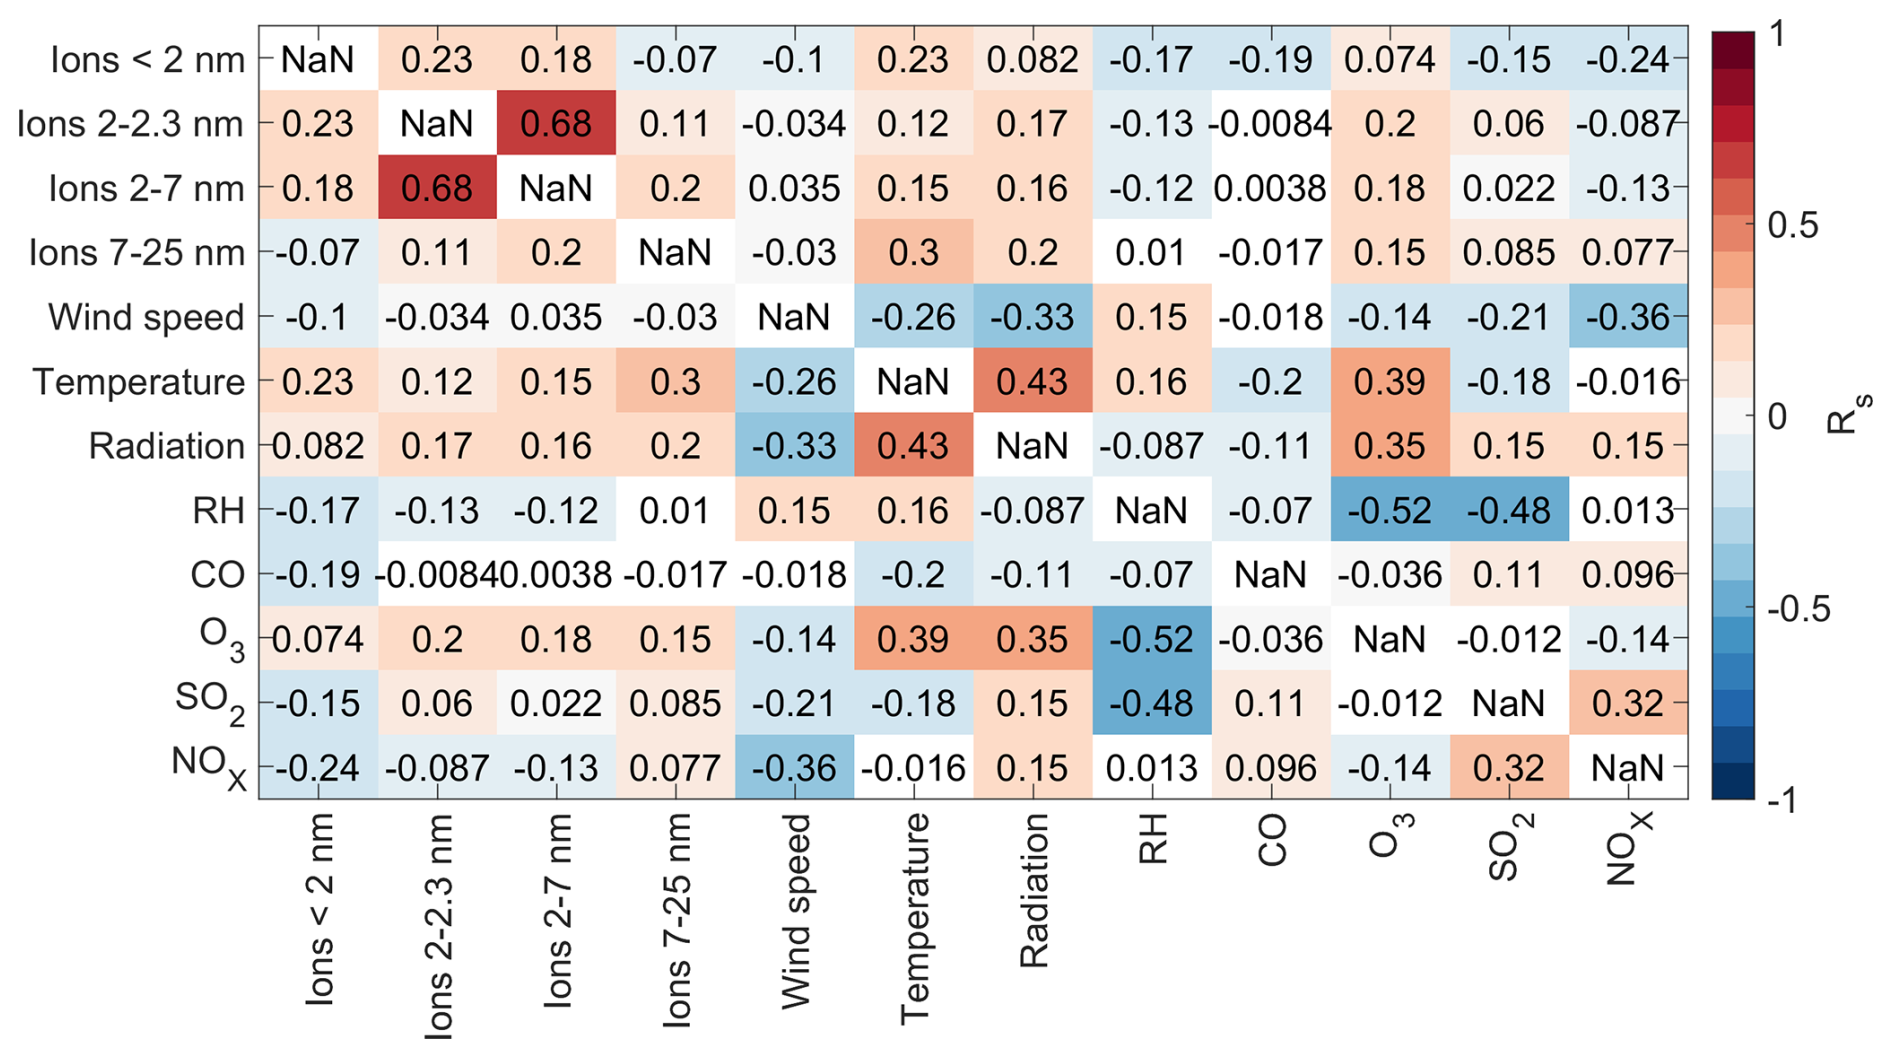
Figure A13Spearman correlation coefficients between different variables in marine air. Each square corresponds to the correlation coefficient between the variables on the x- and y-axes and the colour indicates the strength of the correlation with the square being white if the p-value was above 0.05.
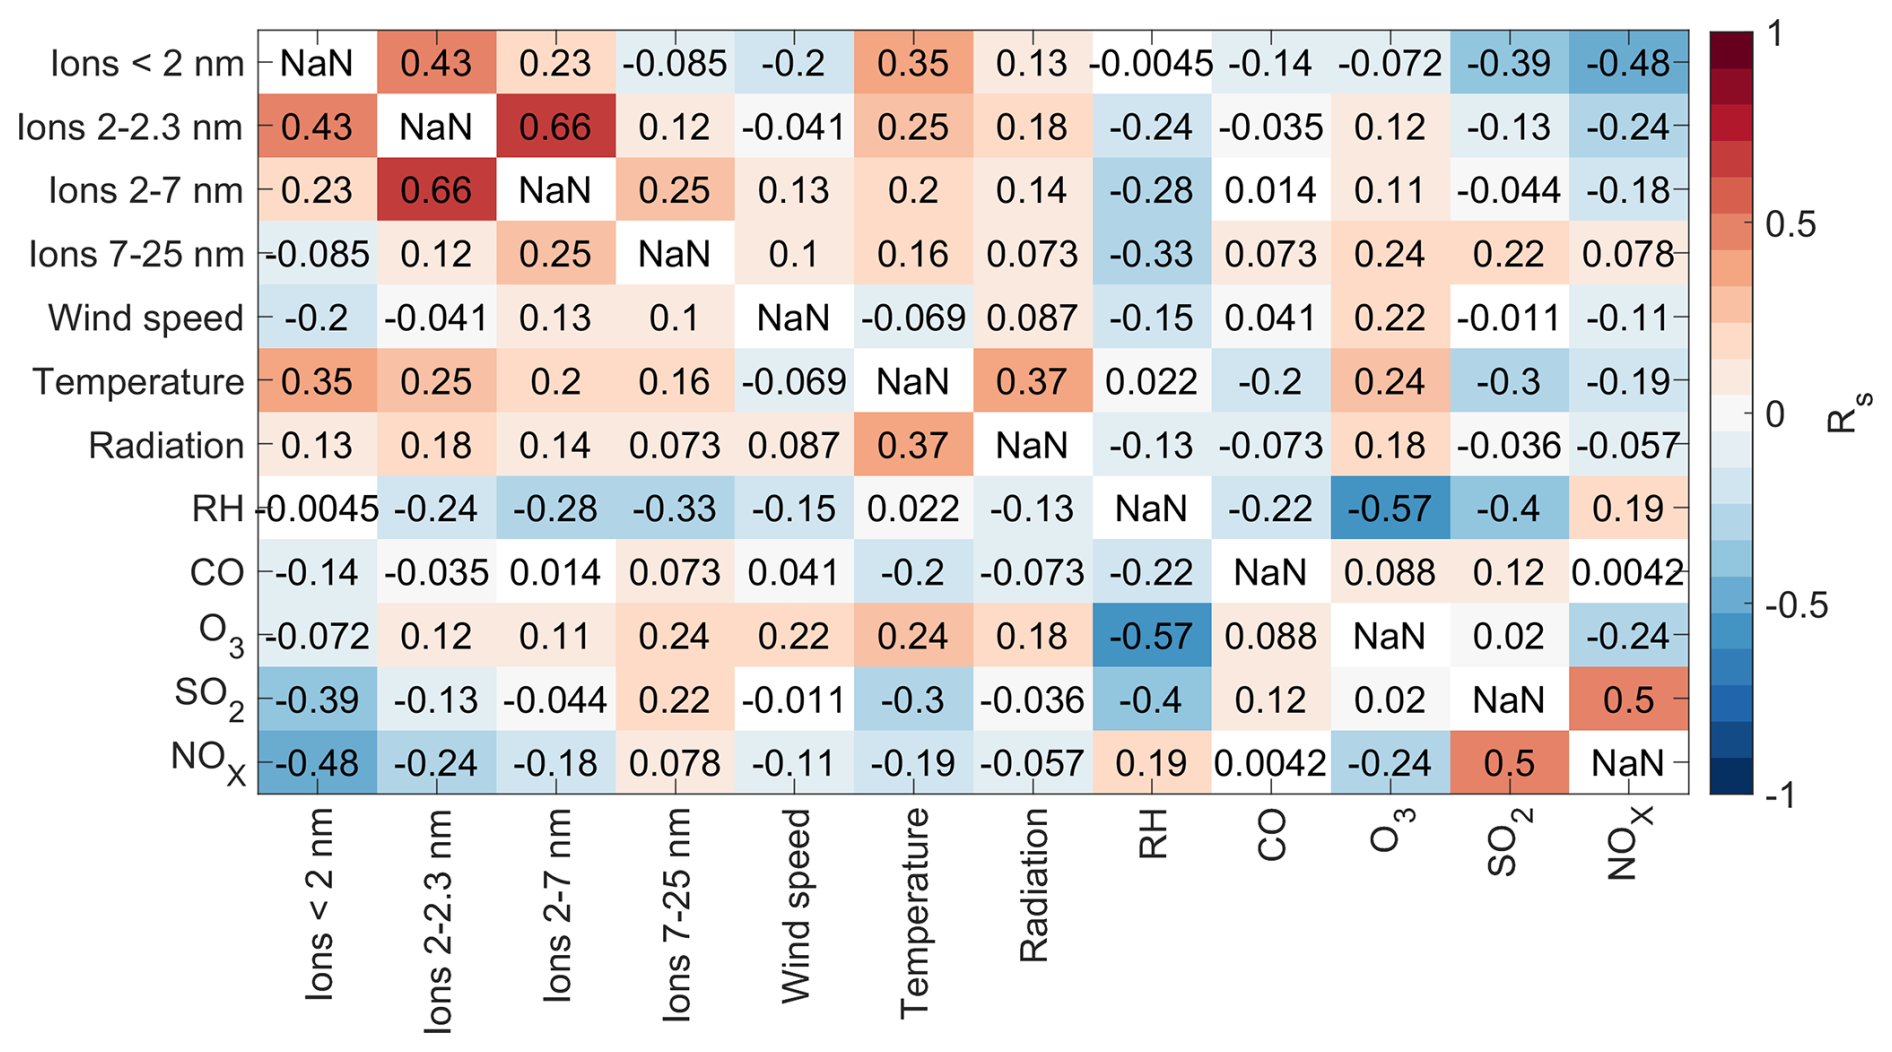
Figure A14Spearman correlation coefficients between different variables in air coming from the land. Each square corresponds to the correlation coefficient between the variables on the x- and y-axes and the colour indicates the strength of the correlation with the square being white if the p-value was above 0.05.
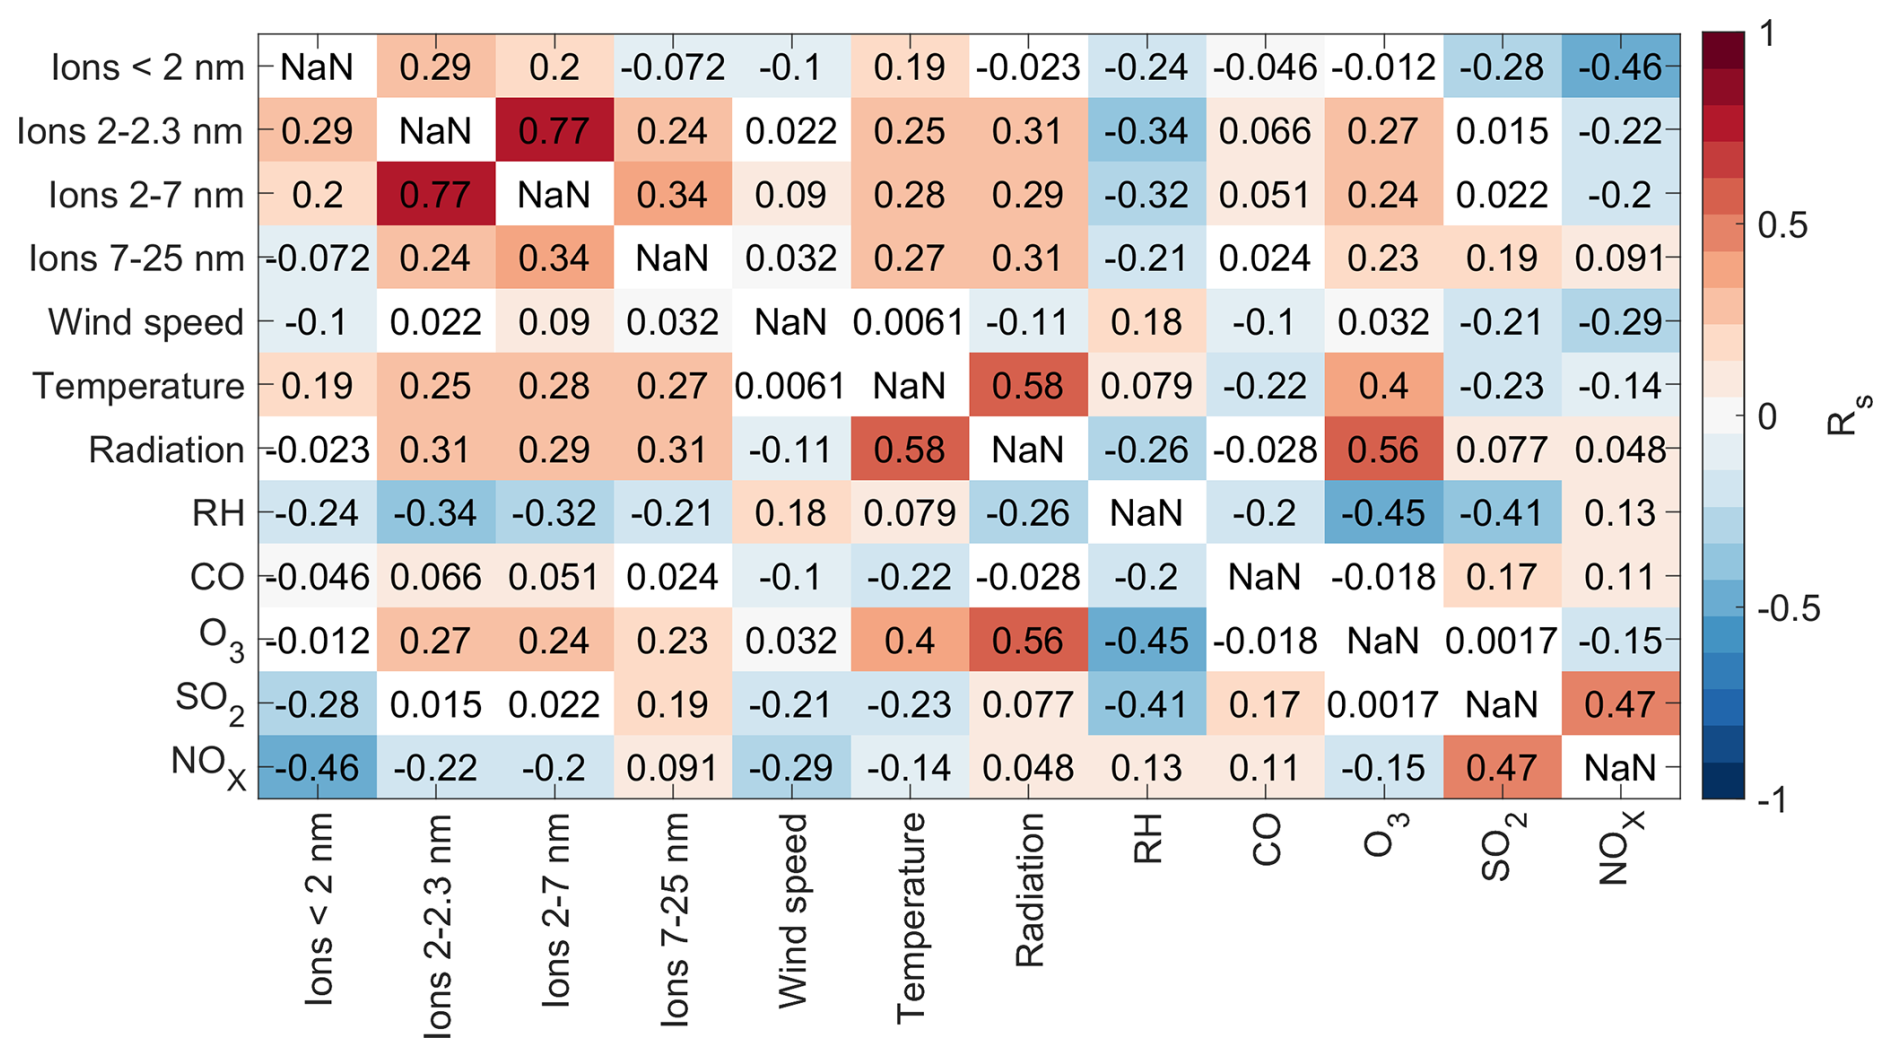
Figure A15Spearman correlation coefficients between different variables during the day (10:00–15:00 h). Each square corresponds to the correlation coefficient between the variables on the x- and y-axes and the colour indicates the strength of the correlation with the square being white if the p-value was above 0.05.
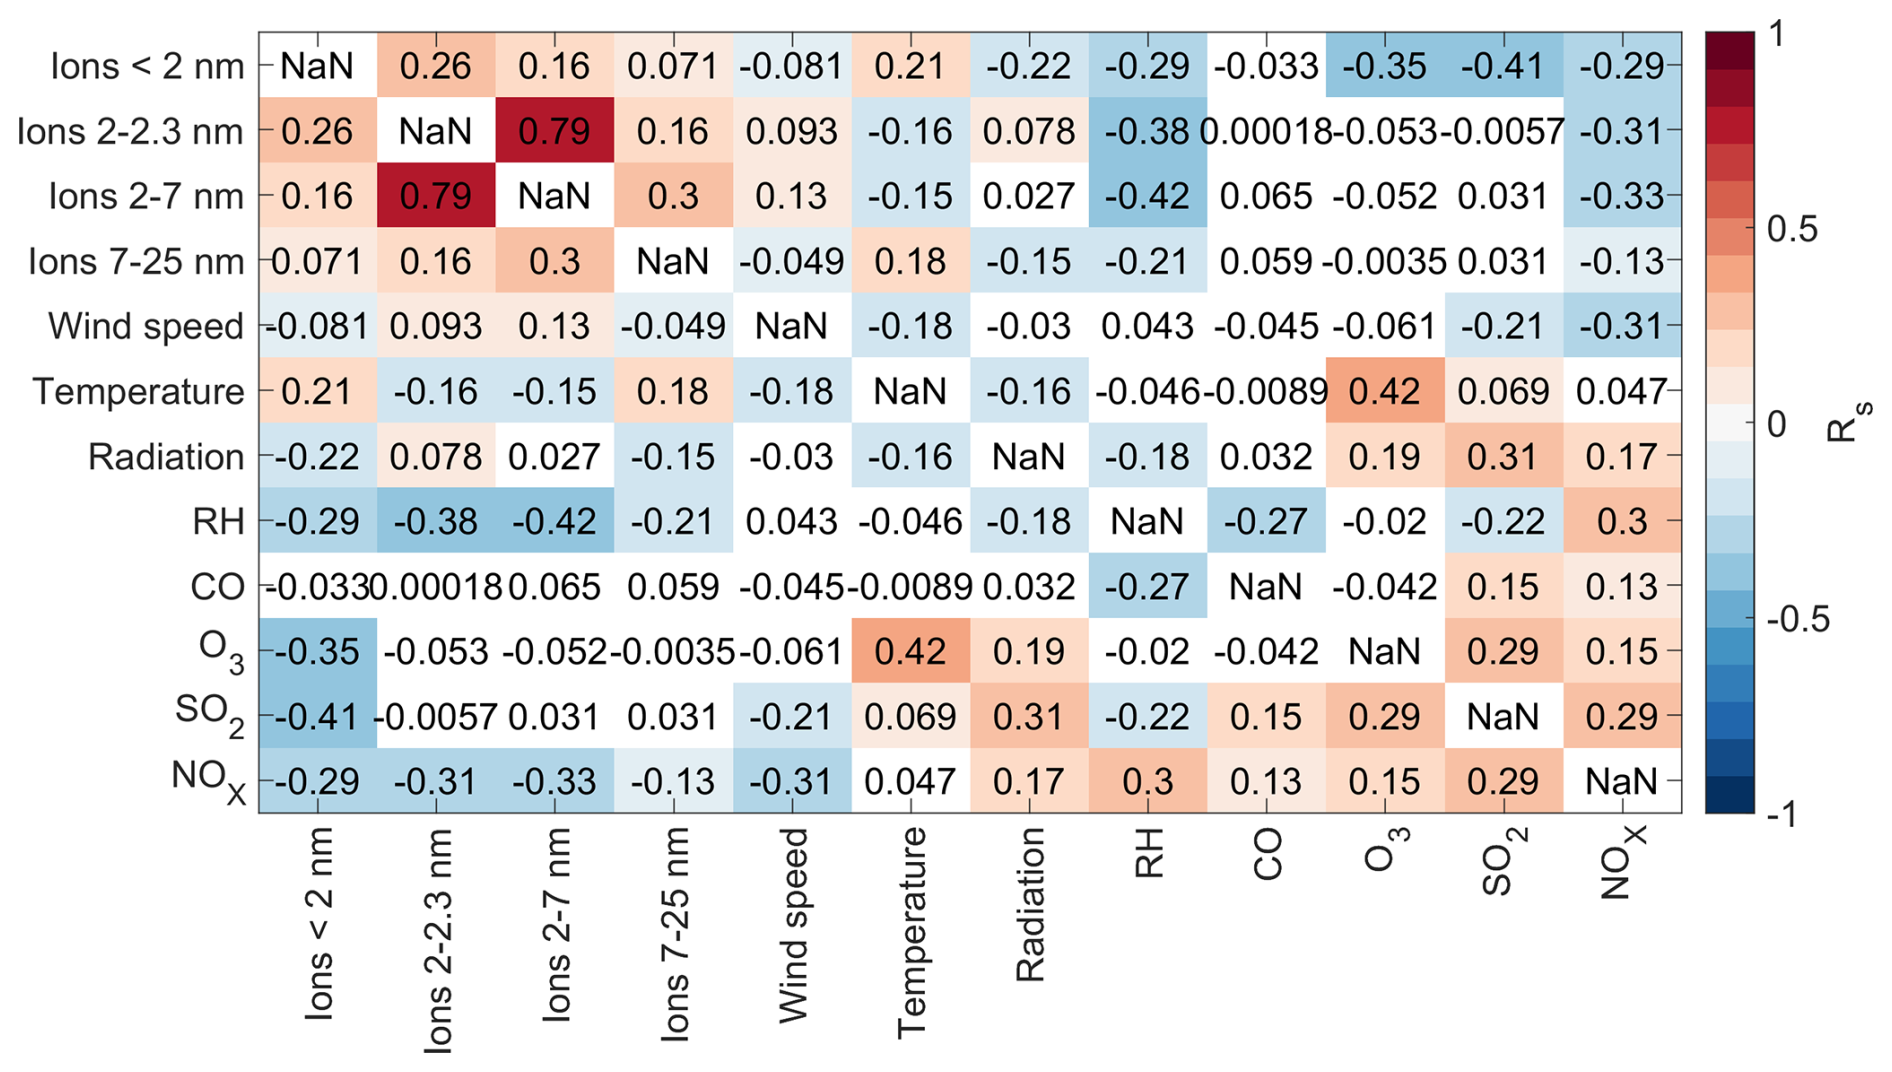
Figure A16Spearman correlation coefficients between different variables during the day (10:00–15:00 h) in the summer (June–August). Each square corresponds to the correlation coefficient between the variables on the x- and y-axes and the colour indicates the strength of the correlation with the square being white if the p-value was above 0.05.
Trace gases can help us understand the sources and chemical make-up of air in the two wind sectors. As the Tvärminne station is situated in a nature conservation area, there are no major sources of anthropogenic pollutants in the near vicinity of the station and the levels of trace gases are overall low and similar to the levels observed in a 13 year long data set from Hyytiälä (Riuttanen et al., 2013). Figures B1 and B2 show the diurnal and seasonal cycles of carbon monoxide (CO), ozone (O3), sulphur dioxide (SO2), and nitrogen oxides (NOX). For the seasonal cycles, months were included only if they had a minimum of one week of data per wind sector.
Comparing the median levels of the gases in the two wind sectors shows that while CO and SO2 have higher levels in the continental wind sector, O3 and NOX are on average higher in the marine wind sector. Both CO and SO2 are produced by anthropogenic sources and there are more of these sources over land, so having higher levels over land is reasonable. Ozone levels are lower in the continental wind sector, because other pollutants consume ozone. Higher NOX levels in the marine sector are likely related to long-range transport as explained later in this section. Next we go through the observed trends for each gas separately.
CO is formed in incomplete combustion and its major sources in Finland include traffic and small-scale combustion, such as heating homes with wood burning. The main sink for CO is hydroxyl radicals, which are produced in sunny conditions and are thus most abundant in the summer (Holloway et al., 2000). This explains the observed seasonal cycle (Fig. B2a) in which we can see the lowest CO levels in the summer. The seasonal trends observed here are in line with the results observed previously in Helsinki and Sodankylä by Karppinen et al. (2024). This is expected since the lifetime of CO is relatively long, and we do not expect any strong CO sources in the near vicinity of the Tvärminne station.
The diurnal cycle of CO has a maximum in the late afternoon (16:00–18:00 h) and a minimum in the morning (06:00–08:00 h) in both wind sectors. The diurnal cycle observed here is related to emissions accumulating in the boundary layer during the day and our results are somewhat similar to what has been observed in Helsinki during the weekends and less pronounced than what was observed in Helsinki during the weekdays (Järvi et al., 2009). This is reasonable since the traffic volumes in Helsinki especially during the week are much higher than those in the Tvärminne region.
The diurnal cycle of ozone (Fig. B1b) is fairly similar to CO, with the highest values observed in the afternoon (14:00–16:00 h) and lowest values late at night (02:00–06:00 h). This is somewhat similar to what has been observed before in Hyytiälä (Lyubovtseva et al., 2005) and Helsinki (Järvi et al., 2009), since during the day ozone can be produced by photolysis and mixed down from higher altitudes. The differences between the two wind sectors are small, but during the day, the marine sector has statistically significantly higher concentrations. The seasonal cycle of ozone (Fig. B2b) shows highest levels in both wind sectors in the late spring. This has been observed previously for example in Hyytiälä (Lyubovtseva et al., 2005; Riuttanen et al., 2013), because the radiation levels are high in the summer and ozone is produced by photolysis. The fact that ozone levels are higher in the marine sector is in line with previous work by Riuttanen et al. (2013) who observed that in Hyytiälä in the winter the ozone concentrations are higher when the air masses come from marine areas where the levels of ozone deposition and ozone destroying pollutants are low. The spring ozone maximum coincided also with the maximum in NPF event frequency which is rational since both ozone and particles can be produced by photochemical reactions and ozone can oxidize many vapours so that they become less volatile and are more likely to form particles.
SO2 has a weak diurnal cycle with both wind sectors reaching their highest concentrations during the day (Fig. B1c). The marine wind sector has lower concentrations than the continental wind sector during the night. The trend of having higher SO2 concentrations during the day is similar to what has been observed previously in Helsinki during the weekdays (Järvi et al., 2009). Looking at the seasonal cycle, SO2 concentrations are the lowest in the late summer and early autumn (Fig. B2c). This is reasonable as previous work in Hyytiälä has connected high SO2 values in winter with more heating emissions, less photochemical losses, and temperature inversions trapping pollutants (Riuttanen et al., 2013).
For NOX, the concentrations are in general low and in the continental wind sector the variations in concentration of each hour are larger than a possible diurnal cycle (Fig. B1d). In the marine sector we observe higher concentrations during the day. Previous results for Hyytiälä (Riuttanen et al., 2013) indicate that a possible reason for higher NOX concentrations in our marine sector is long-range transport from south and south-east. In the seasonal cycle, more variability can be seen in the data from February to June, with lowest values observed in late summer and early autumn (Fig. B2d). Similar seasonal trends have been observed before in Hyytiälä. There, the higher NOX levels in the winter and early spring were associated with combustion sources, low photochemical sink, and increased long-range transport (Riuttanen et al., 2013), and similar phenomena are likely to play a role in Tvärminne.
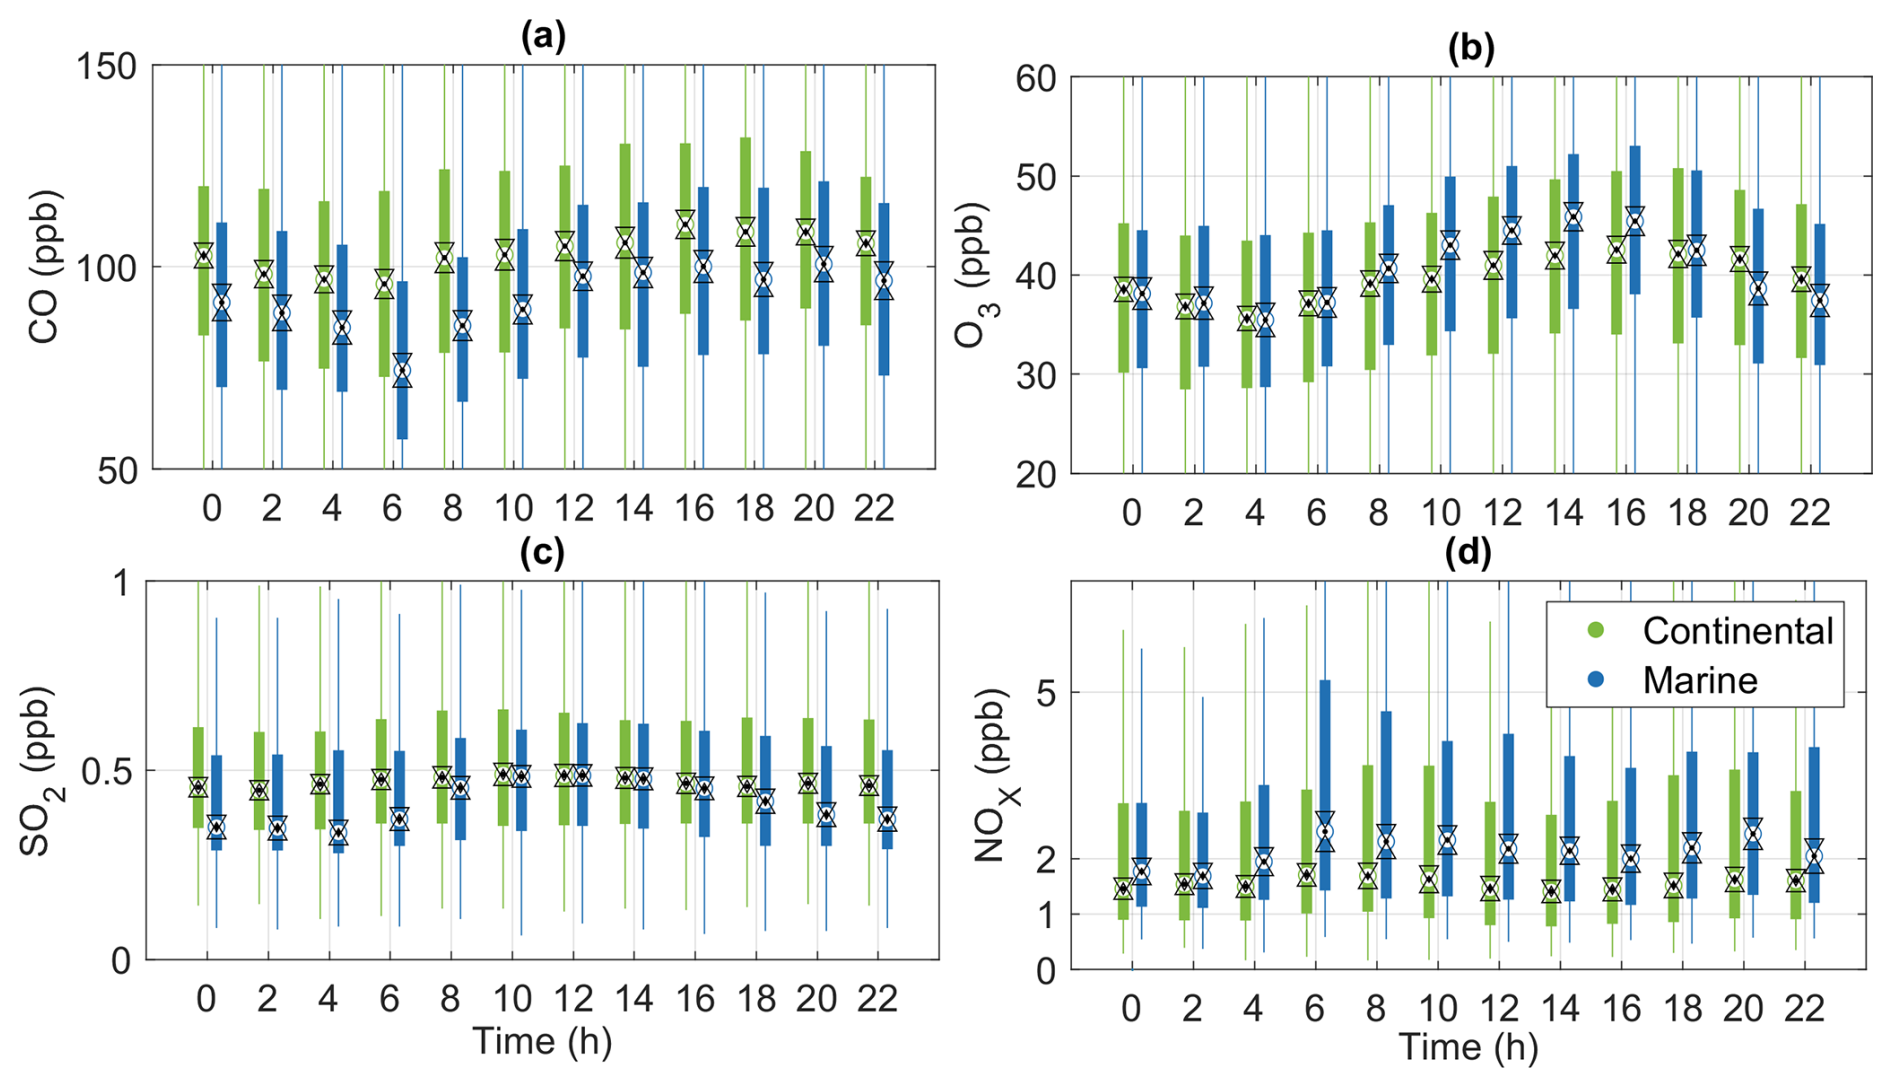
Figure B1Diurnal cycles of different trace gases in coastal and continental air. Please note that no calibration factor was applied to the NOX data due to technical difficulties. The black dots indicate the medians, the triangles indicate the confidence interval of the medians, the boxes the 25th–75th percentiles, the crosses the 10th and 90th percentiles, and the whiskers cover approximately 99.3 % of the data.
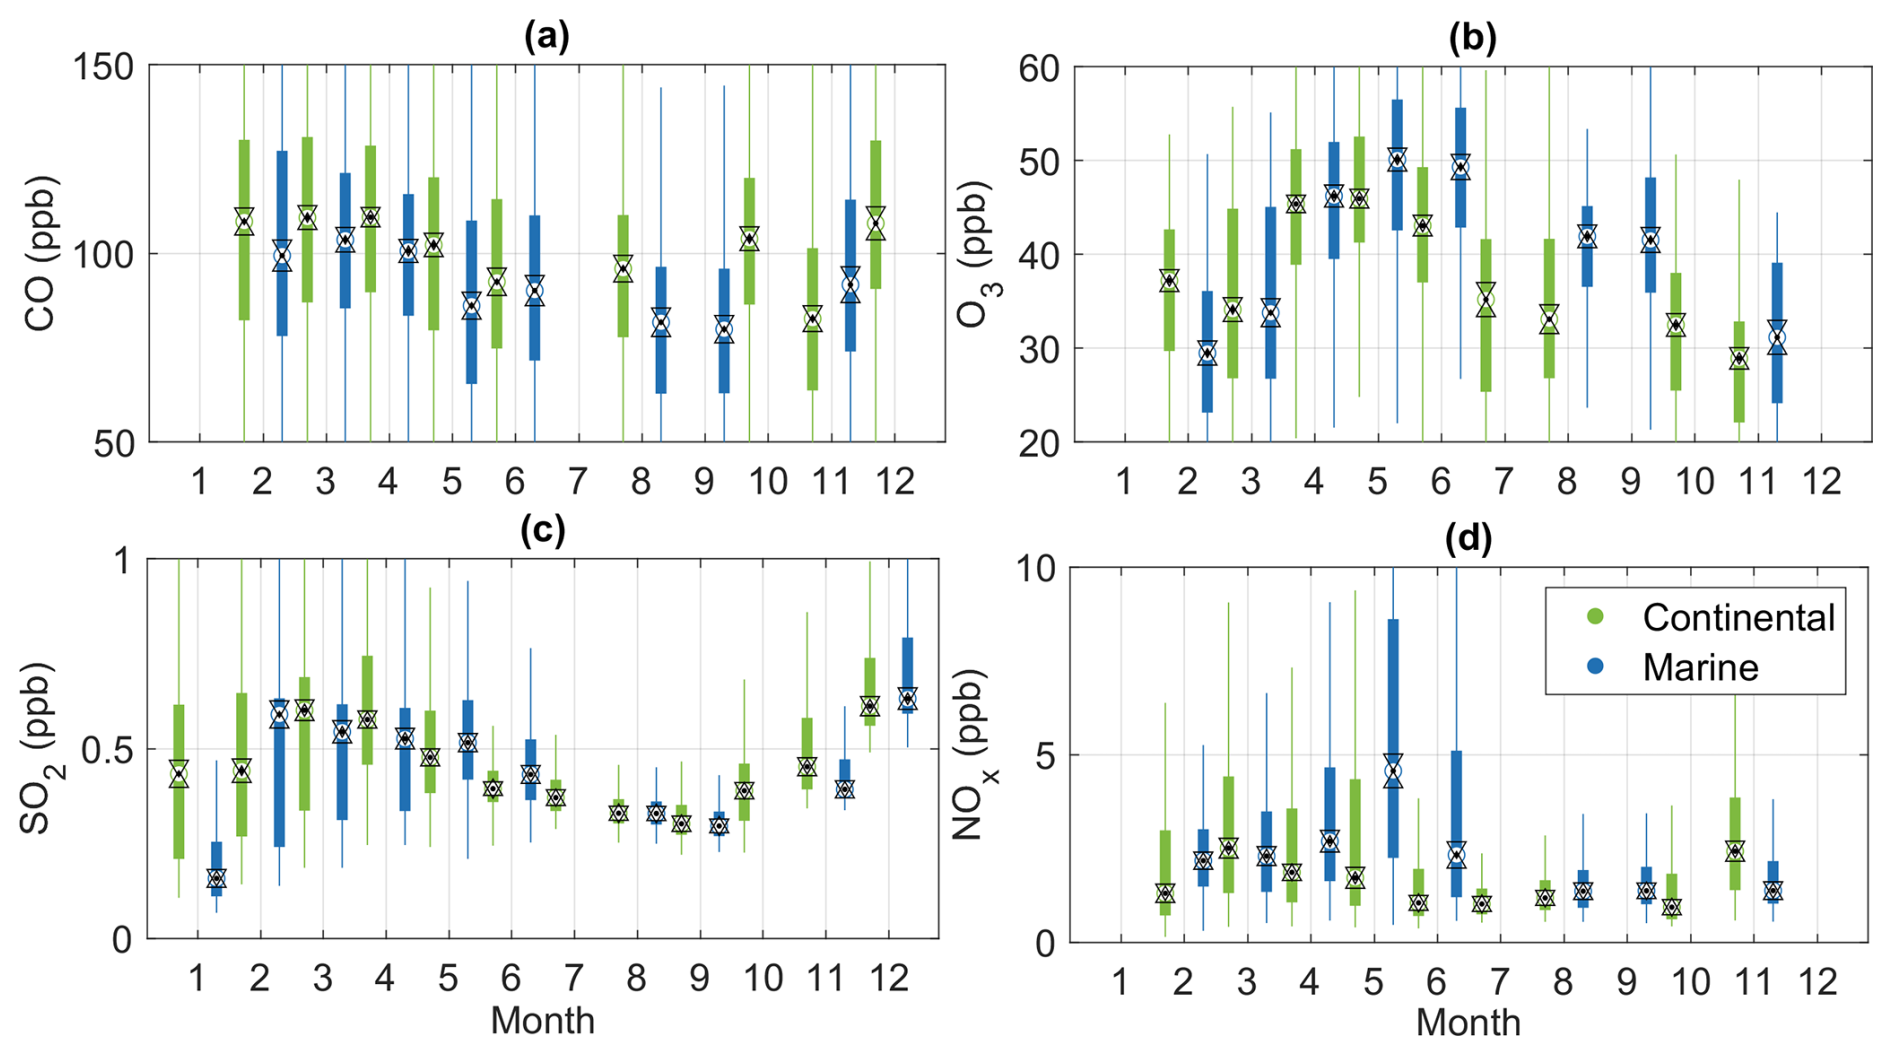
Figure B2Seasonal cycles of different trace gases in coastal and continental air. Months were included only if they had a minimum of one week of data per wind sector. Please note that no calibration factor was applied to the NOX data due to technical difficulties. The black dots indicate the medians, the triangles indicate the confidence interval of the medians, the boxes the 25th–75th percentiles, the crosses the 10th and 90th percentiles, and the whiskers cover approximately 99.3 % of the data.
The data are publicly available in Zenodo at https://doi.org/10.5281/zenodo.16693683 (Peltola et al., 2025). The code used for wind rose plots was by https://www.mathworks.com/matlabcentral/fileexchange/47248-wind-rose (Perreira, 2024).
MP conducted the data analysis and wrote the paper. MP, RT, KS, JL, SH, AV, JK, and TC were responsible for the measurements. All authors contributed to discussion of the results and provided input for the paper.
The contact author has declared that none of the authors has any competing interests.
Publisher's note: Copernicus Publications remains neutral with regard to jurisdictional claims made in the text, published maps, institutional affiliations, or any other geographical representation in this paper. The authors bear the ultimate responsibility for providing appropriate place names. Views expressed in the text are those of the authors and do not necessarily reflect the views of the publisher.
We thank the technical staff at Tvärminne Zoological Station and at INAR for assistance with instrument deployment. This is a publication from the Centre for Coastal Ecosystem and Climate Change Research (https://www.coastclim.org, last access: 6 January 2026).
This research has been supported by the Jane and Aatos Erkko Foundation (grants “CoastClim” and “REMO”), the Ella and Georg Ehrnrooth Foundation, and the Research Council of Finland flagship ACCC (grant numbers 337549, 357902, and 359340). This project has received infrastructure funding from the European Union – NextGenerationEU instrument and is funded by the Research Council of Finland under grant numbers 345510, 358647, and 367739.
Open-access funding was provided by the Helsinki University Library.
This paper was edited by Birgit Wehner and reviewed by Anna Miller and three anonymous referees.
Aalto, P., Hämeri, K., Becker, E., Weber, R., Salm, R., Mäkelä, J., Hoell, C., O'Dowd, C., Karlsson, H., Hansson, H., Väkevä, M., Koponen, I., Buzorius, G., and Kulmala, M.: Physical characterization of aerosol particles during nucleation events, Tellus, 53B, 344–358, 2001. a, b
Andersen, J. H., Carstensen, J., Conley, D. J., Dromph, K., Fleming-Lehtinen, V., Gustafsson, B. G., Josefson, A. B., Norkko, A., Villnäs, A., and Murray, C.: Long-term temporal and spatial trends in eutrophication status of the Baltic Sea, Biological Reviews, 92, 135–149, https://doi.org/10.1111/brv.12221, 2017. a
Baccarini, A., Karlsson, L., Dommen, J., Duplessis, P., Vüllers, J., Brooks, I. M., Saiz-Lopez, A., Salter, M., Tjernström, M., Baltensperger, U., Zieger, P., and Schmale, J.: Frequent new particle formation over the high Arctic pack ice by enhanced iodine emissions, Nature Communications, 11, 1–11, https://doi.org/10.1038/s41467-020-18551-0, 2020. a
Baccarini, A., Dommen, J., Lehtipalo, K., Henning, S., Modini, R. L., Gysel-Beer, M., Baltensperger, U., and Schmale, J.: Low-volatility vapors and new particle formation over the Southern Ocean during the Antarctic Circumnavigation Expedition, Journal of Geophysical Research: Atmospheres, e2021JD035126, https://doi.org/10.1029/2021JD035126, 2021. a
Beck, L. J., Sarnela, N., Junninen, H., Hoppe, C. J. M., Garmash, O., Bianchi, F., Riva, M., Rose, C., Peräkylä, O., Wimmer, D., Kausiala, O., Jokinen, T., Ahonen, L., Mikkilä, J., Hakala, J., He, X.-C., Kontkanen, J., Wolf, K. K. E., Cappelletti, D., Mazzola, M., Traversi, R., Petroselli, C., Viola, A. P., Vitale, V., Lange, R., Massling, A., Nøjgaard, J. K., Krejci, R., Karlsson, L., Zieger, P., Jang, S., Lee, K., Vakkari, V., Lampilahti, J., Thakur, R. C., Leino, K., Kangasluoma, J., Duplissy, E.-M., Siivola, E., Marbouti, M., Tham, Y. J., Saiz-Lopez, A., Petäjä, T., Ehn, M., Worsnop, D. R., Skov, H., Kulmala, M., Kerminen, V.-M., and Sipilä, M.: Differing mechanisms of new particle formation at two Arctic sites., Geophysical Research Letters, 48, e2020GL091334, https://doi.org/10.1029/2020GL091334, 2021. a
Brean, J., Dall’Osto, M., Simó, R., Shi, Z., Beddows, D., and Harrison, R. M.: Open ocean and coastal new particle formation from sulfuric acid and amines around the Antarctic Peninsula, Nature Geoscience, 14, 383–388, https://doi.org/10.1038/s41561-021-00751-y, 2021. a, b
Charlson, R. J., Lovelock, J. E., Andreae, M. O., and Warren, S. G.: Oceanic phytoplankton, atmospheric sulphur, cloud albedo and climate, Nature, 326, 655–661, https://doi.org/10.1038/326655a0, 1987. a
Chen, X., Kerminen, V.-M., Paatero, J., Paasonen, P., Manninen, H. E., Nieminen, T., Petäjä, T., and Kulmala, M.: How do air ions reflect variations in ionising radiation in the lower atmosphere in a boreal forest?, Atmospheric Chemistry and Physics, 16, 14297–14315, https://doi.org/10.5194/acp-16-14297-2016, 2016. a, b
Dada, L., Chellapermal, R., Buenrostro Mazon, S., Paasonen, P., Lampilahti, J., Manninen, H. E., Junninen, H., Petäjä, T., Kerminen, V.-M., and Kulmala, M.: Refined classification and characterization of atmospheric new-particle formation events using air ions, Atmospheric Chemistry and Physics, 18, 17883–17893, https://doi.org/10.5194/acp-18-17883-2018, 2018. a
Dal Maso, M., Kulmala, M., Riipinen, I., Wagner, R., Hussein, T., Aalto, P. P., and Lehtinen, K. E.: Formation and growth of fresh atmospheric aerosols: eight years of aerosol size distribution data from SMEAR II, Hyytiälä, Finland, Boreal Environment Research, 10, 323–336, https://doi.org/10.60910/yq6q-vj10, 2005. a, b
de Jonge, R. W., Xavier, C., Olenius, T., Elm, J., Svenhag, C., Hyttinen, N., Nieradzik, L., Sarnela, N., Kristensson, A., Petäjä, T., Ehn, M., and Roldin, P.: Natural Marine Precursors Boost Continental New Particle Formation and Production of Cloud Condensation Nuclei, Environmental Science & Technology, 58, 10956–10968, https://doi.org/10.1021/acs.est.4c01891, 2024. a
Engler, C., Lihavainen, H., Komppula, M., Kerminen, V.-M., Kulmala, M., and Viisanen, Y.: Continuous measurements of aerosol properties at the Baltic Sea, Tellus B: Chemical and Physical Meteorology, 59, 728–741, 2007. a
Furneaux, K. L., Whalley, L. K., Heard, D. E., Atkinson, H. M., Bloss, W. J., Flynn, M. J., Gallagher, M. W., Ingham, T., Kramer, L., Lee, J. D., Leigh, R., McFiggans, G. B., Mahajan, A. S., Monks, P. S., Oetjen, H., Plane, J. M. C., and Whitehead, J. D.: Measurements of iodine monoxide at a semi polluted coastal location, Atmospheric Chemistry and Physics, 10, 3645–3663, https://doi.org/10.5194/acp-10-3645-2010, 2010. a
Gallego, M. A., Timmermann, A., Friedrich, T., and Zeebe, R. E.: Drivers of future seasonal cycle changes in oceanic pCO2, Biogeosciences, 15, 5315–5327, https://doi.org/10.5194/bg-15-5315-2018, 2018. a
Garmash, O., Ezhova, E., Arshinov, M., Belan, B., Lampilahti, A., Davydov, D., Räty, M., Aliaga, D., Baalbaki, R., Chan, T., Bianchi, F., Kerminen, V.-M., Petäjä, T., and Kulmala, M.: Heatwave reveals potential for enhanced aerosol formation in Siberian boreal forest, Environmental Research Letters, 19, 014047, https://doi.org/10.1088/1748-9326/ad10d5, 2024. a
Goebeler, N., Norkko, A., and Norkko, J.: Ninety years of coastal monitoring reveals baseline and extreme ocean temperatures are increasing off the Finnish coast, Communications Earth & Environment, 3, 215, https://doi.org/10.1038/s43247-022-00545-z, 2022. a
Gordon, H., Kirkby, J., Baltensperger, U., Bianchi, F., Breitenlechner, M., Curtius, J., Dias, A., Dommen, J., Donahue, N. M., Dunne, E. M., Duplissy, J., Ehrhart, S., Flagan, R. C., Frege, C., Fuchs, C., Hansel, A., Hoyle, C. R., Kulmala, M., Kürten, A., Lehtipalo, K., Makhmutov, V., Molteni, U., Rissanen, M. P., Stozkhov, Y., Tröstl, J., Tsagkogeorgas, G., Wagner, R., Williamson, C., Wimmer, D., Winkler, P. M., Yan, C., and Carslaw, K. S.: Causes and importance of new particle formation in the present-day and preindustrial atmospheres, Journal of Geophysical Research: Atmospheres, 122, 8739–8760, https://doi.org/10.1002/2017JD026844, 2017. a
Grose, M. R., Cainey, J. M., McMinn, A., and Gibson, J. A.: Coastal marine methyl iodide source and links to new particle formation at Cape Grim during February 2006, Environmental Chemistry, 4, 172–177, 2007. a
Hamed, A., Korhonen, H., Sihto, S.-L., Joutsensaari, J., Järvinen, H., Petäjä, T., Arnold, F., Nieminen, T., Kulmala, M., Smith, J. N., Lehtinen, K. E. J., and Laaksonen, A.: The role of relative humidity in continental new particle formation, Journal of Geophysical Research: Atmospheres, 116, https://doi.org/10.1029/2010JD014186, 2011. a
He, X.-C., Tham, Y. J., Dada, L., Wang, M., Finkenzeller, H., Stolzenburg, D., Iyer, S., Simon, M., Kürten, A., Shen, J., Rörup, B., Rissanen, M., Schobesberger, S., Baalbaki, R., Wang, D. S., Koenig, T. K., Jokinen, T., Sarnela, N., Beck, L. J., Almeida, J., Amanatidis, S., Amorim, A., Ataei, F., Baccarini, A., Bertozzi, B., Bianchi, F., Brilke, S., Caudillo, L., Chen, D., Chiu, R., Chu, B., Dias, A., Ding, A., Dommen, J., Duplissy, J., Haddad, I. E., Carracedo, L. G., Granzin, M., Hansel, A., Heinritzi, M., Hofbauer, V., Junninen, H., Kangasluoma, J., Kemppainen, D., Kim, C., Kong, W., Krechmer, J. E., Kvashin, A., Laitinen, T., Lamkaddam, H., Lee, C. P., Lehtipalo, K., Leiminger, M., Li, Z., Makhmutov, V., Manninen, H. E., Marie, G., Marten, R., Mathot, S., Mauldin, R. L., Mentler, B., Möhler, O., Müller, T., Nie, W., Onnela, A., Petäjä, T., Pfeifer, J., Philippov, M., Ranjithkumar, A., Saiz-Lopez, A., Salma, I., Scholz, W., Schuchmann, S., Schulze, B., Steiner, G., Stozhkov, Y., Tauber, C., Tomé, A., Thakur, R. C., Väisänen, O., Vazquez-Pufleau, M., Wagner, A. C., Wang, Y., Weber, S. K., Winkler, P. M., Wu, Y., Xiao, M., Yan, C., Ye, Q., Ylisirniö, A., Zauner-Wieczorek, M., Zha, Q., Zhou, P., Flagan, R. C., Curtius, J., Baltensperger, U., Kulmala, M., Kerminen, V.-M., Kurtén, T., Donahue, N. M., Volkamer, R., Kirkby, J., Worsnop, D. R., and Sipilä, M.: Role of iodine oxoacids in atmospheric aerosol nucleation, Science, 371, 589–595, https://doi.org/10.1126/science.abe0298, 2021. a
Holloway, T., Levy, H., and Kasibhatla, P.: Global distribution of carbon monoxide, Journal of Geophysical Research: Atmospheres, 105, 12123–12147, 2000. a
Honkanen, M., Aurela, M., Hatakka, J., Haraguchi, L., Kielosto, S., Mäkelä, T., Seppälä, J., Siiriä, S.-M., Stenbäck, K., Tuovinen, J.-P., Ylöstalo, P., and Laakso, L.: Interannual and seasonal variability of the air–sea CO2 exchange at Utö in the coastal region of the Baltic Sea, Biogeosciences, 21, 4341–4359, https://doi.org/10.5194/bg-21-4341-2024, 2024. a
Hyvärinen, A.-P., Komppula, M., Engler, C., Kivekäs, N., Kerminen, V.-M., Dal Maso, M., Viisanen, Y., and Lihavainen, H.: Atmospheric new particle formation at Utö, Baltic Sea 2003-2005, Tellus B: Chemical and Physical Meteorology, 60, 345–352, 2008. a, b
Jokinen, T., Sipilä, M., Kontkanen, J., Vakkari, V., Tisler, P., Duplissy, E.-M., Junninen, H., Kangasluoma, J., Manninen, H. E., Petäjä, T., Kulmala, M., Worsnop, D. R., Kirkby, J., Virkkula, A., and Kerminen, V.-M.: Ion-induced sulfuric acid–ammonia nucleation drives particle formation in coastal Antarctica, Science Advances, 4, eaat9744, https://doi.org/10.1126/sciadv.aat9744, 2018. a
Järvi, J., Hannuniemi, H., Hussein, T., Junninen, H., Aalto, P. P., Hillamo, R., Mäkelä, T., Keronen, P., Siivola, E., Vesala, T., and Kulmala, M.: The urban measurement station SMEAR III: Continuous monitoring of air pollution and surface–atmosphere interactions in Helsinki, Finland, Boreal Environment Research, 14, 86–109, https://doi.org/10.60910/bg74-fbgh, 2009. a, b, c
Kangasluoma, J., Cai, R., Jiang, J., Deng, C., Stolzenburg, D., Ahonen, L. R., Chan, T., Fu, Y., Kim, C., Laurila, T. M., Zhou, Y., Dada, L., Sulo, J., Flagan, R. C., Kulmala, M., Petäjä, T., and Lehtipalo, K.: Overview of measurements and current instrumentation for 1–10 nm aerosol particle number size distributions, Journal of Aerosol Science, 148, 105584, https://doi.org/10.1016/j.jaerosci.2020.105584, 2020. a
Karppinen, T., Sundström, A.-M., Lindqvist, H., Hatakka, J., and Tamminen, J.: Satellite-based assessment of national carbon monoxide concentrations for air quality reporting in Finland, Remote Sensing Applications: Society and Environment, 33, 101120, https://doi.org/10.1016/j.rsase.2023.101120, 2024. a
Ke, P., Lintunen, A., Kolari, P., Lohila, A., Tuovinen, S., Lampilahti, J., Thakur, R., Peltola, M., Peräkylä, O., Nieminen, T., Ezhova, E., Pihlatie, M., Laasonen, A., Koskinen, M., Rautakoski, H., Heimsch, L., Kokkonen, T., Vähä, A., Mammarella, I., Noe, S., Bäck, J., Kerminen, V.-M., and Kulmala, M.: Potential of carbon uptake and local aerosol production in boreal and hemi-boreal ecosystems across Finland and in Estonia, Biogeosciences, 22, 3235–3251, https://doi.org/10.5194/bg-22-3235-2025, 2025. a
Kerminen, V.-M., Chen, X., Vakkari, V., Petäjä, T., Kulmala, M., and Bianchi, F.: Atmospheric new particle formation and growth: review of field observations, Environmental Research Letters, 13, 103003, https://doi.org/10.1088/1748-9326/aadf3c, 2018. a
Komppula, M., Vana, M., Kerminen, V.-M., Lihavainen, H., Viisanen, Y., Horrak, U., Komsaare, K., Tamm, E., Hirsikko, A., Laakso, L., and Kulmala, M.: Size distributions of atmospheric ions in the Baltic Sea region, Boreal Environment Research, 12, 323–336, https://doi.org/10.60910/nhm3-7nan, 2007. a
Kulmala, M., Maso, M. D., Mäkelä, J., Pirjola, L., Väkevä, M., Aalto, P., Miikkulainen, P., Hämeri, K., and O’dowd, C.: On the formation, growth and composition of nucleation mode particles, Tellus B: Chemical and Physical Meteorology, 53, 479–490, https://doi.org/10.3402/tellusb.v53i4.16622, 2001. a
Kulmala, M., Ezhova, E., Kalliokoski, T., Noe, S., Vesala, T., Lohila, A., Liski, J., Makkonen, R., Bäck, J., Petäjä, T., and Kerminen, V.-M.: CarbonSink+-Accounting for multiple climate feedbacks from forests, Boreal Environment Research, 25, https://doi.org/10.60910/3cq2-n4tw, 2020. a
Kulmala, M., Ke, P., Lintunen, A., Peräkylä, O., Lohtander, A., Tuovinen, S., Lampilahti, J., Kolari, P., Schiestl-Aalto, P., Kokkonen, T., Nieminen, T., Dada, L., Ylivinkka, I., Petäjä, T., Bäck, J., Lohila, A., Heimsch, L., Ezhova, E., and Kerminen, V.-M.: A novel concept for assessing the potential of different boreal ecosystems to mitigate climate change (CarbonSink+ Potential), Boreal Environment Research, 29, 1–16, https://doi.org/10.60910/emwe-cqhf, 2024. a, b
Lehmann, A. and Myrberg, K.: Upwelling in the Baltic Sea–A review, Journal of Marine Systems, 74, S3–S12, https://doi.org/10.1016/j.jmarsys.2008.02.010, 2008. a
Lyubovtseva, Y. S., Sogacheva, L., Dal Maso, M., Bonn, B., Keronen, P., and Kulmala, M.: Seasonal variations of trace gases, meteorological parameters, and formation of aerosols in boreal forests, Boreal Environment Research, 10, 493–510, https://doi.org/10.60910/a04q-f551, 2005. a, b
Manninen, H. E., Petäjä, T., Asmi, E., Riipinen, I., Nieminen, T., MikkiIä, J., Hõrrak, U., Mirme, A., Mirme, S., Laakso, L., Kerminen, V.-M., and Kulmala, M.: Long-term field measurements of charged and neutral clusters using Neutral cluster and Air Ion Spectrometer (NAIS), Boreal Environment Research, 14, 591–605, https://doi.org/10.60910/aga2-4j77, 2009. a
Masson-Delmotte, V., Zhai, P., Pirani, A., Connors, S., Péan, C., Berger, S., Caud, N., Chen, Y., Goldfarb, L., Gomis, M., Huang, M., Leitzell, K., Lonnoy, E., Matthews, J., Maycock, T., Waterfield, T., Yelekçi, O., Yu, R., and Zhou, B.: Climate Change 2021: The Physical Science Basis. Contribution of Working Group I to the Sixth Assessment Report of the Intergovernmental Panel on Climate Change, edited by: Masson-Delmotte, V., Zhai, P., Pirani, A., Connors, S. L., Péan, C., Berger, S., Caud, N., Chen, Y., Goldfarb, L., Gomis, M. I., Gomis, M. I., Huang, M., Leitzell, K., Lonnoy, E., Matthews, J. B. R., Maycock, T. K., Waterfield, T., Yelekçi, O., Yu, R., and Zhou, B., https://doi.org/10.1017/9781009157896, 2021. a
Mayer, K. J., Wang, X., Santander, M. V., Mitts, B. A., Sauer, J. S., Sultana, C. M., Cappa, C. D., and Prather, K. A.: Secondary marine aerosol plays a dominant role over primary sea spray aerosol in cloud formation, ACS Central Science, 6, 2259–2266, https://doi.org/10.1021/acscentsci.0c00793, 2020. a
McFiggans, G., Coe, H., Burgess, R., Allan, J., Cubison, M., Alfarra, M. R., Saunders, R., Saiz-Lopez, A., Plane, J. M. C., Wevill, D., Carpenter, L., Rickard, A. R., and Monks, P. S.: Direct evidence for coastal iodine particles from Laminaria macroalgae – linkage to emissions of molecular iodine, Atmospheric Chemistry and Physics, 4, 701–713, https://doi.org/10.5194/acp-4-701-2004, 2004. a
Mirme, S. and Mirme, A.: The mathematical principles and design of the NAIS – a spectrometer for the measurement of cluster ion and nanometer aerosol size distributions, Atmospheric Measurement Techniques, 6, 1061–1071, https://doi.org/10.5194/amt-6-1061-2013, 2013. a
Nieminen, T., Asmi, A., Dal Maso, M., Aalto, P. P., Keronen, P., Petäjä, T., Kulmala, M., and Kerminen, V.-M.: Trends in atmospheric new-particle formation: 16 years of observations in a boreal-forest environment, Boreal Environmental Research, 19, 191–214, http://hdl.handle.net/10138/165199, 2014. a, b
O'Connor, T., Jennings, S., and O'Dowd, C.: Highlights of fifty years of atmospheric aerosol research at Mace Head, Atmospheric Research, 90, 338–355, https://doi.org/10.1016/j.atmosres.2008.08.014, 2008. a
O'Dowd, C., Monahan, C., and Dall'Osto, M.: On the occurrence of open ocean particle production and growth events, Geophysical Research Letters, 37, https://doi.org/10.1029/2010GL044679, 2010. a
Peltola, M., Rose, C., Trueblood, J. V., Gray, S., Harvey, M., and Sellegri, K.: New particle formation in coastal New Zealand with a focus on open-ocean air masses, Atmospheric Chemistry and Physics, 22, 6231–6254, https://doi.org/10.5194/acp-22-6231-2022, 2022. a, b
Peltola, M., Thakur, R., Spence, K., Lampilahti, J., Mäkelä, R., Karttunen, S., Ezhova, E., Haapanala, S., Vähä, A., Kangasluoma, J., Chan, T., Paasonen, P., Norkko, J., Norkko, A., Kulmala, M., and Ehn, M.: Dataset for Measurement report: New particle formation and aerosol properties at a newly founded atmospheric observatory at the Finnish Baltic Sea coast, Zenodo [data set], https://doi.org/10.5281/zenodo.16693683, 2025. a
Perreira, D.: Wind Rose, https://www.mathworks.com/matlabcentral/fileexchange/47248-wind-rose (last access: 30 July 2024), 2024. a
Quinn, P. and Bates, T.: The case against climate regulation via oceanic phytoplankton sulphur emissions, Nature, 480, 51, https://doi.org/10.1038/nature10580, 2011. a
Räty, M., Sogacheva, L., Keskinen, H.-M., Kerminen, V.-M., Nieminen, T., Petäjä, T., Ezhova, E., and Kulmala, M.: Dynamics of aerosol, humidity, and clouds in air masses travelling over Fennoscandian boreal forests, Atmospheric Chemistry and Physics, 23, 3779–3798, https://doi.org/10.5194/acp-23-3779-2023, 2023. a
Regayre, L. A., Schmale, J., Johnson, J. S., Tatzelt, C., Baccarini, A., Henning, S., Yoshioka, M., Stratmann, F., Gysel-Beer, M., Grosvenor, D. P., and Carslaw, K. S.: The value of remote marine aerosol measurements for constraining radiative forcing uncertainty, Atmospheric Chemistry and Physics, 20, 10063–10072, https://doi.org/10.5194/acp-20-10063-2020, 2020. a
Riuttanen, L., Hulkkonen, M., Dal Maso, M., Junninen, H., and Kulmala, M.: Trajectory analysis of atmospheric transport of fine particles, SO2, NOx and O3 to the SMEAR II station in Finland in 1996–2008, Atmos. Atmospheric Chemistry and Physics, 13, 2153–2164, https://doi.org/10.5194/acp-13-2153-2013, 2013. a, b, c, d, e, f, g, h, i
Rolph, G., Stein, A., and Stunder, B.: Real-time environmental applications and display system: READY, Environmental Modelling & Software, 95, 210–228, https://doi.org/10.1016/j.envsoft.2017.06.025, 2017. a
Rosenfeld, D., Zhu, Y., Wang, M., Zheng, Y., Goren, T., and Yu, S.: Aerosol-driven droplet concentrations dominate coverage and water of oceanic low-level clouds, Science, 363, https://doi.org/10.1126/science.aav0566, 2019. a
Roth, F., Sun, X., Geibel, M. C., Prytherch, J., Brüchert, V., Bonaglia, S., Broman, E., Nascimento, F., Norkko, A., and Humborg, C.: High spatiotemporal variability of methane concentrations challenges estimates of emissions across vegetated coastal ecosystems, Global Change Biology, 28, 4308–4322, https://doi.org/10.1111/gcb.16177, 2022. a
Schmale, J., Zieger, P., and Ekman, A. M.: Aerosols in current and future Arctic climate, Nature Climate Change, 11, 95–105, https://doi.org/10.1038/s41558-020-00969-5, 2021. a
Sipilä, M., Sarnela, N., Jokinen, T., Henschel, H., Junninen, H., Kontkanen, J., Richters, S., Kangasluoma, J., Franchin, A., Peräkylä, O., Rissanen, M. P., Ehn, M., Vehkamäki, H., Kurten, T., Berndt, T., Petäjä, T., Worsnop, D., Ceburnis, D., Kerminen, V.-M., Kulmala, M., and O’Dowd, C.: Molecular-scale evidence of aerosol particle formation via sequential addition of HIO3, Nature, 537, 532–534, https://doi.org/10.1038/nature19314, 2016. a, b
Stein, A., Draxler, R. R., Rolph, G. D., Stunder, B. J., Cohen, M., and Ngan, F.: NOAA’s HYSPLIT atmospheric transport and dispersion modeling system, Bulletin of the American Meteorological Society, 96, 2059–2077, https://doi.org/10.1175/BAMS-D-14-00110.1, 2015. a
Stolzenburg, D., Fischer, L., Vogel, A. L., Heinritzi, M., Schervish, M., Simon, M., Wagner, A. C., Dada, L., Ahonen, L. R., Amorim, A., Baccarini, A., Bauer, P. S., Baumgartner, B., Bergen, A., Bianchi, F., Breitenlechner, M., Brilke, S., Mazon, S. B., Chen, D., Dias, A., Draper, D. C., Duplissy, J., Haddad, I. E., Finkenzeller, H., Frege, C., Fuchs, C., Garmash, O., Gordon, H., He, X., Helm, J., Hofbauer, V., Hoyle, C. R., Kim, C., Kirkby, J., Kontkanen, J., Kürten, A., Lampilahti, J., Lawler, M., Lehtipalo, K., Leiminger, M., Mai, H., Mathot, S., Mentler, B., Molteni, U., Nie, W., Nieminen, T., Nowak, J. B., Ojdanic, A., Onnela, A., Passananti, M., Petäjä, T., Quéléver, L. L. J., Rissanen, M. P., Sarnela, N., Schallhart, S., Tauber, C., Tomé, A., Wagner, R., Wang, M., Weitz, L., Wimmer, D., Xiao, M., Yan, C., Ye, P., Zha, Q., Baltensperger, U., Curtius, J., Dommen, J., Flagan, R. C., Kulmala, M., Smith, J. N., Worsnop, D. R., Hansel, A., Donahue, N. M., and Winkler, P. M.: Rapid growth of organic aerosol nanoparticles over a wide tropospheric temperature range, Proceedings of the National Academy of Sciences, 115, 9122–9127, https://doi.org/10.1073/pnas.1807604115, 2018. a
Sulo, J., Lampilahti, J., Chen, X., Kontkanen, J., Nieminen, T., Kerminen, V.-M., Petäjä, T., Kulmala, M., and Lehtipalo, K.: Measurement report: Increasing trend of atmospheric ion concentrations in the boreal forest, Atmospheric Chemistry and Physics, 22, 15223–15242, https://doi.org/10.5194/acp-22-15223-2022, 2022. a, b
Tammelin, B., Vihma, T., Atlaskin, E., Badger, J., Fortelius, C., Gregow, H., Horttanainen, M., Hyvönen, R., Kilpinen, J., Latikka, J., Ljungberg, K., Mortensen, N. G., Niemelä, S., Ruosteenoja, K., Salonen, K., Suomi, I., and Venäläinen, A.: Production of the Finnish wind atlas, Wind Energy, 16, 19–35, https://doi.org/10.1002/we.517, 2013. a
Thakur, R. C., Dada, L., Beck, L. J., Quéléver, L. L. J., Chan, T., Marbouti, M., He, X.-C., Xavier, C., Sulo, J., Lampilahti, J., Lampimäki, M., Tham, Y. J., Sarnela, N., Lehtipalo, K., Norkko, A., Kulmala, M., Sipilä, M., and Jokinen, T.: An evaluation of new particle formation events in Helsinki during a Baltic Sea cyanobacterial summer bloom, Atmospheric Chemistry and Physics, 22, 6365–6391, https://doi.org/10.5194/acp-22-6365-2022, 2022. a
Thakur, R. C., Peltola, M., Spence, K., Vähä, A., Haapanala, S., Ke, P., Ezhova, E., Hellen, H., Geilfus, N.-X., Chan, T., Norkko, J., Mammarella, I., Ehn, M., Norkko, A., and Kulmala, M.: Coastal-SMEAR – introduction to infrastructure and capacity of the atmospheric observatory in Tvärminne, Finland, Boreal Env. Res., 30, 195–219, https://doi.org/10.60910/ber2025.7rkh-0d75, 2025. a
Tuovinen, S., Lampilahti, J., Kerminen, V.-M., and Kulmala, M.: Intermediate ions as indicator for local new particle formation, Aerosol Research, 2, 93–105, https://doi.org/10.5194/ar-2-93-2024, 2024. a, b
Zheng, G., Kuang, C., Uin, J., Watson, T., and Wang, J.: Large contribution of organics to condensational growth and formation of cloud condensation nuclei (CCN) in the remote marine boundary layer, Atmospheric Chemistry and Physics, 20, 12515–12525, https://doi.org/10.5194/acp-20-12515-2020, 2020. a
Zheng, G., Wang, Y., Wood, R., Jensen, M. P., Kuang, C., McCoy, I. L., Matthews, A., Mei, F., Tomlinson, J. M., Shilling, J. E., Zawadowicz, M. A., Crosbie, E., Moore, R., Ziemba, L., Andreae, M. O., and Wang, J.: New particle formation in the remote marine boundary layer, Nature Communications, 12, 1–10, https://doi.org/10.1038/s41467-020-20773-1, 2021. a, b, c