the Creative Commons Attribution 4.0 License.
the Creative Commons Attribution 4.0 License.
Investigation of aerosol transport flux structure over Beijing based on lidar observations and the impact of dust transport on air quality
Zhengguo Tian
Si Liu
Cheng Yao
Tong Lu
Weijie Zou
Zhenping Yin
Bin Zhang
Daru Chen
Zhichao Bu
Yubao Chen
Xuan Wang
The origins, spatial distribution, and diffusion mechanisms of aerosols hold practical guiding significance for regional haze governance. The vertical and horizontal fluxes of aerosols serve as effective parameters for assessing the diffusion efficiency of aerosols, but they are less exploited due to insufficient observations. This study uses polarization lidar to differentiate between the aerosol sources of dust and non-dust and to estimate the mass concentration profiles of each. Combining the wind profiles acquired from Doppler wind lidar, the vertical and horizontal fluxes profiles of two type aerosols are calculated. This approach is designed to account for the influence of local aerosol transport mechanisms on air pollution, enabling a more precise reflection of the internal variations within a particular region. A winter haze event in Beijing from 2–4 November 2023 was analyzed to distinguish the vertical distribution of and mass concentration and fluxes of aerosols brought by dust transported from the northwest monsoon and those from anthropogenic emissions within the North China plain area. Further analysis of different wind zones revealed that the aerosol concentration and fluxes from urban areas (regions with a higher density of anthropogenic sources) can be used to assess the local pollutant diffusion capacity, as well as the influence of vertical turbulence on ground PM10 concentrations. Taking Beijing as an example, this study investigated the diffusion characteristics of urban aerosols, ultimately providing technical means and data references for early warning of urban air pollution and assessment of air pollution control measures.
- Article
(5528 KB) - Full-text XML
- BibTeX
- EndNote
Atmospheric particulate matter or aerosols are fine solid or liquid particles that come from direct emissions or secondary conversion of gas – particulate matter and can suspend in the air. Atmospheric particulate matter pollution is one of the issues that the whole world pays attention to, and there is sufficient evidence showing that it has adverse impacts on human daily life and health (Brunekreef and Holgate, 2002). Anthropogenic aerosol emissions are one of the primary sources of air pollution. Klimont et al. (2017) estimated that the global anthropogenic total emissions of PM2.5 in 2010 were approximately 80 million t, among which anthropogenic combustion aerosols (including transportation and industrial emissions) accounted for more than 80 % (Klimont et al., 2017). China, with its vast territory, high population density and rapid economic development, has inevitably produced a large amount of anthropogenic aerosols during its development process, which has had a significant impact on air quality in East Asia. Since 2013, China has dedicated substantial efforts to air pollution governance and has promulgated numerous measures for managing and controlling aerosol emissions in cities (The State Council of the People's Republic of China, 2013; Geng et al., 2019). Nevertheless, these measures are primarily centered on the overall supervision of emission volumes. There exists an absence of a holistic approach to address various aspects of aerosol emissions, including the temporal dynamics, spatial patterns, dispersion processes, and the principal determinants that significantly contribute to air pollution. As a result, it remains challenging to establish an accurate and timely early warning system. Consequently, research on the emission and diffusion mechanisms of urban anthropogenic aerosols holds significant practical guiding value for the effective formulation and evaluation of emission policies.
Aerosols can be lifted from the Earth's surface into the atmosphere due to factors such as deep convection, frontal passages, and turbulence within the atmospheric boundary layer (Chen et al., 2012). This vertical transport mechanism is crucial for the initial step of regional-to-intercontinental transport. It is also of great significance for gaining an in-depth understanding of the frequent occurrence of long-duration and large-scale air pollution in China, as well as for improving urban air quality across the country. For example, it has revealed a new mechanism by which severe haze pollution in the Beijing-Tianjin-Hebei and Yangtze River Delta urban agglomerations during autumn and winter is intensified through mutual interaction and long-distance transport (Huang et al., 2020). Meanwhile, this can provide new insights for mitigating regional-scale mutual influences, thereby achieving scientific and precise haze control.
Atmospheric pollution in urban areas is mainly caused by anthropogenic emissions, including vehicle exhaust emissions, industrial emissions, and the combustion of carbon substances in daily life. Therefore, anthropogenic aerosols in urban areas can serve as an “emission indicator” for air pollution sources, which can be used to evaluate the effectiveness of air pollution reduction and air quality management measures. In the causes of air pollution, in addition to pollutant emission sources, the atmospheric planetary boundary layer height (PBLH) also plays an important role in controlling the temporal and spatial variations of pollutant concentrations (Ding et al., 2015). In most cases, anthropogenic air pollutants emitted from the surface are confined within the atmospheric planetary boundary layer, and their vertical mixing height directly determines the vertical mixing space of pollutants (Lou et al., 2019; Gerbig et al., 2008).
The interaction between vertical atmospheric pollution and the atmospheric boundary layer feedback process is an important factor in enhancing the transport of pollution between regions. The vertical flux of atmospheric aerosols is a key physical quantity used to quantitatively characterize the net transport of aerosols in the vertical direction per unit area and per unit time. It connects surface processes, boundary layer turbulence, aerosol cycling, and meteorological conditions. Its core significance lies in quantifying the intensity and direction of aerosol transport in the vertical direction, thereby revealing the source and sink mechanisms of aerosols, their diffusion capabilities, and regional environmental impacts (Huang et al., 2024). Therefore, accurately assessing aerosol fluxes depends on the characteristics of the aerosol sources, the regional features, and the meteorological conditions within the atmospheric boundary layer. As Huang et al. (2020) demonstrated, aerosols themselves, especially light-absorbing components such as black carbon, can significantly influence the boundary layer structure through Aerosol-Boundary Layer Interaction (ABI), and amplify the accumulation and transport processes of regional pollutants (Huang et al., 2020). Due to the complexity and nonlinearity of the causes of atmospheric compound pollution under China's unique environmental conditions (Lv et al., 2017), more stringent requirements are placed on detection tools and methods in aerosol flux research. Typically, a comprehensive assessment of aerosol flux necessitates the employment of a combination of various methodologies and technologies, encompassing ground-based observations and vertical stereo-detection techniques. Moreover, it is difficult to estimate the emission of particulate matter and the capacity of dry deposition at the surface to remove particulate matter from the air, which makes it impossible to parameterize these processes for application in atmospheric numerical simulation techniques.
Horizontal transport caused by wind speed and wind direction is also an important factor restricting the mixing space of pollutants (Weissmann et al., 2005; Wang et al., 2009; Tian et al., 2020; Zhang et al., 2020; Hu et al., 2022; Lin et al., 2023). However, in the actual assessment and prediction of air pollution, it is difficult to consider the three factors of emission volume, atmospheric boundary layer, and dominant wind speed in a coordinated manner. Consequently, the horizontal flux can offer crucial insights into the horizontal transport of aerosol sources within cities and the net emissions resulting from external sources. For example, the lidar observations in Singapore (Huang et al., 2024) have shown that cross-border haze originating from biomass burning in Indonesia is transported via the nocturnal low-level jet. During the development of the daytime boundary layer, it is entrained to the ground surface, leading to a 500 % increase in the local PM2.5 concentration (Huang et al., 2024). Conversely, the findings of Zhang et al. (2015) suggest that the prevailing wind exerts a substantial influence on the pollution concentration in cities. For instance, the northerly wind is correlated with relatively lower pollutant concentrations in Beijing (Zhang et al., 2015).
Over the past two decades, many scholars have attempted to use different observation methods to conduct targeted studies on the sources, diffusion mechanisms, spatial distribution, and other important influencing factors of particulate matter pollution (Tanaka et al., 2005; Weissmann et al., 2005; Van Donkelaar et al., 2016; Huang et al., 2024). In the field campaigns of aerosol observation techniques, in-situ continuous monitoring remains one of the principal detection approaches. Its advantage is the ability to provide a high temporal resolution and straightforward aerosol mass concentration data. In-situ sampling monitoring can not only offer a relatively comprehensive understanding of aerosol characteristics but also be utilized to analyze the composition of particulate matter. Additionally, a network of such sampling points can be established for research on regional near-surface particulate matter emissions (Liu and Daum, 2000; Drinovec et al., 2015). Currently, numerous methods for measuring the surface–atmosphere exchange processes of aerosols have been developed (Pryor et al., 2008). Among these, the most representative, direct, and productive systematic observational instruments and data analysis techniques for aerosol fluxes are associated with the European ACTRIS (Aerosol, Cloud and Trace Gases Research Infrastructure) program. It is important to note that while eddy-covariance measurements for aerosols are not a standard component of the ACTRIS core program, they are occasionally conducted as research activities at some ACTRIS sites. For example, such measurements can be performed by combining ultrasonic anemometers and particle size spectrometers on meteorological towers to obtain single-point aerosol fluxes. However, this approach can only represent relatively small areas. However, this approach can only represent relatively small areas. As a result, when applying the aerosol flux results to mesoscale circulation models, significant uncertainties may occur (Chen et al., 2008). Consequently, there is an urgent demand for vertical profile observations of aerosol fluxes that span the entire atmospheric boundary layer.
In recent years, remote sensing technology, particularly lidar, has become a powerful tool for aerosol research due to its high spatiotemporal resolution and detection sensitivity (Li et al., 2019; Lopatin et al., 2013; Che et al., 2019; Wang et al., 2019a, b; Weinzierl et al., 2011; Denjean et al., 2016; Córdoba-Jabonero et al., 2018). Unlike passive sensors, lidar systems actively probe the atmosphere and can retrieve vertically resolved aerosol properties – such as depolarization ratio, extinction coefficient, and mass concentration – along with wind field information within the planetary boundary layer (PBL) (Müller et al., 2001; Böckmann et al., 2005; Mamouri and Ansmann, 2014). The combination of multi-wavelength polarization Raman lidar and Doppler lidar offers a particularly advanced approach for quantifying aerosol fluxes. The pioneering work successfully demonstrated the application of the eddy covariance technique by combining Doppler wind lidar and Raman aerosol lidar to retrieve vertical aerosol flux profiles, validating the core methodology of synergistic lidar observations (Wandinger et al., 2004). By leveraging covariance algorithms and co-located measurements of aerosol properties and 3D wind vectors, this synergistic technique enables direct estimation of both vertical and horizontal aerosol transport with high accuracy (Engelmann et al., 2008; Huang et al., 2024). Thus, the integration of these lidar technologies provides a feasible and robust method for studying aerosol fluxes within the atmospheric boundary layer. However, most of the current detection methods and contents have the following deficiencies: Insufficient detection methods and research on anthropogenic aerosol emissions. Most of the current flux research methods use in-situ or passive remote sensing observations (e.g. Yuan et al., 2019; Conte et al., 2021; Casquero-Vera et al., 2022; Hu et al., 2022), lacking high-resolution vertical spatial scale variation results, and rarely estimating natural and anthropogenic aerosols (dust and anthropogenic emissions) separately; Insufficient consideration of regional meteorological conditions on the concentration of atmospheric pollutants, it is necessary to consider the impact of both horizontal and vertical mixing on air pollution; Currently, there is a lack of effective quantitative assessment of the sources and sinks (accumulation and removal rates) of atmospheric pollutants. Most importantly, urban aerosol fluxes largely depend on site characteristics, so more urban particulate matter flux data from different cities are needed to fully understand the role of urban pollution sources and their spatial variability.
This paper focuses on an air pollution event in Beijing during winter and conducts a detailed analysis of the impact of wind direction shear on aerosol transport within a short period of time. Polarization lidar and Doppler wind profile lidar were used to obtain the vertical and horizontal aerosol mass concentration flux profiles to consider the influence of local aerosol transport mechanisms on air pollution. Although only one special case is selected in this study, it represents a complete and typical pollution cycle driven by the complex interplay of meteorological factors and boundary layer dynamics, which constitutes the core focus of our research. This case is possible to elucidate the fundamental mechanisms governing aerosol transport under the typical monsoon during winter over the North China Plain. The observation results can be used to accurately reflect the internal changes in a specific area, and ultimately provide technical means and data references for early warning of urban air pollution and assessment of air pollution control measures, such as in large cities like Beijing. The northwest of Beijing is mountainous, and the southeast is a plain. The plain slopes gently from northwest to southeast, with the height gradually decreasing. Due to the influence of topography and climate, a large amount of air pollutants is not only emitted in the urban area of Beijing, but also in the suburbs, rural areas, and surrounding cities. The mutual exchange of air pollutants among these cities makes the understanding of the formation of air pollution and the formulation of control strategies more complex. As a hot spot representative of the central area of the Beijing–Tianjin–Hebei region, the emission characteristics and meteorological conditions of the urban area of Beijing are different from those of other urban agglomerations. Therefore, the aerosol flux may differ from the observation results of other urban agglomerations.
2.1 Doppler wind lidar
Wind lidar is the most effective method for global wind field information detection and can also obtain wind field information within the three-dimensional profile. In this study, a Doppler wind lidar system was used to monitor the vertical profile of the wind field. The detection range of this system is 3000 m, with a distance resolution of 50 m and a time resolution of 1 min. During the long-term observation period, the lidar system was set to the velocity azimuth display (VAD) scanning mode, with a fixed elevation angle of 60°, an azimuth range of 0 to 300°, a scanning interval of 5°, and a total of 60 radial profiles were obtained for each scanning circle, lasting for 135 s. Then, based on the assumption of a horizontally uniform wind field, the horizontal wind speed, wind direction, and vertical wind speed were extracted from the measured radial velocities at different azimuth angles (Smalikho, 2003; Banakh and Smalikho, 2013). Due to physical obstructions at the instrument site, the laser transmission and reception path of the lidar was partially blocked by nearby structures, making effective detection impossible within the 300 to 360° sector. However, the absence of data from a 60° sector has a negligible impact on the accuracy of the wind profile retrieval-the uncertainty. Consequently, the calculated horizontal aerosol fluxes are not significantly affected.
2.2 Raman–Mie scattering aerosol LiDAR (REAL)
REAL is a single-wavelength polarized Raman–Mie scattering aerosol lidar with a wavelength of 532 nm, featuring a groundbreaking design that achieves a near-surface blind zone of less than 50 m – significantly below the industry-typical blind zone of over 100 m– which provides a crucial advantage for high-precision joint analysis with ground-based observational data. The system's receiver is equipped with six channels, among which the core channels include the 532 nm parallel polarization channel (P), the 532 nm perpendicular polarization channel (S), and the 607 nm nitrogen Raman channel. This configuration, as detailed by Chen et al. (2024) regarding system parameters, enables the REAL to possess continuous observation capabilities from the ground to the upper atmosphere. To ensure the dynamic range of the data from the three main receiving channels, each main channel is divided into high and low sub-channels through a non-polarizing beam splitter and data gluing is achieved through linear overlap (Zhang et al., 2014). To enhance the dynamic range of the lidar echo signal, in the system design, optimization was made in terms of stray light, anti-electromagnetic interference in the detection circuit, and polarization isolation. After the design was completed, it passed a series of tests of mutual comparison with the 532 nm reference lidar MUSA (Wandinger et al., 2016) of the EARLINET lidar calibration center with high quality. In the mutual comparison, it was found that the signal deviation of REAL and MUSA within the detection dynamic range was less than 2 %, and the dynamic detection range was larger.
In this research, the PM2.5 and PM10 data employed were primarily sourced from the official website of the China National Environmental Monitoring Centre (http://www.cnemc.cn/, last access: 15 June 2025). This website offers real-time dissemination and historical data query capabilities for air quality monitoring data across different regions in China. Furthermore, air quality-related information (Beijing's PM concentration) published on the official website of the Beijing Municipal Ecology and Environment Bureau (http://sthj.beijing.gov.cn/, last access: 15 June 2025) was also consulted for supplementation and verification purposes. When analyzing the direction and backward trajectories of long-range transported aerosols, we utilized the Hybrid Single-Particle Lagrangian Integrated Trajectory (HYSPLIT) model (https://ready.arl.noaa.gov/HYSPLIT.php, last access: 5 August 2025). The HYSPLIT model has been extensively applied in calculating the trajectories of air quality, pollutants, and their transport processes (Kim et al., 2020).
2.3 Data processing
In this study, the aerosol optical properties were retrieved using a 532 nm single-wavelength Raman–Mie polarization scattering lidar (REAL) system, and the wind profiles were obtained by means of a Doppler wind lidar. The raw dataset measured by the REAL is sampled within 1 min, with a vertical resolution of 15 m. Before retrieving aerosol optical properties, these data undergo preprocessing steps, including dead time correction, background noise subtraction, signal gluing and averaging, range correction, and polarization gain ratio calibration to ensure the quality of the data (Freudenthaler, 2016; Wang et al., 2023; Mao et al., 2024). The aerosol backscattering coefficient is retrieved using the sum of the horizontally and vertically polarized Mie scattering signals (D'Amico et al., 2015).
Since the presence of clouds can severely bias the retrieval of aerosol optical properties, cloud-affected range bins were identified and masked before inversion using the Value Distribution Equalization (VDE) algorithm originally proposed for ground-based lidar (Zhao et al., 2014). In VDE, semi-discretization is applied to suppress random noise while preserving sharp layer gradients, followed by histogram-equalization to enhance far-range signal visibility; empirical gradient/attenuation tests are then used to delineate cloud layers. The practical reliability of this screening under diverse atmospheric conditions has been demonstrated in long-term, multi-instrument evaluations (Zou et al., 2024). Only cloud-free bins were used for the subsequent aerosol inversions and particle depolarization ratio (PDR)-based classification.
The separation of dust and non-dust aerosols was achieved following the Polarization Lidar Photometer Retrieval (POLIPHON) method (Freudenthaler et al., 2009; Mamouri and Ansmann, 2014), which utilizes the PDR as the key parameter.
In the text, δm represents the depolarization ratio of the molecules, δv denotes the volume depolarization ratio, and βa and βm are the backscattering coefficients of aerosols and molecules, respectively. Subsequently, classification thresholds are set: when δp≥0.31, it is identified as pure dust aerosol (δdust); when δp≤0.05, it is identified as non-dust aerosol (δnon-dust); the intermediate range is classified as a mixture of dust and other aerosols. Following the classification, the non-dust aerosol component is primarily attributed to anthropogenic emissions within the study context. Beijing is an inland megacity with no significant local sources of sea salt aerosols and is not influenced by volcanic emissions (Zhang et al., 2013; Huang et al., 2014; Liu et al., 2016). Therefore, for this study focusing on the Beijing region, the term “non-dust aerosol” serves as a reasonable proxy for anthropogenic aerosol, allowing us to investigate the transport characteristics of pollutants originating from local human activities separately from transported dust. The backscattering coefficient of dust is calculated following these rules: In a pure dust region, the total backscattering coefficient is solely contributed by dust. In a non-dust region, the contribution of dust is zero. In a mixed region, based on the linear mixing model, the contribution of dust is proportionally distributed according to the PDR (Tesche et al., 2009b; He et al., 2023, 2025):
The total backscattering coefficient minus the backscattering coefficient of dust yields the non-dust backscattering coefficient.
The aerosol mass concentration is derived via the joint calculation of the extinction coefficient and the mass concentration conversion factor (Mamouri and Ansmann, 2014).
Among them, the aerosol extinction coefficient which is calculated by dust and non-dust backscattering coefficient with assumed fixed lidar ratio (LR), and c represents the mass concentration conversion factor. In this study, the mass concentration conversion factor c for dust aerosols is adopted as kg m−2, while that for non-dust aerosols is taken as kg m−2 (Mamouri and Ansmann, 2017).
The fluctuations of aerosol mass concentration (m′) and vertical wind speed (w′) for eddy covariance calculations were derived from datasets with a 1 min temporal resolution. This resolution represents a balance between resolving the dominant turbulent eddies responsible for vertical transport and ensuring robust covariance statistics from the lidar measurements. The Doppler wind lidar acquires radial wind velocities at a native frequency of 1 Hz, which are integrated over its 135 s VAD scanning cycle to retrieve wind profiles, resulting in a final 1 min output. The aerosol optical properties from the REAL lidar are also provided at a 1 min resolution. The spatial volume for each data point is defined by a 50 m vertical range resolution and the horizontal averaging inherent to the VAD scan. This configuration (1 min, 50 m) is a standard and well-validated approach in lidar-based boundary layer flux studies. It effectively captures the energy-containing eddies that dominate vertical transport. While some attenuation of the flux may occur due to the smoothing of the smallest-scale turbulence by spatial and temporal averaging, the method robustly captures the principal patterns and vertical structure of the aerosol fluxes.
To ensure spatial alignment between the aerosol data and wind field data during flux calculations, we resampled the aerosol mass concentration data retrieved by the REAL to a vertical resolution of 50 m (consistent with the wind field data) before performing the covariance calculations. The vertical aerosol mass flux is calculated using the eddy covariance method (Swinbank, 1951). The eddy covariance method is a direct measurement method for vertical fluxes based on turbulence theory. Thus, the aerosol mass concentration vertical fluxes at different heights can be expressed as follows (Engelmann et al., 2008; Dipu et al., 2013):
When calculating the vertical flux, the instantaneous fluctuation of the vertical wind speed at a given altitude is defined such that upward is positive and downward is negative. A positive vertical flux implies that the vertical motion is responsible for aerosol transport, while a negative vertical flux indicates that the vertical motion is involved in aerosol scavenging. While the aerosol mass concentration horizontal fluxes at different heights can be expressed as follows (Hu et al., 2022; Lin et al., 2023; Li et al., 2024):
Among them, z represents the vertical range of the lidar. The time-averaged value (30 min) is calculated by computing the covariance between the specific aerosol mass concentration m′(z) and the fluctuation w′(z) of the vertical wind speed at different altitudes caused by turbulence; the time-averaged horizontal wind speed and aerosol concentration (30 min) are used for calculation. In addition, the covariance between the specific aerosol mass concentration m′(z) and the fluctuation v′(z) of the horizontal wind speed at different altitudes caused by turbulence is also considered in the horizontal fluxes in this study. When computing the horizontal flux, we decompose the horizontal wind speed into components in the north00south direction cos (wd), where the northwestward direction is defined as positive. When there is a positive correlation between the wind direction and the fluctuations in aerosol mass concentration, the horizontal flux is positive, signifying the northward transport of aerosols.
The column of both fluxes is calculated as the product of the transport flux per unit cross-sectional area and the sum of the heights of each layer (Hu et al., 2022):
Among them, zi represents the height interval of each layer. This study further calculates the emission rates of dust and non-dust aerosols, which are derived by dividing the aerosol flux by their respective mass concentrations, thereby directly reflecting the transport efficiency per unit concentration of aerosols.
The observation site is located at the Beijing South Suburban Observatory (latitude: 39°54′20′′ N, longitude: 116°25′29′′ E). The observation period is selected from 19:30 CST (China Standard Time) on 2 November to 09:30 CST on 4 November 2023, with an interval of 38 h. Throughout the observation, the sky was predominantly clear or had sparse cloud cover. Only the contributions of optical properties caused by aerosols are used so that ensured the continuous acquisition of aerosol vertical profiles and wind field information over the free troposphere.
Figure 1 presents a comprehensive overview of the in-situ and lidar observation results over Beijing from 19:30 CST on 2 November to 09:30 CST on 4 November 2023. It integrates near-surface particulate matter concentrations with vertically resolved atmospheric profiles to illustrate the temporal evolution of a winter haze event. The figure is composed of six panels (a–f) that collectively depict the key parameters driving aerosol dynamics.
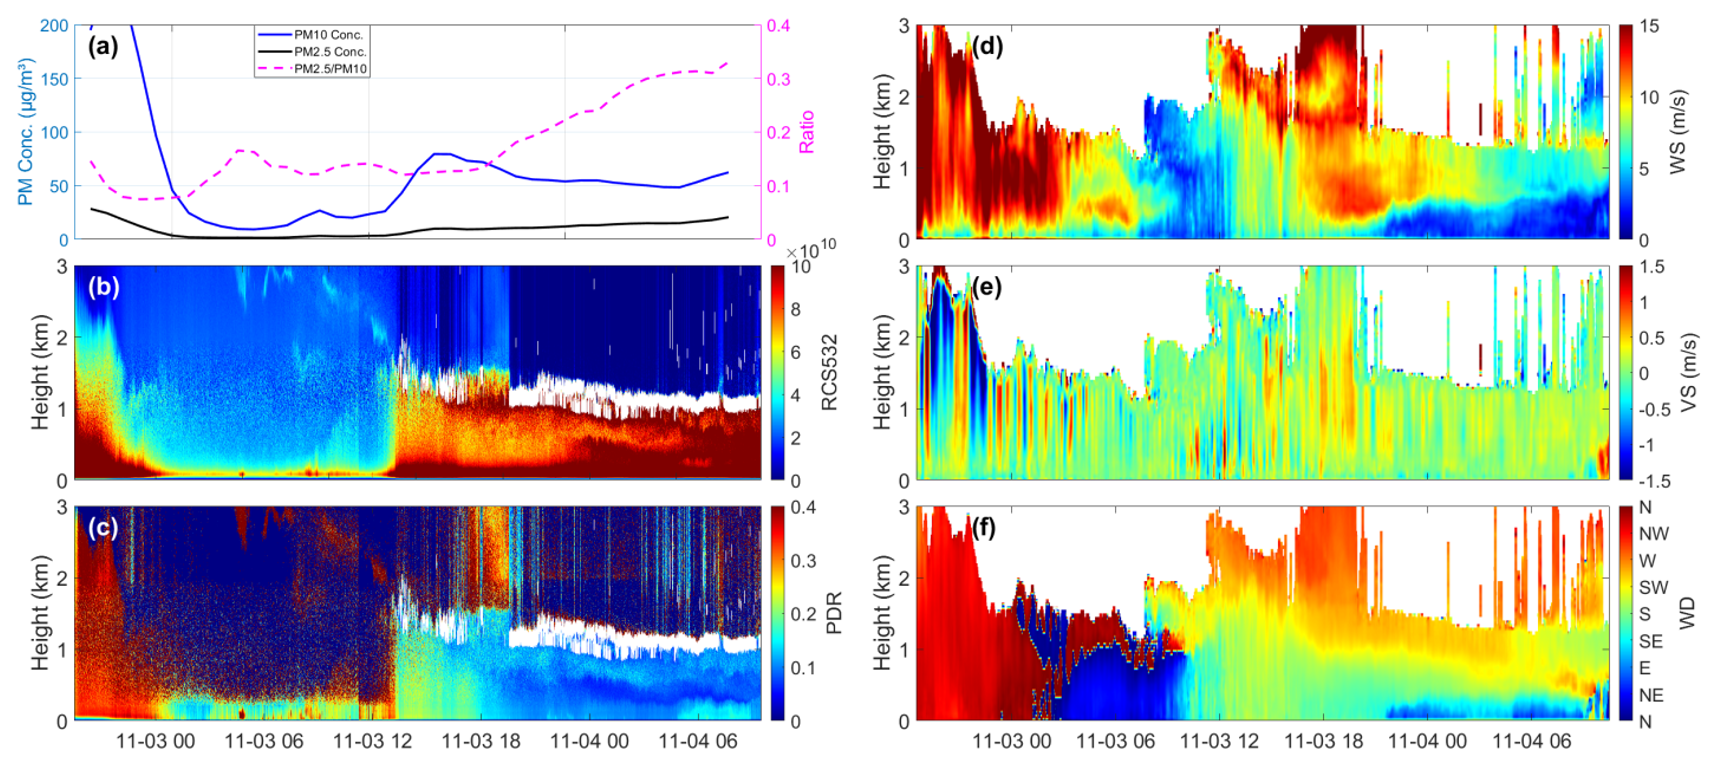
Figure 1In-situ and lidar observation results over Beijing from 19:30 CST on 2 November to 09:30 CST on 4 November 2023. (a) Near-surface PM2.5 and PM10 concentrations and their ratio from 19:30 CST on 2 November to 09:30 CST on 4 November 2023; Observational results of the temporal and spatial distribution of the REAL and wind profiler lidar from 19:30 CST on 2 November to 09:30 CST on 4 November 2023, in the 0–3 km atmospheric layer over Beijing; (b) 532 nm lidar range-corrected signal (RCS, representing vertical distribution information of relative aerosol loadings); (c) 532 nm particle depolarization ratio; (d) temporal and spatial distribution of horizontal wind speed; (e) Temporal and spatial distribution of vertical velocity; (f) temporal and spatial distribution of wind direction. The white areas in (b) and (c) represent cloud layers identified by the Vertical Distribution Equalization (VDE) method, and the white areas in (d)–(f) represent the absence of observation datasets.
The event commenced with the arrival of a pronounced dust layer. Starting around 19:30 CST on 2 November, the lidar observations revealed a high-aerosol-loading layer below 1.5 km (Fig. 1b), as indicated by the enhanced range-corrected signal at 532 nm (RCS532). This layer was characterized by a significantly elevated particle depolarization ratio (δp) of 0.3–0.4 (Fig. 1c), unequivocally identifying the presence of non-spherical dust aerosols (Peng et al., 2021; Floutsi et al., 2023; Tesche et al., 2009a). This was synchronized with a drop in the near-surface PM2.5 PM10 ratio to below 0.1. The meteorological driver was a strong northwesterly flow (Fig. 1d and f) with wind speeds exceeding 10 m s−1 above 500 m, which transported dust from the northwest (confirmed by HYSPLIT back-trajectories in Fig. 4a). The boundary layer height (PBLH) was elevated (∼1.5 km), and strong vertical mixing was observed (Fig. 1e). Thus, it is inferred that the accumulation and subsequent dissipation of local pollution during this period were jointly influenced by long-range transported dust particles and local emissions.
A pivotal transition occurred around 02:30 CST on 3 November. The low-level wind direction below 1 km abruptly shifted from northwesterly (NW) to northeasterly (NE) (Fig. 1f). The boundary layer height was compressed close to the ground (<0.5 km), consistent with observations of weaker vertical exchange rates below 500 m (Fig. 1e). This is likely due to the change in near-surface temperature caused by the cold air from the north, which reduced vertical turbulence and thus inhibited the vertical development of the boundary layer (Seinfeld et al., 1998). On the other hand, the northerly airflow played a crucial role in the horizontal transport of local pollutants, leading to a rapid decrease in overall aerosol concentration. With the wind shear and the weakening of vertical turbulence, the boundary layer lost its dust source, and the aerosol type shifted from dust-dominated to locally emitted fine particles.
During the daytime of 3 November, solar heating elevated the PBLH back to ∼1.5 km. The wind field became complex: southerly winds prevailed near the surface, while a strong wind shear existed around 1–2 km altitude, with westerly/southwesterly winds aloft (Fig. 1d, and f). This structure facilitated the vertical mixing of residual dust aloft and local anthropogenic emissions, resulting in a well-mixed aerosol layer with a moderate δp of ∼0.2 below 1.5 km (Fig. 1c). Notably, a layer of dust (δp>0.3) persisted atop the boundary layer (1.5–2 km), indicating continuous advection.
Throughout the entire observation period, the core of the westerly jet stream, which existed at an altitude of approximately 1000 m with an intensity of 15 m s−1 on the night of 2 November significantly weakened and dissipated by the day on 3 November. However, a westerly jet structure with adjusted intensity and position (around 2000–2500 m, 12–15 m s−1) was reestablished on the night of 3 November. Regarding the near-surface wind field, the prevailing wind direction steadily shifted to southerly/southwesterly (S/SW) after 06:00 CST on 3 November. This change in wind direction, coinciding with the typical timing following a cold front passage, indicates that the local influence of warm advection played a role after the cold front had passed. Lastly, a significant vertical discontinuity in the wind field consistently existed near 1000 m, characterized by variable wind directions and strong vertical wind speed gradients at this altitude. The most intense shear event occurred around 18:00 CST on 3 November, with a wind speed difference exceeding 10 m s−1 observed within just 500 m of vertical distance.
During the period of rapid pollutant clearance (before 02:00 CST on 3 November), both the atmospheric boundary layer height and wind direction were crucial for the efficient removal of pollutants. The decrease in boundary layer height prevented the mixing of dust aerosols from above into the surface layer, and the strong northwesterly winds facilitated the rapid dispersion of anthropogenic pollutants. Subsequently, the wind shear from northwest to southeast directions cut off the source of dust aerosols, while the elevated boundary layer height also contributed to the dilution of anthropogenically emitted aerosols.
Figure 2a illustrates the spatio-temporal evolution of the total aerosol backscattering coefficient at 532 nm from 19:30 CST on 2 November to 09:30 CST on 4 November 2023. It reveals the complex vertical structural variations of aerosol loadings during this pollution event: at the initial stage of pollution (evening of 2 November to early morning of 3 November), significant high-value (about m−1,sr−1 appeared at low altitudes (0–1.5 km), indicating the accumulation of aerosols in the near-surface layer; subsequently, with changes in meteorological conditions, a strong aerosol layer (backscattering coefficient over m−1 sr−1) emerged at higher altitudes (1.5–2.5 km), while the aerosol backscattering coefficient near-surface layer is lower to m−1 sr−1.
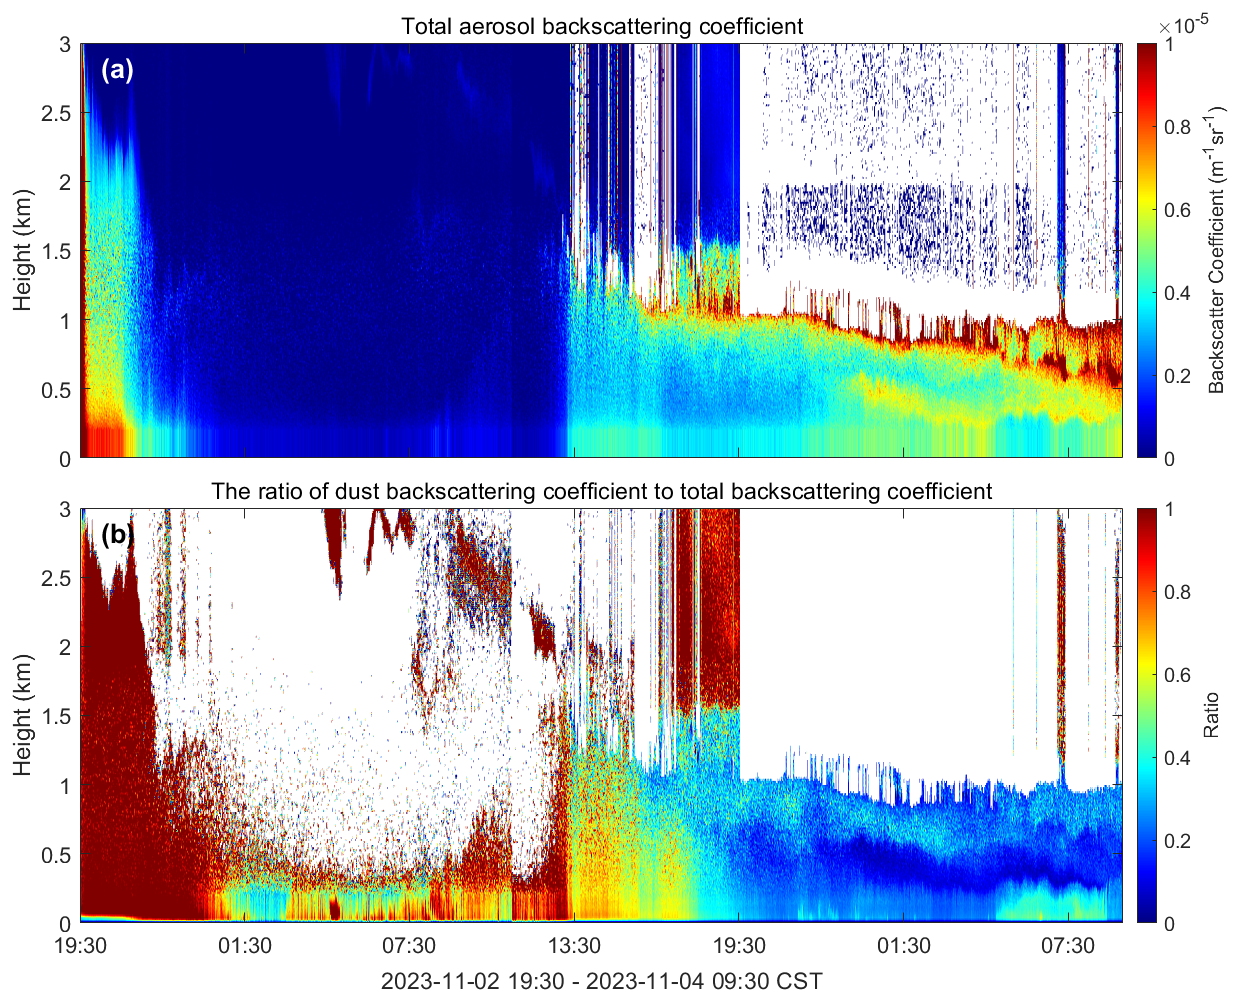
Figure 2(a) the spatial-temporal evolution of the total aerosol backscattering coefficient at 532 nm wavelength from 19:30 CST on 2 November to 09:30 CST on 4 November 2023. (b) The ratio of dust backscattering coefficient to total backscattering coefficient. The white areas indicate the absence information.
To gain an in-depth understanding of the transport behavior of aerosols from different sources, we have separated dust and non-dust aerosols following the POLIPHON method based on the depolarization signal (Fig. 2b). It indicates that dust aerosols were primarily concentrated in the elevated layer (approximately 1–3 km), although they were occasionally mixed down to near the surface (e.g., on 2 November and around 12:00 CST on 3 November). In contrast, non-dust aerosols were predominantly found in the atmospheric layer (below 1 km), which is mainly attributed to local anthropogenic emissions in the North China Plain. It noted that the spatial footprint of the measurement is height-dependent, meaning the influence of near-surface local sources diminishes with increasing altitude.
To investigate the regional transport of aerosols, the temporal variations in PM concentrations in Beijing and its surrounding cities during this period were analyzed (Fig. 3). On 2 November, the five cities simultaneously reached peak PM2.5 concentrations, indicating a regional fine particulate matter pollution event. The PM2.5/PM10 ratio exceeded 0.6 during the peak period in all cities, confirming that the pollution was primarily composed of PM2.5. Zhangjiakou first experienced an explosive increase in PM10 at 10:00 CST on 2 November followed by subsequent pollution peaks in Shijiazhuang, Tianjin, and Chengde, revealing a dust transport pathway from northwest to southeast. Subsequently, both PM10 and PM2.5 concentrations in the five cities showed a rapid decline, and the PM2.5 PM10 ratio also decreased to varying degrees, reflecting the effective clearance of local pollutants by strong meteorological processes.
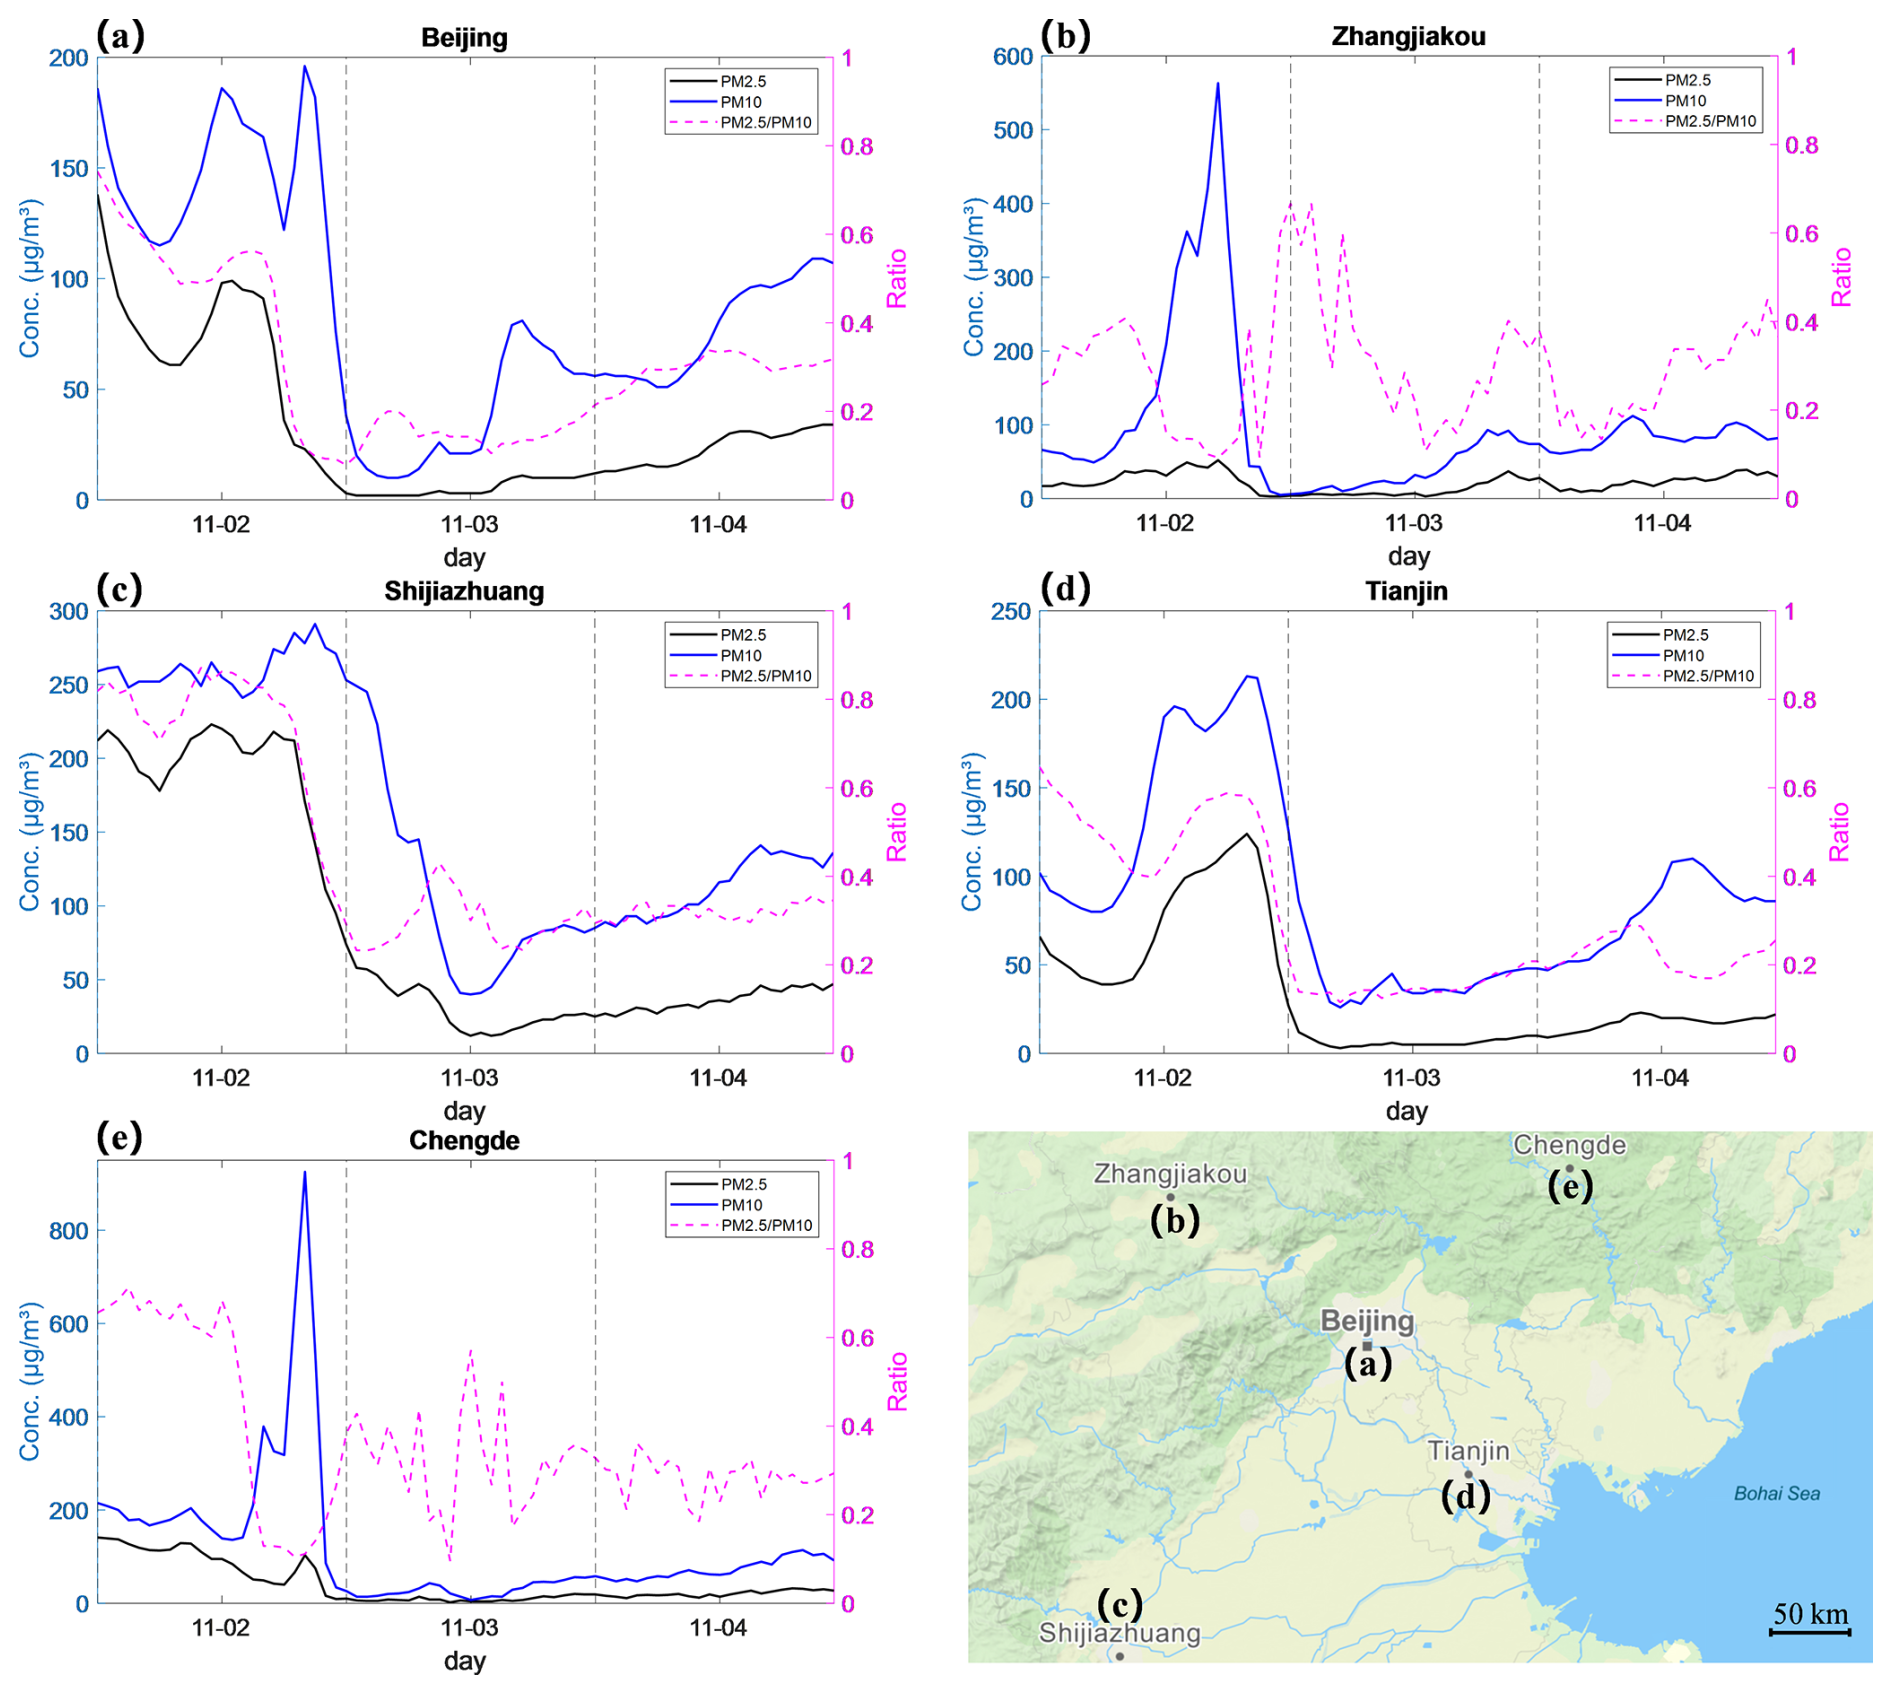
Figure 3The hourly air quality trends of major cities in the Beijing–Tianjin–Hebei region (Beijing, Tianjin, Zhangjiakou, Chengde) from 2–4 November 2023 are presented. The map (© Mapbox, available at https://www.mapbox.com/mapbox-studio, last access: 3 December 2025) illustrates the geographical distribution of the cities, with surrounding subplots showing the daily variation patterns of PM2.5 (black line), PM10 (blue line) concentrations, and the PM2.5 PM10 ratio (pink dashed line) for each city. The concentration units are micrograms per cubic meter (µg m−3), and the time span is from 00:00 to 23:00 CST daily.
Figure 4 shows the backward trajectories consistent with the wind direction results from the HYSPLIT model and wind profiler lidar observations, revealing the sources of aerosols within the aerosol layer during the air pollution event in Beijing, November 2023. From Fig. 4a (16:00 CST on 2 November), it can be observed that the air mass trajectory follows a northwest–southeast path, originating from southern Mongolia and western Inner Mongolia, China (39–41° N, 114–116° E), indicating that the air mass during this period was primarily transported from the northwest, consistent with the contemporaneous wind field characterized by “predominantly northwesterly winds” In Fig. 4b (Beijing Time, 13:00 BJT on 3 November), there is a dramatic change in the trajectory pattern, with all altitude levels turning southwestward. The air mass below 1000 m originates from the southern North China Plain (35° N, 115° E), while the 1500–3000 m layer recirculates inland from the Yellow Sea (34° N, 122° E), reflecting the warm and moist air mass along the coastal return flow. The trajectory at 500 m altitude passed over the Bohai Bay (38° N, 120° E) 12 h prior, suggesting a relatively clean air mass, although the possibility of sea salt particles being mixed in cannot be ruled out. In Fig. 4c (07:00 CST on 5 November), the trajectories at all altitudes exhibit a southeast–northwest recirculation trend, with the lower layer (199–699 m) air mass originating from the eastern North China Plain (38–40° N, 117–119° E), driven northwestward by southerly winds. The upper layer (1500–2199 m) trajectories extend southwestward, indicating the reverse transport after the recovery of the northwesterly winds at high altitudes. Combined with the observations of particle depolarization, it can be confirmed that dust aerosols primarily originate from the northwest (Taklamakan Desert), while non-dust aerosols mainly come from anthropogenic emission sources in the North China region.
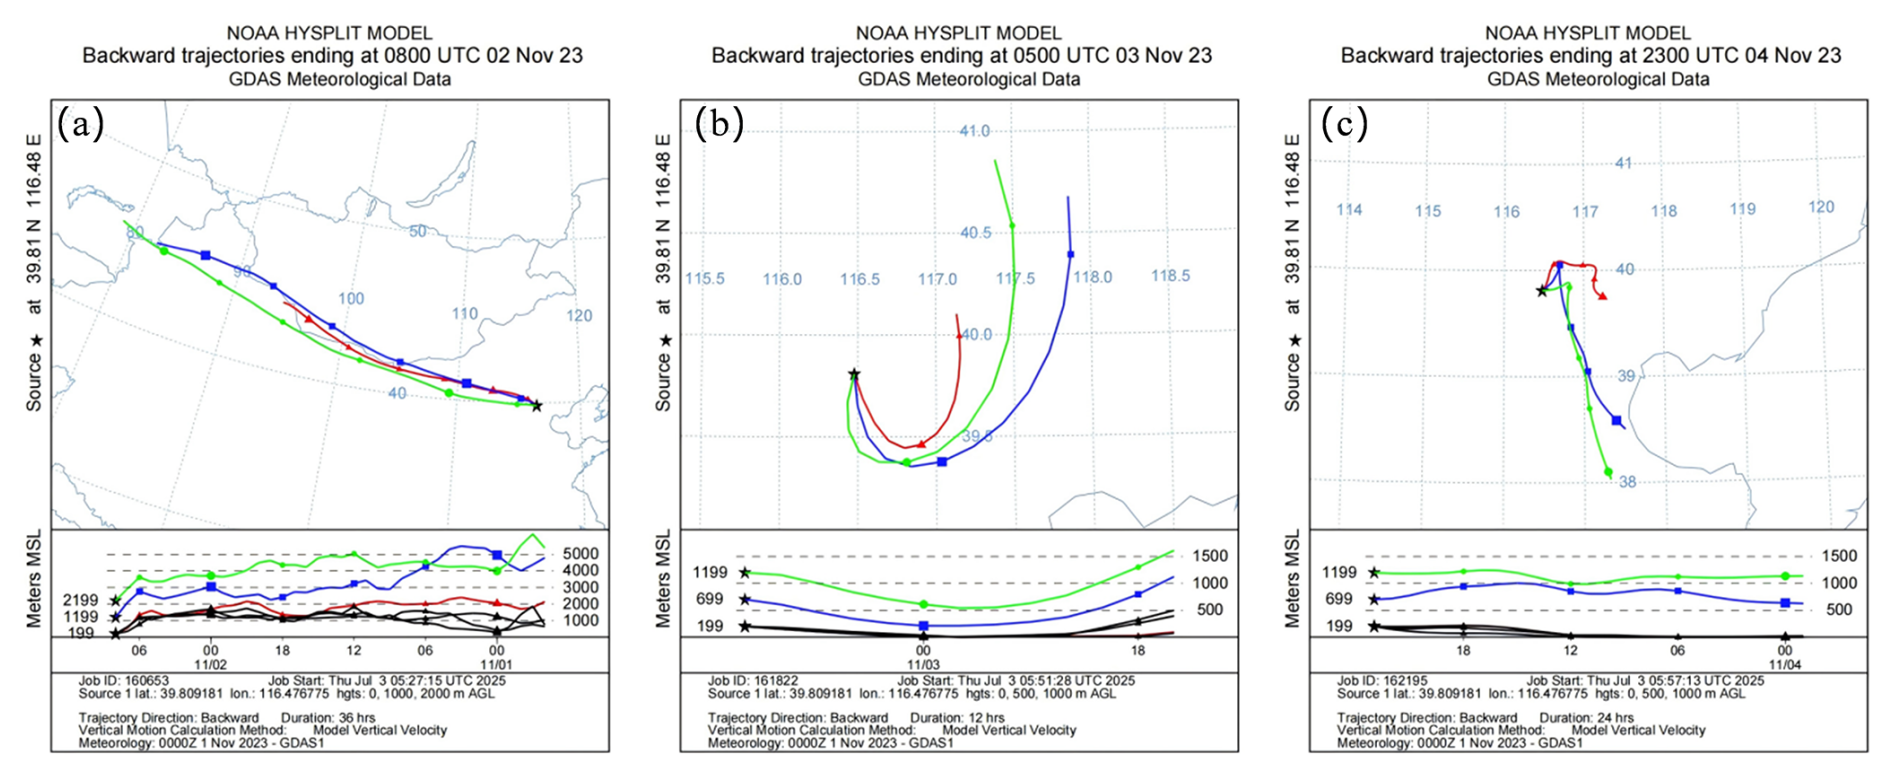
Figure 4HYSPLIT modeled 48 h airmass backward trajectories for Beijing on 2–4 November 2023. (a) HYSPLIT modeled 36 h on 2 November 2023 at 00:00 CST (China Standard Time). All altitudes (green, blue, red and black), the trajectories mainly originated above the Taklimakan Desert. (b) HYSPLIT modeled 12 h on 2 November 2023 at 21:00 CST. All altitudes (green, blue, red and black), the trajectories mainly originated above the North China Plain. (c) HYSPLIT modeled 24 h on 4 November 2023 at 15:00 CST. At higher altitudes (green), the trajectories mainly originated above the North China Plain, while at lower altitudes (blue and red) they originated above the Taklimakan Desert.
To quantitatively describe the aerosol transport flux during this event, we obtained the horizontal and vertical fluxes of aerosols by combining the estimated dust/non-dust aerosol mass concentrations with wind profile data (as shown in Fig. 5). The flux evolution clearly aligns with the three meteorological phases identified in Fig. 1.
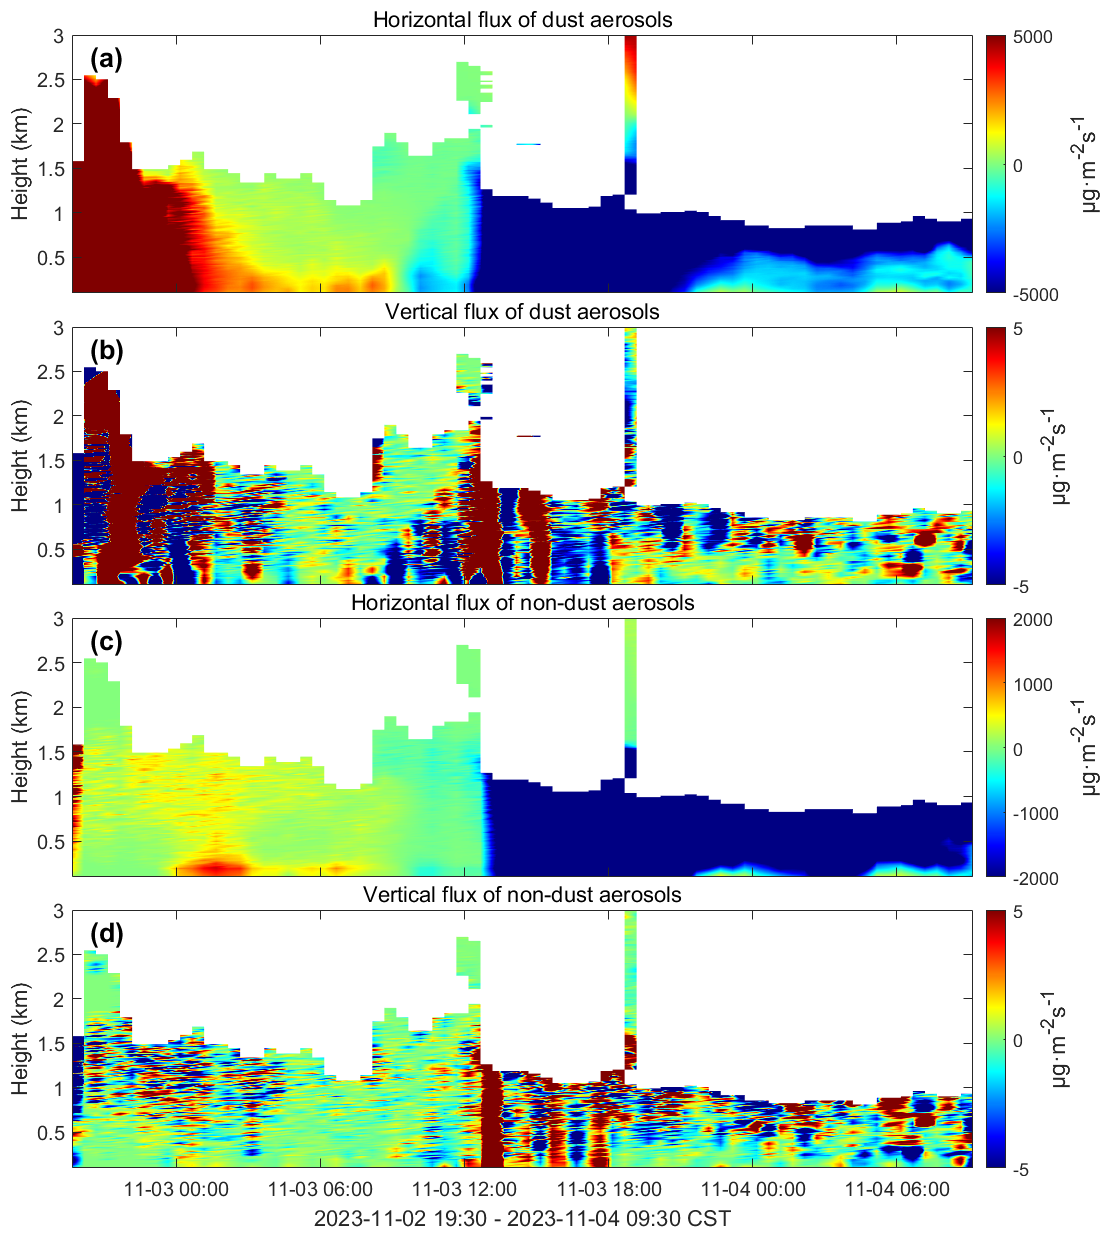
Figure 5Aerosol flux results from 19:30 CST (China Standard Time) on 2 November to 09:30 CST on 4 November 2023, in the 0.1–3 km atmospheric layer over Beijing. (a) Horizontal flux of dust aerosols; (b) vertical flux of dust aerosols; (c) horizontal flux of non-dust aerosols; (d) vertical flux of non-dust aerosols.
During Phase 1 (evening of 2 November to ∼ 02:30 CST on 3 November), dominated by strong northwesterly winds, both dust and non-dust aerosols were transported southeastward, as indicated by strong positive horizontal fluxes (Fig. 5a and c). The horizontal flux of dust aerosols peaked at approximately 5000 µg m−2 s−1 in the elevated layer. Concurrently, intense upward vertical fluxes of dust aerosols exceeded 5 µg m−2 s−1 (Fig. 5b), corresponding to the period of strong turbulent mixing within the deep boundary layer.
The pivotal transition in Phase 2 (∼ 02:30 ST on 3 November) is markedly reflected in the flux data. The abrupt shift in low-level wind direction to northeasterly directly triggered a sharp reversal of the dust horizontal flux from positive to near zero within an hour (Fig. 5a), effectively cutting off the dust supply. This phenomenon confirms the modulating effect of wind shear on pollutant clearance proposed by Zhang et al. (2020), but this study further reveals its impact on the transport mechanism of aerosol types. This was accompanied by a shift of the dust vertical flux to significant deposition (approximately −4 µg m−2 s−1), reflecting scavenging due to boundary layer compression and weakened turbulence.
In Phase 3 (daytime on 3 November), the horizontal flux of dust aerosols dramatically shifted to strong negative values (approximately −5000 µg m−2 s−1) below 2 km around noon (Fig. 5a), indicating northwestward transport of dust that was likely recirculated back as wind directions became complex. Meanwhile, the redevelopment of the boundary layer led to a second peak in the upward vertical flux of dust (over 5 µg m−2 s−1, Fig. 5b), indicating secondary lifting. Throughout this period, the vertical flux of non-dust aerosols remained slightly positive, except for a brief deposition event around 14:00 CST at 800 m altitude (Fig. 5d), underscoring that fine particles mainly undergo upward diffusion, contrasting sharply with the intermittent, strong deposition of dust.
The most notable dust/non-dust aerosol flux events in Fig. 5 occurred during the evening of 2 November to the early morning of 3 November, as well as from the morning to noon on 3 November. These periods correspond to the strong horizontal wind speed events and wind direction abrupt changes depicted in Fig. 1. Strong horizontal winds and strong boundary layer turbulence mixing are the primary driving forces behind the lifting of aerosol from the ground and the transport of mixture dust and anthropogenic emission particles.
Compared to the study of near-surface aerosol fluxes (e.g., Casquero-Vera et al., 2022; Pryor et al., 2008; Yuan et al., 2019), the vertical cross-sectional aerosol fluxes in this research are particularly useful for understanding the inter-regional transport of aerosols. However, if similar lidar devices were deployed in multiple cities across the Beijing–Tianjin–Hebei region, it would be possible to further quantitatively analyze the mutual transport of aerosols between cities. Regrettably, due to the limitations in observation duration, this study was unable to utilize long-term observational data to investigate pollution processes and pollutant transport characteristics under various weather patterns.
Figure 6 illustrates the spatial-temporal distribution of emission rates of dust and non-dust aerosols in the horizontal and vertical directions over the Beijing region from 19:30 CST on 2 November to 09:30 CST on 4 November 2023. The horizontal emission rate of dust aerosols (Fig. 6a) fluctuated significantly due to abrupt changes in the wind field. In the evening of 2 November, driven by strong northwesterly winds, the horizontal emission rate showed a notable positive value (approximately 8–10 m s−1), indicating transport of dust towards the southeast. Early on 3 November, with the abrupt shift of the low-level wind direction to northeasterly, the horizontal emission rate sharply reversed to a strong negative value ( m s−1), signifying a sudden increase in the efficiency of transporting dust northwestward. This drastic reversal in emission rates directly explains the rapid changes in the distribution of the high particle depolarization ratio layer observed in Fig. 1c, as well as the abrupt decrease in near-surface PM10 concentrations – strong transport efficiency rapidly removed local dust. The horizontal emission rate of non-dust aerosols (Fig. 6c) exhibited a trend highly synchronized with that of dust aerosols, underscoring their co-variation in response to the same wind-field forcing.
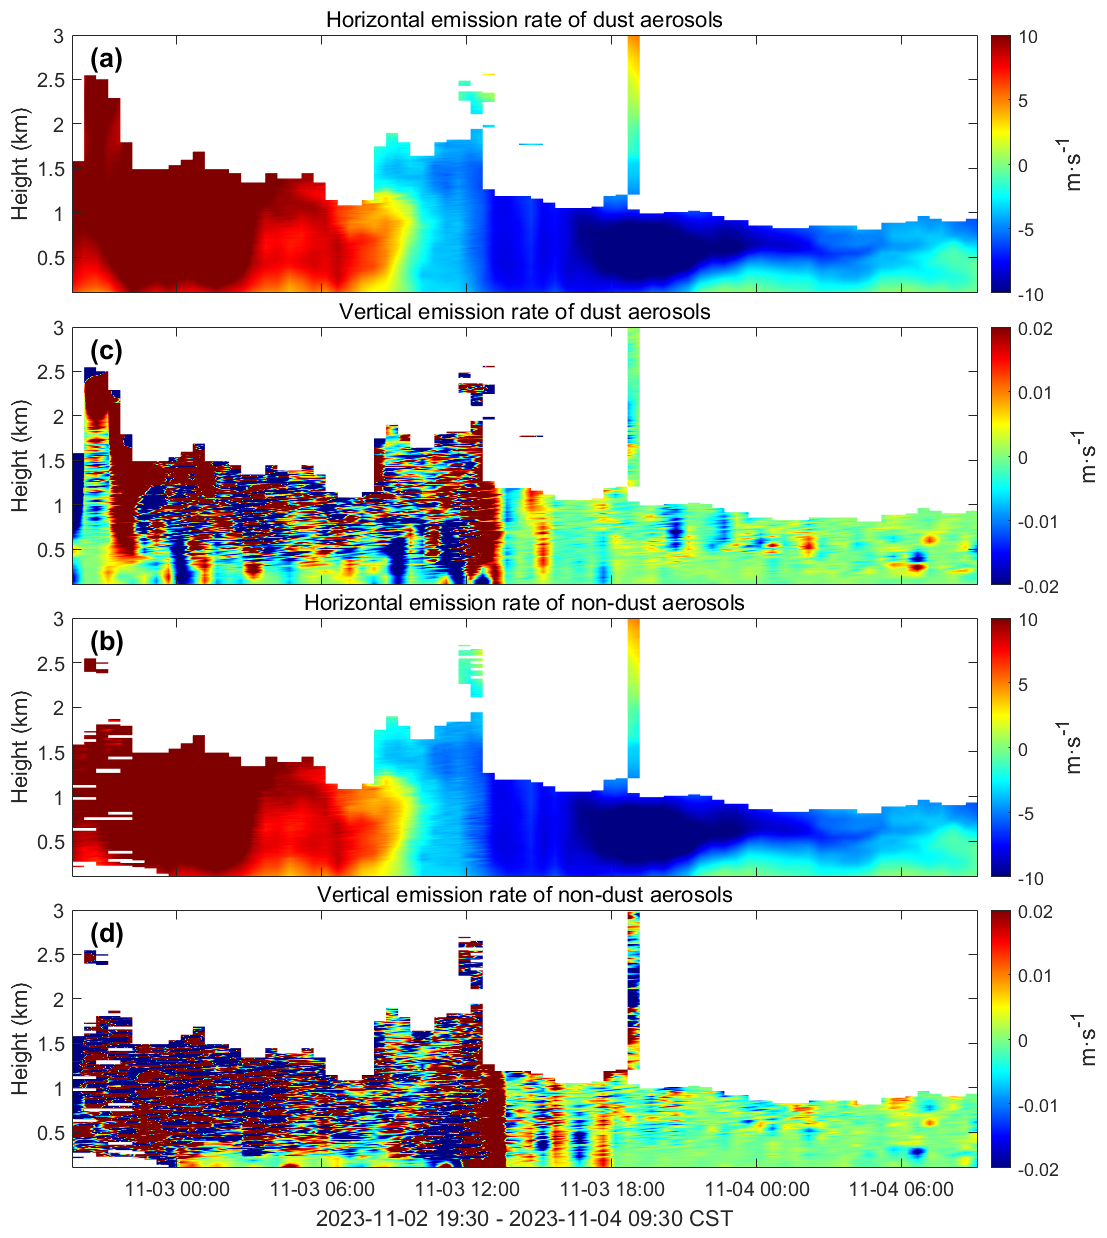
Figure 6Aerosol emission rate results from 19:30 CST on 2 November to 09:30 CST on 4 November 2023 in the 0.1–3 km atmospheric layer over Beijing. (a) Horizontal emission rate of dust aerosols; (b) vertical emission rate of dust aerosols; (c) horizontal emission rate of non-dust aerosols; (d) vertical emission rate of non-dust aerosols.
In the evening of 2 November, the boundary layer height was approximately 1.5 km, with strong convection, and the vertical emission rate of dust aerosols exceeded 0.01 m s−1, indicating that strong convection efficiently lifted dust. Early in the morning of 3 November, the boundary layer height compressed to less than 0.5 km, with weaker convection, and the vertical emission rate shifted to around −0.01 m s−1, reflecting a dominant deposition process. In the afternoon, as the boundary layer rose again, a peak in positive emission rates reemerged.
The most notable characteristic of the vertical emission rate of non-dust aerosols (Fig. 6d) was that it was mostly positive (0 to 0.02 m s−1) throughout the observation period. This suggests that for non-dust aerosols, the vertical diffusion rate caused by convection was continuously greater than their minimal gravitational settling rate, resulting in a net upward transport. This observation dynamically explains the slower decrease in PM2.5 concentrations compared to PM10 in Fig. 1a and the phenomenon of pollution lingering, as fine particles, due to their extremely slow settling speed, are difficult to effectively remove through dry deposition and are more likely to be entrained and remain in the atmosphere for extended periods.
The results indicate a significant regulatory effect of meteorological conditions on aerosol emission rates: the diurnal variation in planetary boundary layer height drives the alternation between positive and negative vertical emission rates; whereas abrupt changes in wind direction modulate the intensity of horizontal emission rates by altering the transport pathways.
To analyze the changes in the near-surface and total fluxes of dust and non-dust aerosols during the diffusion process of this event, we obtained the column transport fluxes from 100–3000 m (approximating the aerosol content throughout the entire atmospheric layer) and from 100–300 m (representing the ground-level aerosol content) (Fig. 7). Negative non-dust fluxes can be used to characterize the meteorological conditions' ability to clear locally emitted anthropogenic aerosols; positive non-dust fluxes indicate the meteorological conditions' capacity to accumulate locally emitted anthropogenic aerosols. Negative dust fluxes can be used to characterize the meteorological conditions' ability to clear already accumulated dust aerosols locally; positive dust fluxes indicate the meteorological conditions' capacity to accumulate dust aerosols transported to the local area.
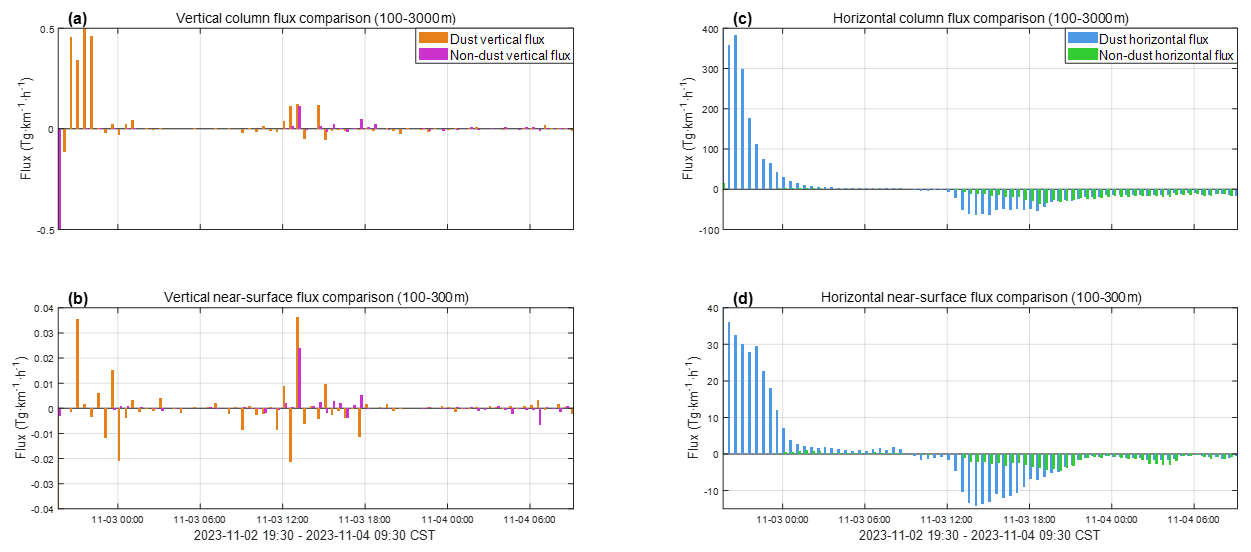
Figure 7Distribution of aerosol column transport fluxes from 2–4 November 2023. (a) Vertical column transport fluxes of aerosols within the atmospheric layer of 100–3000 m; (b) horizontal column transport fluxes of aerosols within the atmospheric layer of 100–3000 m; (c) vertical near-surface column transport fluxes of aerosols within the atmospheric layer of 100–300 m; (d) horizontal near-surface column transport fluxes of aerosols within the atmospheric layer of 100–300 m.
The comparison of near-surface vertical fluxes (100–300 m, Fig. 7b) reveals distinct behaviors between dust and non-dust aerosols, indicative of their different sources. The vertical flux of dust exhibits strong intermittent deposition and occasional strong upward transport. In contrast, the vertical flux of non-dust aerosols remains consistently close to zero, with much smaller amplitudes of both positive and negative fluctuations throughout the event. This indicates that in the near-surface layer, the net vertical exchange of locally emitted non-dust aerosols is minimal, whereas dust undergoes significant episodic deposition and lifting, driven by synoptic-scale processes. This pattern supports the interpretation that dust is primarily subject to long-range transport and dynamic meteorological forcing, while non-dust aerosols are dominated by local, near-surface emissions with limited net vertical exchange on the event scale.
Examining the column transport fluxes from 100–3000 m (Fig. 7a), the highest value of positive vertical fluxes are about 0.5 Tg km−1 h−1for dust aerosols and 0.15 Tg km−1 h−1 for non-dust aerosols, while the highest value of negative vertical fluxes are about 0.15 Tg km−1 h−1 for dust aerosols and 0.5 Tg km−1 h−1 for non-dust aerosols. It is observed that both dust and non-dust aerosol horizontal fluxes exceed their respective vertical fluxes, indicating that the horizontal dispersion of pollutants is more pronounced than their vertical dispersion. For the Southeastward horizontal transport (positive values shown in Fig. 7c), the maximal total column dust horizontal fluxes (100–3000 m) are estimated to be about 380 Tg km−1 h−1. In comparison, the maximal total column non-dust horizontal fluxes are found about 10 times smaller (about 30 Tg km−1 h−1). Regarding the near-surface level (Fig. 7d), the maximal column dust horizontal fluxes (100–300 m) are estimated to be about 36 Tg km−1 h−1. In comparison, the maximal column non-dust horizontal fluxes are found about 8 times smaller (about 3.5 Tg km−1 h−1). For the Northwestward horizontal transport (negative values shown in Fig. 7c), the maximal total column dust horizontal fluxes (100–3000 m) are estimated to be about 60 Tg km−1 h−1. In comparison, the maximal total column non-dust horizontal fluxes are found about 1–2 times smaller (about 40 Tg km−1 h−1). Compared with Southeastward horizontal transport, the Northwestward dust aerosols flux decreased significantly (approximately one-sixth of the Southeastward flux), while the non-dust aerosols flux slightly increased (about 1.3 times that of the southeastward flux). It may indicate that the long-range transported dust was mixed with local emissions in the downstream region of Beijing then impact the PM concentrations of Beijing. And also, it can indicate that the transportation cross-section in Southeastward is smaller than that in northwestward, which agrees with the terrain around Beijing region (Beijing has mountains in its northwest and plains in its southeast). In addition, to confirm with the near surface PM concentration over five cities (Fig. 4), it seems the aerosol transport cross-section probably reaches over 100 km levels. Regarding the near-surface level, the maximal column dust horizontal fluxes (100–300 m) are estimated to be about 14 Tg km−1 h−1. In comparison, the maximal column non-dust horizontal fluxes are found about 3 times smaller (about 4.5 Tg km−1 h−1). Compared with Southeastward horizontal transport, it seems Northwestward horizontal transport brought 4 times less dust aerosols back but 1.2 times more non-dust aerosols. It indicates that the impact of local emissions is more than dust on the near surface. In general, a comparison between southeastward and northwestward air flows suggests that air pollutants over Beijing are more easily influenced by northwestward flows, which can bring about twice as much aerosol loading from the southeast region to Beijing.
The correlation analysis of aerosol fluxes reveals significant differences in the transport mechanisms of dust and non-dust components (Fig. 8). The horizontal fluxes exhibit a high positive correlation (r=0.856, p<0.01), indicating that dust and non-dust aerosols are controlled by the same atmospheric dynamical processes in the horizontal direction. In contrast, although the vertical fluxes show a positive correlation trend, the correlation is significantly weaker (r=0.438, p<0.01), suggesting a big difference in their vertical transport processes. It is probably because one mainly comes from surface emission, while the other is mainly from sedimentation, and their emission rates are also comparatively different.
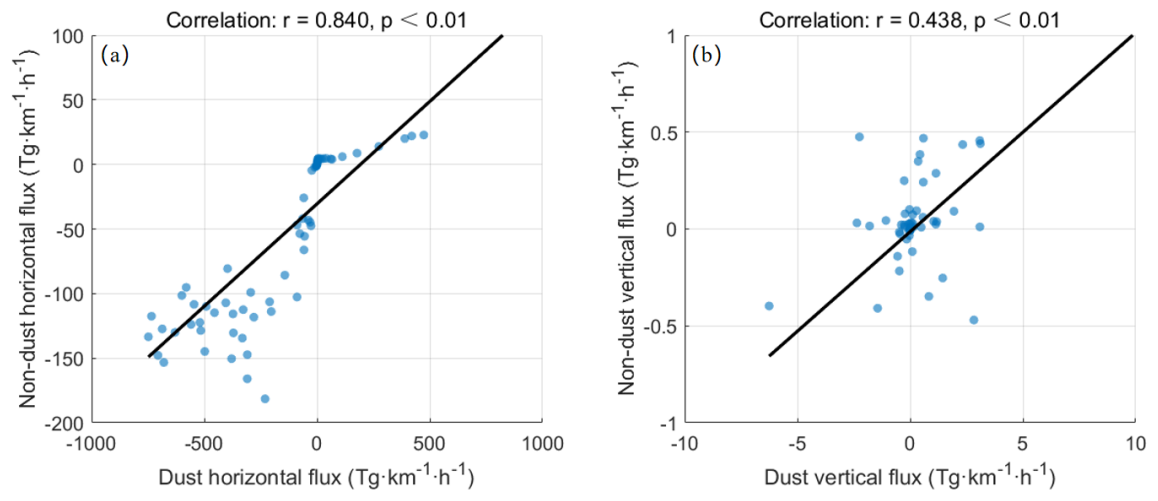
Figure 8Correlation between Dust and Non-Dust Aerosol Fluxes. (a) Scatter plot showing the correlation between dust horizontal flux and non-dust horizontal flux. (b) Scatter plot illustrating the correlation between dust vertical flux and non-dust vertical flux.
A strong dust transport event occurred from North-West China to the North China Plain in November 2023. During the transport periods, the Southeast-toward migration of cold air-masses carries not only the long-range transported dust but also local anthropogenic pollutants from the North China Plain to the Southeast region. This study quantitatively analyzed the vertical-horizontal flux structure of aerosols in the Beijing area using the polarization lidar and Doppler wind lidar observations on 2 November 19:00 CST to 4 November 2023 09:30 CST. The main research findings are summarized as follows:
-
Meteorological factors exert a significant effect on aerosol concentrations. Temporal and spatial variations in wind direction and speed are the core drivers of horizontal aerosol transmission. From the evening of 2 November to the early morning of 3 November, the low-altitude wind direction in Beijing shifted from Northwest to northeast, causing the horizontal transmission direction of dust aerosols to change from southeastward to northwestward. This confirms the path rule that “northwesterly winds push dust to spread southeastward, while northeasterly winds drive dust to transmit northwestward”. Meanwhile, the dissipation and reconstruction of the upper-level westerly jet further affected the vertical transmission range of aerosols. In addition, the diurnal variation of the planetary boundary layer (PBL) height governs the vertical diffusion of aerosols by regulating turbulence intensity. When the boundary layer is stable at night, dust tends to settle and accumulate; during the day, the rising boundary layer, accompanied by strong turbulence, promotes the upward diffusion of aerosols, which is highly synchronized with the positive-negative transition of vertical emission rate (positive during uplift and negative during sedimentation). Aerosol concentrations control requires the synergy of “source reduction” and “meteorological factors”. For a short period, meteorological factors are the dominant factors regulating aerosol concentration fluctuations, as they directly affect the transport and diffusion efficiency of aerosols without changing emission intensity. Thus meteorological forecasting and early warning can be used to guide real regulation (e.g., enhanced emission reduction during stable boundary layer periods), in order to achieve effective control of aerosol concentrations.
-
There are fundamental differences in emission and diffusion characteristics between dust and non-dust aerosols. The emission rate of dust aerosols fluctuates drastically, with their horizontal transmission significantly affected by sudden wind direction changes. Vertically, they exhibit an alternating “uplift-sedimentation” pattern and are mainly concentrated in the near-surface layer below 1000 m, reflecting their close association with natural/anthropogenic activities such as surface dust emission. In contrast, non-dust aerosols (dominated by anthropogenically emitted fine particles) have a stable and low-intensity emission rate. Their horizontal transmission trend is consistent with that of dust but responds more gently. Vertically, they primarily undergo weak upward diffusion, with rare large-scale sedimentation – characteristics that reflect the continuous emission from anthropogenic sources (e.g., industry and transportation). Moreover, due to their small particle size and slow sedimentation rate, fine particles are more likely to accumulate within the boundary layer.
-
The effectiveness of multi-source observation technologies and flux calculation methods is verified. In this study, Real lidar was used to retrieve aerosol optical properties (e.g., particle depolarization ratio) for accurate classification of dust and non-dust aerosols. Combined with Doppler wind lidar to obtain high-resolution wind profiles, the eddy covariance method was applied to calculate aerosol mass fluxes. This approach successfully captured the temporal and spatial distribution of emission rates of the two types of aerosols in horizontal and vertical directions. This technical system can effectively analyze the coupling mechanism of “meteorological conditions – pollution sources – diffusion processes” and provides a reliable method for quantifying anthropogenic aerosol emission rates in cities.
-
The synergistic impact of regional pollution transmission and local emissions is significant. Observations of PM concentrations in cities around Beijing showed that on 2 November, Zhangjiakou was the first to experience an explosive increase in PM10 concentration, followed by pollution peaks in Shijiazhuang, Tianjin and other cities. This reveals the cross-regional transmission path of dust from northwest to southeast. Additionally, the peak PM2.5 concentration in Beijing corresponds to the stable emission of non-dust aerosols, indicating that the superposition of regional transmission and local anthropogenic emissions is a key cause of this pollution event. Severe weather processes (e.g., cold air advection) have a significant scavenging effect on both types of pollutants, further verifying the potential of meteorological intervention in pollution control. The total amount of dust transmission rate is estimated to be about 1360 Tg km−1 h−1 and the total amount of local pollutants transmission rate is estimated to be about 770 Tg km−1 h−1 for the entire troposphere.
Our findings on the distinct flux regimes of dust and anthropogenic aerosols during a winter haze event in Beijing provide new process-level insights that extend previous research. While earlier studies have established the importance of northwesterly transport for dust episodes and the role of the boundary layer in pollutant accumulation (e.g., Huang et al., 2020; Zhang et al., 2020), this study quantifies the type-resolved vertical and horizontal flux structures and their emission rates. The high correlation in horizontal fluxes but weaker correlation in vertical fluxes between dust and non-dust aerosols advances the understanding that while synoptic-scale advection controls the co-transport of different aerosol types, their surface–atmosphere exchange processes (e.g., emission vs. sedimentation) are governed by fundamentally different mechanisms. This result is consistent with the conceptual model of external versus local source dominance and provides lidar-based vertical flux evidence for such a decoupling in the North China Plain.
From the perspective of atmospheric physical processes, our results clarify the coupling relationship between synoptic-scale meteorological processes (westerly jet, cold air advection) and boundary-layer-scale dynamics (PBL height, turbulence) in regulating aerosol flux structure over the North China Plain: the upper-level westerly jet controls the vertical transport range of aerosols, while the boundary layer dynamics dominate the near-surface aerosol accumulation and diffusion, and their joint action determines the temporal and spatial distribution of air pollution in Beijing. This coupling mechanism is a key part of the atmospheric circulation-pollution interaction in the East Asian winter monsoon region, and the quantitative flux data obtained in this study can provide a reliable observational constraint for improving the parameterization of aerosol transport in atmospheric numerical models. For the understanding of atmospheric composition and climate effects, the decoupling of dust and non-dust aerosol fluxes helps to accurately assess their different radiative forcing effects: dust aerosols (mainly in the elevated layer) have a direct radiative effect on the upper boundary layer, while non-dust aerosols (accumulated in the near-surface layer) mainly affect the surface radiation balance and boundary layer development. The quantitative results of their transport fluxes provide a basis for further studying the contribution of different aerosol types to the regional climate of the North China Plain.
In conclusion, the established polarization-wind field joint inversion framework in this study overcomes the spatial representativeness issues of traditional single-point flux observations. The aerosol type separation achieved by the depolarization ratio method enables the quantitative decomposition of the contributions to the aerosol flux. Combining both vertical and horizontal fluxes of aerosol can be used to estimate the total transport amount of dust along its trajectories and also the total transport amount between the cities. The aerosol type-specific flux observation technology developed in this study provides new insights for joint pollution prevention and control in urban agglomerations like the Beijing–Tianjin–Hebei region and similar city clusters. This holds important reference value for the implementation of cross-regional coordinated air pollution control in the context of the integrated development of the Beijing–Tianjin–Hebei and Yangtze River Delta regions. It proves that using lidar remote sensing to study aerosol fluxes under different meteorological conditions (wind direction, wind speed and boundary layer height) provides data suitable for a scientific basis for urban air pollution early warning and the formulation of regional joint prevention and control strategies (e.g., northwest source control for dust and local emission reduction for non-dust aerosols). Furthermore, the aerosol fluxes profiles can be useful to estimate the amount of pollutant across-region transport. However, there are limitations: the observation duration is limited (38 h), making it difficult to cover fluxes characteristics under various weather patterns; the mass concentration conversion factor uses fixed values without considering the hygroscopic growth effect during aerosol aging; and the non-dust contributions are assumed to be anthropogenic emissions, of which the sources need to be further confirmed and a more accurate mass concentration conversion factor is required. Moreover, the horizontal flux calculation does not incorporate multi-city network observations, limiting the closure verification of regional transport fluxes. In the future, lidar observation networks can be deployed to track regional transport fluxes in real-time and optimize emergency emission reduction strategies for heavy pollution weather. For instance, when horizontal flux monitoring indicates an increase in dust input, dust suppression measures at construction sites can be initiated in advance; whereas when the vertical flux of non-dust aerosols remains positive, it is necessary to strengthen the control of industrial point sources and mobile sources.
Code and data can be provided by the corresponding author on request.
All the authors made contributions to this research work and manuscript. In particular, LW, ZY, YH and XW designed the whole strategy of this work. LW organized the observation campaign. ZT analyzed the data and wrote the manuscript draft. SL and CY participated the data analysis. LW, ZY, YH, BZ, DC and XW participated in the scientific discussions, reviewed and proofread the manuscript. TL participated in the observations and data collection. LL, BZ, DC, ZB, YC and XW reviewed and proofread the manuscript. LW, ZY, YH, LL, XW and YC acquired the research funding and led the study. All authors have read and agreed to the published version of the manuscript.
The contact author has declared that none of the authors has any competing interests.
Publisher's note: Copernicus Publications remains neutral with regard to jurisdictional claims made in the text, published maps, institutional affiliations, or any other geographical representation in this paper. The authors bear the ultimate responsibility for providing appropriate place names. Views expressed in the text are those of the authors and do not necessarily reflect the views of the publisher.
This research has been supported by the National Natural Science Foundation of China (grant nos. 42475147, 62105248, 42575141, and 42575203), and supported by the High-Performance Computing Center of Zhejiang Normal University.
This paper was edited by Andreas Petzold and reviewed by two anonymous referees.
Banakh, V. and Smalikho, I.: Coherent Doppler Wind Lidars in a Turbulent Atmosphere, Artech, ISBN 9781608076680, 2013.
Böckmann, C., Mironova, I., Müller, D., Schneidenbach, L., and Nessler, R.: Microphysical aerosol parameters from multiwavelength lidar, J. Opt. Soc. Am. A, 22, 518–528, https://doi.org/10.1364/JOSAA.22.000518, 2005.
Brunekreef, B. and Holgate, S. T. : Air pollution and health, Lancet, 360, 1233–1242, 2002.
Casquero-Vera, J. A., Lyamani, H., Titos, G., de A. Moreira, G., Benavent-Oltra, J. A., Conte, M., Contini, D., Järvi, L., Olmo-Reyes, F. J., and Alados-Arboledas, L.: Aerosol number fluxes and concentrations over a southern European urban area, Atmos. Environ., 269, 118849, https://doi.org/10.1016/j.atmosenv.2021.118849, 2022.
Che, H., Xia, X., Zhao, H., Dubovik, O., Holben, B. N., Goloub, P., Cuevas-Agulló, E., Estelles, V., Wang, Y., Zhu, J., Qi, B., Gong, W., Yang, H., Zhang, R., Yang, L., Chen, J., Wang, H., Zheng, Y., Gui, K., Zhang, X., and Zhang, X.: Spatial distribution of aerosol microphysical and optical properties and direct radiative effect from the China Aerosol Remote Sensing Network, Atmos. Chem. Phys., 19, 11843–11864, https://doi.org/10.5194/acp-19-11843-2019, 2019.
Chen, B., Xu, X. D., Yang, S., and Zhao, T. L.: Climatological perspectives of air transport from atmospheric boundary layer to tropopause layer over Asian monsoon regions during boreal summer inferred from Lagrangian approach, Atmos. Chem. Phys., 12, 5827–5839, https://doi.org/10.5194/acp-12-5827-2012, 2012.
Chen, R., Jiang, H., Xiao, Z.-Y., Yu, S.-Q., Jiao, L., and Hong, S.-M.: Monitoring Aerosol Optical Properties Using Ground Based Remote Sensing and the Change of Atmospheric Environment in Hangzhou Region, Res. Environ. Sci., 21, 22–26, 2008.
Chen, Y., Bu, Z., Li, Y., Dong, Y., Li, T., Wang, X., Wang, X., Liu, Z., and Wang, X.: A High-Performance 532 nm Raman–Mie Lidar for the Calibration of an Aerosol Lidar Network, Remote Sens., 16, 570, https://doi.org/10.3390/rs16030570, 2024.
Conte, M., Contini, D., and Held, A.: Multiresolution decomposition and wavelet analysis of urban aerosol fluxes in Italy and Austria, Atmos. Res., 248, 105267, https://doi.org/10.1016/j.atmosres.2020.105267, 2021.
Córdoba-Jabonero, C., Sicard, M., Ansmann, A., del Águila, A., and Baars, H.: Separation of the optical and mass features of particle components in different aerosol mixtures by using POLIPHON retrievals in synergy with continuous polarized Micro-Pulse Lidar (P-MPL) measurements, Atmos. Meas. Tech., 11, 4775–4795, https://doi.org/10.5194/amt-11-4775-2018, 2018.
D'Amico, G., Amodeo, A., Baars, H., Binietoglou, I., Freudenthaler, V., Mattis, I., Wandinger, U., and Pappalardo, G.: EARLINET Single Calculus Chain – overview on methodology and strategy, Atmos. Meas. Tech., 8, 4891–4916, https://doi.org/10.5194/amt-8-4891-2015, 2015.
Denjean, C., Cassola, F., Mazzino, A., Triquet, S., Chevaillier, S., Grand, N., Bourrianne, T., Momboisse, G., Sellegri, K., Schwarzenbock, A., Freney, E., Mallet, M., and Formenti, P.: Size distribution and optical properties of mineral dust aerosols transported in the western Mediterranean, Atmos. Chem. Phys., 16, 1081–1104, https://doi.org/10.5194/acp-16-1081-2016, 2016.
Ding, K., Liu, J., Ding, A., Liu, Q., Zhao, T. L., Shi, J., Han, Y., Wang, H., and Jiang, F.: Uplifting of carbon monoxide from biomass burning and anthropogenic sources to the free troposphere in East Asia, Atmos. Chem. Phys., 15, 2843–2866, https://doi.org/10.5194/acp-15-2843-2015, 2015.
Dipu, S., Prabha, T. V., Pandithurai, G., Dudhia, J., Pfister, G., Rajesh, K., and Goswami, B. N.: Impact of elevated aerosol layer on the cloud macrophysical properties prior to monsoon onset, Atmos. Environ., 70, 454–467, https://doi.org/10.1016/j.atmosenv.2013.01.011, 2013.
Drinovec, L., Močnik, G., Zotter, P., Prévôt, A., Ruckstuhl, C., Coz, E., Rupakheti, M., Sciare, J., Müller, T., Wiedensohler, A., and Hansen, A. D. A.: The “dual-spot” Aethalometer: an improved measurement of aerosol black carbon with real-time loading compensation, Atmos. Meas. Tech., 8, 1965–1979, https://doi.org/10.5194/amt-8-1965-2015, 2015.
Engelmann, R., Wandinger, U., Ansmann, A., Müller, D., Žeromskis, G., Althausen, D., and Wehner, B.: Lidar observations of the vertical aerosol flux in the planetary boundary layer, J. Atmos. Ocean. Tech., 25, 1296–1306, https://doi.org/10.1175/2007JTECHA967.1, 2008.
Floutsi, A. A., Baars, H., Engelmann, R., Althausen, D., Ansmann, A., Bohlmann, S., Heese, B., Hofer, J., Kanitz, T., Haarig, M., Ohneiser, K., Radenz, M., Seifert, P., Skupin, A., Yin, Z., and Petzold, A.: DeLiAn – a growing collection of depolarization ratio, lidar ratio and Ångström exponent for different aerosol types and mixtures from ground-based lidar observations, Atmos. Meas. Tech., 16, 2353–2379, https://doi.org/10.5194/amt-16-2353-2023, 2023.
Freudenthaler, V.: About the effects of polarising optics on lidar signals and the Δ90 calibration, Atmos. Meas. Tech., 9, 4181–4255, https://doi.org/10.5194/amt-9-4181-2016, 2016.
Freudenthaler, V., Esselborn, M., Wiegner, M., Heese, B., Tesche, M., Ansmann, A., Müller, D., Althausen, D., Wirth, M., and Fix, A.: Depolarization ratio profiling at several wavelengths in pure Saharan dust during SAMUM 2006, Tellus B, 61, 165–179, https://doi.org/10.1111/j.1600-0889.2008.00396.x, 2009.
Geng, G., Xiao, Q., Zheng, Y., Tong, D., Zhang, Y., Zhang, X., Zhang, Q., He, K., and Liu, Y.: Impact of China's Air Pollution Prevention and Control Action Plan on PM2.5 chemical composition over eastern China, Sci. China Earth Sci., 62, 1872–1884, https://doi.org/10.1007/s11430-018-9353-x, 2019.
Gerbig, C., Körner, S., and Lin, J. C.: Vertical mixing in atmospheric tracer transport models: error characterization and propagation, Atmos. Chem. Phys., 8, 591–602, https://doi.org/10.5194/acp-8-591-2008, 2008.
He, Y., Yin, Z., Ansmann, A., Liu, F., Wang, L., Jing, D., and Shen, H.: POLIPHON conversion factors for retrieving dust-related cloud condensation nuclei and ice-nucleating particle concentration profiles at oceanic sites, Atmos. Meas. Tech., 16, 1951–1970, https://doi.org/10.5194/amt-16-1951-2023, 2023.
He, Y., Choudhury, G., Tesche, M., Ansmann, A., Yi, F., Müller, D., and Yin, Z.: Extended POLIPHON dust conversion factor dataset for lidar-derived cloud condensation nuclei and ice-nucleating particle concentration profiles, Atmos. Meas. Tech., 18, 5669–5685, https://doi.org/10.5194/amt-18-5669-2025, 2025.
Hu, Q., Liu, C., Li, Q., Liu, T., Jia, X., Zhu, Y., Xing, C., Tan, W., and Gao, M.: Vertical profiles of the transport fluxes of aerosol and its precursors between Beijing and its southwest cities, Environ. Pollut., 312, 119988, https://doi.org/10.1016/j.envpol.2022.119988, 2022.
Huang, R.-J., Zhang, Y., Bozzetti, C., Ho, K.-F., Cao, J.-J., Han, Y., Daellenbach, K. R., Slowik, J. G., Platt, S. M., Canonaco, F., Zotter, P., Wolf, R., Pieber, S. M., Bruns, E. A., Crippa, M., Ciarelli, G., Piazzalunga, A., Schwikowski, M., Abbaszade, G., Schnelle-Kreis, J., Zimmermann, R., Baltensperger, U., El Haddad, I., and Prévôt, A. S. H.: High secondary aerosol contribution to particulate pollution during haze events in China, Nature, 514, 218–222, https://doi.org/10.1038/nature13774, 2014.
Huang, T., Fang, T., Feng, L., Leong, C. Y., and Yim, S. H. L.: Investigating the interaction between transboundary haze and planetary boundary layer in Singapore, Geophys. Res. Lett., 51, e2023GL107667, https://doi.org/10.1029/2023GL107667, 2024.
Huang, X., Ding, A., Wang, Z., Ding, K., Gao, J., Chai, F., and Fu, C.: Amplified transboundary transport of haze by aerosol–boundary layer interaction in China, Nat. Geosci., 13, 428–434, https://doi.org/10.1038/s41561-020-0583-4, 2020.
Kim, H. C., Chai, T., Stein, A., and Kondragunta, S.: Inverse modeling of fire emissions constrained by smoke plume transport using HYSPLIT dispersion model and geostationary satellite observations, Atmos. Chem. Phys., 20, 10259–10277, https://doi.org/10.5194/acp-20-10259-2020, 2020.
Klimont, Z., Kupiainen, K., Heyes, C., Purohit, P., Cofala, J., Rafaj, P., Borken-Kleefeld, J., and Schöpp, W.: Global anthropogenic emissions of particulate matter including black carbon, Atmos. Chem. Phys., 17, 8681–8723, https://doi.org/10.5194/acp-17-8681-2017, 2017.
Li, L., Dubovik, O., Derimian, Y., Schuster, G. L., Lapyonok, T., Litvinov, P., Ducos, F., Fuertes, D., Chen, C., Li, Z., Lopatin, A., Torres, B., and Che, H.: Retrieval of aerosol components directly from satellite and ground-based measurements, Atmos. Chem. Phys., 19, 13409–13443, https://doi.org/10.5194/acp-19-13409-2019, 2019.
Li, R., Wu, S., Sun, K., Wang, Q., Wang, X., Qin, S., Fan, M., Ma, L., Hao, Y., and Zheng, X.: Profiling of particulate matter transport flux based on dual-wavelength lidar and ensemble learning algorithm, Opt. Express, 32, 28892–28913, https://doi.org/10.1364/OE.522165, 2024.
Lin, C., Fung, J. C. H., Ren, C., Ng, E. Y. Y., Li, Y., He, Y., Leung, K. K. M., Ning, Z., and Lau, A. K. H.: Horizontal flux of ozone in the planetary boundary layer in Hong Kong using wind LiDAR measurements, Atmos. Environ., 312, 120046, https://doi.org/10.1016/j.atmosenv.2023.120046, 2023.
Liu, Q., Baumgartner, J., Zhang, Y., and Schauer, J. J.: Source apportionment of Beijing air pollution during a severe winter haze event and associated pro-inflammatory responses in lung epithelial cells, Atmos. Environ., 126, 28–35, https://doi.org/10.1016/j.atmosenv.2015.11.031, 2016.
Liu, Y. and Daum, P. H.: The effect of refractive index on size distributions and light scattering coefficients derived from optical particle counters, J. Aerosol Sci., 31, 945–957, https://doi.org/10.1016/S0021-8502(99)00573-X, 2000.
Lopatin, A., Dubovik, O., Chaikovsky, A., Goloub, P., Lapyonok, T., Tanré, D., and Litvinov, P.: Enhancement of aerosol characterization using synergy of lidar and sun-photometer coincident observations: the GARRLiC algorithm, Atmos. Meas. Tech., 6, 2065–2088, https://doi.org/10.5194/amt-6-2065-2013, 2013.
Lou, M., Guo, J., Wang, L., Xu, H., Chen, D., Miao, Y., Lv, Y., Li, Y., Guo, X., and Ma, S.: On the relationship between aerosol and boundary layer height in summer in China under different thermodynamic conditions, Earth Space Sci., 6, 887–901, https://doi.org/10.1029/2019EA000620, 2019.
Lv, M., Liu, D., Li, Z., Mao, J., Sun, Y., Wang, Z., Wang, Y., and Xie, C.: Hygroscopic growth of atmospheric aerosol particles based on lidar, radiosonde, and in situ measurements: Case studies from the Xinzhou field campaign, J. Quant. Spectrosc. Ra., 188, 60–70, https://doi.org/10.1016/j.jqsrt.2015.12.029, 2017.
Mamouri, R. E. and Ansmann, A.: Fine and coarse dust separation with polarization lidar, Atmos. Meas. Tech., 7, 3717–3735, https://doi.org/10.5194/amt-7-3717-2014, 2014.
Mamouri, R.-E. and Ansmann, A.: Potential of polarization/Raman lidar to separate fine dust, coarse dust, maritime, and anthropogenic aerosol profiles, Atmos. Meas. Tech., 10, 3403–3427, https://doi.org/10.5194/amt-10-3403-2017, 2017.
Mao, S., Yin, Z., Wang, L., Wei, Y., Bu, Z., Chen, Y., Dai, Y., Müller, D., and Wang, X.. Aerosol optical properties retrieved by polarization Raman lidar: Methodology and strategy of a quality-assurance tool, Remote Sens., 16, 207, https://doi.org/10.3390/rs16010207, 2024.
Müller, D., Wandinger, U., Althausen, D., and Fiebig, M.: Comprehensive particle characterization from three-wavelength Raman-lidar observations: case study, Appl. Optics, 40, 4863–4869, https://doi.org/10.1364/AO.40.004863, 2001.
Peng, L., Yi, F., Liu, F., Yin, Z., and He, Y.: Optical properties of aerosol and cloud particles measured by a single-line-extracted pure rotational Raman lidar, Opt. Express, 29, 21947–21964, https://doi.org/10.1364/OE.427864, 2021.
Pryor, S. C., Gallagher, M. W., Sievering, H., Larsen, S. E., Barthelmie, R. J., Birsan, F., Nemitz, E., Rinne, J., Kulmala, M., Grönholm, T., Taipale, R., and Vesala, T.: A review of measurement and modelling results of particle atmosphere–surface exchange, Tellus B, 60, 42–75, https://doi.org/10.1111/j.1600-0889.2007.00298.x, 2008.
Seinfeld, J. H., Pandis, S. N., and Noone, K. J.: Atmospheric Chemistry and Physics: From Air Pollution to Climate Change, Phys. Today, 51, 88–90, https://doi.org/10.1063/1.882420, 1998.
Smalikho, I. N.: Techniques of wind vector estimation from data measured with a scanning coherent Doppler lidar, J. Atmos. Ocean. Tech., 20, 276–291, https://doi.org/10.1175/1520-0426(2003)020<0276:TOWVEF>2.0.CO;2, 2003.
Swinbank, W. C.: The measurement of vertical transfer of heat and water vapor by eddies in the lower atmosphere, J. Meteorol., 8, 135–145, https://doi.org/10.1175/1520-0469(1951)008<0135:TMOVTO>2.0.CO;2, 1951.
Tanaka, T. Y., Kurosaki, Y., Chiba, M., Matsumura, T., Nagai, T., Yamazaki, A., Uchiyama, A., Tsunematsu, N., and Kai, K.: Possible transcontinental dust transport from North Africa and the Middle East to East Asia, Atmos. Environ., 39, 3901–3909, https://doi.org/10.1016/j.atmosenv.2005.03.034, 2005.
Tesche, M., Ansmann, A., Müller, D., Althausen, D., Mattis, I., Heese, B., Freudenthaler, V., Wiegner, M., Esselborn, M., Pisani, G., and Knippertz, P.: Vertical profiling of Saharan dust with Raman lidars and airborne HSRL in southern Morocco during SAMUM, Tellus B, 61, 144–164, https://doi.org/10.1111/j.1600-0889.2008.00390.x, 2009a.
Tesche, M., Ansmann, A., Müller, D., Engelmann, R., Freudenthaler, V., and Groß, S.: Vertically resolved separation of dust and smoke over Cape Verde using multiwavelength Raman and polarization lidars during Saharan Mineral Dust Experiment 2008, J. Geophys. Res.-Atmos., 114, D13202, https://doi.org/10.1029/2009JD011862, 2009b.
The State Council of the People's Republic of China: Action Plan on Air Pollution Prevention and Control, https://www.gov.cn/zwgk/2013-09/12/content_2486773.htm (last access: 6 July 2025), 2013.
Tian, P., Liu, D., Zhao, D., Yu, C., Liu, Q., Huang, M., Deng, Z., Ran, L., Wu, Y., Ding, S., Hu, K., Zhao, G., Zhao, C., and Ding, D.: In situ vertical characteristics of optical properties and heating rates of aerosol over Beijing, Atmos. Chem. Phys., 20, 2603–2622, https://doi.org/10.5194/acp-20-2603-2020, 2020.
Van Donkelaar, A., Martin, R. V., Brauer, M., Hsu, N. C., Kahn, R. A., Levy, R. C., Lyapustin, A., Sayer, A. M., and Winker, D. M.: Global estimates of fine particulate matter using a combined geophysical-statistical method with information from satellites, models, and monitors, Environ. Sci. Technol., 50, 3762–3772, https://doi.org/10.1021/acs.est.5b05833, 2016.
Wandinger, U., Linné, H., Bösenberg, J., Zeromskis, E., Althausen, D., and Müller, D.: Turbulent aerosol fluxes determined from combined observations with doppler wind and Raman aerosol lidar, in: 22nd International Laser Radar Conference (ILRC 2004), ESA Special Publications, 561, 743–746, 2004.
Wandinger, U., Freudenthaler, V., Baars, H., Amodeo, A., Engelmann, R., Mattis, I., Groß, S., Pappalardo, G., Giunta, A., D'Amico, G., Chaikovsky, A., Osipenko, F., Slesar, A., Nicolae, D., Belegante, L., Talianu, C., Serikov, I., Linné, H., Jansen, F., Apituley, A., Wilson, K. M., de Graaf, M., Trickl, T., Giehl, H., Adam, M., Comerón, A., Muñoz-Porcar, C., Rocadenbosch, F., Sicard, M., Tomás, S., Lange, D., Kumar, D., Pujadas, M., Molero, F., Fernández, A. J., Alados-Arboledas, L., Bravo-Aranda, J. A., Navas-Guzmán, F., Guerrero-Rascado, J. L., Granados-Muñoz, M. J., Preißler, J., Wagner, F., Gausa, M., Grigorov, I., Stoyanov, D., Iarlori, M., Rizi, V., Spinelli, N., Boselli, A., Wang, X., Lo Feudo, T., Perrone, M. R., De Tomasi, F., and Burlizzi, P.: EARLINET instrument intercomparison campaigns: overview on strategy and results, Atmos. Meas. Tech., 9, 1001–1023, https://doi.org/10.5194/amt-9-1001-2016, 2016.
Wang, L., Stanič, S., Eichinger, W., Močnik, G., Drinovec, L., and Gregorič, A.: Investigation of Aerosol Properties and Structures in Two Representative Meteorological Situations over the Vipava Valley Using Polarization Raman LiDAR, Atmosphere, 10, 128, https://doi.org/10.3390/atmos10030128, 2019a.
Wang, L., Stanič, S., Eichinger, W., Song, X., and Zavrtanik, M.: Development of an Automatic Polarization Raman LiDAR for Aerosol Monitoring over Complex Terrain, Sensors, 19, 3186, https://doi.org/10.3390/s19143186, 2019b.
Wang, L., Yin, Z., Bu, Z., Wang, A., Mao, S., Yi, Y., Müller, D., Chen, Y., and Wang, X.: Quality assessment of aerosol lidars at 1064 nm in the framework of the MEMO campaign, Atmos. Meas. Tech., 16, 4307–4318, https://doi.org/10.5194/amt-16-4307-2023, 2023.
Wang, W., Primbs, T., Tao, S., Zhu, T., and Simonich, S. L. M.: Atmospheric Particulate Matter Pollution during the 2008 Beijing Olympics, Environ. Sci. Technol., 43, 5314–5320, 2009.
Weinzierl, B., Sauer, D., Esselborn, M., Petzold, A., Veira, A., Rose, M., Mund, S., Wirth, M., Ansmann, A., Tesche, M., Gross, S., and Freudenthaler, V.: Microphysical and optical properties of dust and tropical biomass burning aerosol layers in the Cape Verde region – an overview of the airborne in situ and lidar measurements during SAMUM-2, Tellus B, 63, 589–618, https://doi.org/10.1111/j.1600-0889.2011.00566.x, 2011.
Weissmann, M., Braun, F. J., Gantner, L., Mayr, G. J., Rahm, S., and Reitebuch, O.: The structure of the Alpine mountain–plain circulation: airborne Doppler lidar measurements and numerical simulations, Mon. Weather Rev., 133, 3095–3109, https://doi.org/10.1175/MWR3012.1, 2005.
Yuan, R., Zhang, X., Liu, H., Gui, Y., Shao, B., Tao, X., Wang, Y., Zhong, J., Li, Y., and Gao, Z.: Aerosol vertical mass flux measurements during heavy aerosol pollution episodes at a rural site and an urban site in the Beijing area of the North China Plain, Atmos. Chem. Phys., 19, 12857–12874, https://doi.org/10.5194/acp-19-12857-2019, 2019.
Zhang, H., Wang, Y., Hu, J., Ying, Q., and Hu, X.-M.: Relationships between meteorological parameters and criteria air pollutants in three megacities in China, Environ. Res., 140, 242–254, https://doi.org/10.1016/j.envres.2015.04.004, 2015.
Zhang, R., Jing, J., Tao, J., Hsu, S.-C., Wang, G., Cao, J., Lee, C. S. L., Zhu, L., Chen, Z., Zhao, Y., and Shen, Z.: Chemical characterization and source apportionment of PM2.5 in Beijing: seasonal perspective, Atmos. Chem. Phys., 13, 7053–7074, https://doi.org/10.5194/acp-13-7053-2013, 2013.
Zhang, Y., Yi, F., Kong, W., and Yi, Y.: Slope characterization in combining analog and photon count data from atmospheric lidar measurements, Appl. Optics, 53, 7312–7320, https://doi.org/10.1364/AO.53.007312, 2014.
Zhang, Y., Guo, J., Yang, Y., Wang, Y., and Yim, S. H. L.: Vertical wind shear modulates particulate matter pollutions: A perspective from radar wind profiler observations in Beijing, China, Remote Sens., 12, 546, https://doi.org/10.3390/rs12030546, 2020.
Zhao, C., Wang, Y., Wang, Q., Li, Z., Wang, Z., and Liu, D.: A new cloud and aerosol layer detection method based on micropulse lidar measurements, J. Geophys. Res.-Atmos., 119, 6788–6802, https://doi.org/10.1002/2014JD021760, 2014.
Zou, W., Yin, Z., Dai, Y., Chen, Y., Bu, Z., and Li, S.: Robust Lidar-Radar Composite Cloud Boundary Detection Method With Rainfall Pixels Removal, IEEE T. Geosci. Remote, 62, 4111216, https://doi.org/10.1109/TGRS.2024.3476127, 2024.