the Creative Commons Attribution 4.0 License.
the Creative Commons Attribution 4.0 License.
 | 08 Jan 2026
Long-term trends in daytime cirrus cloud radiative effects: analyzing twenty years of Micropulse Lidar Network measurements at Greenbelt, Maryland in eastern North America
Erica K. Dolinar
Jasper R. Lewis
Andreu Salcedo-Bosch
James R. Campbell
Ellsworth J. Welton
This study analyzes a 20-year dataset (2003–2022) to understand long-term trends in radiative effects and optical properties of cirrus clouds. The research was conducted at NASA's Goddard Space Flight Center in Greenbelt, Maryland, USA, the primary location of the Micropulse Lidar Network (MPLNET) project. Analysis of net cloud radiative effects (CREs) at both the top-of-the-atmosphere (TOA) and surface (SFC) reveals decreases in radiative flux by −0.019 and −0.037 W m−2 yr−1 and −0.031 and −0.068 W m−2 yr−1, respectively, based on constrained solutions for lidar-derived 523/527/532 nm extinction coefficient (m−1) solved for lidar ratios bounded by 20 and 30 sr. Currently, key cloud properties such as boundary temperature and altitude, as well as integrated optical depth, remained stable with only minor seasonal changes. This study also uncovers a persistent decline in surface albedo, with a derived trend of −0.00036 yr−1. We further find that the interrelationship between CRE and surface albedo variation intensifies notably during winter months. This leads to speculation that a decrease in the number of days of snow and ice is the main driver of the decrease in surface albedo. The observed trends show a complex relationship between albedo, radiative flux, and climate, highlighting the need for continued monitoring due to their significant impact on future climate and weather patterns. We further quantify trend uncertainty with block-bootstrapped 95 % confidence intervals and evaluate sensitivity to solar zenith angle (SZA), finding that TOA trend magnitudes are partially explained by increasing SZA while surface trends remain robust.
- Article
(1489 KB) - Full-text XML
- BibTeX
- EndNote


The Intergovernmental Panel on Climate Change (IPCC) was founded in 1988 by the World Meteorological Organization (WMO) with the support of the United Nations Environment Program. Its purpose is to examine scientific, technological, and socioeconomic data relevant to understanding climate change. More than three decades have passed since the first meeting in 1990, and the importance of clouds and aerosols in Earth's climate system remains a focal point in both the fifth and sixth assessment reports (AR5 and AR6; Stocker, 2014; Landi et al., 2021). These reports highlight that clouds and aerosols significantly influence the regulation of Earth's temperature and energy balance by reflecting and absorbing sunlight. The reports also discuss the challenges associated with accurately representing the behavior and interconnection of clouds and aerosols in climate models, as these processes can vary greatly depending on factors such as location and atmospheric conditions. The report emphasizes the need for a deeper understanding of the roles of clouds and aerosols in the climate system to improve the accuracy of climate predictions. It stresses the importance of further research on the relationships among clouds, aerosols, and climate variations. AR6 also points out the importance of variations in cloud cover, as clouds are vital for controlling the global exchange of energy. Alterations in cloud patterns, whether due to interactions with aerosols or feedback mechanisms within clouds, can greatly influence how energy is distributed in the climate system. Accurate representation of cirrus occurrence and optical properties is essential for both daily numerical weather prediction and long-term climate projections. Improved cirrus parameterizations reduce shortwave flux biases at the surface and TOA, benefiting synoptic-scale forecasts and decadal climate simulations alike. Although numerous studies have evaluated short-term or geographically limited radiative impacts of cirrus clouds (Campbell et al., 2016; Lolli et al., 2017a; Campbell et al., 2021), a comprehensive long-term evaluation spanning multiple decades at a single site has not yet been systematically carried out. To bridge this gap, this study presents the first detailed analysis of the two-decade-long record (2003–2022) at the NASA Micropulse Lidar Network (MPLNET) observational site in Greenbelt, Maryland, USA. MPLNET complements NASA's Earth Observing System (EOS) satellites by providing continuous, vertically resolved cloud information for algorithm validation and process studies at high temporal resolution.
The uniqueness and novelty of this analysis reside in the use of a continuous and homogeneous dataset in conjunction with rigorous statistical methodologies (Mann-Kendall and Sen slope analyses) to identify statistically significant temporal trends in the radiative effects of cirrus clouds at both the top of the atmosphere (TOA) and the surface (SFC). This broad temporal span not only enables the detection of subtle climatic patterns that emerge from intrinsic variability (Weatherhead et al., 1998a), but also provides an essential understanding of feedback processes specific to certain regions and their repercussions on global climate behavior. An essential part of understanding changes within a highly dynamic system such as the Earth's atmosphere involves a quantitative evaluation of trend significance, which is determined in relation to the precision of the fundamental measurements (Weatherhead et al., 1998a). Consequently, careful consideration must be given to the duration and quality of the observations necessary to capture atmospheric trends of varying magnitudes (Weatherhead et al., 2002). Despite the importance of attributing changing conditions to the effects of climate variability, it can unfortunately be insufficient to simply establish long-term remote sensing platforms in the absence of a practical understanding of the challenges in identifying significant trends amid complex datasets (Weatherhead et al., 2018). Regarding the radiative and macrophysical characteristics of clouds, the advancement of satellite technology, combined with the emergence of reliable ground-based profiling instruments, has led to the collection of more than two decades of lidar measurements to evaluate the effects of climate change (Cermak et al., 2006). This study aims to evaluate the long-term trends and variability of the radiative effects of cirrus clouds as well as their macrophysical properties. We focus on daytime conditions, since cirrus clouds can exert a net cooling or warming effect depending on a host of internal and external factors (Stephens and Webster, 1981). Three previous studies by the same group provide snapshots of equivalent forcing and macrophysical properties at a series of different latitudes: Singapore (equatorial, Lolli et al., 2017a), Greenbelt, Maryland, USA (mid-latitude; Campbell et al., 2016) and Fairbanks, Alaska, USA (polar; Campbell et al., 2021). Therein, they describe how the daytime forcing of cirrus clouds exhibits a meridional gradient from warming near the equator to neutral or slight cooling near the poles. The relative contribution of radiative effects of cirrus clouds is in direct contrast to the net cooling contribution overall (that is, day and night) of all clouds to the climate (near −20 W m−2, for example, in Ramanathan et al., 1989; Yi et al., 2017). An enhanced understanding of the radiative properties of cirrus clouds and the subsequent refinement of their parameterization is essential to improve the precision of numerical models. Cirrus clouds significantly influence Earth's energy balance by modulating energy flux exchanges. Therefore, a better representation of the model is crucial for both short-term, day-to-day weather modeling (Berry and Mace, 2013) and long-term climate forecasting (Kärcher et al., 2006).
Nadir-pointing lidars have been routinely profiling the microphysical, optical, and geometric properties of cirrus clouds at different sites around the world for over 40 years (see, e.g., Platt et al., 1987; Imasu and Iwasaka, 1991; Sassen et al., 2001; Sassen and Campbell, 2001). These active optical remote sensing instruments, whose prevalence increased following the invention of lasers (Ciofini et al., 2003), are well suited to investigate aerosols, clouds, and light precipitation (Lolli et al., 2017b; Lolli, 2021) due to their high spatial and temporal resolution, as well as their distinct spectral sensitivity. Cirrus clouds, with irregular particle sizes and shapes, have proven ideal targets for polarized lidar profiling (Sassen, 2005). Still, their early deployment and application was sporadic and widely distributed given their novelty, their highly-specialized technical nature, and the hazards of operating with an active laser source. The development and emergence of the eye-safe Micropulse Lidar system (Spinhirne, 1993) initiated the transition of lidar technology from an episodic remote sensing tool to continuous full-time measurements. At the beginning of the 21st century, NASA instituted the Micropulse Lidar Network (MPLNET; Welton et al., 2001; Campbell et al., 2002; Welton et al., 2018) as an integral component of its Earth Observing System (EOS) program (Wielicki et al., 1995), designed to provide ongoing and consistent observations of Earth's system for advancing climate research. MPLNET contributes to the EOS mission by providing high-resolution, ground-based data on cloud and aerosol vertical structure, which are crucial for validating and complementing the observations from EOS satellites. Currently, over 25 years since its constitution, MPLNET holds the most extensive continuous record of ground-based cirrus cloud observations. The MPLNET database allows for a unique assessment of the long-term time evolution of cirrus cloud presence, their optical properties, and, through radiative transfer modeling, their radiative effects. This research aims to identify temporal trends related to global climate forcing. This study presents the most extensive long-term analysis of daytime cirrus cloud radiative effects using a continuous 20-year dataset from NASA MPLNET at GSFC, Maryland. Unlike previous studies that focused on shorter temporal scales or limited geographic regions, this research utilizes a unique combination of high-resolution ground-based lidar measurements and radiative transfer modeling to detect statistically significant trends in cirrus cloud radiative effects at both the top of the atmosphere (TOA) and the surface (SFC). The study also provides new information on the interplay between cirrus clouds, surface albedo, and climate feedback mechanisms, revealing a persistent decline in radiative fluxes suggesting an evolving atmospheric energy balance. Using advanced statistical techniques, including the Mann-Kendall test and the Sen slope estimator, this work ensures robust trend detection despite natural variability. The findings have direct implications for improving climate models, as they highlight the importance of continued ground-based lidar monitoring for assessing long-term changes in cloud-radiation interactions. Twenty years (2003–2022) of lidar measurements were collected at the NASA Goddard Space Flight Center (GSFC) in Greenbelt, Maryland, USA (38.99° N, 76.85° W). The data record is normalized, when necessary, to avoid breaks in observations due to instrument failures and unrepresented months caused by adverse operating conditions (e.g., strong presence of fog and/or rain and / or water clouds). The significance of the temporal trends derived herein are characterized using both the non-parametric seasonal Mann-Kendall test in conjunction with the slope calculated using Sen's. Moreover, the significance of temporal trends is determined by employing statistical methods that account for natural variability and measurement uncertainties (Weatherhead et al., 1998a). Our goal is to understand changes in cirrus clouds over the two-decade record collected at GSFC. However, we also want to understand the nature of the MPLNET record with respect to the significance of the trends derived therein. Our objective is to comprehensively assess the scope of the MPLNET archive for climatological research and to establish a foundational framework for the collection of lidar datasets that facilitate studies based on trend analysis.
We start by describing the instruments and datasets used in the analysis. All input products are available through the MPLNET online data portal https://mplnet.gsfc.nasa.gov (last access: 29 November 2025). The data used in this study are publicly available and can be accessed through the NASA MPLNET data portal (https://mplnet.gsfc.nasa.gov, last access: 29 November 2025).
2.1 Instruments
2.1.1 The NASA MPLNET lidar network
The NASA MPLNET network has been operational since 1999 and consists of a collection of commercially available micropulse lidar (MPL) systems produced by LEICA Geosystems, Lanham, MD, USA (formerly SigmaSpace) (Welton et al., 2001). These MPL instruments (Spinhirne et al., 1995) are single-wavelength elastic lidars and are globally deployed to support the NASA Earth Observing System (EOS) program (Wielicki et al., 1995). MPLNET continuously monitors the atmosphere every 60 s from the surface up to 30 km. The adjustable vertical resolution of the profile software can be set in the range of 0.030 to 0.075 km, depending on the station. The network operates under any meteorological conditions. A minimum Signal-to-Noise Ratio of 3 is generally required for meaningful aerosol retrievals. The signal is considered fully attenuated when it drops to the background noise level, which typically occurs in optically thick clouds (Cloud Optical Depth >3.0), preventing retrievals beyond this point. This threshold helps to ensure that noise does not significantly distort the derived profiles of extinction and backscatter (Campbell et al., 2002). Temporary and permanent observation sites are operational in various regions, such as the polar, mid-latitude, tropical, and equatorial regions, to collect information on the optical and geometric properties of aerosols and clouds. Each lidar instrument is usually co-located with NASA Aerosol Robotic Network (AERONET; Holben et al., 1998) sunphotometers to constrain the lidar ratio in the lidar inversion and reduce uncertainties in the retrieved optical properties. This is because AERONET provides an independent and highly accurate measurement of the column optical depth (OD), which helps to more accurately separate the aerosol and cloud components of the lidar signal during the inversion process, leading to a more precise calculation of the cloud extinction profile. The MPLNET products, publicly available on the website https://mplnet.gsfc.nasa.gov/ (last access: 29 November 2025), follow the modified EOS convention, which has three levels: Level 1 and Level L1.5 data are available in near-real time (NRT). Level 2 data is available upon request. The primary difference between L2 and L1/15 files is that L2 may have additional post-calibrations applied as well as corrections to instrument temperatures. The only difference between the L1 and L1.5 products is that the data that do not meet the L1.5 Quality Assurance (QA) criteria are screened and replaced with a Not-a-Number (NaN) value in the files.
2.1.2 Measurement Site
Twenty years of lidar-derived cirrus cloud optical property profiles were obtained from the MPLNET GSFC permanent observation site. The station is located in Greenbelt, MD, USA (38.99° N and 76.84° W) at an altitude of 50 m above sea level. The site is classified as urban, being part of the Washington-Baltimore metropolitan area. CALIPSO regional cloud fraction is used to compute diurnal scaling factors in the CRE aggregation (Sect. 2.3).
2.2 Data Processing
This study presents for the first time the findings derived from analyzing such an extensive data set for TOA cloud radiative effect (CRE) from ground-based measurements. The instantaneous TOA CRE was standardized by multiplying its values by the daytime fraction of cirrus cloud occurrence, which was derived from the 15-year record of the Cloud-Aerosol Lidar with Orthogonal Polarization (CALIOP) instrument onboard the CALIPSO satellite that operated from 2006–2023 (Vaughan et al., 2009; Winker et al., 2009). This normalization accounts for the fact that cirrus clouds are not always present during the daytime. A single ground-based lidar provides measurements only directly overhead and therefore cannot produce a climatologically representative cloud fraction for a region. CALIPSO provides a long-term and spatially broader dataset for the fraction of cirrus clouds over the Greenbelt area, which is necessary to scale the instantaneous CRE values into a diurnally and regionally representative radiative effect. Although we acknowledge the limitation that CALIPSO measurements are not perfectly co-located in time and space with MPLNET observations, using a long-term (15-year) regional average is the most robust available method for this scaling. The methodology previously reported in Campbell et al. (2016), Lolli et al. (2017a), Campbell et al. (2021) was used to retrieve the cirrus cloud extinction profile and cloud optical depth (COD). In those previous studies, lidar observations were used to assess a yearly and biannual analysis of CRE at three different observational sites deployed at three different latitudes: GSFC, MD, USA (Campbell et al., 2016), Singapore (Lolli et al., 2017a) and Fairbanks, AK, USA (Campbell et al., 2021). These yearly analyses put into evidence that the daytime TOA net CRE shows latitudinal variability (South-North direction in the boreal hemisphere, North-South direction in the austral hemisphere) due to the different average solar zenith angles at the three different sites. The TOA net CRE is positive for equatorial and tropical regions, almost neutral at mid-latitudes, and slightly negative for polar regions.
2.3 Retrieval methods
2.3.1 Cirrus cloud extinction and optical depth
Cirrus cloud retrievals and calculations of extinction and COD are done using the same procedure from previous MPLNET CRE studies (Campbell et al., 2016; Lolli et al., 2017a; Campbell et al., 2021; Dolinar et al., 2024). Profiles containing single-layer cirrus clouds (that is, no aerosols, other cloud forms, or precipitation) are selected from MPLNET cloud detections (Campbell et al., 2008; Lewis et al., 2016, 2020) at GSFC. The analysis workflow first selects for profiles containing only single-layer cirrus clouds. This is achieved by screening profiles to exclude any cases with multiple cloud layers, low-level water clouds, or significant aerosol layers detected below the cirrus layer by the MPLNET algorithms. Then, using “bookend” effective lidar ratios of 20 and 30 sr, unconstrained retrievals of the cloud extinction coefficient are performed. The term “bookend” signifies that these two values represent well-established lower and upper bounds for cirrus cloud lidar ratios based on extensive literature (Yorks et al., 2011; Sassen and Comstock, 2001; Lewis et al., 2016), thereby providing a range for the retrieved optical properties that accounts for the inherent variability and uncertainty of the true lidar ratio. The profile of the extinction coefficient is integrated with respect to altitude to provide lower (20 sr) and upper (30 sr) limits of the COD. The effective lidar ratios are chosen based on reported literature (Yorks et al., 2011; Sassen and Comstock, 2001; Lewis et al., 2016) and account for the effects of multiple scattering. Multiple scattering, which is the process by which a photon is scattered multiple times before being detected by the lidar, is expected to be minimal due to the small field of view of the MPL (100 µrad) (Comstock et al., 2002). However, its residual effect is implicitly included in the empirically derived effective lidar ratios, which account for the slight enhancement of the backscatter signal due to multiple scattering within cirrus. The cloud layer height retrievals are carried out using the uncertainty-based cloud detection method (UCDM), as fully explained by Campbell et al. (2008), Lewis et al. (2016). In short, the UCDM identifies cloud layers by setting a detection threshold based on the statistical uncertainty of the lidar signal. This uncertainty is quantified as the standard deviation of the signal in a region of the atmosphere known to be free of clouds and aerosols (typically the upper troposphere). This uncertainty is then used to set a threshold for cloud detection, where a signal is identified as a cloud layer if it is significantly higher than background noise. A signal return from a potential cloud layer must exceed this background noise level by a statistically significant margin to be identified as a cloud, thereby minimizing false detections. Cirrus clouds are classified using the cloud top temperature threshold below −37 °C suggested by Campbell et al. (2015) and cloud base temperature below −25 °C. Non-cirrus clouds, cirrus clouds with a Cloud Optical Depth (COD) of less than 0.005 or greater than 3.0, and all clouds identified using the gradient-based cloud detection method (GCDM; Lewis et al., 2016) are removed from this study. The GCDM is a complementary cloud detection algorithm that identifies clouds boundaries based on detecting strong gradients in the lidar signal, while the COD is a dimensionless measure of the total attenuation of light by a cloud. The meteorological profiles required for the identification and radiative transfer of cirrus, including temperature, specific humidity, and ozone, are derived from the Goddard Earth Observing System Model version 5 (GEOS-5) Forward Processing for Instrument Teams (FP-IT) atmospheric general circulation model (Rienecker et al., 2008; Molod et al., 2012).
2.3.2 Cirrus cloud radiative effect
The Fu-Liou-Gu Radiative Transfer Model
The Fu-Liou-Gu (FLG) radiative transfer model was specifically chosen for this study because of its established accuracy and flexibility in simulating radiative processes involving clouds and aerosols. Compared to simpler single-scattering or two-stream models, the FLG model effectively accounts for multiple scattering events and spectral variation of cloud and atmospheric constituents by employing the discrete-ordinate approach. This method significantly improves the representation of radiative interactions within optically thin cirrus clouds, a critical factor given their complex optical characteristics. Moreover, previous validation studies have demonstrated that the FLG model reliably captures both direct and diffuse radiative components, which is essential for accurately quantifying the subtle radiative effects of cirrus clouds (Fu and Liou, 1992; Gu et al., 2003). These advantages make the FLG model particularly suitable for examining long-term trends in cloud radiative effects and assessing their implications for climate studies, thus motivating its selection for this analysis. FLG model is a widely used tool for simulating the transport of broadband solar and infrared radiation through the atmosphere. It was developed by Fu and Liou (1992, 1993), and subsequently extended by Gu et al. (2003). The FLG model solves the radiative transfer equation using a discrete ordinate approach to represent the angular distribution of incoming and outgoing radiation. This method allows for both direct sun irradiance and diffuse sky radiation to be considered. In addition, scattering between different levels in the atmosphere can be considered, which greatly improves the accuracy of simulations compared to other simpler single-scattering models. The FLG model works by assuming that incoming solar radiation is divided into 18 total spectral bands (6 in the solar (0.2–4 µm) and 12 in the infrared (4.5–1000 µm)) and the outgoing terrestrial radiation is divided into four flux streams (visible, short-wave infrared, long-wave infrared, and total reflected solar radiation). These fluxes are then calculated on the basis of their reflectivity or absorptivity depending on the properties of different layers within the atmosphere such as aerosols, clouds, or other components like water vapor or ozone. To accurately simulate atmospheric processes, the FLG model requires detailed knowledge of atmospheric properties such as temperature, humidity, and ozone profiles, aerosol concentrations, and optical thicknesses in each layer of air. These parameters are then used to compute various quantities such as transmittance across each layer, extinction coefficients due to scattering or absorption by aerosols and cloud droplets/ice crystals, surface reflectance, etc., all necessary components that influence how solar energy is partitioned within an atmosphere (Fu and Liou, 1992, 1993; Gu et al., 2003). The FLG model has been successfully applied in numerous studies to assess the radiative effect of clouds and aerosols (Tosca et al., 2017; Lolli et al., 2019; Landi et al., 2021; Dolinar et al., 2024). In all of those cases, instantaneous radiative effects are computed by directly injecting the 1 min aerosol/cloud profiles at 1 min temporal resolution and 0.075 km spatial resolution into the FLG model. FLG then outputs the instantaneous upward and downward solar and infrared fluxes from which the radiative effects can be calculated at the TOA and surface.
The absolute daytime net CRE is calculated as a weighted average that integrates radiative effects on the observed distribution of cloud optical depths, normalized by cloud and daytime fractions. The calculation for the TOA is shown in Eq. (1), and an analogous equation is used for the SFC.
where the summation is over all Cloud Optical Depth (COD) bins i from 0 to 3:
-
COD_RFi – Relative frequency of occurrence for cirrus clouds in a specific COD bin i.
-
– The average cloud radiative forcing (clear-sky flux minus cloudy-sky flux) for all clouds within that same COD bin i.
-
CF – The regional cirrus cloud fraction, derived from the 15-year CALIPSO record.
-
DF – The daytime fraction (i.e., fraction of a 24 h period that is daylight).
Similarly, the daytime surface cirrus CRE is
with identical notation to the TOA definition. For monthly means, we average instantaneous 1 min values within calendar months before aggregation. To avoid ambiguity, we reserve CRE for aggregated quantities and CRFi for COD-bin-resolved forcing.
Here is the COD-bin weight, and DFi is the daytime fraction; denotes the bin-mean surface CRE (W m−2) used in Eq. (2).
2.4 Long-Term Trend Analysis
The optimal method for identifying temporal trends is a non-parametric, rank-based approach, well suited for managing missing data, negative values, and values below detection limits without relying on a specific statistical distribution. In this study, we employ the Mann-Kendall (MK) test to uncover long-term monotonic trends, either upward or downward, and use the Sen's slope estimator to determine the slope and its 95 % confidence limits from the median of slopes calculated from all possible data pairs. Due to distinct seasonal patterns in many time series, the modified seasonal MK test (Hirsch et al., 1982) is consistently used to assess trends over a 12-month period. The MK test is suitable for small samples that are often found in environmental studies. Furthermore, it is robust against heteroskedasticity, which refers to the condition in which the variance of errors, or the variability of a variable, is unequal across the range of values of a second variable that predicts it and lacks the assumption of normality (Mann, 1945; Kendall, 1948). Originally proposed as an extension of the Spearman rank correlation test, it can identify both linear and non-linear time-based changes unlike Spearman's rho, which only detects linear relationships (Yue et al., 2002). Although the MK test has greater statistical power than other trend tests, it is sensitive to autocorrelation, which can increase the probability of false positives by incorrectly rejecting the null hypothesis of no trend (Collaud Coen et al., 2020). Because monthly series exhibit modest autocorrelation (e.g., Table 4), we did not pre-whiten the data; instead, we quantify uncertainty using a moving-block bootstrap that preserves serial dependence (Sect. 2.4.1).
2.4.1 Trend estimation and uncertainty
We estimate monotonic trends using the Theil–Sen estimator and assess significance with the (seasonal) Mann–Kendall test. 95 % confidence intervals (CI) for Sen slopes are computed using a moving block bootstrap (12 month blocks; B=2000) to preserve serial correlation. For comparison, we report ordinary least squares (OLS) slopes with Newey–West 95 % CI. The Newey-West 95 % CI refers to confidence intervals adjusted for heteroskedasticity and autocorrelation using the Newey-West estimator.
2.5 SZA sensitivity and instrument check
We estimate an SZA-adjusted trend from (reporting β1 with Newey–West 95 % CI), and we repeat the Sen slopes for 2003–2009 vs. 2010–2022 to test for an instrument-related slope change (time × post-2010 interaction).
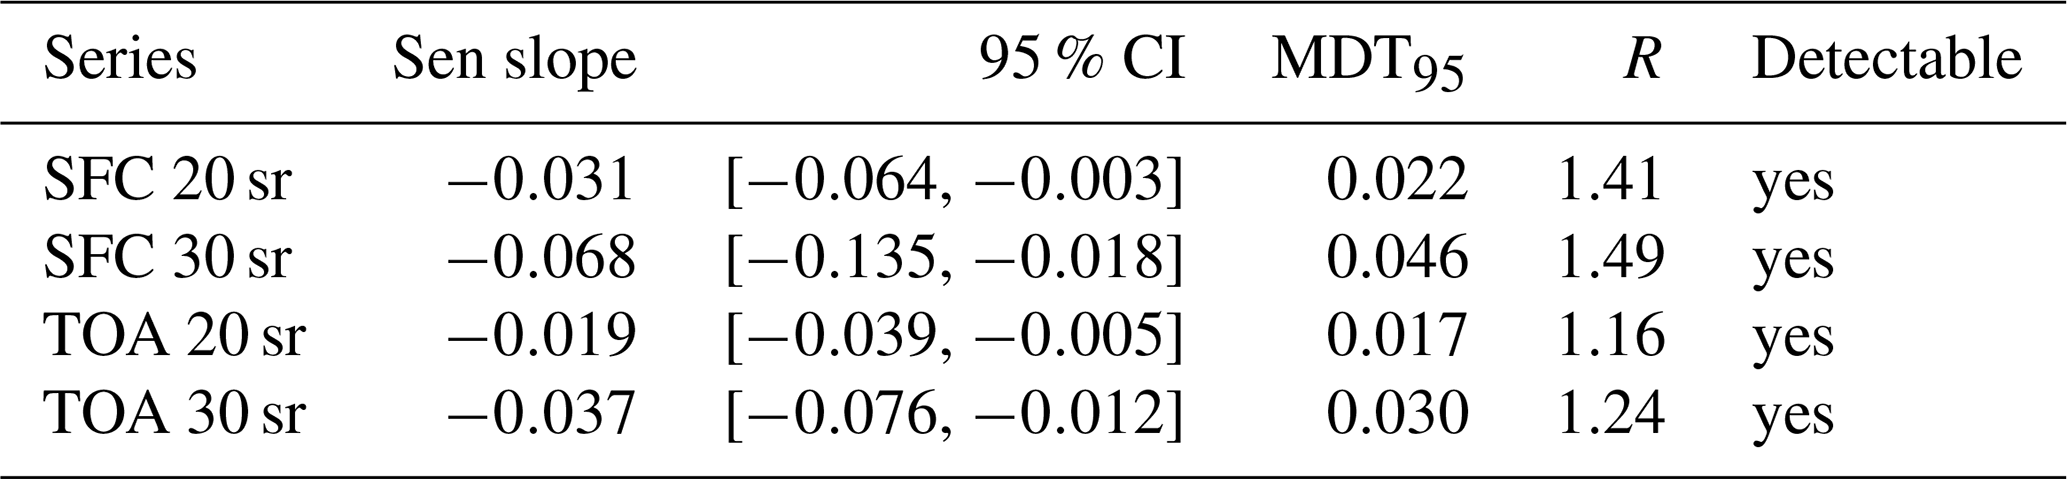
Table 1SZA–adjusted trends (β1 with Newey–West HAC(12) 95 % CI) and split-period Theil–Sen slopes (95 % CI). Units: W m−2 yr−1.
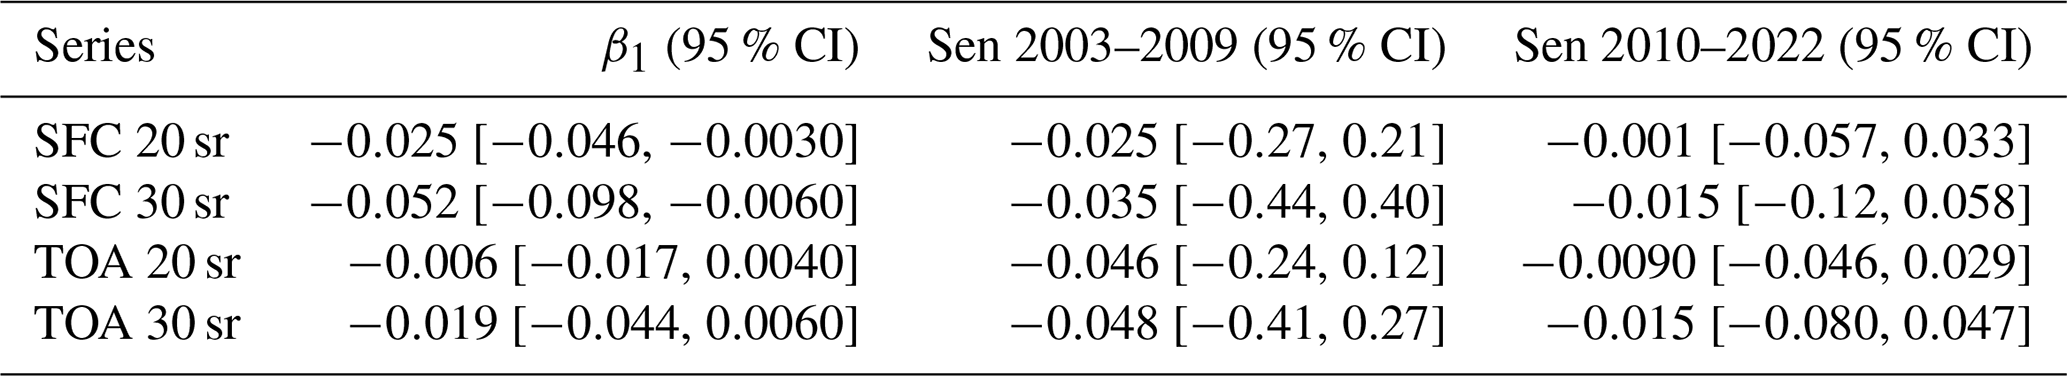
β1 from with HAC(12) 95 % CI. Sen slopes use a 12-month moving-block bootstrap for 95 % CI.
The surface CRE trends remain significantly negative, while the TOA trends weaken and are not statistically significant. For SFC 20 sr, the SZA-adjusted trend is W m−2 yr−1 (95 % CI ), and for SFC 30 sr W m−2 yr−1 (95 % CI ); both exclude zero. In contrast, TOA 20 sr and TOA 30 sr are (95 % CI ) and (95 % CI ) W m−2 yr−1, respectively, which include zero. Theil-Sen split period slopes are consistently negative in sign but imprecise within each subperiod. SFC 20 sr: −0.025 (2003–2009) vs. −0.0010 (2010–2022); SFC 30 sr: −0.035 vs. −0.015 ; TOA 20 sr: −0.046 vs. −0.0090 ; TOA 30 sr: −0.048 vs. −0.015 W m−2 yr−1. Taken together, these diagnostics indicate that negative SFC trends are robust to SZA variability, while SZA-adjusted TOA trends are negative in sign (−0.019 to −0.0060 W m−2 yr−1), but their confidence intervals 95 % include zero; therefore, we treat them as suggestive but not statistically robust at the level 95 %.
2.5.1 Minimum Detectable Trend
We estimate the minimum detectable trend at the level 95 % (MDT95) by Monte Carlo simulation of AR(1) surrogates that preserve monthly seasonality, series length and lag-1 autocorrelation. For each series, we compute the Theil-Sen slopes on 2000 null realizations and define MDT95 as the 95th percentile of . This approach aligns with the Weatherhead framework while accounting for serial dependence and seasonal structure. See Table 4 for the values of ϕ, σ, and MDT95.
-
Calculation of Lag-1 autocorrelation (ϕ). This measures the correlation of the time series with a one-month delay, indicating the persistence of the signal over time.
-
Standard Deviation of Residuals (σ). The residuals were calculated by subtracting the mean from each data point, and the standard deviation of these residuals was calculated. This provides an estimate of the variability of the data around its mean.
-
Number of Data Points (n). The total number of observations was counted, which in this dataset is 212, representing monthly measurements over approximately 17.67 years.
-
Time Span (T). The total time span of the data, calculated by dividing the number of data points by 12, gives the duration of the dataset in years.
-
Minimum Detectable Trend (MDT95). Using the formula:
where σ is the standard deviation, ϕ is the lag-1 autocorrelation, n is the number of data points and T is the time interval in which the minimum detectable trend was calculated. This metric denotes the minimal detectable trend within the provided dataset, considering its intrinsic variability and autocorrelation (Weatherhead et al., 1998a).
Table 1 summarizes the SZA-adjusted trends and split-period Theil–Sen slopes for the TOA and surface daytime cirrus CRE series.
3.1 Daytime cirrus cloud dataset statistical analysis
The optical properties of the daytime cirrus clouds (for example, the vertical extinction coefficient and the optical depth) were obtained from the MPLNET cloud product version 3 (CLD; Lewis et al., 2016). Consistently with Campbell et al. (2016), we define daytime clouds as those when the incoming solar flux is greater than the total (solar + IR) outgoing clear-sky flux at the TOA. Moreover, we conduct a visual inspection to ensure a consistent database with balanced monthly data, checking for potential interruptions due to initial data collection errors, changes in measurement methods, or equipment failures. The CRE cannot be considered a continuous variable such as temperature because it depends on the presence of cirrus clouds. In this study, we apply the seasonal Mann-Kendall nonparametric test along with Sen's slope to the monthly averaged daytime cirrus CRE and optical depth from 2003 to 2022. Figure 1 shows that the inconsistent occurrence of cirrus clouds results in minimal autocorrelation.
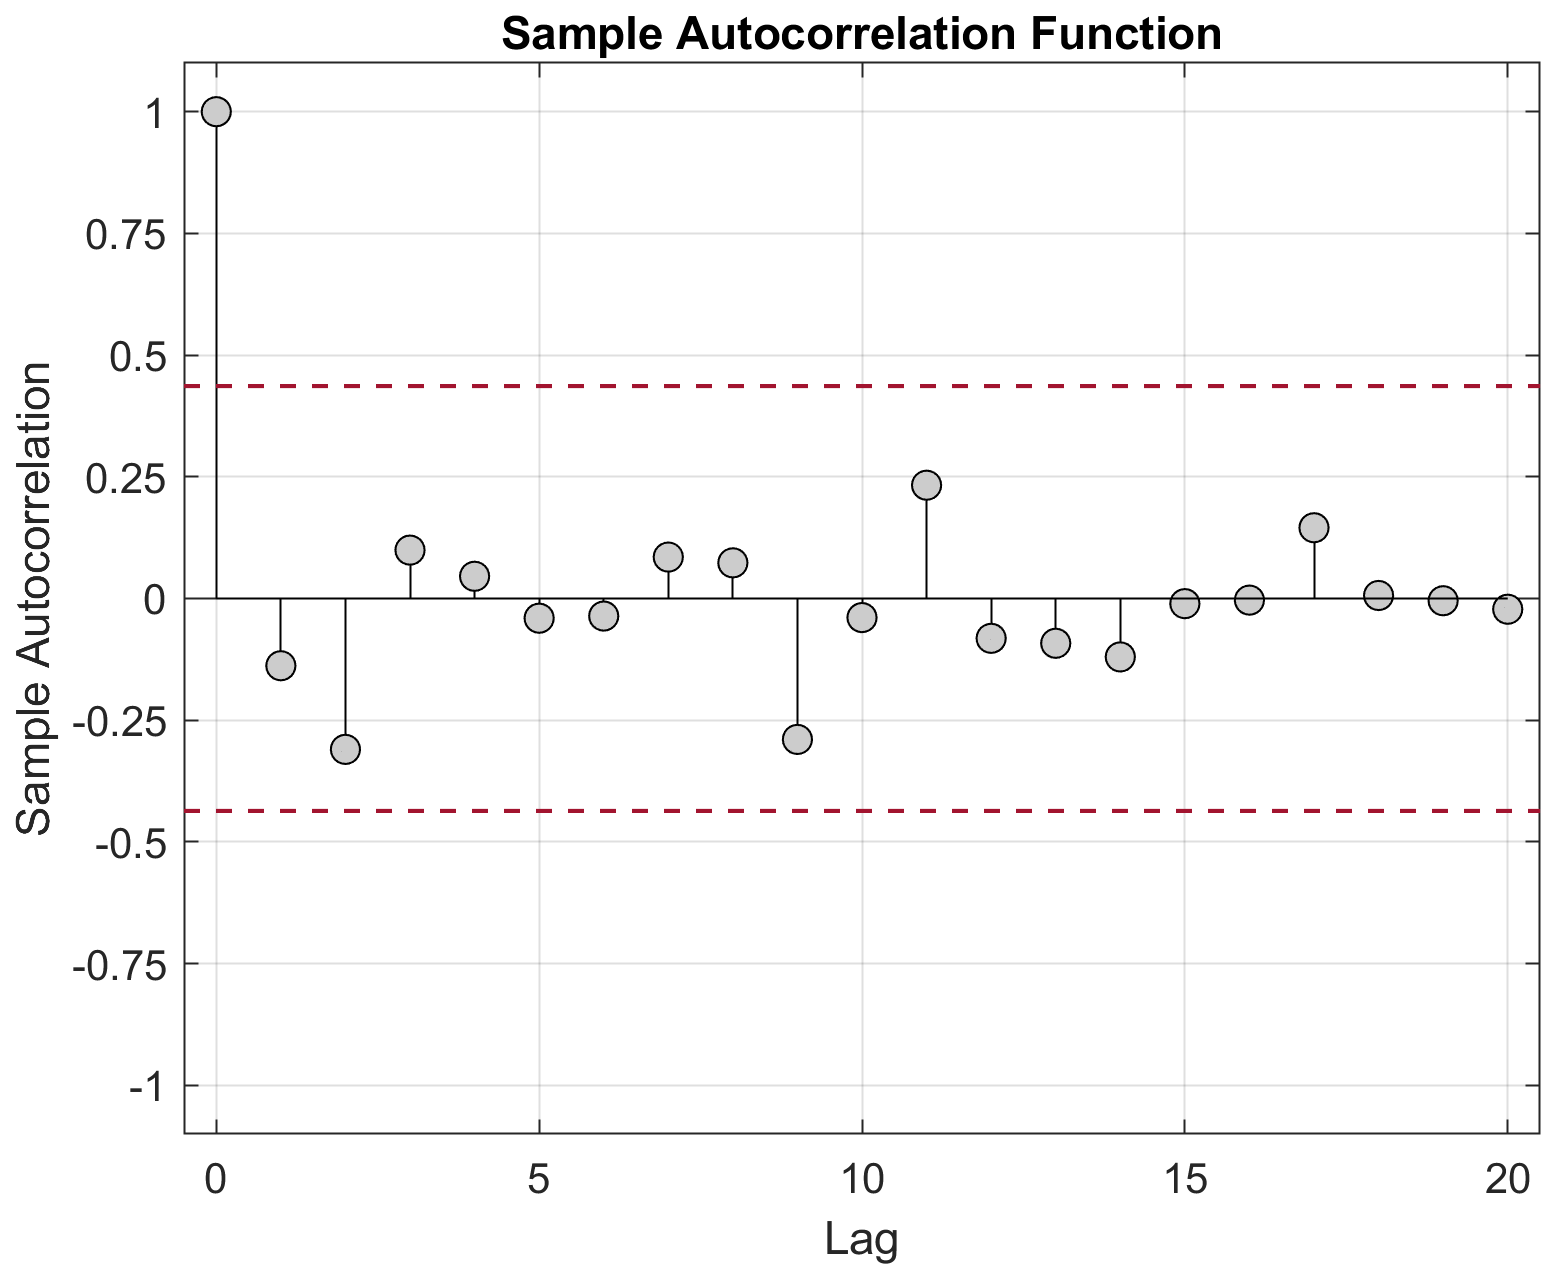
Figure 1Autocorrelation of the monthly averaged Cloud Radiative Effect (CRE), showing no significant autocorrelation in the data.
Cirrus clouds are identified using a cloud top temperature threshold of −37 °C, based on NASA GEOS-5 meteorological data (Campbell et al., 2015), along with the retrievals of unconstrained extinction coefficients using lidar ratios of 20 and 30 sr. The COD is computed as the product of the lidar spatial resolution and the atmospheric extinction profile. If corresponding to a daytime cirrus cloud, the extinction profile is then input into FLG to compute the TOA and SFC CREs. Figure 2 illustrates that, in 85 % of months, the monthly averages are derived from at least 1000 valid 1-min profiles.

Figure 2Histogram of the number of valid 1 min cirrus cloud profiles used for analysis each month. 85 % of months have an average of at least 1000 cloud samples, ensuring robust monthly statistics.
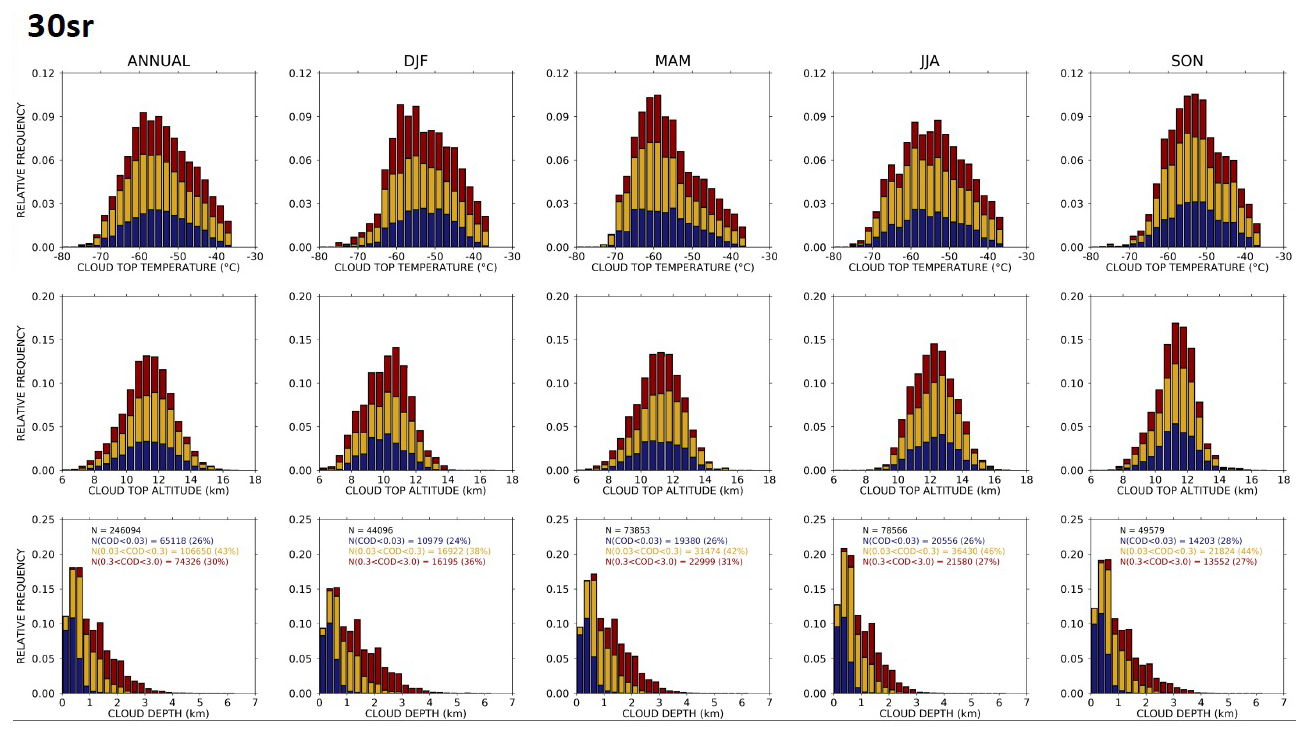
Figure 3Seasonal distributions of cloud top temperature, altitude, and depth, estimated using a 30 sr lidar ratio, over a 20-year period. Cloud top temperature peaks around −55 °C, cloud top altitude around 13–14 km, and cloud depth is predominantly less than 2 km, showing minimal seasonal variations across all metrics. Histogram colors represent different ranges of cloud optical depth:blue indicates optically thin cirrus (COD <0.03), yellow represents semi-transparent cirrus (), and red denotes optically thick cirrus (COD >0.3).
Figure 3 illustrates a comprehensive statistical analysis of three key cloud-related parameters, cloud top temperature, cloud top altitude, and cloud geometric depth averaged over different temporal windows for the 20-year database estimated from the 30 sr solution. The histograms display the relative frequency distributions of these parameters for the annual average and for each season: DJF (December, January, February), MAM (March, April, May), JJA (June, July, August), and SON (September, October, November). The first row of histograms shows the distribution of cloud top temperature, which ranges from approximately −80 to −30 °C. The distribution is roughly Gaussian in shape, with a peak around −55 °C. There are subtle variations across seasons, indicating that while cloud top temperatures are relatively stable on an annual basis, there are minor seasonal fluctuations. The second row represents the distribution of the cloud top altitude, spanning from around 6 to 18 km. These histograms also follow a Gaussian-like distribution, reaching a peak at approximately 13–14 km. Similarly to temperature, seasonal differences in altitude are minimal, suggesting a consistent vertical structure of clouds throughout the year. The third row focuses on the depth of the cloud, showing a different distribution compared with the other parameters. The distribution of cloud depth is skewed towards lower values, with a rapid decline in frequency as depth increases from 0 to 7 km. This indicates that shallow clouds dominate the dataset. Although the proportion of shallow versus deep clouds shows slight seasonal variation, the overall pattern remains consistent. In summary, the data suggest that cloud characteristics such as top temperature and altitude are relatively stable across different temporal windows, with only minor seasonal variations, whereas cloud depth exhibits a skewed distribution that consistently favors shallower clouds throughout the 20-year period.
3.2 Surface albedo
The albedo is a measure of surface brightness, and its significance in radiative transfer models stems from the fact that it influences how much incoming solar radiation is reflected by the surface. Albedo is defined as the percentage of incoming solar energy reflected by the Earth's surface (Ineichen et al., 1990). The quantity of energy absorbed by a medium is determined by its albedo; for example, surfaces with higher albedo, such as snow-covered areas, absorb less energy than surfaces with lower albedo, such as darker soils. The FLG radiative transfer model requires surface albedo as input to compute cloud heating rates and radiative effects. Changes in surface albedo produce significant effects on the Earth-atmosphere radiative budget. In this study, for broadband solar reflection, the monthly mean gridded surface albedo (with 1° × 1° resolution) of the Clouds and Earth Radiant Energy System (Wielicki et al., 1995) SYN1deg, version 4 product is used. The surface IR emissivity is set at 0.98 and is considered constant. The observed negative trends, particularly pronounced during the winter and summer months, indicate an evolving atmospheric energy balance that could contribute to regional warming through positive feedback mechanisms. Concurrently, a significant decline in surface albedo, driven likely by reductions in snow and ice coverage, further amplifies these implications, underscoring the climatological significance of the observed radiative trends. Detailed statistical findings from the Mann-Kendall trend test and Sen slope values are described in the following subsections.
3.3 Cirrus cloud atmospheric radiative effects
In this section, we perform a long-term trend analysis of the atmospheric radiative effects of cirrus clouds during the day (see, e.g., Fig. 4). A positive (negative) TOA CRE indicates warming (cooling) of the Earth-atmosphere system. The seasonal MK test is performed on monthly-averaged daytime CRE observations, which are calculated by averaging all instantaneous 1 min CRE values (derived for each valid cirrus profile) within a given calendar month. We consider trends statistically significant at the 95 % confidence level (p<0.05). Over 2003–2022, Theil–Sen slopes (95 % CI) are: TOA 30 sr []; TOA 20 sr −0.019 []; SFC 30 sr −0.068 []; SFC 20 sr −0.031 []. The summary of results is presented in Table 3 and provides a comprehensive summary of the temporal trends of various atmospheric and surface parameters using the Mann-Kendall trend test. SZA increases by +0.24° yr−1 (95 % CI ). Adjusting for SZA reduces the magnitudes of the TOA trend and removes 95 % significance (TOA 20 sr: −0.0063 []; TOA 30 sr: −0.019 [] W m−2 yr−1). Surface trends remain significantly negative after adjustment (SFC 20 sr: −0.025 []; SFC 30 sr: −0.052 []).
The variables analyzed include TOA and SFC net CREs and COD estimated from 20 and 30 sr lidar ratios. The results of the Mann-Kendall trend analysis indicate a statistically significant decreasing trend over 20 years in TOA20sr, TOA30sr, SFC20sr and SFC30sr (p<0.05), confirming the presence of a negative trend in these radiation components. This implies that the net radiative effect during the day, both at the TOA and surface, is decreasing over time, which could have implications for changes in atmospheric and surface energy balances. The associated Sen slopes are then negative, indicating the annual rate of reduction. For example, the TOA30sr exhibits a Sen slope of −0.031 W m−2 yr−1.
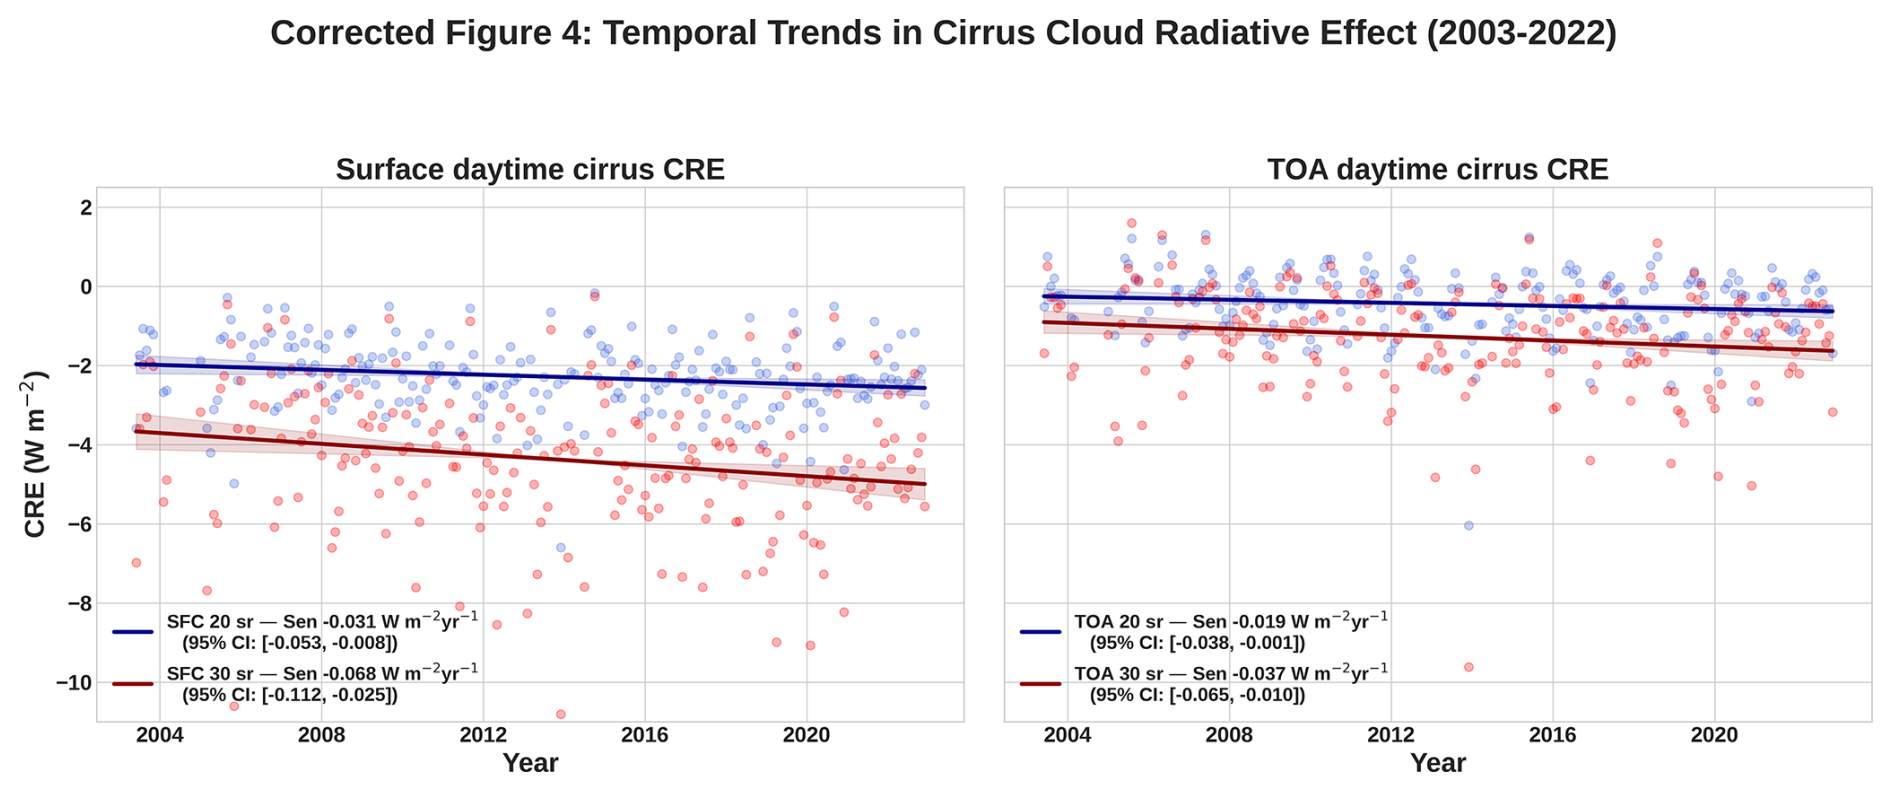
Figure 4Temporal trends in CRE at the SFC (left) and TOA (right) from 2003 to 2022 using (blue) 20 sr and (red) 30 sr. Each point is the monthly average value with the Sen's slope overlaid. Confidence intervals are represented as shadows, and values reported in the legend.
3.4 Other cloud-related parameters
Parameters such as cloud top temperature (CTT), cloud base temperature (CBT), cloud top height (CTH), and cloud base height (CBH) do not show statistically significant trends, as evidenced by p values that exceed the threshold of 0.05. This suggests the absence of notable alterations in cloud characteristics, including both temperature and altitude. However, SZA and cloud occurrence (i.e., count) show an increasing trend with a Mann-Kendall p value of 0.021 and 0.048, respectively. The observed increasing trend in SZA, characterized by a Sen's slope of 0.23 yr−1, may indicate, together with the count data, a significant improvement in the MPL cloud detection capabilities. In particular, in 2010, the instrument was upgraded to a newer version that incorporated an enhanced signal-to-noise ratio. The larger SZA generally reduces the solar background at the detector, but it also changes illumination geometry and atmospheric path length; to isolate this effect, we estimated SZA-adjusted trends (Sect. 2.5).
Table 2Trend detectability (Sen slope with 95 % CI), minimum detectable trend (MDT95), and ratio MDT95. Units for slopes and MDT95: W m−2 yr−1.
Segmented trends indicate weaker slopes after 2010: TOA 30 sr −0.048 (2003–2009) vs. −0.015 (2010–2022) and TOA 20 sr −0.046 vs. −0.0096 W m−2 yr−1. An OLS interaction test (time × after 2010) finds no significant slope change (p=0.19–0.97).
Table 3Mann-Kendall (MK) and Sen slope results for 20-year trends across variables. Bold means that Sen's slope is statistically significant, while italic means that it is no trend.
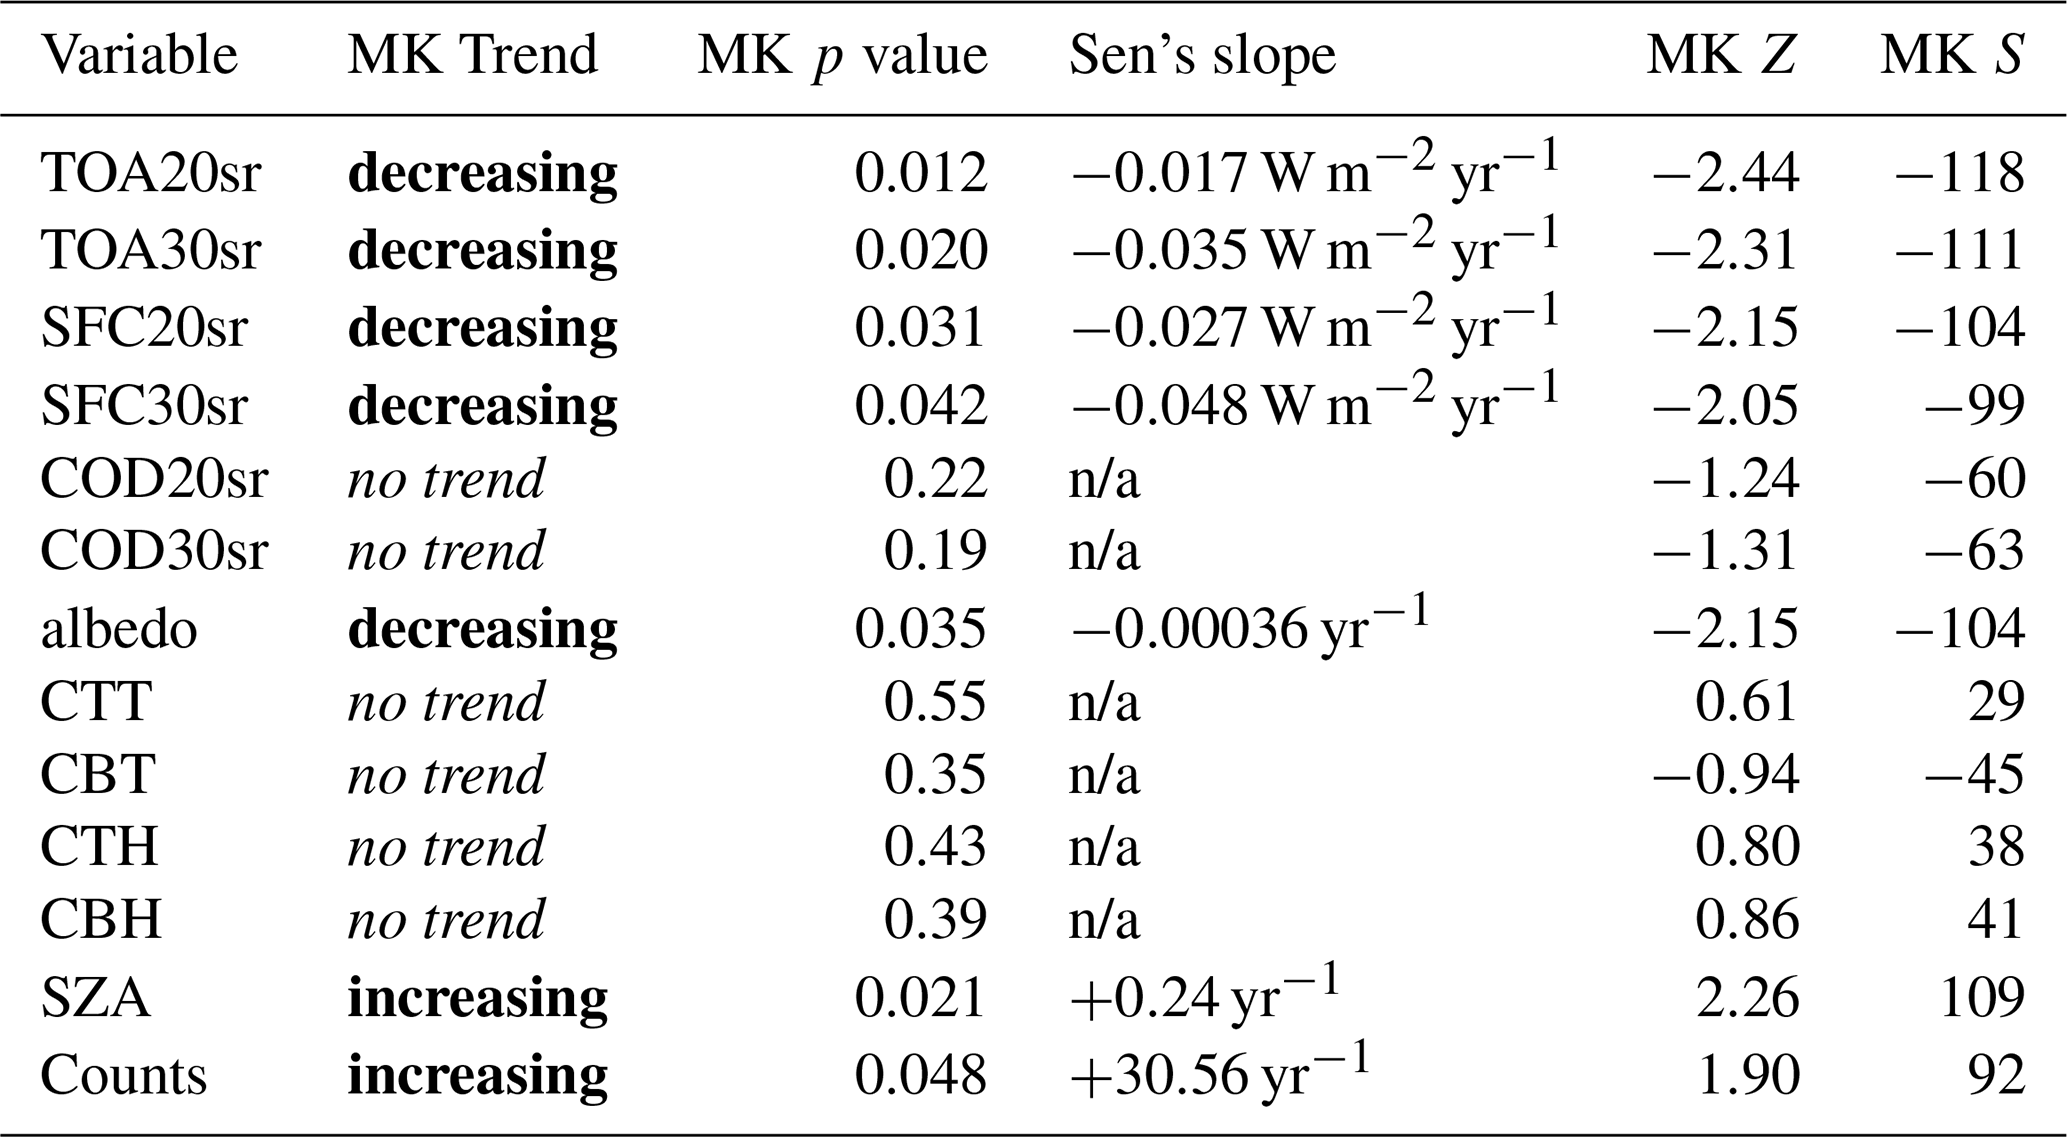
MK S: Kendall's S statistic (sum over all pairwise sign comparisons). MK Z: standardized S (approximately standard normal under the no-trend null). Sen's slope: median of all pairwise slopes; robust to outliers. Units for CRE: W m−2 yr−1. n/a = not applicable.
Overall, the decreasing trends in shortwave radiation components suggest changes in atmospheric transparency or cloud cover that might affect Earth's radiative balance. The unchanged optical properties of the clouds together with their altitude suggest that these factors may not be the primary drivers of the observed radiative trends.
These trends exceed their detectability thresholds as quantified by MDT95; see Table 2. For all four CRE series, exceeds MDT95 by 16 % to 49 %, confirming that trends are detectable at the level of 95 %.
Table 4Lag-1 autocorrelation (ϕ), standard deviation (σ), and minimum detectable trend (MDT95) for the selected parameters.
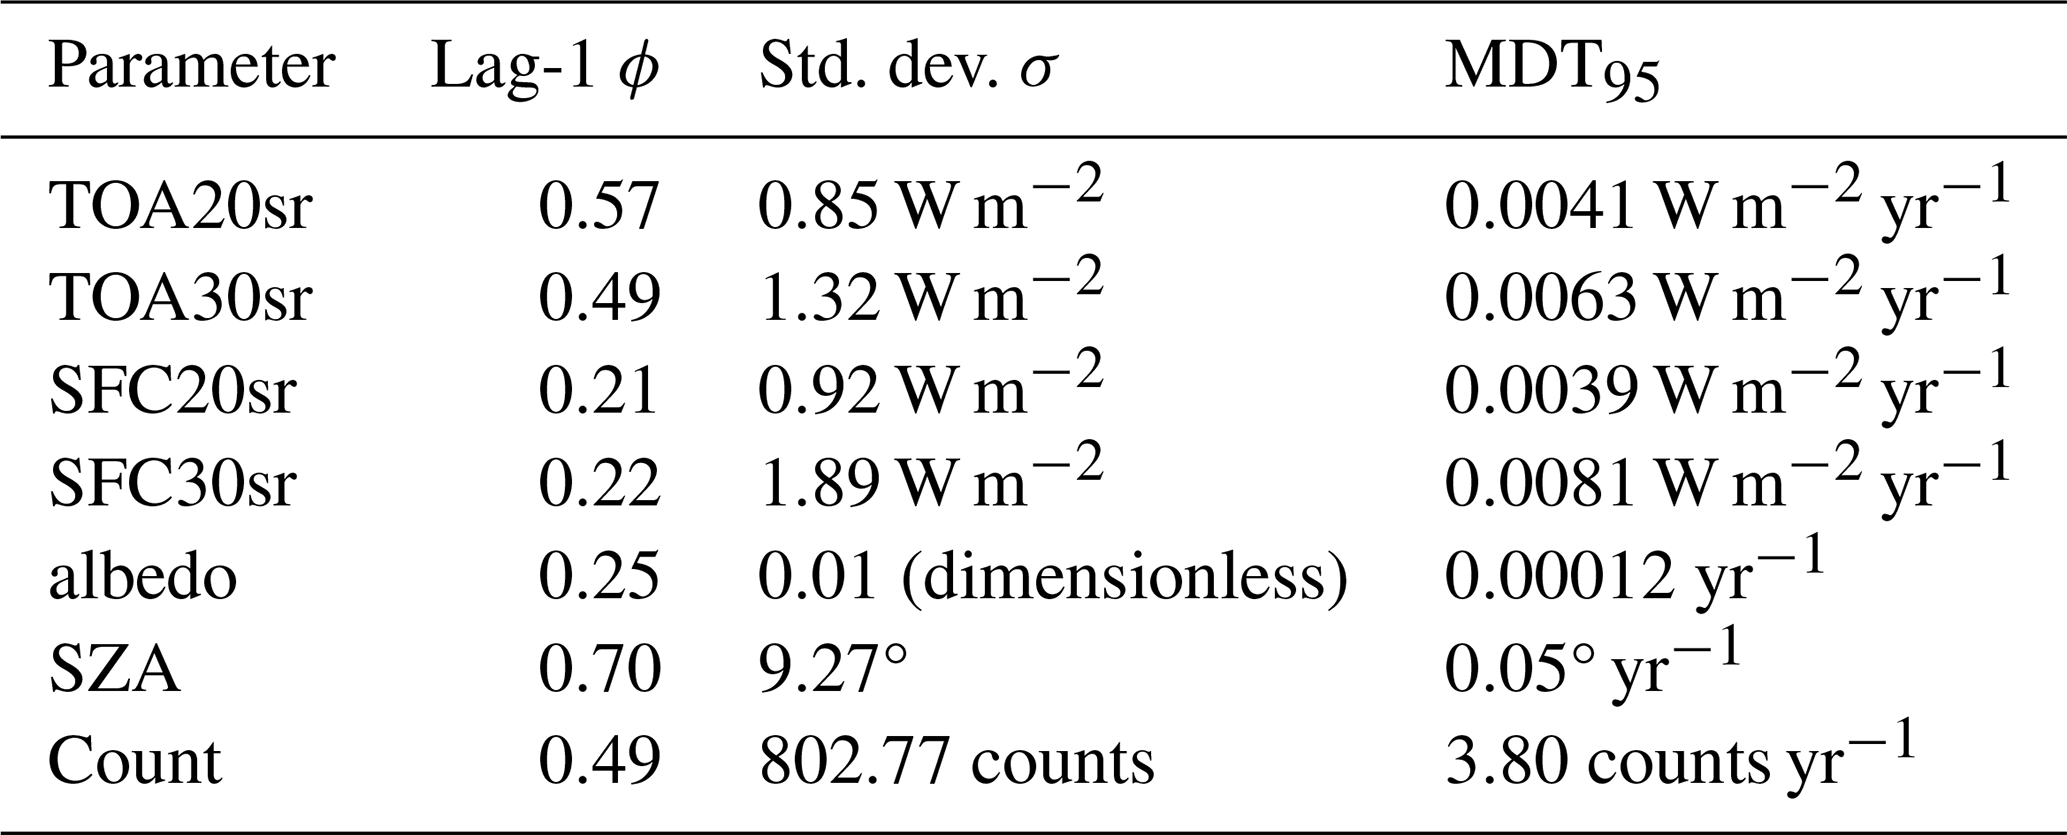
ϕ: lag-1 autocorrelation estimated on monthly anomalies (monthly climatology removed). σ: standard deviation of the same anomalies (units as shown). MDT95: 95th percentile of from AR(1) null simulations that preserve monthly seasonality and series length.
3.5 Cirrus cloud optical depth
We performed the seasonal MK test with Sen's slope estimation to assess long-term trends in cloud optical depth at both 20 and 30 sr (not shown). The results show that no discernible long-term monotonic global trend could be identified with confidence 95 %, as evidenced by the p values of 0.22 and 0.19, respectively. This implies that the optical properties of the cirrus clouds remained relatively constant throughout the 20-year period.
3.6 Long-term surface albedo trend
Analysis of monthly mean CERES surface albedos in GSFC showed a 20-year global negative trend at a confidence level 95 %. The results of the global trend are shown in Fig. 5. Surface albedo directly influences the daytime radiative transfer calculations, where a decreasing albedo translates into more absorbed radiation by the surface, reducing the reflected shortwave flux at both the surface and at the TOA.
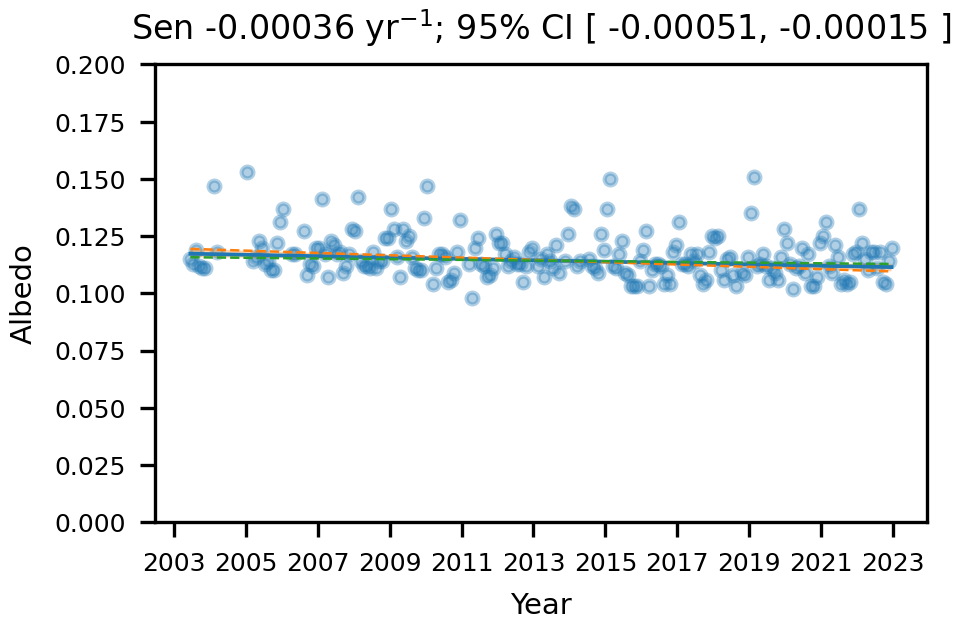
Figure 5Surface albedo 20-years trend analysis is statistically significant with a negative Sen's slope of −0.00036 yr−1.
3.7 Climatological significance of the trends
We evaluated the minimum detectable trend for statistically significant MK trends. Comparing the observed trend magnitudes (Sen's slope from Table 3) with the calculated Minimum Detectable Trends (MDT95, Table 2) confirms the robustness of our findings. For example, the Sen slope for TOA30sr was −0.035 W m−2 yr−1, which is substantially higher than its MDT95 of 0.0063 W m−2 yr−1. Likewise, the observed albedo trend of −0.00036 yr−1 is three times larger than its detection limit of 0.00012 yr−1. This comparison demonstrates that the key trends identified in this study are statistically robust signals and not artifacts of intrinsic noise or length.
3.8 Seasonal Analysis
The variability of statistically significant temporal trends over 20 years of measurements is also analyzed by season. The complete database is divided into four main seasons, December–January–February (DJF), March–April–May (MAM), June–July–August (JJA), and September–October–November (SON).
Seasonal analyses at both the SFC and TOA (Table 5) indicate consistent negative trends throughout all seasons, suggesting a reduction in radiative flux over the years. For SFC variables, during the winter months (DJF), SFC20sr shows a decreasing trend with a Sen slope of −0.053 W m−2 yr−1, while SFC30sr exhibits a stronger decline with a Sen's slope of −0.12 W m−2 yr−1, indicating a more pronounced reduction. In spring (MAM), SFC20sr shows a slight negative trend with a Sen slope of −0.018 W m−2 yr−1, while SFC30sr has a more substantial decrease of −0.056 W m−2 yr−1. The summer season (JJA) shows a moderate negative trend for SFC20sr with a Sen slope of −0.035 W m−2 yr−1, while SFC30sr continues to demonstrate a stronger decline of −0.0630 W m−2 yr−1. In the fall months (SON), SFC20sr exhibits a small negative trend with a Sen slope of −0.0169 W m−2 yr−1, and SFC30sr has a comparable downward trend with a slope of −0.0360 W m−2 yr−1. For the TOA variables, during DJF, TOA20sr shows a negative trend with a Sen slope of −0.0276 W m−2 yr−1, while TOA30sr exhibits a steeper decline with a slope of −0.1054 W m−2 yr−1.
In MAM, both TOA20sr and TOA30sr show similar decreasing trends with slopes of −0.0435 and −0.053 W m−2 yr−1, respectively. Summer (JJA) shows negative trends with TOA20sr at −0.0365 W m−2 yr−1 and TOA30sr at −0.0645 W m−2 yr−1. In SON, the trends continue with TOA20sr at −0.0354 W m−2 yr−1 and TOA30sr at −0.047 W m−2 yr−1. The observed decreasing trends in daytime net radiative fluxes at both the TOA and the surface emphasize potential shifts in regional climate dynamics, particularly during the winter and summer seasons. The pronounced decrease in surface albedo, especially during the winter months, suggests a decrease in snow cover, likely driven by regional warming, which could amplify surface warming through positive feedback mechanisms. The significant decrease in surface albedo, especially during the winter months, further underscores potential shifts in local climate systems, possibly accelerating snow and ice melt and influencing broader environmental conditions. Overall, the analysis indicates that both surface and TOA cirrus CREs are decreasing consistently across all seasons, with the reductions generally being more pronounced at 30 sr compared with the 20 sr solution. The SFC variables generally show stronger seasonal trends than the TOA, especially in winter (DJF), where the slope of SFC30sr is much steeper than the slope of TOA30sr. This could indicate a greater variability or sensitivity in surface radiative flux compared to the TOA flux in the winter season. In other seasons like MAM and SON, the trends for both SFC and TOA variables are more aligned in magnitude, suggesting more uniform changes in radiative fluxes across different atmospheric layers. Overall, while both SFC and TOA show consistent negative trends, the magnitude of these trends is more variable at the surface level, particularly for the SFC30sr variable, which shows the steepest seasonal declines across the board.
Table 5Mann-Kendall Test and Sen's Slope Results for 20-Year seasonal trends Across CRE at TOA and SFC.
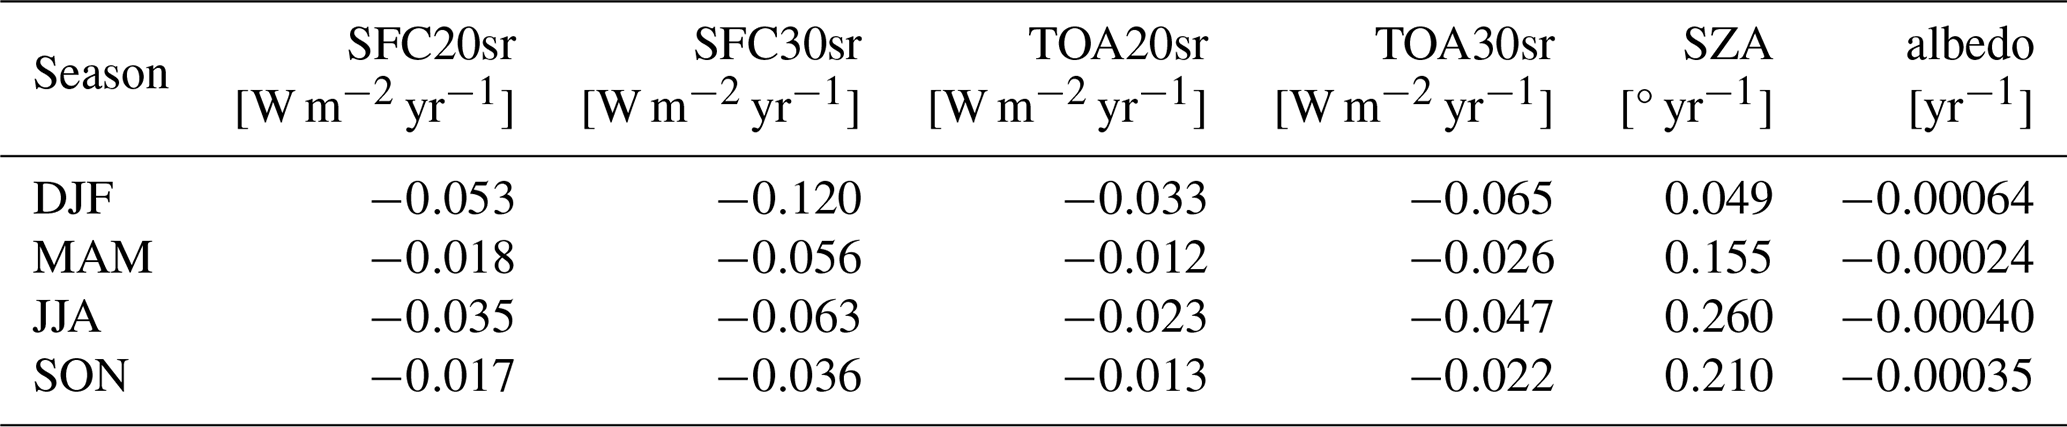
Seasonal analyses of surface albedo and SFC/TOA cirrus CREs reveal similarities and differences in their trends between seasons. albedo shows a consistent negative trend in all seasons, indicating a decrease in reflectivity over time. This aligns with the general reduction in the surface and TOA radiative fluxes. In winter (DJF), albedo has a negative trend of −0.00064 yr−1, which corresponds to significant reductions in SFC20sr and SFC30sr (−0.05 and −0.12 W m−2 yr−1, respectively) and substantial decline in TOA30sr (−0.07 W m−2 yr−1). This suggests that a decrease in reflectivity could be contributing to the reduction in radiative flux at both surface and atmospheric levels. In spring (MAM), the albedo trend is less steep at −0.00025 yr−1, while SFC and TOA also show less pronounced decreases, with SFC20sr and SFC30sr at −0.02 and −0.06 W m−2 yr−1, respectively, and TOA20sr and TOA30sr at −0.01 and −0.03 W m−2 yr−1. This partial agreement indicates a weaker correlation between changes in albedo and radiative flux during spring. In summer (JJA), the albedo trend remains negative at −0.00040 yr−1, with SFC and TOA showing similar decreasing trends, particularly for SFC30sr and TOA30sr (−0.06 and −0.05 W m−2 yr−1, respectively), suggesting a more direct relationship between reduced reflectivity and declining radiative fluxes. Finally, in autumn (SON), the trend of albedo is −0.00036 yr−1, which is consistent with milder decreases in the SFC20sr and SFC30sr variables (−0.02 and −0.04 W m−2 yr−1) and the TOA variables (−0.01 and −0.02 W m−2 yr−1).
Summarizing, the surface albedo declines by yr−1 (Sen; 95 % CI ) and yr−1 (OLS; 95 % CI ).
This indicates a more coherent trend among all variables during the fall. In general, while there is general agreement between the albedo, SFC, and TOA trends in each season, the strength of their correlation varies, with stronger alignment in winter and summer and partial agreement in spring and fall. The solar zenith angle has a large influence on the radiative effects of the cirrus cloud, so understanding how this angle changes in reference to the long-term trend is crucial. We mentioned previously that MPLNET instrument designs changed in 2010, thus improving the signal-to-noise ratio and increasing cloud detection. Table 5 supports this technical advancement, where the seasonal trends in the SZA are all increasing. We would be remiss to not mention that the increasing trends in SZA may also be due to a systematic behavior change in cloud presence over the diurnal cycle. Quantifying this distinction is beyond the scope of this study. Trends in SZA are largest during the summer months (JJA) when there are more available daylight hours and the sun is higher in the sky.
3.9 Discussion
Seasonal analyses of surface albedo and cirrus cloud radiative effects (CRE) at the surface (SFC) and top-of-atmosphere (TOA) reveal consistent negative trends across all variables, suggesting a general reduction in net radiative flux over the last 20 years. albedo, which represents Earth's surface reflectivity, shows a persistent decrease across all seasons, with the most significant reductions observed during winter (DJF) and summer (JJA). This declining trend in albedo indicates that less solar radiation is being reflected back into the atmosphere, leading to increased absorption by the surface and contributing to the observed decreases in cirrus CRE at both the SFC and TOA. During winter, the reduction in albedo, particularly at −0.00064 yr−1, is accompanied by substantial decreases in SFC and TOA CRE. The SFC20sr and SFC30sr variables show decreases of −0.05 and −0.12 W m−2 yr−1, respectively, while the TOA20sr and TOA30sr variables show reductions of −0.03 and −0.07 W m−2 yr−1. This alignment of trends suggests that the decreased reflectivity, likely due to less snow and ice cover (a trend supported by regional climate studies, e.g., Dyer and Mote, 2006), plays a significant role in the observed radiative flux changes. As snow and ice are highly reflective, their reduction in winter decreases albedo, allowing more solar energy to be absorbed by the surface, subsequently lowering the outgoing radiative flux at both SFC and TOA. The drop in the radiative effect at the surface and TOA has important implications for weather and climate alike. A decrease in albedo and subsequent reduction in radiative flux can lead to surface warming, which may accelerate snow and ice melt, creating a feedback loop that further reduces albedo and increases surface temperatures. This process can alter local and regional weather patterns, potentially leading to warmer winters with less snow cover and more variability in temperature and precipitation. Furthermore, changes in radiative flux at the TOA can influence large-scale atmospheric circulation patterns, potentially impacting weather systems and contributing to more extreme weather events. The identified trends underscore the intrinsic link between albedo, radiative flux, and climate dynamics, highlighting the importance of attentive observation of these alterations due to their significant impact on future climate and weather systems. Although our findings provide robust evidence for statistically significant radiative trends, the analysis is constrained by certain methodological limitations. Specifically, a key limitation is the instrument upgrade that occurred in 2010. This upgrade improved the signal-to-noise ratio, likely enhancing the detection of optically thinner cirrus, particularly at higher solar zenith angles. This may have introduced an artificial positive trend in cloud counts and a potential bias in the CRE trends. While the stable trend in COD suggests this effect may be small, a more rigorous segmented trend analysis (pre- and post-2010) would be required to quantify this potential bias. Similarly, while an increasing trend in SZA was identified, a sensitivity study to quantify its impact on the CRE trends was not performed. While this study uses p values to establish statistical significance, we also acknowledge that confidence intervals for the Sen's slope estimator were not calculated, which would provide a quantitative measure of uncertainty in the trend magnitudes. Specifically, this study uses observations from a single site in Greenbelt, Maryland, which may not fully represent broader global trends or variability. To mitigate these limitations, future research should incorporate additional MPLNET sites in varying geographic and climatic regions and employ multilayer cloud radiative transfer models to better capture the complexity of cloud-radiation interactions. To further address the methodological limitations identified in this analysis, future studies should analyze data from additional MPLNET sites that cover diverse geographical and climatic regions. This broader spatial perspective would provide a clearer picture of global variability and trends in radiative effects of the cirrus cloud. Moreover, incorporating multilayer cloud and aerosol radiative transfer modeling could significantly enhance the accuracy and realism of cloud-radiation interactions in climatological assessments. Finally, targeted in situ measurements and remote sensing studies that better characterize the microphysical properties of cirrus clouds, particularly ice crystal shape and size distributions, would improve the reliability of radiative forcing estimates and further refine their representation in climate models.
Figure 4 shows the monthly daytime CRE time series at the surface and TOA for lidar ratios of 20 and 30 sr together with the corresponding Sen's slopes.
In this paper, the results of a 20-year trend analysis for the radiative effects and optical properties of daytime optically thin cirrus clouds were reported. This analysis provides robust evidence of significant declining trends in daytime cirrus cloud radiative effects and surface albedo over a 20-year observational period, underscoring an evolving atmospheric energy balance with substantial climatological implications. The persistent decrease in radiative flux at both the top of atmosphere (TOA) and surface (SFC), coupled with the significant reduction in surface albedo, likely driven by decreasing snow and ice coverage, suggests the presence of positive climate feedback mechanisms, potentially intensifying regional warming and altering atmospheric circulation patterns. These findings highlight the crucial role of continuous ground-based lidar observations, such as those provided by MPLNET, in the accurate monitoring and quantification of long-term atmospheric changes. In addition, the insights gained through this analysis underline the importance of improving cloud representation in climate models, emphasizing the need for improved observational constraints to enhance future climate projections and inform climate adaptation strategies. The results discussed in this study are based on the longest record of ground-based cirrus cloud measurements, from 2003 to 2022, taken from the NASA Micropulse Lidar Network at Goddard Space Flight Center, Greenbelt, MD, USA. Herein, cirrus clouds are defined with a cloud top temperature threshold ( °C), an optical depth threshold (<3.0), and lidar-derived extinction coefficients are constrained using 20 and 30 sr lidar ratios. Each 1 min average single layer daytime cirrus cloud extinction coefficient profile was injected into the Fu-Liou-Gu radiative transfer model to compute its cloud radiative effect (CRE, W m−2) both at the top of the atmosphere (TOA) and at the surface (SFC). The instantaneous radiative effects were then normalized by the daytime fraction and cloud fraction obtained from the Cloud-Aerosol Lidar with Orthogonal Polarization (CALIOP) instrument onboard of Cloud-Aerosol Lidar and Infrared Pathfinder Satellite Observations (CALIPSO) satellite observations. To perform a long-term trend analysis and reduce noise, the instantaneous CRE values were averaged monthly, from which the seasonal Mann-Kendall statistical test with Sen's slope were performed. The trends in CRE are statistically significant at the confidence level 95 % in both TOA and SFC and at 20 and 30 sr. At the TOA there is a net decrease of flux of −0.017 (20 sr) and −0.035 (30 sr) W m−2 per year and −0.027 (20 sr) and −0.048 (30 sr) W m−2 per year at the SFC. Moreover, the surface albedo exhibits a statistically significant seasonal Mann-Kendall test over the two decades. The surface albedo decreased at a rate of −0.00036 yr−1. Lower albedo values increase the absorbed energy of the surface, which translates to reduced reflected shortwave radiative at both TOA and SFC. Although crucial for assessing a climatologically significant trend in the net radiative effect of cirrus clouds during the day, this study shows some limitations due to the proposed methodology. Our quantitative results are specific to a single, long-duration MPLNET site and reflect local sampling, instrument characteristics, and regional meteorology. While the qualitative satellite context indicates that our site-based trends are consistent in sign with co-located regional satellite products, we refrain from generalizing the magnitudes beyond the site. A multi-site MPLNET synthesis and a systematic comparison with satellite CRE and albedo across diverse regimes are natural next steps.
For one, the radiative effects of aerosols (and other clouds) are not taken into account. The Fu-Liou-Gu radiative transfer model computations are instantaneous and only run on single-layer cirrus clouds, which, of course, limits the accuracy in assessing their true radiative effects within the entire climate system. Furthermore, there are many unknowns regarding the microphysical and optical properties of cirrus clouds, such as the size and shape of ice crystals, which can influence their radiative behavior (see, e.g., Dolinar et al., 2024). Cirrus clouds are the only cloud type that, during the daytime, might cool or warm the Earth atmosphere system depending on their location, optical thickness, and underlying surface properties. For this reason, the scientific community recommends further research and continued monitoring to better understand the role of cirrus clouds in the broader context of climate change and to reduce uncertainty in our understanding of their impact. Our results align closely with the themes highlighted in recent IPCC assessment reports, highlighting the intricate interplay between clouds, aerosols, and radiative forcing. These reports underscore the need for improved clouds representation in weather and climate models due to their substantial influence on the global energy balance. Given this, ongoing investment in long-term observational networks such as MPLNET remains critical, providing essential datasets to validate and improve weather forecasts and climate predictions. Continued efforts to refine cloud parameterization and sustained observational efforts are vital to improving our understanding and predictions of climate change and guiding effective policy interventions.
MPLNET lidar data are available at https://mplnet.gsfc.nasa.gov/ (last access: 29 November 2025). CERES SYN1deg products are available from NASA ASDC. CALIPSO/CALIOP data are available from NASA ASDC. Processed monthly aggregates and analysis scripts are available from the corresponding author upon reasonable request.
SL, JRC, JRL, EKD, conceptualized the study, designed the methodology, SL led the manuscript writing. EKD contributed to statistical analysis, trend detection, and interpretation of radiative effects. JRL processed and analyzed MPLNET lidar data and provided technical validation of cloud property retrievals. ASB assisted in implementing the statistical tests, trend detection, and contributed to data visualization. JRC provided expertise in cirrus cloud microphysics and contributed to discussions on cloud-radiation interactions. EJW supervised the project, provided guidance on data quality control, and contributed to the final manuscript revisions. All authors participated in discussing the results and editing the manuscript, and approved the final version for submission.
The contact author has declared that none of the authors has any competing interests.
Publisher's note: Copernicus Publications remains neutral with regard to jurisdictional claims made in the text, published maps, institutional affiliations, or any other geographical representation in this paper. While Copernicus Publications makes every effort to include appropriate place names, the final responsibility lies with the authors. Views expressed in the text are those of the authors and do not necessarily reflect the views of the publisher.
The NASA Micro-Pulse Lidar Network is supported by the NASA Earth Observing System and Radiation Sciences Program.
The NASA Micro Pulse Lidar Network is supported by the NASA Earth Observing System and the NASA Radiation Sciences Program.
This paper was edited by Eduardo Landulfo and reviewed by three anonymous referees.
Berry, E. and Mace, G. G.: Cirrus Cloud Properties and the Large-Scale Meteorological Environment: Relationships Derived from A-Train and NCEP–NCAR Reanalysis Data, Journal of Applied Meteorology and Climatology, 52, 1253–1276, https://doi.org/10.1175/JAMC-D-12-0102.1, 2013. a
Campbell, J. R., Hlavka, D. L., Welton, E. J., Flynn, C. J., Turner, D. D., Spinhirne, J. D., Scott, V. S., and Hwang, I. H.: Full-time, eye-safe cloud and aerosol lidar observation at atmospheric radiation measurement program sites: Instruments and data processing., Journal of Atmospheric and Oceanic Technology, 19, 431–442, 2002. a, b
Campbell, J. R., Sassen, K., and Welton, E. J.: Elevated cloud and aerosol layer retrievals from micropulse lidar signal profiles, Journal of Atmospheric and Oceanic Technology, 25, 685–700, 2008. a, b
Campbell, J. R., Vaughan, M. A., Oo, M., Holz, R. E., Lewis, J. R., and Welton, E. J.: Distinguishing cirrus cloud presence in autonomous lidar measurements, Atmos. Meas. Tech., 8, 435–449, https://doi.org/10.5194/amt-8-435-2015, 2015. a, b
Campbell, J. R., Lolli, S., Lewis, J. R., Gu, Y., and Welton, E. J.: Daytime cirrus cloud top-of-the-atmosphere radiative forcing properties at a midlatitude site and their global consequences, Journal of Applied Meteorology and Climatology, 55, 1667–1679, 2016. a, b, c, d, e, f
Campbell, J. R., Dolinar, E. K., Lolli, S., Fochesatto, G. J., Gu, Y., Lewis, J. R., Marquis, J. W., McHardy, T. M., Ryglicki, D. R., and Welton, E. J.: Cirrus cloud top-of-the-atmosphere net daytime forcing in the Alaskan subarctic from ground-based MPLNET monitoring, Journal of Applied Meteorology and Climatology, 60, 51–63, 2021. a, b, c, d, e
Cermak, J., Schneebeli, M., Nowak, D., Vuilleumier, L., and Bendix, J.: Characterization of low clouds with satellite and ground-based remote sensing systems, Meteorologische Zeitschrift, 15, 65–72, https://doi.org/10.1127/0941-2948/2006/0100, 2006. a
Ciofini, M., Lapucci, A., and Lolli, S.: Diffractive optical components for high power laser beam sampling, Journal of Optics A, 5, 186, https://doi.org/10.1088/1464-4258/5/3/308, 2003. a
Collaud Coen, M., Andrews, E., Alastuey, A., Arsov, T. P., Backman, J., Brem, B. T., Bukowiecki, N., Couret, C., Eleftheriadis, K., Flentje, H., Fiebig, M., Gysel-Beer, M., Hand, J. L., Hoffer, A., Hooda, R., Hueglin, C., Joubert, W., Keywood, M., Kim, J. E., Kim, S.-W., Labuschagne, C., Lin, N.-H., Lin, Y., Lund Myhre, C., Luoma, K., Lyamani, H., Marinoni, A., Mayol-Bracero, O. L., Mihalopoulos, N., Pandolfi, M., Prats, N., Prenni, A. J., Putaud, J.-P., Ries, L., Reisen, F., Sellegri, K., Sharma, S., Sheridan, P., Sherman, J. P., Sun, J., Titos, G., Torres, E., Tuch, T., Weller, R., Wiedensohler, A., Zieger, P., and Laj, P.: Multidecadal trend analysis of in situ aerosol radiative properties around the world, Atmos. Chem. Phys., 20, 8867–8908, https://doi.org/10.5194/acp-20-8867-2020, 2020. a
Comstock, J. M., Ackerman, T. P., and Mace, G. G.: Ground-based lidar and radar remote sensing of tropical cirrus clouds at Nauru Island: Cloud statistics and radiative impacts, Journal of Geophysical Research: Atmospheres, 107, 0148–0227, https://doi.org/10.1029/2002JD002203, 2002. a
Dolinar, E. K., Campbell, J. R., Marquis, J. W., Lewis, J. R., Lolli, S., Yang, P., and Welton, E. J.: Estimation of the Uncertainty in Daytime Cirrus Cloud Radiative Forcing and Heating Rates Due to Ice Crystal Optics, Journal of Applied Meteorology and Climatology, 64, 513–527, https://doi.org/10.1175/JAMC-D-24-0065.1, 2024. a, b, c
Dyer, J. L. and Mote, T. L.: Spatial variability and trends in observed snow depth over North America, Geophysical research letters, 33, https://doi.org/10.1029/2006GL027258, 2006. a
Fu, Q. and Liou, K. N.: On the correlated k-distribution method for radiative transfer in nonhomogeneous atmospheres, J. Atmos. Sci, 49, 2139–2156, 1992. a, b, c
Fu, Q. and Liou, K. N.: Parameterization of the Radiative Properties of Cirrus Clouds, Journal of the Atmospheric Sciences, 50, 2008–2025, 1993. a, b
Gu, Y., Farrara, J., Liou, K., and Mechoso, C.: Parameterization of cloud–radiation processes in the UCLA general circulation model, Journal of Climate, 16, 3357–3370, 2003. a, b, c
Hirsch, R. M., Slack, J. R., and Smith, R. A.: Techniques of trend analysis for monthly water quality data, Water Resources Research, 18, 107–121, https://doi.org/10.1029/WR018i001p00107, 1982. a
Holben, B. N., Eck, T. F., Slutsker, I., Tanré, D., Buis, J.-P., Setzer, A., Vermote, E., Reagan, J. A., Kaufman, Y. J., Nakajima, T., Lavenu, F., Jankowiak, I., and Smirnov, A.: AERONET – A federated instrument network and data archive for aerosol characterization, Remote Sensing of Environment, 66, 1–16, 1998. a
Imasu, R. and Iwasaka, Y.: Characteristics of cirrus clouds observed by laser radar (lidar) during the spring of 1987 and the winter of 1987/88, Journal of the Meteorological Society of Japan. Ser. II, 69, 401–411, 1991. a
Ineichen, P., Guisan, O., and Perez, R.: Ground-reflected radiation and albedo, Solar Energy, 44, 207–214, 1990. a
Kärcher, B., Hendricks, J., and Lohmann, U.: Physically based parameterization of cirrus cloud formation for use in global atmospheric models, Journal of Geophysical Research: Atmospheres, 111, https://doi.org/10.1029/2005JD006219, 2006. a
Kendall, M. G.: Rank correlation methods, London: Charles Griffin & Company Limited, 1948. a
Landi, T. C., Bonasoni, P., Brunetti, M., Campbell, J. R., Marquis, J. W., Di Girolamo, P., and Lolli, S.: Aerosol Direct Radiative Effects under Cloud-Free Conditions over Highly-Polluted Areas in Europe and Mediterranean: A Ten-Years Analysis (2007–2016), Remote Sensing, 13, https://doi.org/10.3390/rs13152933, 2021. a, b
Lewis, J. R., Campbell, J. R., Welton, E. J., Stewart, S. A., and Haftings, P. C.: Overview of MPLNET Version 3 Cloud Detection, Journal of Atmospheric and Oceanic Technology, 33, 2113–2134, https://doi.org/10.1175/JTECH-D-15-0190.1, 2016. a, b, c, d, e, f
Lewis, J. R., Campbell, J. R., Stewart, S. A., Tan, I., Welton, E. J., and Lolli, S.: Determining cloud thermodynamic phase from the polarized Micro Pulse Lidar, Atmos. Meas. Tech., 13, 6901–6913, https://doi.org/10.5194/amt-13-6901-2020, 2020. a
Lolli, S.: Is the Air Too Polluted for Outdoor Activities? Check by Using Your Photovoltaic System as an Air-Quality Monitoring Device, Sensors, 21, https://doi.org/10.3390/s21196342, 2021. a
Lolli, S., Campbell, J. R., Lewis, J. R., Gu, Y., Marquis, J. W., Chew, B. N., Liew, S.-C., Salinas, S. V., and Welton, E. J.: Daytime Top-of-the-Atmosphere Cirrus Cloud Radiative Forcing Properties at Singapore, Journal of Applied Meteorology and Climatology, 56, 1249–1257, 2017a. a, b, c, d, e
Lolli, S., Campbell, J. R., Lewis, J. R., Gu, Y., and Welton, E. J.: Technical note: Fu–Liou–Gu and Corti–Peter model performance evaluation for radiative retrievals from cirrus clouds, Atmos. Chem. Phys., 17, 7025–7034, https://doi.org/10.5194/acp-17-7025-2017, 2017b. a
Lolli, S., Khor, W. Y., Matjafri, M. Z., and Lim, H. S.: Monsoon season quantitative assessment of biomass burning clear-sky aerosol radiative effect at surface by ground-based lidar observations in Pulau Pinang, Malaysia in 2014, Remote Sens., 11, 2660-1–2660-14, https://doi.org/10.3390/rs11222660, 2019. a
Mann, H. B.: Nonparametric tests against trend, Econometrica: Journal of the econometric society, 13, 245–259, https://doi.org/10.2307/1906937, 1945. a
Molod, A., Takacs, L., Suarez, M., Bacmeister, J., Song, I.-S., and Eichmann, A.: The GEOS-5 atmospheric general circulation model: Mean climate and development from MERRA to Fortuna, Tech. rep., NASA GSFC, 2012. a
Platt, C., Scott, S., and Dilley, A.: Remote sounding of high clouds. Part VI: Optical properties of midlatitude and tropical cirrus, Journal of the atmospheric sciences, 44, 729–747, 1987. a
Ramanathan, V., Cess, R. D., Harrison, E. F., Minnis, P., Barkstrom, B. R., Ahmad, E., and Hartman, D.: Cloud-radiatve forcing and climate: results from the Earth Radiation Budget Experiment, Science, 243, 57–63, https://doi.org/10.1126/science.243.4887.57, 1989. a
Rienecker, M. M., Suarez, M. J., Todling, R., Bacmeister, J. T., Takacs, L., Liu, H.-C., Gu, W., Sienkiewicz, M., Koster, R. D., Gelaro, R., Stajner, I., and Nielsen, J. E.: The GEOS-5 Data Assimilation System-Documentation of Versions 5.0. 1, 5.1. 0, and 5.2. 0, Tech. rep., NASA GSFC, 2008. a
Sassen, K.: Polarization in lidar, in: LIDAR: Range-resolved optical remote sensing of the atmosphere, edited by: Weitkamp, C., Springer Series in Optical Sciences 102. New York: Springer, 19–42, https://doi.org/10.1007/0-387-25102-0_2, 2005. a
Sassen, K. and Campbell, J. R.: A midlatitude cirrus cloud climatology from the Facility for Atmospheric Remote Sensing. Part I: Macrophysical and synoptic properties, Journal of the Atmospheric Sciences, 58, 481–496, 2001. a
Sassen, K. and Comstock, J. M.: A midlatitude cirrus cloud climatology from the Facility for Atmospheric Remote Sensing. Part III: Radiative properties, Journal of the Atmospheric Sciences, 58, 2113–2127, 2001. a, b
Sassen, K., Comstock, J. M., Wang, Z., and Mace, G. G.: Cloud and aerosol research capabilities at FARS: The Facility for Atmospheric Remote Sensing, Bulletin of the American Meteorological Society, 82, 1119–1138, 2001. a
Spinhirne, J. D.: Micro pulse lidar, IEEE transactions on geoscience and remote sensing, 31, 48–55, 1993. a
Spinhirne, J. D., Rall, J. A., and Scott, V. S.: Compact eye safe lidar systems, The Review of Laser Engineering, 23, 112–118, 1995. a
Stephens, G. L. and Webster, P. J.: Clouds and climate: Sensitivity of simple systems, Journal of the Atmospheric Sciences, 38, 235–247, https://doi.org/10.1175/1520-0469, 1981. a
Stocker, T.: Climate change 2013: the physical science basis: Working Group I contribution to the Fifth assessment report of the Intergovernmental Panel on Climate Change, Cambridge university press, ISBN 978-1-107-05799-1, https://doi.org/10.1017/CBO9781107415324, 2014. a
Tosca, M. G., Campbell, J., Garay, M., Lolli, S., Seidel, F. C., Marquis, J., and Kalashnikova, O.: Attributing Accelerated Summertime Warming in the Southeast United States to Recent Reductions in Aerosol Burden: Indications from Vertically-Resolved Observations, Remote Sensing, 9, 674, https://doi.org/10.3390/rs9070674, 2017. a
Vaughan, M. A., Powell, K. A., Winker, D. M., Hostetler, C. A., Kuehn, R. E., Hunt, W. H., Getzewich, B. J., Young, S. A., Liu, Z., and McGill, M. J.: Fully Automated Detection of Cloud and Aerosol Layers in the CALIPSO Lidar Measurements, Journal of Atmospheric and Oceanic Technology, 26, 2034–2050, https://doi.org/10.1175/2009JTECHA1228.1, 2009. a
Weatherhead, E. C., Reinsel, G. C., Tiao, G. C., Meng, X.-L., Choi, D., Cheang, E.-K., Keller, T., DeLuisi, J., Wuebbles, D. J., Kerr, J. B., Miller, A. J., Oltmans, S. J., and Frederick, J. E.: Factors affecting the detection of trends: statistical considerations and applications to environmental data, Journal of Geophysical Research, 103, 17149–17161, 1998. a, b, c, d
Weatherhead, E. C., Stevermer, A. J., and Schwartz, B. E.: Detecting enviromental changes and trends, Physics and Chemistry of the Earth, 27, 399–403, 2002. a
Weatherhead, E. C., Wielicki, B. A., Ramaswamy, V., Abbott, M., Ackerman, T. P., Atlas, R., Brasseur, G., Bruhwiler, L., Busalacchi, A. J., Butler, J. H., Clack, C. T. M., Cooke, R., Cucurull, L., Davis, S. M., English, J. M., Fahey, D. W., Fine, S. S., Lazo, J. K., Liang, S., Loeb, N. G., Rignot, E., Soden, B., Stanitski, D., Stephens, G., Tapley, B. D., Thompson, A. M., Trenberth, K. E., and Wuebbles, D.: Designing the Climate Observing System of the Future, Earth's Future, 6, 80–102, https://doi.org/10.1002/2017EF000627, 2018. a
Welton, E. J., Campbell, J. R., Spinhirne, J. D., and Scott III, V. S.: Global monitoring of clouds and aerosols using a network of micropulse lidar systems. In Lidar Remote Sensing for Industry and Environment Monitoring, Proc. of SPIE, International Society for Optics and Photonics, 4153, 151–158, 2001. a, b
Welton, E. J., Stewart, S. A., Lewis, J. R., Belcher, L. R., Campbell, J. R., and Lolli, S.: Status of the NASA Micro Pulse Lidar Network (MPLNET): overview of the network and future plans, new version 3 data products, and the polarized MPL, in: EPJ Web of Conferences, 176, 09003, EDP Sciences, 2018. a
Wielicki, B. A., Cess, R. D., King, M. D., Randall, D. A., and Harrison, E. F.: Mission to planet Earth: Role of clouds and radiation in climate, Bulletin of the American Meteorological Society, 76, 2125–2153, 1995. a, b, c
Winker, D. M., Vaughan, M. A., Omar, A., Hu, Y., Powell, K. A., Liu, Z., Hunt, W. H., and Young, S. A.: Overview of the CALIPSO Mission and CALIOP Data Processing Algorithms, Journal of Atmospheric and Oceanic Technology, 26, 2310–2323, https://doi.org/10.1175/2009JTECHA1281.1, 2009. a
Yi, B., Rapp, A. D., Yang, P., Baum, B. A., and King, M. D.: A comparison of Aqua MODIS ice and liquid water cloud physical and optical properties between collection 6 and collection 5.1: cloud radiative effects, J. Geophys. Res.-Atmos., 122, https://doi.org/10.1002/2016JD025654, 2017. a
Yorks, J. E., Hlavka, D. L., Vaughan, M. A., McGill, M. J., Hart, W. D., Rodier, S., and Kuehn, R.: Airborne validation of cirrus cloud properties derived from CALIPSO lidar measurements: Spatial properties, Journal of Geophysical Research: Atmospheres, 116, D21207, https://doi.org/10.1029/2011JD015942, 2011. a, b
Yue, S., Pilon, P., and Cavadias, G.: Power of the Mann–Kendall and Spearman's rho tests for detecting monotonic trends in hydrological series, Journal of Hydrology, 259, 254–271, 2002. a
Over the past twenty years, continuous lidar observations at NASA's Goddard Space Flight Center have assessed the radiative impact of cirrus clouds on the Earth–atmosphere system. Findings show these clouds increasingly trap heat as surface reflectivity drops with less snow and ice, contributing to local warming. Continued cirrus monitoring is crucial to refine climate forecasts and support effective climate action.
Over the past twenty years, continuous lidar observations at NASA's Goddard Space Flight Center...