the Creative Commons Attribution 4.0 License.
the Creative Commons Attribution 4.0 License.
 | 17 Mar 2026
Evaluation of UKESM aerosol size and composition using ATom measurements indicates missing marine aerosol formation mechanisms
Xu-Cheng He
Han Ding
Maria R. Russo
Daniel P. Grosvenor
Xuemei Wang
Anthony C. Jones
Pedro Campuzano-Jost
Benjamin Nault
Agnieszka Kupc
Donald Blake
Jose L. Jimenez
Christina J. Williamson
James Weber
Hamish Gordon
Atmospheric aerosols influence climate through their interactions with radiation and clouds, yet large uncertainties remain in their simulation by global models. This study evaluates the United Kingdom Earth System Model version 1.1 (UKESM1.1) using global-scale aircraft observations from the Atmospheric Tomography (ATom) mission, focusing on aerosol lifecycle processes in the remote marine atmosphere. We assess model performance in simulating aerosol precursor vapours, number size distributions, chemical composition, and environmental conditions. Several process improvements are tested, including sulfuric acid-ammonia nucleation, ammonium nitrate scheme, methanesulfonic acid condensation, and low-temperature isoprene-derived secondary organic aerosol formation.
Model biases differ significantly between the upper troposphere (UT) and the marine boundary layer (MBL). In the UT, UKESM1.1 overestimates nucleation and Aitken mode particles while underestimating accumulation mode, indicating insufficient growth. In the MBL, the model overestimates primary aerosols (e.g. seasalt) and precursor gases but underestimates nucleation and Aitken mode particles, even after incorporating updated nucleation and ammonium nitrate scheme. The persistence of low aerosol number concentrations, despite overestimated precursors, suggests missing formation pathways likely involving other species such as iodine, amines, and organic vapours.
These limitations result in an unbalanced cloud condensation nuclei budget that over-relies on primary emissions. Sensitivity tests reveal that model outputs are strongly influenced by dimethyl sulfide emissions and vapour condensation schemes. Our results highlight the need for future model development to prioritise mechanistic representation of currently missing aerosol sources, rather than relying on empirical tuning, to improve aerosol-climate interaction estimates.
- Article
(16388 KB) - Full-text XML
- BibTeX
- EndNote


Aerosols profoundly influence the Earth's climate system (Charlson et al., 1992). Depending on their chemical composition and size, they can directly affect the planetary radiation balance by scattering (e.g. sulfate aerosols) or absorbing (e.g. black carbon aerosols) solar radiation. Furthermore, aerosols act indirectly by serving as cloud condensation nuclei (CCN), thereby altering cloud microphysical properties, lifetime, and albedo, which ultimately impacts Earth's radiation balance (Twomey, 1977). While satellite observations help constrain the contemporary radiation balance, understanding the net effect of aerosols on Earth's radiative balance since the preindustrial era, known as aerosol forcing, presents a significant challenge. This aerosol forcing quantification requires knowledge of the aerosol state in the preindustrial era, a period without direct observations.
Consequently, climate models are almost exclusively used to infer preindustrial aerosol states. These models are typically evaluated against the current aerosol state, under the assumption that present-day processes can be extrapolated backward in time. However, uncertainties associated with this assumption, coupled with limitations in accurately simulating even the present-day aerosol lifecycle, lead to substantial uncertainties in estimates of both direct and indirect aerosol forcings (Masson-Delmotte et al., 2021).
Despite the urgent need for reducing aerosol forcing uncertainties, they have shown little improvement over recent decades. Multiple factors contribute to these persistent uncertainties. These include an incomplete understanding of aerosol emission sources and airborne aerosol formation pathways (Kirkby et al., 2023), the intricate nature of aerosol–cloud interactions (Bellouin et al., 2020), difficulties in representing complex aerosol processes and natural feedback loops within Earth system models (ESMs) (Thornhill et al., 2021), and, critically, the poorly constrained preindustrial aerosol state (Carslaw et al., 2013, 2017).
A prerequisite for reducing these uncertainties and ultimately quantifying aerosol–cloud–climate interactions is the accurate quantification of aerosol sources. Aerosols originate from two main pathways: direct emission of primary aerosols (e.g. dust, seasalt, primary organic aerosols and black carbon) and airborne aerosol formation (secondary aerosols) from precursor vapours. This airborne aerosol formation pathway, involving the nucleation of low-volatility molecules followed by growth through condensation or coagulation, is estimated to contribute over 50 % of global tropospheric aerosol number concentration and dominates in the upper troposphere (UT) (Gordon et al., 2017). Therefore, a thorough understanding of airborne aerosol formation is crucial for constraining the global aerosol number budget and improving forcing estimates.
Historically, research into vapours driving aerosol nucleation has centred on sulfuric acid (H2SO4), formed via the oxidation of sulfur dioxide (SO2) by the hydroxyl radical (OH) (Kulmala et al., 1998; Kirkby et al., 2011). Sulfur sources include natural emissions (e.g. from dimethyl sulfide, DMS) and anthropogenic activities (SO2), making H2SO4 nucleation key to understanding both preindustrial conditions and anthropogenic aerosol forcing. Aerosol nucleation involving H2SO4 is typically assisted by water vapour and atmospheric ions, with rates highly sensitive to temperature, humidity, and ion concentrations (Kulmala et al., 1998; Vehkamäki et al., 2002; Lee et al., 2003). However, H2SO4-H2O nucleation, even considering ions, often fails to explain observed aerosol nucleation rates in the boundary layer (Kirkby et al., 2011; Dunne et al., 2016). Subsequent laboratory and field studies have established that alkaline vapours, particularly ammonia (NH3) and amines (e.g. dimethyl amine, DMA), dramatically enhance H2SO4 nucleation rates (Kirkby et al., 2011; Almeida et al., 2013; Jen et al., 2014). This base-enhanced nucleation is observed across diverse environments, from polluted regions (Yan et al., 2021) to pristine polar and marine atmospheres (Jokinen et al., 2018; Beck et al., 2021; Brean et al., 2021).
Beyond H2SO4, recent research has highlighted other significant contributors to regional and potentially global new particle formation (NPF). Oxidation products of monoterpenes are major drivers in boreal forests (Yokouchi and Ambe, 1985; Ehn et al., 2014; Tunved et al., 2006; Kirkby et al., 2016), while isoprene oxidation products are implicated in nucleation events observed in the tropical UT (Andreae et al., 2018; Shen et al., 2024; Curtius et al., 2024). Furthermore, iodine oxoacids play a dominant role in coastal (Hoffmann et al., 2001; O'Dowd et al., 2002; Sipilä et al., 2016) and polar regions (Baccarini et al., 2020; Price et al., 2023). Their widespread presence and rapid nucleation kinetics suggest a broader contribution to marine aerosol formation (He et al., 2021a, b, 2023). These mechanisms can dominate regionally or act synergistically with H2SO4, collectively influencing global aerosol populations (Lehtipalo et al., 2018; He et al., 2023; Shen et al., 2024).
The formation pathways involving organic vapours and iodine species are particularly important in pristine regions. In these environments, cloud formation is highly sensitive to small changes in CCN concentrations (Carslaw et al., 2013; Koren et al., 2014). Moreover, as global anthropogenic sulfur emissions decline, the relative contribution of H2SO4-driven nucleation is expected to decrease, while the importance of organic and iodine-based mechanisms for the global aerosol budget will likely increase (He et al., 2021b, 2023). Accurately representing these processes in climate models is therefore essential for defining the preindustrial baseline, constraining anthropogenic aerosol forcing, and projecting future climate change.
Despite their climatic importance, aerosol processes remain crudely represented in many ESMs. A significant number of models used in initiatives like the Coupled Model Intercomparison Project Phase 6 (CMIP6) employ prescribed aerosol fields, which are not interactively coupled with model chemistry and climate dynamics (Wang et al., 2022). This limits their ability to simulate aerosol forcings and feedbacks realistically. Even in ESMs with interactive aerosol modules (Thornhill et al., 2021), the representation of airborne aerosol formation is often restricted to simplified H2SO4–H2O nucleation schemes based on theoretical rates (Kulmala et al., 1998; Vehkamäki et al., 2002). These schemes face a fundamental paradox: while experimental and observational evidence clearly demonstrates that H2SO4–H2O nucleation mechanisms alone are insufficient to explain observed aerosol number concentrations (Kirkby et al., 2011; Dunne et al., 2016; Kirkby et al., 2023), the most popular theoretical nucleation rates currently adopted in models actually overestimate aerosol nucleation by several orders of magnitude (Yu et al., 2020). This overestimation may unintentionally compensate for missing nucleation mechanisms involving other species such as ions from cosmic rays or radon, NH3, organics, and iodine compounds (Kirkby et al., 2011, 2016; He et al., 2021b, 2023; Shen et al., 2024), but it prevents models from capturing the underlying physical processes and their associated climate feedbacks related to nitrogen, carbon, and iodine cycles.
Robust evaluation against observations therefore is paramount for assessing ESM performance and improving the necessary aerosol precursor chemistry and microphysics. While satellite observations provide valuable global context, they have limitations, particularly in detecting aerosols smaller than 100 nm and those near or below clouds (Seinfeld et al., 2016). Aircraft campaigns offer complementary, high-resolution in-situ data on precursor gases, detailed aerosol number size distributions, and sometimes chemical composition. Among available aircraft campaigns, the Atmospheric Tomography (ATom) mission stands out, providing an exceptionally comprehensive dataset relevant to the aerosol lifecycle (Williamson et al., 2019; Brock et al., 2019, 2021; Thompson et al., 2022; Wofsy et al., 2021). For example, the ability to measure aerosol size distributions from below 10 nm to over 1 µm, quantify SO2 at levels below 10 pptv (parts per trillion by volume), and detect hydroxyl radicals sets the ATom observations apart from most other aircraft campaigns. Conducted across four seasons (2016–2018), ATom flights spanned the Pacific and Atlantic Oceans from the Arctic to the Antarctic, sampling continuously both vertically (0.2–12 km) and latitudinally over vast remote marine regions. This makes ATom uniquely suited for evaluating ESM simulations of aerosol processes, especially in pristine marine environments where aerosol–cloud interactions are most sensitive and forcing uncertainties are largest (Carslaw et al., 2013).
ATom observations have been widely used to evaluate aerosol-related processes in global models. For instance, Koenig et al. (2020) compared CAM-Chem simulations of iodine species with measurements. Froyd et al. (2022) evaluated the performance of CESM/CARMA and GEOS/GOCART in simulating dust aerosols and examined the influence of dust on cirrus cloud formation. Williamson et al. (2019) compared aerosol number size distributions from ATom with outputs from GEOS-Chem, CAM5, and CESM. Yu et al. (2019) assessed the effectiveness of aerosol removal by convective systems in CESM. Hodzic et al. (2020) evaluated the performance of GEOS5, ECHAM6-HAM, CESM, and GEOS-Chem in simulating aerosol chemical composition, with a particular focus on organic aerosols. Nault et al. (2021) analysed the simulated inorganic aerosol acidity in CCSM4, GISS, TM4, GEOS-Chem, GEOS5, and AM4.1 using ATom data. More recently, Gao et al. (2022) provided a detailed comparison of GEOS-Chem simulations with ATom measurements across multiple aerosol species, including sulfate, organics, black carbon, nitrate, and ammonium. Bian et al. (2024) evaluated the performance of AeroCom models in simulating the sulfur cycle over the marine atmosphere. Together, these studies demonstrated the value of ATom data in identifying model biases and highlight the importance of accurately representing aerosol sources, transformations, and removal processes to improve simulations of global aerosol lifecycle.
In this study, we leverage the ATom dataset to evaluate the performance of the atmosphere component of the UK Earth System Model version 1.1 (UKESM1.1) (Mulcahy et al., 2023) in simulating key aspects of the aerosol lifecycle. While an earlier version (UKESM1.0) was previously evaluated against ATom (Ranjithkumar et al., 2021), that study focused on only three variables related to airborne aerosol formation (SO2, total aerosol number, condensation sink). Our evaluation is significantly more comprehensive, encompassing precursor vapours (DMS, SO2, NH3) and oxidants (OH and ozone, O3); aerosol number concentrations across nucleation, Aitken, accumulation, and coarse modes; aerosol chemical composition (sulfate, organic, ammonium, nitrate, seasalt); and environmental conditions (temperature [T], relative humidity [RH] and condensation sink [CS]). Such a multi-faceted evaluation is crucial, as tuning models to match a limited subset of variables can unconsciously introduce biases in other areas, leading to equifinality without improving overall predictive skill (Lee et al., 2016).
Furthermore, beyond evaluating the default model configuration, we implement and test several major updated or alternative process representations within UKESM1.1. These include: (1) a new H2SO4-NH3 nucleation scheme (Dunne et al., 2016) with the ammonium nitrate scheme (Jones et al., 2021), reflecting its proposed importance in pristine environments (Kirkby et al., 2011; Dunne et al., 2016); (2) a condensation scheme for methanesulfonic acid (MSA), an important DMS oxidation product involved in aerosol growth (Beck et al., 2021) which is currently ignored in UKESM1.1; (3) the incorporation of an isoprene secondary organic aerosol (SOA) formation scheme, for isoprene's significance for organic aerosol mass (Weber et al., 2021; Tsigaridis et al., 2014); and (4) testing the impact of using a traditional DMS climatology (Lana et al., 2011) and a new chemistry scheme, CRI-Strat2 of UKESM1.1 (Weber et al., 2021; Archer-Nicholls et al., 2021).
It is important to emphasise that while many model evaluation studies focus on sensitivity tests to improve the model performance metrics, the primary focus of this study is improving the aerosol microphysical processes in UKESM1.1. We prioritise implementing experimentally and observationally verified processes over optimising agreement with observations through existing parameter tuning. We aim to identify key discrepancies between the model (in its default and modified configurations) and the ATom observations, analysing these differences from a process-understanding perspective. Finally, we will discuss the implications of these findings for future model development, integrating insights from laboratory studies, field observations, and model simulations to advance our mechanistic understanding of the aerosol lifecycle and its climate role – ensuring improvements are driven by enhanced physical representation.
Consistent with this process-oriented approach, the manuscript is structured as follows. The Methods section provides an overview of UKESM1.1, including its aerosol and chemistry modules, as well as the model developments and implementations carried out in this study. The Results section is organised by individual parameters, allowing readers to focus on specific variables of interest. The Discussion section synthesises these results and highlights their implications for aerosol processes in the marine boundary layer and the upper troposphere. Finally, we present recommendations for further development of UKESM to improve the representation of aerosols and cloud condensation nuclei.
2.1 UKESM description
This study utilises the UKESM1.1 in its atmosphere-only configuration (Sellar et al., 2019; Mulcahy et al., 2020, 2023), wherein sea surface temperatures and sea ice are prescribed from Reynolds' database (Reynolds et al., 2007). UKESM1.1 builds upon the HadGEM3-GC3.1 global coupled atmosphere-ocean-ice climate model (Williams et al., 2018) and incorporates additional Earth system components, including representations of carbon and nitrogen cycles, land use change, ocean biogeochemistry, and a unified troposphere–stratosphere chemistry and modal aerosol scheme (Sellar et al., 2019). The land surface model (Joint UK Land Environment Simulator, JULES) is run simultaneously, but without dynamic vegetation. As a result, land surface temperature, soil moisture, and heat and moisture fluxes to the atmosphere are simulated rather than prescribed.
2.2 United Kingdom Chemistry and Aerosol model (UKCA)
Atmospheric chemistry and aerosols are simulated using the UKCA model (version UM13.0), which is fully coupled to UKESM1.1 for handling tracer transport (O'Connor et al., 2014; Archibald et al., 2020). UKCA utilises emission datasets consistent with the CMIP6, incorporating anthropogenic (Hoesly et al., 2018), biomass-burning (Van Marle et al., 2017), and biogenic sources (Guenther et al., 2012). As the CMIP6 emission datasets utilised in this study extend only up to 2014, emissions for the years after 2015 are prescribed using the Shared Socioeconomic Pathway (SSP) SSP3-7.0 scenario. Some biogenic emissions, including isoprene, terpenes, methanol, and acetone, are simulated using interactive emission schemes. Surface concentrations of methane (CH4), nitrous oxide (N2O) and other well-mixed greenhouse gases were prescribed following the SSP3-7.0 projection.
The aerosol scheme within UKCA is largely based on the Global Model of Aerosol Processes (GLOMAP)-mode (Mann et al., 2010; Mulcahy et al., 2020). GLOMAP employs a two-moment (tracking both number and mass) pseudo-modal approach to simulate the global distribution of sulfate, black carbon, organic matter, and seasalt aerosols, whereas mineral dust is simulated using the CLASSIC sectional dust scheme (Woodward, 2001). Nitrate and ammonium aerosols are not included in the standard UKESM1.1 configuration; however, a scheme incorporating these species has recently been developed (Jones et al., 2021) and is included in some of the simulations we present. GLOMAP simulates comprehensive aerosol microphysical processes, including NPF, condensation of vapours onto existing aerosols, aerosol coagulation, dry deposition, wet scavenging, and cloud processing (Mann et al., 2010). The aerosol number size distribution is represented by four modes: nucleation (geometric mean dry diameter, < 10 nm), Aitken (10 < < 100 nm), accumulation (100 < < 500 nm), and coarse (500 < < 10 000 nm). In the model version used in this study, all four modes contain soluble components. Additionally, there is an insoluble Aitken mode (100 < < 500 nm) composed solely of organic matter and black carbon. At each timestep, a fraction of insoluble Aitken-mode particles is transferred to the soluble Aitken mode. This fraction is proportional to the condensation rate of soluble material (e.g. sulfate or organics) and is scaled such that the accumulation of ten monolayers of soluble material on a fraction of insoluble aerosols would result in the conversion to the soluble mode.
Since comprehensive descriptions of the atmospheric chemistry and aerosol formation mechanisms in UKCA have been previously published (Mann et al., 2010; O'Connor et al., 2014; Archibald et al., 2020; Mulcahy et al., 2020), we focus here only on the key processes and parameterisations directly relevant to the analysis presented in this study.
2.2.1 Primary aerosols
Primary aerosols are aerosols directly emitted from various sources. In UKESM1.1, these include mineral dust, seasalt, black carbon, organic matter, and sulfate. Mineral dust is simulated using a scheme with six size bins ranging from 0.06 to 60 µm in diameter. The dust within each bin is treated independently and assigned a density of 2.65 kg m−3 (Woodward, 2001).
Seasalt emissions are calculated using the bin-resolved parameterisation of Gong (2003). The emitted mass and number are distributed between the soluble accumulation and coarse modes, depending on whether the centre diameter of the source bin is below or above the diameter threshold separating these modes (approximately 500 nm). A density of 2.165 kg m−3 is assumed for seasalt in UKESM1.1.
Primary carbonaceous aerosol emissions include black carbon and organic matter originating from both anthropogenic sources (biofuel and fossil fuel combustion) and biomass burning processes. Aerosols emitted from biomass/biofuel sources are assigned a geometric mean diameter of 150 nm, while those from fossil fuel sources are assigned 60 nm; both emission types assume standard deviation of 1.59 (Stier et al., 2005; Mann et al., 2010). Notably, although the assigned diameter for biomass/biofuel aerosol emissions (150 nm) exceed the typical upper size limit of the Aitken mode (100 nm), these aerosols are nevertheless emitted into the model's insoluble Aitken mode. Anthropogenic emissions are released into the lowest model layer, whereas biomass burning emissions are distributed vertically between the surface and approximately 6 km above ground level.
Primary marine organic aerosols represent another primary aerosol source which was recently implemented in UKESM (Mulcahy et al., 2020). These organic aerosols are thought to be emitted as components of organic-enriched sea spray (Rinaldi et al., 2010), and their emissions show a high correlation with marine biological activity, often indicated by chlorophyll concentrations (Rinaldi et al., 2013). Consequently, UKESM1.1 adopts the parameterisation of Gantt et al. (2012), which relates emissions to both wind speed and biological activity represented by surface chlorophyll concentration. The calculated organic mass emission flux is partitioned, with 25 % attributed to the soluble Aitken mode and 75 % to the insoluble Aitken mode. An emission diameter of 160 nm is assumed for both fractions, based on experimental and observational constraints (O'Dowd et al., 2004; Prather et al., 2013).
Consistent with Mann et al. (2010), the model assumes that 2.5 % of anthropogenic SO2 emissions by mass are directly emitted as primary sulfate aerosols. This primary sulfate mass is distributed with an initial size distribution specified by Stier et al. (2005): 50 % is allocated to the accumulation mode (assuming = 150 nm) and 50 % to the coarse mode (assuming = 1500 nm).
2.2.2 Sulfur sources and chemistry
Sulfate aerosols form through the oxidation of SO2, either via gas-phase reactions that produce H2SO4 and trigger NPF and growth, or through multiphase oxidation by hydrogen peroxide (H2O2) and O3 dissolved in cloud liquid water, which contributes to aerosol mass only. The gas-phase oxidation of SO2 produces gaseous H2SO4, which drives NPF and growth in the model. In the aqueous phase, SO2 dissolves into cloud droplets, where it undergoes oxidation by dissolved H2O2 and O3 to form sulfate. The model does not include an explicit representation of multi-phase chemical species; instead, the sulfate formed through these pathways is treated as a direct mass flux contributing to the accumulation and coarse aerosol modes. Finally, because certain removal processes (e.g. precipitation removal) associated with aqueous sulfate formation are not represented in the model, a 25 % reduction factor is applied to the calculated aqueous sulfate formation mass flux (Mulcahy et al., 2020).
In UKCA, SO2 originates from both the oxidation of DMS and direct anthropogenic emissions. Anthropogenic emissions of SO2 are taken from the Community Emissions Data System (CEDS) inventory (Hoesly et al., 2018). SO2 emitted from both the energy and industrial sectors is released into the model's surface layer (up to 35 m), consistent with the treatment of other trace gas emissions in UKCA. Additionally, natural SO2 emission from continuously degassing volcanoes is prescribed using the climatology developed by Dentener et al. (2006). A major revision of the SO2 dry deposition scheme, as described by Hardacre et al. (2021), was implemented in UKESM1.1. This update, along with several additional bug fixes and model improvements detailed in Mulcahy et al. (2023), contributed to reduced surface SO2 concentrations in UKESM1.1 compared to the earlier UKESM1 version evaluated by Ranjithkumar et al. (2021).
Table 1Comparison of DMS oxidation pathways across different chemistry schemes in UKESM versions. The table shows the key DMS oxidation reactions implemented in UKESM1.0 (Strat-Trop), UKESM1.1 (Strat-Trop), and UKESM1.1 (CRI-Strat2) chemistry schemes. UKESM1.1 incorporates dimethyl sulfoxide (DMSO) as an intermediate species with simplified oxidation pathways, while CRI-Strat2 includes a more detailed representation with methylthiomethylperoxy radical (MTMP) and methylsulfinic acid (MSIA) intermediates leading to both SO2 and MSA formation. The numerical coefficients indicate stoichiometric yields for branching reactions. We note that while Mulcahy et al. (2023) suggested that the UKESM1.1 included DMS + O(3P) → SO2, it is not included in the version of UKESM1.1 used in this study.
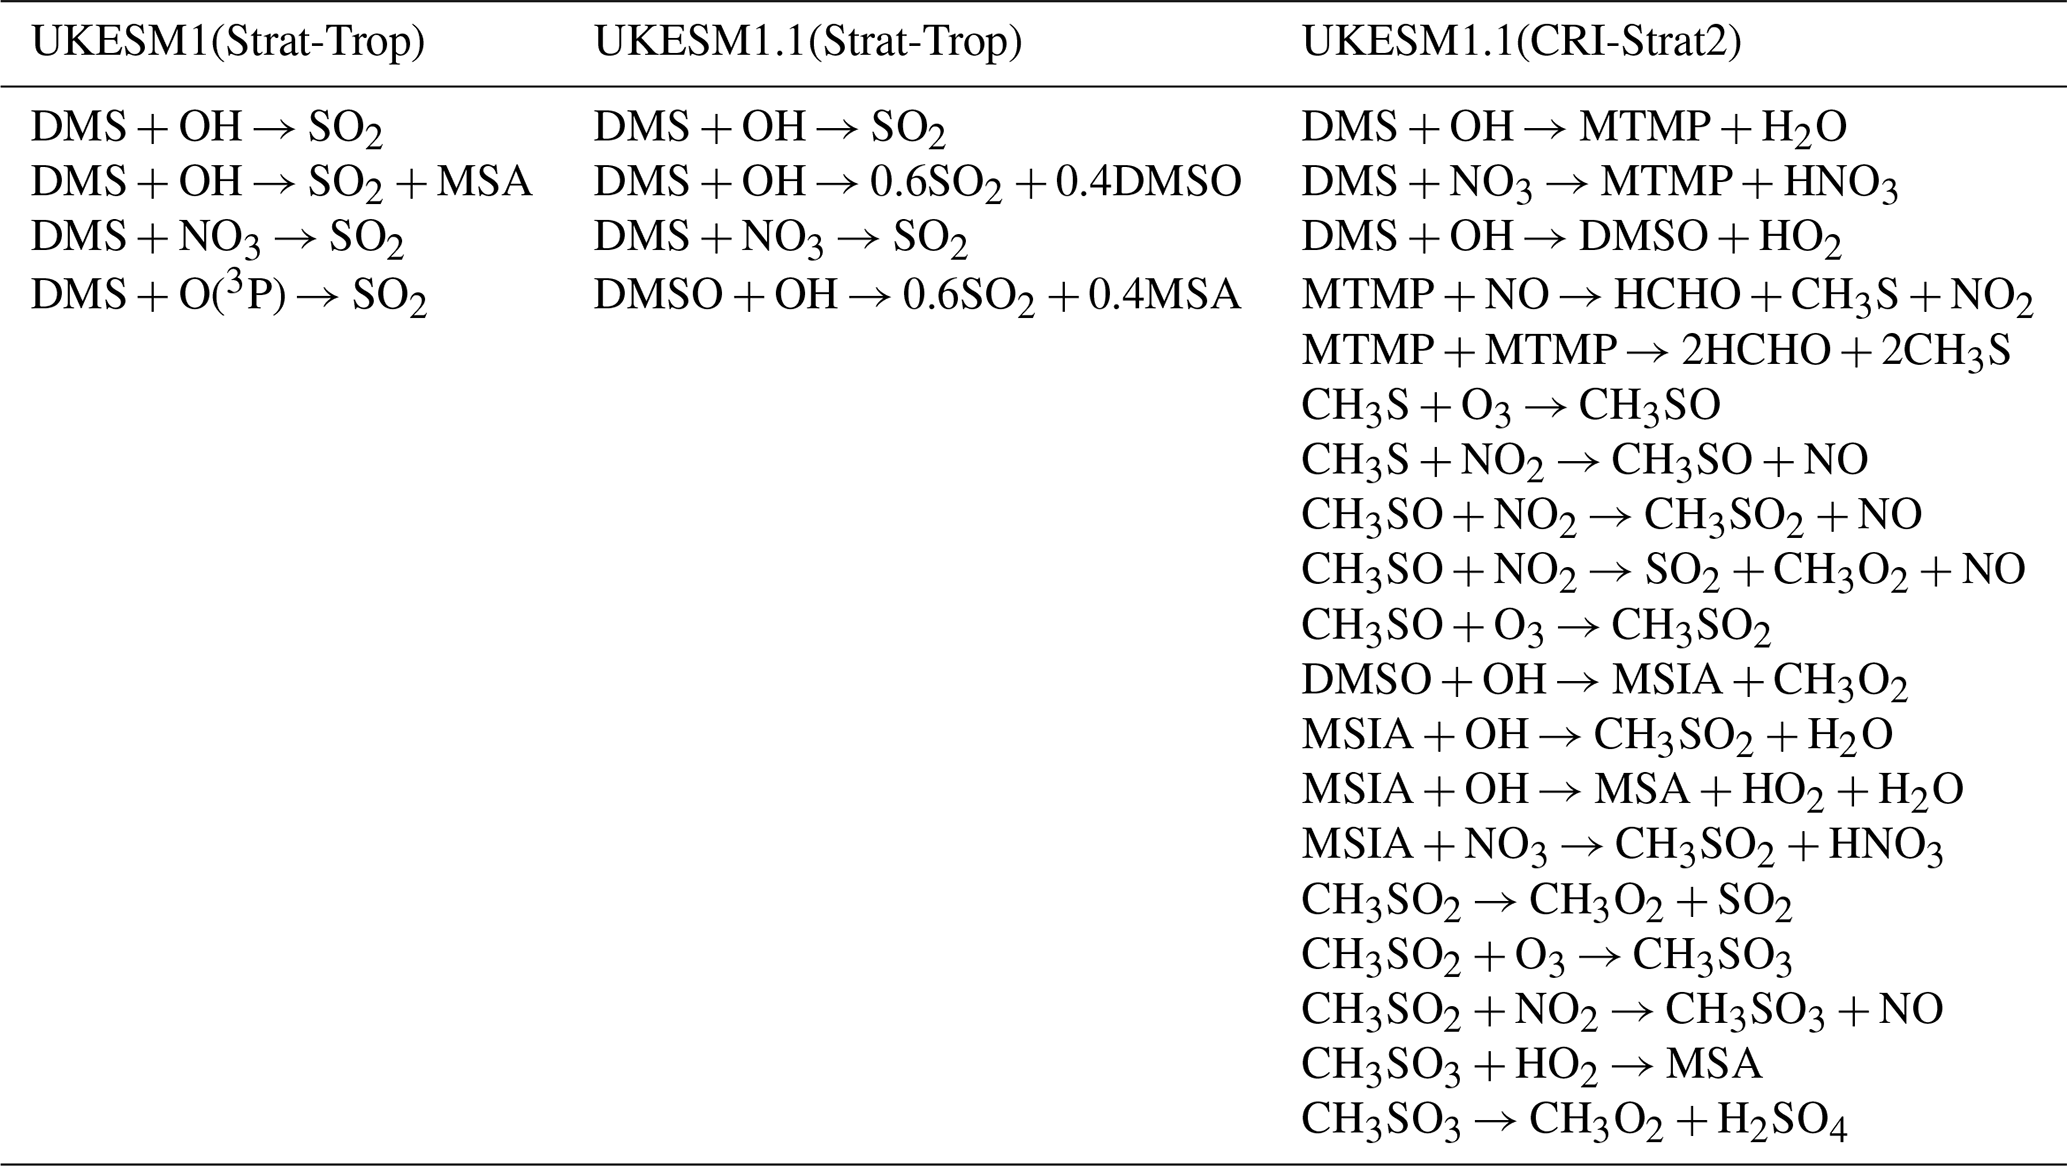
Marine DMS emissions in the model are calculated using an interactive scheme. The ocean biogeochemistry component, incorporating the Model of Ecosystem Dynamics, nutrient Utilisation, Sequestration and Acidification (MEDUSA) module, simulates the DMS concentration in the surface ocean. This follows the formulation modified from Anderson et al. (2001) to ensure energy balance within the coupled system (Sellar et al., 2019). Additionally, terrestrial DMS emissions are also included, based on an earlier climatology (Spiro et al., 1992).
The representation of DMS chemistry within UKCA is simplified, a common necessity in large-scale global models. The primary oxidation pathway for DMS represented in the model is the reaction with OH radicals, which is the dominant atmospheric sink for DMS. Additionally, DMS is also oxidised by nitrate (NO3) radicals and atomic oxygen (O(3P)), although the latter pathway is generally negligible in the troposphere. The default chemistry scheme employed in UKCA is the Strat-Trop scheme (Archibald et al., 2020), but the specific reactions of DMS oxidation pathways differ between UKESM1 and UKESM1.1 (Table 1). The reaction of DMS with OH proceeds via two channels: addition and abstraction. In both UKESM versions, the abstraction channel of OH oxidation, along with DMS oxidation by NO3, leads directly to the formation of SO2. While Mulcahy et al. (2023) suggested that the UKESM1.1 included the reaction DMS + O(3P) → SO2, it is not included in the version of UKESM1.1 used in this study. The addition channel in UKESM1.1 differs from that in UKESM1; the latter neglects the formation of dimethyl sulfoxide (DMSO). However, DMSO is recognised as an important intermediate species subject to atmospheric transport and deposition and it is a precursor of MSA. Consequently, DMS oxidation by OH directly produces MSA in UKESM1.0, partially accounting for the neglected DMSO pathway. In UKESM1.1, the addition channel was modified to produce a mixture of SO2 and DMSO, with molar yields of 0.6 and 0.4, respectively. Subsequent DMSO oxidation by OH in UKESM1.1 further produces SO2 and MSA, with yields of 60 % and 40 %, respectively (Table 1).
2.2.3 Airborne formation of aerosols
Several key airborne aerosol production processes are simulated by default in UKCA. First, new particles are formed via the binary H2SO4–H2O nucleation scheme, producing aerosols in the smallest (nucleation) mode. Second, aerosols grow via the condensation of H2SO4 and organic oxidation products onto existing aerosol surfaces. In the meantime, coagulation between aerosol particles reduces the number concentration in smaller modes (e.g. the nucleation mode) while contributing to aerosol growth in larger modes (e.g. the Aitken and accumulation modes). When aerosols within a specific mode grow beyond the upper size threshold for that mode, they are transferred to the next largest mode via mode merging (Mann et al., 2010).
The default binary H2SO4–H2O aerosol nucleation mechanism follows the theoretical parameterisation described by Vehkamäki et al. (2002), which is most effective at producing new particles in the free troposphere. Mechanisms for NPF specifically within the planetary boundary layer are not explicitly included in the default model configuration. However, the model includes an option to use a boundary layer nucleation parameterisation based on cluster activation theory, wherein the nucleation rate exhibits a power-law dependence on the H2SO4 concentration (Kulmala et al., 2006). Additionally, a multi-component nucleation scheme described by Metzger et al. (2010), which considers the roles of both H2SO4 and organic vapours, is also available as an option within the model. It should be noted that these optional boundary layer nucleation schemes do not quantitatively represent the state-of-the-science atmospheric nucleation mechanisms and are therefore not utilised in this study (Kirkby et al., 2023).
Condensable organic oxidation products, which contribute to aerosol growth, are represented in the model as originating from the oxidation of monoterpenes, assuming a lumped mass yield of 13 % (Mann et al., 2010). However, to account for SOA production from other sources (such as isoprene oxidation) and to compensate for the absence of explicit anthropogenic and marine volatile organic compound (VOC) emissions in this model configuration, this lumped monoterpene oxidation yield is scaled by a factor of two.
Besides nucleation, vapour condensation, and coagulation, other aerosol microphysical processes simulated in the model impact the aerosol lifecycle, including dry deposition, wet scavenging, and the ageing of insoluble aerosols (representing processes that increase aerosol solubility). Readers are referred to Mann et al. (2010) for the detailed formulation of these microphysical processes.
2.3 Model development
A major hurdle in climate simulations involving aerosols and their interactions with clouds and climate is the often-poor representation of precursor chemistry (e.g. sulfur chemistry) and aerosol nucleation mechanisms. For example, the theoretical binary H2SO4–H2O nucleation mechanism adopted by UKESM1.1 dates back to around the turn of the century (Kulmala et al., 1998; Vehkamäki et al., 2002), and this mechanism is widely recognised as mechanistically insufficient to fully explain atmospheric aerosol formation (Kirkby et al., 2011, 2023). Furthermore, recent advances in understanding DMS oxidation mechanisms point to insufficient representation of these pathways in the default UKESM1.1 for accurately simulating marine sulfur chemistry and subsequent aerosol formation (Cala et al., 2023).
In addition to employing potentially outdated mechanisms, the default UKESM1.1 configuration also lacks representations of several processes known to be important for aerosol formation and growth. For instance, the model lacks representation of ion-induced nucleation processes, which are recognised as a globally significant source of aerosols (Kirkby et al., 2011; Dunne et al., 2016). Additionally, the model treats MSA as an inert tracer, meaning it is not subject to deposition, or condensation processes, despite its demonstrated importance in aerosol growth (Beck et al., 2021). The model also lacks a representation of NPF processes involving isoprene oxidation products, which has recently been identified as important in the tropical UT (Shen et al., 2024; Curtius et al., 2024). Other key omissions include, for example, the lack of representation of iodine chemistry and the associated iodine oxoacid aerosol formation mechanisms, processes shown to have a global impact on marine aerosol formation (He et al., 2021b, 2023), and alkaline molecules such as ammonia (NH3), which are known to enhance aerosol nucleation (Kirkby et al., 2011).
To address some of these key deficiencies, this study implements several process improvements, focusing primarily on incorporating the H2SO4–NH3 nucleation mechanism, which includes both the ion-induced and neutral nucleation channels, and a new, preliminary MSA condensation scheme based on recent observational findings. H2SO4–NH3 aerosol nucleation has been shown to be an important global process (Kirkby et al., 2011; Dunne et al., 2016). The implemented H2SO4–NH3 nucleation parameterisation is one of the few derived directly from experiments utilising instrumentation designed to minimise the influence of organic vapours and other strong alkaline molecules (Kirkby et al., 2011; Almeida et al., 2013). The MSA condensation scheme is based on the observational work of Beck et al. (2021), which demonstrated that MSA can condense effectively onto pre-existing aerosols, contributing significantly to their early growth. As an initial proof-of-concept implementation, this MSA condensation scheme assumes irreversible condensation onto pre-existing aerosols (analogous to the model's treatment of H2SO4 and oxidised organics).
Table 2Summary of model simulations and configurations used in this study. The table shows the key differences between simulations, including DMS emission schemes (interactive vs. climatology), atmospheric chemistry schemes (Strat-Trop vs. CRI-Strat2), aerosol nucleation mechanisms (H2SO4–H2O vs. H2SO4–NH3), inclusion of ammonium nitrate chemistry, methanesulfonic acid (MSA) condensation, and secondary organic aerosol (SOA) formation pathways. MTSOA refers to monoterpene-derived SOA mass yield, while IPSOA refers to isoprene-derived SOA mass yield. The SA-NH3 (benchmark) simulation represents the primary configuration with newly implemented H2SO4–NH3 nucleation scheme and ammonium nitrate scheme used for comparison with other model implementations. Simulation abbreviations (e.g. SA-NH3-IPSOA) are used throughout the manuscript, where SA denotes sulfuric acid to distinguish from the chemical formula notation (e.g. H2SO4–NH3) used for nucleation mechanisms.
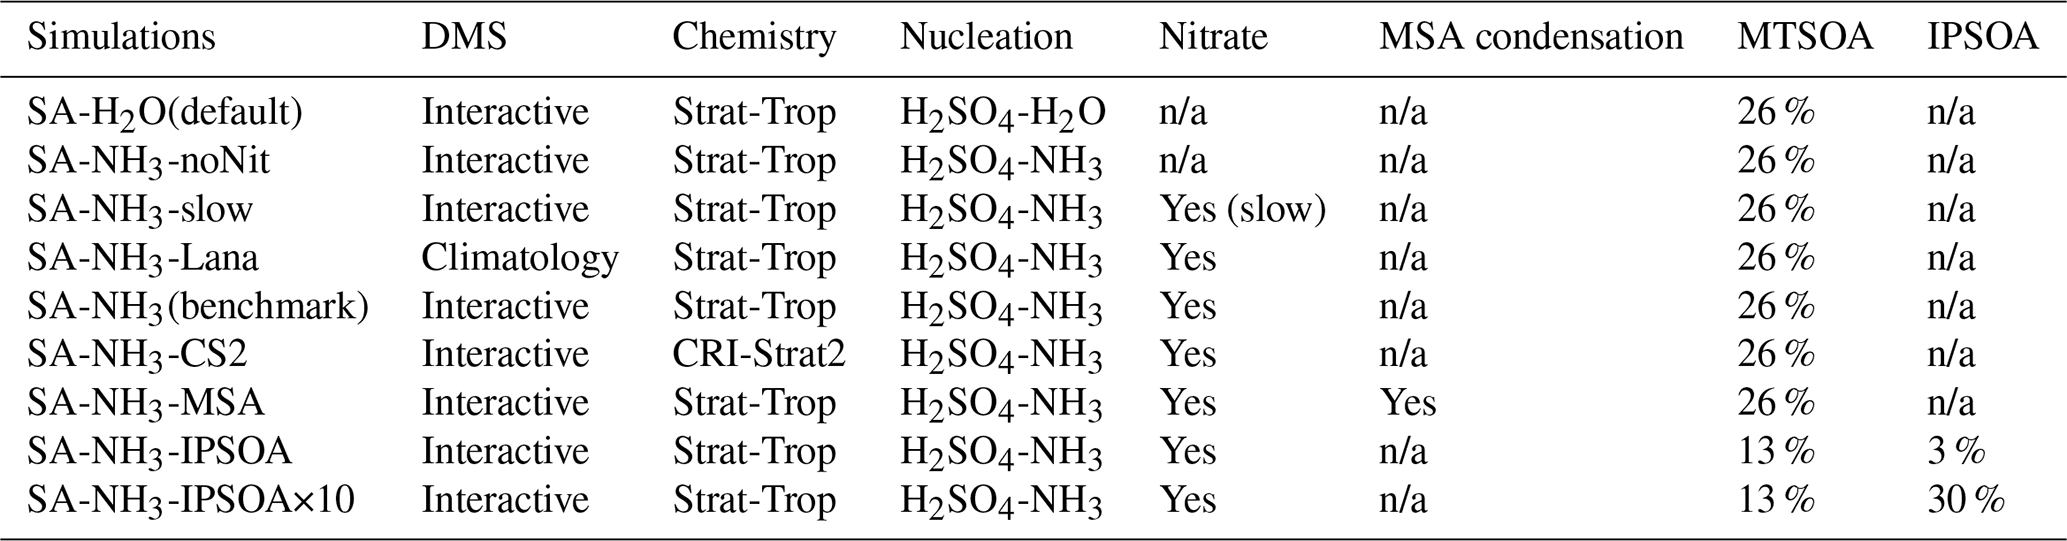
n/a: not applicable
In addition to these new developments, we also test the impact of using the alternative CRI-Strat2 chemistry scheme (Weber et al., 2021; Archer-Nicholls et al., 2021), incorporate the recently developed ammonium nitrate scheme (Jones et al., 2021), and evaluate the effect of replacing the interactive DMS emission scheme with a DMS climatology (Lana et al., 2011) in the model. A full list of the simulations performed is provided in Table 2, which details the key differences between the model configurations used in this study.
2.3.1 Development of H2SO4–NH3 aerosol nucleation mechanism
The implemented H2SO4–NH3 nucleation scheme is based on the parameterisation developed by Dunne et al. (2016), which was derived from measurements performed in the CERN CLOUD (Cosmics Leaving OUtdoor Droplets) experiments. A key feature of the CLOUD experiments, compared with previous laboratory studies, is the extremely high standard of cleanliness. This allows the nucleation capability of individual vapours, and mixtures thereof, to be studied independently with minimal contamination. Taking advantage of this capability, experiments were performed to separately evaluate the influence of H2SO4, NH3, H2O, and atmospheric ions on the aerosol nucleation rate. Readers are referred to the original paper for detailed formulations and parameter values (Dunne et al., 2016).
Experiments reported in Dunne et al. (2016) identified four distinct aerosol nucleation regimes, differentiated by the concentrations of NH3 and the presence of atmospheric ions. The first regime is termed binary neutral nucleation of H2SO4–H2O; this represents the experimental version of the theoretical nucleation scheme used by default in UKESM1.1 (Kulmala et al., 1998; Vehkamäki et al., 2002). This regime's rate depends only on the concentrations of H2SO4 and H2O. The second regime is termed binary ion-induced nucleation of H2SO4–H2O, describing nucleation in the presence of atmospheric ions. Consequently, the nucleation rate of this regime exhibits an additional dependence on the concentration of atmospheric ions. The third regime is ternary neutral nucleation of H2SO4–NH3(–H2O), which depends on the concentrations of H2SO4, NH3, and H2O. As H2O participation is fundamental to atmospheric nucleation, it is often implicitly assumed and omitted from the nomenclature. Finally, the fourth regime is ternary ion-induced nucleation of H2SO4–NH3, which incorporates the enhancing effect of atmospheric ions on the ternary system.
The impact of H2O on aerosol nucleation is represented as a relative humidity dependent multiplier (KRH) applied to the nucleation rate calculated based on H2SO4, NH3, and atmospheric ion concentrations. The formula reads , where c1 = 1.5 ± 1.3, c2 = 0.045 ± 0.003, RH is the relative humidity expressed as a fraction, and T is the temperature in Kelvin. This formulation uses 38 % RH (RH = 0.38) as the reference condition, reflecting the humidity level at which most of the underlying experiments were performed (Dunne et al., 2016).
As atmospheric ion pair production rates are not explicitly simulated in UKESM1.1, they are prescribed using a climatology output from the simulations described by Gordon et al. (2017). NH3 emissions in UKESM1.1 are taken from the CEDS dataset (Hoesly et al., 2018). However, simulated atmospheric NH3 concentrations within the model are not well constrained. For example, the uptake of gaseous ammonia by acidic aerosols (leading to ammonium formation), which is widely acknowledged as an important NH3 sink, is not represented in the default model configuration. This leads to an overestimation of gas-phase NH3 concentrations in the model. Therefore, the recently developed ammonium nitrate scheme (Jones et al., 2021) is incorporated in most simulations in this study, aiming to improve the representation of the atmospheric NH3 budget.
The new H2SO4–NH3 nucleation scheme is implemented in all simulations listed in Table 2, except for the control simulation using the default binary scheme, labelled SA–H2O(default). The SA-NH3(benchmark) simulation represents a key experiment in this study; it incorporates the ammonium nitrate scheme using parameter settings corresponding to the fast nitrate formation scheme (specifically, a nitric acid uptake coefficient γ = 0.193) as described by Jones et al. (2021). Another sensitivity simulation, SA-NH3-slow, explores slower nitrate formation by utilising γ = 0.001. Additionally, the SA-NH3-noNit simulation is performed using the H2SO4–NH3 nucleation scheme but without activating the ammonium nitrate module, serving as a reference to evaluate the impact of the nitrate scheme itself on aerosol formation.
2.3.2 Development of MSA condensation scheme
In the default UKESM1.1 configuration (Mulcahy et al., 2023), MSA is treated as an inert tracer. This treatment causes MSA to accumulate indefinitely in the model, leading to unrealistically high concentrations. To address this limitation, a scheme of MSA condensation onto pre-existing aerosols, as well as its wet and dry deposition, are implemented in the model in this study.
The wet deposition of MSA is treated analogously to other soluble gas-phase species in the model, following the formulation described by Giannakopoulos et al. (1999). Consistent with recommendations by Barnes et al. (2006) and Cala et al. (2023), an effective Henry's law constant of 109 M atm−1 is adopted for MSA. The dry deposition rate of MSA is assumed to be the same as that calculated for gaseous H2SO4, for the similarity in their molecular sizes and, consequently, their diffusivities in air.
Finally, the MSA condensation scheme implemented assumes irreversible condensation onto pre-existing aerosol particles, at the same rate as H2SO4. This assumption is based on the comparable molecular weights (MSA = 96 g mol−1; H2SO4 = 98 g mol−1) and bulk densities (MSA = 1.5 g cm−3; H2SO4 = 1.8 g cm−3) of the two species. This treatment is supported by recent Arctic observations which suggest that MSA can condense effectively onto pre-existing aerosols, potentially at a rate comparable to that of H2SO4 (Beck et al., 2021). The MSA aerosol mass is currently merged with the existing sulfate aerosol mass in the model for simplicity. The MSA condensation scheme is added to the SA-NH3 (benchmark), hereafter referred to as SA-NH3-MSA.
However, it must be emphasised that this MSA condensation scheme is preliminary and has not yet been fully validated against comprehensive experimental data. For instance, a potential humidity dependence of MSA partitioning to the aerosol phase has been implicated in aircraft measurements (Mauldin et al., 1999). Other modelling studies have adopted volatility-dependent parameterisations for MSA condensation, assuming it to be a temperature- and humidity-dependent process (Hodshire et al., 2019). Unfortunately, there is currently limited experimental data available to rigorously validate MSA condensation rates predicted by either type of scheme; future experimental work is crucial for developing and constraining MSA condensation parameterisations in models. Thus, the MSA condensation scheme in this study aims to provide an initial proof-of-concept implementation, allowing for the evaluation of MSA's potential impact within the current chemistry framework.
2.3.3 Coupling H2SO4–NH3 nucleation with a DMS emission climatology
Although the default UKESM1.1 configuration employs an interactive marine DMS emission scheme coupled to the MEDUSA module, this study also evaluates the widely used DMS climatology developed by Lana et al. (2011). This comparison is motivated by the significant uncertainties associated with modelled DMS emissions. For example, Bhatti et al. (2023) demonstrated that simulated DMS emissions in the Southern Ocean are highly sensitive to the choice of emission parameterisation. Specifically, the seawater DMS concentrations predicted by the interactive MEDUSA scheme generally exhibit limited spatial variability, although they show low values surrounding the Antarctic continent. In contrast, the Lana et al. (2011) climatology predicts distinct hotspots of high seawater DMS concentration near Antarctica. While rigorously verifying the true spatial pattern of global DMS emissions is beyond the scope of this study, the distinct differences between the interactive scheme and the climatology are substantial. This provides an opportunity to evaluate the sensitivity of simulated atmospheric chemistry and aerosol properties in response to different DMS source mechanisms. The DMS climatology is implemented in the simulation labelled SA-NH3-Lana, which also utilises the H2SO4–NH3 nucleation scheme and the ammonium nitrate scheme.
2.3.4 Coupling H2SO4–NH3 nucleation with CRI-Strat2 chemistry
The coupling of the Common Representative Intermediates mechanism (CRI) with the existing UKCA stratospheric chemistry scheme (Strat) was initially carried out by Archer-Nicholls et al. (2021) and subsequently updated by Weber et al. (2021) to create the CRI-Strat2 (CS2) chemistry scheme. The development of CS2 aimed to improve the model's representation of the oxidation of non-methane volatile organic compounds and provide traceability to the CRI2.2 scheme (Jenkin et al., 2019). For instance, compared to the default Strat-Trop scheme, the CS2 scheme includes a more detailed representation of the oxidation pathways for DMS and other key biogenic VOCs, such as isoprene and monoterpenes. It is worth noting that the original CS2 scheme is not only a new chemistry mechanism but also uses different emission inventories – distinct from those used in simulations with the Strat-Trop chemistry scheme. Details of the emission inventories employed in the CS2 scheme are provided in Archer-Nicholls et al. (2021) and Weber et al. (2021). For example, most anthropogenic and biogenic emissions are based on datasets spanning 2000–2010 or on a 2010 time-slice. In this study, we updated selected anthropogenic emissions – including SO2, nitrogen monoxide, organic carbon, black carbon, ammonia, methane, and carbon monoxide – to use CMIP6 SSP3-7.0 emissions to be consistent with the ST simulations. Emissions of volatile organic compounds (VOCs), most of which are unique in CS2, are left unchanged and therefore remain consistent with the original implementations described by Archer-Nicholls et al. (2021) and Weber et al. (2021). This modification removes the influence of inconsistent anthropogenic emissions, such that the comparison between CS2 and ST presented in this study primarily reflects differences in the underlying chemistry schemes, as well as the impact of the additional VOCs included in CS2.
The key reaction pathways of the DMS oxidation within the CS2 version used in this study are tabulated in Table 1. Similarly to other sensitivity simulations, the CS2 scheme is coupled with the H2SO4–NH3 nucleation scheme and the ammonium nitrate scheme, which is labelled SA-NH3-CS2. It is important to note, however, that despite providing an improved representation compared to Strat-Trop, the key DMS oxidation pathways included in CS2 (primarily following those described by Von Glasow and Crutzen, 2004) do not reflect the latest scientific understanding (Cala et al., 2023). Numerous recent studies, emerging from theoretical, laboratory experiments, and field observations, have provided a more comprehensive picture of DMS oxidation mechanisms (Veres et al., 2020; Shen et al., 2022; Jacob et al., 2024). However, incorporating these more up-to-date reaction pathways into the model is beyond the scope of this study. The primary purpose of this simulation is therefore to evaluate how employing a different, more complex tropospheric chemistry scheme (CS2 vs. Strat-Trop) influences the simulated atmospheric sulfur cycle, the resultant aerosol number size distributions and composition.
2.3.5 Coupling H2SO4–NH3 nucleation with isoprene secondary organic aerosol formation
The default UKESM1.1 configuration incorporates a simplified representation of SOA formation, based solely on the oxidation of monoterpenes. SOA formation from isoprene oxidation is not explicitly represented; instead, its contribution is implicitly considered by scaling the monoterpene oxidation SOA yield by a factor of two. However, Weber et al. (2022) recently implemented a new scheme in the UKCA model to explicitly represent isoprene SOA formation. This new scheme treats SOA formed from isoprene oxidation as a distinct aerosol component, produced with a fixed mass yield of 3 % from the reaction of isoprene with the major atmospheric oxidants (O3, NO3, and OH). Other aspects of the treatment of this isoprene SOA component are assumed to be identical to those of the SOA derived from monoterpene oxidation. The choice of the 3 % yield is based on the work of Scott et al. (2014), which in turn relies on the experimental findings of Kroll et al. (2005, 2006). Concurrently with the introduction of this explicit isoprene SOA source, the scaling factor previously applied to the monoterpene SOA yield is removed. Therefore, the mass yield for SOA formation from monoterpene oxidation reverts to its base value of 13 % in simulations using this scheme (Table 2). The simulation incorporating this explicit isoprene SOA scheme is referred to as SA-NH3-IPSOA. After formation, the condensable oxidation products of monoterpenes and isoprene are assumed to condense irreversibly onto all particle modes, including nucleation, Aitken, accumulation, and coarse.
It should be acknowledged that representing SOA formation using fixed yields is a significant simplification, as actual yields are known to be strongly influenced by factors such as temperature, oxidant concentrations, aerosol acidity and nitrogen oxide (NOx) levels. Furthermore, the formation pathways differ: monoterpene oxidation can produce extremely low-volatility compounds that contribute effectively to SOA mass through irreversible condensation (Ehn et al., 2014), whereas isoprene SOA formation is thought to be dominated by the reactive uptake of gas-phase oxidation products, such as isoprene epoxydiols (IEPOX) (Paulot et al., 2009). This reactive uptake process is significantly affected by factors like aerosol acidity; for instance, yields as high as 28.6 % have been observed under low-NOx conditions onto acidified sulfate seed aerosol (Surratt et al., 2010). Additionally, many previous laboratory experiments on isoprene SOA yields were conducted at room temperatures. Given that lower temperatures reduce the volatility of organic vapours, the effective yield of isoprene SOA formation is expected to be higher under colder atmospheric conditions. This expectation is supported by the recent work of Shen et al. (2024), which revealed that isoprene oxidation products can initiate both aerosol nucleation and subsequent growth at low temperatures, implying a significantly higher potential SOA yield under such conditions. Therefore, to explore the sensitivity to this uncertainty, we also perform a simulation where the mass yield for the explicit isoprene SOA formation scheme is increased tenfold (to 30 %). This simulation is referred to as SA-NH3–IPSOA×10.
2.4 ATom airborne campaign
The ATom airborne campaign aimed at investigating the composition of the atmosphere over the remote Pacific and Atlantic Oceans (Thompson et al., 2022). Measurements were carried out using the NASA DC-8 aircraft from 2016 to 2018 across four major deployments, roughly corresponding to the four seasons: spring (ATom-4, April–May 2018), summer (ATom-1, July–August 2016), autumn (ATom-3, September–October 2017), and winter (ATom-2, January–February 2017). The measurements covered a wide latitudinal range from the Arctic to the Antarctic (approximately 84° N to 86° S) and extended vertically from near the surface to the tropopause (approximately 0.2 to 12 km), primarily over remote ocean regions. The aerosol number size distribution data used in this study are from version 2 of the dataset by Brock et al. (2022), while the trace gas data are from Wofsy et al. (2021).
One of the key scientific objectives of the ATom campaign is to understand the distribution of aerosols and the precursor vapours contributing to aerosol formation and growth. Consequently, the ATom campaign boasted a comprehensive suite of instruments measuring the atmospheric constituents relevant to the full aerosol lifecycle, from precursor vapours to aerosol number size distribution and chemical composition. This rich dataset provides a unique opportunity to evaluate the performance of the UKESM1.1 model simulations presented in this study.
The aerosol number size distribution of dry aerosols, spanning the diameter range from 2.7 nm to 4.8 µm, was obtained by merging measurements from several instruments. Firstly, the nucleation-mode aerosol size spectrometer (NMASS) system features a set of five condensation particle counters (CPCs) operating in parallel at different cut-off diameters (Williamson et al., 2018). Two sets of NMASS instruments were deployed on the DC-8 aircraft: the first was used across all four ATom campaigns, while the second was added for ATom-2, -3, and -4. The CPCs of the first NMASS had lower cut-off diameters set at 3.2, 8.3, 14, 27, and 59 nm, while the second NMASS used cut-offs of 5.2, 6.9, 11, 20, and 38 nm, resulting in merged data across 10 size bins below approximately 60 nm. Aerosols in the diameter range 63 to 1000 nm were measured by an ultra-high-sensitivity aerosol size spectrometer (UHSAS) (Kupc et al., 2018). For larger aerosols from 120 nm to 10 µm, a laser aerosol spectrometer (LAS, model 3340, TSI Inc.) was employed. However, the effective upper detection size limit for the LAS was restricted to 4.8 µm due to the size cut by the aircraft inlet system (Brock et al., 2019). Furthermore, due to an instrument malfunction during ATom-2, LAS data from that deployment were only used for the 0.97 to 4.8 µm range, after the application of correction factors (Brock et al., 2019). It is important to note that aerosol size distribution data exclude periods when the aircraft was within clouds (Brock et al., 2019).
Regarding precursor gases, the SO2 data from ATom-1, -2, and -3 had insufficient sensitivity (detection limit > 100 pptv) for typical remote marine conditions (tens of pptv). Therefore, only the SO2 data from ATom-4 are used in this evaluation. The instrument used during the ATom-4 campaign was a laser-induced fluorescence (LIF) instrument capable of detecting SO2 down to approximately 2 pptv, even at pressures as low as 35 hPa, making it ideal for the ATom measurement requirements (Rollins et al., 2016). OH concentrations were measured using the Penn State Airborne Tropospheric Hydrogen Oxides Sensor (ATHOS), which reported detection limits of approximately 4.5 × 105 cm−3 near the surface and 1.5 × 105 cm−3 at 10 km altitude. O3 concentrations were measured by the National Oceanic and Atmospheric Administration (NOAA) NOyO3 instrument (Pollack et al., 2010).
Measurements of non-refractory submicron aerosol chemical composition were provided by the University of Colorado high-resolution time-of-flight aerosol mass spectrometer (AMS) (Hodzic et al., 2020; Guo et al., 2021). For consistency with the model's aerosol scheme, the evaluated AMS composition data were limited to sulfate, ammonium, nitrate, organic matter, and seasalt components. The atmospheric NH3 concentration data used in this study were not directly measured but were derived from the AMS aerosol acidity measurements provided by Nault et al. (2021). Therefore, the estimation of gas-phase NH3 is likely subject to greater uncertainty than that of aerosol mass measurements.
Unless otherwise noted, reported observational and model data for aerosol number concentrations, vapour condensation sink, and aerosol mass concentrations used in this study have been converted to standard temperature and pressure (STP: 273.15 K, 1000 hPa). To enable direct comparisons between the model output and observations, aerosol number size distributions from ATom were recalculated into consistent size modes: nucleation mode (< 10 nm in diameter), Aitken mode (10–100 nm), accumulation mode (100 nm–1 µm), and coarse mode (1–10 µm).
2.5 Evaluation of UKESM1.1 using ATom observations
The simulations in this study employ a horizontal resolution of 1.875° longitude × 1.25° latitude, corresponding to approximately 135 km at the equator. Vertically, the model utilises 85 levels extending up to 85 km from the Earth's surface, with 50 levels concentrated between 0 and 18 km, which are the primary region of focus for this study.
The model simulations are nudged using horizontal wind and temperature fields from the ERA5 reanalysis (Telford et al., 2008; Dee et al., 2011; Hersbach et al., 2020) corresponding to the period of ATom observation. This nudging aims to reproduce the specific meteorological conditions at the time and location of the measurements, thereby reducing model biases often present in free-running model configurations (Kipling et al., 2013). Since the temporal resolution of the ERA5 reanalysis is 6 h, the relaxation time constant for the nudged simulations is set to 6 h. Nudging is applied vertically between model levels 12 and 80.
To cover the full ATom observation period, the model was run from July 2016 to June 2018, with a 6 month spin-up (initialisation) period from January to June 2016. For comparison with ATom observations, model outputs are retrieved as instantaneous values at a high temporal resolution of one hour. This high frequency is intended to minimise sampling bias from the model. However, due to the substantial disk space required for these high-resolution outputs (roughly 25 GB d−1), model data are saved only for the specific dates corresponding to ATom flights for subsequent offline analysis.
Since this study focuses on remote marine environments, ATom observations over the continental United States and Canada are excluded from the analysis. Most of the ATom observations used in this study have 1 min time resolution, including aerosol number size distribution (Brock et al., 2019, 2021), environmental conditions (T, RH, CS), particle composition and NH3 (Nault et al., 2021). DMS, O3, OH and SO2 used in this study have time resolution between 120–200 s (Wofsy et al., 2021). For consistency, the ATom data are sub-sampled to a fixed 5 min interval by selecting the nearest data point within each 5 min window. This interval is selected based on a combined assessment of the temporal resolutions of various parameters measured during the ATom campaign, the model's output resolution, and the objective of obtaining multiple data points within each model grid box (assuming a NASA DC-8 average speed of 833 km h−1, a 5 min flight segment covers roughly 70 km). Since the aerosol number size distribution is the primary dataset that underpins the entire analysis, all other parameters are included only when corresponding aerosol data are available. This ensures that the temporal and spatial coverage of the supporting data aligns with that of the aerosol measurements. Following data preparation, the model outputs are interpolated onto the four-dimensional grid (longitude, latitude, altitude, and time) of the observational data using the In-Situ Observations Simulator (Russo et al., 2025). It is important to note that this study makes frequent use of model-to-ATom ratios, as well as their logarithmic form (), to assess model performance. To ensure the robustness and interpretability of these ratios, we apply a thresholding criterion whereby only ATom measurements with positive values (> 0) are included in the analysis. This step avoids artificially large ratios or undefined logarithmic values that can arise from dividing by zero or by near-zero values – particularly those resulting from background subtraction in the ATom dataset, which may yield small positive or negative values. Prior to further analysis, only the spatial and temporal points with valid ATom measurements are retained, and the corresponding model values at those locations are also preserved to ensure consistency. Data points with invalid ATom values are excluded from both datasets. While this approach may introduce a slight positive bias in the statistical summaries (e.g. mean and median) of the observational dataset, it ensures that the ratio-based comparisons remain physically meaningful and are not dominated by noise near the detection limit. The variables most affected by this thresholding are those frequently measured near instrument detection limits – especially nitrate aerosol mass throughout the vertical column, as well as ammonium and seasalt aerosol mass above the marine boundary layer (MBL).
The aerosol number size distribution data are further processed to derive the total aerosol number concentration and the size-resolved number concentrations for the four modes: nucleation, Aitken, accumulation, and coarse, to be consistent with the processed ATom data. Similarly, the modelled aerosol chemical composition is processed to facilitate comparison with the AMS measurements of submicron aerosols. The AMS size range is defined by the performance of the aerodynamic lens used as the instrument inlet, and hence, operational transmission is defined by its vacuum aerodynamic diameter, which differs from the optical/geometric diameter used by aerosol sizers and models (Guo et al., 2021; Brock et al., 2021; Kim et al., 2025). Aerodynamic diameter is typically smaller than geometric diameter, depending on particle density. Moreover, the transmission efficiency of particles larger than approximately 500 nm in aerodynamic diameter decreases log-linearly with size and is not unity. As a result, the AMS measures only a fraction of aerosol mass with a geometric diameter below 1 µm. To enable direct comparison between model outputs and AMS observations, a real-time transmission correction based on the geometric diameter is applied following Guo et al. (2021).
For sulfate, organic, nitrate, and ammonium components, their total mass is calculated by summing the mass in the model's nucleation and Aitken modes with the mass fraction of aerosols from the accumulation and coarse modes after applying transmission correction. For seasalt, which is not present in the model's nucleation and Aitken modes, only the mass fraction of aerosols smaller than 1 µm, and corrected by AMS transmission, from the accumulation and coarse modes is included in this comparison. Therefore, the total submicron aerosol mass comparison presented in this study is based on the sum of sulfate, organic matter, nitrate, ammonium, and seasalt components only. It should be noted that black carbon and dust are not included in this chemical composition comparison, as aerosol mass spectrometer measurements do not typically quantify these refractory components. However, these species are included in the model simulations and contribute to the evaluated aerosol number size distributions.
Following the recommendation of Williamson et al. (2021), we exclude potential stratospheric air from the model-ATom comparison when either the model or observation indicated O3 > 250 ppbv and RH < 10 %. After this stratospheric filtering, the analysis is conducted across three altitude-based layers: (1) 0–2 km (MBL), (2) 2–8 km (lower to mid free troposphere), and (3) 8–12 km (upper troposphere, UT).
Data during aircraft takeoff and landing are not excluded in the analysis of this study, as in the original dataset provided by Brock et al. (2019). However, this inclusion is not expected to significantly affect the results. Most quantitative analyses in this study – such as tables and vertical profiles – use median values, which are robust to outliers. The only exception is the curtain plots, which display mean values due to the limited number of data points in each grid cell, making median estimates statistically unreliable. Importantly, since takeoff and landing events are geographically localised, their influence on the global-scale patterns depicted in the curtain plots is minimal. Therefore, the overall impact on our analysis is expected to be negligible.
Table 3Model-to-ATom median ratios for environmental conditions, precursor vapours, aerosol number size distributions, and chemical composition in the marine boundary layer (0–2 km altitude). Ratios are calculated using all available ATom data below 2 km for comparison with different UKESM1.1 configurations implementing various SA (sulfuric acid)-based nucleation schemes (see Table 2 for simulation details). The median values are calculated from the point-by-point model-to-ATom ratios (i.e. the ratio is computed at each location or time point, followed by taking the median), and therefore do not necessarily equal the ratio of the median model value to the median ATom value. Values greater than 1 indicate model overestimation, while values less than 1 indicate model underestimation relative to ATom observations. Environmental conditions include T, RH, and CS of dry aerosols. Precursor vapours include DMS, SO2, NH3, O3, and OH. Aerosol number concentrations are reported for nucleation (dry diameter < 10 nm), Aitken (10–100 nm), accumulation (100–1000 nm), and coarse (1000–10 000 nm) modes, along with total number concentration. Chemical composition includes sulfate, organic matter, ammonium, nitrate, and seasalt mass concentrations, with total mass representing their sum. Missing values indicate that ammonium and nitrate components are not included in simulations without the ammonium nitrate scheme (SA-H2O[default] and SA-NH3-noNit). Similar tables for the 2–8 and 8–12 km altitude ranges are provided in the Appendix (Tables A1 and A2, respectively).
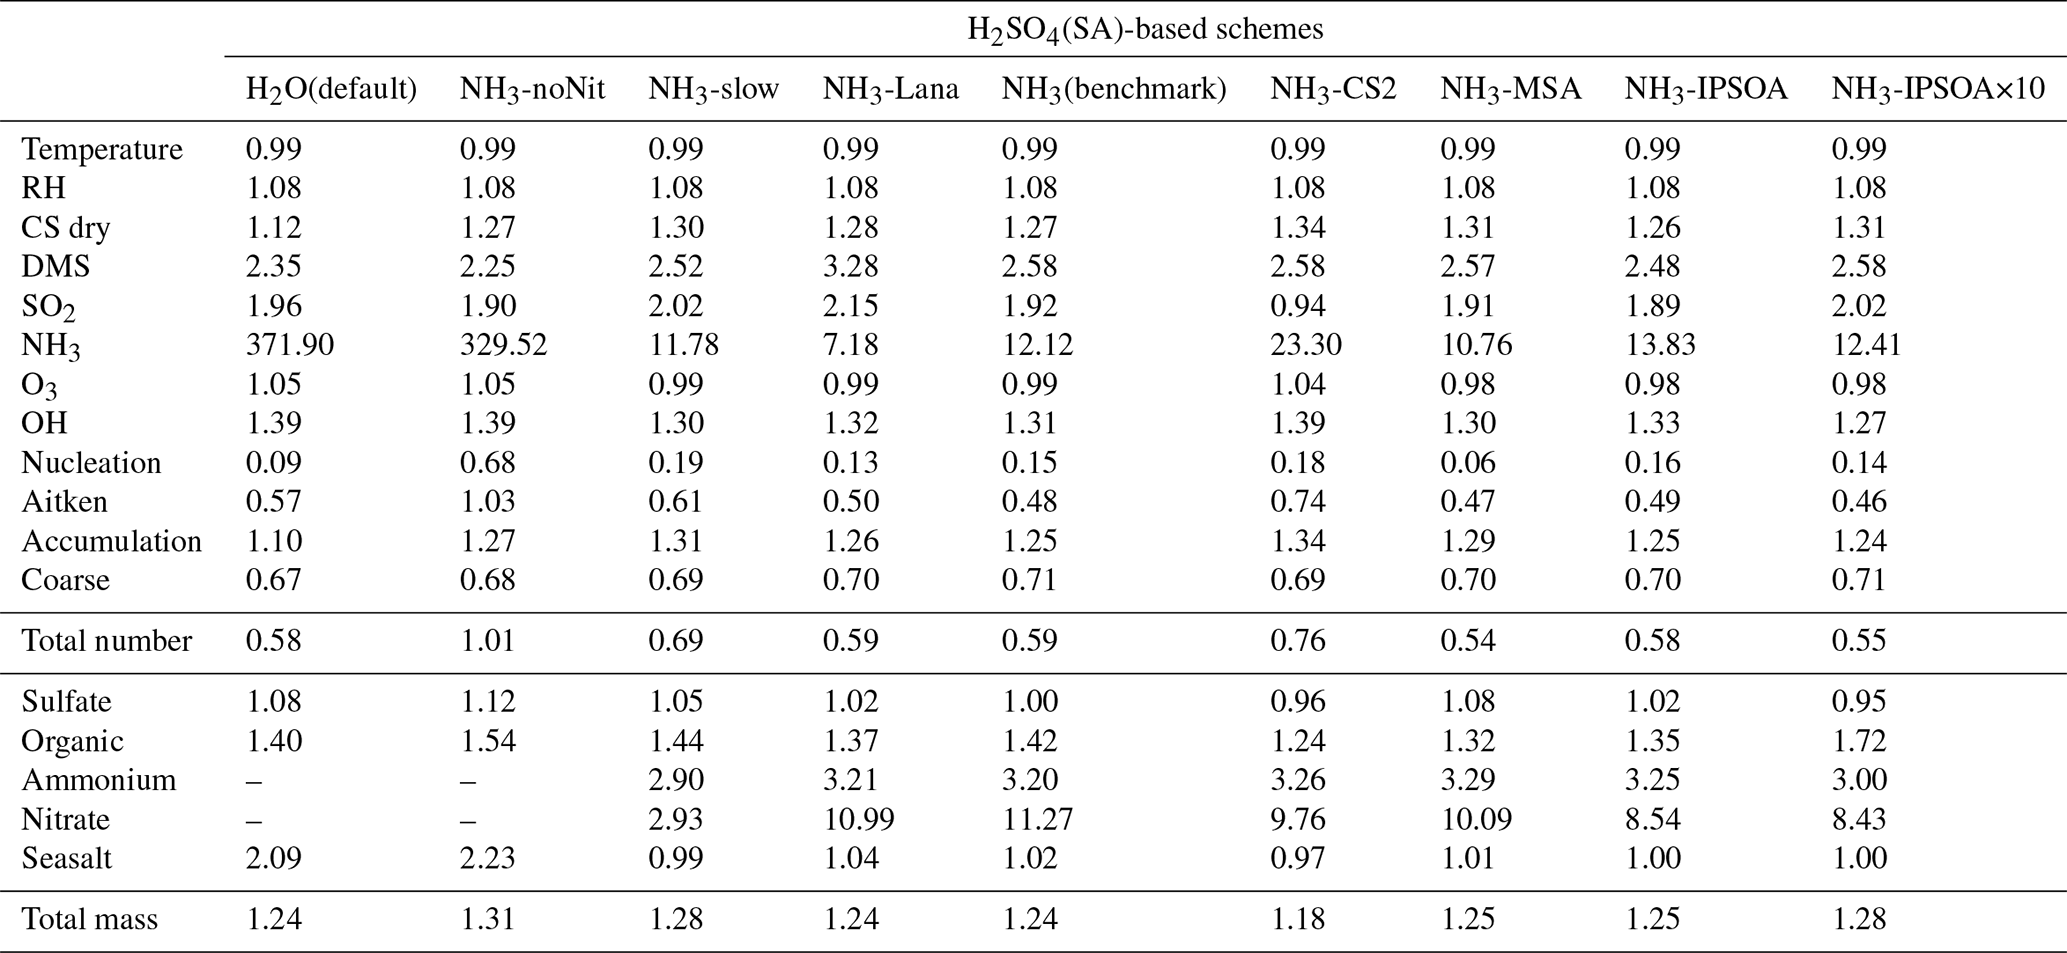
This study evaluates the performance of the model simulations for many aerosol relevant parameters, as listed in Table 3, against the ATom observations. The data presented in Table 3 are median ratios of modelled to observed (ATom) values. For simplicity, these model-to-ATom ratios are referred to as “ratios” throughout the manuscript, unless otherwise specified. The values presented in this summary table are calculated using all available data points below 2 km altitude, an altitude covering the marine boundary layer (MBL, for simplicity defined as < 2 km in this study) and, depending on location, parts of the lower free troposphere. In the Appendix, we further tabulate the model-to-ATom ratios for the 2–8 and 8–12 km altitude ranges (Tables A1 and A2, respectively).
Since a single median value is insufficient to capture the full distribution of the data, our results and discussions will also feature model-ATom comparisons presented as curtain plots (latitudinal and vertical distributions) of both the original measured/modelled fields and the ratios of modelled to observed values. The analysis is further complemented by vertical profile comparisons for specific parameters, probability density functions of aerosol distribution, and horizontal spatial maps at selected altitudes.
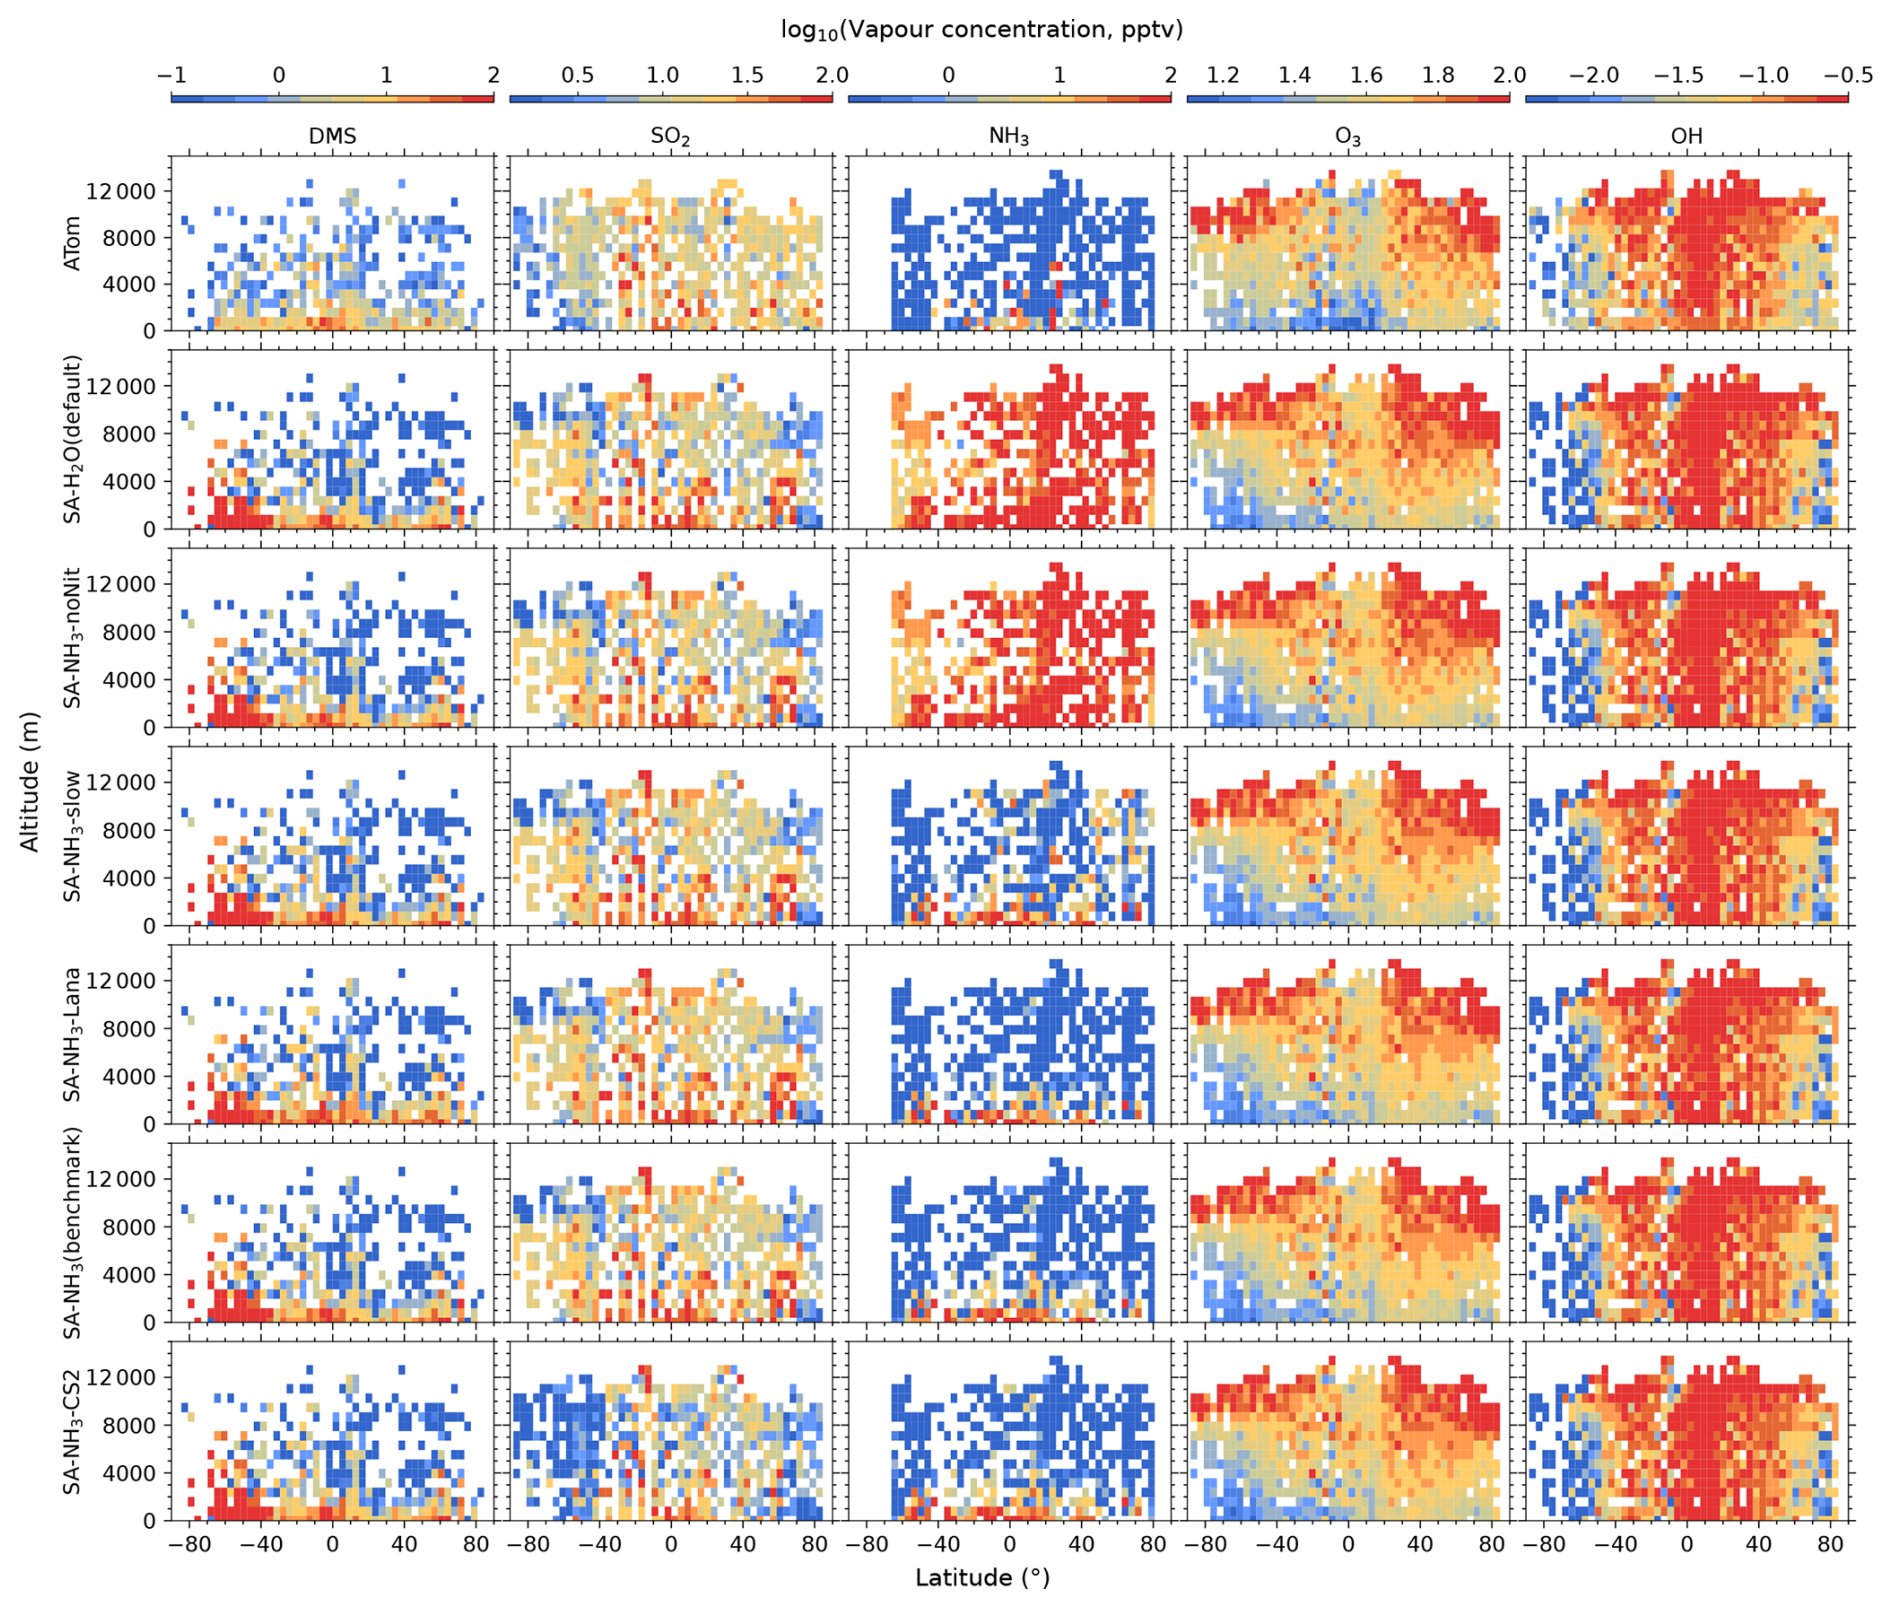
Figure 1Curtain plots of precursor vapour and oxidant concentrations along ATom flight tracks. Mean concentrations of DMS, SO2, NH3, O3, and OH are shown for ATom observations (first row) and selected model simulations (subsequent rows; see Table 2 for simulation details). Model outputs are interpolated to ATom flight coordinates and times. All data are displayed on a logarithmic scale to enhance visualisation of concentration variations spanning multiple orders of magnitude. Colour scales are consistent within each column to facilitate direct comparison between observations and model simulations.
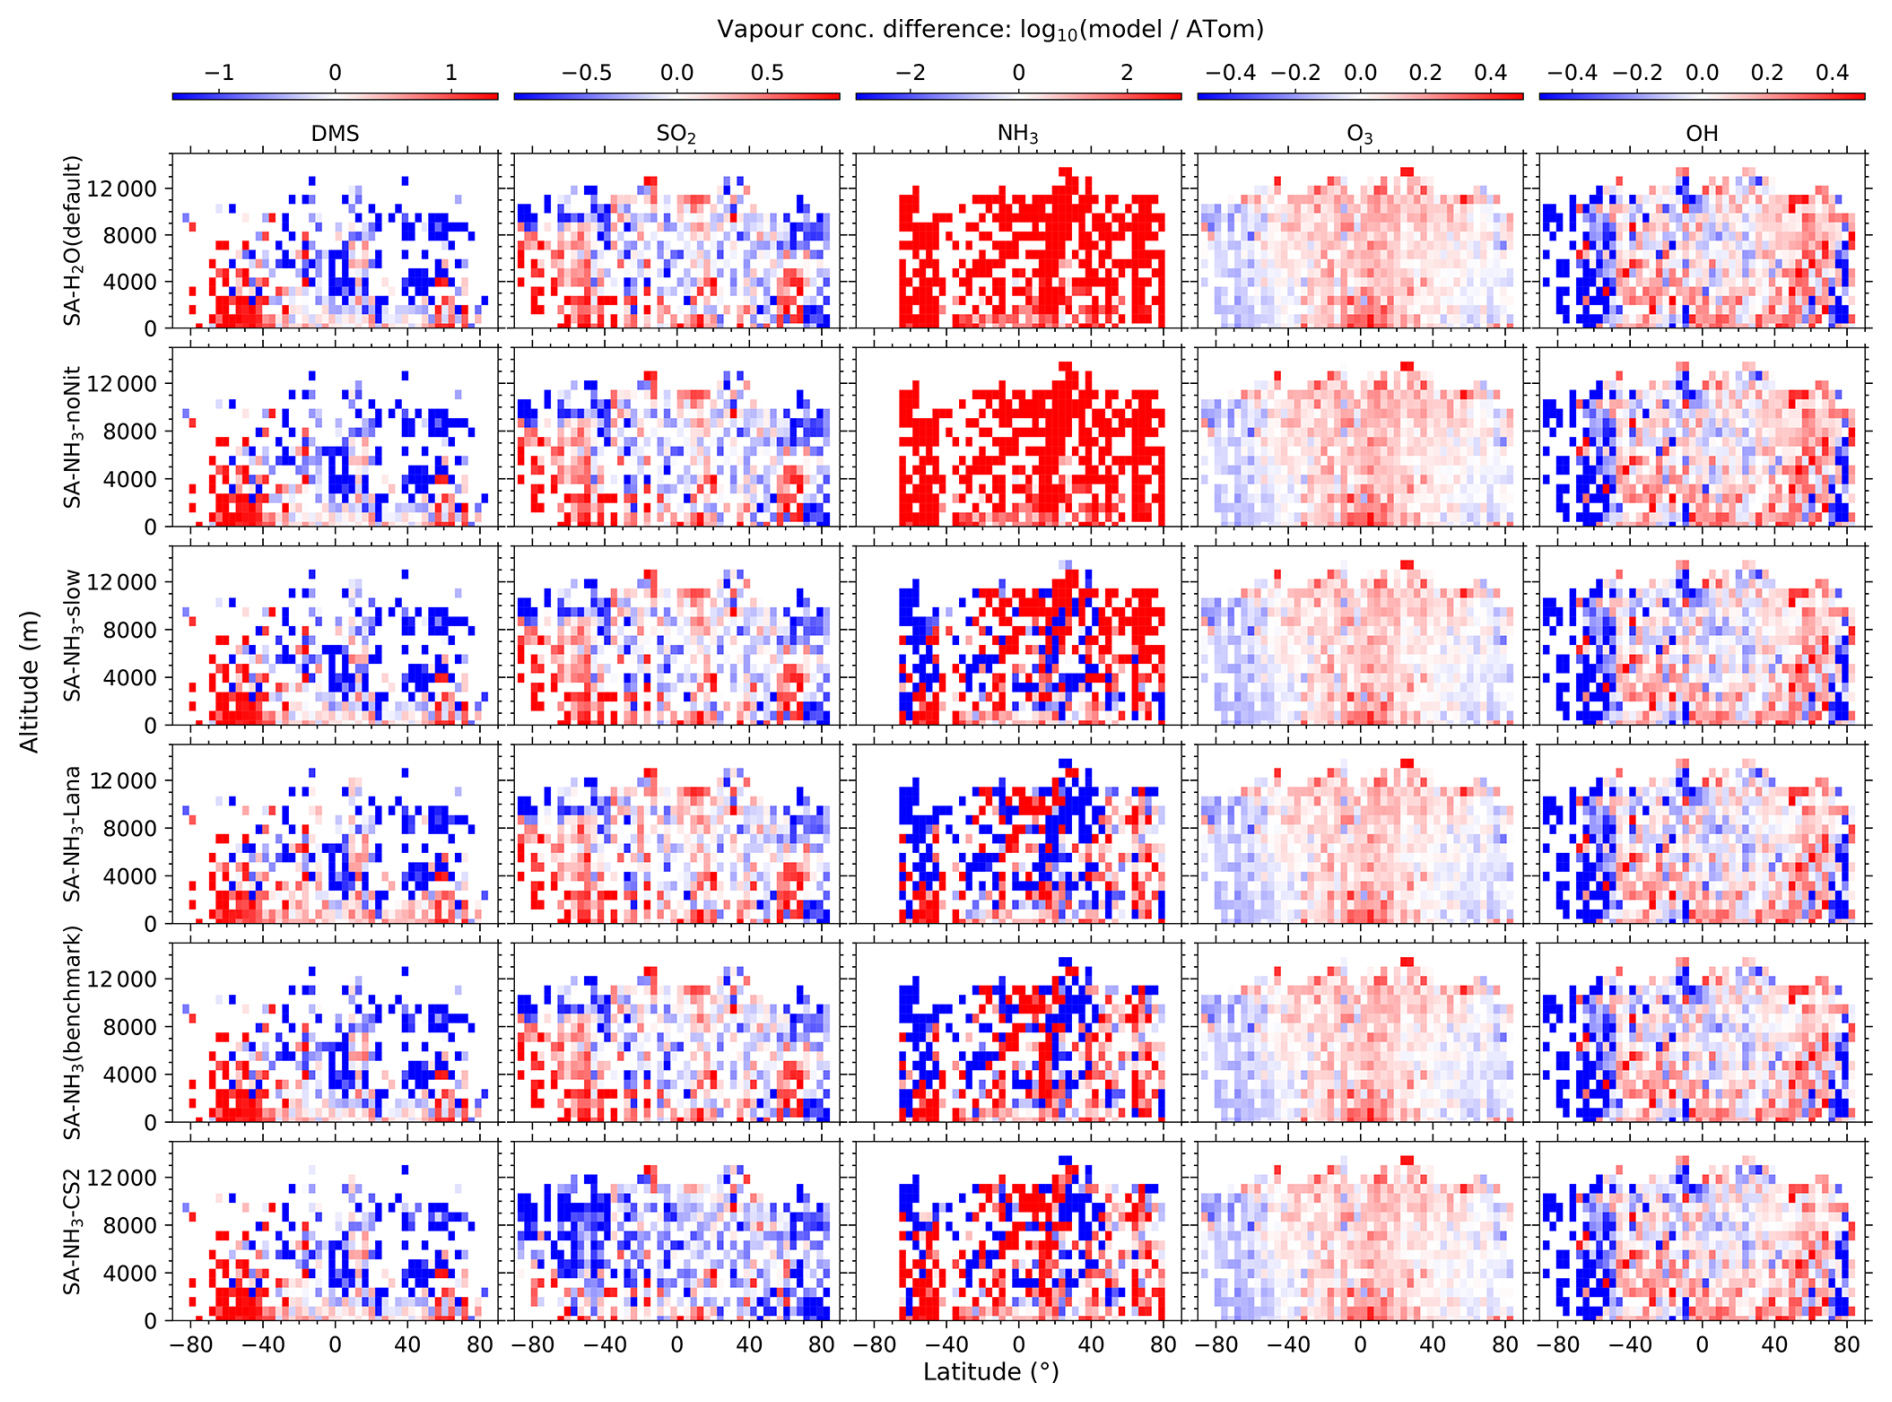
Figure 2Curtain plots of model-to-ATom ratios for precursor vapour and oxidant concentrations along ATom flight tracks. Mean ratios of modelled to observed concentrations for DMS, SO2, NH3, O3, and OH are shown for selected model simulations (see Table 2 for simulation details). Model outputs are interpolated to ATom flight coordinates and times. Data are displayed on a logarithmic scale with a diverging colour scheme where values greater than 1 indicate model overestimation and values less than 1 indicate model underestimation. Colour scales are consistent within each column to facilitate comparison between different model configurations.
3.1 Vapour concentrations
The observed and modelled mixing ratios of key precursor vapours and oxidants (DMS, SO2, NH3, O3, and OH) are presented in Fig. 1, while the corresponding ratios of modelled to observed values are shown in Fig. 2. All mixing ratio data in these figures are displayed on a logarithmic scale to better visualise the magnitude of differences between the model simulations and observations.
3.1.1 Oxidants
The measured O3 and OH mixing ratios both exhibit a distinct inter-hemispheric asymmetry, with consistently higher values observed in the Northern Hemisphere (NH) compared to the Southern Hemisphere (SH). This asymmetry is well-understood to be driven by higher anthropogenic emissions of ozone precursors, such as nitrogen oxides (NOx) and hydrocarbons, in the NH (Wang and Jacob, 1998). Regarding latitudinal distribution, observed O3 mixing ratios are generally lowest in the tropics and increase towards higher latitudes, a pattern consistent with recent compilations of oceanic and polar O3 data (Kanaya et al., 2025). In contrast, observed OH concentrations show approximately the opposite latitudinal trend to O3, with the highest values found in the tropics. This inverse latitudinal distribution is primarily attributed to the stronger solar radiation in the tropics which leads to more rapid photochemical destruction of O3, which in turn drives higher OH production rates.
Comparing the benchmark SA-NH3 simulation with the ATom measurements reveals that O3 is generally overestimated by the model in the tropics throughout the vertical profile, transitioning to a slight underestimation in the polar regions. Interestingly, despite the asymmetry in the absolute observed concentrations, the pattern of modelled O3 discrepancies relative to observations appears broadly symmetrical between the hemispheres. Quantitatively, the median overestimation of O3 in the tropics (25° S to 25° N, full altitude range unless otherwise specified) is 29 % (i.e. model-to-ATom ratio of 1.29), while the median underestimation in the polar regions (60–90° N/S) is 15 % (i.e. model-to-ATom ratio of 0.85). However, the model discrepancies for OH differ significantly from those for O3 and exhibit a strong inter-hemispheric asymmetry. North of approximately 50° S latitude, modelled OH concentrations are generally overestimated by around 8 %, whereas south of 50° S, modelled OH is substantially underestimated, by 54 %.
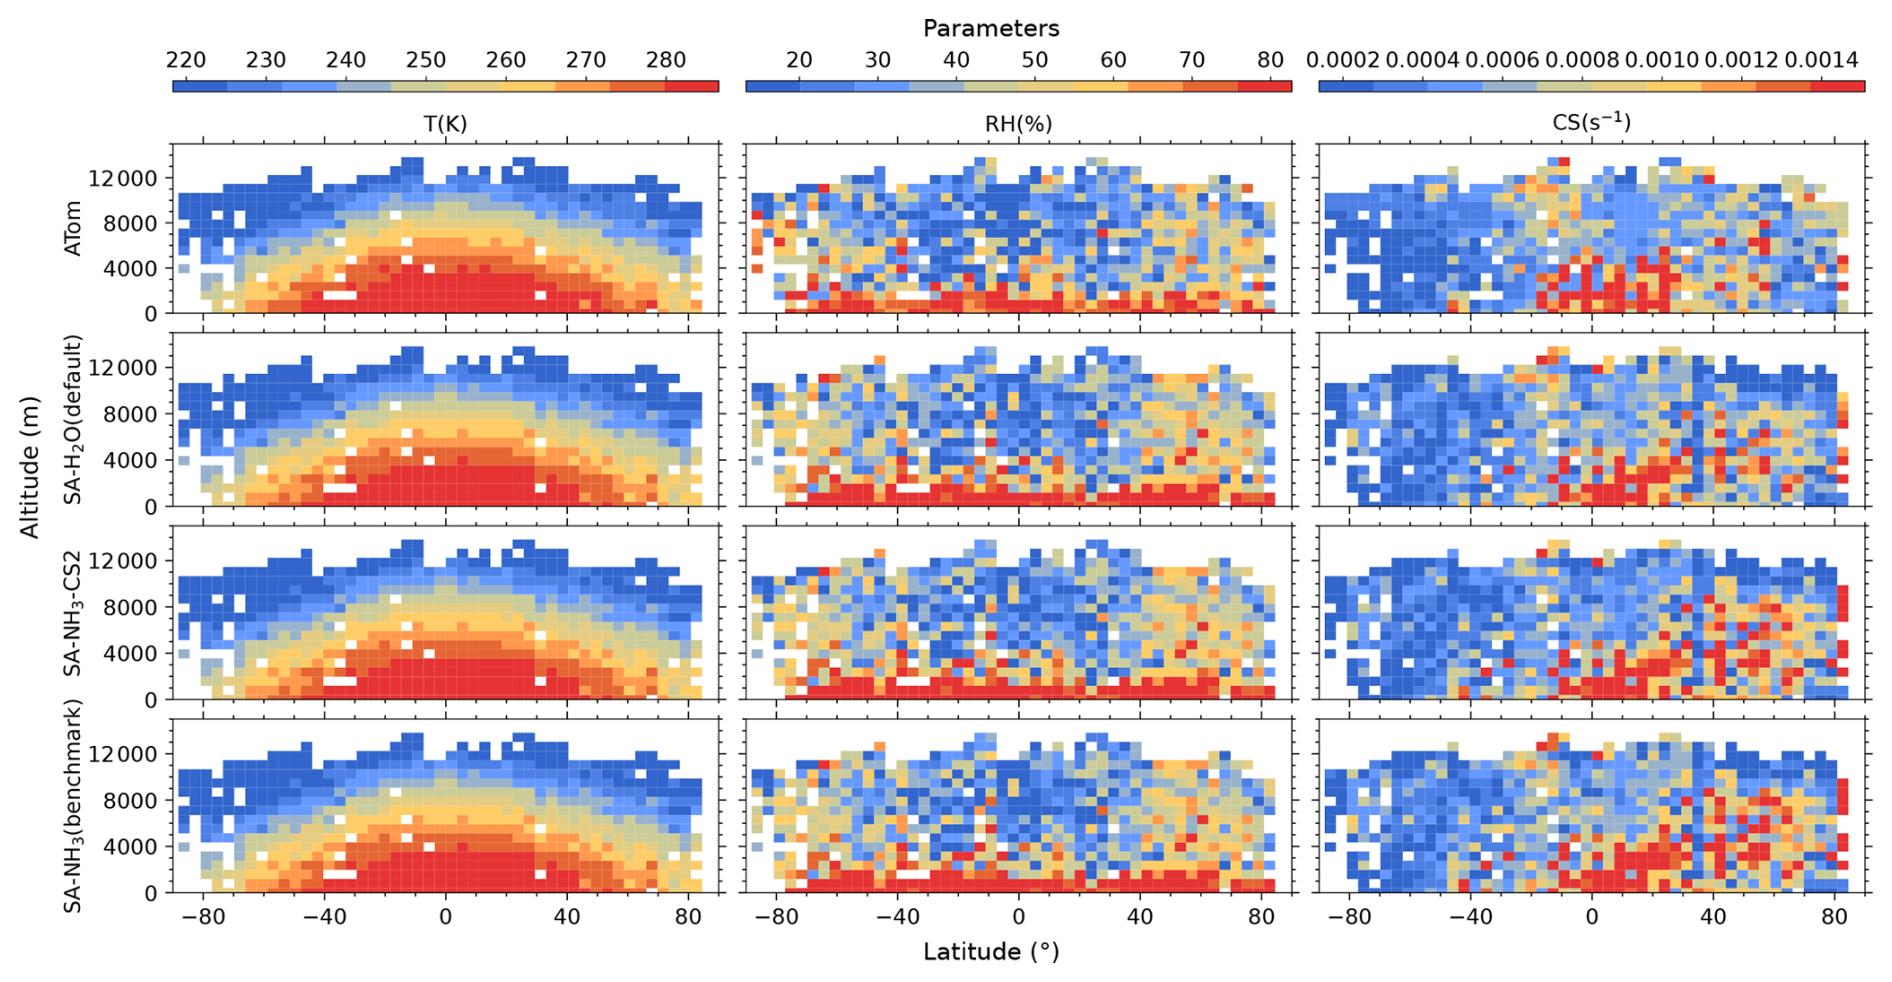
Figure 3Curtain plots of environmental conditions along ATom flight tracks. Mean T, RH, and condensation sink (CS) of dry particles are shown for ATom observations (first row) and selected model simulations (subsequent rows; see Table 2 for simulation details). Model outputs are interpolated to ATom flight coordinates and times. All data are displayed on linear scale. Colour scales are consistent within each column to facilitate direct comparison between observations and model simulations.
The reason for this systematic underestimation of OH concentrations south of 50° S by the model is currently unclear and warrants further investigation in future studies. However, some potential contributing factors can be explored using the data presented. The primary photochemical production pathway for OH involves the photolysis of O3 followed by the reaction of the resulting O(1D) atom with water vapour (H2O). Our evaluation of relative humidity (Fig. 3) indicates a general model overestimation south of 50° S. Given that modelled O3 is only slightly underestimated in this region (by 19 %), inaccuracies in the modelled concentrations of the primary precursors (O3 and H2O) seem unlikely to be the main drivers of the substantial OH underestimation. However, uncertainties in the modelled photolysis rate of O3 (J(O1D)) represent one factor to be examined, as this directly impacts the OH production rate. Additionally, the primary loss processes for OH involve reactions with methane (CH4) and carbon monoxide (CO); therefore, the accuracy of their simulated concentrations is also important. Other factors potentially contributing to the discrepancy include inaccuracies in modelled NOx concentrations (which influence OH recycling) or other unexpected OH loss processes in the model.
3.1.2 Sulfur species
As key precursors for atmospheric H2SO4, DMS and SO2 are also evaluated against ATom observations in this study (Fig. 1). The measured DMS mixing ratios during ATom are generally highest in the MBL, with concentrations decreasing with increasing altitude. Within the MBL, measured DMS mixing ratios are relatively higher in the tropics compared to mid-latitude and polar regions, and the distribution appears essentially symmetrical between the hemispheres. Median DMS mixing ratios measured by ATom were around 5.6 pptv below 2 km altitude and 0.6 pptv above 2 km. In contrast to DMS, observed SO2 mixing ratios in ATom4 exhibit a more homogeneous distribution throughout the marine atmosphere, with an overall median value of 11.9 pptv.
Comparing modelled DMS with observations reveals that simulations utilising the interactive DMS emission scheme consistently overestimate observed mixing ratios by roughly a factor of 19.32 south of 40° S across all altitudes (SA-NH3 simulation). The SA-NH3-Lana simulation, which employs a climatological DMS emission scheme, shows marginally better agreement in this high southern latitude region, although it still overestimates observed DMS by a factor of 11.24. Conversely, considering the global MBL, the median modelled overestimation factor for DMS is lower in the interactive scheme simulation (SA-NH3, factor of 2.58) compared to the climatology simulation (SA-NH3-Lana, factor of 3.28) in Table 3. Therefore, judged by median performance, the interactive DMS emission scheme appears to perform better within the MBL globally but significantly worsens the model performance at high southern latitudes compared to the climatology. Similarly, modelled SO2 mixing ratios south of 40° S (full altitude range) are also overestimated relative to ATom4 data, by 33 % in the SA-NH3 simulation and by a lesser amount, around 20 %, in the SA-NH3-Lana simulation.
While switching the DMS emission scheme primarily impacts modelled DMS and SO2 concentrations in a latitude-dependent manner (particularly at high southern latitudes), changing the core tropospheric chemistry scheme from Strat-Trop to CS2 exerts a global influence on simulated SO2 mixing ratios. Simulated SO2 mixing ratios are consistently lower in the SA-NH3-CS2 simulation compared to simulations employing the Strat-Trop scheme (Fig. 2 and Tables 3, A1, A2). Consequently, the SO2 simulation in SA-NH3-CS2 shows reasonable agreement with observations (slight overestimation) between approximately 40° S and 60° N, but tends towards underestimation outside this latitude range. This suggests that the modified DMS oxidation chemistry within the CS2 scheme significantly alters the simulated SO2 budget compared to Strat-Trop (Table 1). However, it must be pointed out that this apparent improvement in the SO2 simulation with CS2 is not necessarily indicative of a better overall representation of sulfur chemistry, given that DMS remains significantly overestimated by the model in most regions. Therefore, the seemingly better SO2 agreement might arise from compensating errors within the model's sulfur cycle representation, an issue warranting further investigation.
3.1.3 Ammonia
As previously reported by Nault et al. (2021), atmospheric NH3 mixing ratios estimated during ATom are generally low, often below 1 pptv (Fig. 1). The highest NH3 mixing ratios were observed in the tropical MBL (25° S to 25° N; altitude < 2 km) with a median value of 6.6 pptv. Outside this tropical MBL region, observed NH3 mixing ratios frequently dropped below 1 pptv, at which NH3 would typically have a negligible impact on aerosol nucleation processes involving H2SO4.
In contrast to observations, modelled NH3 mixing ratios in the default SA-H2O simulation are globally overestimated by several orders of magnitude compared to observations (Fig. 2). For example, the median NH3 mixing ratio in the tropical MBL is simulated to be 215.4 pptv in this configuration, 32.64 times higher than the observed median. In the SA-NH3-noNit simulation (which includes H2SO4–NH3 aerosol nucleation but not the ammonium nitrate scheme), the median tropical MBL NH3 mixing ratio remains high at 212.0 pptv. However, after implementing the ammonium nitrate scheme developed by Jones et al. (2021) (which enables the uptake of NH3 by acidic aerosols), the modelled median NH3 mixing ratios in the tropical MBL are significantly reduced, to 28.6 and 25.1 pptv in the SA-NH3-slow and SA-NH3 benchmark simulations, respectively. These values are considerably closer to the observed median. This result strongly suggests that the uptake of NH3 by acidic aerosols to form ammonium is a significant sink for gaseous NH3 in the remote marine atmosphere, and that simulated NH3 concentrations are highly sensitive to the representation of this process.
It should be noted, however, that even in the SA-NH3 benchmark simulation, global atmospheric NH3 is still overestimated by a factor of 12.12 when compared to ATom data in the MBL (Table 3). Using the slow nitrate uptake coefficient, the SA-NH3-slow scheme does not improve the ammonia simulation, with the model-to-ATom NH3 ratio remaining at 11.78. A similar trend of atmospheric NH3 overestimation is consistently observed in other chemical transport models as well (Nault et al., 2021). This persistent, large overestimation of gaseous NH3 inevitably drives an even larger overestimation in the formation rate of new aerosol particles via the H2SO4–NH3 nucleation pathway, as will be discussed later. Therefore, further constraining modelled NH3 mixing ratios, likely through improved emission inventories or more detailed representation of its uptake and loss processes, remains a critical area for model development to improve aerosol simulations of NH3 in the remote marine atmosphere (Ge et al., 2021).
3.2 Environmental conditions
Besides the concentrations of precursor vapours and oxidants, environmental conditions such as T and RH are also crucial for airborne aerosol formation processes. Generally, lower temperatures and higher relative humidities are more favourable for new particle formation, thus promoting aerosol nucleation processes (Kirkby et al., 2011; Dunne et al., 2016).
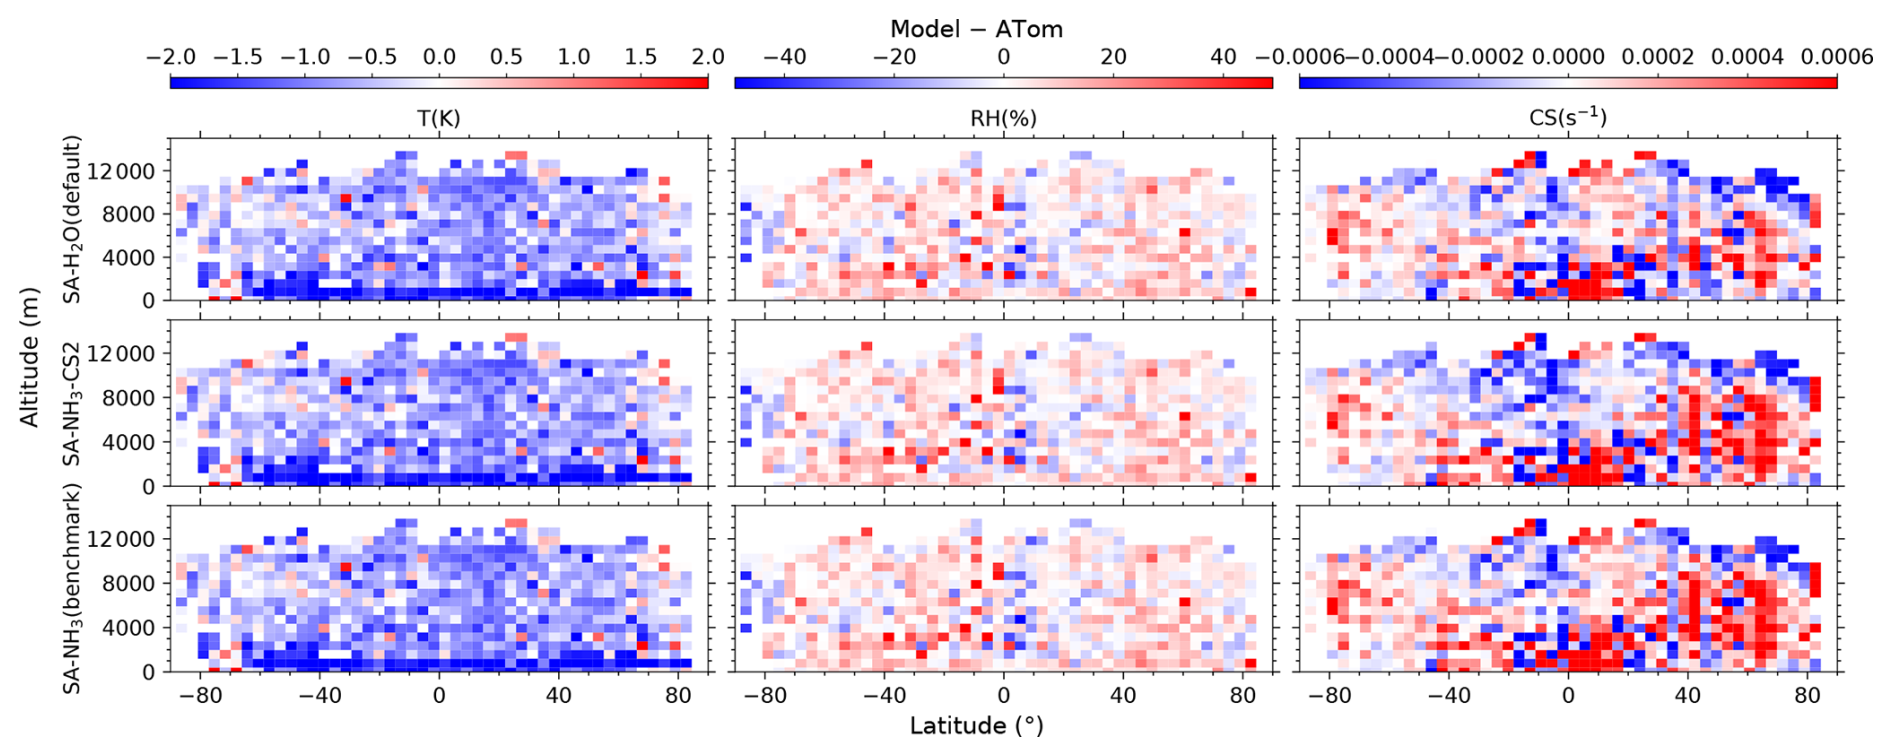
Figure 4Curtain plots of model-to-ATom differences (model – ATom) for environmental conditions along ATom flight tracks. Mean differences of modelled to observed values for T, RH, and CS are shown for selected model simulations (see Table 2 for simulation details). Model outputs are interpolated to ATom flight coordinates and times. Data are displayed on linear scale with a diverging colour scheme. Colour scales are consistent within each column to facilitate comparison between different model configurations.
Since the model simulations are nudged towards reanalysis meteorological fields, the simulated temperatures are generally in good agreement with ATom observations. For example, the median model underestimation of temperature in the SA-NH3 simulation is only 0.8 K globally. This relatively small temperature bias is not expected to significantly impact calculated aerosol nucleation rates, as their temperature dependence is generally modest for temperature changes of this magnitude. Both simulated temperature and RH show negligible differences between the various model configurations tested in this study, as the implemented changes in aerosol formation schemes do not significantly affect these meteorological variables on the timescales considered. However, while temperature is generally well represented, modelled RH is consistently overestimated by UKESM1.1 across most of the sampled atmosphere (Fig. 4). For example, the median RH overestimation is 1.08 (model-to-ATom ratio) in the MBL, increasing to 1.15 in the UT (Table A2). The overestimation of RH in the UT will inevitably lead to an overestimation of aerosol nucleation rates from H2SO4-NH3 based pathways, given the RH-dependence of these processes (Dunne et al., 2016).
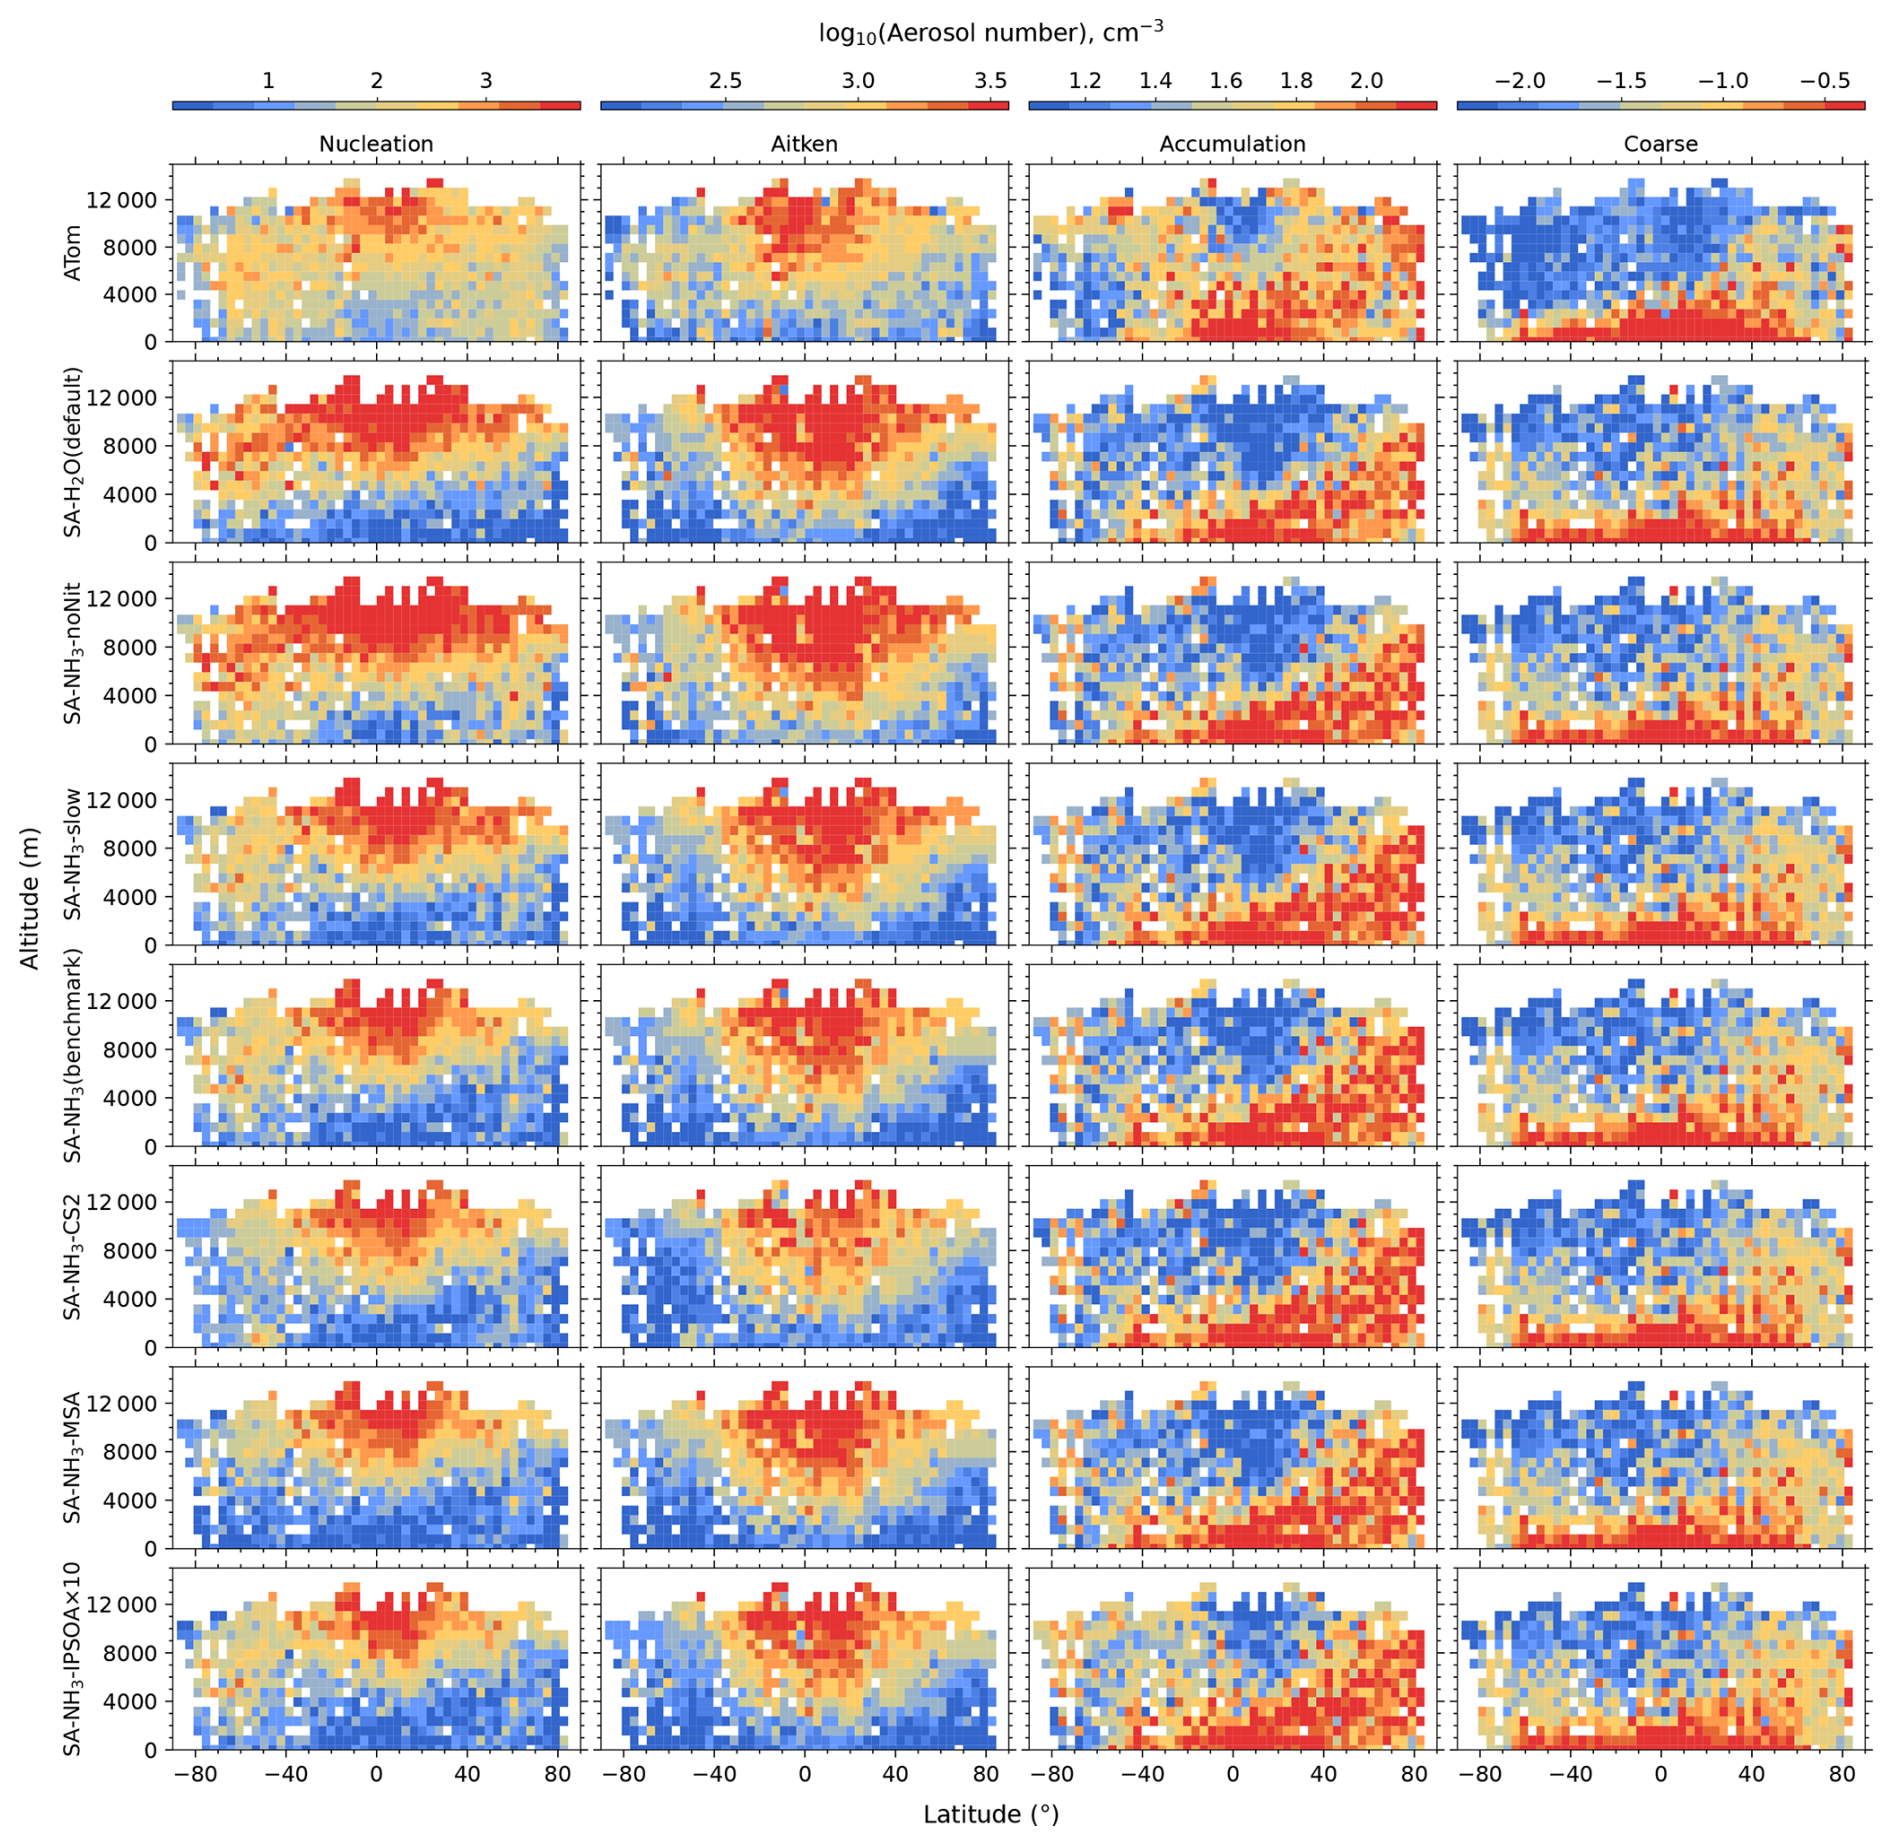
Figure 5Curtain plots of aerosol number size distribution along ATom flight tracks. Mean nucleation mode (< 10 nm), Aitken mode (10–100 nm), accumulation mode (100–1000 nm), and coarse mode (1000–10 000 nm) aerosol number concentrations are shown for ATom observations (first row) and selected model simulations (subsequent rows; see Table 2 for simulation details). Model outputs are interpolated to ATom flight coordinates and times. All data are displayed on a logarithmic axis to enhance visualisation of the variations in parameters. Colour scales are consistent within each column to facilitate direct comparison between observations and model simulations.
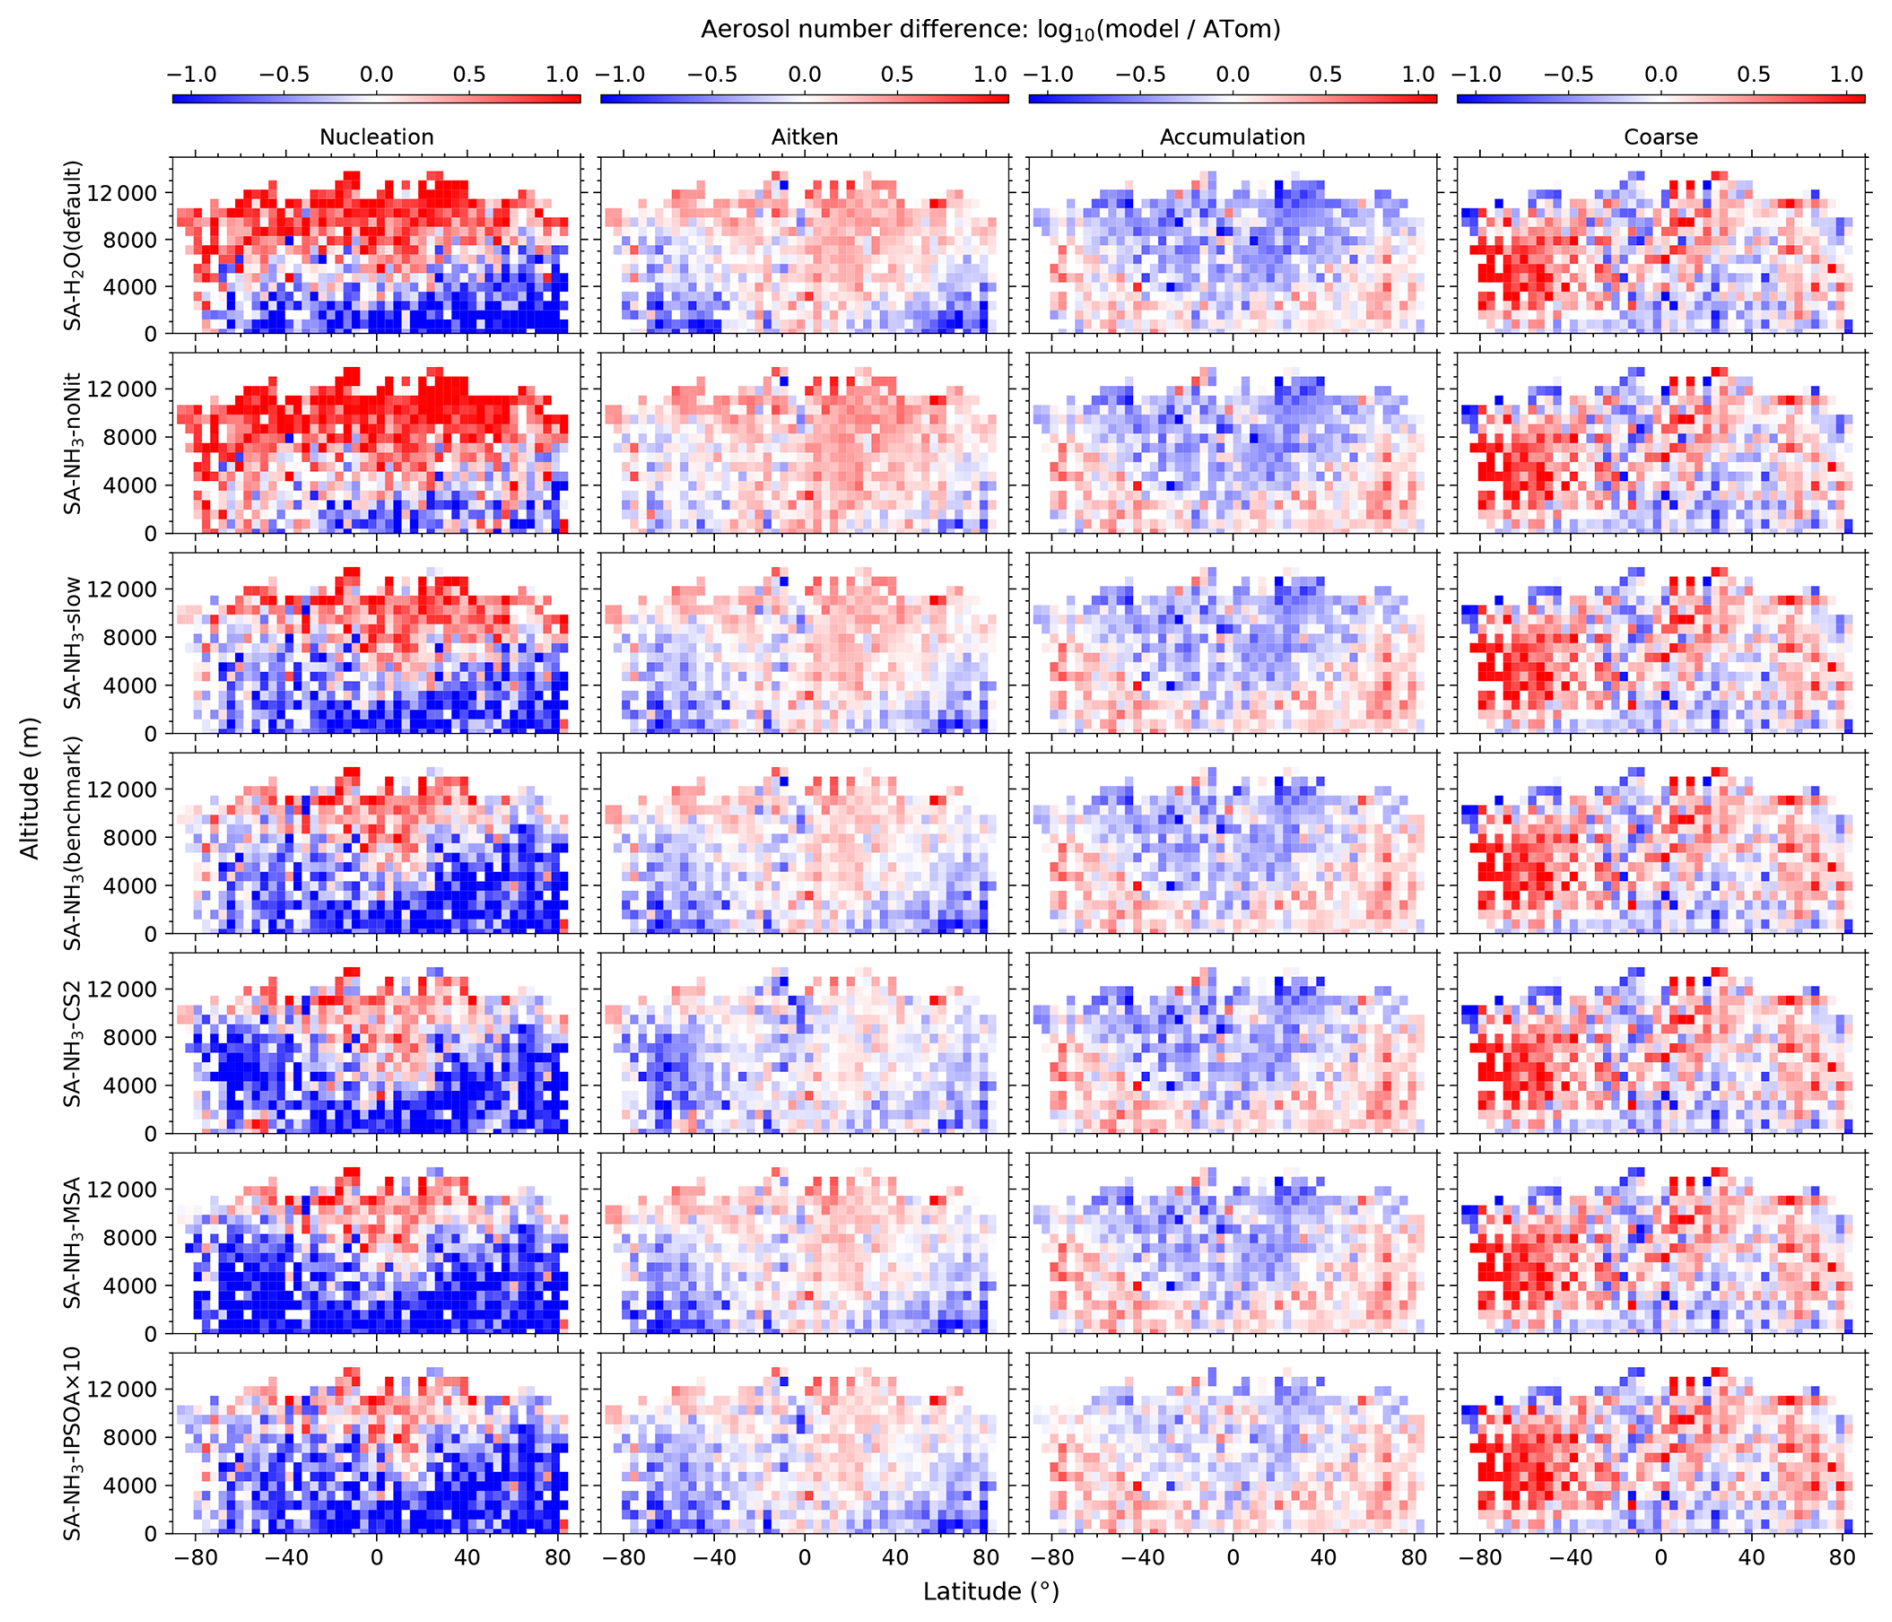
Figure 6Curtain plots of model-to-ATom ratios for aerosol number size distribution along ATom flight tracks. Mean ratios of modelled to observed values for nucleation mode (< 10 nm), Aitken mode (10–100 nm), accumulation mode (100–1000 nm), and coarse mode (1000–10 000 nm) aerosol number concentrations are shown for selected model simulations (see Table 2 for simulation details). Model outputs are interpolated to ATom flight coordinates and times. Data are displayed on a logarithmic scale with a diverging colour scheme where values greater than 1 indicate model overestimation and values less than 1 indicate model underestimation. Colour scales are consistent within each column to facilitate comparison between different model configurations.
3.3 Aerosol number size distribution
The observed aerosol number concentrations within each aerosol mode from the ATom measurements, alongside those from selected model simulations, are presented in Fig. 5. Ratios of modelled to observed values are similarly shown in Fig. 6. While Ranjithkumar et al. (2021) reported a comparison of modelled total aerosol number concentration vertical profiles with ATom observations, this study focuses on a mode-resolved comparison across all four modes (nucleation, Aitken, accumulation, and coarse), as this modal separation is necessary to understand their distinct sources, transformation pathways, and climate impacts.
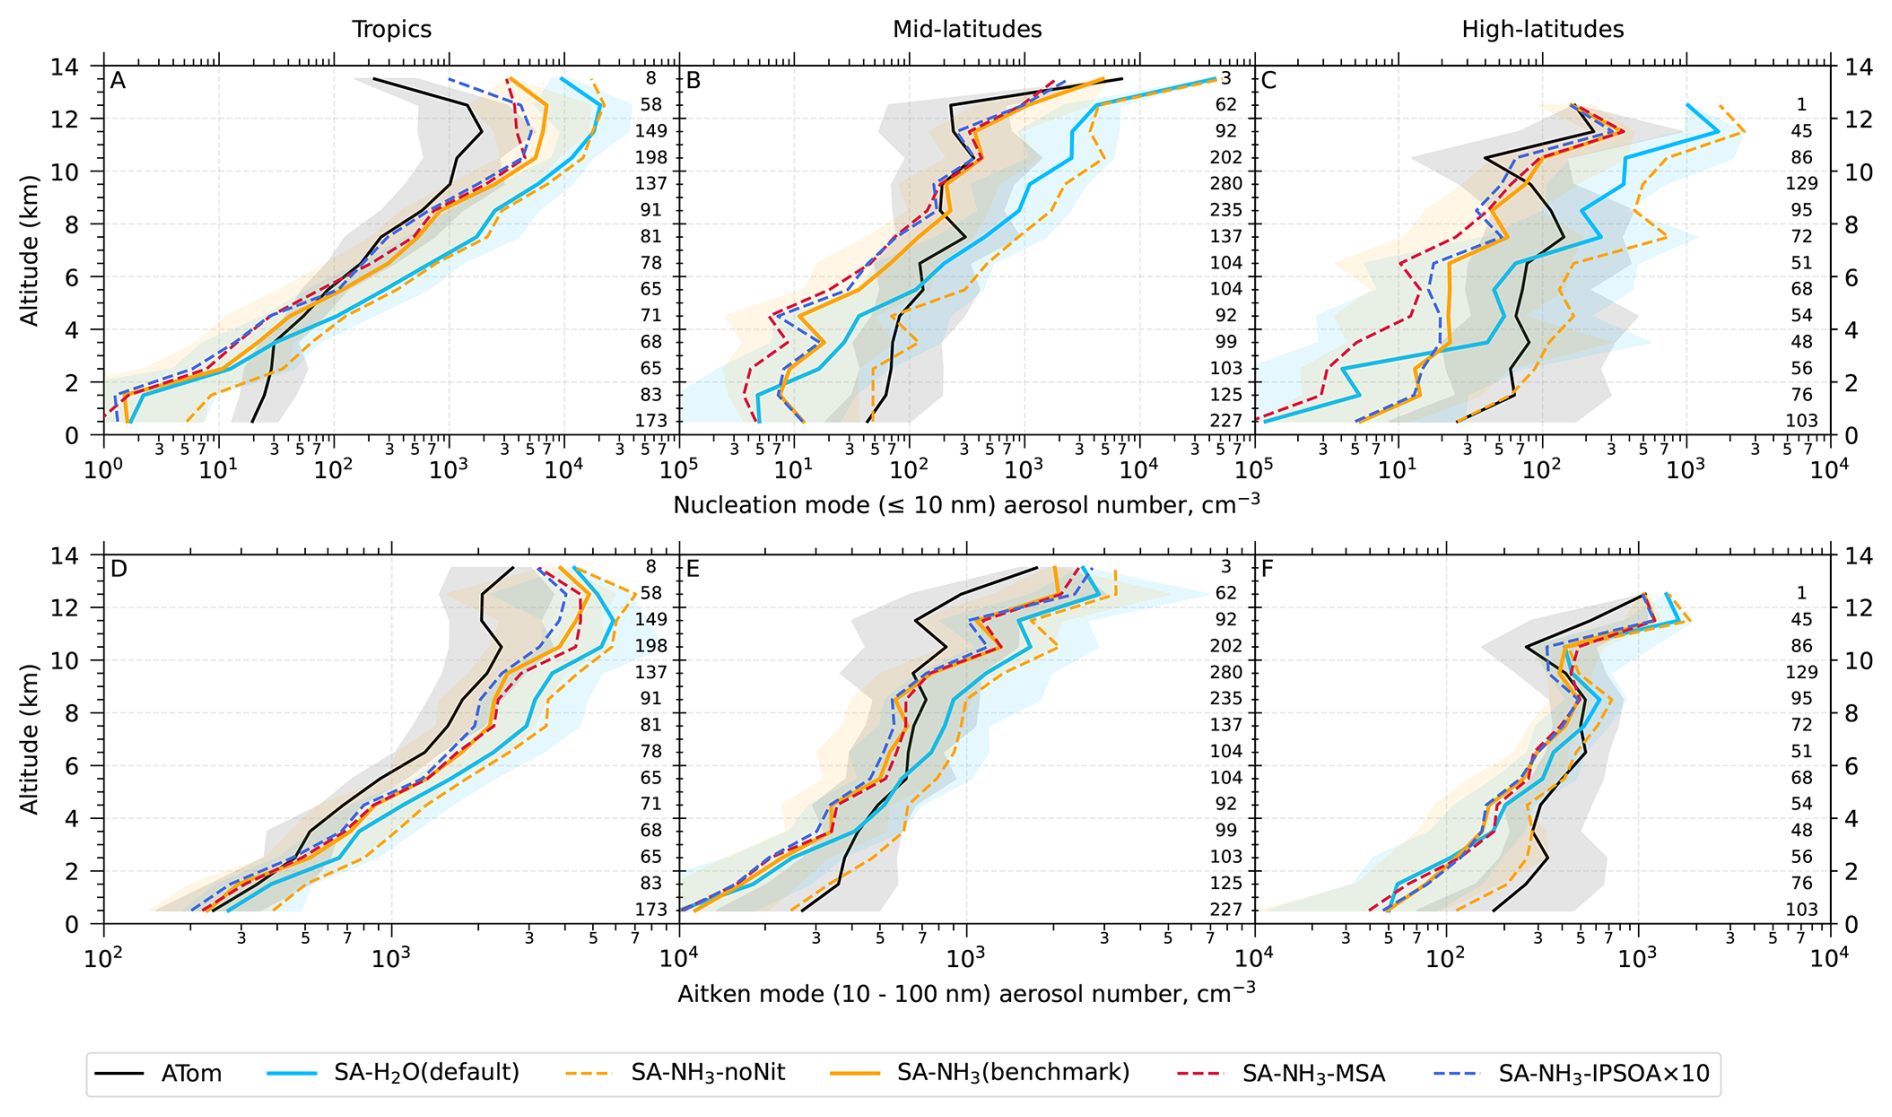
Figure 7Vertical profiles of nucleation mode (< 10 nm) and Aitken mode (10–100 nm) aerosol number concentrations (cm−3). ATom observations (black lines) and selected model simulations (coloured lines; see Table 2 for simulation details) are presented. Median values are shown for nucleation mode aerosols in the tropics (A, 25° S to 25° N), mid-latitudes (B, 25–60° N/S), and high-latitudes (C, 60–90° N/S), and for Aitken mode aerosols in the tropics (D), mid-latitudes (E), and high-latitudes (F). Shaded areas for solid lines represent the interquartile range (25th to 75th percentiles) for both ATom observations and model simulations, indicating the variability in aerosol concentrations. Numbers on the right edge of each panel show the sample size used to calculate median values for each altitude bin at 5 min temporal resolution.
3.3.1 Nucleation and Aitken mode aerosols
The ATom measurements reveal a ubiquitous presence of nucleation mode aerosols throughout the marine atmosphere (Brock et al., 2019; Williamson et al., 2019). The concentrations of nucleation mode aerosols are largely symmetrical between the hemispheres. Another notable feature of the observed nucleation mode aerosol distribution is that its vertical variation is considerably larger in the tropics than in mid-latitudes and polar regions (Fig. 7). For example, nucleation mode aerosol concentrations measured at approximately 12 km altitude in the tropics are around two orders of magnitude higher than those at the marine surface level, whereas this vertical gradient in mid-latitudes and polar regions is typically less than one order of magnitude. This phenomenon has previously been associated with strong NPF events occurring in the tropical UT, as proposed by Clarke et al. (2013) and Williamson et al. (2019). Similar to the nucleation mode, Aitken mode aerosols also exhibit a comparable vertical trend in the tropics, with enhanced concentrations observed in the UT relative to the lower troposphere.
Comparing the default simulation (SA-H2O) with ATom observations (Figs. 6 and 7), the bias in nucleation mode aerosol concentrations shows a clear dipole pattern: a significant overestimation globally above approximately 4 km, and a strong underestimation below this altitude. For example, the default simulation overestimates nucleation mode aerosols by roughly one order of magnitude at 12 km altitude (Fig. 7), while it underestimates them with a ratio of 0.09 in the MBL (Table 3). The overestimation of the nucleation mode in the UT by the default simulation is attributed to several factors. The primary factor is that the theoretical binary H2SO4–H2O nucleation mechanism from Vehkamäki et al. (2002) itself overestimates the neutral H2SO4–H2O nucleation rate by up to three orders of magnitude in the UT, as highlighted by Yu et al. (2020). Other secondary factors include the model's underestimation of temperature, overestimation of SO2 and RH (discussed in previous sections), all of which contribute to an increased nucleation rate. Taking the tropical UT (8–12 km, 25° S to 25° N) as an example, the model-to-ATom ratios of SO2 and RH are 1.46 and 1.12, respectively, in the default simulation. The only evaluated factor that might partly counter this tendency to overestimation is the condensation sink, which the model overestimates by 11 % in the tropical UT; however, this effect is outweighed by the other contributing factors.
Implementing the H2SO4–NH3 nucleation scheme without the ammonium nitrate scheme (SA-NH3-noNit simulation) does not improve model skill in simulating aerosol number size distribution in the tropical UT; the overestimation of nucleation mode aerosols remains high, similar to that in the default SA-H2O simulation (Fig. 6). On the other hand, the SA-NH3-noNit simulation shows nucleation mode aerosol concentrations more than 7 times higher in the MBL compared to the default simulation, due to the aerosol nucleation enhancement from H2SO4–NH3 nucleation mechanism (Table 3). However, despite this enhancement, the simulated nucleation mode aerosol concentrations are still lower than the ATom observations in the MBL. Furthermore, it must be noted that this apparent improvement in predicting MBL nucleation mode aerosols in the SA-NH3-noNit simulation is concurrent with a enormous overprediction of NH3 by the model, which is higher than ATom observations by a factor of 329.52 (Table 3). After implementing the ammonium nitrate scheme, with either a slow (SA-NH3-slow) or fast (SA-NH3 benchmark) nitric acid uptake coefficient, the overestimation of NH3 is reduced to factors of 11.78 and 12.12, respectively. However, the underestimation of nucleation mode aerosols worsens, with ratios of 0.19 and 0.15 for these simulations, respectively. This represents a marginal enhancement compared with the default H2SO4–H2O nucleation mechanism over pristine marine environments.
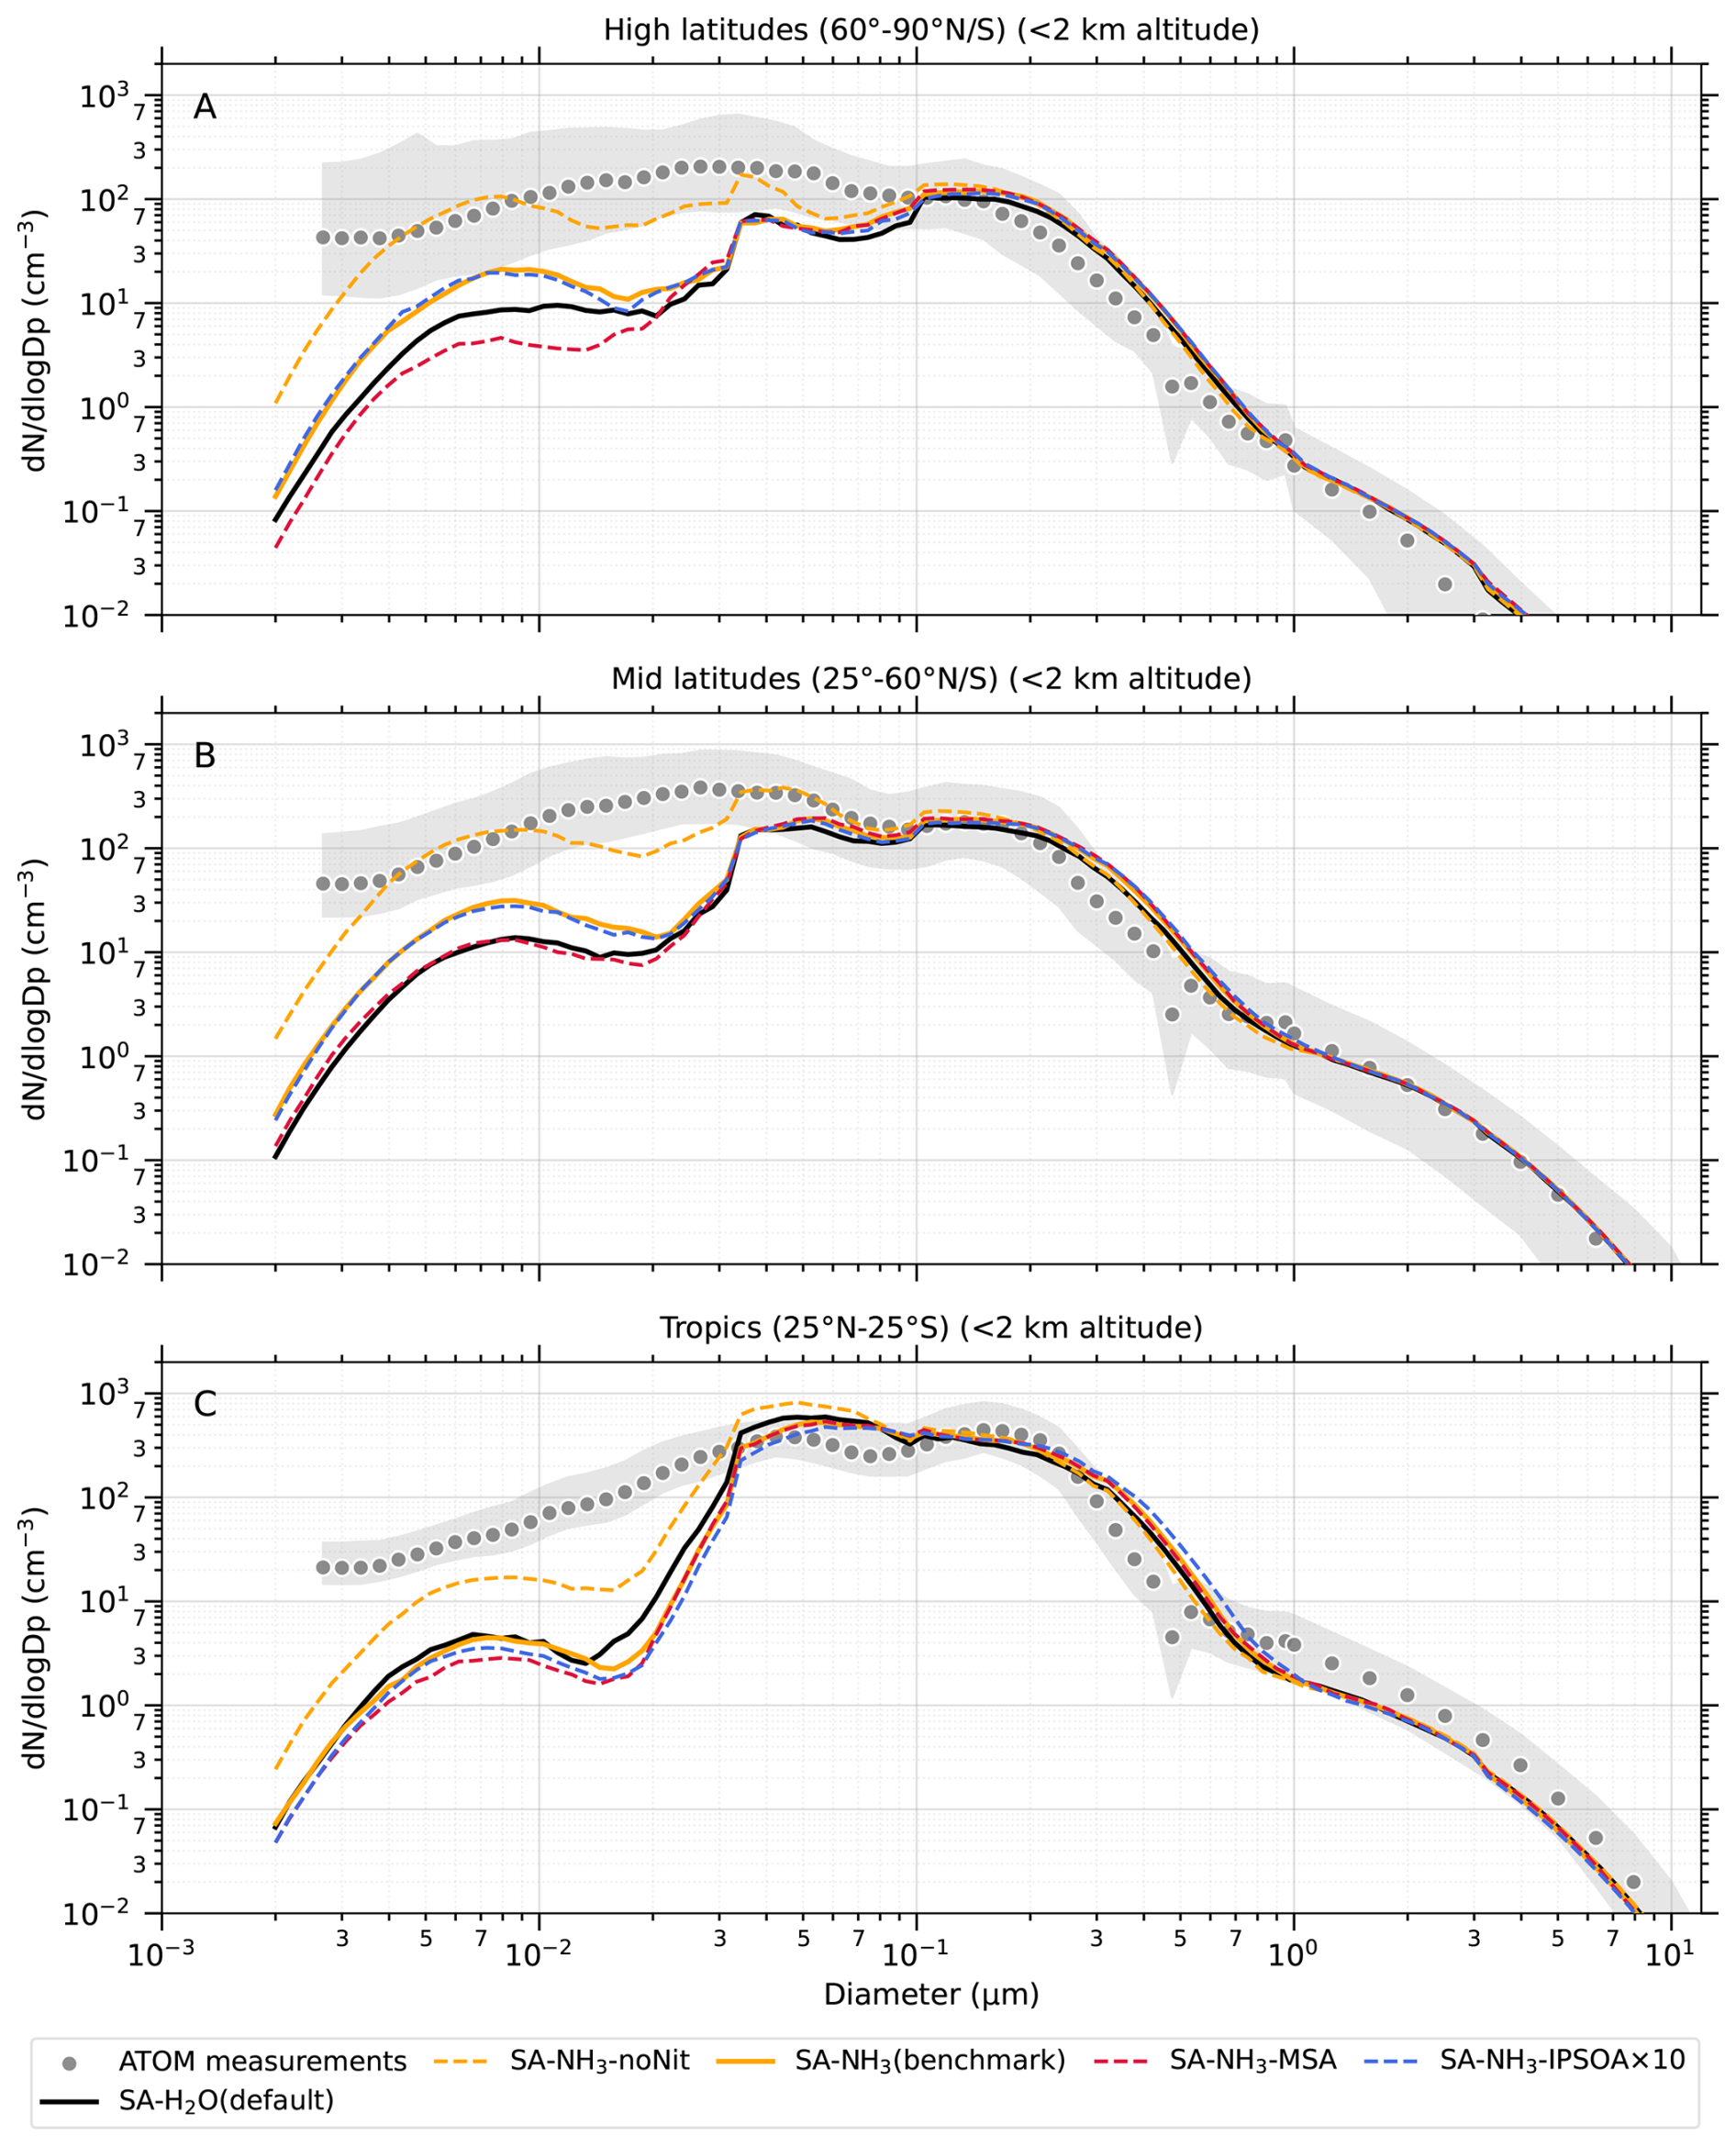
Figure 8Aerosol number size distribution probability density functions in the marine boundary layer (0–2 km altitude) showing median values for ATom observations and selected model simulations. Probability density functions of aerosol number concentration () are shown for ATom observations (gray dots) and model simulations (coloured lines; see Table 2 for simulation details). Gray shade represents the interquartile range of the ATom observations. The x-axis represents aerosol diameter in micrometers, while the y-axis shows the probability density function of aerosol number concentration.
In general, the biases in modelled Aitken mode aerosol concentrations show similar patterns to those for the nucleation mode. In the MBL, Aitken mode aerosols are underestimated by a factor of approximately two for most model simulations except the SA-NH3-noNit and SA-NH3-CS2 simulations (Table 3). The median Aitken mode aerosol concentration is well simulated in the SA-NH3-noNit simulation. However, as discussed previously, this improved agreement is associated with the significant overestimation of NH3 in this particular model configuration. Despite this major caveat, the SA-NH3-noNit simulation is the only simulation that substantially improves the model skill in predicting both nucleation mode and Aitken mode aerosol concentrations in the MBL, with model-to-ATom ratios of 0.68 and 1.03, respectively. The aerosol probability density function in the MBL for this simulation also shows much closer agreement with the ATom observations than other simulations (Fig. 8). This result – where better aerosol predictions require unrealistically high precursor concentrations – indicates that the H2SO4–NH3 mechanism cannot adequately explain observed MBL airborne aerosol formation. Additional or alternative aerosol formation processes are necessary to explain the high nucleation mode aerosol concentrations observed in the MBL.
3.3.2 Accumulation and coarse mode aerosols
The observed global distributions of accumulation mode and coarse mode aerosols differ significantly from those of the nucleation and Aitken modes. Generally, regions with high Aitken mode aerosol concentrations are typically associated with low concentrations of accumulation mode aerosols, suggesting a somewhat inverse relationship in their spatial distributions (Figs. 5 and 6). This relationship is partly regulated by the amount of condensable vapours available for growth, through which Aitken mode aerosols grow into the accumulation mode. Coarse mode aerosols exhibit significantly higher concentrations in the lower troposphere (below approximately 4 km; Fig. A1). This is attributed to their larger size, which limits their atmospheric mobility and makes them more susceptible to deposition processes; thus they are concentrated nearer to their emission sources. Overall, both accumulation and coarse mode aerosol concentrations are significantly higher in the mid- to high-latitudes of the NH compared to the SH due to greater anthropogenic activities in the NH.
Accumulation mode aerosols are notably the only mode consistently overestimated by the presented model simulations in the MBL, with a model-to-ATom ratio of 1.25 in the SA-NH3 benchmark simulation (Table 3). There are several potential reasons for this overestimation: (1) excessive aerosol nucleation and subsequent growth processes in the MBL, (2) excessive primary emissions of accumulation mode aerosols, or (3) inefficient aerosol removal processes. The first reason is unlikely, as both nucleation mode and Aitken mode aerosols are significantly underestimated in the MBL, as discussed previously. The second reason is likely, as the model appears to overestimate primary emissions contributing to accumulation mode aerosols, such as seasalt, in the MBL (supported by aerosol composition data discussed in the next section; see Table 3). The third reason cannot be ruled out, but it cannot be assessed with the data available in this study.
While accumulation mode aerosols are overestimated in the MBL, they are underestimated in the UT, where particle growth is strongly constrained by a limited supply of condensable vapours (Fig. A1). Since H2SO4 is likely already overestimated in the tropical UT by the model (due to overestimation of SO2 and OH), the condensable vapours driving this additional growth are likely to be oxidised organic compounds, such as isoprene-derived SOA, transported from rainforests to the marine UT, as suggested by Shen et al. (2024) and Curtius et al. (2024). This is supported by the SA-NH3-IPSOA×10 simulation which leads to a significant increase in modelled accumulation mode aerosol concentrations in this region, resulting in a model-to-ATom ratio of 0.65. This represents an increase of 0.19 in the ratio compared to the benchmark simulation (which has a ratio of 0.46). Simultaneously, the overestimation of Aitken mode aerosols in the tropical UT is also reduced by these additional condensable vapours, with the SA-NH3-IPSOA×10 simulation yielding a model-to-ATom ratio of 1.35. This is a decrease of 0.19 in the ratio from the benchmark simulation (which has a ratio of 1.54).
Coarse mode aerosols are generally underestimated by the model in the MBL, with a median model-to-ATom ratio of 0.71 in the SA-NH3 benchmark simulation (Table 3). In regions other than the MBL, coarse mode aerosols are generally overestimated by the model (Fig. 6). The most severe overestimation occurs south of 40° S above the MBL, where the model overestimation can exceed a factor of 10, although the absolute number concentrations in this region are very low (less than 0.1 cm−3).
The combined surface area of accumulation and coarse mode aerosols, and to a lesser extent Aitken mode aerosols, determines the available surface for vapour condensation, and thus defines the condensation sink (CS). The CS is calculated here following the methodology of Pirjola and Kulmala (1998), based on the dry aerosol size distribution. The CS typically exhibits a negative correlation with the aerosol nucleation rate, as a higher CS indicates a larger aerosol surface area for vapour condensation, thereby reducing the vapour concentration available for aerosol nucleation. In a large fraction of atmosphere sampled by ATom, the CS is overestimated by the model (Fig. 4). In the MBL, the benchmark simulation overestimates CS by 27 % (Table 3). Considering that the primary production pathway for H2SO4 in the MBL is the reaction of SO2 with OH, while its major loss process is condensation onto existing aerosols (governed by CS), a simplified steady-state approximation suggests . Given that the model overestimation of CS in the MBL is roughly counterbalanced by the overestimation of OH (by 31 %) in the benchmark simulation (Table 3), the model-to-ATom ratio for the term is close to unity. Consequently, the bias in simulated H2SO4 in the MBL is likely dominated by the bias in SO2, suggesting that H2SO4 is probably overestimated by a factor of 2 (Table 3).
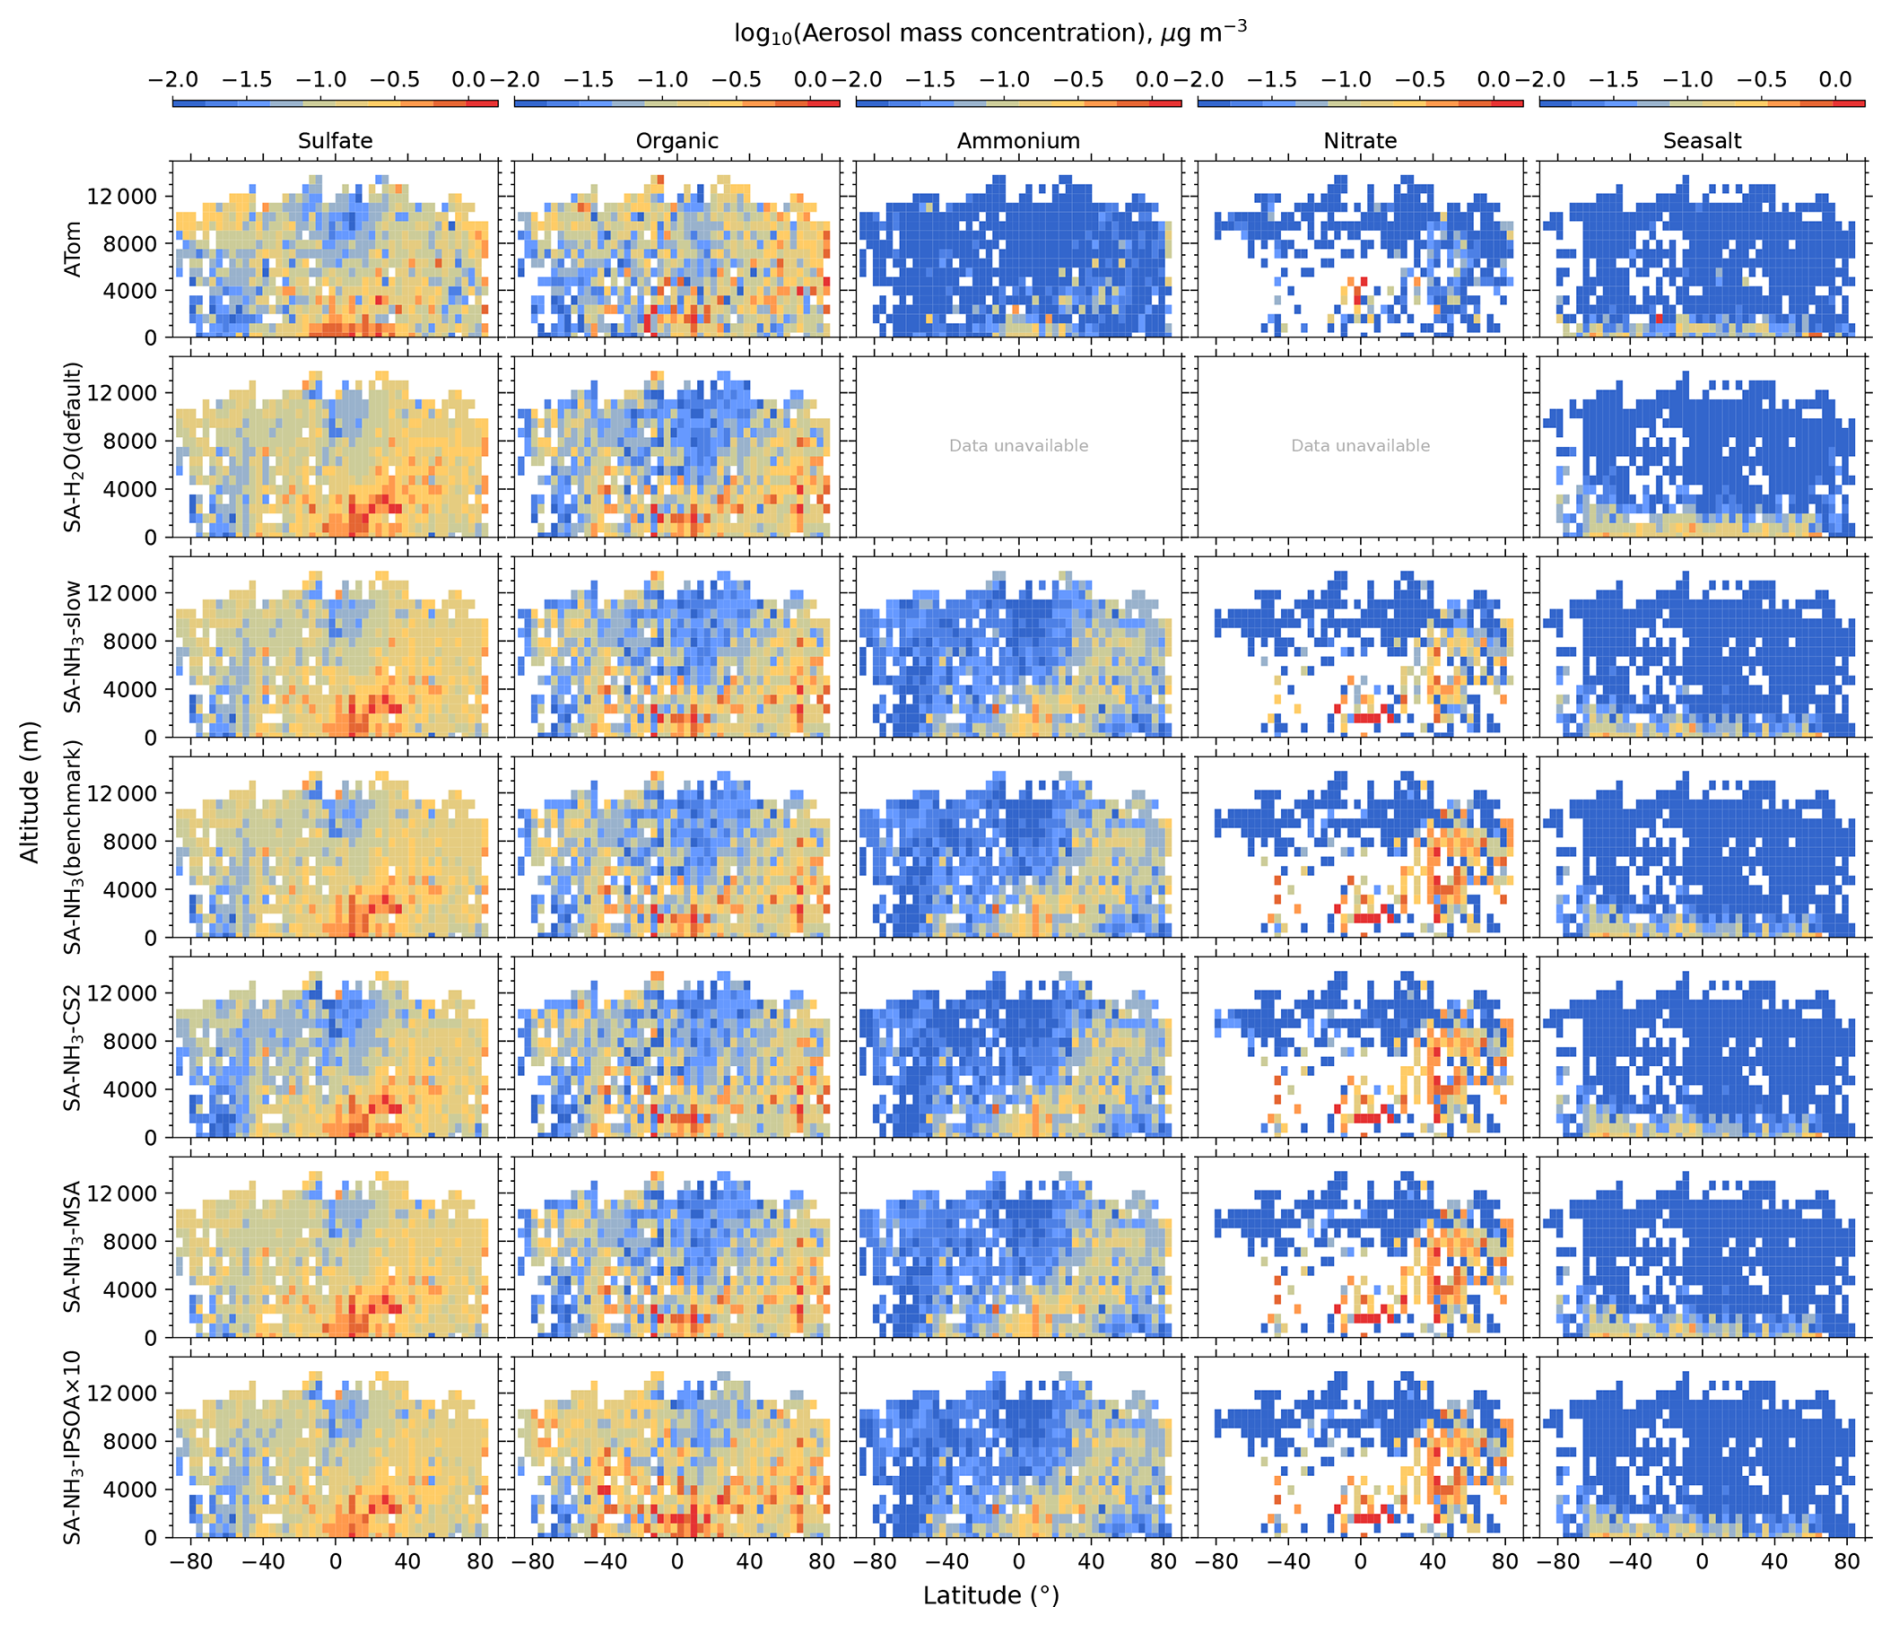
Figure 9Curtain plots of aerosol composition along ATom flight tracks. Mean sulfate, organic, ammonium, nitrate and seasalt mass concentrations are shown for ATom observations (first row) and selected model simulations (subsequent rows; see Table 2 for simulation details). Model outputs are interpolated to ATom flight coordinates and times. All data are displayed on a logarithmic to enhance visualisation of the variations in parameters. Colour scales are consistent within each column to facilitate direct comparison between observations and model simulations. The SA-H2O (default) simulation does not include ammonium or nitrate in aerosols, thus the absence of data in the corresponding plots.
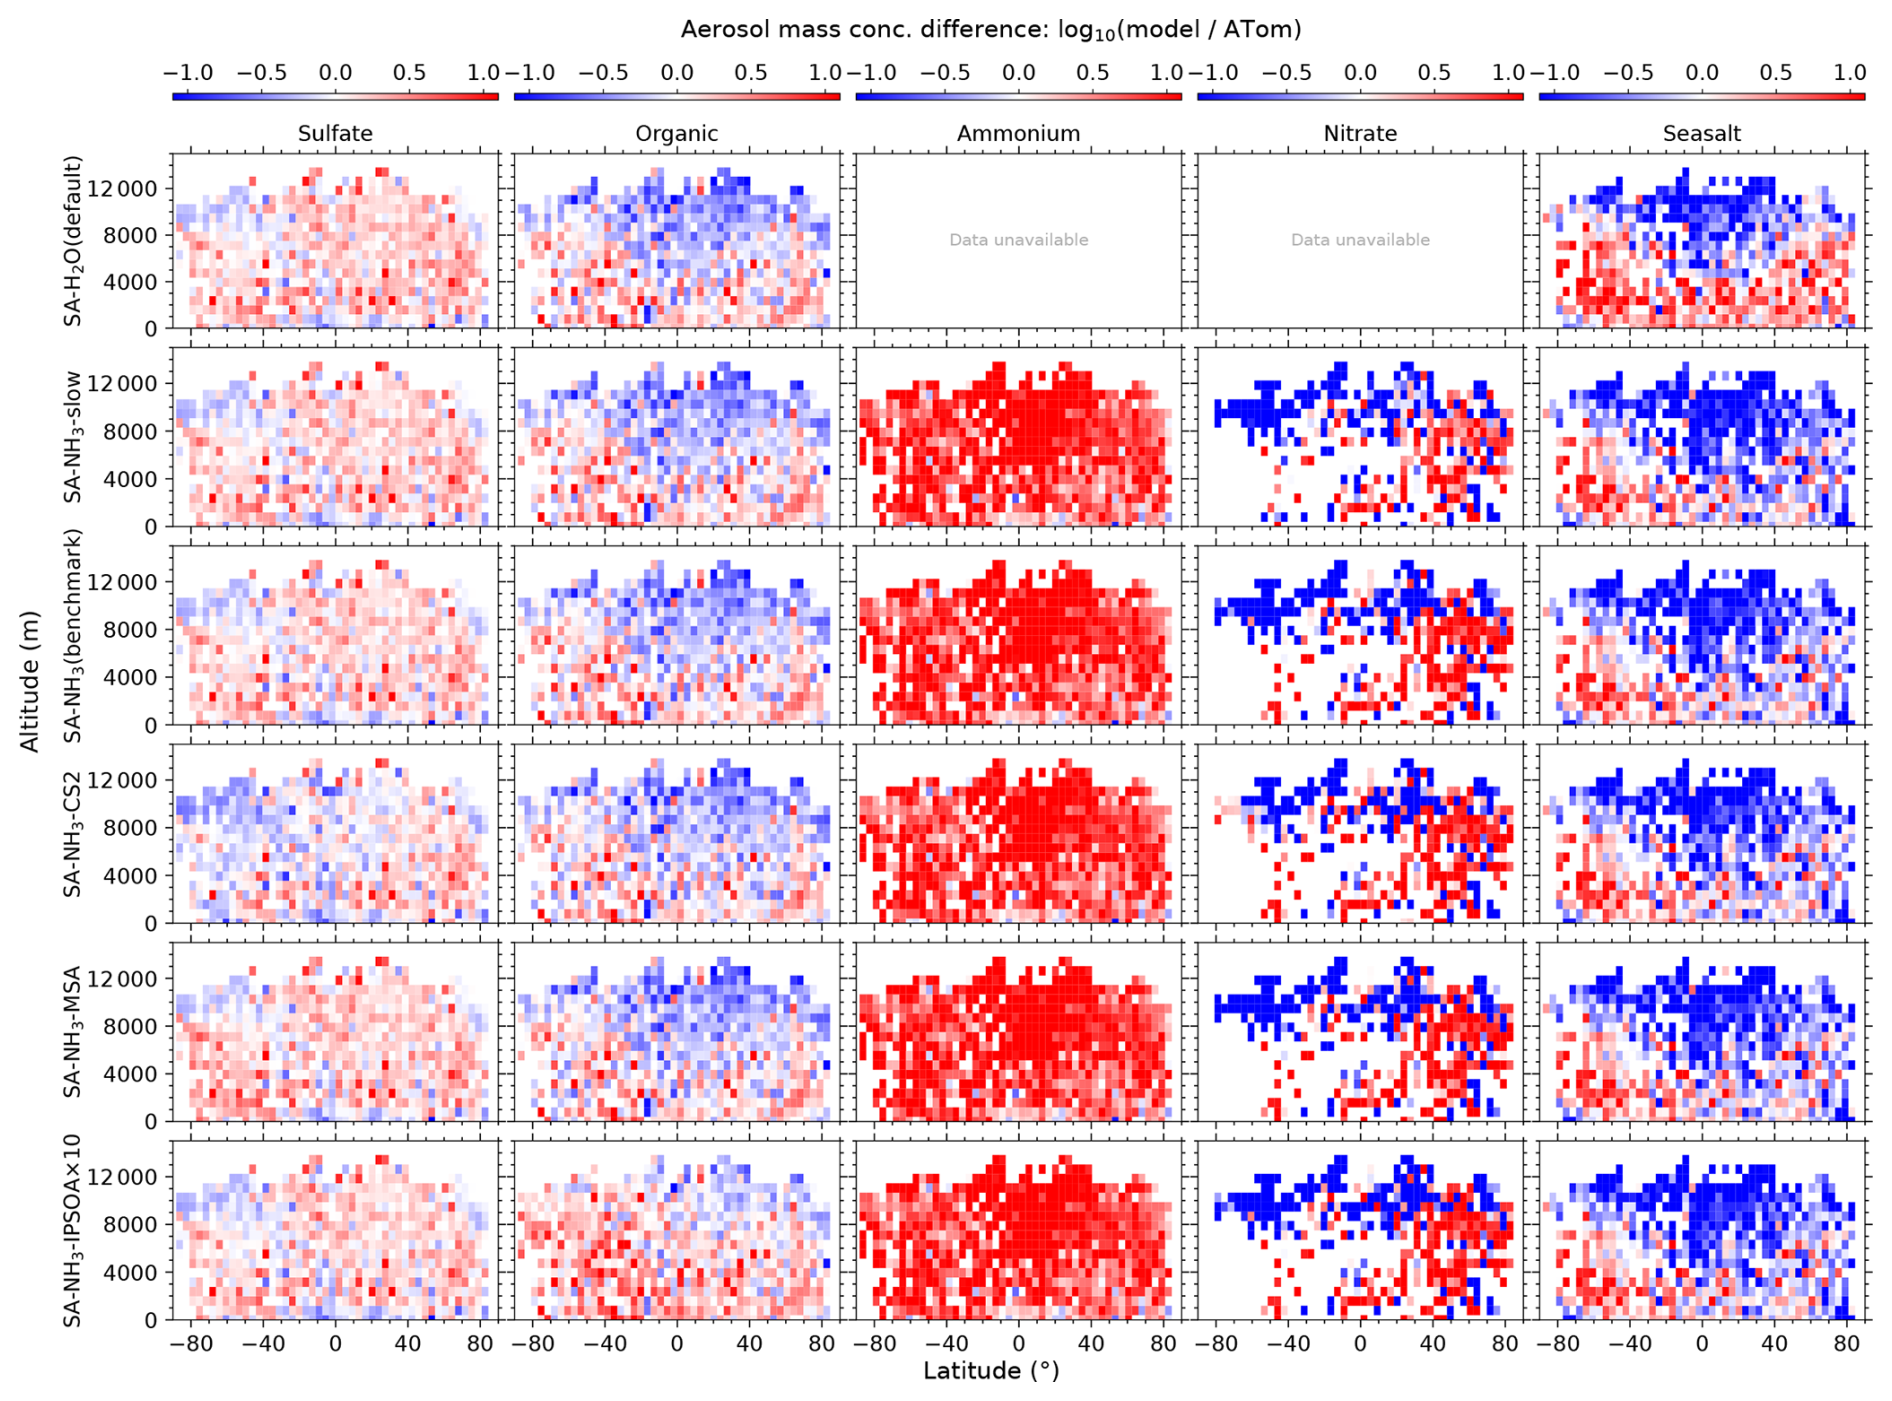
Figure 10Curtain plots of model-to-ATom ratios for aerosol composition along ATom flight tracks. Mean ratios of modelled to observed values for sulfate, organic, ammonium, nitrate and seasalt mass concentrations are shown for selected model simulations (see Table 2 for simulation details). Model outputs are interpolated to ATom flight coordinates and times. Data are displayed on a logarithmic scale with a diverging colour scheme where values greater than 1 indicate model overestimation and values less than 1 indicate model underestimation. Colour scales are consistent within each column to facilitate comparison between different model configurations. The SA-H2O (default) simulation does not include ammonium or nitrate in aerosols, thus the absence of data in the corresponding plots.
3.4 Aerosol composition
The observed aerosol mass concentrations ATom measurements, alongside those from selected model simulations, are presented in Fig. 9. Ratios of modelled to observed values are similarly shown in Fig. 10. In general, model simulations tend to overestimate the MBL submicron aerosol mass (Table 3). This overestimation of aerosol mass occurs despite the general underestimation of total aerosol number concentrations by the model in the MBL. This seemingly contradictory result – overestimated aerosol mass alongside underestimated aerosol number concentrations in the MBL – can be reconciled by considering the modal contributions: the model overestimates aerosol concentrations in the accumulation mode (which dominates aerosol mass), while simultaneously underestimating concentrations in the nucleation and Aitken modes (which dominate aerosol number). It should also be noted that the aerosol size distribution in Fig. 8 shows that the model's accumulation mode aerosol distribution is skewed towards larger sizes, which is consistent with the overestimation of aerosol mass in the MBL.
3.4.1 Sulfate
Except in very specific regions (e.g. the UT south of 40° S and MBL), sulfate aerosol mass is consistently overestimated by the model, with the magnitude of this overestimation typically being a few tens of percent across much of the sampled atmosphere (Figs. 9 and 10). For example, between 2–8 km, the default (SA-H2O) and benchmark (SA-NH3) simulations overestimate sulfate by 42 % and 34 %, respectively (Table A1). The only model simulations that significantly change sulfate aerosol mass concentrations, between 2–8 km, are SA-NH3-Lana, SA-NH3-CS2 and SA-NH3-MSA. By modifying the DMS emission scheme, the SA-NH3-Lana simulation increases the sulfate overestimation by 11 %, resulting in a model-to-observation ratio of 1.45. This increase is likely driven by higher DMS emissions from the adopted climatological dataset, relative to the default interactive scheme, as discussed earlier. On the other hand, the SA-NH3-CS2 simulation reduces the sulfate overestimation from 34 % (in the benchmark) to 5 %, while the SA-NH3-MSA simulation increases the overestimation to 45 % (Table A1). The reduction in sulfate overestimation in the SA-NH3-CS2 simulation is attributed to the lower SO2 concentrations resulting from the CS2 chemistry scheme (see earlier discussions). The additional 11 % increase in bias in the SA-NH3-MSA simulation is due to the inclusion of condensable MSA vapours, which are treated as part of the sulfate aerosol component in the model for mass accounting, as MSA is not independently treated in the model.
It is important to mention that the most significant changes in sulfate aerosol mass concentrations relative to ATom, due to these scheme modifications, appear to concentrate in relatively pristine environments, such as the tropical UT and the SH (Fig. 10). This supports that these changes are primarily driven by changes to the atmospheric chemistry of DMS (in SA-NH3-CS2) and the inclusion of its oxidation products like MSA as condensable species (in SA-NH3-MSA). Anthropogenic primary sulfate aerosol emissions and direct emissions of SO2, which are more dominant in the NH, are not significantly affected by these specific scheme changes; therefore, sulfate aerosol mass concentrations in the NH are less impacted. This highlights the need to improve the representation of DMS sources and its atmospheric chemistry in the model for simulating aerosols in the pristine regions of the atmosphere.
One primary reason for this general global overestimation of sulfate aerosol is the model's overestimation of SO2 concentrations, a key precursor for sulfate aerosol formation. Sulfate aerosol in the model is formed either from primary sources from anthropogenic emissions, or secondary processes such as from the gas-phase condensation of H2SO4, or, more significantly, through aqueous-phase oxidation of SO2 in cloud droplets by H2O2 and O3 (Mulcahy et al., 2020). Consequently, the accuracy of simulated sulfate aerosol concentrations is also sensitive to the modelled concentrations of other species involved in these pathways, such as gas-phase OH and aqueous-phase oxidants like H2O2 and O3. Furthermore, the use of a fixed cloud pH value of 5.0 in the model may also affect the efficiency of SO2 uptake (Mulcahy et al., 2020). Since the model's treatment of these multi-phase processes is relatively simplified, further mechanistic implementation and evaluation of these processes are needed to improve the model's representation of sulfate aerosol.
Another potential contributor to the overestimation of sulfate is the underestimation of its removal processes, leading to an overestimated aerosol lifetime. For instance, Mulcahy et al. (2020) reported a sulfate () lifetime of 5.57 d in UKESM1.0, which is around 2 d longer than the estimate of 3.7 d by Mann et al. (2010). This value also lies at the upper end of the range reported by AeroCom-I models, which spans from 3 to 5.4 d, suggesting that sulfate removal may be too slow in UKESM.
3.4.2 Organic matter
The model-ATom discrepancy in organic aerosol mass exhibits a distinct dipole pattern: underestimation in the upper troposphere (8–12 km) and the tropical lower to mid free troposphere (2–8 km), and moderate overestimation across the rest of the sampled atmosphere (Figs. 10 and A3). In the UT, this underestimation is most likely attributed to a lack of significant organic aerosol sources in the model at these altitudes. A clear missing source of organic aerosol in the model's UT is SOA derived from the oxidation products of isoprene, which are not explicitly included as a significant SOA source in the default model configuration. Recent ambient observations and laboratory studies have shown that isoprene oxidation products can contribute significantly to new particle formation and growth in the tropical UT (Shen et al., 2024; Curtius et al., 2024).
Although a comprehensive isoprene new particle formation mechanism cannot be implemented in the model at this stage due to a lack of readily available parameterisations, this study attempts to partially account for this missing contribution of isoprene oxidation products to aerosol growth using the SA-NH3-IPSOA and SA-NH3-IPSOA×10 simulations. The implementation of the explicit IPSOA scheme significantly increases modelled organic aerosol mass concentrations in the tropical UT. The median measured organic aerosol mass concentration during the ATom campaigns in this region is 0.083 µg m−3. The model-to-ATom ratio in the benchmark SA-NH3 simulation for this region is 0.32, indicating an underestimation by around 3 times. With a 3 % SOA mass yield from isoprene oxidation, the SA-NH3-IPSOA simulation improves the model-to-ATom ratio for organic aerosol mass concentration in the tropical UT to 0.41. A 30 % SOA mass yield (SA-NH3-IPSOA×10 simulation) further improves this comparison, increasing the model-to-ATom ratio to 0.86 (Fig. 10).
In the MBL, the model simulations generally overestimate organic aerosol mass concentrations, for example by a factor of 1.42 in the benchmark SA-NH3 simulation. The SA-NH3-IPSOA simulation results in a model-to-ATom ratio of 1.35 for MBL organic aerosol. This slight reduction in the MBL organic aerosol overestimation, despite adding an isoprene SOA source, is likely due to the concurrent reduction in the prescribed monoterpene SOA yield (see Table 2 and Methods). The SA-NH3-IPSOA×10 simulation, on the other hand, significantly worsens the organic aerosol mass overestimation in the MBL, increasing the model-to-ATom ratio to 1.72. This increased overestimation likely results from an isoprene SOA yield (30 %) that is unrealistically high for the warmer MBL conditions, where higher temperatures generally lead to lower SOA yields. Therefore, accurately quantifying the SOA yield from isoprene oxidation, both in the cold UT and warm MBL, is crucial for improving the model's representation of organic aerosols.
Another notable feature is the generally stronger underestimation of submicron organic aerosol mass in the NH compared to the SH. This disparity is likely due to the model's omission of secondary organic aerosol contributions from anthropogenic precursors, a limitation that warrants further investigation.
3.4.3 Ammonium and nitrate
The ammonium and nitrate aerosol scheme, recently developed by Jones et al. (2021), is not included in the default UKESM1.1 configuration. Therefore, the default (SA-H2O) and SA-NH3-noNit simulations do not include these two aerosol components, while the ammonium nitrate scheme is included in all other simulations discussed in this study. ATom observations indicate that the mass concentrations of both ammonium and (inorganic) nitrate are significantly lower than those of sulfate and organic matter globally. This is particularly true for nitrate mass, which exhibits low concentrations globally (Fig. 9).
For the region where the nitrate component is above the detection limit of AMS, model simulations generally show an overestimation of nitrate aerosol mass concentrations compared to ATom observations below 8 km (Tables 3 and A1). For example, the benchmark SA-NH3 simulation reports a model-to-ATom ratio of 11.27 in the MBL, indicating a significant overestimation by the model (Table 3). Using the slow nitric acid uptake coefficient (SA-NH3-slow simulation) reduces this overestimation in the MBL, with the ratio reduced to 2.93. This discrepancy might suggest that the nitric acid uptake coefficient is still too fast, and using an even slower value could improve the simulation of nitrate aerosol mass concentrations in this NH. Alternatively, the overprediction may be from overestimated anthropogenic NOx emissions, which would lead to excessive atmospheric nitric acid and, consequently, particulate nitrate. A third possible explanation is that the model underestimates the deposition rates of NOx and its oxidation products. Therefore, the exact cause of the nitrate aerosol overestimation in the NH remains uncertain and requires further investigation.
In contrast to nitrate, ammonium aerosol mass concentrations are ubiquitously overestimated by the model throughout the sampled atmosphere when the ammonium nitrate scheme is active (Figs. 10 and A2). This overestimation of ammonium likely translates into an overestimation of aerosol pH (i.e. an underestimation of aerosol acidity) globally, consistent with findings for other chemical transport models reported by Nault et al. (2021). In the MBL, the benchmark SA-NH3 simulation overestimates ammonium aerosol mass concentrations by a factor of 3.20 compared to ATom observations (Table 3). Furthermore, this positive model bias for ammonium is even larger above the MBL. For example, the bias increases to a factor of 7.73 between 2–8 km altitude. It is worth noting that both ammonium aerosol and gas-phase NH3 concentrations are significantly overestimated by the model in the MBL (Table 3). This pervasive overestimation of ammonium is unlikely to be solely explained by flaws in the implemented ammonium nitrate scheme itself. Improvements to either or both the NH3 emission inventories and the representation of its atmospheric removal processes are needed to enhance the simulation of both gaseous NH3 and particulate ammonium in the model.
3.4.4 Seasalt
Seasalt aerosols are a major component of primary marine CCN and play a crucial role in cloud microphysics and climate. The precise relative contributions of seasalt aerosols (primary) and new particle formation processes to the total CCN population remain uncertain. These two major aerosol sources have distinct feedback mechanisms within the climate system and are projected to exhibit different responses to future environmental changes. It is therefore essential to accurately represent both processes in models to enable robust assessments of future changes in CCN, cloud microphysics, and ultimately, climate.
As expected, the measured seasalt concentrates in the MBL (Murphy et al., 2019). However, the simulations without the ammonium nitrate scheme (SA-H2O and SA-NH3-noNit) overpredict seasalt aerosol mass concentrations in submicron aerosols within the MBL, with the default simulation predicting concentrations 2.09 times higher than observed (Table 3). This overestimation persists consistently across latitudes, from the tropics to high-latitude regions (Fig. 10). Additionally, simulations that include the ammonium nitrate scheme show a reduction in seasalt aerosol mass. This decrease is possibly linked to chemical processing, specifically the displacement of chloride by nitrate through heterogeneous uptake of HNO3 on seasalt particles, leading to the formation of hydrogen chloride (HCl) (Jones et al., 2021). However, given the very low nitrate concentrations in the marine boundary layer, it remains uncertain whether sufficient nitrate is available to drive appreciable chloride displacement. Further investigation is needed to better understand the implications of the ammonium nitrate scheme on seasalt conservation in marine environments.
Constraining seasalt emissions, particularly with geometric diameter smaller than 1 µm, is crucial for accurately understanding the CCN budget in the MBL, as Aitken and accumulation mode aerosols are the major contributors to CCN concentrations. The default model's overestimation of seasalt aerosols in the MBL will likely lead to an exaggerated contribution from primary seasalt to the CCN budget, potentially masking or underestimating the CCN contribution from airborne aerosol formation processes. The default model's overprediction of seasalt aerosols in the marine atmosphere is also supported by a recent study by Venugopal et al. (2025), which found that the default seasalt emission scheme in UKESM overpredicts the dependence of seasalt emissions on wind speed when validated against aerosol optical depth observations.
Previous sections have evaluated the model's performance in simulating individual environmental conditions, precursor vapours, aerosol number size distributions, and aerosol chemical composition against ATom observations. Addressing the identified discrepancies is crucial for improving the representation of aerosol processes in the model, with the ultimate goal of achieving accurate predictions for the correct physical and chemical reasons. In this section, we synthesise our findings to discuss the implications of our model development endeavours and to outline future directions for improving aerosol simulations.
The discussions focus on two specific regions: the UT, particularly between 8 and 12 km altitude, and the MBL, below 2 km altitude. The selection of these two regions is based on several key considerations. Firstly, they are the regions where the model exhibits its most significant biases for numerous evaluated parameters. Secondly, the UT is a region where ATom observations reveal significant enhancements in aerosol number concentrations, often driven by strong new particle formation (Williamson et al., 2019). Thirdly, the MBL is critical due to the sensitivity of marine low-level clouds, a key component of the Earth's radiative balance, to the MBL aerosol population that acts as CCN.
4.1 Marine boundary layer processes
The systematic overestimation of aerosol nucleation precursors (SO2, OH and NH3) alongside the underestimation of nucleation and Aitken mode particle concentrations in the MBL highlights a fundamental inconsistency between current model representations and the actual processes governing airborne aerosol formation in marine environments. This paradox – where abundant precursor vapours fail to generate sufficient particle numbers – suggests that H2SO4–H2O nucleation alone cannot account for observed aerosol formation rates in the marine atmosphere.
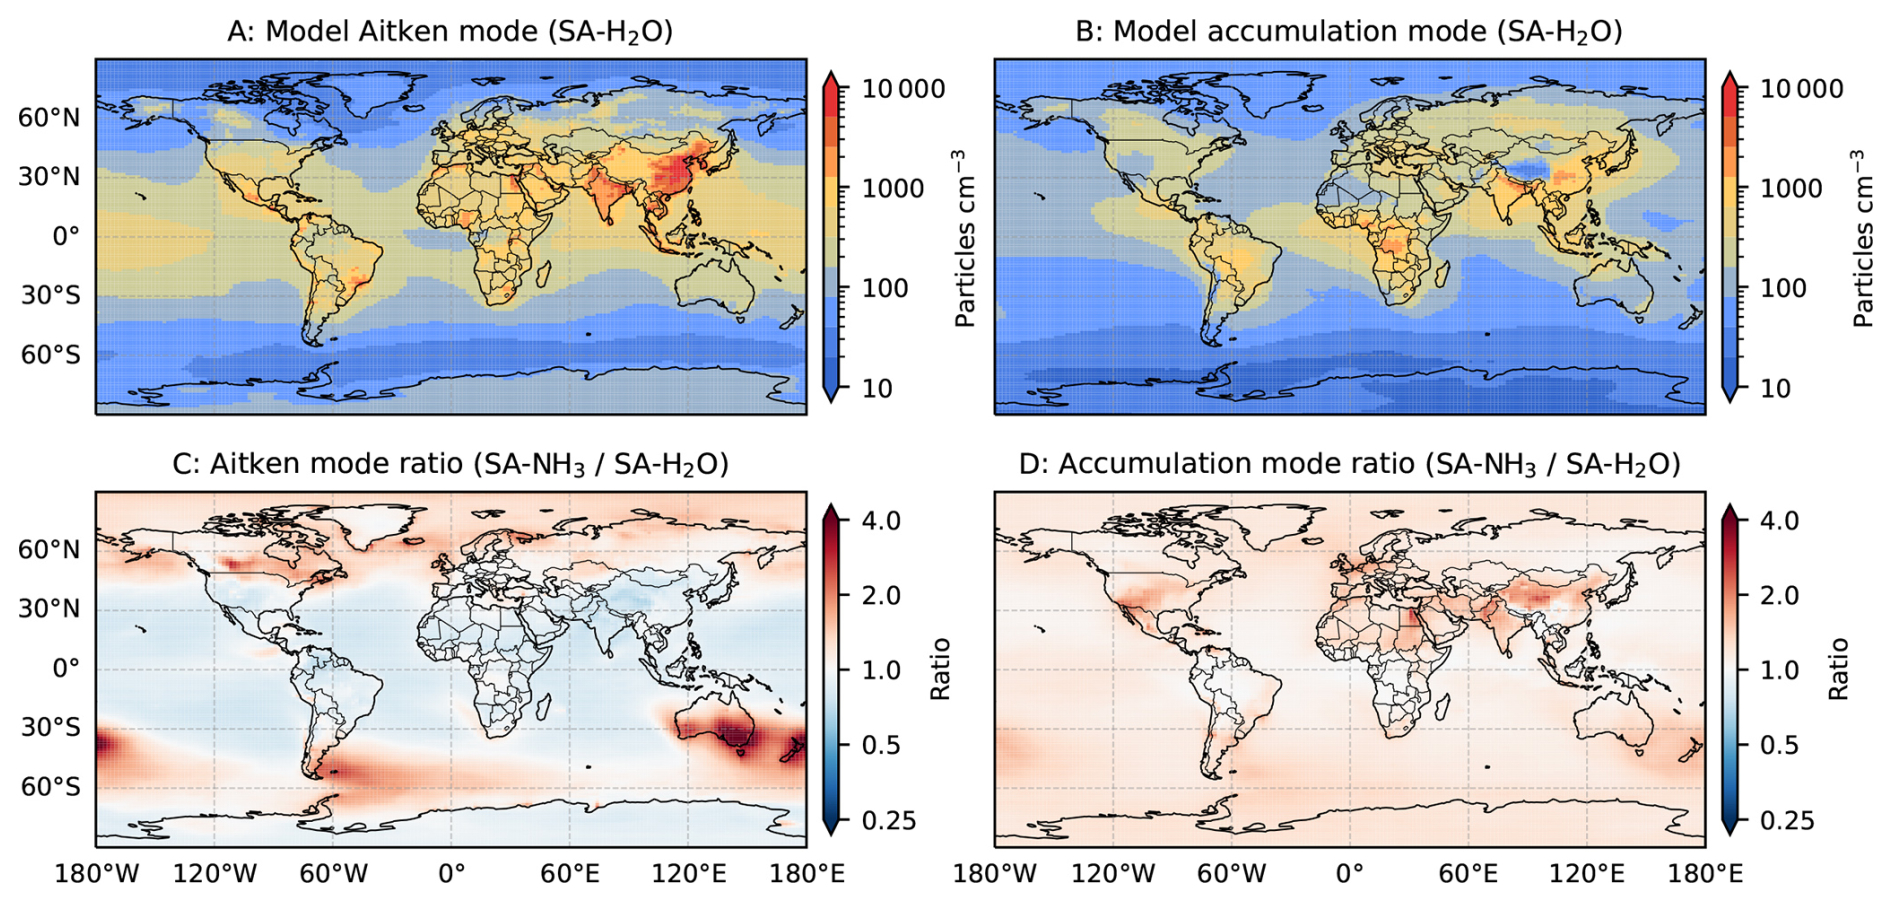
Figure 11Global distribution of marine boundary layer aerosol changes following implementation of the H2SO4–NH3 nucleation mechanism. Panels show aerosol number concentrations in the marine boundary layer (0–2 km altitude) averaged over monthly means from July 2016 to June 2018: (A) Aitken mode aerosols from the default SA-H2O simulation, (B) accumulation mode aerosols from the default SA-H2O simulation, (C) ratio of Aitken mode concentrations between benchmark SA-NH3 and default SA-H2O simulations, and (D) ratio of accumulation mode concentrations between benchmark SA-NH3 and default SA-H2O simulations.
The implementation of the H2SO4–NH3 nucleation mechanism with the ammonium nitrate scheme produces mixed results. While this leads to modest improvements in nucleation mode particle concentrations, it worsens the underestimation of Aitken mode aerosols (Table 3) and generally reduces Aitken mode concentrations across the MBL, particularly in pristine marine regions (Fig. 11). In contrast, accumulation mode aerosol concentrations exhibit widespread increases, especially over populated continental regions where elevated NH3 emissions promote both aerosol mass formation and H2SO4–NH3 nucleation.
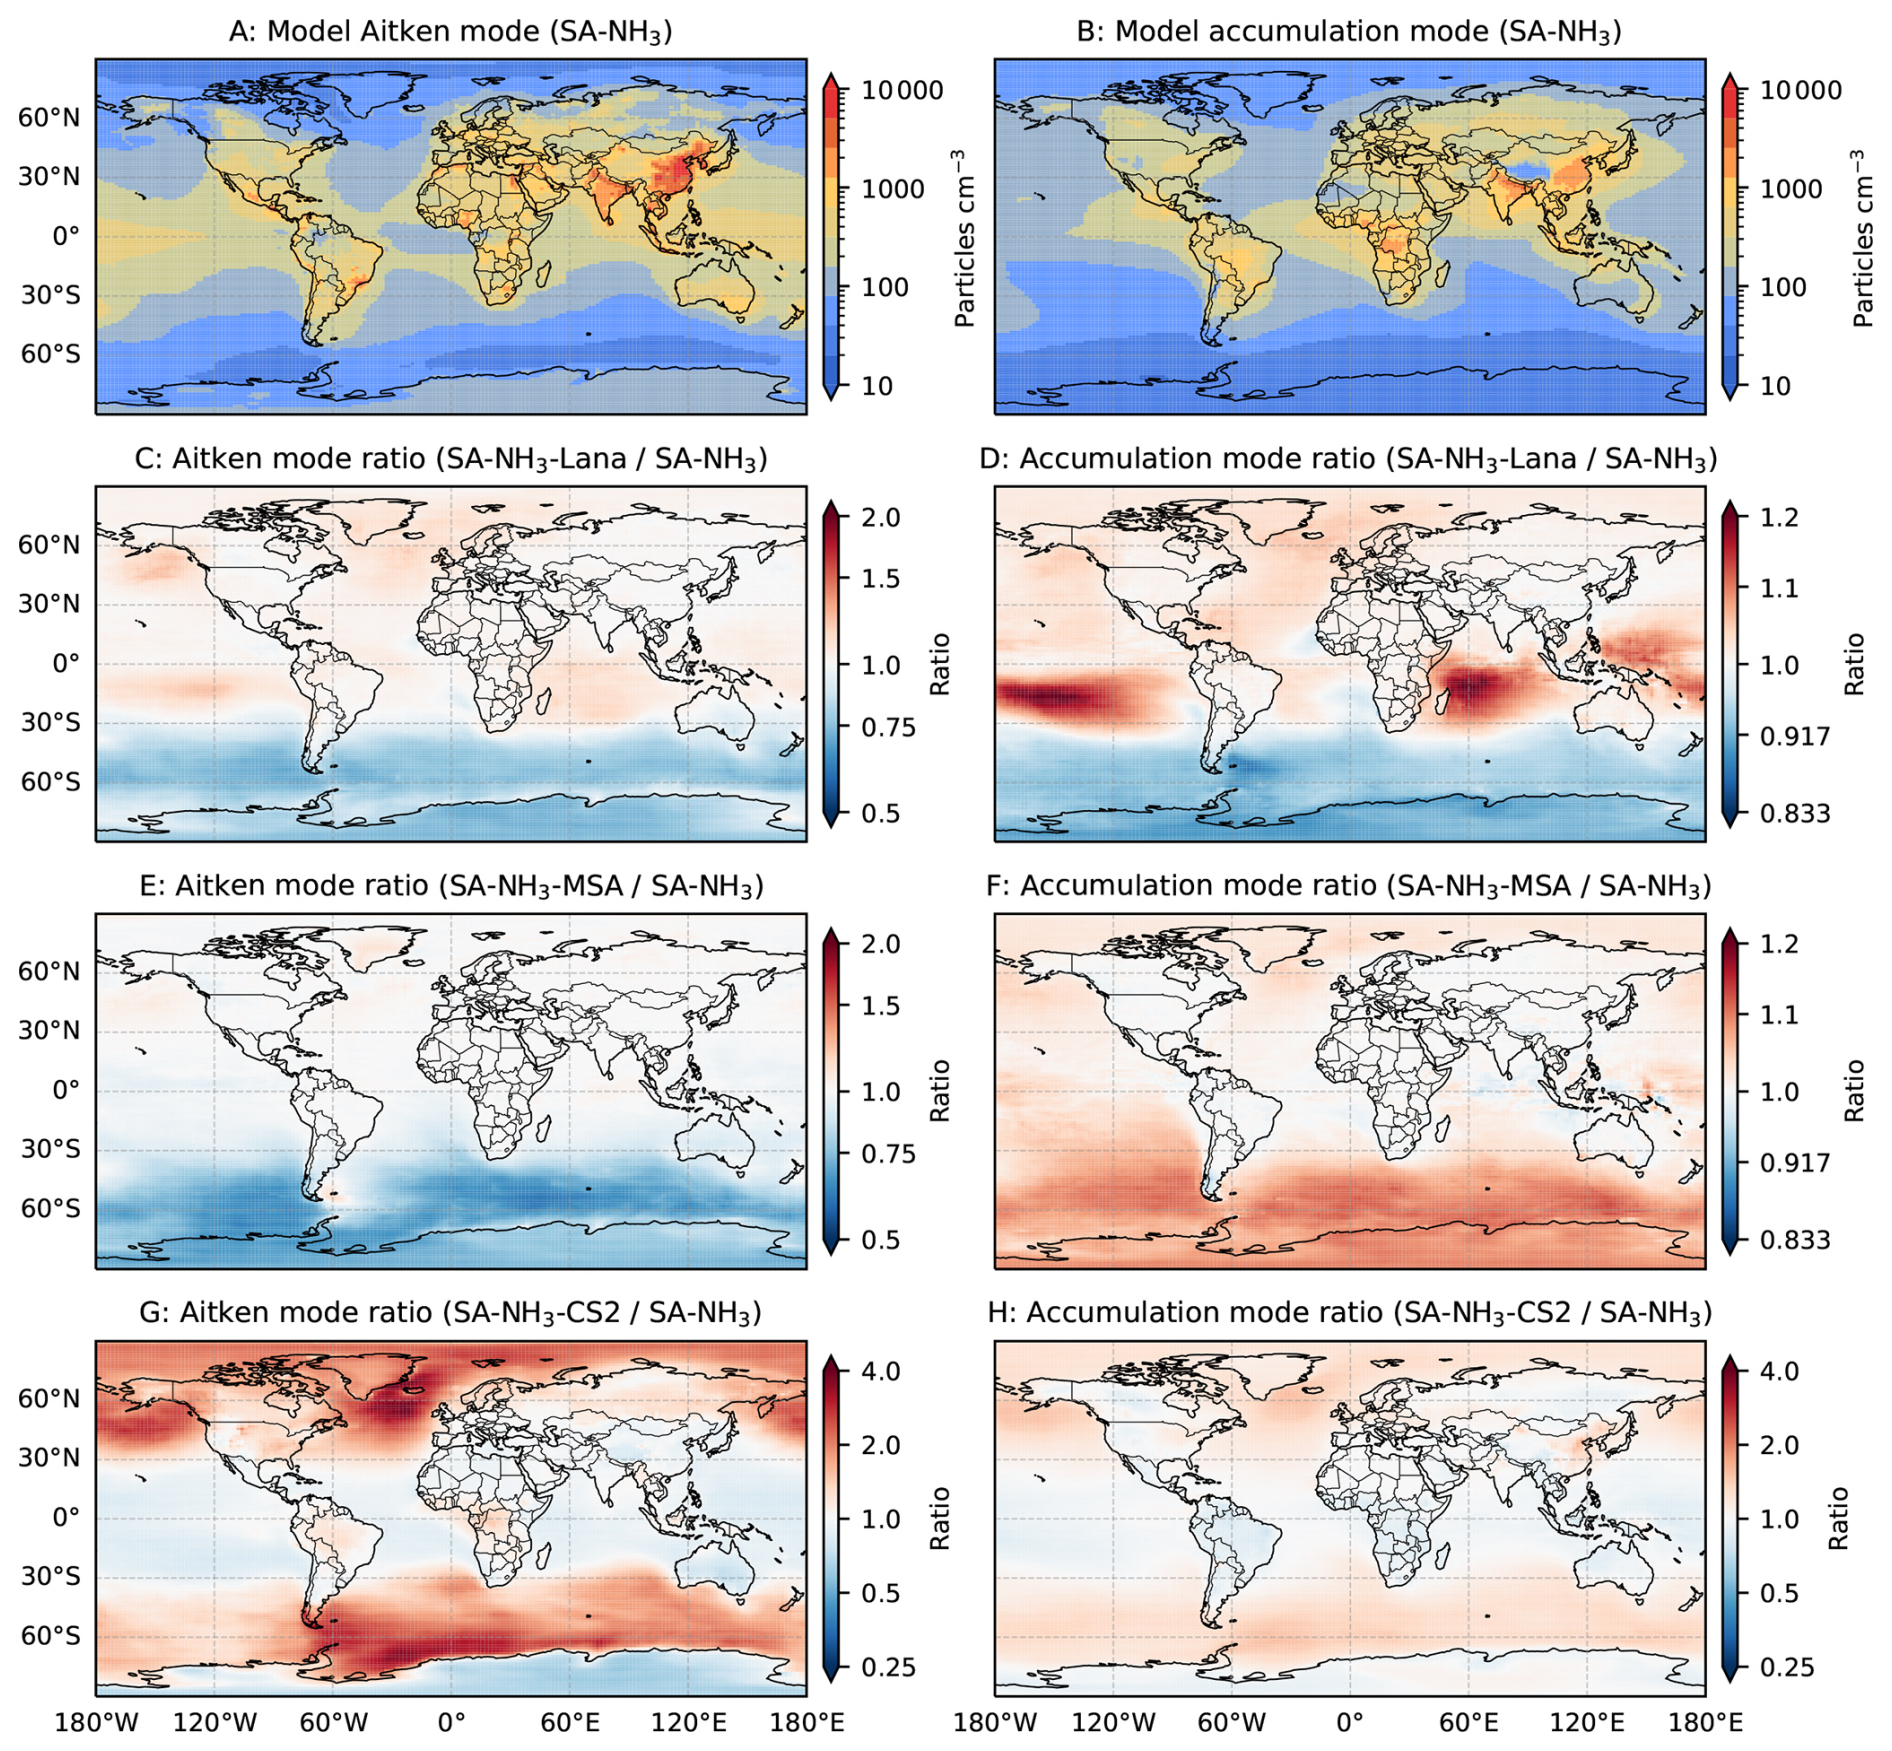
Figure 12Global distribution of marine boundary layer aerosol changes following implementation of the Lana et al. (2011) DMS climatology, MSA condensation and CRI-Strat2 scheme. Panels show aerosol number concentrations in the marine boundary layer (0–2 km altitude) averaged over monthly data from July 2016 to June 2018: (A) Aitken mode aerosols from the benchmark SA-NH3 simulation, (B) accumulation mode aerosols from the benchmark SA-NH3 simulation, (C) ratio of Aitken mode concentrations between SA-NH3-Lana and benchmark SA-NH3 simulations, and (D) ratio of accumulation mode concentrations between SA-NH3-Lana and benchmark SA-NH3 simulations, (E) ratio of Aitken mode concentrations between SA-NH3-MSA and benchmark SA-NH3 simulations, and (F) ratio of accumulation mode concentrations between SA-NH3-MSA and benchmark SA-NH3 simulations, (G) ratio of Aitken mode concentrations between SA-NH3-CS2 and benchmark SA-NH3 simulations, and (H) ratio of accumulation mode concentrations between SA-NH3-CS2 and benchmark SA-NH3 simulations.
Model sensitivity to different schemes is substantial. Adding condensable vapours such as MSA increases accumulation mode concentrations, particularly over the Southern Ocean where DMS emission is high, while simultaneously reducing Aitken mode concentrations as aerosols grow more rapidly to the accumulation mode (Fig. 12). Switching DMS emission schemes or chemistry schemes (from Strat-Trop to CS2) produces significant regional changes, with polar regions being especially sensitive due to their low background aerosol concentrations.
Beyond aerosol numbers, the default model overestimates total submicron aerosol mass in the MBL. For example, seasalt is overestimated in the default model, potentially leading to exaggerated primary CCN contributions. The concurrent overestimation of both gas-phase NH3 and particulate ammonium in the simulations with the ammonium nitrate scheme suggests fundamental issues with NH3 budget representation.
These findings indicate that the default model's CCN budgets in the MBL are incorrectly described, with excessive dependence on primary emissions such as seasalt masking deficient airborne aerosol formation processes. This imbalance has important implications for preindustrial baseline estimates, as the relative importance of natural versus anthropogenic aerosol sources may be fundamentally misrepresented. The results strongly support incorporating additional aerosol formation pathways, likely involving iodine oxoacids, organic vapours, or other marine-specific precursors.
4.2 Upper tropospheric processes
The model's biases for the aerosol number size distribution in the UT are essentially the opposite of those in the MBL. Specifically, the model overestimates nucleation and Aitken mode aerosol concentrations while underestimating accumulation mode aerosol concentrations. This pattern of too many small aerosols and too few large ones may suggest an imbalance in the model between new particle formation and subsequent aerosol growth processes. The UT provides a clearer reflection of the model's performance in simulating these airborne aerosol formation processes, as it is a region where most primary aerosols are not efficiently transported, minimising the confounding influence of primary source biases that are more prominent in the MBL. In the default simulation, the model overestimates nucleation and Aitken mode aerosols by factors of 6.30 and 1.88, respectively, while the model-to-ATom ratio for accumulation mode aerosols is only 0.39 (Table A2). As discussed in earlier sections, this overestimation of small aerosols primarily results from the excessive aerosol nucleation rate predicted by the Vehkamäki et al. (2002) scheme, as well as from contributing factors such as the overestimated concentrations of OH and H2O (Figs. 2 and 4).
Implementing the H2SO4–NH3 nucleation mechanism and ammonium nitrate scheme in the benchmark simulation significantly reduces the overestimation of nucleation and Aitken mode aerosols, yielding improved model-to-ATom ratios of 1.74 and 1.41, respectively. Simultaneously, the underestimation of accumulation mode aerosols is also reduced (i.e. improved), with the model-to-ATom ratio increasing to 0.52. This can be understood in terms of mass balance: a lower nucleation rate results in fewer nucleation and Aitken mode aerosols, but the available condensable vapour is then distributed among fewer aerosols, promoting more efficient growth of the remaining population into the accumulation mode. It is worth mentioning that since sulfate aerosol mass is reasonably simulated by the model in the UT (ratio of 1.04 in the benchmark simulation), the missing mass needed to grow aerosols into the accumulation size range and to match observations must be accounted for by other components. As nitrate, ammonium, and seasalt aerosol mass concentrations are all too low in the UT over remote marine atmosphere (Fig. 9), organic matter is the only remaining component that can account for this missing mass, consistent with the hypothesis by (Williamson et al., 2019; Kupc et al., 2020).
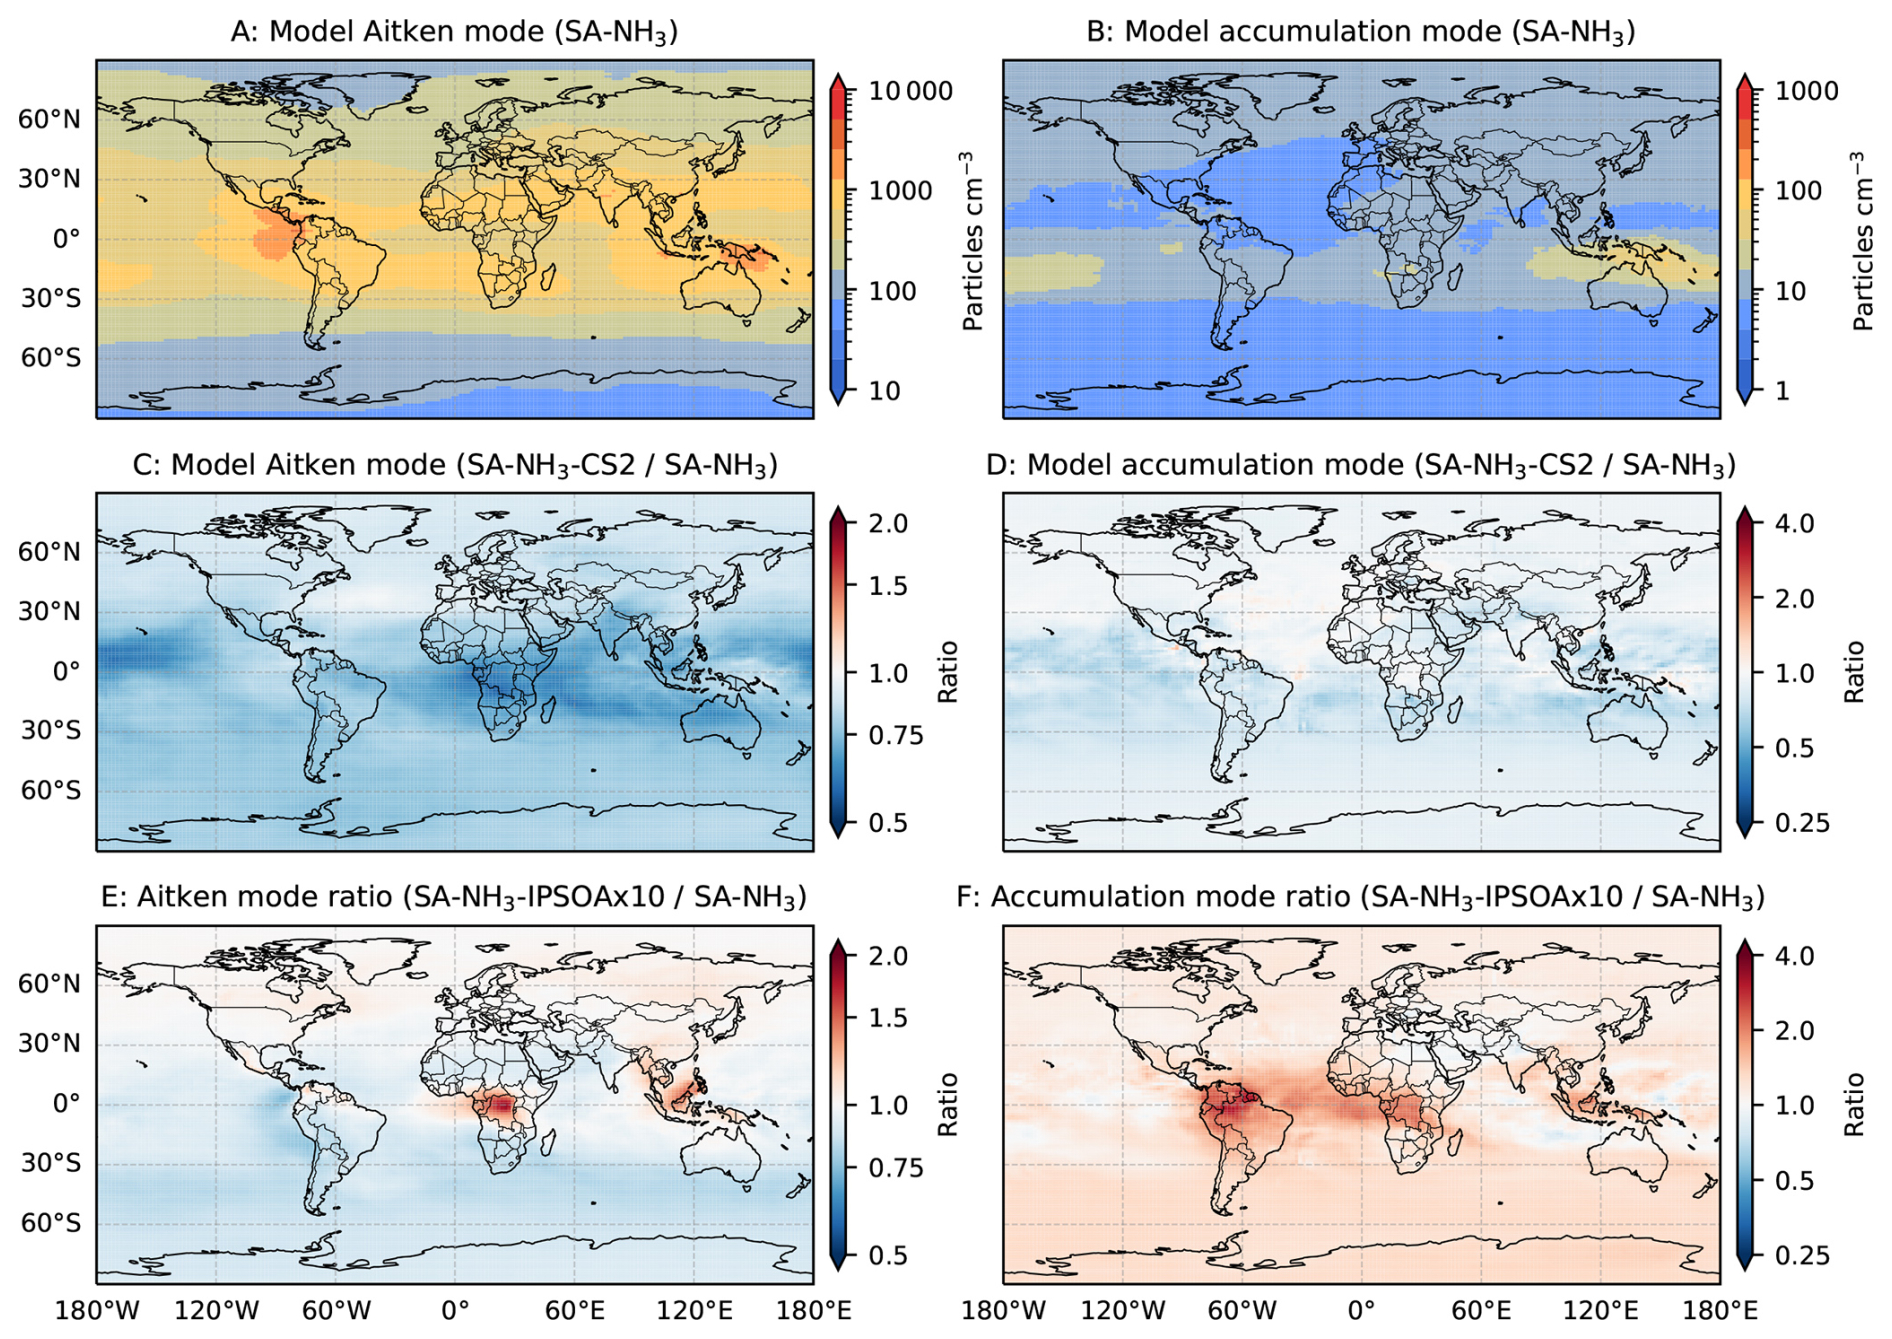
Figure 13Global distribution of upper tropospheric aerosol changes following implementation of the CRI-Strat2 scheme and isoprene secondary organic aerosol formation scheme. Panels show aerosol number concentrations in the upper troposphere (8–12 km altitude) averaged over monthly means from July 2016 to June 2018: (A) Aitken mode aerosols from the benchmark SA-NH3 simulation, (B) accumulation mode aerosols from the benchmark SA-NH3 simulation, (C) ratio of Aitken mode concentrations between SA-NH3-CS2 and benchmark SA-NH3 simulations, and (D) ratio of accumulation mode concentrations between SA-NH3-CS2 and benchmark SA-NH3 simulations, (E) ratio of Aitken mode concentrations between SA-NH3-IPSOA×10 and benchmark SA-NH3 simulations, and (F) ratio of accumulation mode concentrations between SA-NH3-IPSOA×10 and benchmark SA-NH3 simulations.
Indeed, all simulations without the IPSOA scheme show significantly underestimated organic aerosol mass concentrations in the UT, with the benchmark simulation underestimating it with a ratio of 0.45. Isoprene is the most likely candidate to account for this missing organic aerosol mass, as its global emission is large (around 500 Tg yr−1), and its oxidation products have recently been discovered to contribute significantly to new particle formation and growth in the UT (Shen et al., 2024; Curtius et al., 2024). Implementing the IPSOA scheme with a high mass yield of 30 % (in the SA-NH3-IPSOA×10 simulation) significantly improves the agreement, increasing the model-to-ATom ratio for organic aerosol mass in the UT to 0.86. The inclusion of the IPSOA scheme results in the largest enhancements in accumulation mode aerosol concentrations above tropical rainforests (Fig. 13), a finding consistent with satellite observations (Palmer et al., 2022). It is worth highlighting that the impact of including IPSOA stretches beyond the tropical UT, extending to the mid- and high-latitude UT. This demonstrates that the long lifetime of aerosols in the UT allows them to be transported over great distances, thereby exerting a global impact. Addressing this missing organic aerosol component, and thereby the underestimated accumulation mode aerosol concentrations in the UT, is crucial for improving the model's representation of ice nucleating particles and cirrus cloud formation, which in turn affects the Earth's longwave radiation balance.
Once again, changing the chemistry scheme from Strat-Trop to CS2 has a large impact on the modelled agreement for Aitken and accumulation mode aerosols in the UT (Fig. 13). The reduction in SO2 concentrations in the SA-NH3-CS2 simulation is the clear cause of the reduction in these aerosol populations, as can be seen in Fig. 2. This is also supported by the aerosol composition analysis, which shows a corresponding reduction in the sulfate aerosol mass bias, with insignificant changes in other aerosol components (Fig. 10).
4.3 Recommendations for future model improvements
The evaluation of UKESM against ATom observations in this study has identified several key areas for improving the model's representation of aerosol microphysics and chemistry in the marine atmosphere. These involve primary aerosol emissions, precursor vapours, nucleation and growth processes, and aerosol chemical composition. While each evaluated parameter has its own specific bias and uncertainties, the two main trends are (1) the overestimated aerosol mass and precursor gasses and (2) the underrepresented aerosol number. This indicates that the airborne aerosol formation rates are underestimated in the UKESM.
Many of the airborne aerosol formation mechanisms are essentially missing in the model, which requires extensive efforts to implement and evaluate these processes. Several candidate mechanisms have been proposed in the literature. The first and most prominent candidate is iodine oxoacids (iodic acid, HIO3, and iodous acid, HIO2), which are widely acknowledged as important for aerosol nucleation in the MBL. Iodine oxoacids are ubiquitously measured in the global atmosphere, from pristine marine to polluted urban environments (Beck et al., 2021; He et al., 2021b, 2023; Zhang et al., 2024). Depending on the location and season, the concentrations of iodine oxoacids are often comparable to (within one order of magnitude of) or can even exceed those of H2SO4. Dedicated laboratory experiments have revealed that on a per-molecule basis, iodine oxoacids are significantly more efficient than H2SO4 at forming new particles (He et al., 2021b). Furthermore, when iodine oxoacids are mixed with H2SO4 and NH3, the synergistic aerosol nucleation of the sulfur-iodine system is even more efficient than any of the individual components alone (He et al., 2023). A recent global model study has also shown that the inclusion of iodine oxoacids significantly improved modelled aerosol number concentrations in the MBL (Zhao et al., 2024), although the parameterisation used in that study was mostly a fit to experimental data of He et al. (2021b) and did not include the synergistic effects of the sulfur-iodine system (He et al., 2023). It is worth noting that while Zhao et al. (2024) suggested that iodine oxoacid-driven aerosol nucleation has a negligible impact above the MBL due to rapid scavenging of iodine species in the MBL, ambient observations suggest the widespread presence of iodine compounds throughout the troposphere, including the UT (Koenig et al., 2020; He et al., 2021b, 2023; Schill et al., 2025). This discrepancy is likely due to the absence of halogen recycling mechanisms in the model used by Zhao et al. (2024).
The second candidate mechanism is nucleation involving atmospheric amines, which have been shown to have strong synergistic effects with H2SO4 (Almeida et al., 2013). Sporadic ambient observations of the participation of amines in aerosol nucleation have been reported, for example, near the Antarctic Peninsula (Brean et al., 2021). However, direct measurements of nucleating cluster ions in polar regions typically show a stronger participation of NH3 rather than amines (Beck et al., 2021; Jokinen et al., 2018), and the global relevance of amines in marine aerosol nucleation is yet to be determined. Global simulations along the ATom flight paths have also suggested a minor contribution of amines to aerosol nucleation in the MBL (Zhao et al., 2024).
The third candidate mechanism is airborne aerosol formation from organic vapours, such as monoterpenes and isoprene, or their synergistic nucleation with inorganic acids (e.g. H2SO4 and iodine oxoacids). Unfortunately, the role of organic vapours in MBL aerosol nucleation remains highly debated, as their marine source strength and subsequent atmospheric concentrations are highly uncertain. For example, Luo and Yu (2010) estimated that global oceanic emissions of α-pinene and isoprene using bottom-up estimates are 0.013 and 0.32 Tg C yr−1, respectively, significantly lower than oceanic DMS emissions. However, the same study reported that using a top-down approach (forcing the model to match observed organic concentrations) resulted in much higher global emissions of 29.5 Tg C yr−1 for α-pinene and 11.6 Tg C yr−1 for isoprene, values comparable to global oceanic DMS emissions. More recent in-situ measurements of monoterpenes in the Arctic and Atlantic Oceans suggest concentrations below 5 pptv, supporting an estimated global marine monoterpene emission of 0.16 Tg C yr−1 (Hackenberg et al., 2017), which aligns better with the bottom-up estimate of Luo and Yu (2010). Therefore, further constraining marine organic vapour emissions is needed to better represent the role of organic vapours in new particle formation in the MBL. On the other hand, in the UT, the role of isoprene derivatives in new particle formation is unambiguous as reported in Shen et al. (2024); Curtius et al. (2024). The long range transport of the formed aerosols will affect the aerosol populations in the marine atmosphere.
Finally, we outline some of the most important recommendations. While not exhaustive, they provide a solid foundation for future model development efforts.
-
Re-evaluate primary aerosol emissions in the MBL with a focus on seasalt and organics.
-
Re-evaluate the aerosol deposition schemes in the model.
-
Re-evaluate the marine NH3 emission inventory and investigate the bias in the atmospheric NH3 budget both in the gas phase and in aerosols ().
-
Investigate and improve the representation of OH in the atmosphere, especially in the Southern Hemisphere.
-
Improve the atmospheric DMS chemistry scheme as well as the DMS emissions, particularly in the Southern Ocean, where the model currently overestimates DMS emissions.
-
Implement comprehensive halogen chemistry in the model with a focus on representing iodine chemistry and iodine oxoacid production.
-
Implement the iodine oxoacid new particle formation mechanism in the model, together with the synergistic effects of sulfur-iodine aerosol nucleation, to improve the representation of new particle formation in the MBL.
-
Implement experimentally verified MSA condensation scheme in the model.
-
Improve model treatment of organic oxidation pathways, especially in the upper troposphere.
-
Implement the isoprene new particle formation mechanism in the model, together with the synergistic aerosol nucleation of isoprene derivatives with H2SO4 and iodine oxoacids, to improve the representation of new particle formation in the upper troposphere.
It should be noted that the need to implement new aerosol formation schemes is not unique to UKESM; other Earth system model evaluation studies, such as those using EC-Earth3, have reached similar conclusion (Svenhag et al., 2024). While implementing these comprehensive chemical and microphysical pathways will increase the computational demand on the model's chemical solver, such developments are essential for capturing the true sensitivity of the climate to aerosols. Once these full mechanisms are implemented and validated, they can be systematically simplified or parameterised based on their performance to reduce the computational burden for long-term climate simulations without sacrificing significant accuracy, for the eventual CMIP implementations.
This study provides a detailed evaluation of the United Kingdom Earth System Model version 1.1 (UKESM1.1), using observations from the Atmospheric Tomography (ATom) mission to examine parameters relevant to the aerosol lifecycle in the remote marine atmosphere. By comparing model outputs with measurements of precursor vapours, aerosol number size distributions, and aerosol chemical composition, we identify several key shortcomings in current model's representation of aerosol microphysics and chemistry, and offer targeted recommendations for future development.
Our analysis highlights two contrasting biases in UKESM1.1's treatment of aerosols in the marine boundary layer. The default model overestimates primary submicron seasalt, while underrepresenting airborne aerosol formation processes. At the same time, the model underestimates nucleation and Aitken mode aerosols, with model-to-ATom ratios down to 0.09 and 0.57, respectively. This imbalance suggests that the current cloud condensation nuclei budget in the model is overly reliant on primary emissions, potentially misrepresenting the importance of airborne aerosol formation processes that are likely important in pristine marine regions.
In contrast, the model exhibits an opposite bias in the upper troposphere, generating excessive nucleation and Aitken mode aerosols due to the default H2SO4–H2O nucleation scheme, but failing to grow them efficiently to accumulation mode sizes relevant for ice cloud formation.
To address these problems, we implement a H2SO4–NH3 nucleation scheme alongside an ammonium nitrate module developed by Jones et al. (2021). This update partly improves performance in simulating aerosol number size distributions in the upper troposphere but does little to resolve the discrepancies in the MBL. The continued underprediction of small aerosols in the MBL – despite substantial overestimation of precursors such as SO2, OH, and NH3 – strongly suggest that the model's representation of airborne aerosol formation processes is incomplete.
Incorporating additional condensable vapours such as isoprene oxidation products, improves the model simulations in the upper troposphere. A modified isoprene secondary organic aerosol scheme with enhanced yields improves observed organic aerosol concentrations in the upper troposphere, consistent with emerging evidence that low temperature isoprene oxidation significantly contributes to aerosol formation and growth aloft (Shen et al., 2024; Curtius et al., 2024). The implemented methanesulfonic acid condensation scheme increases particle mass and alters the particle number size distribution; however, its quantitative impact remains uncertain pending more accurate experimental constraints.
Additionally, the model simulations in this study indicate that the concentrations of cloud condensation nuclei (CCN)-active Aitken and accumulation mode aerosols in the MBL are significantly influenced not only by the implemented aerosol nucleation and growth schemes but also by the emission mechanisms for precursor vapours, and the adopted atmospheric chemistry mechanisms. For instance, switching from the interactive DMS emission scheme to the Lana et al. (2011) climatology resulted in substantial changes to both Aitken and accumulation mode aerosol distributions, with reductions south of 30° S and enhancements in tropical regions. Changing the chemistry scheme from Strat-Trop to CRI-Strat2 leads to significant reductions in SO2 concentrations, which in turn affects aerosol nucleation rates and size distributions throughout the marine atmosphere. These sensitivity tests demonstrate that achieving accurate CCN predictions requires not only mechanistically sound aerosol nucleation and growth parameterisations, but also reliable representations of precursor emissions and their atmospheric transformation pathways. The interconnected nature of these processes means that improvements in one area can be offset by deficiencies in another, highlighting the need for comprehensive, process-based model development rather than isolated parameter adjustments.
These findings carry important implications for climate modelling. The tendency to overestimate primary submicron seasalt in the MBL suggests that the default UKESM1.1 might underestimate the role of anthropogenic aerosol sources from e.g. SO2 in shaping present-day CCN populations. Furthermore, the absence of key natural airborne aerosol formation pathways in the model, potentially involving iodine oxoacids, organic vapours, or their interactions with H2SO4, also contributes to both the preindustrial and present day CCN populations in the atmosphere. These factors could skew estimates of preindustrial aerosol baselines and the strength of aerosol–cloud interactions.
Our results underscore the need to incorporate comprehensive halogen chemistry, especially iodine-related aerosol nucleation mechanisms, which are increasingly recognised in both laboratory and field studies as major contributors to marine aerosol formation. Enhancing model treatments of organic aerosol sources and their oxidation pathways is also essential, particularly for the upper troposphere, where long range transport of isoprene-derived aerosols can shape aerosol populations on a global scale.
Looking ahead, model improvement efforts should prioritise process-based improvement over empirical tuning. The long-lasting uncertainties in aerosol forcing, despite decades of model development, highlight the limitations of ad-hoc adjustments and point to the importance of mechanistic understanding. Capturing the underlying physics and chemistry of aerosol processes is one of the prerequisites for building models capable of producing robust climate projections and informing effective mitigation strategies.
The ATom dataset offers a powerful benchmark for advancing this work, but fully leveraging its value will require sustained investment in experimental research. Laboratory studies of nucleation chemistry and targeted field campaigns are particularly needed to resolve the complex pathways governing natural aerosol formation. As anthropogenic sulfur emissions continue to decline, accurately representing these natural processes will become even more crucial for predicting future climate trajectories.
Table A1Model-to-ATom median ratios for environmental conditions, precursor vapours, aerosol number size distributions, and chemical composition between 2–8 km altitude. Ratios are calculated using all available ATom data between 2–8 km for comparison with different UKESM1.1 configurations implementing various SA (sulfuric acid)-based nucleation schemes (see Table 2 for simulation details). The median values are calculated from the point-by-point model-to-ATom ratios (i.e. the ratio is computed at each location or time point, followed by taking the median), and therefore do not necessarily equal the ratio of the median model value to the median ATom value. Values greater than 1 indicate model overestimation, while values less than 1 indicate model underestimation relative to ATom observations. Environmental conditions include T, RH, and CS of dry aerosols. Precursor vapours include DMS, SO2, NH3, O3, and OH. Aerosol number concentrations are reported for nucleation (dry diameter < 10 nm), Aitken (10–100 nm), accumulation (100–1000 nm), and coarse (1000–10 000 nm) modes, along with total number concentration. Chemical composition includes sulfate, organic matter, ammonium, nitrate, and seasalt mass concentrations, with total mass representing their sum. Missing values indicate that ammonium and nitrate components are not included in simulations without the ammonium nitrate scheme (SA-H2O[default] and SA-NH3-noNit). The extreme values in the NH3 ratios result from extremely low NH3 concentrations inferred from aerosol acidity, as NH3 is virtually absent in the specified region.
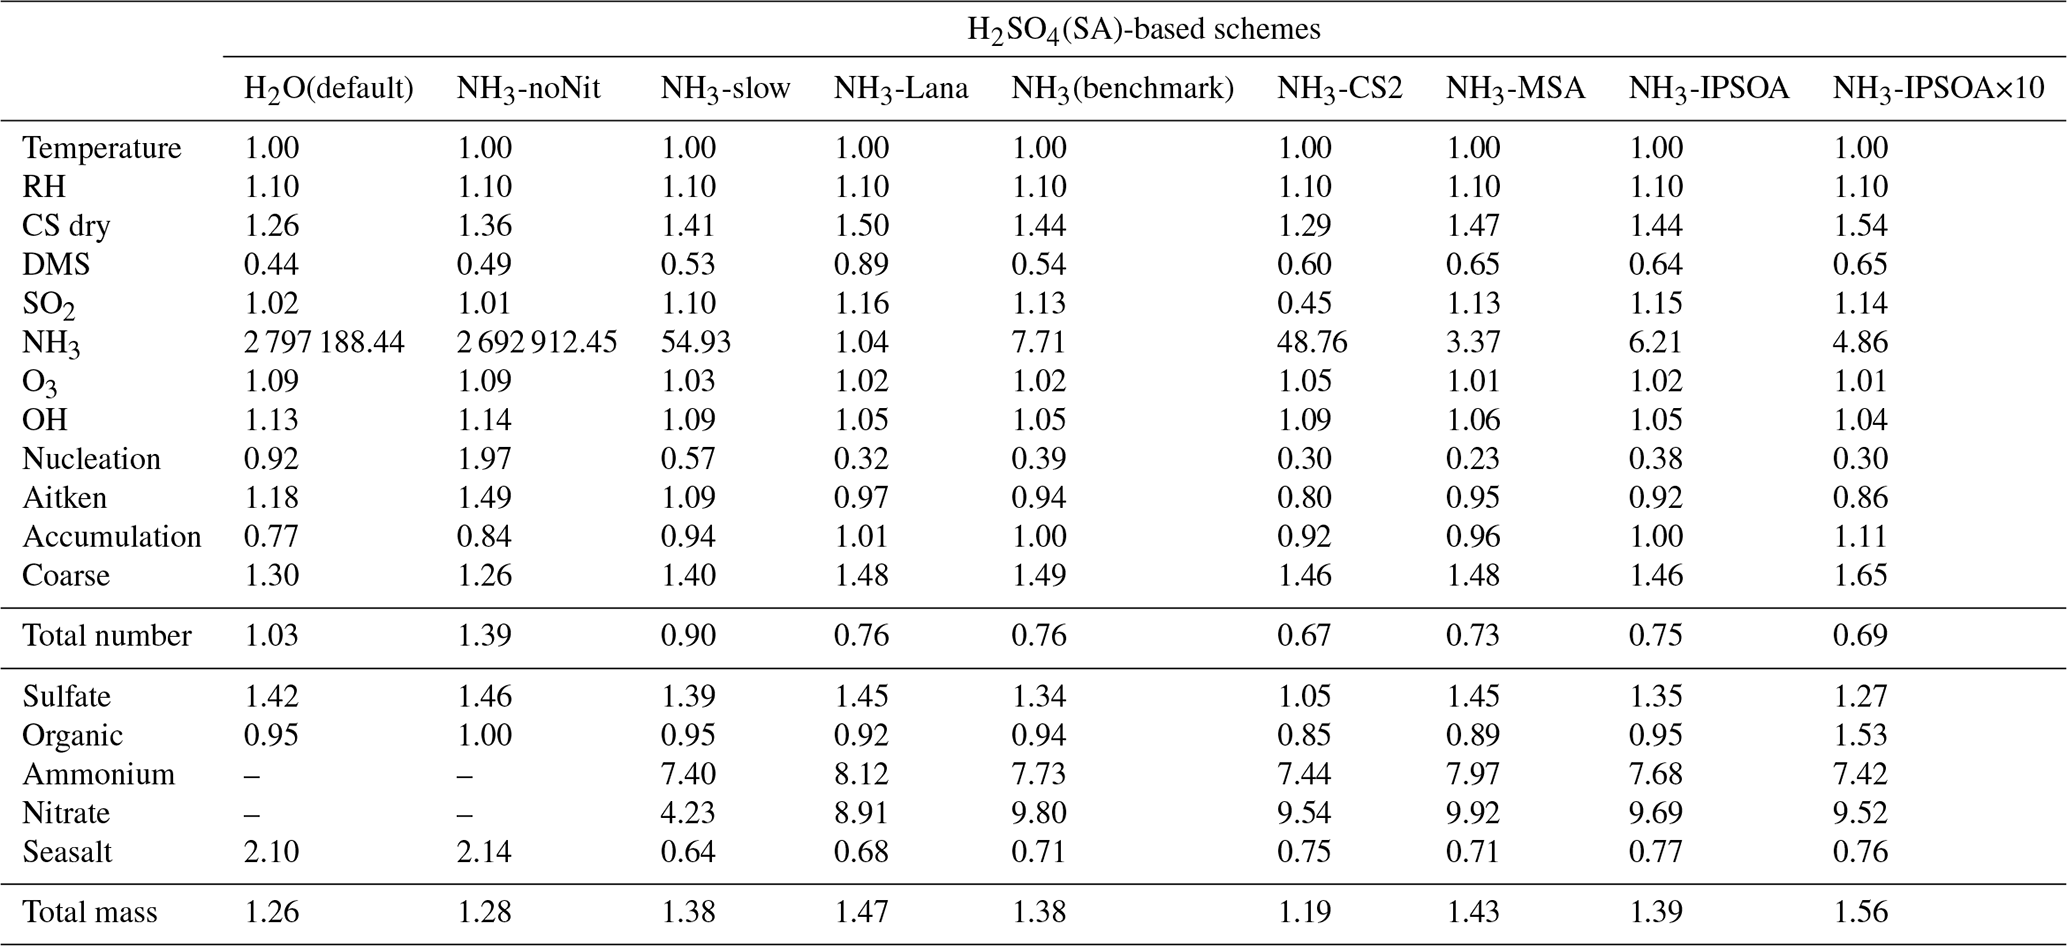
Table A2Model-to-ATom median ratios for environmental conditions, precursor vapours, aerosol number size distributions, and chemical composition in upper troposphere (8–12 km altitude). Ratios are calculated using all available ATom data between 8–12 km for comparison with different UKESM1.1 configurations implementing various SA (sulfuric acid)-based nucleation schemes (see Table 2 for simulation details). The median values are calculated from the point-by-point model-to-ATom ratios (i.e. the ratio is computed at each location or time point, followed by taking the median), and therefore do not necessarily equal the ratio of the median model value to the median ATom value. Values greater than 1 indicate model overestimation, while values less than 1 indicate model underestimation relative to ATom observations. Environmental conditions include T, RH, and CS of dry aerosols. Precursor vapours include DMS, SO2, NH3, O3, and OH. Aerosol number concentrations are reported for nucleation (dry diameter < 10 nm), Aitken (10–100 nm), accumulation (100–1000 nm), and coarse (1000–10 000 nm) modes, along with total number concentration. Chemical composition includes sulfate, organic matter, ammonium, nitrate, and seasalt mass concentrations, with total mass representing their sum. Missing values indicate that ammonium and nitrate components are not included in simulations without the ammonium nitrate scheme (SA-H2O[default] and SA-NH3-noNit). The extreme values in the NH3 ratios result from extremely low NH3 concentrations inferred from aerosol acidity, as NH3 is virtually absent in the specified region.
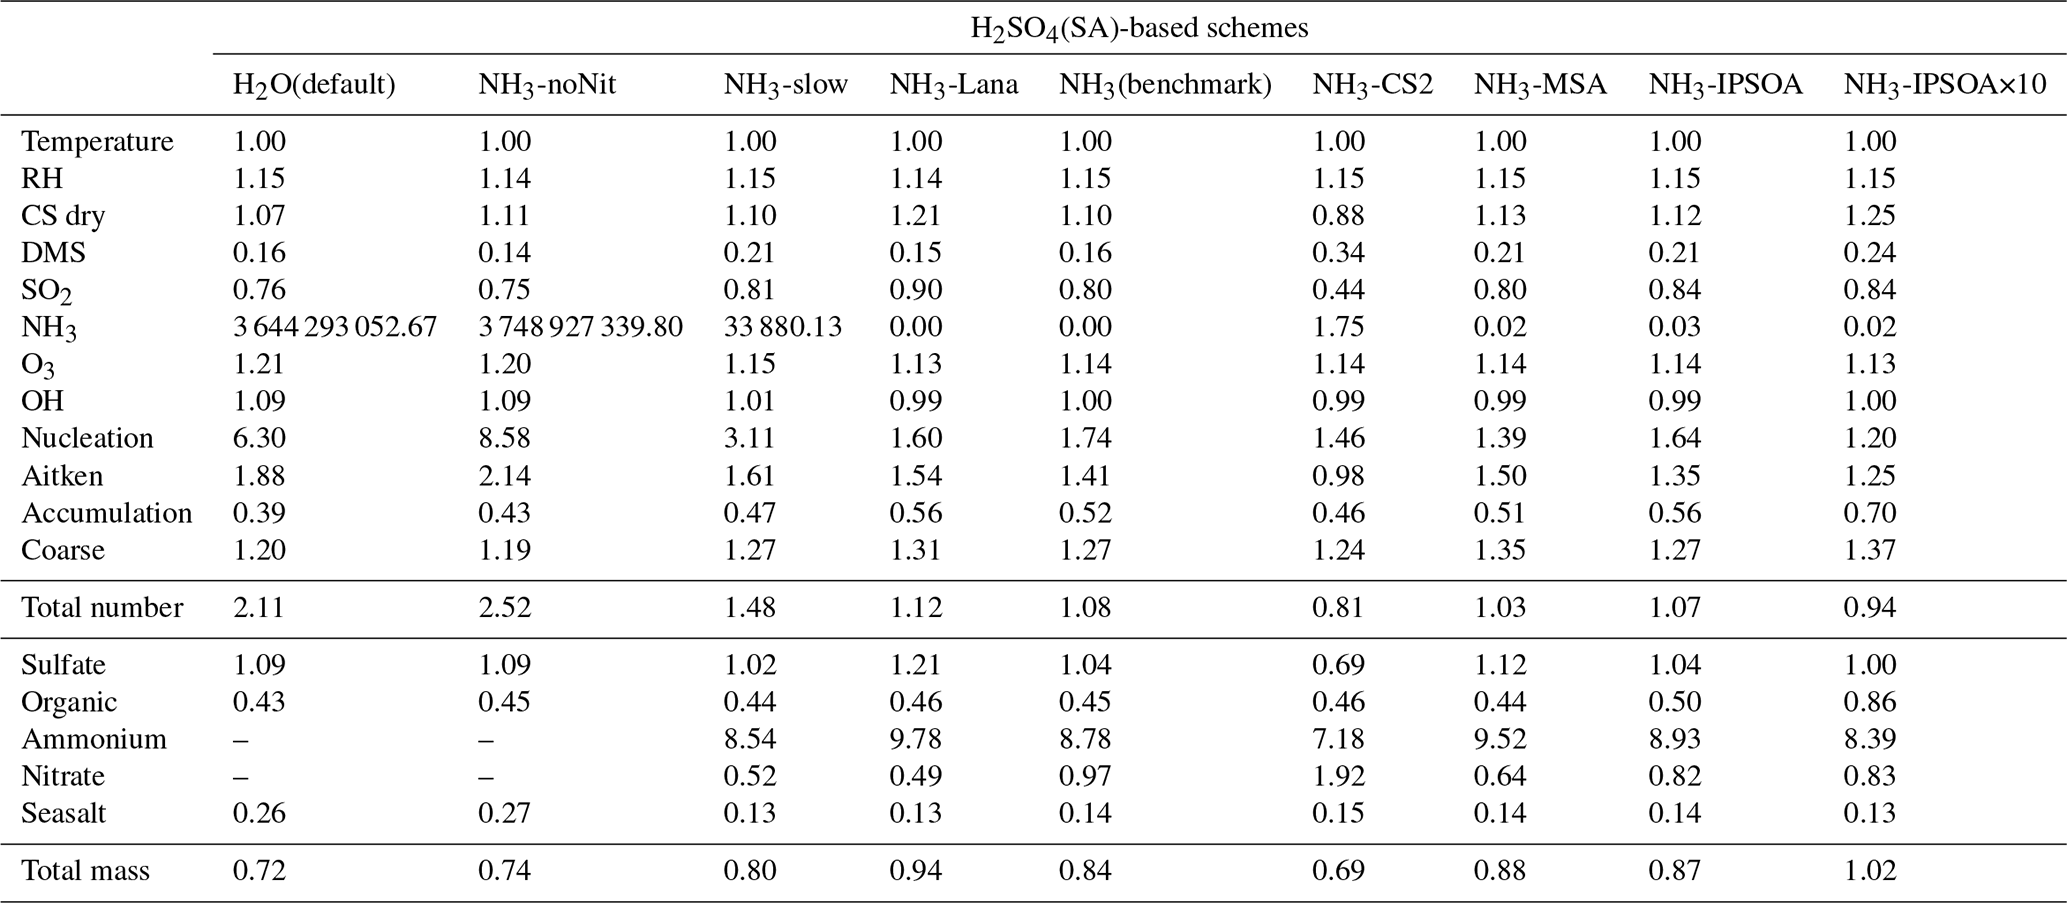
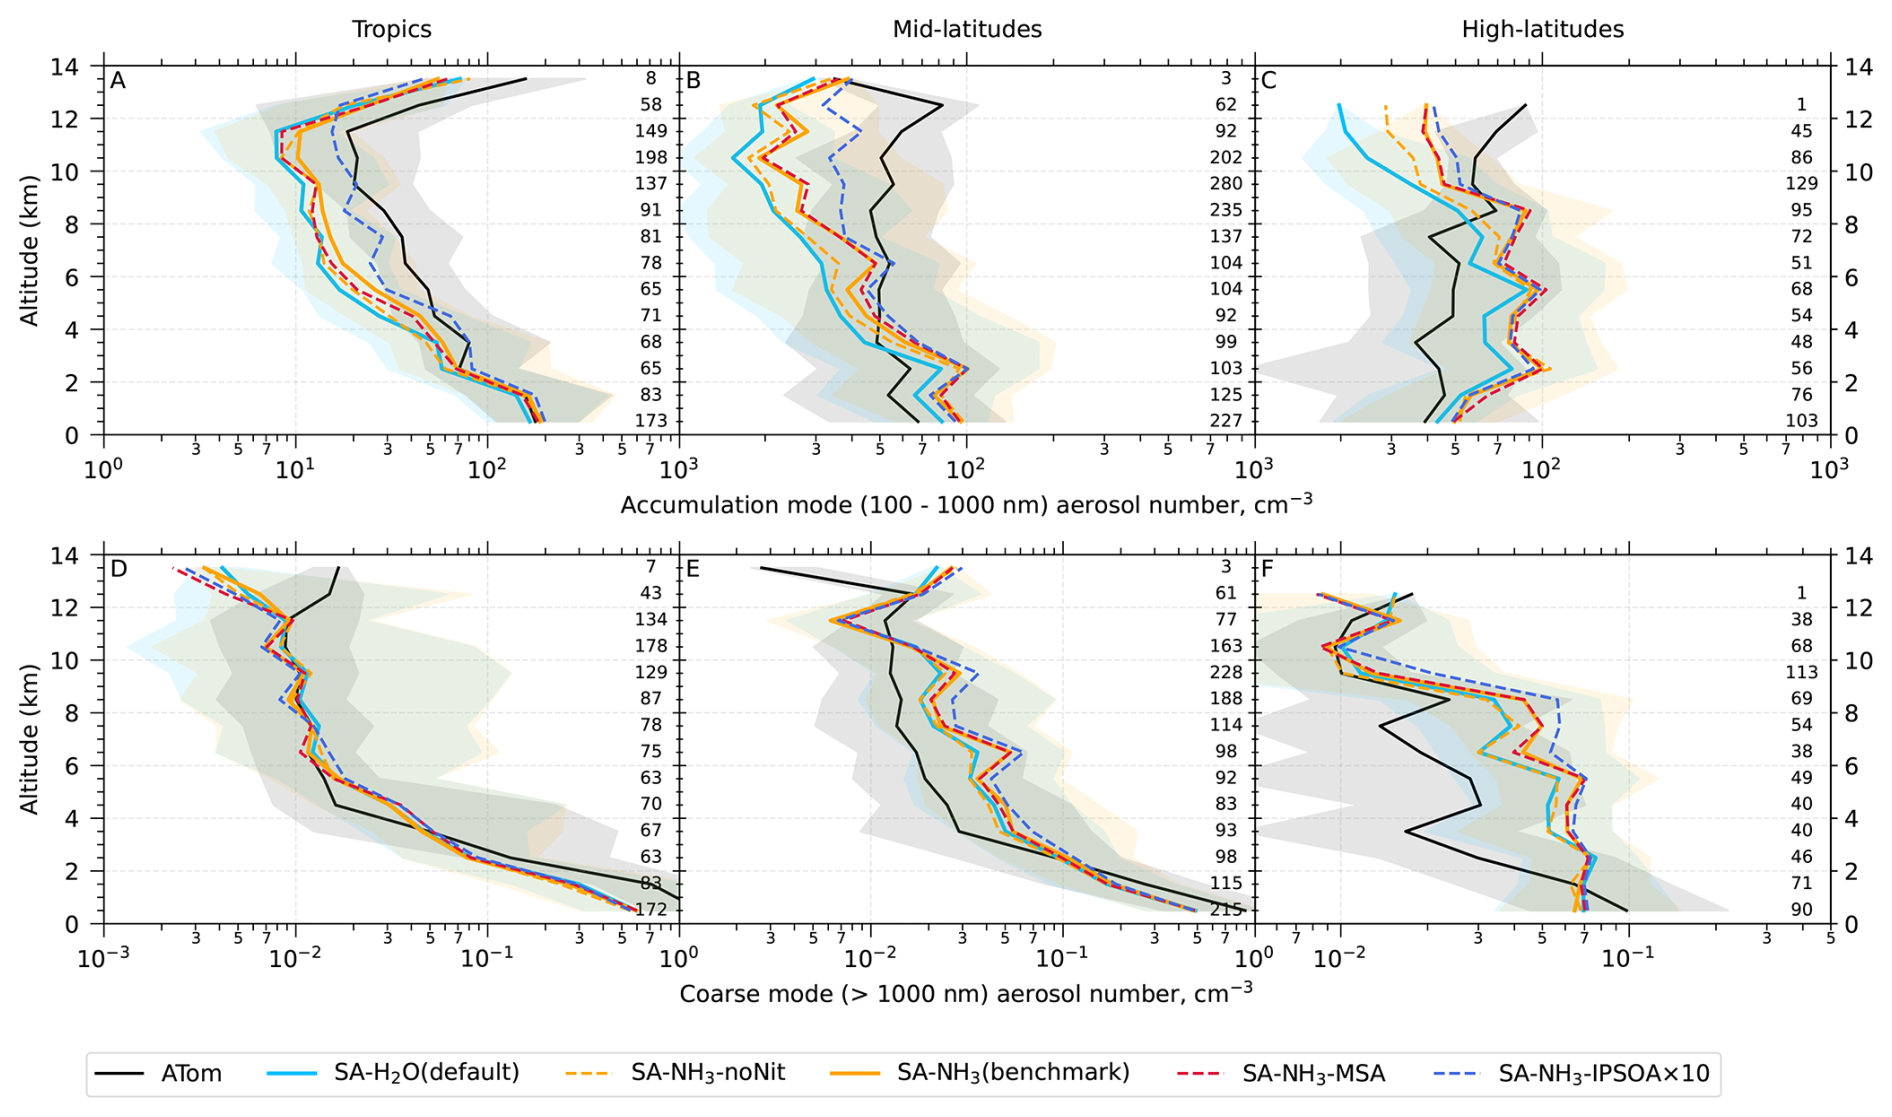
Figure A1Vertical profiles of accumulation mode (100–1000 nm) and coarse mode (1000–10 000) aerosol number concentrations. ATom observations (black lines) and selected model simulations (coloured lines; see Table 2 for simulation details) are presented. Median values are shown for accumulation mode aerosols in the tropics (A, 25° S to 25° N), mid-latitudes (B, 25–60° N/S), and high-latitudes (C, 60–90° N/S), and for coarse mode aerosols in the tropics (D), mid-latitudes (E), and high-latitudes (F). Shaded areas for solid lines represent the interquartile range (25th to 75th percentiles) for both ATom observations and model simulations, indicating the variability in aerosol concentrations. Numbers on the right edge of each panel show the sample size used to calculate median values for each altitude bin at 5 min temporal resolution.
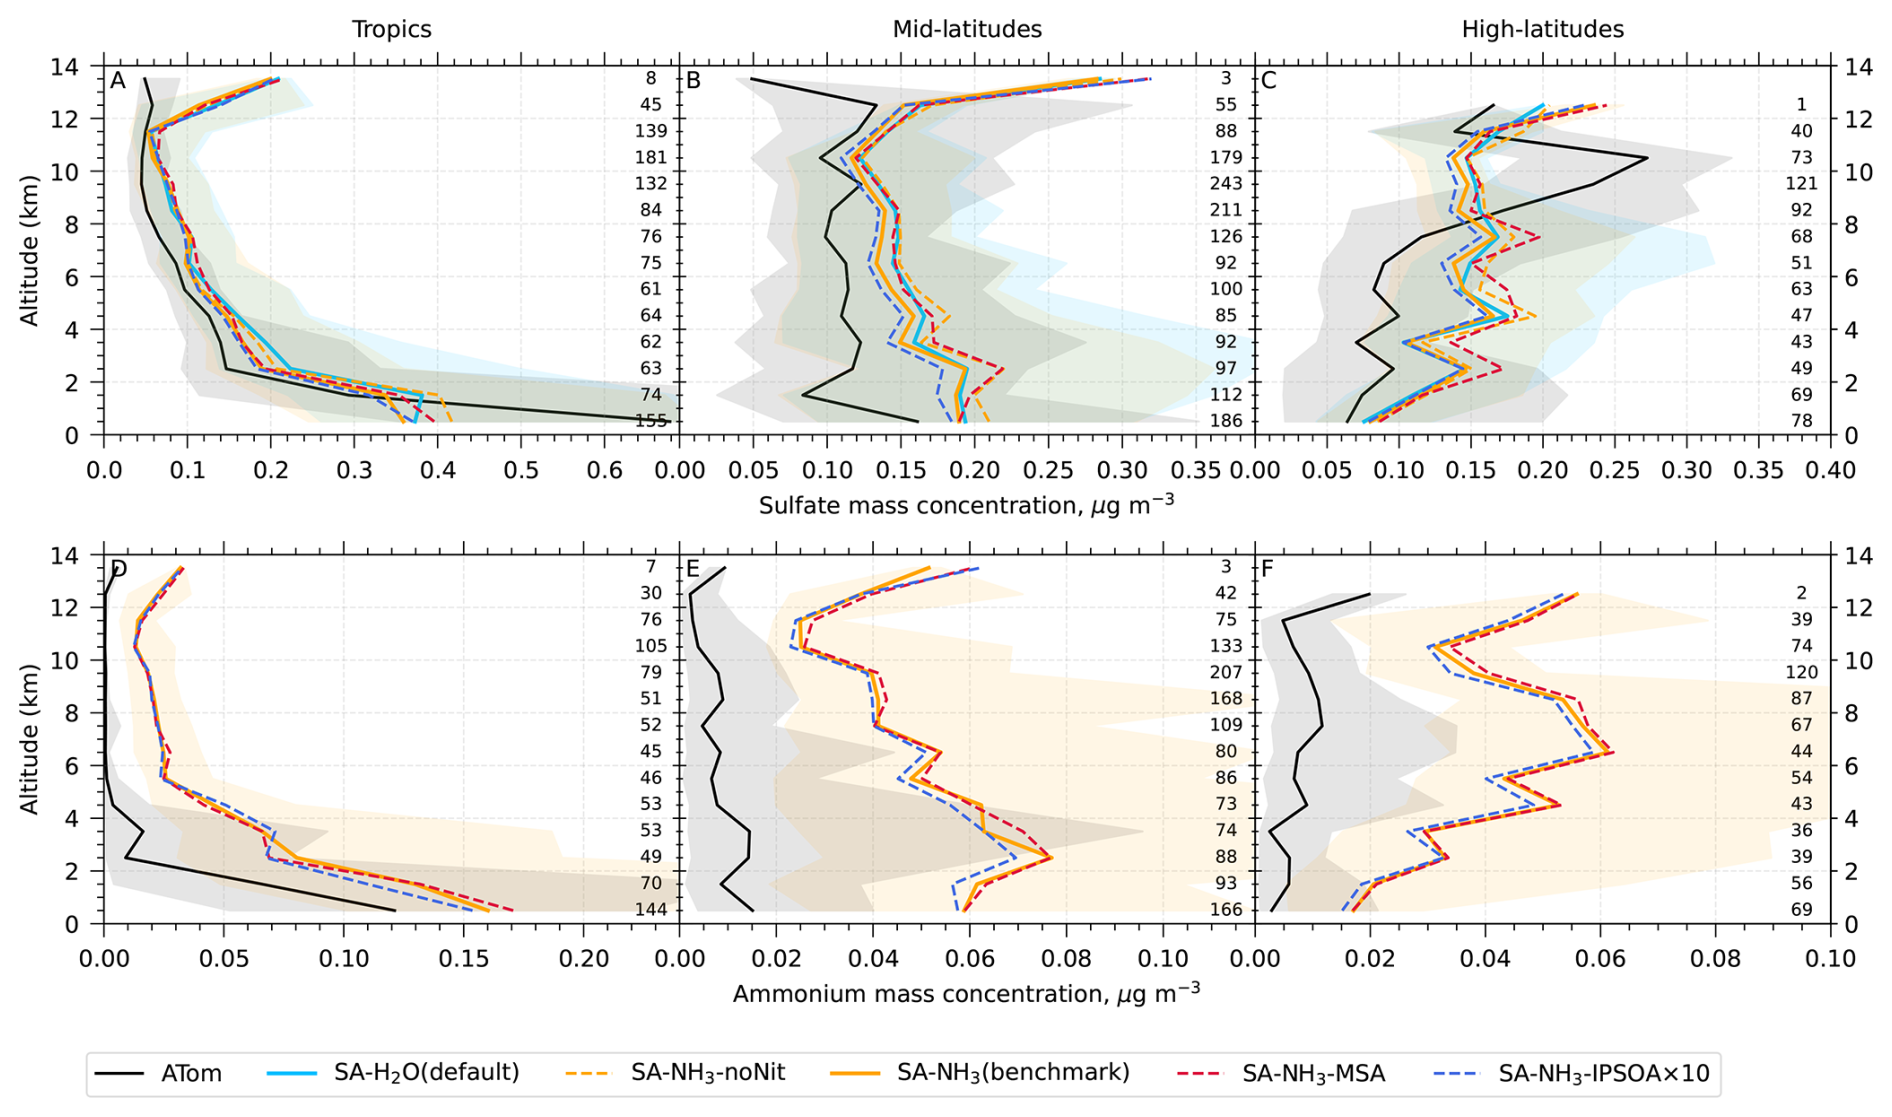
Figure A2Vertical profiles of sulfate and ammonium mass concentrations in particles smaller than 1 µm (µg m−3). ATom observations (black lines) and selected model simulations (coloured lines; see Table 2 for simulation details) are presented. Median values are shown for sulfate mass concentrations in the tropics (A, 25° S to 25° N), mid-latitudes (B, 25–60° N/S), and high-latitudes (C, 60–90° N/S), and for ammonium mass concentrations in the tropics (D), mid-latitudes (E), and high-latitudes (F). Shaded areas for solid lines represent the interquartile range (25th to 75th percentiles) for both ATom observations and model simulations, indicating the variability in aerosol concentrations. Numbers on the right edge of each panel show the sample size used to calculate median values for each altitude bin at 5 min temporal resolution.
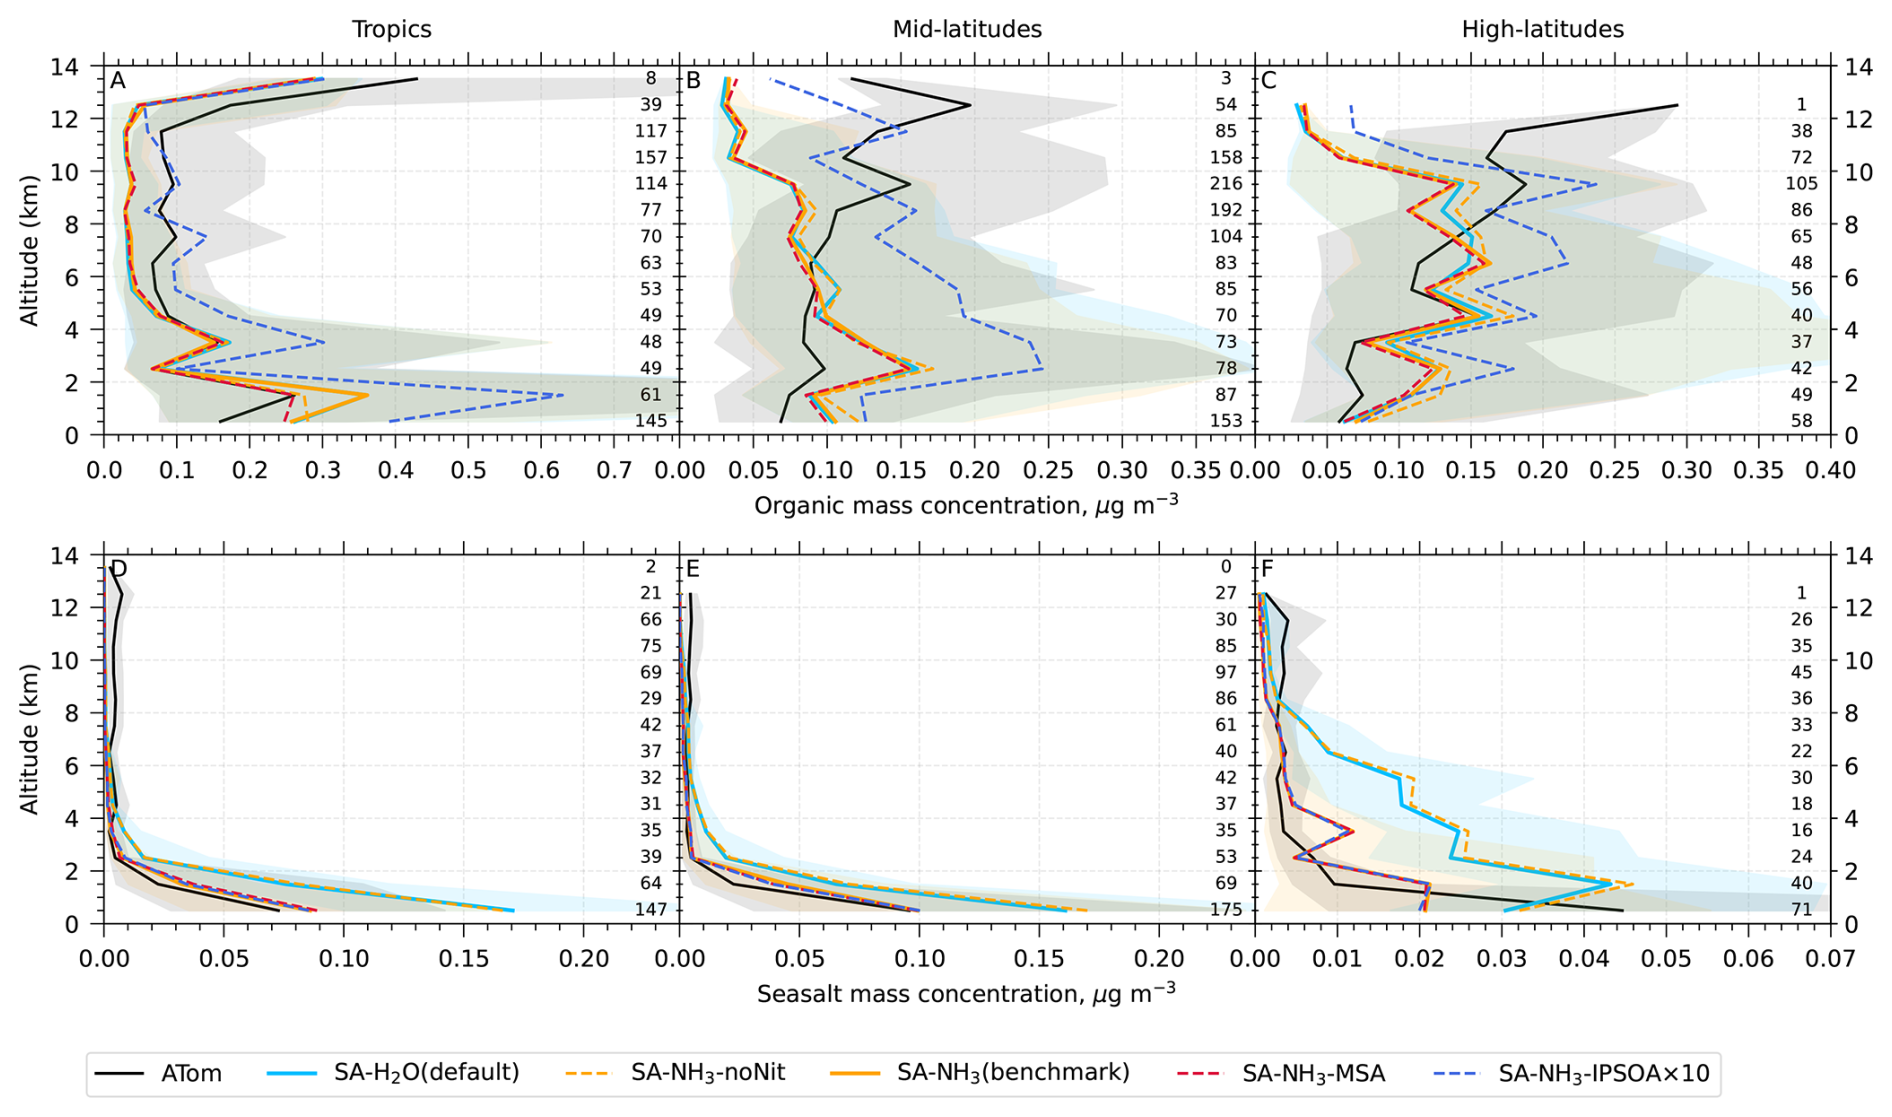
Figure A3Vertical profiles of organic and seasalt mass concentrations in particles smaller than 1 µm (µg m−3). ATom observations (black lines) and selected model simulations (coloured lines; see Table 2 for simulation details) are presented. Median values are shown for organic mass concentrations in the tropics (A, 25° S to 25° N), mid-latitudes (B, 25–60° N/S), and high-latitudes (C, 60–90° N/S), and for seasalt mass concentrations in the tropics (D), mid-latitudes (E), and high-latitudes (F). Shaded areas for solid lines represent the interquartile range (25th to 75th percentiles) for both ATom observations and model simulations, indicating the variability in aerosol concentrations. Numbers on the right edge of each panel show the sample size used to calculate median values for each altitude bin at 5 min temporal resolution.
The ATom aerosol number size distribution measurements are publicly accessible at https://doi.org/10.3334/ORNLDAAC/2111 (Brock et al., 2022). The ATom atmospheric trace gas measurements are archived at https://doi.org/10.3334/ORNLDAAC/1925 (Wofsy et al., 2021). ATom aerosol composition measurements are also available at https://doi.org/10.3334/ORNLDAAC/1925 (Wofsy et al., 2021); however, the specific dataset utilised in this study, together with the real-time transmission correction curve, was provided by Pedro Campuzano-Jost and Jose L. Jimenez. The integrated 5 min-resolution dataset, combining collocated UKESM1.1 model output with subsampled ATom observational data, along with the maps, are deposited in the Zenodo repository (https://doi.org/10.5281/zenodo.18815332; He, 2026). Additional UKESM1.1 model output is available from Xu-Cheng He upon reasonable request.
X-CH, NLA, ATA, and HG conceived this study. NLA and ATA provided the computational environment and resources on ARCHER2 and H.G. on Bridges-2. X-CH, HD, XW, JW, and HG carried out model development and module incorporation. HD, HG, and X-CH implemented the sulfuric acid-ammonia new particle formation parameterisation into the UKESM. X-CH, JW, XW, and HG carried out all other model developments and module incorporations. Additionally, PC-J, BN, AK, DB, JLJ, and CJW provided ATom observational data. X-CH carried out data analysis and wrote the manuscript. All authors have commented and edited the manuscript.
At least one of the (co-)authors is a member of the editorial board of Atmospheric Chemistry and Physics. The peer-review process was guided by an independent editor, and the authors also have no other competing interests to declare.
Publisher's note: Copernicus Publications remains neutral with regard to jurisdictional claims made in the text, published maps, institutional affiliations, or any other geographical representation in this paper. The authors bear the ultimate responsibility for providing appropriate place names. Views expressed in the text are those of the authors and do not necessarily reflect the views of the publisher.
This work used the ARCHER2 UK National Supercomputing Service. This work used the Bridges-2 machine at the Pittsburgh Supercomputing Center (PSC) through allocation atm200005p from the Advanced Cyberinfrastructure Coordination Ecosystem: Services and Support (ACCESS) program, which is supported by National Science Foundation grants no. 2138259, 2138286, 2138307, 2137603, and 2138296. We thank Kenneth S. Carslaw for insightful discussions on the sulfuric acid – ammonia aerosol nucleation mechanism. We additionally thank Charles A. Brock, William H. Brune, Thomas B. Ryerson, Alexander B. Thames, Chelsea R. Thompson, and Steven C. Wofsy for providing data directly relevant to this study, and extend our gratitude to the entire ATom team for their extraordinary work in collecting and curating these invaluable atmospheric measurements.
Xu-Cheng He received support from Research Council of Finland grant no. 359331, 349659, 371185. Hamish Gordon and Han Ding received support from the NASA ROSES program via grant no. 80NSSC19K0949, and Hamish Gordon additionally received support from the US Department of Energy Atmospheric System Research program via grant no. DE-SC-0022227. Alexander T. Archibald acknowledges Natural Environment Research Council CARES project no. NE/W009412/1. Nathan Luke Abraham and Maria R. Russo thank Natural Environment Research Council for financial support through the VISION project, NE/Z503393/1. Donald Blake received support from NASA grant no. NNX15AJ91A. Pedro Campuzano-Jost, Benjamin Nault, and Jose L. Jimenez are supported by NASA grant no. 80NSSC21K1451 and 80NSSC23K0828.
This paper was edited by Fangqun Yu and reviewed by two anonymous referees.
Almeida, J., Schobesberger, S., Kürten, A., Ortega, I. K., Kupiainen-Määttä, O., Praplan, A. P., Adamov, A., Amorim, A., Bianchi, F., Breitenlechner, M., David, A., Dommen, J., Donahue, N. M., Downard, A., Dunne, E., Duplissy, J., Ehrhart, S., Flagan, R. C., Franchin, A., Guida, R., Hakala, J., Hansel, A., Heinritzi, M., Henschel, H., Jokinen, T., Junninen, H., Kajos, M., Kangasluoma, J., Keskinen, H., Kupc, A., Kurtén, T., Kvashin, A. N., Laaksonen, A., Lehtipalo, K., Leiminger, M., Leppä, J., Loukonen, V., Makhmutov, V., Mathot, S., McGrath, M. J., Nieminen, T., Olenius, T., Onnela, A., Petäjä, T., Riccobono, F., Riipinen, I., Rissanen, M., Rondo, L., Ruuskanen, T., Santos, F. D., Sarnela, N., Schallhart, S., Schnitzhofer, R., Seinfeld, J. H., Simon, M., Sipilä, M., Stozhkov, Y., Stratmann, F., Tomé, A., Tröstl, J., Tsagkogeorgas, G., Vaattovaara, P., Viisanen, Y., Virtanen, A., Vrtala, A., Wagner, P. E., Weingartner, E., Wex, H., Williamson, C., Wimmer, D., Ye, P., Yli-Juuti, T., Carslaw, K. S., Kulmala, M., Curtius, J., Baltensperger, U., Worsnop, D. R., Vehkamäki, H., and Kirkby, J.: Molecular Understanding of Sulphuric Acid–Amine Particle Nucleation in the Atmosphere, Nature, 502, 359–363, https://doi.org/10.1038/nature12663, 2013. a, b, c
Anderson, T., Spall, S., Yool, A., Cipollini, P., Challenor, P., and Fasham, M.: Global Fields of Sea Surface Dimethylsulfide Predicted from Chlorophyll, Nutrients and Light, J. Marine Syst., 30, 1–20, https://doi.org/10.1016/S0924-7963(01)00028-8, 2001. a
Andreae, M. O., Afchine, A., Albrecht, R., Holanda, B. A., Artaxo, P., Barbosa, H. M. J., Borrmann, S., Cecchini, M. A., Costa, A., Dollner, M., Fütterer, D., Järvinen, E., Jurkat, T., Klimach, T., Konemann, T., Knote, C., Krämer, M., Krisna, T., Machado, L. A. T., Mertes, S., Minikin, A., Pöhlker, C., Pöhlker, M. L., Pöschl, U., Rosenfeld, D., Sauer, D., Schlager, H., Schnaiter, M., Schneider, J., Schulz, C., Spanu, A., Sperling, V. B., Voigt, C., Walser, A., Wang, J., Weinzierl, B., Wendisch, M., and Ziereis, H.: Aerosol characteristics and particle production in the upper troposphere over the Amazon Basin, Atmos. Chem. Phys., 18, 921–961, https://doi.org/10.5194/acp-18-921-2018, 2018. a
Archer-Nicholls, S., Abraham, N. L., Shin, Y. M., Weber, J., Russo, M. R., Lowe, D., Utembe, S. R., O'Connor, F. M., Kerridge, B., Latter, B., Siddans, R., Jenkin, M., Wild, O., and Archibald, A. T.: The Common Representative Intermediates Mechanism Version 2 in the United Kingdom Chemistry and Aerosols Model, J. Adv. Model. Earth Sy., 13, e2020MS002420, https://doi.org/10.1029/2020MS002420, 2021. a, b, c, d, e
Archibald, A. T., O'Connor, F. M., Abraham, N. L., Archer-Nicholls, S., Chipperfield, M. P., Dalvi, M., Folberth, G. A., Dennison, F., Dhomse, S. S., Griffiths, P. T., Hardacre, C., Hewitt, A. J., Hill, R. S., Johnson, C. E., Keeble, J., Köhler, M. O., Morgenstern, O., Mulcahy, J. P., Ordóñez, C., Pope, R. J., Rumbold, S. T., Russo, M. R., Savage, N. H., Sellar, A., Stringer, M., Turnock, S. T., Wild, O., and Zeng, G.: Description and evaluation of the UKCA stratosphere–troposphere chemistry scheme (StratTrop vn 1.0) implemented in UKESM1, Geosci. Model Dev., 13, 1223–1266, https://doi.org/10.5194/gmd-13-1223-2020, 2020. a, b, c
Baccarini, A., Karlsson, L., Dommen, J., Duplessis, P., Vüllers, J., Brooks, I. M., Saiz-Lopez, A., Salter, M., Tjernström, M., Baltensperger, U., Zieger, P., and Schmale, J.: Frequent New Particle Formation over the High Arctic Pack Ice by Enhanced Iodine Emissions, Nat. Commun., 11, 4924, https://doi.org/10.1038/s41467-020-18551-0, 2020. a
Barnes, I., Hjorth, J., and Mihalopoulos, N.: Dimethyl Sulfide and Dimethyl Sulfoxide and Their Oxidation in the Atmosphere, Chem. Rev., 106, 940–975, https://doi.org/10.1021/cr020529+, 2006. a
Beck, L. J., Sarnela, N., Junninen, H., Hoppe, C. J. M., Garmash, O., Bianchi, F., Riva, M., Rose, C., Peräkylä, O., Wimmer, D., Kausiala, O., Jokinen, T., Ahonen, L., Mikkilä, J., Hakala, J., He, X.-C., Kontkanen, J., Wolf, K. K. E., Cappelletti, D., Mazzola, M., Traversi, R., Petroselli, C., Viola, A. P., Vitale, V., Lange, R., Massling, A., Nøjgaard, J. K., Krejci, R., Karlsson, L., Zieger, P., Jang, S., Lee, K., Vakkari, V., Lampilahti, J., Thakur, R. C., Leino, K., Kangasluoma, J., Duplissy, E.-M., Siivola, E., Marbouti, M., Tham, Y. J., Saiz-Lopez, A., Petäjä, T., Ehn, M., Worsnop, D. R., Skov, H., Kulmala, M., Kerminen, V.-M., and Sipilä, M.: Differing Mechanisms of New Particle Formation at Two Arctic Sites, Geophys. Res. Lett., 48, https://doi.org/10.1029/2020GL091334, 2021. a, b, c, d, e, f, g
Bellouin, N., Quaas, J., Gryspeerdt, E., Kinne, S., Stier, P., Watson-Parris, D., Boucher, O., Carslaw, K. S., Christensen, M., Daniau, A.-L., Dufresne, J.-L., Feingold, G., Fiedler, S., Forster, P., Gettelman, A., Haywood, J. M., Lohmann, U., Malavelle, F., Mauritsen, T., McCoy, D. T., Myhre, G., Mülmenstädt, J., Neubauer, D., Possner, A., Rugenstein, M., Sato, Y., Schulz, M., Schwartz, S. E., Sourdeval, O., Storelvmo, T., Toll, V., Winker, D., and Stevens, B.: Bounding Global Aerosol Radiative Forcing of Climate Change, Rev. Geophys., 58, https://doi.org/10.1029/2019RG000660, 2020. a
Bhatti, Y. A., Revell, L. E., Schuddeboom, A. J., McDonald, A. J., Archibald, A. T., Williams, J., Venugopal, A. U., Hardacre, C., and Behrens, E.: The sensitivity of Southern Ocean atmospheric dimethyl sulfide (DMS) to modeled oceanic DMS concentrations and emissions, Atmos. Chem. Phys., 23, 15181–15196, https://doi.org/10.5194/acp-23-15181-2023, 2023. a
Bian, H., Chin, M., Colarco, P. R., Apel, E. C., Blake, D. R., Froyd, K., Hornbrook, R. S., Jimenez, J., Jost, P. C., Lawler, M., Liu, M., Lund, M. T., Matsui, H., Nault, B. A., Penner, J. E., Rollins, A. W., Schill, G., Skeie, R. B., Wang, H., Xu, L., Zhang, K., and Zhu, J.: Observationally constrained analysis of sulfur cycle in the marine atmosphere with NASA ATom measurements and AeroCom model simulations, Atmos. Chem. Phys., 24, 1717–1741, https://doi.org/10.5194/acp-24-1717-2024, 2024. a
Brean, J., Dall'Osto, M., Simó, R., Shi, Z., Beddows, D. C. S., and Harrison, R. M.: Open Ocean and Coastal New Particle Formation from Sulfuric Acid and Amines around the Antarctic Peninsula, Nat. Geosci., 14, 383–388, https://doi.org/10.1038/s41561-021-00751-y, 2021. a, b
Brock, C., Froyd, K., Dollner, M., Williamson, C., Schill, G., Murphy, D., Wagner, N., Kupc, A., Jimenez, J., Campuzano-Jost, P., Nault, B., Schroder, J., Day, D., Price, D., Weinzierl, B., Schwarz, J., Katich, J., Wang, S., Zeng, L., Webb, R., Dibb, J., Scheuer, E., Diskin, G., DiGangi, J., Bui, T., Dean-Day, J., Thompson, C., Peischl, J., Ryerson, T., Bourgeois, I., Daube, B., Commane, R., and Wofsy, S.: ATom: Comprehensive Aerosol Properties, 2016–2018, Version 2, ORNL Distributed Active Archive Center [data set], https://doi.org/10.3334/ORNLDAAC/2111, 2022. a, b
Brock, C. A., Williamson, C., Kupc, A., Froyd, K. D., Erdesz, F., Wagner, N., Richardson, M., Schwarz, J. P., Gao, R.-S., Katich, J. M., Campuzano-Jost, P., Nault, B. A., Schroder, J. C., Jimenez, J. L., Weinzierl, B., Dollner, M., Bui, T., and Murphy, D. M.: Aerosol size distributions during the Atmospheric Tomography Mission (ATom): methods, uncertainties, and data products, Atmos. Meas. Tech., 12, 3081–3099, https://doi.org/10.5194/amt-12-3081-2019, 2019. a, b, c, d, e, f, g
Brock, C. A., Froyd, K. D., Dollner, M., Williamson, C. J., Schill, G., Murphy, D. M., Wagner, N. J., Kupc, A., Jimenez, J. L., Campuzano-Jost, P., Nault, B. A., Schroder, J. C., Day, D. A., Price, D. J., Weinzierl, B., Schwarz, J. P., Katich, J. M., Wang, S., Zeng, L., Weber, R., Dibb, J., Scheuer, E., Diskin, G. S., DiGangi, J. P., Bui, T., Dean-Day, J. M., Thompson, C. R., Peischl, J., Ryerson, T. B., Bourgeois, I., Daube, B. C., Commane, R., and Wofsy, S. C.: Ambient aerosol properties in the remote atmosphere from global-scale in situ measurements, Atmos. Chem. Phys., 21, 15023–15063, https://doi.org/10.5194/acp-21-15023-2021, 2021. a, b, c
Cala, B. A., Archer-Nicholls, S., Weber, J., Abraham, N. L., Griffiths, P. T., Jacob, L., Shin, Y. M., Revell, L. E., Woodhouse, M., and Archibald, A. T.: Development, intercomparison, and evaluation of an improved mechanism for the oxidation of dimethyl sulfide in the UKCA model, Atmos. Chem. Phys., 23, 14735–14760, https://doi.org/10.5194/acp-23-14735-2023, 2023. a, b, c
Carslaw, K. S., Lee, L. A., Reddington, C. L., Pringle, K. J., Rap, A., Forster, P. M., Mann, G. W., Spracklen, D. V., Woodhouse, M. T., Regayre, L. A., and Pierce, J. R.: Large Contribution of Natural Aerosols to Uncertainty in Indirect Forcing, Nature, 503, 67–71, https://doi.org/10.1038/nature12674, 2013. a, b, c
Carslaw, K. S., Gordon, H., Hamilton, D. S., Johnson, J. S., Regayre, L. A., Yoshioka, M., and Pringle, K. J.: Aerosols in the Pre-industrial Atmosphere, Current Climate Change Reports, 3, 1–15, https://doi.org/10.1007/s40641-017-0061-2, 2017. a
Charlson, R. J., Schwartz, S. E., Hales, J. M., Cess, R. D., Coakley, J. A., Hansen, J. E., and Hofmann, D. J.: Climate Forcing by Anthropogenic Aerosols, Science, 255, 423–430, https://doi.org/10.1126/science.255.5043.423, 1992. a
Clarke, A. D., Freitag, S., Simpson, R. M. C., Hudson, J. G., Howell, S. G., Brekhovskikh, V. L., Campos, T., Kapustin, V. N., and Zhou, J.: Free troposphere as a major source of CCN for the equatorial pacific boundary layer: long-range transport and teleconnections, Atmos. Chem. Phys., 13, 7511–7529, https://doi.org/10.5194/acp-13-7511-2013, 2013. a
Curtius, J., Heinritzi, M., Beck, L. J., Pöhlker, M. L., Tripathi, N., Krumm, B. E., Holzbeck, P., Nussbaumer, C. M., Hernández Pardo, L., Klimach, T., Barmpounis, K., Andersen, S. T., Bardakov, R., Bohn, B., Cecchini, M. A., Chaboureau, J.-P., Dauhut, T., Dienhart, D., Dörich, R., Edtbauer, A., Giez, A., Hartmann, A., Holanda, B. A., Joppe, P., Kaiser, K., Keber, T., Klebach, H., Krüger, O. O., Kürten, A., Mallaun, C., Marno, D., Martinez, M., Monteiro, C., Nelson, C., Ort, L., Raj, S. S., Richter, S., Ringsdorf, A., Rocha, F., Simon, M., Sreekumar, S., Tsokankunku, A., Unfer, G. R., Valenti, I. D., Wang, N., Zahn, A., Zauner-Wieczorek, M., Albrecht, R. I., Andreae, M. O., Artaxo, P., Crowley, J. N., Fischer, H., Harder, H., Herdies, D. L., Machado, L. A. T., Pöhlker, C., Pöschl, U., Possner, A., Pozzer, A., Schneider, J., Williams, J., and Lelieveld, J.: Isoprene Nitrates Drive New Particle Formation in Amazon's Upper Troposphere, Nature, 636, 124–130, https://doi.org/10.1038/s41586-024-08192-4, 2024. a, b, c, d, e, f, g
Dee, D. P., Uppala, S. M., Simmons, A. J., Berrisford, P., Poli, P., Kobayashi, S., Andrae, U., Balmaseda, M. A., Balsamo, G., Bauer, P., Bechtold, P., Beljaars, A. C. M., Van De Berg, L., Bidlot, J., Bormann, N., Delsol, C., Dragani, R., Fuentes, M., Geer, A. J., Haimberger, L., Healy, S. B., Hersbach, H., Hólm, E. V., Isaksen, L., Kållberg, P., Köhler, M., Matricardi, M., McNally, A. P., Monge-Sanz, B. M., Morcrette, J.-J., Park, B.-K., Peubey, C., De Rosnay, P., Tavolato, C., Thépaut, J.-N., and Vitart, F.: The ERA-Interim Reanalysis: Configuration and Performance of the Data Assimilation System, Q. J. Roy. Meteor. Soc., 137, 553–597, https://doi.org/10.1002/qj.828, 2011. a
Dentener, F., Kinne, S., Bond, T., Boucher, O., Cofala, J., Generoso, S., Ginoux, P., Gong, S., Hoelzemann, J. J., Ito, A., Marelli, L., Penner, J. E., Putaud, J.-P., Textor, C., Schulz, M., van der Werf, G. R., and Wilson, J.: Emissions of primary aerosol and precursor gases in the years 2000 and 1750 prescribed data-sets for AeroCom, Atmos. Chem. Phys., 6, 4321–4344, https://doi.org/10.5194/acp-6-4321-2006, 2006. a
Dunne, E. M., Gordon, H., Kürten, A., Almeida, J., Duplissy, J., Williamson, C., Ortega, I. K., Pringle, K. J., Adamov, A., Baltensperger, U., Barmet, P., Benduhn, F., Bianchi, F., Breitenlechner, M., Clarke, A., Curtius, J., Dommen, J., Donahue, N. M., Ehrhart, S., Flagan, R. C., Franchin, A., Guida, R., Hakala, J., Hansel, A., Heinritzi, M., Jokinen, T., Kangasluoma, J., Kirkby, J., Kulmala, M., Kupc, A., Lawler, M. J., Lehtipalo, K., Makhmutov, V., Mann, G., Mathot, S., Merikanto, J., Miettinen, P., Nenes, A., Onnela, A., Rap, A., Reddington, C. L. S., Riccobono, F., Richards, N. A. D., Rissanen, M. P., Rondo, L., Sarnela, N., Schobesberger, S., Sengupta, K., Simon, M., Sipilä, M., Smith, J. N., Stozkhov, Y., Tomé, A., Tröstl, J., Wagner, P. E., Wimmer, D., Winkler, P. M., Worsnop, D. R., and Carslaw, K. S.: Global Atmospheric Particle Formation from CERN CLOUD Measurements, Science, 354, 1119–1124, https://doi.org/10.1126/science.aaf2649, 2016. a, b, c, d, e, f, g, h, i, j, k, l
Ehn, M., Thornton, J. A., Kleist, E., Sipilä, M., Junninen, H., Pullinen, I., Springer, M., Rubach, F., Tillmann, R., Lee, B., Lopez-Hilfiker, F., Andres, S., Acir, I.-H., Rissanen, M., Jokinen, T., Schobesberger, S., Kangasluoma, J., Kontkanen, J., Nieminen, T., Kurtén, T., Nielsen, L. B., Jørgensen, S., Kjaergaard, H. G., Canagaratna, M., Maso, M. D., Berndt, T., Petäjä, T., Wahner, A., Kerminen, V.-M., Kulmala, M., Worsnop, D. R., Wildt, J., and Mentel, T. F.: A Large Source of Low-Volatility Secondary Organic Aerosol, Nature, 506, 476–479, https://doi.org/10.1038/nature13032, 2014. a, b
Froyd, K. D., Yu, P., Schill, G. P., Brock, C. A., Kupc, A., Williamson, C. J., Jensen, E. J., Ray, E., Rosenlof, K. H., Bian, H., Darmenov, A. S., Colarco, P. R., Diskin, G. S., Bui, T., and Murphy, D. M.: Dominant Role of Mineral Dust in Cirrus Cloud Formation Revealed by Global-Scale Measurements, Nat. Geosci., 15, 177–183, https://doi.org/10.1038/s41561-022-00901-w, 2022. a
Gantt, B., Johnson, M. S., Meskhidze, N., Sciare, J., Ovadnevaite, J., Ceburnis, D., and O'Dowd, C. D.: Model evaluation of marine primary organic aerosol emission schemes, Atmos. Chem. Phys., 12, 8553–8566, https://doi.org/10.5194/acp-12-8553-2012, 2012. a
Gao, C. Y., Heald, C. L., Katich, J. M., Luo, G., and Yu, F.: Remote Aerosol Simulated During the Atmospheric Tomography (ATom) Campaign and Implications for Aerosol Lifetime, J. Geophys. Res.-Atmos., 127, e2022JD036524, https://doi.org/10.1029/2022JD036524, 2022. a
Ge, Y., Heal, M. R., Stevenson, D. S., Wind, P., and Vieno, M.: Evaluation of global EMEP MSC-W (rv4.34) WRF (v3.9.1.1) model surface concentrations and wet deposition of reactive N and S with measurements, Geosci. Model Dev., 14, 7021–7046, https://doi.org/10.5194/gmd-14-7021-2021, 2021. a
Giannakopoulos, C., Chipperfield, M. P., Law, K. S., and Pyle, J. A.: Validation and Intercomparison of Wet and Dry Deposition Schemes Using 210Pb in a Global Three-dimensional Off-line Chemical Transport Model, J. Geophys. Res.-Atmos., 104, 23761–23784, https://doi.org/10.1029/1999JD900392, 1999. a
Gong, S. L.: A Parameterization of Sea-salt Aerosol Source Function for Sub- and Super-micron Particles, Global Biogeochem. Cy., 17, 2003GB002079, https://doi.org/10.1029/2003GB002079, 2003. a
Gordon, H., Kirkby, J., Baltensperger, U., Bianchi, F., Breitenlechner, M., Curtius, J., Dias, A., Dommen, J., Donahue, N. M., Dunne, E. M., Duplissy, J., Ehrhart, S., Flagan, R. C., Frege, C., Fuchs, C., Hansel, A., Hoyle, C. R., Kulmala, M., Kürten, A., Lehtipalo, K., Makhmutov, V., Molteni, U., Rissanen, M. P., Stozkhov, Y., Tröstl, J., Tsagkogeorgas, G., Wagner, R., Williamson, C., Wimmer, D., Winkler, P. M., Yan, C., and Carslaw, K. S.: Causes and Importance of New Particle Formation in the Present-Day and Preindustrial Atmospheres, J. Geophys. Res.-Atmos., 122, 8739–8760, https://doi.org/10.1002/2017JD026844, 2017. a, b
Guenther, A. B., Jiang, X., Heald, C. L., Sakulyanontvittaya, T., Duhl, T., Emmons, L. K., and Wang, X.: The Model of Emissions of Gases and Aerosols from Nature version 2.1 (MEGAN2.1): an extended and updated framework for modeling biogenic emissions, Geosci. Model Dev., 5, 1471–1492, https://doi.org/10.5194/gmd-5-1471-2012, 2012. a
Guo, H., Campuzano-Jost, P., Nault, B. A., Day, D. A., Schroder, J. C., Kim, D., Dibb, J. E., Dollner, M., Weinzierl, B., and Jimenez, J. L.: The importance of size ranges in aerosol instrument intercomparisons: a case study for the Atmospheric Tomography Mission, Atmos. Meas. Tech., 14, 3631–3655, https://doi.org/10.5194/amt-14-3631-2021, 2021. a, b, c
Hackenberg, S. C., Andrews, S. J., Airs, R. L., Arnold, S. R., Bouman, H. A., Cummings, D., Lewis, A. C., Minaeian, J. K., Reifel, K. M., Small, A., Tarran, G. A., Tilstone, G. H., and Carpenter, L. J.: Basin-Scale Observations of Monoterpenes in the Arctic and Atlantic Oceans, Environ. Sci. Technol., 51, 10449–10458, https://doi.org/10.1021/acs.est.7b02240, 2017. a
Hardacre, C., Mulcahy, J. P., Pope, R. J., Jones, C. G., Rumbold, S. T., Li, C., Johnson, C., and Turnock, S. T.: Evaluation of SO2, and an updated SO2 dry deposition parameterization in the United Kingdom Earth System Model, Atmos. Chem. Phys., 21, 18465–18497, https://doi.org/10.5194/acp-21-18465-2021, 2021. a
He, X.-C.: Evaluation of UKESM aerosol size and composition using ATom measurements indicates missing marine aerosol formation mechanisms – data resources, Zenodo [data set], https://doi.org/10.5281/zenodo.18815333, 2026. a
He, X.-C., Iyer, S., Sipilä, M., Ylisirniö, A., Peltola, M., Kontkanen, J., Baalbaki, R., Simon, M., Kürten, A., Tham, Y. J., Pesonen, J., Ahonen, L. R., Amanatidis, S., Amorim, A., Baccarini, A., Beck, L., Bianchi, F., Brilke, S., Chen, D., Chiu, R., Curtius, J., Dada, L., Dias, A., Dommen, J., Donahue, N. M., Duplissy, J., El Haddad, I., Finkenzeller, H., Fischer, L., Heinritzi, M., Hofbauer, V., Kangasluoma, J., Kim, C., Koenig, T. K., Kubečka, J., Kvashnin, A., Lamkaddam, H., Lee, C. P., Leiminger, M., Li, Z., Makhmutov, V., Xiao, M., Marten, R., Nie, W., Onnela, A., Partoll, E., Petäjä, T., Salo, V.-T., Schuchmann, S., Steiner, G., Stolzenburg, D., Stozhkov, Y., Tauber, C., Tomé, A., Väisänen, O., Vazquez-Pufleau, M., Volkamer, R., Wagner, A. C., Wang, M., Wang, Y., Wimmer, D., Winkler, P. M., Worsnop, D. R., Wu, Y., Yan, C., Ye, Q., Lehtinen, K., Nieminen, T., Manninen, H. E., Rissanen, M., Schobesberger, S., Lehtipalo, K., Baltensperger, U., Hansel, A., Kerminen, V.-M., Flagan, R. C., Kirkby, J., Kurtén, T., and Kulmala, M.: Determination of the Collision Rate Coefficient between Charged Iodic Acid Clusters and Iodic Acid Using the Appearance Time Method, Aerosol Sci. Tech., 55, 231–242, https://doi.org/10.1080/02786826.2020.1839013, 2021a. a
He, X.-C., Tham, Y. J., Dada, L., Wang, M., Finkenzeller, H., Stolzenburg, D., Iyer, S., Simon, M., Kürten, A., Shen, J., Rörup, B., Rissanen, M., Schobesberger, S., Baalbaki, R., Wang, D. S., Koenig, T. K., Jokinen, T., Sarnela, N., Beck, L. J., Almeida, J., Amanatidis, S., Amorim, A., Ataei, F., Baccarini, A., Bertozzi, B., Bianchi, F., Brilke, S., Caudillo, L., Chen, D., Chiu, R., Chu, B., Dias, A., Ding, A., Dommen, J., Duplissy, J., El Haddad, I., Gonzalez Carracedo, L., Granzin, M., Hansel, A., Heinritzi, M., Hofbauer, V., Junninen, H., Kangasluoma, J., Kemppainen, D., Kim, C., Kong, W., Krechmer, J. E., Kvashin, A., Laitinen, T., Lamkaddam, H., Lee, C. P., Lehtipalo, K., Leiminger, M., Li, Z., Makhmutov, V., Manninen, H. E., Marie, G., Marten, R., Mathot, S., Mauldin, R. L., Mentler, B., Möhler, O., Müller, T., Nie, W., Onnela, A., Petäjä, T., Pfeifer, J., Philippov, M., Ranjithkumar, A., Saiz-Lopez, A., Salma, I., Scholz, W., Schuchmann, S., Schulze, B., Steiner, G., Stozhkov, Y., Tauber, C., Tomé, A., Thakur, R. C., Väisänen, O., Vazquez-Pufleau, M., Wagner, A. C., Wang, Y., Weber, S. K., Winkler, P. M., Wu, Y., Xiao, M., Yan, C., Ye, Q., Ylisirniö, A., Zauner-Wieczorek, M., Zha, Q., Zhou, P., Flagan, R. C., Curtius, J., Baltensperger, U., Kulmala, M., Kerminen, V.-M., Kurtén, T., Donahue, N. M., Volkamer, R., Kirkby, J., Worsnop, D. R., and Sipilä, M.: Role of Iodine Oxoacids in Atmospheric Aerosol Nucleation, Science, 371, 589–595, https://doi.org/10.1126/science.abe0298, 2021b. a, b, c, d, e, f, g, h
He, X.-C., Simon, M., Iyer, S., Xie, H.-B., Rörup, B., Shen, J., Finkenzeller, H., Stolzenburg, D., Zhang, R., Baccarini, A., Tham, Y. J., Wang, M., Amanatidis, S., Piedehierro, A. A., Amorim, A., Baalbaki, R., Brasseur, Z., Caudillo, L., Chu, B., Dada, L., Duplissy, J., El Haddad, I., Flagan, R. C., Granzin, M., Hansel, A., Heinritzi, M., Hofbauer, V., Jokinen, T., Kemppainen, D., Kong, W., Krechmer, J., Kürten, A., Lamkaddam, H., Lopez, B., Ma, F., Mahfouz, N. G. A., Makhmutov, V., Manninen, H. E., Marie, G., Marten, R., Massabò, D., Mauldin, R. L., Mentler, B., Onnela, A., Petäjä, T., Pfeifer, J., Philippov, M., Ranjithkumar, A., Rissanen, M. P., Schobesberger, S., Scholz, W., Schulze, B., Surdu, M., Thakur, R. C., Tomé, A., Wagner, A. C., Wang, D., Wang, Y., Weber, S. K., Welti, A., Winkler, P. M., Zauner-Wieczorek, M., Baltensperger, U., Curtius, J., Kurtén, T., Worsnop, D. R., Volkamer, R., Lehtipalo, K., Kirkby, J., Donahue, N. M., Sipilä, M., and Kulmala, M.: Iodine Oxoacids Enhance Nucleation of Sulfuric Acid Particles in the Atmosphere, Science, 382, 1308–1314, https://doi.org/10.1126/science.adh2526, 2023. a, b, c, d, e, f, g, h, i
Hersbach, H., Bell, B., Berrisford, P., Hirahara, S., Horányi, A., Muñoz-Sabater, J., Nicolas, J., Peubey, C., Radu, R., Schepers, D., Simmons, A., Soci, C., Abdalla, S., Abellan, X., Balsamo, G., Bechtold, P., Biavati, G., Bidlot, J., Bonavita, M., De Chiara, G., Dahlgren, P., Dee, D., Diamantakis, M., Dragani, R., Flemming, J., Forbes, R., Fuentes, M., Geer, A., Haimberger, L., Healy, S., Hogan, R. J., Hólm, E., Janisková, M., Keeley, S., Laloyaux, P., Lopez, P., Lupu, C., Radnoti, G., De Rosnay, P., Rozum, I., Vamborg, F., Villaume, S., and Thépaut, J.-N.: The ERA5 Global Reanalysis, Q. J. Roy. Meteor. Soc., 146, 1999–2049, https://doi.org/10.1002/qj.3803, 2020. a
Hodshire, A. L., Campuzano-Jost, P., Kodros, J. K., Croft, B., Nault, B. A., Schroder, J. C., Jimenez, J. L., and Pierce, J. R.: The potential role of methanesulfonic acid (MSA) in aerosol formation and growth and the associated radiative forcings, Atmos. Chem. Phys., 19, 3137–3160, https://doi.org/10.5194/acp-19-3137-2019, 2019. a
Hodzic, A., Campuzano-Jost, P., Bian, H., Chin, M., Colarco, P. R., Day, D. A., Froyd, K. D., Heinold, B., Jo, D. S., Katich, J. M., Kodros, J. K., Nault, B. A., Pierce, J. R., Ray, E., Schacht, J., Schill, G. P., Schroder, J. C., Schwarz, J. P., Sueper, D. T., Tegen, I., Tilmes, S., Tsigaridis, K., Yu, P., and Jimenez, J. L.: Characterization of organic aerosol across the global remote troposphere: a comparison of ATom measurements and global chemistry models, Atmos. Chem. Phys., 20, 4607–4635, https://doi.org/10.5194/acp-20-4607-2020, 2020. a, b
Hoesly, R. M., Smith, S. J., Feng, L., Klimont, Z., Janssens-Maenhout, G., Pitkanen, T., Seibert, J. J., Vu, L., Andres, R. J., Bolt, R. M., Bond, T. C., Dawidowski, L., Kholod, N., Kurokawa, J.-I., Li, M., Liu, L., Lu, Z., Moura, M. C. P., O'Rourke, P. R., and Zhang, Q.: Historical (1750–2014) anthropogenic emissions of reactive gases and aerosols from the Community Emissions Data System (CEDS), Geosci. Model Dev., 11, 369–408, https://doi.org/10.5194/gmd-11-369-2018, 2018. a, b, c
Hoffmann, T., O'Dowd, C. D., and Seinfeld, J. H.: Iodine Oxide Homogeneous Nucleation: An Explanation for Coastal New Particle Production, Geophys. Res. Lett., 28, 1949–1952, https://doi.org/10.1029/2000GL012399, 2001. a
Jacob, L. S. D., Giorio, C., and Archibald, A. T.: Extension, development, and evaluation of the representation of the OH-initiated dimethyl sulfide (DMS) oxidation mechanism in the Master Chemical Mechanism (MCM) v3.3.1 framework, Atmos. Chem. Phys., 24, 3329–3347, https://doi.org/10.5194/acp-24-3329-2024, 2024. a
Jen, C. N., McMurry, P. H., and Hanson, D. R.: Stabilization of Sulfuric Acid Dimers by Ammonia, Methylamine, Dimethylamine, and Trimethylamine, J. Geophys. Res.-Atmos., 119, 7502–7514, https://doi.org/10.1002/2014JD021592, 2014. a
Jenkin, M., Khan, M., Shallcross, D., Bergström, R., Simpson, D., Murphy, K., and Rickard, A.: The CRI v2.2 Reduced Degradation Scheme for Isoprene, Atmos. Environ., 212, 172–182, https://doi.org/10.1016/j.atmosenv.2019.05.055, 2019. a
Jokinen, T., Sipilä, M., Kontkanen, J., Vakkari, V., Tisler, P., Duplissy, E.-M., Junninen, H., Kangasluoma, J., Manninen, H. E., Petäjä, T., Kulmala, M., Worsnop, D. R., Kirkby, J., Virkkula, A., and Kerminen, V.-M.: Ion-Induced Sulfuric Acid–Ammonia Nucleation Drives Particle Formation in Coastal Antarctica, Science Advances, 4, eaat9744, https://doi.org/10.1126/sciadv.aat9744, 2018. a, b
Jones, A. C., Hill, A., Remy, S., Abraham, N. L., Dalvi, M., Hardacre, C., Hewitt, A. J., Johnson, B., Mulcahy, J. P., and Turnock, S. T.: Exploring the sensitivity of atmospheric nitrate concentrations to nitric acid uptake rate using the Met Office's Unified Model, Atmos. Chem. Phys., 21, 15901–15927, https://doi.org/10.5194/acp-21-15901-2021, 2021. a, b, c, d, e, f, g, h, i
Kanaya, Y., Sommariva, R., Saiz-Lopez, A., Mazzeo, A., Koenig, T. K., Kawana, K., Johnson, J. E., Colomb, A., Tulet, P., Molloy, S., Galbally, I. E., Volkamer, R., Mahajan, A., Halfacre, J. W., Shepson, P. B., Schmale, J., Angot, H., Blomquist, B., Shupe, M. D., Helmig, D., Gil, J., Lee, M., Coburn, S. C., Ortega, I., Chen, G., Lee, J., Aikin, K. C., Parrish, D. D., Holloway, J. S., Ryerson, T. B., Pollack, I. B., Williams, E. J., Lerner, B. M., Weinheimer, A. J., Campos, T., Flocke, F. M., Spackman, J. R., Bourgeois, I., Peischl, J., Thompson, C. R., Staebler, R. M., Aliabadi, A. A., Gong, W., Van Malderen, R., Thompson, A. M., Stauffer, R. M., Kollonige, D. E., Gómez Martin, J. C., Fujiwara, M., Read, K., Rowlinson, M., Sato, K., Kurokawa, J., Iwamoto, Y., Taketani, F., Takashima, H., Navarro-Comas, M., Panagi, M., and Schultz, M. G.: Observational ozone datasets over the global oceans and polar regions (version 2024), Earth Syst. Sci. Data, 17, 4901–4932, https://doi.org/10.5194/essd-17-4901-2025, 2025. a
Kim, D., Campuzano-Jost, P., Guo, H., Day, D. A., Yang, D., Dhaniyala, S., Williams, L., Croteau, P., Jayne, J., Worsnop, D., Volkamer, R., and Jimenez, J. L.: Development and characterization of an aircraft inlet system for broader quantitative particle sampling at higher altitudes: aerodynamic lenses, beam and vaporizer diagnostics, and pressure-controlled inlets, Aerosol Research, 3, 371–404, https://doi.org/10.5194/ar-3-371-2025, 2025. a
Kipling, Z., Stier, P., Schwarz, J. P., Perring, A. E., Spackman, J. R., Mann, G. W., Johnson, C. E., and Telford, P. J.: Constraints on aerosol processes in climate models from vertically-resolved aircraft observations of black carbon, Atmos. Chem. Phys., 13, 5969–5986, https://doi.org/10.5194/acp-13-5969-2013, 2013. a
Kirkby, J., Curtius, J., Almeida, J., Dunne, E., Duplissy, J., Ehrhart, S., Franchin, A., Gagné, S., Ickes, L., Kürten, A., Kupc, A., Metzger, A., Riccobono, F., Rondo, L., Schobesberger, S., Tsagkogeorgas, G., Wimmer, D., Amorim, A., Bianchi, F., Breitenlechner, M., David, A., Dommen, J., Downard, A., Ehn, M., Flagan, R. C., Haider, S., Hansel, A., Hauser, D., Jud, W., Junninen, H., Kreissl, F., Kvashin, A., Laaksonen, A., Lehtipalo, K., Lima, J., Lovejoy, E. R., Makhmutov, V., Mathot, S., Mikkilä, J., Minginette, P., Mogo, S., Nieminen, T., Onnela, A., Pereira, P., Petäjä, T., Schnitzhofer, R., Seinfeld, J. H., Sipilä, M., Stozhkov, Y., Stratmann, F., Tomé, A., Vanhanen, J., Viisanen, Y., Vrtala, A., Wagner, P. E., Walther, H., Weingartner, E., Wex, H., Winkler, P. M., Carslaw, K. S., Worsnop, D. R., Baltensperger, U., and Kulmala, M.: Role of Sulphuric Acid, Ammonia and Galactic Cosmic Rays in Atmospheric Aerosol Nucleation, Nature, 476, 429–433, https://doi.org/10.1038/nature10343, 2011. a, b, c, d, e, f, g, h, i, j, k, l
Kirkby, J., Duplissy, J., Sengupta, K., Frege, C., Gordon, H., Williamson, C., Heinritzi, M., Simon, M., Yan, C., Almeida, J., Tröstl, J., Nieminen, T., Ortega, I. K., Wagner, R., Adamov, A., Amorim, A., Bernhammer, A.-K., Bianchi, F., Breitenlechner, M., Brilke, S., Chen, X., Craven, J., Dias, A., Ehrhart, S., Flagan, R. C., Franchin, A., Fuchs, C., Guida, R., Hakala, J., Hoyle, C. R., Jokinen, T., Junninen, H., Kangasluoma, J., Kim, J., Krapf, M., Kürten, A., Laaksonen, A., Lehtipalo, K., Makhmutov, V., Mathot, S., Molteni, U., Onnela, A., Peräkylä, O., Piel, F., Petäjä, T., Praplan, A. P., Pringle, K., Rap, A., Richards, N. A. D., Riipinen, I., Rissanen, M. P., Rondo, L., Sarnela, N., Schobesberger, S., Scott, C. E., Seinfeld, J. H., Sipilä, M., Steiner, G., Stozhkov, Y., Stratmann, F., Tomé, A., Virtanen, A., Vogel, A. L., Wagner, A. C., Wagner, P. E., Weingartner, E., Wimmer, D., Winkler, P. M., Ye, P., Zhang, X., Hansel, A., Dommen, J., Donahue, N. M., Worsnop, D. R., Baltensperger, U., Kulmala, M., Carslaw, K. S., and Curtius, J.: Ion-Induced Nucleation of Pure Biogenic Particles, Nature, 533, 521–526, https://doi.org/10.1038/nature17953, 2016. a, b
Kirkby, J., Amorim, A., Baltensperger, U., Carslaw, K. S., Christoudias, T., Curtius, J., Donahue, N. M., Haddad, I. E., Flagan, R. C., Gordon, H., Hansel, A., Harder, H., Junninen, H., Kulmala, M., Kürten, A., Laaksonen, A., Lehtipalo, K., Lelieveld, J., Möhler, O., Riipinen, I., Stratmann, F., Tomé, A., Virtanen, A., Volkamer, R., Winkler, P. M., and Worsnop, D. R.: Atmospheric New Particle Formation from the CERN CLOUD Experiment, Nat. Geosci., 16, 948–957, https://doi.org/10.1038/s41561-023-01305-0, 2023. a, b, c, d
Koenig, T. K., Baidar, S., Campuzano-Jost, P., Cuevas, C. A., Dix, B., Fernandez, R. P., Guo, H., Hall, S. R., Kinnison, D., Nault, B. A., Ullmann, K., Jimenez, J. L., Saiz-Lopez, A., and Volkamer, R.: Quantitative Detection of Iodine in the Stratosphere, P. Natl. Acad. Sci. USA, 117, 1860–1866, https://doi.org/10.1073/pnas.1916828117, 2020. a, b
Koren, I., Dagan, G., and Altaratz, O.: From Aerosol-Limited to Invigoration of Warm Convective Clouds, Science, 344, 1143–1146, https://doi.org/10.1126/science.1252595, 2014. a
Kroll, J. H., Ng, N. L., Murphy, S. M., Flagan, R. C., and Seinfeld, J. H.: Secondary Organic Aerosol Formation from Isoprene Photooxidation under high-NOx Conditions, Geophys. Res. Lett., 32, 2005GL023637, https://doi.org/10.1029/2005GL023637, 2005. a
Kroll, J. H., Ng, N. L., Murphy, S. M., Flagan, R. C., and Seinfeld, J. H.: Secondary Organic Aerosol Formation from Isoprene Photooxidation, Environ. Sci. Technol., 40, 1869–1877, https://doi.org/10.1021/es0524301, 2006. a
Kulmala, M., Laaksonen, A., and Pirjola, L.: Parameterizations for Sulfuric Acid/Water Nucleation Rates, J. Geophys. Res.-Atmos., 103, 8301–8307, https://doi.org/10.1029/97JD03718, 1998. a, b, c, d, e
Kulmala, M., Lehtinen, K. E. J., and Laaksonen, A.: Cluster activation theory as an explanation of the linear dependence between formation rate of 3nm particles and sulphuric acid concentration, Atmos. Chem. Phys., 6, 787–793, https://doi.org/10.5194/acp-6-787-2006, 2006. a
Kupc, A., Williamson, C., Wagner, N. L., Richardson, M., and Brock, C. A.: Modification, calibration, and performance of the Ultra-High Sensitivity Aerosol Spectrometer for particle size distribution and volatility measurements during the Atmospheric Tomography Mission (ATom) airborne campaign, Atmos. Meas. Tech., 11, 369–383, https://doi.org/10.5194/amt-11-369-2018, 2018. a
Kupc, A., Williamson, C. J., Hodshire, A. L., Kazil, J., Ray, E., Bui, T. P., Dollner, M., Froyd, K. D., McKain, K., Rollins, A., Schill, G. P., Thames, A., Weinzierl, B. B., Pierce, J. R., and Brock, C. A.: The potential role of organics in new particle formation and initial growth in the remote tropical upper troposphere, Atmos. Chem. Phys., 20, 15037–15060, https://doi.org/10.5194/acp-20-15037-2020, 2020. a
Lana, A., Bell, T. G., Simó, R., Vallina, S. M., Ballabrera-Poy, J., Kettle, A. J., Dachs, J., Bopp, L., Saltzman, E. S., Stefels, J., Johnson, J. E., and Liss, P. S.: An Updated Climatology of Surface Dimethlysulfide Concentrations and Emission Fluxes in the Global Ocean: UPDATED DMS CLIMATOLOGY, Global Biogeochem. Cy., 25, https://doi.org/10.1029/2010GB003850, 2011. a, b, c, d, e, f
Lee, L. A., Reddington, C. L., and Carslaw, K. S.: On the Relationship between Aerosol Model Uncertainty and Radiative Forcing Uncertainty, P. Natl. Acad. Sci. USA, 113, 5820–5827, https://doi.org/10.1073/pnas.1507050113, 2016. a
Lee, S.-H., Reeves, J. M., Wilson, J. C., Hunton, D. E., Viggiano, A. A., Miller, T. M., Ballenthin, J. O., and Lait, L. R.: Particle Formation by Ion Nucleation in the Upper Troposphere and Lower Stratosphere, Science, 301, 1886–1889, https://doi.org/10.1126/science.1087236, 2003. a
Lehtipalo, K., Yan, C., Dada, L., Bianchi, F., Xiao, M., Wagner, R., Stolzenburg, D., Ahonen, L. R., Amorim, A., Baccarini, A., Bauer, P. S., Baumgartner, B., Bergen, A., Bernhammer, A.-K., Breitenlechner, M., Brilke, S., Buchholz, A., Mazon, S. B., Chen, D., Chen, X., Dias, A., Dommen, J., Draper, D. C., Duplissy, J., Ehn, M., Finkenzeller, H., Fischer, L., Frege, C., Fuchs, C., Garmash, O., Gordon, H., Hakala, J., He, X., Heikkinen, L., Heinritzi, M., Helm, J. C., Hofbauer, V., Hoyle, C. R., Jokinen, T., Kangasluoma, J., Kerminen, V.-M., Kim, C., Kirkby, J., Kontkanen, J., Kürten, A., Lawler, M. J., Mai, H., Mathot, S., Mauldin, R. L., Molteni, U., Nichman, L., Nie, W., Nieminen, T., Ojdanic, A., Onnela, A., Passananti, M., Petäjä, T., Piel, F., Pospisilova, V., Quéléver, L. L. J., Rissanen, M. P., Rose, C., Sarnela, N., Schallhart, S., Schuchmann, S., Sengupta, K., Simon, M., Sipilä, M., Tauber, C., Tomé, A., Tröstl, J., Väisänen, O., Vogel, A. L., Volkamer, R., Wagner, A. C., Wang, M., Weitz, L., Wimmer, D., Ye, P., Ylisirniö, A., Zha, Q., Carslaw, K. S., Curtius, J., Donahue, N. M., Flagan, R. C., Hansel, A., Riipinen, I., Virtanen, A., Winkler, P. M., Baltensperger, U., Kulmala, M., and Worsnop, D. R.: Multicomponent New Particle Formation from Sulfuric Acid, Ammonia, and Biogenic Vapors, Science Advances, 4, eaau5363, https://doi.org/10.1126/sciadv.aau5363, 2018. a
Luo, G. and Yu, F.: A Numerical Evaluation of Global Oceanic Emissions of α-Pinene and Isoprene, Atmospheric Chemistry and Physics, 10, 2007–2015, https://doi.org/10.5194/acp-10-2007-2010, 2010. a, b
Mann, G. W., Carslaw, K. S., Spracklen, D. V., Ridley, D. A., Manktelow, P. T., Chipperfield, M. P., Pickering, S. J., and Johnson, C. E.: Description and evaluation of GLOMAP-mode: a modal global aerosol microphysics model for the UKCA composition-climate model, Geosci. Model Dev., 3, 519–551, https://doi.org/10.5194/gmd-3-519-2010, 2010. a, b, c, d, e, f, g, h, i
Masson-Delmotte, V., Zhai, P., Pirani, A., Connors, S. L., Péan, C., Berger, S., Caud, N., Chen, Y., Goldfarb, L., Gomis, M. I., Huang, M., Leitzell, K., Lonnoy, E., Matthews, J. B. R., Maycock, T. K., Waterfield, T., Yelekçi, O., Yu, R., and Zhou, B.: IPCC, 2021: Climate Change 2021: The Physical Science Basis. Contribution of Working Group I to the Sixth Assessment Report of the Intergovernmental Panel on Climate Change, Cambridge University Press, United Kingdom, https://doi.org/10.1017/9781009157896, 2021. a
Mauldin, R. L., Tanner, D. J., Heath, J. A., Huebert, B. J., and Eisele, F. L.: Observations of H2 SO4 and MSA during PEM-Tropics-A, J. Geophys. Res.-Atmos., 104, 5801–5816, https://doi.org/10.1029/98JD02612, 1999. a
Metzger, A., Verheggen, B., Dommen, J., Duplissy, J., Prevot, A. S. H., Weingartner, E., Riipinen, I., Kulmala, M., Spracklen, D. V., Carslaw, K. S., and Baltensperger, U.: Evidence for the Role of Organics in Aerosol Particle Formation under Atmospheric Conditions, P. Natl. Acad. Sci. USA, 107, 6646–6651, https://doi.org/10.1073/pnas.0911330107, 2010. a
Mulcahy, J. P., Johnson, C., Jones, C. G., Povey, A. C., Scott, C. E., Sellar, A., Turnock, S. T., Woodhouse, M. T., Abraham, N. L., Andrews, M. B., Bellouin, N., Browse, J., Carslaw, K. S., Dalvi, M., Folberth, G. A., Glover, M., Grosvenor, D. P., Hardacre, C., Hill, R., Johnson, B., Jones, A., Kipling, Z., Mann, G., Mollard, J., O'Connor, F. M., Palmiéri, J., Reddington, C., Rumbold, S. T., Richardson, M., Schutgens, N. A. J., Stier, P., Stringer, M., Tang, Y., Walton, J., Woodward, S., and Yool, A.: Description and evaluation of aerosol in UKESM1 and HadGEM3-GC3.1 CMIP6 historical simulations, Geosci. Model Dev., 13, 6383–6423, https://doi.org/10.5194/gmd-13-6383-2020, 2020. a, b, c, d, e, f, g, h
Mulcahy, J. P., Jones, C. G., Rumbold, S. T., Kuhlbrodt, T., Dittus, A. J., Blockley, E. W., Yool, A., Walton, J., Hardacre, C., Andrews, T., Bodas-Salcedo, A., Stringer, M., de Mora, L., Harris, P., Hill, R., Kelley, D., Robertson, E., and Tang, Y.: UKESM1.1: development and evaluation of an updated configuration of the UK Earth System Model, Geosci. Model Dev., 16, 1569–1600, https://doi.org/10.5194/gmd-16-1569-2023, 2023. a, b, c, d, e, f
Murphy, D. M., Froyd, K. D., Bian, H., Brock, C. A., Dibb, J. E., DiGangi, J. P., Diskin, G., Dollner, M., Kupc, A., Scheuer, E. M., Schill, G. P., Weinzierl, B., Williamson, C. J., and Yu, P.: The distribution of sea-salt aerosol in the global troposphere, Atmos. Chem. Phys., 19, 4093–4104, https://doi.org/10.5194/acp-19-4093-2019, 2019. a
Nault, B. A., Campuzano-Jost, P., Day, D. A., Jo, D. S., Schroder, J. C., Allen, H. M., Bahreini, R., Bian, H., Blake, D. R., Chin, M., Clegg, S. L., Colarco, P. R., Crounse, J. D., Cubison, M. J., DeCarlo, P. F., Dibb, J. E., Diskin, G. S., Hodzic, A., Hu, W., Katich, J. M., Kim, M. J., Kodros, J. K., Kupc, A., Lopez-Hilfiker, F. D., Marais, E. A., Middlebrook, A. M., Andrew Neuman, J., Nowak, J. B., Palm, B. B., Paulot, F., Pierce, J. R., Schill, G. P., Scheuer, E., Thornton, J. A., Tsigaridis, K., Wennberg, P. O., Williamson, C. J., and Jimenez, J. L.: Chemical Transport Models Often Underestimate Inorganic Aerosol Acidity in Remote Regions of the Atmosphere, Communications Earth & Environment, 2, 93, https://doi.org/10.1038/s43247-021-00164-0, 2021. a, b, c, d, e, f
O'Connor, F. M., Johnson, C. E., Morgenstern, O., Abraham, N. L., Braesicke, P., Dalvi, M., Folberth, G. A., Sanderson, M. G., Telford, P. J., Voulgarakis, A., Young, P. J., Zeng, G., Collins, W. J., and Pyle, J. A.: Evaluation of the new UKCA climate-composition model – Part 2: The Troposphere, Geosci. Model Dev., 7, 41–91, https://doi.org/10.5194/gmd-7-41-2014, 2014. a, b
O'Dowd, C. D., Jimenez, J. L., Bahreini, R., Flagan, R. C., Seinfeld, J. H., Hämeri, K., Pirjola, L., Kulmala, M., Jennings, S. G., and Hoffmann, T.: Marine Aerosol Formation from Biogenic Iodine Emissions, Nature, 417, 632–636, https://doi.org/10.1038/nature00775, 2002. a
O'Dowd, C. D., Facchini, M. C., Cavalli, F., Ceburnis, D., Mircea, M., Decesari, S., Fuzzi, S., Yoon, Y. J., and Putaud, J.-P.: Biogenically Driven Organic Contribution to Marine Aerosol, Nature, 431, 676–680, https://doi.org/10.1038/nature02959, 2004. a
Palmer, P. I., Marvin, M. R., Siddans, R., Kerridge, B. J., and Moore, D. P.: Nocturnal Survival of Isoprene Linked to Formation of Upper Tropospheric Organic Aerosol, Science, 375, 562–566, https://doi.org/10.1126/science.abg4506, 2022. a
Paulot, F., Crounse, J. D., Kjaergaard, H. G., Kürten, A., St. Clair, J. M., Seinfeld, J. H., and Wennberg, P. O.: Unexpected Epoxide Formation in the Gas-Phase Photooxidation of Isoprene, Science, 325, 730–733, https://doi.org/10.1126/science.1172910, 2009. a
Pirjola, L. and Kulmala, M.: Modelling the Formation of H2SO4–H2O Particles in Rural, Urban and Marine Conditions, Atmos. Res., 46, 321–347, https://doi.org/10.1016/S0169-8095(97)00072-0, 1998. a
Pollack, I. B., Lerner, B. M., and Ryerson, T. B.: Evaluation of Ultraviolet Light-Emitting Diodes for Detection of Atmospheric NO2 by Photolysis – Chemiluminescence, J. Atmos. Chem. 65, 111–125, https://doi.org/10.1007/s10874-011-9184-3, 2010. a
Prather, K. A., Bertram, T. H., Grassian, V. H., Deane, G. B., Stokes, M. D., DeMott, P. J., Aluwihare, L. I., Palenik, B. P., Azam, F., Seinfeld, J. H., Moffet, R. C., Molina, M. J., Cappa, C. D., Geiger, F. M., Roberts, G. C., Russell, L. M., Ault, A. P., Baltrusaitis, J., Collins, D. B., Corrigan, C. E., Cuadra-Rodriguez, L. A., Ebben, C. J., Forestieri, S. D., Guasco, T. L., Hersey, S. P., Kim, M. J., Lambert, W. F., Modini, R. L., Mui, W., Pedler, B. E., Ruppel, M. J., Ryder, O. S., Schoepp, N. G., Sullivan, R. C., and Zhao, D.: Bringing the Ocean into the Laboratory to Probe the Chemical Complexity of Sea Spray Aerosol, P. Natl. Acad. Sci. USA, 110, 7550–7555, https://doi.org/10.1073/pnas.1300262110, 2013. a
Price, R., Baccarini, A., Schmale, J., Zieger, P., Brooks, I. M., Field, P., and Carslaw, K. S.: Late summer transition from a free-tropospheric to boundary layer source of Aitken mode aerosol in the high Arctic, Atmos. Chem. Phys., 23, 2927–2961, https://doi.org/10.5194/acp-23-2927-2023, 2023. a
Ranjithkumar, A., Gordon, H., Williamson, C., Rollins, A., Pringle, K., Kupc, A., Abraham, N. L., Brock, C., and Carslaw, K.: Constraints on global aerosol number concentration, SO2 and condensation sink in UKESM1 using ATom measurements, Atmos. Chem. Phys., 21, 4979–5014, https://doi.org/10.5194/acp-21-4979-2021, 2021. a, b, c
Reynolds, R. W., Smith, T. M., Liu, C., Chelton, D. B., Casey, K. S., and Schlax, M. G.: Daily High-Resolution-Blended Analyses for Sea Surface Temperature, J. Climate, 20, 5473–5496, https://doi.org/10.1175/2007JCLI1824.1, 2007. a
Rinaldi, M., Decesari, S., Finessi, E., Giulianelli, L., Carbone, C., Fuzzi, S., O'Dowd, C. D., Ceburnis, D., and Facchini, M. C.: Primary and Secondary Organic Marine Aerosol and Oceanic Biological Activity: Recent Results and New Perspectives for Future Studies, Adv. Meteorol., 2010, 310682, https://doi.org/10.1155/2010/310682, 2010. a
Rinaldi, M., Fuzzi, S., Decesari, S., Marullo, S., Santoleri, R., Provenzale, A., Von Hardenberg, J., Ceburnis, D., Vaishya, A., O'Dowd, C. D., and Facchini, M. C.: Is Chlorophyll-a the Best Surrogate for Organic Matter Enrichment in Submicron Primary Marine Aerosol?, J. Geophys. Res.-Atmos., 118, 4964–4973, https://doi.org/10.1002/jgrd.50417, 2013. a
Rollins, A. W., Thornberry, T. D., Ciciora, S. J., McLaughlin, R. J., Watts, L. A., Hanisco, T. F., Baumann, E., Giorgetta, F. R., Bui, T. V., Fahey, D. W., and Gao, R.-S.: A laser-induced fluorescence instrument for aircraft measurements of sulfur dioxide in the upper troposphere and lower stratosphere, Atmos. Meas. Tech., 9, 4601–4613, https://doi.org/10.5194/amt-9-4601-2016, 2016. a
Russo, M. R., Bartholomew, S. L., Hassell, D., Mason, A. M., Neininger, E., Perman, A. J., Sproson, D. A. J., Watson-Parris, D., and Abraham, N. L.: Virtual Integration of Satellite and In-situ Observation Networks (VISION) v1.0: In-Situ Observations Simulator (ISO_simulator), Geosci. Model Dev., 18, 181–191, https://doi.org/10.5194/gmd-18-181-2025, 2025. a
Schill, G. P., Froyd, K. D., Murphy, D. M., Williamson, C. J., Brock, C. A., Sherwen, T., Evans, M. J., Ray, E. A., Apel, E. C., Hornbrook, R. S., Hills, A. J., Peischl, J., Ryerson, T. B., Thompson, C. R., Bourgeois, I., Blake, D. R., DiGangi, J. P., and Diskin, G. S.: Widespread trace bromine and iodine in remote tropospheric non-sea-salt aerosols, Atmos. Chem. Phys., 25, 45–71, https://doi.org/10.5194/acp-25-45-2025, 2025. a
Scott, C. E., Rap, A., Spracklen, D. V., Forster, P. M., Carslaw, K. S., Mann, G. W., Pringle, K. J., Kivekäs, N., Kulmala, M., Lihavainen, H., and Tunved, P.: The direct and indirect radiative effects of biogenic secondary organic aerosol, Atmos. Chem. Phys., 14, 447–470, https://doi.org/10.5194/acp-14-447-2014, 2014. a
Seinfeld, J. H., Bretherton, C., Carslaw, K. S., Coe, H., DeMott, P. J., Dunlea, E. J., Feingold, G., Ghan, S., Guenther, A. B., Kahn, R., Kraucunas, I., Kreidenweis, S. M., Molina, M. J., Nenes, A., Penner, J. E., Prather, K. A., Ramanathan, V., Ramaswamy, V., Rasch, P. J., Ravishankara, A. R., Rosenfeld, D., Stephens, G., and Wood, R.: Improving Our Fundamental Understanding of the Role of Aerosol-cloud Interactions in the Climate System, P. Natl. Acad. Sci. USA, 113, 5781–5790, https://doi.org/10.1073/pnas.1514043113, 2016. a
Sellar, A. A., Jones, C. G., Mulcahy, J. P., Tang, Y., Yool, A., Wiltshire, A., O'Connor, F. M., Stringer, M., Hill, R., Palmieri, J., Woodward, S., Mora, L., Kuhlbrodt, T., Rumbold, S. T., Kelley, D. I., Ellis, R., Johnson, C. E., Walton, J., Abraham, N. L., Andrews, M. B., Andrews, T., Archibald, A. T., Berthou, S., Burke, E., Blockley, E., Carslaw, K., Dalvi, M., Edwards, J., Folberth, G. A., Gedney, N., Griffiths, P. T., Harper, A. B., Hendry, M. A., Hewitt, A. J., Johnson, B., Jones, A., Jones, C. D., Keeble, J., Liddicoat, S., Morgenstern, O., Parker, R. J., Predoi, V., Robertson, E., Siahaan, A., Smith, R. S., Swaminathan, R., Woodhouse, M. T., Zeng, G., and Zerroukat, M.: UKESM1: Description and Evaluation of the U.K. Earth System Model, J. Adv. Model. Earth Sy., 11, 4513–4558, https://doi.org/10.1029/2019MS001739, 2019. a, b, c
Shen, J., Scholz, W., He, X.-C., Zhou, P., Marie, G., Wang, M., Marten, R., Surdu, M., Rörup, B., Baalbaki, R., Amorim, A., Ataei, F., Bell, D. M., Bertozzi, B., Brasseur, Z., Caudillo, L., Chen, D., Chu, B., Dada, L., Duplissy, J., Finkenzeller, H., Granzin, M., Guida, R., Heinritzi, M., Hofbauer, V., Iyer, S., Kemppainen, D., Kong, W., Krechmer, J. E., Kürten, A., Lamkaddam, H., Lee, C. P., Lopez, B., Mahfouz, N. G. A., Manninen, H. E., Massabò, D., Mauldin, R. L., Mentler, B., Müller, T., Pfeifer, J., Philippov, M., Piedehierro, A. A., Roldin, P., Schobesberger, S., Simon, M., Stolzenburg, D., Tham, Y. J., Tomé, A., Umo, N. S., Wang, D., Wang, Y., Weber, S. K., Welti, A., Wollesen de Jonge, R., Wu, Y., Zauner-Wieczorek, M., Zust, F., Baltensperger, U., Curtius, J., Flagan, R. C., Hansel, A., Möhler, O., Petäjä, T., Volkamer, R., Kulmala, M., Lehtipalo, K., Rissanen, M., Kirkby, J., El-Haddad, I., Bianchi, F., Sipilä, M., Donahue, N. M., and Worsnop, D. R.: High Gas-Phase Methanesulfonic Acid Production in the OH-Initiated Oxidation of Dimethyl Sulfide at Low Temperatures, Environ. Sci. Technol., 56, 13931–13944, https://doi.org/10.1021/acs.est.2c05154, 2022. a
Shen, J., Russell, D. M., DeVivo, J., Kunkler, F., Baalbaki, R., Mentler, B., Scholz, W., Yu, W., Caudillo-Plath, L., Sommer, E., Ahongshangbam, E., Alfaouri, D., Almeida, J., Amorim, A., Beck, L. J., Beckmann, H., Berntheusel, M., Bhattacharyya, N., Canagaratna, M. R., Chassaing, A., Cruz-Simbron, R., Dada, L., Duplissy, J., Gordon, H., Granzin, M., Große Schute, L., Heinritzi, M., Iyer, S., Klebach, H., Krüger, T., Kürten, A., Lampimäki, M., Liu, L., Lopez, B., Martinez, M., Morawiec, A., Onnela, A., Peltola, M., Rato, P., Reza, M., Richter, S., Rörup, B., Sebastian, M. K., Simon, M., Surdu, M., Tamme, K., Thakur, R. C., Tomé, A., Tong, Y., Top, J., Umo, N. S., Unfer, G., Vettikkat, L., Weissbacher, J., Xenofontos, C., Yang, B., Zauner-Wieczorek, M., Zhang, J., Zheng, Z., Baltensperger, U., Christoudias, T., Flagan, R. C., El Haddad, I., Junninen, H., Möhler, O., Riipinen, I., Rohner, U., Schobesberger, S., Volkamer, R., Winkler, P. M., Hansel, A., Lehtipalo, K., Donahue, N. M., Lelieveld, J., Harder, H., Kulmala, M., Worsnop, D. R., Kirkby, J., Curtius, J., and He, X.-C.: New Particle Formation from Isoprene under Upper-Tropospheric Conditions, Nature, 636, 115–123, https://doi.org/10.1038/s41586-024-08196-0, 2024. a, b, c, d, e, f, g, h, i, j
Sipilä, M., Sarnela, N., Jokinen, T., Henschel, H., Junninen, H., Kontkanen, J., Richters, S., Kangasluoma, J., Franchin, A., Peräkylä, O., Rissanen, M. P., Ehn, M., Vehkamäki, H., Kurten, T., Berndt, T., Petäjä, T., Worsnop, D., Ceburnis, D., Kerminen, V.-M., Kulmala, M., and O'Dowd, C.: Molecular-Scale Evidence of Aerosol Particle Formation via Sequential Addition of HIO3, Nature, 537, 532–534, https://doi.org/10.1038/nature19314, 2016. a
Spiro, P. A., Jacob, D. J., and Logan, J. A.: Global Inventory of Sulfur Emissions with 1° × 1° Resolution, J. Geophys. Res.-Atmos., 97, 6023–6036, https://doi.org/10.1029/91JD03139, 1992. a
Stier, P., Feichter, J., Kinne, S., Kloster, S., Vignati, E., Wilson, J., Ganzeveld, L., Tegen, I., Werner, M., Balkanski, Y., Schulz, M., Boucher, O., Minikin, A., and Petzold, A.: The aerosol-climate model ECHAM5-HAM, Atmos. Chem. Phys., 5, 1125–1156, https://doi.org/10.5194/acp-5-1125-2005, 2005. a, b
Surratt, J. D., Chan, A. W. H., Eddingsaas, N. C., Chan, M., Loza, C. L., Kwan, A. J., Hersey, S. P., Flagan, R. C., Wennberg, P. O., and Seinfeld, J. H.: Reactive Intermediates Revealed in Secondary Organic Aerosol Formation from Isoprene, P. Natl. Acad. Sci. USA, 107, 6640–6645, https://doi.org/10.1073/pnas.0911114107, 2010. a
Svenhag, C., Sporre, M. K., Olenius, T., Yazgi, D., Blichner, S. M., Nieradzik, L. P., and Roldin, P.: Implementing detailed nucleation predictions in the Earth system model EC-Earth3.3.4: sulfuric acid–ammonia nucleation, Geosci. Model Dev., 17, 4923–4942, https://doi.org/10.5194/gmd-17-4923-2024, 2024. a
Telford, P. J., Braesicke, P., Morgenstern, O., and Pyle, J. A.: Technical Note: Description and assessment of a nudged version of the new dynamics Unified Model, Atmos. Chem. Phys., 8, 1701–1712, https://doi.org/10.5194/acp-8-1701-2008, 2008. a
Thompson, C. R., Wofsy, S. C., Prather, M. J., Newman, P. A., Hanisco, T. F., Ryerson, T. B., Fahey, D. W., Apel, E. C., Brock, C. A., Brune, W. H., Froyd, K., Katich, J. M., Nicely, J. M., Peischl, J., Ray, E., Veres, P. R., Wang, S., Allen, H. M., Asher, E., Bian, H., Blake, D., Bourgeois, I., Budney, J., Bui, T. P., Butler, A., Campuzano-Jost, P., Chang, C., Chin, M., Commane, R., Correa, G., Crounse, J. D., Daube, B., Dibb, J. E., DiGangi, J. P., Diskin, G. S., Dollner, M., Elkins, J. W., Fiore, A. M., Flynn, C. M., Guo, H., Hall, S. R., Hannun, R. A., Hills, A., Hintsa, E. J., Hodzic, A., Hornbrook, R. S., Huey, L. G., Jimenez, J. L., Keeling, R. F., Kim, M. J., Kupc, A., Lacey, F., Lait, L. R., Lamarque, J.-F., Liu, J., McKain, K., Meinardi, S., Miller, D. O., Montzka, S. A., Moore, F. L., Morgan, E. J., Murphy, D. M., Murray, L. T., Nault, B. A., Neuman, J. A., Nguyen, L., Gonzalez, Y., Rollins, A., Rosenlof, K., Sargent, M., Schill, G., Schwarz, J. P., Clair, J. M. S., Steenrod, S. D., Stephens, B. B., Strahan, S. E., Strode, S. A., Sweeney, C., Thames, A. B., Ullmann, K., Wagner, N., Weber, R., Weinzierl, B., Wennberg, P. O., Williamson, C. J., Wolfe, G. M., and Zeng, L.: The NASA Atmospheric Tomography (ATom) Mission: Imaging the Chemistry of the Global Atmosphere, B. Am. Meteorol. Soc., 103, E761–E790, https://doi.org/10.1175/BAMS-D-20-0315.1, 2022. a, b
Thornhill, G., Collins, W., Olivié, D., Skeie, R. B., Archibald, A., Bauer, S., Checa-Garcia, R., Fiedler, S., Folberth, G., Gjermundsen, A., Horowitz, L., Lamarque, J.-F., Michou, M., Mulcahy, J., Nabat, P., Naik, V., O'Connor, F. M., Paulot, F., Schulz, M., Scott, C. E., Séférian, R., Smith, C., Takemura, T., Tilmes, S., Tsigaridis, K., and Weber, J.: Climate-driven chemistry and aerosol feedbacks in CMIP6 Earth system models, Atmos. Chem. Phys., 21, 1105–1126, https://doi.org/10.5194/acp-21-1105-2021, 2021. a, b
Tsigaridis, K., Daskalakis, N., Kanakidou, M., Adams, P. J., Artaxo, P., Bahadur, R., Balkanski, Y., Bauer, S. E., Bellouin, N., Benedetti, A., Bergman, T., Berntsen, T. K., Beukes, J. P., Bian, H., Carslaw, K. S., Chin, M., Curci, G., Diehl, T., Easter, R. C., Ghan, S. J., Gong, S. L., Hodzic, A., Hoyle, C. R., Iversen, T., Jathar, S., Jimenez, J. L., Kaiser, J. W., Kirkevåg, A., Koch, D., Kokkola, H., Lee, Y. H., Lin, G., Liu, X., Luo, G., Ma, X., Mann, G. W., Mihalopoulos, N., Morcrette, J.-J., Müller, J.-F., Myhre, G., Myriokefalitakis, S., Ng, N. L., O'Donnell, D., Penner, J. E., Pozzoli, L., Pringle, K. J., Russell, L. M., Schulz, M., Sciare, J., Seland, Ø., Shindell, D. T., Sillman, S., Skeie, R. B., Spracklen, D., Stavrakou, T., Steenrod, S. D., Takemura, T., Tiitta, P., Tilmes, S., Tost, H., van Noije, T., van Zyl, P. G., von Salzen, K., Yu, F., Wang, Z., Wang, Z., Zaveri, R. A., Zhang, H., Zhang, K., Zhang, Q., and Zhang, X.: The AeroCom evaluation and intercomparison of organic aerosol in global models, Atmos. Chem. Phys., 14, 10845–10895, https://doi.org/10.5194/acp-14-10845-2014, 2014. a
Tunved, P., Hansson, H.-C., Kerminen, V.-M., Ström, J., Maso, M. D., Lihavainen, H., Viisanen, Y., Aalto, P. P., Komppula, M., and Kulmala, M.: High Natural Aerosol Loading over Boreal Forests, Science, 312, 261–263, https://doi.org/10.1126/science.1123052, 2006. a
Twomey, S.: The Influence of Pollution on the Shortwave Albedo of Clouds, J. Atmos. Sci., 34, 1149–1152, https://doi.org/10.1175/1520-0469(1977)034<1149:TIOPOT>2.0.CO;2, 1977. a
van Marle, M. J. E., Kloster, S., Magi, B. I., Marlon, J. R., Daniau, A.-L., Field, R. D., Arneth, A., Forrest, M., Hantson, S., Kehrwald, N. M., Knorr, W., Lasslop, G., Li, F., Mangeon, S., Yue, C., Kaiser, J. W., and van der Werf, G. R.: Historic global biomass burning emissions for CMIP6 (BB4CMIP) based on merging satellite observations with proxies and fire models (1750–2015), Geosci. Model Dev., 10, 3329–3357, https://doi.org/10.5194/gmd-10-3329-2017, 2017. a
Vehkamäki, H., Kulmala, M., Napari, I., Lehtinen, K. E. J., Timmreck, C., Noppel, M., and Laaksonen, A.: An Improved Parameterization for Sulfuric Acid–Water Nucleation Rates for Tropospheric and Stratospheric Conditions, J. Geophys. Res.-Atmos., 107, https://doi.org/10.1029/2002JD002184, 2002. a, b, c, d, e, f, g
Venugopal, A. U., Bhatti, Y. A., Morgenstern, O., Williams, J., Edkins, N., Hardacre, C., Jones, A., and Revell, L. E.: Constraining the Uncertainty Associated With Sea Salt Aerosol Parameterizations in Global Models Using Nudged UKESM1-AMIP Simulations, J. Geophys. Res.-Atmos., 130, e2024JD041643, https://doi.org/10.1029/2024JD041643, 2025. a
Veres, P. R., Neuman, J. A., Bertram, T. H., Assaf, E., Wolfe, G. M., Williamson, C. J., Weinzierl, B., Tilmes, S., Thompson, C. R., Thames, A. B., Schroder, J. C., Saiz-Lopez, A., Rollins, A. W., Roberts, J. M., Price, D., Peischl, J., Nault, B. A., Møller, K. H., Miller, D. O., Meinardi, S., Li, Q., Lamarque, J.-F., Kupc, A., Kjaergaard, H. G., Kinnison, D., Jimenez, J. L., Jernigan, C. M., Hornbrook, R. S., Hills, A., Dollner, M., Day, D. A., Cuevas, C. A., Campuzano-Jost, P., Burkholder, J., Bui, T. P., Brune, W. H., Brown, S. S., Brock, C. A., Bourgeois, I., Blake, D. R., Apel, E. C., and Ryerson, T. B.: Global Airborne Sampling Reveals a Previously Unobserved Dimethyl Sulfide Oxidation Mechanism in the Marine Atmosphere, P. Natl. Acad. Sci. USA, p. 201919344, https://doi.org/10.1073/pnas.1919344117, 2020. a
von Glasow, R. and Crutzen, P. J.: Model study of multiphase DMS oxidation with a focus on halogens, Atmos. Chem. Phys., 4, 589–608, https://doi.org/10.5194/acp-4-589-2004, 2004. a
Wang, Y. and Jacob, D. J.: Anthropogenic Forcing on Tropospheric Ozone and OH since Preindustrial Times, J. Geophys. Res.-Atmos., 103, 31123–31135, https://doi.org/10.1029/1998JD100004, 1998. a
Wang, Z., Wang, C., Yang, S., Lei, Y., Che, H., Zhang, X., and Wang, Q.: Evaluation of Surface Solar Radiation Trends over China since the 1960s in the CMIP6 Models and Potential Impact of Aerosol Emissions, Atmos. Res., 268, 105991, https://doi.org/10.1016/j.atmosres.2021.105991, 2022. a
Weber, J., Archer-Nicholls, S., Abraham, N. L., Shin, Y. M., Bannan, T. J., Percival, C. J., Bacak, A., Artaxo, P., Jenkin, M., Khan, M. A. H., Shallcross, D. E., Schwantes, R. H., Williams, J., and Archibald, A. T.: Improvements to the representation of BVOC chemistry–climate interactions in UKCA (v11.5) with the CRI-Strat 2 mechanism: incorporation and evaluation, Geosci. Model Dev., 14, 5239–5268, https://doi.org/10.5194/gmd-14-5239-2021, 2021. a, b, c, d, e, f
Weber, J., Archer-Nicholls, S., Abraham, N. L., Shin, Y. M., Griffiths, P., Grosvenor, D. P., Scott, C. E., and Archibald, A. T.: Chemistry-Driven Changes Strongly Influence Climate Forcing from Vegetation Emissions, Nat. Commun., 13, 7202, https://doi.org/10.1038/s41467-022-34944-9, 2022. a
Williams, K. D., Copsey, D., Blockley, E. W., Bodas-Salcedo, A., Calvert, D., Comer, R., Davis, P., Graham, T., Hewitt, H. T., Hill, R., Hyder, P., Ineson, S., Johns, T. C., Keen, A. B., Lee, R. W., Megann, A., Milton, S. F., Rae, J. G. L., Roberts, M. J., Scaife, A. A., Schiemann, R., Storkey, D., Thorpe, L., Watterson, I. G., Walters, D. N., West, A., Wood, R. A., Woollings, T., and Xavier, P. K.: The Met Office Global Coupled Model 3.0 and 3.1 (GC3.0 and GC3.1) Configurations, J. Adv. Model. Earth Sy., 10, 357–380, https://doi.org/10.1002/2017MS001115, 2018. a
Williamson, C., Kupc, A., Wilson, J., Gesler, D. W., Reeves, J. M., Erdesz, F., McLaughlin, R., and Brock, C. A.: Fast time response measurements of particle size distributions in the 3–60 nm size range with the nucleation mode aerosol size spectrometer, Atmos. Meas. Tech., 11, 3491–3509, https://doi.org/10.5194/amt-11-3491-2018, 2018. a
Williamson, C. J., Kupc, A., Axisa, D., Bilsback, K. R., Bui, T., Campuzano-Jost, P., Dollner, M., Froyd, K. D., Hodshire, A. L., Jimenez, J. L., Kodros, J. K., Luo, G., Murphy, D. M., Nault, B. A., Ray, E. A., Weinzierl, B., Wilson, J. C., Yu, F., Yu, P., Pierce, J. R., and Brock, C. A.: A Large Source of Cloud Condensation Nuclei from New Particle Formation in the Tropics, Nature, 574, 399–403, https://doi.org/10.1038/s41586-019-1638-9, 2019. a, b, c, d, e, f
Williamson, C. J., Kupc, A., Rollins, A., Kazil, J., Froyd, K. D., Ray, E. A., Murphy, D. M., Schill, G. P., Peischl, J., Thompson, C., Bourgeois, I., Ryerson, T. B., Diskin, G. S., DiGangi, J. P., Blake, D. R., Bui, T. P. V., Dollner, M., Weinzierl, B., and Brock, C. A.: Large hemispheric difference in nucleation mode aerosol concentrations in the lowermost stratosphere at mid- and high latitudes, Atmos. Chem. Phys., 21, 9065–9088, https://doi.org/10.5194/acp-21-9065-2021, 2021. a
Wofsy, S., Afshar, S., Allen, H., Apel, E., Asher, E., Barletta, B., Bent, J., Bian, H., Biggs, B., Blake, D., Blake, N., Bourgeois, I., Brock, C., Brune, W., Budney, J., Bui, T., Butler, A., Campuzano-Jost, P., Chang, C., Chin, M., Commane, R., Correa, G., Crounse, J., Cullis, P., Daube, B., Day, D., Dean-Day, J., Dibb, J., DiGangi, J., Diskin, G., Dollner, M., Elkins, J., Erdesz, F., Fiore, A., Flynn, C., Froyd, K., Gesler, D., Hall, S., Hanisco, T., Hannun, R., Hills, A., Hintsa, E., Hoffman, A., Hornbrook, R., Huey, L., Hughes, S., Jimenez, J., Johnson, B., Katich, J., Keeling, R., Kim, M., Kupc, A., Lait, L., McKain, K., Mclaughlin, R., Meinardi, S., Miller, D., Montzka, S., Moore, F., Morgan, E., Murphy, D., Murray, L., Nault, B., Neuman, J., Newman, P., Nicely, J., Pan, X., Paplawsky, W., Peischl, J., Prather, M., Price, D., Ray, E., Reeves, J., Richardson, M., Rollins, A., Rosenlof, K., Ryerson, T., Scheuer, E., Schill, G., Schroder, J., Schwarz, J., St.Clair, J., Steenrod, S., Stephens, B., Strode, S., Sweeney, C., Tanner, D., Teng, A., Thames, A., Thompson, C., Ullmann, K., Veres, P., Wagner, N., Watt, A., Weber, R., Weinzierl, B., Wennberg, P., Williamson, C., Wilson, J., Wolfe, G., Woods, C., Zeng, L., and Vieznor, N.: ATom: Merged Atmospheric Chemistry, Trace Gases, and Aerosols, Version 2 (Version 2.0), ORNL Distributed Active Archive Center [data set], https://doi.org/10.3334/ORNLDAAC/1925, 2021. a, b, c, d, e
Woodward, S.: Modeling the Atmospheric Life Cycle and Radiative Impact of Mineral Dust in the Hadley Centre Climate Model, J. Geophys. Res.-Atmos., 106, 18155–18166, https://doi.org/10.1029/2000JD900795, 2001. a, b
Yan, C., Yin, R., Lu, Y., Dada, L., Yang, D., Fu, Y., Kontkanen, J., Deng, C., Garmash, O., Ruan, J., Baalbaki, R., Schervish, M., Cai, R., Bloss, M., Chan, T., Chen, T., Chen, Q., Chen, X., Chen, Y., Chu, B., Dällenbach, K., Foreback, B., He, X., Heikkinen, L., Jokinen, T., Junninen, H., Kangasluoma, J., Kokkonen, T., Kurppa, M., Lehtipalo, K., Li, H., Li, H., Li, X., Liu, Y., Ma, Q., Paasonen, P., Rantala, P., Pileci, R. E., Rusanen, A., Sarnela, N., Simonen, P., Wang, S., Wang, W., Wang, Y., Xue, M., Yang, G., Yao, L., Zhou, Y., Kujansuu, J., Petäjä, T., Nie, W., Ma, Y., Ge, M., He, H., Donahue, N. M., Worsnop, D. R., Veli-Matti Kerminen, Wang, L., Liu, Y., Zheng, J., Kulmala, M., Jiang, J., and Bianchi, F.: The Synergistic Role of Sulfuric Acid, Bases, and Oxidized Organics Governing New-Particle Formation in Beijing, Geophys. Res. Lett., 48, https://doi.org/10.1029/2020GL091944, 2021. a
Yokouchi, Y. and Ambe, Y.: Aerosols Formed from the Chemical Reaction of Monoterpenes and Ozone, Atmos. Environ., 19, 1271–1276, https://doi.org/10.1016/0004-6981(85)90257-4, 1985. a
Yu, F., Nadykto, A. B., Luo, G., and Herb, J.: H2SO4–H2O binary and ternary homogeneous and ion-mediated nucleation: lookup tables version 1.0 for 3-D modeling application, Geosci. Model Dev., 13, 2663–2670, https://doi.org/10.5194/gmd-13-2663-2020, 2020. a, b
Yu, P., Froyd, K. D., Portmann, R. W., Toon, O. B., Freitas, S. R., Bardeen, C. G., Brock, C., Fan, T., Gao, R.-S., Katich, J. M., Kupc, A., Liu, S., Maloney, C., Murphy, D. M., Rosenlof, K. H., Schill, G., Schwarz, J. P., and Williamson, C.: Efficient In-Cloud Removal of Aerosols by Deep Convection, Geophys. Res. Lett., 46, 1061–1069, https://doi.org/10.1029/2018GL080544, 2019. a
Zhang, Y., Li, D., He, X.-C., Nie, W., Deng, C., Cai, R., Liu, Y., Guo, Y., Liu, C., Li, Y., Chen, L., Li, Y., Hua, C., Liu, T., Wang, Z., Xie, J., Wang, L., Petäjä, T., Bianchi, F., Qi, X., Chi, X., Paasonen, P., Liu, Y., Yan, C., Jiang, J., Ding, A., and Kulmala, M.: Iodine oxoacids and their roles in sub-3 nm particle growth in polluted urban environments, Atmos. Chem. Phys., 24, 1873–1893, https://doi.org/10.5194/acp-24-1873-2024, 2024. a
Zhao, B., Donahue, N. M., Zhang, K., Mao, L., Shrivastava, M., Ma, P.-L., Shen, J., Wang, S., Sun, J., Gordon, H., Tang, S., Fast, J., Wang, M., Gao, Y., Yan, C., Singh, B., Li, Z., Huang, L., Lou, S., Lin, G., Wang, H., Jiang, J., Ding, A., Nie, W., Qi, X., Chi, X., and Wang, L.: Global Variability in Atmospheric New Particle Formation Mechanisms, Nature, 631, 98–105, https://doi.org/10.1038/s41586-024-07547-1, 2024. a, b, c, d