the Creative Commons Attribution 4.0 License.
the Creative Commons Attribution 4.0 License.
 | 09 Mar 2026
Quasi-Lagrangian observations of cloud transitions during the initial phase of marine cold air outbreaks in the Arctic – Part 1: Temporal and spatial evolution
Anna Weber
Benjamin Kirbus
Manfred Wendisch
Bernhard Mayer
This work aims to quantify the macrophysical and microphysical properties of Arctic mixed-phase clouds and their temporal and spatial evolution during marine cold air outbreaks in the Arctic. In particular, cloud thermodynamic phase partitioning and phase transitions are discussed. To this end, high-resolution observations from the airborne hyperspectral and polarized imaging system specMACS during the HALO–(𝒜𝒞)3 campaign are analyzed within a quasi-Lagrangian framework based on backward airmass trajectories. Six flights targeting marine cold air outbreaks of different intensity are compared to investigate the variability of cloud evolution. With increasing time the airmass spent above open, sea ice-free ocean, rising cloud top heights, increasing horizontal cloud extents, and growing effective radii of liquid cloud droplets are observed for all cases. In addition, a phase transition from the liquid water to the mixed-phase cloud regime is detected and the ice fraction increases with time. The variability between the observed cloud properties during the cold air outbreaks is large. Larger and faster increasing cloud top heights and effective radii of liquid cloud droplets are observed during stronger events. In addition, the phase transition from the liquid water to the mixed phase occurs earlier and larger ice fractions are reached during the more intense events. The presented data and analyses provide unique observational data, which can be used to improve the representation of low-level Arctic mixed-phase clouds and their evolution during marine cold air outbreaks in models in the future.
- Article
(8125 KB) - Full-text XML
- BibTeX
- EndNote


During marine cold air outbreaks (MCAOs) in the Arctic, cold and dry airmasses are advected over the cold sea ice towards warm open ocean (Papritz and Spengler, 2017; Fletcher et al., 2016). The temperature difference between the advected cold airmasses and the ocean surface can reach 30 K (Papritz and Spengler, 2017). These enormous horizontal temperature gradients create large vertical surface energy fluxes (sensible and latent heat), intense turbulence, and large heat and moisture fluxes, which may contribute to about 60 % to 80 % of oceanic heat loss during winter in the Nordic Seas, and may affect additionally deep water formation and sea ice evolution (Papritz and Spengler, 2017; Svingen et al., 2023). Furthermore, the strong horizontal temperature gradients between the sea ice surface and ocean skin temperatures promote convection and the formation of low-level clouds (Papritz and Spengler, 2017). The clouds related to MCAOs typically organize into cloud streets oriented along the mean wind direction, which transform into cellular structures further downstream due to a decoupling of the atmospheric boundary layer (ABL) and accompanying precipitation formation (Brümmer, 1999; Gryschka and Raasch, 2005; McCoy et al., 2017; Abel et al., 2017; Pithan et al., 2018; Tornow et al., 2021). With increasing time and distance from the formation location of the MCAO, the ABL typically deepens from a few hundred meters to approximately 1 to 2 km (Brümmer, 1996). MCAOs are most frequently occurring in winter, but also evolve in spring and autumn (Fletcher et al., 2016). They may be related to severe weather events impacting the mid-latitudes, including extremely cold periods and heavy snowfall, and they may initiate polar lows (Pithan et al., 2018). The Fram Strait is one of the main pathways of MCAOs in the Arctic and intense MCAOs are frequently observed in this region (Papritz and Spengler, 2017; Dahlke et al., 2022).
Large-scale as well as high-resolution models are struggling to correctly represent the airmass transformations during meridional transports into and out of the Arctic (Sato et al., 2016; Pithan et al., 2016; Tomassini et al., 2017; Field et al., 2017; Wendisch et al., 2021). Especially the microphysical evolution of clouds during MCAOs is difficult to model (Pithan et al., 2014; McCoy et al., 2015; Tan and Storelvmo, 2019; Field et al., 2014; Abel et al., 2017). Consequently, future projections of Arctic climate properties are uncertain (Smith et al., 2019; Cohen et al., 2020; Block et al., 2020).
The clouds formed during MCAOs are commonly of a mixed-phase type. Arctic mixed-phase clouds have a typical vertical structure. A geometrically thin layer containing supercooled liquid water droplets is located at the cloud top from which ice crystals form via heterogeneous nucleation and sediment downwards (Morrison et al., 2012). The cloud thermodynamic phase partitioning and its spatial distribution are important cloud parameters, impacting the radiative effect of the clouds (Choi et al., 2014; Matus and L'Ecuyer, 2017). In addition, the distribution of supercooled liquid water droplets and ice crystals influence, e.g., riming and the efficiency of the Wegener-Bergeron-Findeisen process, which can lead to rapid glaciation of the clouds (Korolev et al., 2017; Korolev and Milbrandt, 2022), and thus affects cloud cover and lifetime (Pithan et al., 2014). Climate and general circulation models struggle to correctly represent mixed-phase clouds and their microphysical properties (Morrison et al., 2012; Pithan et al., 2014; Komurcu et al., 2014; Cesana et al., 2015, 2022). In particular, the cloud thermodynamic phase partitioning and the vertical distribution of cloud liquid water are challenging for models of different scales (Inoue et al., 2021; Kretzschmar et al., 2019, 2020).
MCAOs and the related clouds have been studied extensively using reanalysis data, ground-based and ship-borne sampling, airborne in situ and remote sensing measurements, satellite observations, as well as model data. Most studies used an Eulerian perspective with a locally fixed coordinate system, while some others applied a quasi-Lagrangian approach. In the Lagrangian perspective, the coordinate system follows the observed airmass, which allows for investigating its temporal evolution. However, true Lagrangian observations are challenging if not impossible (Wendisch et al., 2024). In the Arctic, no geostationary satellite data is available and aircrafts move much faster than the observed airmass. Instead, the evolution of airmasses can be studied in a quasi-Lagrangian way by applying backward trajectories (Wendisch et al., 2023, 2025).
Several studies focused on the properties of clouds during MCAOs. These include dedicated ground-based and ship-based field campaigns providing Eulerian observations of cloud properties (Uttal et al., 2002; Geerts et al., 2022; Shupe et al., 2022; Lackner et al., 2023; Mages et al., 2023; Wendisch et al., 2023; Xia and McFarquhar, 2024). In addition, the microphysical properties of the different cloud regimes during MCAOs and transitions between them were studied during airborne field campaigns using in situ data (Young et al., 2016; Abel et al., 2017; Lloyd et al., 2018; Michaelis et al., 2022) as well as remote sensing observations (Ruiz-Donoso et al., 2020). Besides, model data were applied to investigate the evolution of clouds in MCAOs (Tornow et al., 2021). Quasi-Lagrangian analyses of cloud properties during MCAOs combining satellite observations with backward airmass trajectories were carried out by Murray-Watson et al. (2023), Wu and Ovchinnikov (2022), Tornow et al. (2023), Mateling et al. (2023), and Seppala et al. (2025). These studies investigated the temporal evolution of macrophysical and microphysical cloud properties, as derived from MODIS or CloudSat data, and their dependence on the MCAO strength or aerosol conditions. However, satellite observations of Arctic cloud properties are only possible with polar-orbiting satellites and strongly affected by small-scale variability, which is not resolved by the coarse resolution satellite measurements (Ahn et al., 2018; Marchant et al., 2020). The retrieval of cloud thermodynamic phase partitioning and further cloud microphysical properties is especially challenging, and most satellite-based studies are restricted to liquid water clouds. Typical scales of inhomogeneities in Arctic clouds are on the order of a few hundred meters (Schäfer et al., 2017, 2018). These scales can be resolved by high-spatial resolution airborne measurements. Airborne quasi-Lagrangian observations of MCAO clouds in the Arctic were performed during the HALO–(𝒜𝒞)3 campaign (Wendisch et al., 2024). Even though several airborne research campaigns were conducted in the Arctic during the last decades (Forsberg et al., 2023) and some quasi-Lagrangian airborne measurements were collected outside the Arctic (Boettcher et al., 2021), HALO–(𝒜𝒞)3 appears to be the first airborne campaign using a quasi-Lagrangian sampling strategy in the Arctic. Schirmacher et al. (2024) analyzed the evolution of precipitation and other cloud properties in the roll convection regime using radar data in two case studies of a stronger and a weaker MCAO during HALO–(𝒜𝒞)3. However, the evolution of cloud thermodynamic phase and microphysical cloud properties has not been studied in a quasi-Lagrangian approach using high-resolution airborne measurements so far.
This work is based on measurements of the spectrometer of the Munich Aerosol Cloud Scanner (specMACS, Ewald et al., 2016; Weber et al., 2024a) during the airborne HALO–(𝒜𝒞)3 field campaign (Wendisch et al., 2024; Ehrlich et al., 2025). The campaign generally aimed at improving the understanding of airmass transformations during meridional transports into and out of the Arctic. To this end, the German High Altitude and LOng range research aircraft (HALO, Krautstrunk and Giez, 2012; Stevens et al., 2019) followed a quasi-Lagrangian flight strategy, allowing for studying the evolution of cloud properties during MCAOs. specMACS is a hyperspectral and polarized imaging system operated in a downward-looking perspective on board HALO. It provides high-spatial resolution information about cloud macrophysical and microphysical properties, including quantitative information about cloud thermodynamic phase partitioning.
The objective of this work is to study the temporal and spatial evolution of macrophysical and microphysical properties of clouds during MCAOs in a quasi-Lagrangian way, with a special focus on cloud thermodynamic phase partitioning and phase transitions. Aim is to provide high spatial and temporal resolution data about the evolution of clouds during the initial phase of MCAOs, which can be used for model evaluation to improve the representation of mixed-phase clouds and airmass transformations during MCAOs. Furthermore, the data can help to further our understanding of Arctic mixed-phase cloud processes and, in particular, phase changes in these clouds. For this purpose, measurements of cloud properties from specMACS are combined with backward trajectories. The applied data and methods are introduced in Sect. 2. During HALO–(𝒜𝒞)3, in total six MCAOs were sampled. The cloud evolution is investigated for a strong MCAO in Sect. 3.1. Afterwards, the analyses are extended to all observed cases. The variabiliy between the different observed MCAOs and the dependence of the cloud evolution on the MCAO intensity are discussed in Sect. 3.2. Finally, the results are summarized in Sect. 4. The analyses of the temporal and spatial cloud evolution during MCAOs presented here are extended to the vertical dimension in the second part of this work in Weber et al. (2025a), which investigates the vertical cloud structure and its evolution based on specMACS and other remote sensing and in situ measurements during HALO–(𝒜𝒞)3.
2.1 Measurements
The data used in this work were collected during the airborne HALO–(𝒜𝒞)3 measurement campaign in the Arctic (Wendisch et al., 2024; Ehrlich et al., 2025), which was conducted in March and April 2022. The German High Altitude and LOng range research aircraft (HALO, Krautstrunk and Giez, 2012; Stevens et al., 2019), based in Kiruna, was equipped with remote sensing instrumentation and followed a quasi-Lagrangian sampling strategy. In addition, several research flights were performed in coordination with the Polar 5 and Polar 6 aircraft (Wesche et al., 2016), operating out of Svalbard and containing remote sensing and in situ instrumentation. This work, however, focuses on data from HALO.
The analyses presented in this work are based on measurements of the specMACS instrument (Ewald et al., 2016; Weber et al., 2024a), which was operated in a downward-looking configuration on board HALO. specMACS consists of two hyperspectral line cameras (so-called VNIR and SWIR), which are sensitive to the visible and near-infrared wavelength range between 400 nm and 2500 nm, and two 2D RGB polarization-resolving cameras. The SWIR spectrometer used in this work has a field of view of 35.3° in across-track direction, and the polarization-resolving cameras have a maximum combined field of view of 91° × 117° in along-track and across-track direction, respectively, covering the entire field of view of the spectrometers. The different components of specMACS provide high-spatial-resolution measurements of macrophysical and microphysical cloud properties with spatial resolutions between 10 and 100 m at typical flight altitudes (10 km), depending on the retrieved quantity.
Macrophysical cloud properties that have been derived from the measurements include the cloud top height, the cloud fraction, and the horizontal extent of the clouds. The cloud top height is obtained from a stereographic retrieval using the method by Kölling et al. (2019). A model-based evaluation showed a mean difference of 46±140 m between the retrieved and simulated cloud top heights (Volkmer et al., 2024). The cloud fraction is calculated from the cloud mask by Pörtge et al. (2023), which is based on the brightness of the observed clouds. The threshold value distinguishing cloud-free and cloudy pixels is determined using the method by Otsu (1979). Small variations of the threshold value lead to slightly lower or higher cloud fractions but do not significantly change the results presented in the following sections. The horizontal cloud extent is derived from the 3D cloud geometry obtained from the stereographic retrieval using the watershedding algorithm implemented in the Tracking and Object-Based Analysis of Clouds (TOBAC) package (Heikenfeld et al., 2019; Sokolowsky et al., 2024). The algorithm provides the horizontal area of the identified cloud elements from which an effective cloud radius was calculated under the assumption of a circular shape. A more detailed description of the derivation of the horizontal cloud extent is provided in Appendix A.
Moreover, specMACS provides measurements of microphysical cloud properties. The effective radius of liquid cloud droplets is computed with the cloudbow retrieval by Pörtge et al. (2023). The retrieval is based on multi-angle polarization observations of the cloudbow, which is formed by single scattering on liquid cloud droplets, and the retrieved effective radii are thus representative for the cloud top, corresponding to an optical thickness of about 1. The effective radii of the liquid cloud droplets are determined by fitting polarized scattering phase functions according to Mie theory from a look-up table to the observations. The uncertainty of the measured effective radii of liquid cloud droplets from the cloudbow retrieval was characterized based on an evaluation with synthetic data, which showed mean differences between measured and simulated droplet radii of (Volkmer et al., 2024; Pörtge, 2024).
Information about the cloud thermodynamic phase is derived from the specMACS measurements following two different approaches based on spectral and polarization measurements, respectively. Firstly, the spectral ice index defined by Ehrlich et al. (2008) and Ruiz-Donoso et al. (2020) was calculated from the radiance measurements of the SWIR spectrometer. The ice index represents a qualitative measure of the thermodynamic phase of the cloud particles, exploiting spectral absorption differences between liquid water and ice in the near-infrared which lead to different spectral slopes depending on the thermodynamic phase. The resulting phase index represents the thermodynamic phase at the cloud top. However, the spectral measurements used to calculate the ice index originate from deeper layers within the cloud than the polarization measurements, since the polarization signal is dominated by single scattering. According to sensitivity studies based on radiative transfer simulations, values of the ice index below 20 indicate a liquid water cloud, values above 20 correspond to a mixed-phase cloud (Ehrlich et al., 2009).
Secondly, a quantitative optical ice fraction was derived from the measurements of the polarization-resolving cameras by applying the polarimetric phase partitioning retrieval introduced by Weber et al. (2025b). The ice fraction is defined as the ratio of the ice optical thickness to the total cloud optical thickness. It is determined by fitting multi-angle polarization signals from a forward operator to polarization measurements. The retrieved ice fractions correspond to the average ice fraction from the cloud top to an optical thickness of about 1 to 2 below the top under the assumption of homogeneously mixed clouds (Weber et al., 2025b). Depending on the observation and cloud geometry, different scattering angle ranges and retrieval configurations can be used. Here, the results of the polarimetric phase retrieval for the cloudbow angular range for the green color channel using the forward operator with the parameterization of 3D cloud geometry are shown, and only observations with saturated polarization signals are considered, because they provide the smallest uncertainties for Arctic mixed-phase clouds (Weber et al., 2025b). Nevertheless, the results have a high uncertainty, especially when the solar zenith angle is very large. A detailed discussion of retrieval uncertainties and more details to the phase retrieval can be found in Weber et al. (2025b).
Only measurements above open ocean were considered in the analyses. Over sea ice, retrievals based on passive remote sensing are tainted with additional uncertainties due to the influence of the high reflective surface, especially for thin clouds. In addition, it is challenging to correctly detect clouds above sea ice. While the stereographic retrieval and the cloudbow retrieval are only negligibly affected due to their particular retrieval methods, sea ice surfaces misidentified as clouds can lead to an overestimation of the retrieved cloud fraction and optical ice fraction in the marginal sea ice zone and above sea ice, since both retrievals rely on the applied cloud mask. The cloud mask for the measurements of the polarization-resolving cameras and hence the optical ice fraction is more strongly affected by sea ice than the cloud mask for the spectral measurements used to compute the spectral ice index. The reason is that the polarization-resolving cameras are sensitive to the visible wavelength range, where sea ice surfaces are bright. In contrast, a wavelength of 1640 nm, where sea ice is comparably dark, was used for the cloud mask of the spectral measurements. To exclude measurements above sea ice and filter the most uncertain measurements, a sea ice mask was computed from the combined AMSR2-MODIS sea ice dataset (Ludwig et al., 2020) and applied to the data. All observations and measurements with sea ice concentrations larger than 80 %, which is a typical choice for the definition of the sea ice edge, were excluded from further analysis. At this threshold value, sea ice still partially affects the measurements, but cloud formation begins as soon as small fractions of open ocean are present, and this initial phase should not be excluded from the analyses. Small variations of the threshold value did not significantly change the results. However, they showed more outliers in the measurements close to the sea ice edge or larger parts of the initial evolution of the clouds were excluded, respectively. Remaining issues due to the influence of the surface and misidentified sea ice apply only to measurements during the first minutes and kilometers above open ocean for the above-mentioned quantities. Measurements outside the marginal sea ice zone are not affected.
2.2 Backward trajectories
To study the evolution of cloud properties during the observed MCAOs in a quasi-Lagrangian framework, measurements and retrieval results were combined with backward airmass trajectories, which allow to assign every measurement the time or distance the airmass has traveled southwards since passing the sea ice edge. The backward trajectories were computed from ERA5 wind fields using Lagranto (Sprenger and Wernli, 2015). Every 1 min along each HALO flight track, a trajectory was initialized horizontally at the location of HALO, and vertically at 920 hPa pressure altitude, which roughly corresponds to cloud top. The trajectories were calculated backwards for 24 h also tracing the sea ice concentration (SIC) from the combined AMSR2-MODIS dataset (Ludwig et al., 2020). The obtained backward trajectories have an improved reliability as the dropsondes released from the HALO aircraft have been assimilated in ERA5. The trajectories cover comparably short timescales and therefore the influence of errors remains small (Kirbus et al., 2024).
The time and distance, the airmass traveled above open ocean, was computed for every trajectory by integrating the fraction of open water (1 − SIC) over time and distance, similar to Spensberger and Spengler (2021). For better comparability, the evolution of the cloud properties is analyzed both as a function of time and distance above open ocean, as some studies use time while others use distance. In addition, the wind speed is not constant along the trajectories.
2.3 Overview of the research flights
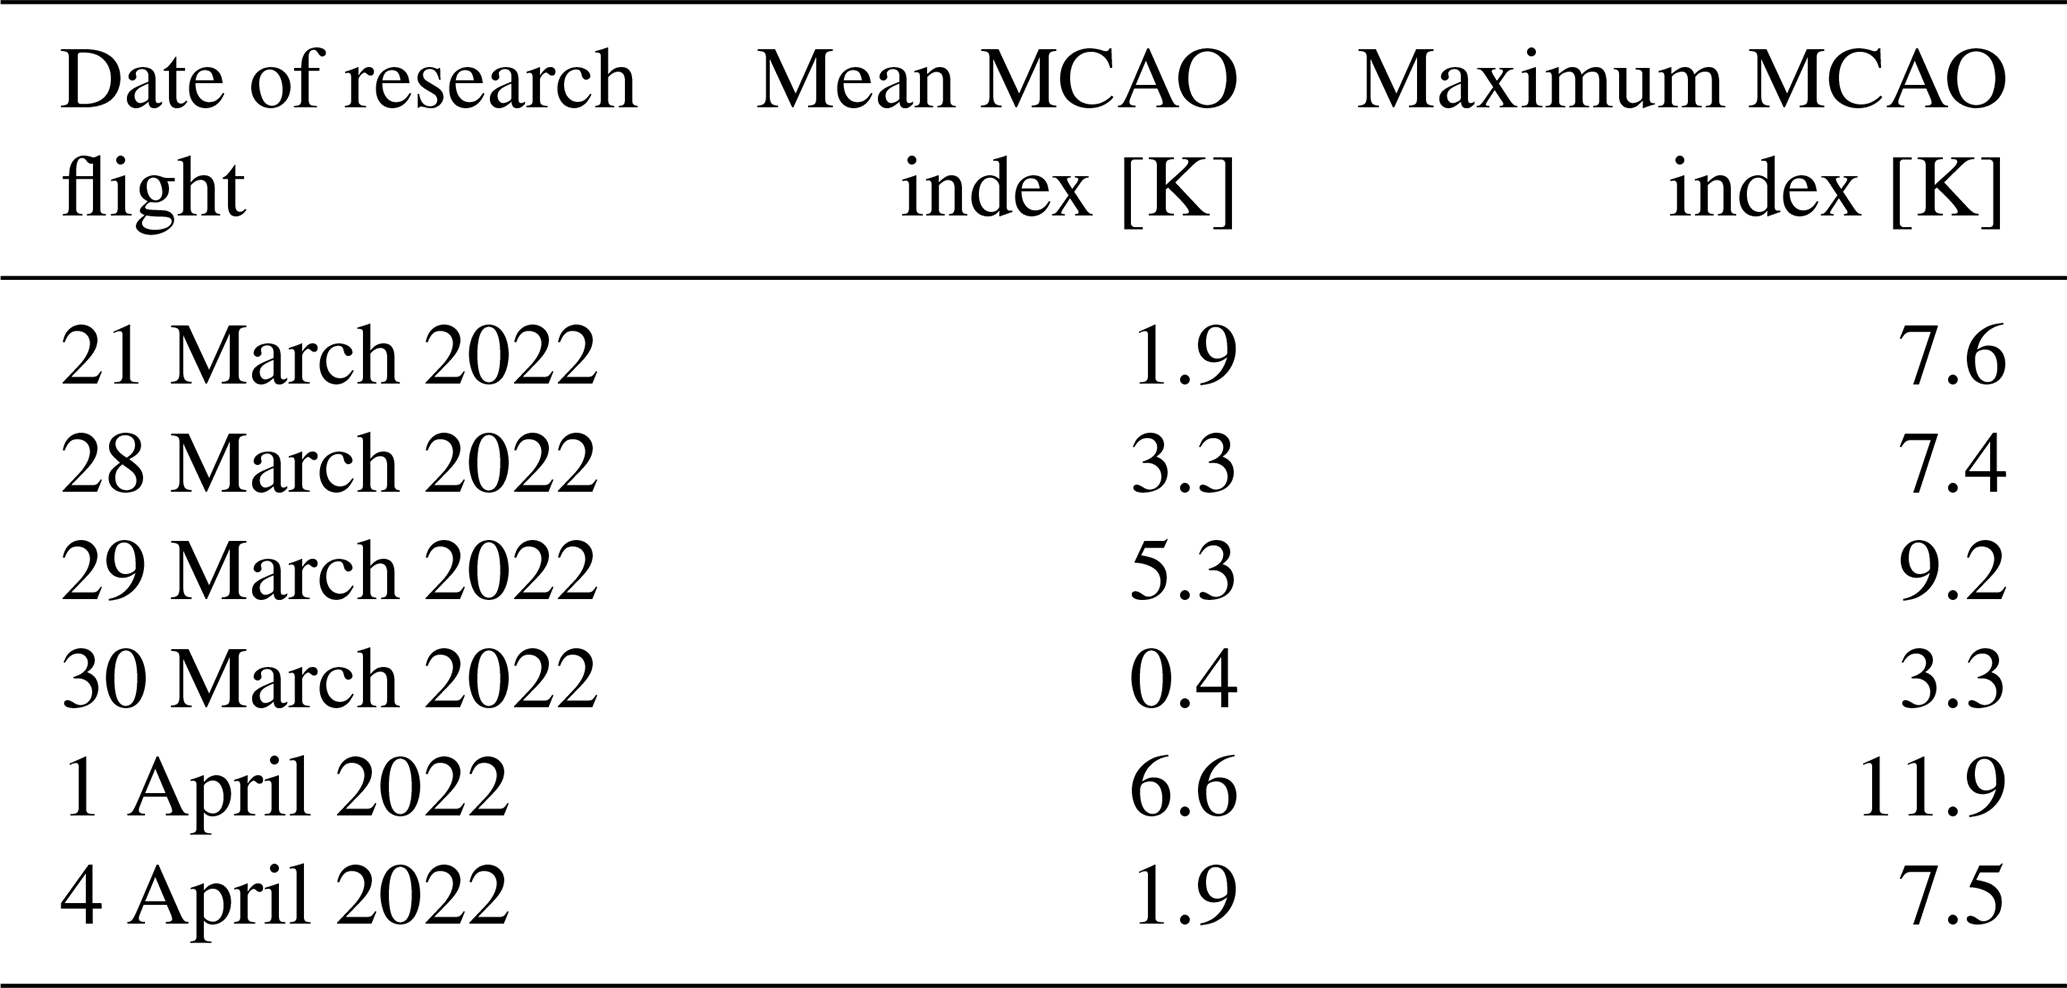
During HALO–(𝒜𝒞)3, MCAOs were sampled that evolved in different synoptic situations (Walbröl et al., 2024). Between 21 March 2022 and the end of the campaign on 12 April 2022, a long cold phase with several MCAOs occurred. Especially strong MCAO events, exceeding the 90th and 75th percentiles of the MCAO index climatology, were observed on 25 March 2022 and 2 April 2022, respectively (Walbröl et al., 2024). The strength of the MCAOs can be characterized through the MCAO index, which is defined as the difference of the potential skin temperature at the surface and the potential temperature at a pressure of 850 hPa (Fletcher et al., 2016)
Larger differences are related to more intense MCAOs. MCAOs with indices indicating temperature differences between are typically refered to as weak events, whereas MCAOs with and MCAO>8 K can be classified as moderate and strong events, respectively (Papritz and Spengler, 2017; Dahlke et al., 2022).
HALO conducted six flights during the cold phase of the campaign, which targeted MCAOs. An overview of the flights analyzed here is given in Fig. 1, where MODIS satellite images and the flight tracks and evaluated flight segments are shown for the research flights on 21 March 2022, 28 March 2022, 29 March 2022, 30 March 2022, 1 April 2022, and 4 April 2022. The research flights covered mostly the Fram Strait region, but for example on 29 March 2022 the area south-east of Svalbard was sampled. Some parts of the flights are affected by the topography of the island of Svalbard, causing, e.g., convergence lines downstream. The long cold period led to increasing sea ice extent north and south-east of Svalbard. The flight patterns mostly followed the quasi-Lagrangian sampling approach with flight legs oriented perpendicular to and along the wind direction (Wendisch et al., 2024).
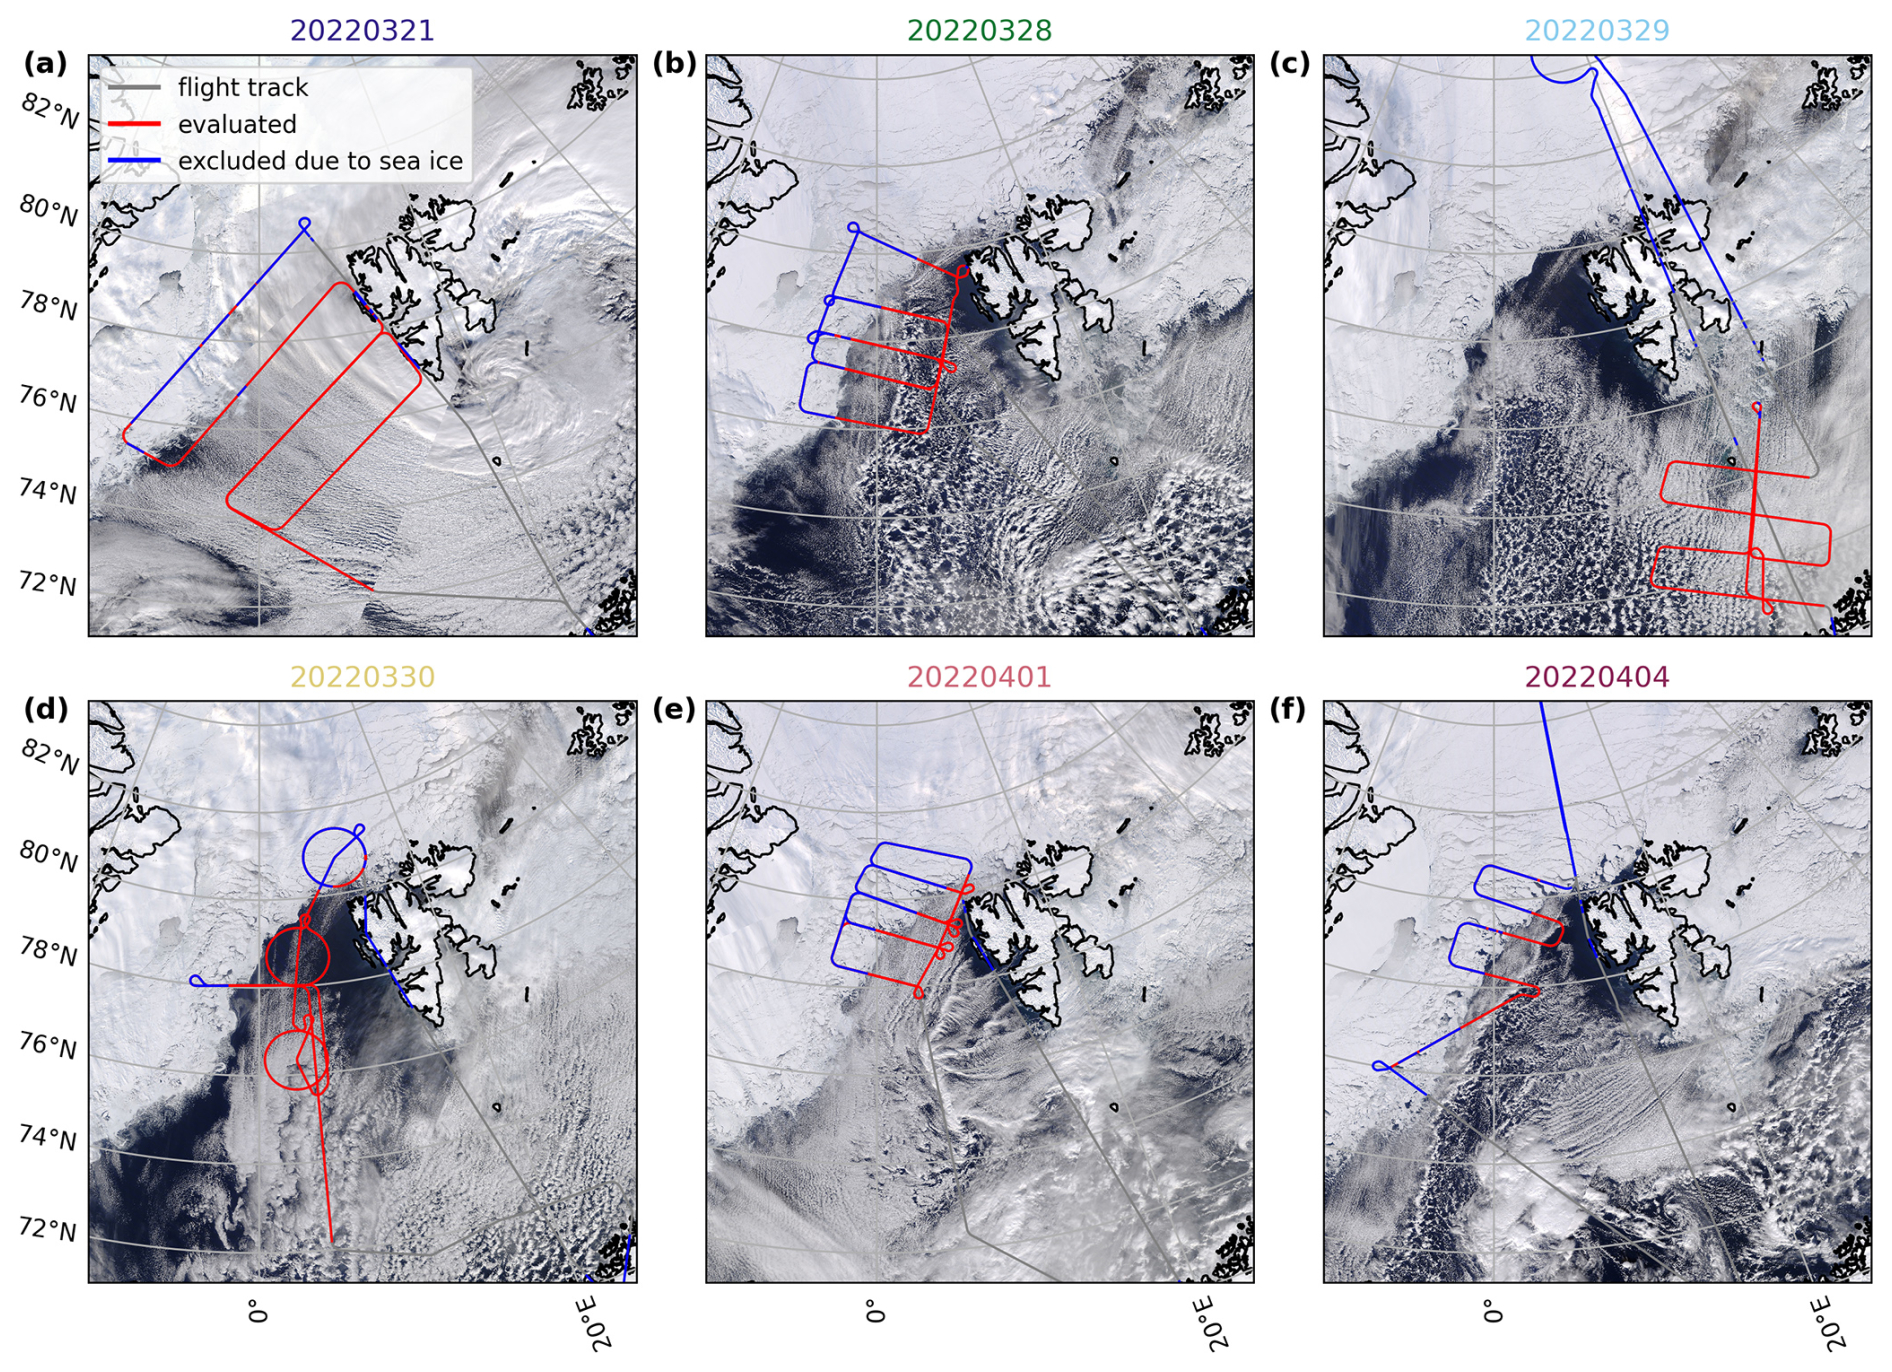
Figure 1MODIS satellite images (Corrected Reflectance (True Color)) from NASA Worldview (https://worldview.earthdata.nasa.gov/, last access: 3 March 2025) for all MCAO flights of HALO–(𝒜𝒞)3. The gray lines indicate the flight tracks, the red lines show the evaluated flight segments, and the blue lines are flight segments excluded due to sea ice.
The strength of the observed MCAOs varied between the different research flights. The mean and maximum values of the MCAO index along the flight tracks of all research flights computed from ERA5 data (Hersbach et al., 2023a, b) are summarized in Table 1. The strongest observed MCAO events were on 1 April 2022 and on 29 March 2022. Weaker MCAO conditions were, for example, measured on 30 March 2022. In addition, the flights sampled different parts of the MCAOs. For example, the research flight on 1 April 2022 focused on the very initial phase of the MCAO, whereas the other research flights also covered regions further downstream. Thus, different parts of the temporal and spatial evolution were sampled.
Table 1Mean and maximum MCAO indices along flight track computed from ERA5 data (Hersbach et al., 2023a, b) for all MCAO flights of HALO–(𝒜𝒞)3.
The quasi-Lagrangian flight strategy applied to almost all flights of the HALO–(𝒜𝒞)3 campaign (Wendisch et al., 2024) allows for studying the evolution of cloud properties during the observed MCAOs. Specifically, the temporal and spatial evolution of macroscopic cloud properties, such as the cloud top height, cloud fraction, and horizontal cloud extent, as well as the evolution of cloud microphysical properties, such as the effective radius of liquid water droplets and cloud thermodynamic phase partitioning, will be analyzed in the following.
3.1 Case study: marine cold air outbreak observed on 1 April 2022
As a case study, the data collected on the research flight conducted by HALO on 1 April 2022 are analyzed first. The flight sampled the initial phase of a MCAO in the Fram Strait (see Fig. 1e). Average and maximum MCAO indices along the flight track of about 7 and 12 K (see Table 1) classify this case as a moderate to strong event. Based on the MCAO index, it appears as a typical event for the Fram Strait region during that time of the year (Walbröl et al., 2024; Kirbus et al., 2024). The satellite image in Fig. 1e shows cloud streets oriented along the mean wind direction from the sea ice edge towards the south to south-west. The event on 1 April 2022 was the strongest MCAO sampled during HALO–(𝒜𝒞)3. In contrast to the other MCAO flights, the backward trajectories showed a clear northerly flow from the central Arctic towards the South without a significant influence of the topography of the island of Svalbard. In addition, collocated in situ measurements were collected on this day. Several studies have already analyzed data from the research flight on 1 April 2022. Kirbus et al. (2024) studied the thermodynamic evolution during this MCAO, based on dropsonde measurements during HALO–(𝒜𝒞)3. In addition, Schirmacher et al. (2024) investigated the roll convection regime using radar observations. In the following, the temporal and spatial evolution of macrophysical and microphysical cloud properties, including cloud top height, cloud thermodynamic phase, and cloud droplet size, derived from passive remote sensing with specMACS will be presented and discussed. This complements existing studies about the MCAO observed on 1 April 2022 and contributes towards a complete picture of this case. The second part of this work (Weber et al., 2025a) additionally analyzes the vertical cloud structure observed on this day, exploiting the collocated remote sensing and in situ observations and building upon the results presented in the following.
3.1.1 Evolution of macrophysical cloud properties
First, the temporal and spatial evolution of the macrophysical cloud properties is analyzed for the flight on 1 April 2022. To this end, the cloud top height, the cloud fraction, and the cloud radius were derived from the specMACS measurements and combined with backward trajectories as described in Sect. 2.
Figure 2 shows the cloud top height (left column), cloud fraction (middle column), and cloud radius (right column) as a function of time (upper row) and distance (lower row) the airmass traveled above open ocean. The histograms for every time or distance bin are normalized by the total number of observations of the respective bin. In addition, Figure 3 displays RGB images taken by the polarization-resolving cameras at four points in time (about 30, 60, 90, and 150 min above open ocean) to illustrate the observed cloud morphology. Parts of Figs. 2 and 3 have also been shown in Wendisch et al. (2024).
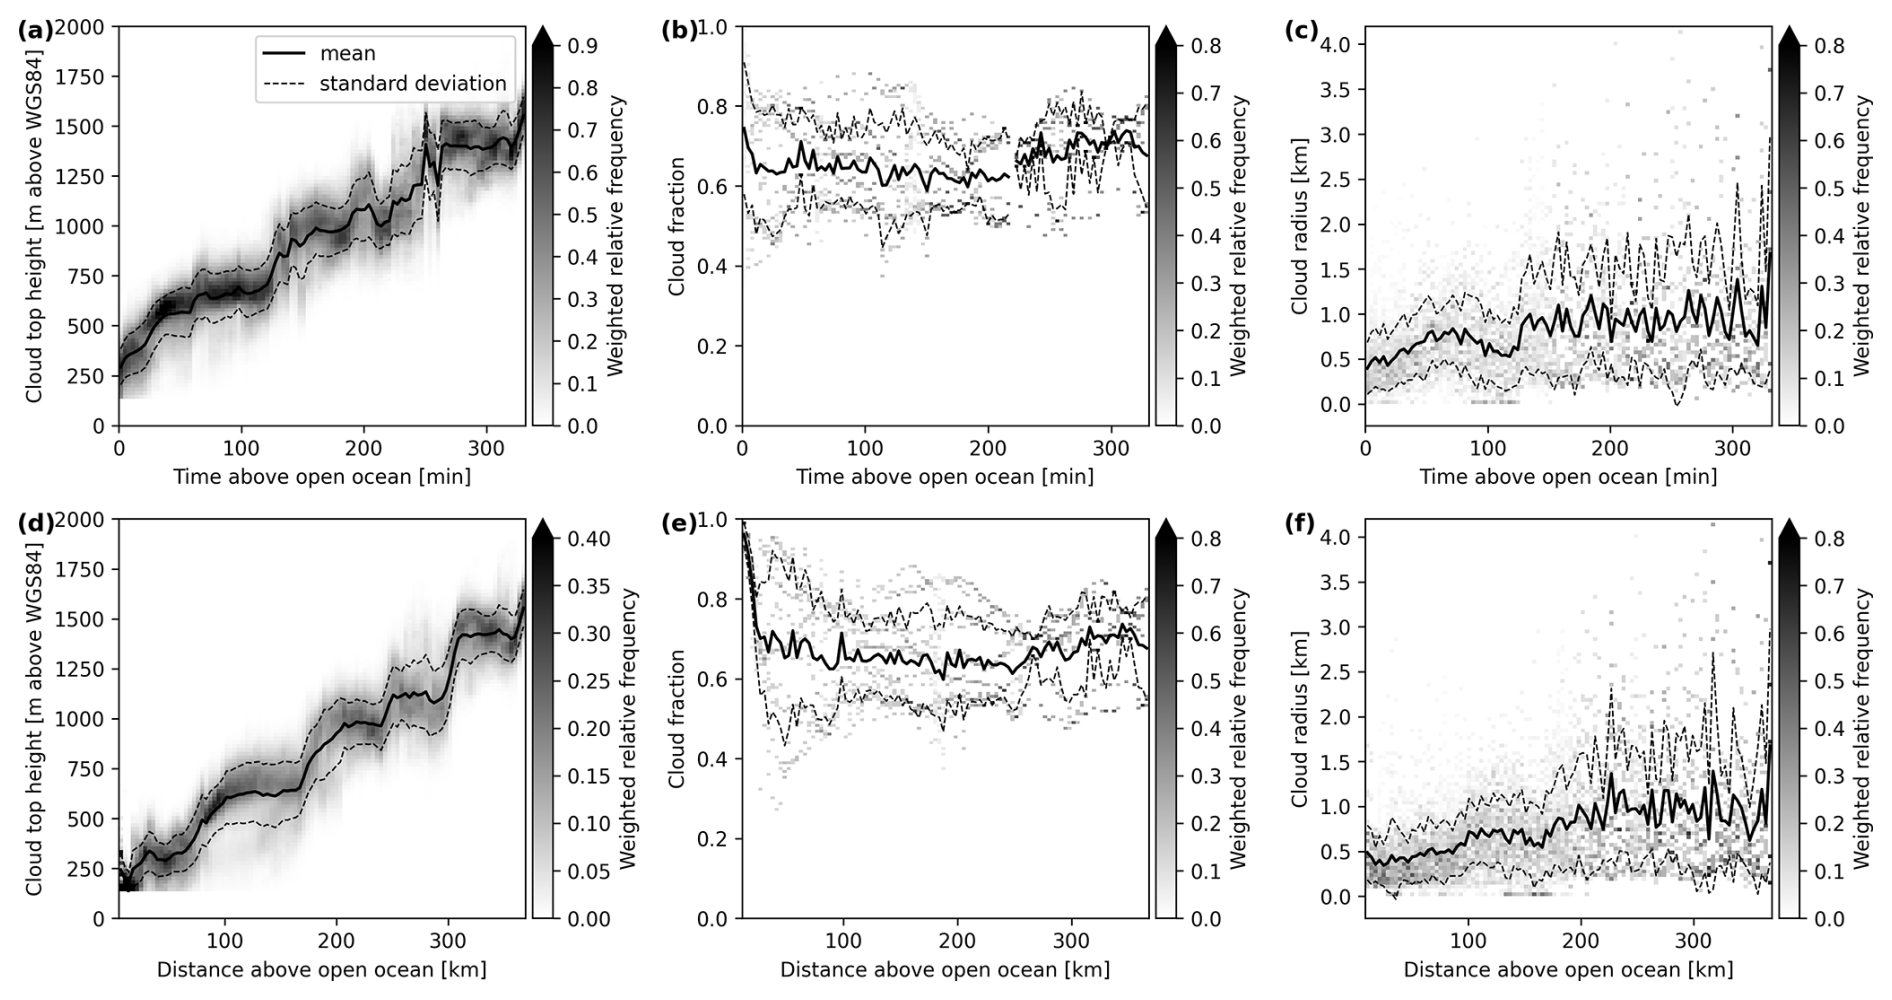
Figure 2Histograms of cloud top height (a, d), cloud fraction (b, e), and cloud radius (c, f) as a function of time (upper row) and distance (lower row) above open ocean for the research flight on 1 April 2022. The solid black line indicates the mean and the dashed lines the standard deviation of the histograms. The cloud top heights are given above the World Geodetic System 1984 (WGS84) ellipsoid.
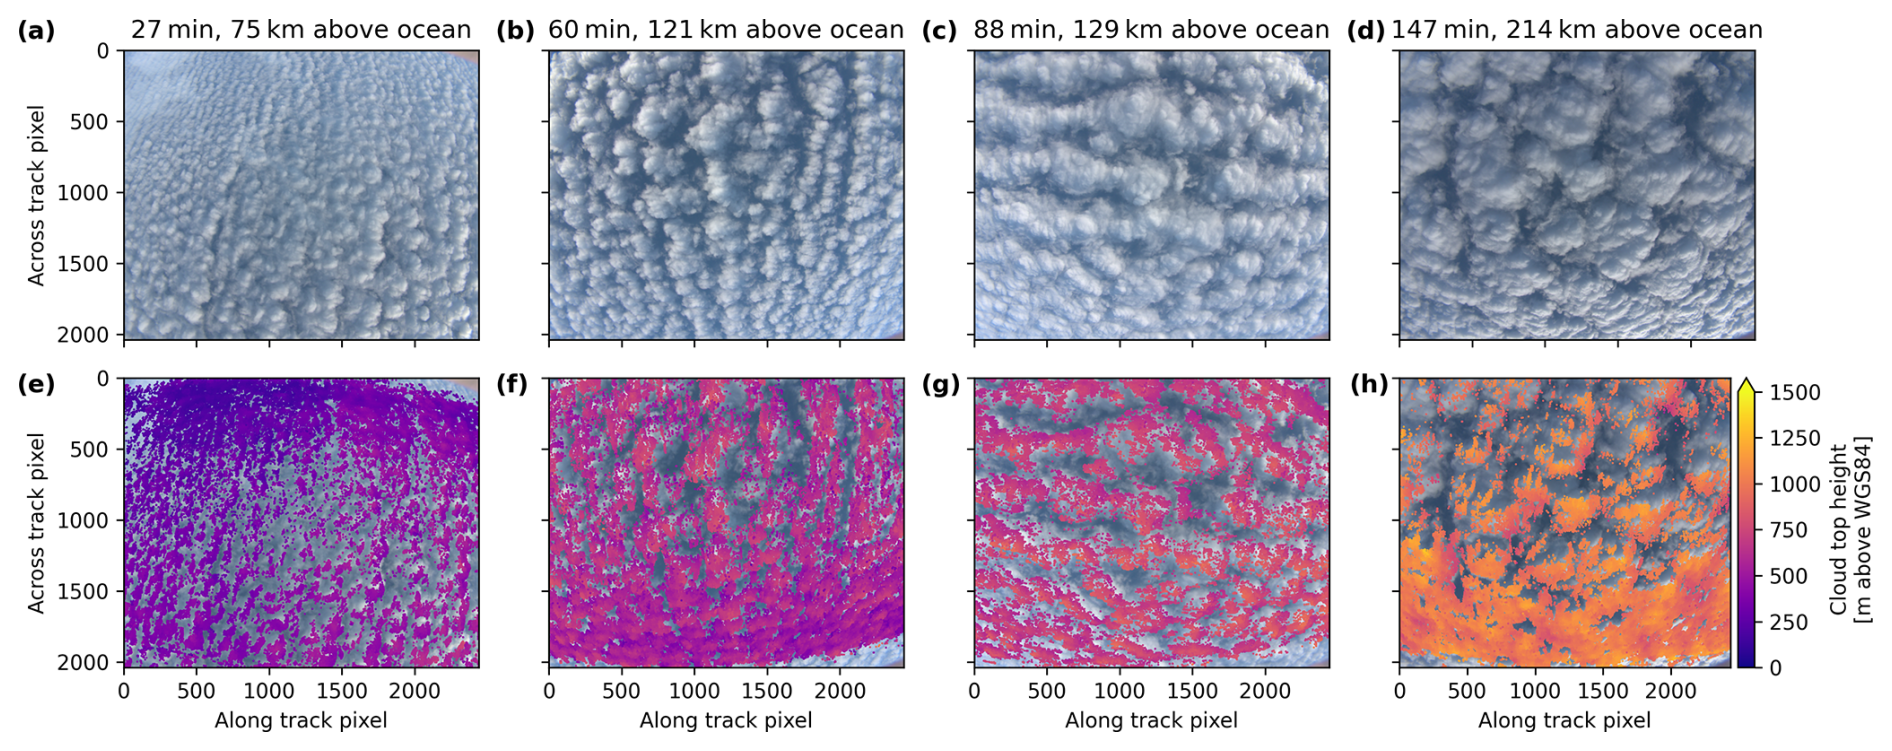
Figure 3Example RGB images (upper row) and cloud top heights (lower row) at four different points in time, about 30 min, 60, 90, and 150 min above open ocean observed on 1 April 2022.
The cloud top height in Fig. 2a and d increases stepwise and almost linearly with time and distance from about 250 m close to the sea ice edge to about 1.5 km after 300 min. This increase in cloud top height over time is typical for the evolution of clouds during MCAOs, as the ABL deepens with time due to the strong surface heating (Brümmer, 1996; Murray-Watson et al., 2023; Kirbus et al., 2024). A similar increase in cloud top height from a few hundred meters to about 1 km during the first 3 h above open ocean was also observed by Schirmacher et al. (2024) derived from data measured by the radar installed on the Polar 5 aircraft operating on the same day in the same region.
The average cloud fraction (see Fig. 2b and e) remained almost constant during the first hours of the observed MCAO, as can also be seen in the RGB images in Fig. 3. The variability of the cloud fraction is high, showing values between 0.5 and 0.8, and is also almost constant with time. The cloud fractions close to unity during the first about 10 min and 10 km above open ocean are due to the misidentification of bright sea ice in the marginal sea ice zone as clouds by the cloud mask and have to be considered as outliers, as discussed above. Schirmacher et al. (2024) observed a strong increase in the cloud cover during the first about 45 min followed by almost constant values for the MCAO on 1 April 2022 in the Fram Strait based on radar observations. This agrees with the specMACS observations, except for the initial increase, which is likely missed by the specMACS measurements due to the overestimation of the cloud fraction in the marginal sea ice zone. A statistical analysis of clouds during MCAOs by Murray-Watson et al. (2023), based on satellite observations, showed increasing cloud fractions during the first hours of MCAOs, followed by a slight decrease. The almost constant cloud fraction observed on 1 April 2022 differs from this general statistical behavior. Based on the MCAO index, the MCAO on 1 April 2022 was typical for this region and time of the year (Walbröl et al., 2024). However, it is not necessarily representative for the average general statistics of MCAOs. The cloud streets and the mean wind direction on 1 April 2022 are not entirely perpendicular to the sea ice edge. The evolution of cloud properties downstream might therefore be influenced by fresh cold and dry air, which could, for example, explain deviations of the observed evolution of the cloud fraction on 1 April 2022 from the general statistics. Furthermore, the absolute values of the cloud fraction depend strongly on the threshold values applied in the cloud mask, the sensitivities of the different instruments and their spatial resolutions, which can explain differences in absolute values across different studies. In addition, specMACS has a narrower field of view than satellite observations, which might affect the cloud fraction estimates.
Finally, the cloud radius increases from approximately 0.5 to 1 km, with high variability. These results agree with the increasing roll circulation wavelength from initially 1 to 2 km derived from radar observations on the same day and in the same region (Schirmacher et al., 2024). The deepening of the ABL with increasing time above open ocean, driven by the strong surface heating, leads to increasing roll circulation wavelengths. This, in turn, affects the cloud field and could explain the increasing geometric size of the observed clouds with increasing time spent above open ocean (Brümmer, 1999). The cloud radius distribution generally consists of a mixture of smaller and larger clouds (see Fig. 3).
The different shapes of the curves describing, e.g., the evolution of the cloud top height during the first kilometers above open ocean compared to the first minutes above open ocean in Fig. 2 and similar figures in the following sections can be explained by changing wind speeds due to the off-ice acceleration at the sea ice edge (Brümmer, 1996).
Moreover, the RGB images in Fig. 3 show cloud streets in panels (a) to (c), which are commonly observed in the initial phase of a MCAO (Brümmer, 1999). After about 150 min, more cellular structures evolve that are visible in panel (d), indicating a transition in cloud morphology from cloud streets to a cellular cloud regime. The transition from rolls to cells is commonly explained by a decoupling of the ABL and accompanying precipitation formation (Brümmer, 1999; Gryschka and Raasch, 2005; McCoy et al., 2017; Abel et al., 2017; Pithan et al., 2018; Tornow et al., 2021). The decoupling of the ABL can be induced or reinforced by latent heat release due to condensation inside the clouds exceeding the surface heat fluxes, as well as by precipitation (Brümmer, 1999; Abel et al., 2017). Radar observations during the MCAO on 1 April 2022 indicate the presence of precipitation already after about 1 h and show further increasing radar reflectivities with increasing time above open ocean (Schirmacher et al., 2024; Kirbus et al., 2024). In addition, surface heat fluxes derived from observations of this MCAO during HALO–(𝒜𝒞)3 (Kirbus et al., 2024) show maxima during a similar time range as the transition of cloud morphology. A combination of measurements of thermodynamic, cloud, and dynamical properties could be used in the future to further investigate the reasons for the transition in cloud morphology observed during the MCAO on 1 April 2022.
3.1.2 Cloud microphysical properties
The same analysis as for the macrophysical quantities was also performed for microphysical cloud characteristics such as the effective radius of liquid water droplets and the cloud thermodynamic phase, quantified through the ice index and ice fraction. Figure 4 displays the evolution of the effective radius of the liquid water droplets (a, d), the ice index (b, e), and the ice fraction (c, f) as a function of time and distance above open ocean. For later times (after approx. 210 min), no measurements of the effective radius and the ice fraction are available because the solar zenith angle during this part of the flight was too large for the cloudbow to be observed inside the field of view of the cameras, such that the retrievals could not be applied.
The effective radius of liquid cloud droplets shows a rapid increase from about 5 to 7.5 µm in the first approximately 30 min. It remains then constant until about 150 min above open ocean, even though the cloud top height increases with time throughout the observed time period, which is usually accompanied by an increase in droplet size. At the same time, the ice index indicates the presence of ice crystals. Hence, the constant effective radius during this time could be explained by ice crystals competing with the supercooled liquid cloud droplets for the available water vapor, limiting the growth of liquid cloud droplets on the one hand, or freezing of larger cloud droplets on the other hand. The uncertainty of the measured effective radii of liquid cloud droplets from the cloudbow retrieval is smaller than the observed increase in the liquid cloud droplet size. Afterward, the effective radius becomes more variable and increases slightly, which coincides with the transition from cloud streets to cellular structures. In the more convective cellular regime, liquid water is formed in the convective updrafts at the centers of the cells, which could lead to further increasing effective radii at the higher cloud tops (Schirmacher et al., 2024; Maherndl et al., 2024). However, the number of measurements is also smaller in this time range due to larger solar zenith angles, and the results are therefore more uncertain. The spike in the evolution of the effective radius at distances smaller than 30 km in panel (d) is due to the influence of sea ice, which was not completely filtered out and should be treated as an outlier.
In situ measurements of the effective radius conducted by the Polar 6 aircraft during the same day and in the same region show average effective radii of about 4 µm during the first 100 min above open ocean and slightly increasing radii for larger times (Moser et al., 2023). While the effective radii derived from cloudbow observations of specMACS are representative for the cloud top, the Polar 6 aircraft was flying lower inside the cloud. This could explain the slightly smaller observed values of the in situ measurements compared to the cloudbow retrieval results. The evolution of the effective radius of liquid cloud droplets during MCAOs was also studied by Murray-Watson et al. (2023), who also observed increasing effective radii with increasing time above open ocean.
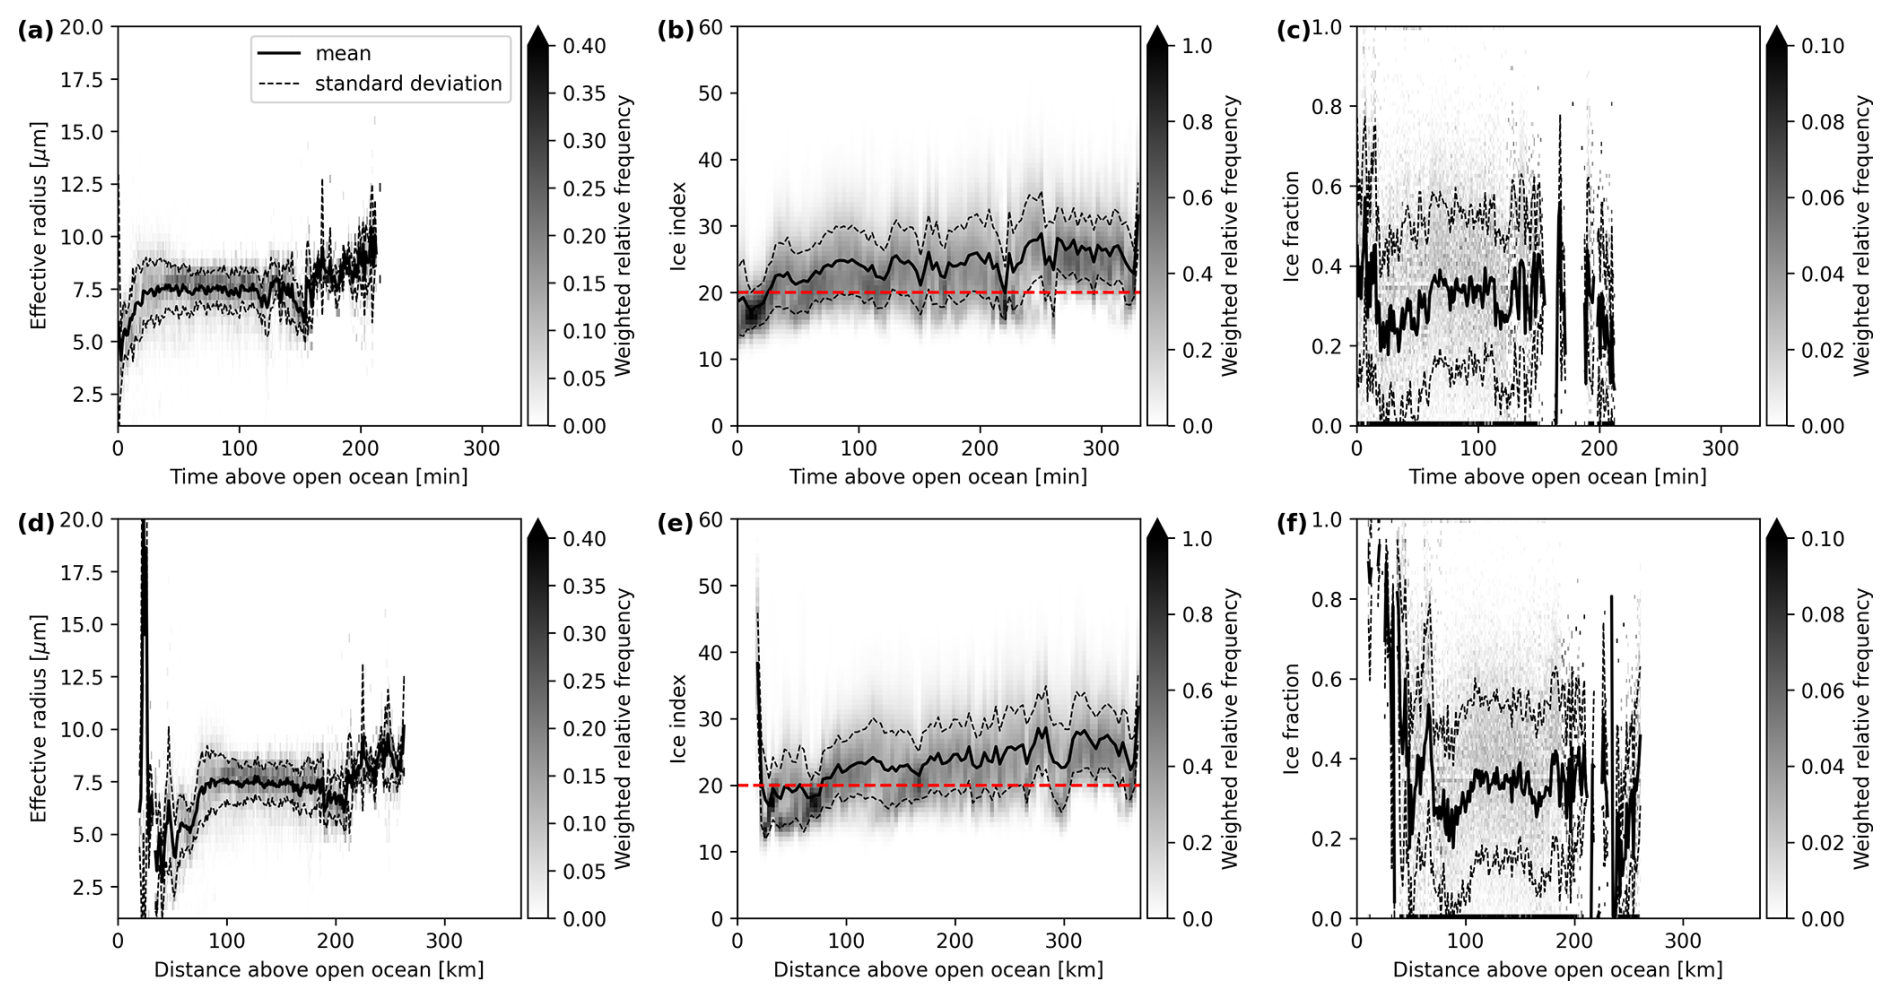
Figure 4Histograms of the effective radius of the liquid water droplets (a, d), the ice index (b, e), and the ice fraction (c, f) as a function of time (upper row) and distance (lower row) above open ocean for the research flight on 1 April 2022. The black solid line indicates the mean and the black dashed line the standard deviation of the histograms. The red dashed line in panels (b) and (e) is the threshold value between the liquid water and the mixed phase.
The evolution of cloud thermodynamic phase is studied using the spectral ice index and the ice fractions from the polarized phase retrieval in the middle and right columns of Fig. 4, respectively. The results of the multi-angle polarimetric retrieval of the ice fraction and the spectral approach applied to derive the ice index have different penetration depths. Both are representative for the cloud top, but the spectral signal originates from slightly deeper altitudes within the cloud than the polarized signal, as discussed in Sect. 2.1. The ice index is smaller than 20 during the first 30 min, indicating a pure liquid water cloud. Subsequently, it transforms into a mixed-phase cloud with slightly increasing ice indices over time. The transition from pure liquid water to the mixed phase occurs during the same time range as the rapid increase of the effective radius at the beginning. Larger effective radii increase the probability for freezing of liquid water droplets and heterogeneous ice formation. In addition, during the same time range, the cloud top height increased and the cloud top temperature decreased. Thus, a threshold temperature and size of the cloud liquid water droplets could be reached that initiate the formation of ice crystals.
The evolution of the ice fraction shows a similar structure. The higher ice fractions during the first 25 min and 50 km close to the sea ice edge are caused by a misclassification of sea ice as cloud, as discussed above. Considering these initially high ice fractions as outliers and taking the bias of the ice fraction for the cloudbow range into account (Weber et al., 2025b), the ice fraction at the beginning was in the range of 0.2. It then increases until about 90 min above open ocean and remains almost constant afterwards, but the cloud top is still dominated by liquid water. The initially faster decrease of the ice fraction appears slightly later than the increase of the spectral ice index, which is more sensitive to ice and representative for slightly lower altitudes, deeper within the cloud, but still at cloud top. Ice crystals forming at the cloud top and sedimenting downward might first increase the relative amount of ice at slightly lower altitudes if the sedimentation speed is faster than the ice formation. Further discussions of the vertical cloud structure can be found in the second part of this work in Weber et al. (2025a). From around 150 min above open ocean, when the transition from cloud streets to cells was observed, the ice fraction becomes variable but also uncertain.
3.2 Statistics of all observed marine cold air outbreaks
After studying the temporal and spatial evolution of cloud macrophysical and microphysical properties during the MCAO on 1 April 2022, the analyses are extended to all research flights targeting MCAOs. The different observed MCAOs cover a variety of different conditions, as discussed in Sect. 2.3. This allows to further investigate the variability of the cloud evolution between different events and the dependence on the strength of the MCAO.
3.2.1 Evolution of macrophysical cloud properties
Similar to above, the temporal and spatial evolution of the macrophysical cloud properties is analyzed first. To this end, the cloud top height, the cloud fraction, and the cloud radius were derived from the specMACS measurements and combined with backward trajectories as described in Sect. 2 for all research flights. Figure 5 displays histograms of these quantities as a function of time (upper row) and distance (lower row) above open ocean together with their mean for all flights in different colors. The first, second, and third columns correspond to the cloud top height, cloud fraction, and cloud radius, respectively. In general, there is a large variability between the different research flights, which were performed under varying MCAO conditions and partly in different regions.
The cloud top height in panels (a) and (d) increases with time and distance from the sea ice edge from a few hundred meters to a maximum of about 2.5 km, depending on the research flight. Increasing cloud top heights with time are expected as the boundary layer generally deepens with time during a MCAO. The largest cloud top heights are observed during the flights on 1 April 2022 (purple line) and 29 March 2022 (green line), which were the strongest observed MCAOs, and lower cloud top heights are reached during the weaker MCAOs. In addition, the increase is faster for these strong events compared to the weaker ones. Larger cloud top heights for stronger MCAOs were also observed by Murray-Watson et al. (2023) and Schirmacher et al. (2024). This can be expected as stronger temperature differences lead to larger surface heat fluxes, increased instability, deeper ABLs, and therefore larger cloud top heights. The very large cloud top heights on 21 March 2022 at large times and distances between 1100 and 1200 min and 900 to 1000 km above open ocean are due to high-level cirrus clouds south-west of Svalbard, as can also be seen in Fig. 1a.
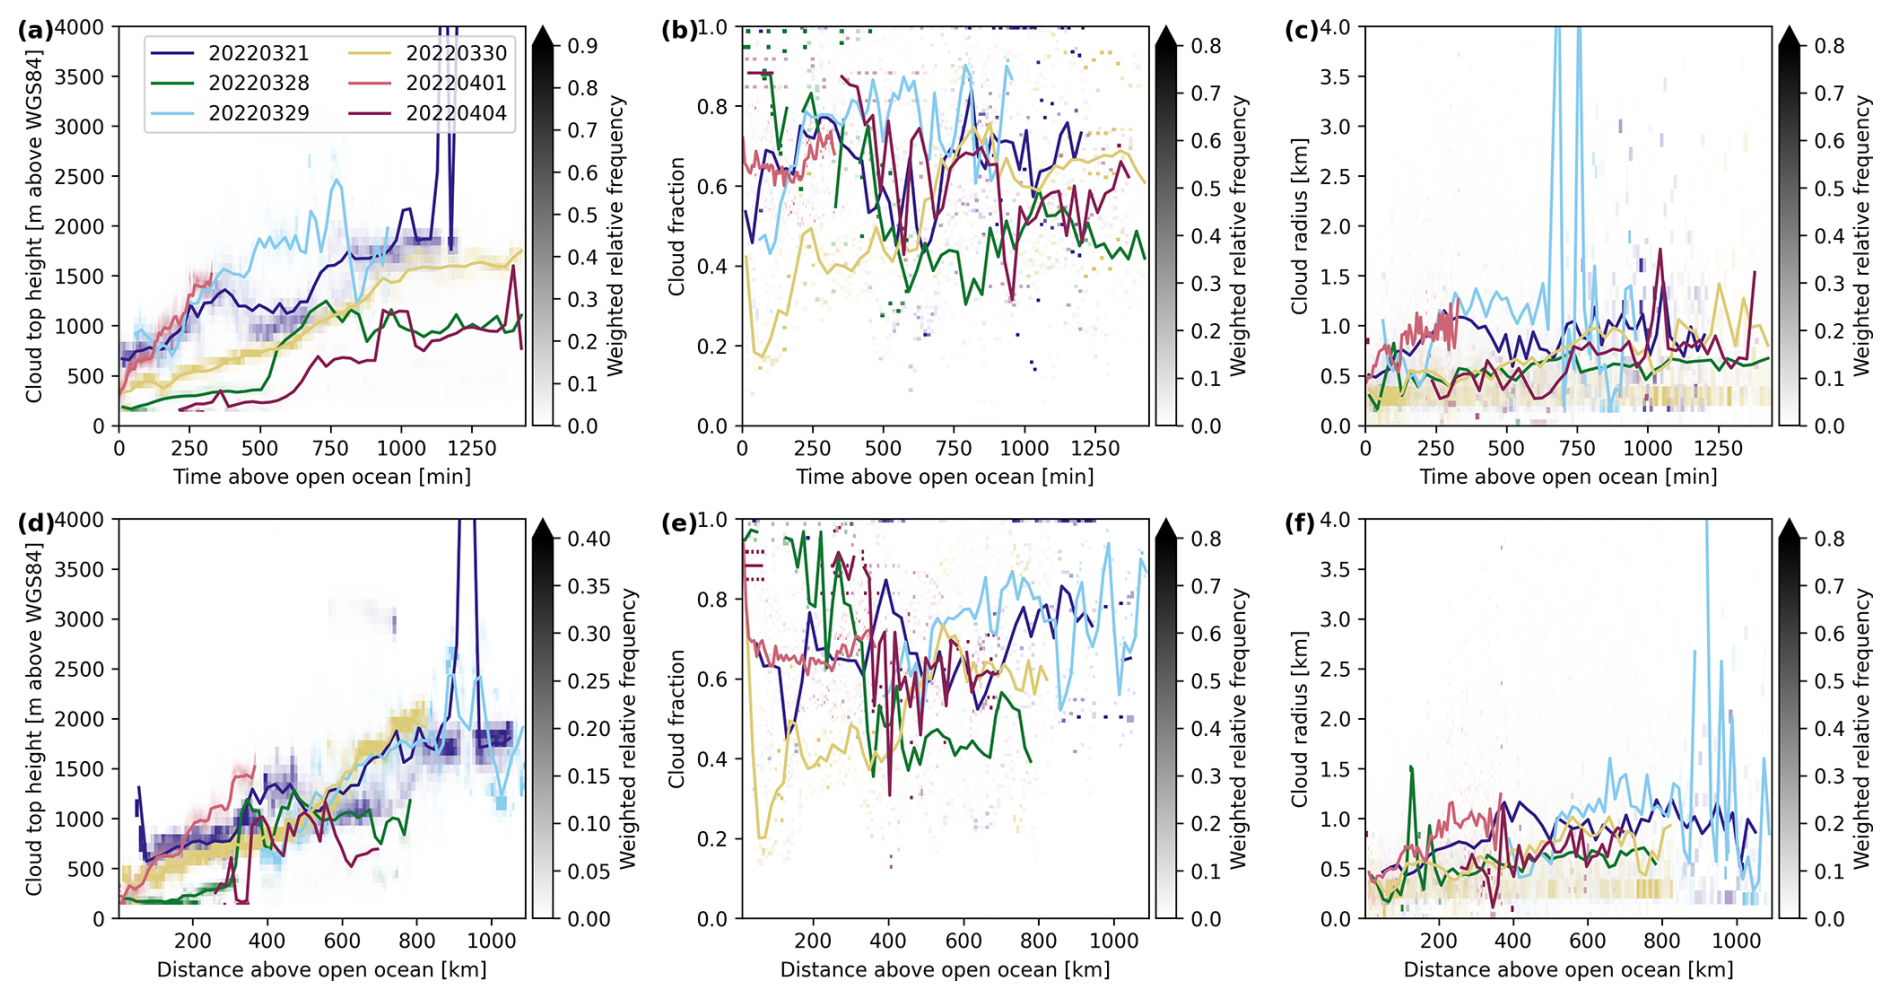
Figure 5Histograms of cloud top height (a, d), cloud fraction (b, e), and cloud radius (c, f) as a function of time (upper row) and distance (lower row) above open ocean with their respective mean for all MCAO flights during HALO–(𝒜𝒞)3. The different colors correspond to the different research flights and the solid lines denote the respective means.
A similar picture is found for the horizontal cloud extent in Fig. 5c and f. The cloud radius generally increases with time and distance above open ocean from a few hundred meters to about 1.5 km. Larger cloud radii are associated with the stronger events on 1 April 2022 and 29 March 2022, and smaller radii are observed during the weaker events on 4 April 2022, 30 March 2022, and 28 March 2022. Similar to the cloud top height, the increase of the cloud radius is faster for stronger events than for weaker MCAOs. Larger cloud top heights can be related to larger ABL heights and therefore larger roll circulations, which affect the cloud field (Brümmer, 1999), and could explain the observed horizontal cloud extents.
In contrast, the cloud fraction shows a more complex behavior and a large variability. In addition to the possible overestimation of the cloud fraction in the marginal sea ice zone, there are some island effects visible, affecting the cloud cover (see Fig. 1). In general, the cloud fraction remains either relatively constant or increases with time, with typical values between 0.4 and 0.8. The stronger MCAOs in Fig. 5 tend to have larger cloud fractions compared to the weaker ones. This agrees with the observations of larger cloud fractions during the first hours of MCAOs for stronger events by Murray-Watson et al. (2023). The flight on 28 March 2022 is an exception and strongly affected by the local topography of Svalbard.
3.2.2 Evolution of microphysical cloud properties
Similar to the macrophysical cloud properties, the temporal and spatial evolution of cloud microphysical properties and their variability and dependence on the MCAO strength are investigated by combining measurements with backward trajectories, as in the previous sections. Figure 6 displays the effective radius of liquid cloud droplets, the ice index, and the ice fraction in the first, second, and third column, respectively, as a function of time (upper row) and distance (lower row) above open ocean.
The effective radius of liquid cloud droplets increases with time and distance above open ocean, and sizes between about 3 and 17 µm were observed. Larger effective radii are reached during the stronger events on 1 April 2022 and 29 March 2022, for which the growth of the cloud droplets is also faster. This can be expected as the effective radius in general increases with height within a cloud, and larger cloud top heights were observed for stronger MCAOs in Fig. 5. The MCAOs observed on 21 March 2022 and 28 March 2022 had, however, similar strengths, but very different cloud droplet effective radii were observed. A reason for this could be differences in the aerosol conditions, since the aerosol concentration generally strongly affects the cloud droplet number concentration and the droplet size.
Murray-Watson et al. (2023) found also increasing effective radii with time, but smaller effective radii during the initial phase of stronger MCAOs compared to weaker events, and, in general, larger droplet sizes between about 12 and 18 µm. There are several possible reasons for these differences. The effective radii in Murray-Watson et al. (2023) were derived from MODIS satellite data with a bispectral retrieval, whereas the effective radii in this work were obtained from the polarimetric cloudbow retrieval. Both retrievals have different sensitivities, penetration depths, and spatial resolutions, which can lead to differences in the derived absolute values of the effective radii. In addition, Murray-Watson et al. (2023) focused on liquid water clouds only, while in this work mixed-phase clouds were also included in the analyses. The presence of ice crystals can lead to smaller cloud droplet sizes, since liquid water and ice in mixed-phase clouds compete for the available water vapor and larger cloud droplets are more likely to freeze. This, together, could explain the differences in the absolute values of the observed cloud droplet radii. The differences in the effective radii between stronger and weaker events could, for example, be related to differences in the aerosol conditions. Murray-Watson et al. (2023) observed large differences in the evolution of the liquid water path and cloud droplet number concentration between weak and strong MCAOs with high and low aerosol conditions. During HALO–(𝒜𝒞)3 only a limited number of six MCAOs were observed, which show a large variability. Nevertheless, they might not be entirely representative for the general statistics of strong and weak MCAOs. The observed MCAOs occurred in different regions, were partly affected by the topography of Svalbard, and differed in synoptic conditions and airmass history across the six events. A larger number of samples would be required for more robust statistics, but the six cases already provide valuable insights into the temporal and spatial cloud evolution and its variability during MCAOs.
Regarding the cloud thermodynamic phase, the ice indices and ice fractions generally increase with time above open ocean. The patterns of both ice index and ice fraction are very similar. Initial values of the ice index are below or around 20, which is the threshold value between liquid water and mixed-phase clouds, and increase to about 30 to 50, depending on the research flight. In addition, the ice fraction increases with time and distance from very small values around 0.2 to approximately 0.5 to 0.8. The ice fraction is overestimated at very small times and distances below 100 min and 100 km above open ocean close to the sea ice edge due to the misclassification of sea ice in the marginal sea ice zone as clouds. The large variability of both the ice index and ice fraction also reflects the larger uncertainty in the thermodynamic phase retrievals compared to the stereographic or the cloudbow retrieval. The described increase in the ice index and ice fraction indicates a transition from a liquid water to a mixed-phase regime with increasing amounts of ice. This phase transition is faster for the stronger observed MCAOs on 1 April 2022, 29 March 2022, and 21 March 2022. In addition, stronger events reach higher ice indices and ice fractions. The faster phase transition and higher ice fractions for stronger events agree with the higher observed cloud top heights and larger effective radii for these events, since typically colder temperatures at higher altitudes and larger cloud droplets increase the probability of ice formation, which typically happens through heterogeneous freezing (de Boer et al., 2011; Cui et al., 2006; Ansmann et al., 2005). Similar to the case study of the MCAO on 1 April 2022, the phase transition coincides with an increase in the effective radius of the liquid cloud droplets and increasing cloud top heights during all observed cases. This indicates that a threshold cloud top height respectively cloud top temperature and cloud droplet size are reached, initiating ice formation.

Figure 6Histograms of effective radius of liquid cloud droplets (a, d), ice index (b, e), and ice fraction (c, f) as a function of time (upper row) and distance (lower row) above open ocean for all MCAO flights of HALO–(𝒜𝒞)3, The solid lines indicate the mean of the respective flight, the black dashed line in panels (b) and (e) is the threshold value between the liquid water and the mixed phase.
In this work, the spatial and temporal evolution of macrophysical and microphysical cloud properties during the initial phase of marine cold air outbreaks in the Arctic was studied with a focus on cloud thermodynamic phase partitioning and phase transitions. To this end, quasi-Lagrangian airborne passive remote sensing observations collected with specMACS during the HALO–(𝒜𝒞)3 campaign in the Arctic were combined with backward airmass trajectories. The evolution of cloud macrophysical and microphysical properties was analyzed for all six flights targeting marine cold air outbreaks (MCAOs) and compared to investigate also the variability of the cloud evolution and the dependence on the MCAO strength. The presented analyses use high-resolution, quasi-Lagrangian airborne observations of the evolution of clouds during MCAOs, complementing existing studies based on coarser resolved satellite observations. In addition, the evolution of the cloud thermodynamic phase partitioning and phase transitions were studied, which have not been investigated previously in a quasi-Lagrangian framework. Multi-angle polarimetric observations allow for the derivation of a quantitative ice fraction, which, in combination with the qualitative ice index based on spectral measurements, provides information about the cloud thermodynamic phase at two different altitudes close to cloud top.
A case study of a strong MCAO observed on 1 April 2022 in the Fram Strait showed increasing cloud top heights and horizontal cloud extents with increasing time and distance above open, sea ice-free ocean, while the cloud fraction stayed almost constant during the observed first 5 h of the MCAO. Moreover, the effective radius of liquid water droplets increased from about 5 to 7.5 µm during the first approximately 30 min and remained constant afterward. The initial increase of the effective radius coincided with an increase in the ice index and ice fraction and a transition from a pure liquid water to a mixed-phase cloud regime. This indicated that a threshold cloud top temperature and droplet size for ice formation in the observed clouds might have been reached.
The same analysis was repeated for all six observed MCAOs. The cloud top heights and horizontal extents increased with time and distance traveled above open ocean during all MCAOs. However, the increase was stronger and faster for more intense MCAOs. Similarly, the effective radius of liquid cloud droplets increased over time and reached larger sizes for stronger MCAOs. Furthermore, increasing ice indices and ice fractions with time and a transition from an initially liquid water to a mixed-phase regime were observed during all MCAOs. This transition happened earlier for stronger MCAO, and larger ice indices and ice fractions were reached for the stronger events. In all observed cases, the transition from the liquid water to the mixed phase coincided with an increase of the effective radius of the liquid cloud droplets and the cloud top height. As the ABL and clouds evolve and the cloud top height increases, the liquid cloud droplets grow to larger sizes and the cloud top temperature typically decreases, leading to an increasing probability of ice formation through heterogeneous freezing. In general, a large variability was observed between the different MCAO cases measured during HALO–(𝒜𝒞)3. The measurements were performed in partly different regions, with different MCAO strengths, different parts of the evolution were sampled, and some island effects also affected the measurements. Only a small number of six MCAO could be studied, which, however, covered a large range of MCAO conditions (Walbröl et al., 2024).
Some limitations of the presented results should be considered. The brightness-based cloud mask for the polarization-resolving cameras of specMACS struggles in the presence of sea ice, where ice can falsely be identified as clouds. This is a known issue for cloud masks based on passive imaging methods. A sea ice mask was applied to consider measurements above open ocean only and to filter the most uncertain results. However, some artifacts in the marginal sea ice zone remained, which were treated as outliers. An improved cloud mask could be developed in the future to improve the results of the analyses and avoid outliers in the measurements in the marginal ice zone during the very initial phase of the cloud evolution. In addition, the large solar zenith angles in the Arctic lead to increased uncertainties of the retrievals of the specMACS instrument. On the one hand, three-dimensional radiative effects have a stronger influence on the phase retrievals for large solar zenith angles. On the other hand, the cloudbow used for the retrievals of the droplet size and ice fraction is then observed at the edge of the field of view of the polarization-resolving cameras, where the measurement uncertainties are larger (Weber et al., 2024a). The results of the cloudbow retrieval and the polarized phase partitioning retrieval were filtered, excluding, for example, retrieval results with a large root mean square error between the fitted model and the measurement to eliminate the most uncertain results.
Furthermore, it should be mentioned that the definition of the ice fraction varies strongly between different studies, depending on the type of measurements and the application (Korolev et al., 2017). In addition, different threshold values are used to define the liquid water, mixed, and ice phases. This must be kept in mind when comparing the results of different studies on phase partitioning. In this work, the ice fraction is an optical ice fraction defined by the optical thickness, and the ice index is a qualitative measure of cloud thermodynamic phase.
The observations of the temporal and spatial evolution of cloud macrophysical and micropyhsical properties during the initial phase of MCAOs presented in this work provide unique observational data, which could be used for model evaluation in future work. Mixed-phase clouds, their thermodynamic phase partitioning and evolution during meridional airmass transformations, such as MCAOs, are not well represented in models. The presented observations could be compared to model results in a Eulerian and a quasi-Lagrangian way for the six observed MCAOs, similar to Wendisch et al. (2025) who analyzed the thermodynamic evolution of MCAOs in dropsonde observations and in the ICON weather prediction model. The macrophysical cloud properties, such as the cloud top height, can be directly derived from typical model output and be compared to measurements. In addition, the ice fraction and effective radius of liquid cloud droplets can be computed from model output as described in Volkmer et al. (2024) and Weber et al. (2025b). A forward operator is only needed for a direct comparison of modeled and measured ice indices, as the ice index is a qualitative measure of the cloud thermodynamic phase and computed from measured radiances.
In the analyses presented in this work, the MCAOs were distinguished in terms of their strength, quantified through the MCAO index. Besides the MCAO intensity, the aerosol concentration also affects the evolution of cloud properties (Murray-Watson et al., 2023) and was not considered so far. The effect of aerosols on the cloud properties could be further studied in the future, using, for example, collocated in situ measurements and lidar observations on board HALO during HALO–(𝒜𝒞)3 to characterize the aerosol conditions.
Furthermore, based on the analyses of the temporal and spatial evolution of clouds during MCAOs during HALO–(𝒜𝒞)3, the vertical cloud structure and its evolution during a MCAO is investigated in the second part of this work in Weber et al. (2025a). Weber et al. (2025a) also includes a comparison to active remote sensing observations and additionally applies collocated in situ observations.
In the following, the retrieval of horizontal cloud extent from measurements of specMACS will be described in more detail. The content of this section has already been published in Weber (2025). To determine the horizontal extent of clouds in two-dimensional images, clouds must be identified and clustered. From the measurements from the polarization-resolving cameras, the 3D cloud geometry can be reconstructed using the stereographic retrieval method of Kölling et al. (2019). These data can be applied in a watershedding algorithm similarly to topographic data to cluster individual clouds. Here, the watershedding algorithm implemented in the Tracking and Object-Based Analysis of Clouds (TOBAC) package (Heikenfeld et al., 2019; Sokolowsky et al., 2024), which is specifically designed for cloud identification and tracking in meteorological applications, was used. Figure A1a displays the derived cloud top heights for one flight segment observed on 1 April 2022. In the cloud size retrieval, features are first detected as extreme values above several subsequent threshold heights between the minimum and maximum cloud top height of a flight segment. The identified features are highlighted as crosses in Fig. A1. Next, the segmentation is performed. The difficulty here is to determine the threshold heights for the watershedding since the cloud height varied significantly during a research flight during HALO–(𝒜𝒞)3 as the clouds and ABL evolved with time and distance from the sea ice edge. This is also visible in the example segment in Fig. A1a, where the cloud top height differs between the beginning (upper left) with lower heights closer to the ice edge and the end (lower right, larger heights) of the segment. Thus, an adaptive threshold based on the average cloud top height over a small time interval was defined. A threshold height of 200 m below the average cloud top height, with a minimum of 100 m and a maximum of 500 m, was chosen after trying different settings. Figure A1b shows the resulting segmentation with the different cloud clusters color-coded. Finally, TOBAC provides the geometric areas of the clusters from which cloud radii were computed, assuming circular shapes. The threshold values were tuned such that the algorithm provided reasonable cloud clusters, as displayed in Fig. A1b, during both the initial phase and later during the cloud evolution. Depending on the choice of the threshold values for the feature detection and segmentation, larger or smaller cloud sizes were obtained, but this applied to the entire temporal evolution of the clouds.
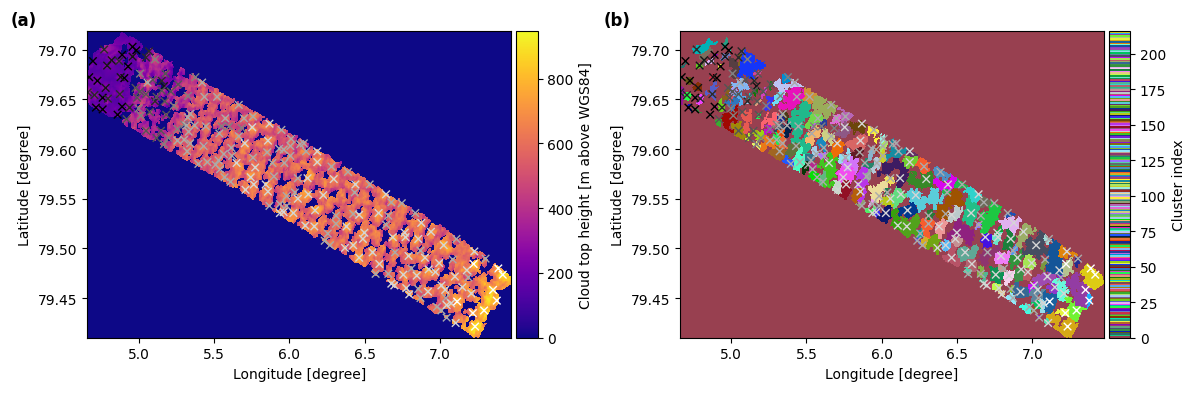
Figure A1(a) Cloud top height of the cloud targets for a flight segment measured on 1 April 2022. (b) Identified features and segmented cloud clusters. The crosses indicate the detected features, and the colors display the results of the segmentation. This figure has already been published in Weber (2025).
The data collected during the HALO–(𝒜𝒞)3 campaign are published on PANGAEA (Ehrlich et al., 2025). The measurements of the SWIR camera of specMACS are available at https://doi.org/10.1594/PANGAEA.966992 (Weber et al., 2024b). Retrieval results from specMACS, the HALO backward trajectories, and the analysis codes used in this work can be provided upon request from the corresponding author.
AW evaluated all data, performed the analyses, and wrote the manuscript with input from all co-authors. BK computed the backward trajectories. MW and BM provided valuable feedback to the analyses and the outline of the study. All authors contributed to the discussion of the results.
The contact author has declared that none of the authors has any competing interests.
Publisher's note: Copernicus Publications remains neutral with regard to jurisdictional claims made in the text, published maps, institutional affiliations, or any other geographical representation in this paper. The authors bear the ultimate responsibility for providing appropriate place names. Views expressed in the text are those of the authors and do not necessarily reflect the views of the publisher.
This article is part of the special issue “HALO-(𝒜𝒞)3 – an airborne campaign to study air mass transformations during warm-air intrusions and cold-air outbreaks”. It is not associated with a conference.
We would like to thank Fabian Hoffmann for valuable discussions about cloud microphysics. In addition, we thank Lea Volkmer for applying the stereographic retrieval to the specMACS observations and thank the entire HALO–(𝒜𝒞)3 team involved in the realization of the measurement flights and the data processing. Furthermore, we thank the Institute of Environmental Physics, University of Bremen for the provision of the merged MODIS-AMSR2 sea-ice concentration data at https://data.seaice.uni-bremen.de/modis_amsr2 (last access: 18 September 2023). We are further grateful for funding of project grant no. 316646266 and 442667104 by the Deutsche Forschungsgemeinschaft (DFG, German Research Foundation) within the framework of Priority Programme SPP 1294 to promote research with HALO. In addition, we appreciate the funding provided by DFG – Project-ID 268020496 – TRR 172.
This research has been supported by the Deutsche Forschungsgemeinschaft (grant nos. 442667104 (SPP 1294), 316646266 (SPP 1294), and 268020496 (TRR 172)).
This paper was edited by Michael Tjernström and reviewed by two anonymous referees.
Abel, S. J., Boutle, I. A., Waite, K., Fox, S., Brown, P. R. A., Cotton, R., Lloyd, G., Choularton, T. W., and Bower, K. N.: The Role of Precipitation in Controlling the Transition from Stratocumulus to Cumulus Clouds in a Northern Hemisphere Cold-Air Outbreak, J. Atmos. Sci., 74, 2293–2314, https://doi.org/10.1175/JAS-D-16-0362.1, 2017. a, b, c, d, e
Ahn, E., Huang, Y., Siems, S. T., and Manton, M. J.: A Comparison of Cloud Microphysical Properties Derived From MODIS and CALIPSO With In Situ Measurements Over the Wintertime Southern Ocean, J. Geophys. Res.-Atmos., 123, 11120–11140, https://doi.org/10.1029/2018JD028535, 2018. a
Ansmann, A., Mattis, I., Müller, D., Wandinger, U., Radlach, M., Althausen, D., and Damoah, R.: Ice formation in Saharan dust over central Europe observed with temperature/humidity/aerosol Raman lidar, J. Geophys. Res., 110, https://doi.org/10.1029/2004JD005000, 2005. a
Block, K., Schneider, F. A., Mülmenstädt, J., Salzmann, M., and Quaas, J.: Climate models disagree on the sign of total radiative feedback in the Arctic, Tellus A, 72, 1696139, https://doi.org/10.1080/16000870.2019.1696139, 2020. a
Boettcher, M., Schäfler, A., Sprenger, M., Sodemann, H., Kaufmann, S., Voigt, C., Schlager, H., Summa, D., Di Girolamo, P., Nerini, D., Germann, U., and Wernli, H.: Lagrangian matches between observations from aircraft, lidar and radar in a warm conveyor belt crossing orography, Atmos. Chem. Phys., 21, 5477–5498, https://doi.org/10.5194/acp-21-5477-2021, 2021. a
Brümmer, B.: Boundary-layer modification in wintertime cold-air outbreaks from the Arctic sea ice, Bound.-Lay. Meteorol., 80, 109–125, https://doi.org/10.1007/BF00119014, 1996. a, b, c
Brümmer, B.: Roll and Cell Convection in Wintertime Arctic Cold-Air Outbreaks, J. Atmos. Sci., 56, 2613–2636, https://doi.org/10.1175/1520-0469(1999)056<2613:RACCIW>2.0.CO;2, 1999. a, b, c, d, e, f
Cesana, G., Waliser, D. E., Jiang, X., and Li, J.-L. F.: Multimodel evaluation of cloud phase transition using satellite and reanalysis data, J. Geophys. Res.-Atmos., 120, 7871–7892, https://doi.org/10.1002/2014JD022932, 2015. a
Cesana, G. V., Khadir, T., Chepfer, H., and Chiriaco, M.: Southern Ocean Solar Reflection Biases in CMIP6 Models Linked to Cloud Phase and Vertical Structure Representations, Geophys. Res. Lett., 49, e2022GL099777, https://doi.org/10.1029/2022GL099777, 2022. a
Choi, Y.-S., Ho, C.-H., Park, C.-E., Storelvmo, T., and Tan, I.: Influence of cloud phase composition on climate feedbacks, J. Geophys. Res.-Atmos., 119, 3687–3700, https://doi.org/10.1002/2013JD020582, 2014. a
Cohen, J., Zhang, X., Francis, J., Jung, T., Kwok, R., Overland, J., Ballinger, T. J., Bhatt, U. S., Chen, H. W., Coumou, D., Feldstein, S., Gu, H., Handorf, D., Henderson, G., Ionita, M., Kretschmer, M., Laliberte, F., Lee, S., Linderholm, H. W., Maslowski, W., Peings, Y., Pfeiffer, K., Rigor, I., Semmler, T., Stroeve, J., Taylor, P. C., Vavrus, S., Vihma, T., Wang, S., Wendisch, M., Wu, Y., and Yoon, J.: Divergent consensuses on Arctic amplification influence on midlatitude severe winter weather, Nat. Clim. Change, 10, 20–29, https://doi.org/10.1038/s41558-019-0662-y, 2020. a
Cui, Z., Carslaw, K. S., Yin, Y., and Davies, S.: A numerical study of aerosol effects on the dynamics and microphysics of a deep convective cloud in a continental environment, J. Geophys. Res.-Atmos., 111, https://doi.org/10.1029/2005JD005981, 2006. a
Dahlke, S., Solbès, A., and Maturilli, M.: Cold Air Outbreaks in Fram Strait: Climatology, Trends, and Observations During an Extreme Season in 2020, J. Geophys. Res.-Atmos., 127, e2021JD035741, https://doi.org/10.1029/2021JD035741, 2022. a, b
de Boer, G., Morrison, H., Shupe, M. D., and Hildner, R.: Evidence of liquid dependent ice nucleation in high-latitude stratiform clouds from surface remote sensors, Geophys. Res. Lett., 38, https://doi.org/10.1029/2010GL046016, 2011. a
Ehrlich, A., Bierwirth, E., Wendisch, M., Gayet, J.-F., Mioche, G., Lampert, A., and Heintzenberg, J.: Cloud phase identification of Arctic boundary-layer clouds from airborne spectral reflection measurements: test of three approaches, Atmos. Chem. Phys., 8, 7493–7505, https://doi.org/10.5194/acp-8-7493-2008, 2008. a
Ehrlich, A., Wendisch, M., Bierwirth, E., Gayet, J.-F., Mioche, G., Lampert, A., and Mayer, B.: Evidence of ice crystals at cloud top of Arctic boundary-layer mixed-phase clouds derived from airborne remote sensing, Atmos. Chem. Phys., 9, 9401–9416, https://doi.org/10.5194/acp-9-9401-2009, 2009. a
Ehrlich, A., Crewell, S., Herber, A., Klingebiel, M., Lüpkes, C., Mech, M., Becker, S., Borrmann, S., Bozem, H., Buschmann, M., Clemen, H.-C., De La Torre Castro, E., Dorff, H., Dupuy, R., Eppers, O., Ewald, F., George, G., Giez, A., Grawe, S., Gourbeyre, C., Hartmann, J., Jäkel, E., Joppe, P., Jourdan, O., Jurányi, Z., Kirbus, B., Lucke, J., Luebke, A. E., Maahn, M., Maherndl, N., Mallaun, C., Mayer, J., Mertes, S., Mioche, G., Moser, M., Müller, H., Pörtge, V., Risse, N., Roberts, G., Rosenburg, S., Röttenbacher, J., Schäfer, M., Schaefer, J., Schäfler, A., Schirmacher, I., Schneider, J., Schnitt, S., Stratmann, F., Tatzelt, C., Voigt, C., Walbröl, A., Weber, A., Wetzel, B., Wirth, M., and Wendisch, M.: A comprehensive in situ and remote sensing data set collected during the HALO–(𝒜𝒞)3 aircraft campaign, Earth Syst. Sci. Data, 17, 1295–1328, https://doi.org/10.5194/essd-17-1295-2025, 2025. a, b, c
Ewald, F., Kölling, T., Baumgartner, A., Zinner, T., and Mayer, B.: Design and characterization of specMACS, a multipurpose hyperspectral cloud and sky imager, Atmos. Meas. Tech., 9, 2015–2042, https://doi.org/10.5194/amt-9-2015-2016, 2016. a, b
Field, P. R., Cotton, R. J., McBeath, K., Lock, A. P., Webster, S., and Allan, R. P.: Improving a convection-permitting model simulation of a cold air outbreak, Q. J. Roy. Meteor. Soc., 140, 124–138, https://doi.org/10.1002/qj.2116, 2014. a
Field, P. R., Brozkova, R., Chen, M., Dudhia, J., Lac, C., Hara, T., Honnert, R., Olson, J., Siebesma, P., de Roode, S., Tomassini, L., Hill, A., and McTaggart-Cowan, R.: Exploring the convective grey zone with regional simulations of a cold air outbreak, Q. J. Roy. Meteor. Soc., 143, 2537–2555, https://doi.org/10.1002/qj.3105, 2017. a
Fletcher, J., Mason, S., and Jakob, C.: The Climatology, Meteorology, and Boundary Layer Structure of Marine Cold Air Outbreaks in Both Hemispheres, J. Climate, 29, 1999–2014, https://doi.org/10.1175/JCLI-D-15-0268.1, 2016. a, b, c
Forsberg, R., Hvidegaard, S. M., Skourup, H., and Simonsen, S.: Three decades of polar airborne campaigns in the Arctic and Antarctica, in: AGU Fall Meeting Abstracts, vol. 2023 of AGU Fall Meeting Abstracts, C31C–1365, 2023. a
Geerts, B., Giangrande, S. E., McFarquhar, G. M., Xue, L., Abel, S. J., Comstock, J. M., Crewell, S., DeMott, P. J., Ebell, K., Field, P., Hill, T. C. J., Hunzinger, A., Jensen, M. P., Johnson, K. L., Juliano, T. W., Kollias, P., Kosovic, B., Lackner, C., Luke, E., Lüpkes, C., Matthews, A. A., Neggers, R., Ovchinnikov, M., Powers, H., Shupe, M. D., Spengler, T., Swanson, B. E., Tjernström, M., Theisen, A. K., Wales, N. A., Wang, Y., Wendisch, M., and Wu, P.: The COMBLE Campaign: A Study of Marine Boundary Layer Clouds in Arctic Cold-Air Outbreaks, B. Am. Meteorol. Soc., 103, E1371–E1389, https://doi.org/10.1175/BAMS-D-21-0044.1, 2022. a
Gryschka, M. and Raasch, S.: Roll convection during a cold air outbreak: A large eddy simulation with stationary model domain, Geophys. Res. Lett., 32, https://doi.org/10.1029/2005GL022872, 2005. a, b
Heikenfeld, M., Marinescu, P. J., Christensen, M., Watson-Parris, D., Senf, F., van den Heever, S. C., and Stier, P.: tobac 1.2: towards a flexible framework for tracking and analysis of clouds in diverse datasets, Geosci. Model Dev., 12, 4551–4570, https://doi.org/10.5194/gmd-12-4551-2019, 2019. a, b
Hersbach, H., Bell, B., Berrisford, P., Biavati, G., Horányi, A., Muñoz Sabater, J., Nicolas, J., Peubey, C., Radu, R., Rozum, I., Schepers, D., Simmons, A., Soci, C., Dee, D., and Thépaut, J.-N.: ERA5 hourly data on pressure levels from 1940 to present, https://doi.org/10.24381/cds.bd0915c6 (last access: 3 April 2025), 2023a. a, b
Hersbach, H., Bell, B., Berrisford, P., Biavati, G., Horányi, A., Muñoz Sabater, J., Nicolas, J., Peubey, C., Radu, R., Rozum, I., Schepers, D., Simmons, A., Soci, C., Dee, D., and Thépaut, J.-N.: ERA5 hourly data on single levels from 1940 to present, https://doi.org/10.24381/cds.adbb2d47 (last access: 3 April 2025), 2023b. a, b
Inoue, J., Sato, K., Rinke, A., Cassano, J. J., Fettweis, X., Heinemann, G., Matthes, H., Orr, A., Phillips, T., Seefeldt, M., Solomon, A., and Webster, S.: Clouds and Radiation Processes in Regional Climate Models Evaluated Using Observations Over the Ice-free Arctic Ocean, J. Geophys. Res.-Atmos., 126, e2020JD033904, https://doi.org/10.1029/2020JD033904, 2021. a
Kirbus, B., Schirmacher, I., Klingebiel, M., Schäfer, M., Ehrlich, A., Slättberg, N., Lucke, J., Moser, M., Müller, H., and Wendisch, M.: Thermodynamic and cloud evolution in a cold-air outbreak during HALO-(𝒜𝒞)3: quasi-Lagrangian observations compared to the ERA5 and CARRA reanalyses, Atmos. Chem. Phys., 24, 3883–3904, https://doi.org/10.5194/acp-24-3883-2024, 2024. a, b, c, d, e, f
Kölling, T., Zinner, T., and Mayer, B.: Aircraft-based stereographic reconstruction of 3-D cloud geometry, Atmos. Meas. Tech., 12, 1155–1166, https://doi.org/10.5194/amt-12-1155-2019, 2019. a, b
Komurcu, M., Storelvmo, T., Tan, I., Lohmann, U., Yun, Y., Penner, J. E., Wang, Y., Liu, X., and Takemura, T.: Intercomparison of the cloud water phase among global climate models, J. Geophys. Res.-Atmos., 119, 3372–3400, https://doi.org/10.1002/2013JD021119, 2014. a
Korolev, A. and Milbrandt, J.: How Are Mixed-Phase Clouds Mixed?, Geophys. Res. Lett., 49, e2022GL099578, https://doi.org/10.1029/2022GL099578, 2022. a
Korolev, A., McFarquhar, G., Field, P. R., Franklin, C., Lawson, P., Wang, Z., Williams, E., Abel, S. J., Axisa, D., Borrmann, S., Crosier, J., Fugal, J., Krämer, M., Lohmann, U., Schlenczek, O., Schnaiter, M., and Wendisch, M.: Mixed-Phase Clouds: Progress and Challenges, Meteorological Monographs, 58, 5.1–5.50, https://doi.org/10.1175/AMSMONOGRAPHS-D-17-0001.1, 2017. a, b
Krautstrunk, M. and Giez, A.: The Transition From FALCON to HALO Era Airborne Atmospheric Research, 609–624, Springer Berlin Heidelberg, Berlin, Heidelberg, ISBN 978-3-642-30183-4, https://doi.org/10.1007/978-3-642-30183-4_37, 2012. a, b
Kretzschmar, J., Salzmann, M., Mülmenstädt, J., and Quaas, J.: Arctic clouds in ECHAM6 and their sensitivity to cloud microphysics and surface fluxes, Atmos. Chem. Phys., 19, 10571–10589, https://doi.org/10.5194/acp-19-10571-2019, 2019. a
Kretzschmar, J., Stapf, J., Klocke, D., Wendisch, M., and Quaas, J.: Employing airborne radiation and cloud microphysics observations to improve cloud representation in ICON at kilometer-scale resolution in the Arctic, Atmos. Chem. Phys., 20, 13145–13165, https://doi.org/10.5194/acp-20-13145-2020, 2020. a
Lackner, C. P., Geerts, B., Juliano, T. W., Xue, L., and Kosovic, B.: Vertical Structure of Clouds and Precipitation During Arctic Cold-Air Outbreaks and Warm-Air Intrusions: Observations From COMBLE, J. Geophys. Res.-Atmos., 128, e2022JD038403, https://doi.org/10.1029/2022JD038403, 2023. a
Lloyd, G., Choularton, T. W., Bower, K. N., Gallagher, M. W., Crosier, J., O'Shea, S., Abel, S. J., Fox, S., Cotton, R., and Boutle, I. A.: In situ measurements of cloud microphysical and aerosol properties during the break-up of stratocumulus cloud layers in cold air outbreaks over the North Atlantic, Atmos. Chem. Phys., 18, 17191–17206, https://doi.org/10.5194/acp-18-17191-2018, 2018. a
Ludwig, V., Spreen, G., and Pedersen, L. T.: Evaluation of a New Merged Sea-Ice Concentration Dataset at 1 km Resolution from Thermal Infrared and Passive Microwave Satellite Data in the Arctic, Remote Sens., 12, https://doi.org/10.3390/rs12193183, 2020. a, b
Mages, Z., Kollias, P., Zhu, Z., and Luke, E. P.: Surface-based observations of cold-air outbreak clouds during the COMBLE field campaign, Atmos. Chem. Phys., 23, 3561–3574, https://doi.org/10.5194/acp-23-3561-2023, 2023. a
Maherndl, N., Moser, M., Schirmacher, I., Bansemer, A., Lucke, J., Voigt, C., and Maahn, M.: How does riming influence the observed spatial variability of ice water in mixed-phase clouds?, Atmos. Chem. Phys., 24, 13935–13960, https://doi.org/10.5194/acp-24-13935-2024, 2024. a
Marchant, B., Platnick, S., Meyer, K., and Wind, G.: Evaluation of the MODIS Collection 6 multilayer cloud detection algorithm through comparisons with CloudSat Cloud Profiling Radar and CALIPSO CALIOP products, Atmos. Meas. Tech., 13, 3263–3275, https://doi.org/10.5194/amt-13-3263-2020, 2020. a
Mateling, M. E., Pettersen, C., Kulie, M. S., and L'Ecuyer, T. S.: Marine Cold-Air Outbreak Snowfall in the North Atlantic: A CloudSat Perspective, J. Geophys. Res.-Atmos., 128, e2022JD038053, https://doi.org/10.1029/2022JD038053, 2023. a
Matus, A. V. and L'Ecuyer, T. S.: The role of cloud phase in Earth's radiation budget, J. Geophys. Res.-Atmos., 122, 2559–2578, https://doi.org/10.1002/2016JD025951, 2017. a
McCoy, D. T., Hartmann, D. L., Zelinka, M. D., Ceppi, P., and Grosvenor, D. P.: Mixed-phase cloud physics and Southern Ocean cloud feedback in climate models, J. Geophys. Res.-Atmos., 120, 9539–9554, https://doi.org/10.1002/2015JD023603, 2015. a
McCoy, I. L., Wood, R., and Fletcher, J. K.: Identifying Meteorological Controls on Open and Closed Mesoscale Cellular Convection Associated with Marine Cold Air Outbreaks, J. Geophys. Res.-Atmos., 122, 11678–11702, https://doi.org/10.1002/2017JD027031, 2017. a, b
Michaelis, J., Schmitt, A. U., Lüpkes, C., Hartmann, J., Birnbaum, G., and Vihma, T.: Observations of marine cold-air outbreaks: a comprehensive data set of airborne and dropsonde measurements from the Springtime Atmospheric Boundary Layer Experiment (STABLE), Earth Syst. Sci. Data, 14, 1621–1637, https://doi.org/10.5194/essd-14-1621-2022, 2022. a
Morrison, H., De Boer, G., Feingold, G., Harrington, J., Shupe, M., and Sulia, K.: Resilience of persistent Arctic mixed-phase clouds, Nat. Geosci., 5, 11–17, https://doi.org/10.1038/ngeo1332, 2012. a, b
Moser, M., Lucke, J., De La Torre Castro, E., Mayer, J., and Voigt, C.: DLR in situ cloud measurements during HALO-(AC)3 Arctic airborne campaign, PANGAEA [data set], https://doi.org/10.1594/PANGAEA.963247, 2023. a
Murray-Watson, R. J., Gryspeerdt, E., and Goren, T.: Investigating the development of clouds within marine cold-air outbreaks, Atmos. Chem. Phys., 23, 9365–9383, https://doi.org/10.5194/acp-23-9365-2023, 2023. a, b, c, d, e, f, g, h, i, j, k
Otsu, N.: A Threshold Selection Method from Gray-Level Histograms, IEEE T. Syst. Man Cyb., 9, 62–66, https://doi.org/10.1109/TSMC.1979.4310076, 1979. a
Papritz, L. and Spengler, T.: A Lagrangian Climatology of Wintertime Cold Air Outbreaks in the Irminger and Nordic Seas and Their Role in Shaping Air–Sea Heat Fluxes, J. Climate, 30, 2717–2737, https://doi.org/10.1175/JCLI-D-16-0605.1, 2017. a, b, c, d, e, f
Pithan, F., Medeiros, B., and Mauritsen, T.: Mixed-phase clouds cause climate model biases in Arctic wintertime temperature inversions, Clim. Dynam., 43, 289–303, https://doi.org/10.1007/s00382-013-1964-9, 2014. a, b, c
Pithan, F., Ackerman, A., Angevine, W. M., Hartung, K., Ickes, L., Kelley, M., Medeiros, B., Sandu, I., Steeneveld, G.-J., Sterk, H. A. M., Svensson, G., Vaillancourt, P. A., and Zadra, A.: Select strengths and biases of models in representing the Arctic winter boundary layer over sea ice: the Larcform 1 single column model intercomparison, J. Adv. Model. Earth Sy., 8, 1345–1357, https://doi.org/10.1002/2016MS000630, 2016. a
Pithan, F., Svensson, G., Caballero, R., Chechin, D., Cronin, T. W., Ekman, A. M. L., Neggers, R., Shupe, M. D., Solomon, A., Tjernström, M., and Wendisch, M.: Role of air-mass transformations in exchange between the Arctic and mid-latitudes, Nat. Geosci., 11, 805–812, https://doi.org/10.1038/s41561-018-0234-1, 2018. a, b, c
Pörtge, V., Kölling, T., Weber, A., Volkmer, L., Emde, C., Zinner, T., Forster, L., and Mayer, B.: High-spatial-resolution retrieval of cloud droplet size distribution from polarized observations of the cloudbow, Atmos. Meas. Tech., 16, 645–667, https://doi.org/10.5194/amt-16-645-2023, 2023. a, b
Pörtge, V. T.: Understanding cloud droplet size distributions from multi-angle polarimetric observations, https://doi.org/10.5282/edoc.34002, 2024. a
Ruiz-Donoso, E., Ehrlich, A., Schäfer, M., Jäkel, E., Schemann, V., Crewell, S., Mech, M., Kulla, B. S., Kliesch, L.-L., Neuber, R., and Wendisch, M.: Small-scale structure of thermodynamic phase in Arctic mixed-phase clouds observed by airborne remote sensing during a cold air outbreak and a warm air advection event, Atmos. Chem. Phys., 20, 5487–5511, https://doi.org/10.5194/acp-20-5487-2020, 2020. a, b
Sato, Y., Miura, H., Yashiro, H., Goto, D., Takemura, T., Tomita, H., and Nakajima, T.: Unrealistically pristine air in the Arctic produced by current global scale models, Sci. Rep., 6, https://doi.org/10.1038/srep26561, 2016. a
Schäfer, M., Bierwirth, E., Ehrlich, A., Jäkel, E., Werner, F., and Wendisch, M.: Directional, horizontal inhomogeneities of cloud optical thickness fields retrieved from ground-based and airbornespectral imaging, Atmos. Chem. Phys., 17, 2359–2372, https://doi.org/10.5194/acp-17-2359-2017, 2017. a
Schäfer, M., Loewe, K., Ehrlich, A., Hoose, C., and Wendisch, M.: Simulated and observed horizontal inhomogeneities of optical thickness of Arctic stratus, Atmos. Chem. Phys., 18, 13115–13133, https://doi.org/10.5194/acp-18-13115-2018, 2018. a
Schirmacher, I., Schnitt, S., Klingebiel, M., Maherndl, N., Kirbus, B., Ehrlich, A., Mech, M., and Crewell, S.: Clouds and precipitation in the initial phase of marine cold-air outbreaks as observed by airborne remote sensing, Atmos. Chem. Phys., 24, 12823–12842, https://doi.org/10.5194/acp-24-12823-2024, 2024. a, b, c, d, e, f, g, h
Seppala, H., Zhang, Z., and Zheng, X.: Developing a Lagrangian Frame Transformation on Satellite Data to Study Cloud Microphysical Transitions in Arctic Marine Cold Air Outbreaks, Geophys. Res. Lett., 52, e2025GL115637, https://doi.org/10.1029/2025GL115637, 2025. a
Shupe, M. D., Rex, M., Blomquist, B., Persson, P. O. G., Schmale, J., Uttal, T., Althausen, D., Angot, H., Archer, S., Bariteau, L., Beck, I., Bilberry, J., Bucci, S., Buck, C., Boyer, M., Brasseur, Z., Brooks, I. M., Calmer, R., Cassano, J., Castro, V., Chu, D., Costa, D., Cox, C. J., Creamean, J., Crewell, S., Dahlke, S., Damm, E., de Boer, G., Deckelmann, H., Dethloff, K., Dütsch, M., Ebell, K., Ehrlich, A., Ellis, J., Engelmann, R., Fong, A. A., Frey, M. M., Gallagher, M. R., Ganzeveld, L., Gradinger, R., Graeser, J., Greenamyer, V., Griesche, H., Griffiths, S., Hamilton, J., Heinemann, G., Helmig, D., Herber, A., Heuzé, C., Hofer, J., Houchens, T., Howard, D., Inoue, J., Jacobi, H.-W., Jaiser, R., Jokinen, T., Jourdan, O., Jozef, G., King, W., Kirchgaessner, A., Klingebiel, M., Krassovski, M., Krumpen, T., Lampert, A., Landing, W., Laurila, T., Lawrence, D., Lonardi, M., Loose, B., Lüpkes, C., Maahn, M., Macke, A., Maslowski, W., Marsay, C., Maturilli, M., Mech, M., Morris, S., Moser, M., Nicolaus, M., Ortega, P., Osborn, J., Pätzold, F., Perovich, D. K., Petäjä, T., Pilz, C., Pirazzini, R., Posman, K., Powers, H., Pratt, K. A., Preußer, A., Quéléver, L., Radenz, M., Rabe, B., Rinke, A., Sachs, T., Schulz, A., Siebert, H., Silva, T., Solomon, A., Sommerfeld, A., Spreen, G., Stephens, M., Stohl, A., Svensson, G., Uin, J., Viegas, J., Voigt, C., von der Gathen, P., Wehner, B., Welker, J. M., Wendisch, M., Werner, M., Xie, Z., and Yue, F.: Overview of the MOSAiC expedition: Atmosphere, Elementa: Science of the Anthropocene, 10, 00060, https://doi.org/10.1525/elementa.2021.00060, 2022. a
Smith, D. M., Screen, J. A., Deser, C., Cohen, J., Fyfe, J. C., García-Serrano, J., Jung, T., Kattsov, V., Matei, D., Msadek, R., Peings, Y., Sigmond, M., Ukita, J., Yoon, J.-H., and Zhang, X.: The Polar Amplification Model Intercomparison Project (PAMIP) contribution to CMIP6: investigating the causes and consequences of polar amplification, Geosci. Model Dev., 12, 1139–1164, https://doi.org/10.5194/gmd-12-1139-2019, 2019. a
Sokolowsky, G. A., Freeman, S. W., Jones, W. K., Kukulies, J., Senf, F., Marinescu, P. J., Heikenfeld, M., Brunner, K. N., Bruning, E. C., Collis, S. M., Jackson, R. C., Leung, G. R., Pfeifer, N., Raut, B. A., Saleeby, S. M., Stier, P., and van den Heever, S. C.: tobac v1.5: introducing fast 3D tracking, splits and mergers, and other enhancements for identifying and analysing meteorological phenomena, Geosci. Model Dev., 17, 5309–5330, https://doi.org/10.5194/gmd-17-5309-2024, 2024. a, b
Spensberger, C. and Spengler, T.: Sensitivity of Air-Sea Heat Exchange in Cold-Air Outbreaks to Model Resolution and Sea-Ice Distribution, J. Geophys. Res.-Atmos., 126, e2020JD033610, https://doi.org/10.1029/2020JD033610, e2020JD033610 2020JD033610, 2021. a
Sprenger, M. and Wernli, H.: The LAGRANTO Lagrangian analysis tool – version 2.0, Geosci. Model Dev., 8, 2569–2586, https://doi.org/10.5194/gmd-8-2569-2015, 2015. a
Stevens, B., Ament, F., Bony, S., Crewell, S., Ewald, F., Gross, S., Hansen, A., Hirsch, L., Jacob, M., Kölling, T., Konow, H., Mayer, B., Wendisch, M., Wirth, M., Wolf, K., Bakan, S., Bauer-Pfundstein, M., Brueck, M., Delanoë, J., Ehrlich, A., Farrell, D., Forde, M., Gödde, F., Grob, H., Hagen, M., Jäkel, E., Jansen, F., Klepp, C., Klingebiel, M., Mech, M., Peters, G., Rapp, M., Wing, A. A., and Zinner, T.: A High-Altitude Long-Range Aircraft Configured as a Cloud Observatory: The NARVAL Expeditions, B. Am. Meteorol. Soc., 100, 1061–1077, https://doi.org/10.1175/BAMS-D-18-0198.1, 2019. a, b
Svingen, K., Brakstad, A., Våge, K., von Appen, W.-J., and Papritz, L.: The Impact of Cold-Air Outbreaks and Oceanic Lateral Fluxes on Dense-Water Formation in the Greenland Sea from a 10-Year Moored Record (1999–2009), J. Phys. Oceanogr., 53, 1499–1517, https://doi.org/10.1175/JPO-D-22-0160.1, 2023. a
Tan, I. and Storelvmo, T.: Evidence of Strong Contributions From Mixed-Phase Clouds to Arctic Climate Change, Geophys. Res. Lett., 46, 2894–2902, https://doi.org/10.1029/2018GL081871, 2019. a
Tomassini, L., Field, P. R., Honnert, R., Malardel, S., McTaggart-Cowan, R., Saitou, K., Noda, A. T., and Seifert, A.: The “Grey Zone” cold air outbreak global model intercomparison: A cross evaluation using large-eddy simulations, J. Adv. Model. Earth Sy., 9, 39–64, https://doi.org/10.1002/2016MS000822, 2017. a
Tornow, F., Ackerman, A. S., and Fridlind, A. M.: Preconditioning of overcast-to-broken cloud transitions by riming in marine cold air outbreaks, Atmos. Chem. Phys., 21, 12049–12067, https://doi.org/10.5194/acp-21-12049-2021, 2021. a, b, c
Tornow, F., Ackerman, A. S., Fridlind, A. M., Tselioudis, G., Cairns, B., Painemal, D., and Elsaesser, G.: On the Impact of a Dry Intrusion Driving Cloud-Regime Transitions in a Midlatitude Cold-Air Outbreak, J. Atmos. Sci., 80, 2881–2896, https://doi.org/10.1175/JAS-D-23-0040.1, 2023. a
Uttal, T., Curry, J. A., McPhee, M. G., Perovich, D. K., Moritz, R. E., Maslanik, J. A., Guest, P. S., Stern, H. L., Moore, J. A., Turenne, R., Heiberg, A., Serreze, M. C., Wylie, D. P., Persson, O. G., Paulson, C. A., Halle, C., Morison, J. H., Wheeler, P. A., Makshtas, A., Welch, H., Shupe, M. D., Intrieri, J. M., Stamnes, K., Lindsey, R. W., Pinkel, R., Pegau, W. S., Stanton, T. P., and Grenfeld, T. C.: Surface Heat Budget of the Arctic Ocean, B. Am. Meteorol. Soc., 83, 255–276, https://doi.org/10.1175/1520-0477(2002)083<0255:SHBOTA>2.3.CO;2, 2002. a
Volkmer, L., Pörtge, V., Jakub, F., and Mayer, B.: Model-based evaluation of cloud geometry and droplet size retrievals from two-dimensional polarized measurements of specMACS, Atmos. Meas. Tech., 17, 1703–1719, https://doi.org/10.5194/amt-17-1703-2024, 2024. a, b, c
Walbröl, A., Michaelis, J., Becker, S., Dorff, H., Ebell, K., Gorodetskaya, I., Heinold, B., Kirbus, B., Lauer, M., Maherndl, N., Maturilli, M., Mayer, J., Müller, H., Neggers, R. A. J., Paulus, F. M., Röttenbacher, J., Rückert, J. E., Schirmacher, I., Slättberg, N., Ehrlich, A., Wendisch, M., and Crewell, S.: Contrasting extremely warm and long-lasting cold air anomalies in the North Atlantic sector of the Arctic during the HALO-(𝒜𝒞)3 campaign, Atmos. Chem. Phys., 24, 8007–8029, https://doi.org/10.5194/acp-24-8007-2024, 2024. a, b, c, d, e
Weber, A.: Remote sensing of mixed-phase clouds and their evolution during marine cold air outbreaks in the Arctic, LMU München: Fakultät für Physik, https://doi.org/10.5282/edoc.36417, 2025. a, b
Weber, A., Kölling, T., Pörtge, V., Baumgartner, A., Rammeloo, C., Zinner, T., and Mayer, B.: Polarization upgrade of specMACS: calibration and characterization of the 2D RGB polarization-resolving cameras, Atmos. Meas. Tech., 17, 1419–1439, https://doi.org/10.5194/amt-17-1419-2024, 2024a. a, b, c
Weber, A., Pörtge, V., Zinner, T., and Mayer, B.: Spectral radiance measurements with the hyperspectral and polarized imaging system specMACS during the HALO-(AC)3 field campaign, PANGAEA [data set], https://doi.org/10.1594/PANGAEA.966992, 2024b. a
Weber, A., Hoffmann, F., and Mayer, B.: Quasi-Lagrangian observations of cloud transitions during the initial phase of marine cold air outbreaks in the Arctic – Part 2: Vertical cloud structure, EGUsphere [preprint], https://doi.org/10.5194/egusphere-2025-5832, 2025a. a, b, c, d, e
Weber, A., Pörtge, V., Emde, C., and Mayer, B.: Retrieval of cloud thermodynamic phase partitioning from multi-angle polarimetric imaging of Arctic mixed-phase clouds, Atmos. Meas. Tech., 18, 7581–7601, https://doi.org/10.5194/amt-18-7581-2025, 2025b. a, b, c, d, e, f
Wendisch, M., Handorf, D., Tegen, I., Neggers, R. A. J., and Spreen, G.: Glimpsing the Ins and Outs of the Arctic Atmospheric Cauldron, Eos, 102, https://doi.org/10.1029/2021EO155959, 2021. a
Wendisch, M., Brückner, M., Crewell, S., Ehrlich, A., Notholt, J., Lüpkes, C., Macke, A., Burrows, J. P., Rinke, A., Quaas, J., Maturilli, M., Schemann, V., Shupe, M. D., Akansu, E. F., Barrientos-Velasco, C., Bärfuss, K., Blechschmidt, A.-M., Block, K., Bougoudis, I., Bozem, H., Böckmann, C., Bracher, A., Bresson, H., Bretschneider, L., Buschmann, M., Chechin, D. G., Chylik, J., Dahlke, S., Deneke, H., Dethloff, K., Donth, T., Dorn, W., Dupuy, R., Ebell, K., Egerer, U., Engelmann, R., Eppers, O., Gerdes, R., Gierens, R., Gorodetskaya, I. V., Gottschalk, M., Griesche, H., Gryanik, V. M., Handorf, D., Harm-Altstädter, B., Hartmann, J., Hartmann, M., Heinold, B., Herber, A., Herrmann, H., Heygster, G., Höschel, I., Hofmann, Z., Hölemann, J., Hünerbein, A., Jafariserajehlou, S., Jäkel, E., Jacobi, C., Janout, M., Jansen, F., Jourdan, O., Jurányi, Z., Kalesse-Los, H., Kanzow, T., Käthner, R., Kliesch, L. L., Klingebiel, M., Knudsen, E. M., Kovács, T., Körtke, W., Krampe, D., Kretzschmar, J., Kreyling, D., Kulla, B., Kunkel, D., Lampert, A., Lauer, M., Lelli, L., von Lerber, A., Linke, O., Löhnert, U., Lonardi, M., Losa, S. N., Losch, M., Maahn, M., Mech, M., Mei, L., Mertes, S., Metzner, E., Mewes, D., Michaelis, J., Mioche, G., Moser, M., Nakoudi, K., Neggers, R., Neuber, R., Nomokonova, T., Oelker, J., Papakonstantinou-Presvelou, I., Pätzold, F., Pefanis, V., Pohl, C., van Pinxteren, M., Radovan, A., Rhein, M., Rex, M., Richter, A., Risse, N., Ritter, C., Rostosky, P., Rozanov, V. V., Donoso, E. R., Garfias, P. S., Salzmann, M., Schacht, J., Schäfer, M., Schneider, J., Schnierstein, N., Seifert, P., Seo, S., Siebert, H., Soppa, M. A., Spreen, G., Stachlewska, I. S., Stapf, J., Stratmann, F., Tegen, I., Viceto, C., Voigt, C., Vountas, M., Walbröl, A., Walter, M., Wehner, B., Wex, H., Willmes, S., Zanatta, M., and Zeppenfeld, S.: Atmospheric and Surface Processes, and Feedback Mechanisms Determining Arctic Amplification: A Review of First Results and Prospects of the (AC)3 Project, B. Am. Meteorol. Soc., 104, E208–E242, https://doi.org/10.1175/BAMS-D-21-0218.1, 2023. a, b
Wendisch, M., Crewell, S., Ehrlich, A., Herber, A., Kirbus, B., Lüpkes, C., Mech, M., Abel, S. J., Akansu, E. F., Ament, F., Aubry, C., Becker, S., Borrmann, S., Bozem, H., Brückner, M., Clemen, H.-C., Dahlke, S., Dekoutsidis, G., Delanoë, J., De La Torre Castro, E., Dorff, H., Dupuy, R., Eppers, O., Ewald, F., George, G., Gorodetskaya, I. V., Grawe, S., Groß, S., Hartmann, J., Henning, S., Hirsch, L., Jäkel, E., Joppe, P., Jourdan, O., Jurányi, Z., Karalis, M., Kellermann, M., Klingebiel, M., Lonardi, M., Lucke, J., Luebke, A. E., Maahn, M., Maherndl, N., Maturilli, M., Mayer, B., Mayer, J., Mertes, S., Michaelis, J., Michalkov, M., Mioche, G., Moser, M., Müller, H., Neggers, R., Ori, D., Paul, D., Paulus, F. M., Pilz, C., Pithan, F., Pöhlker, M., Pörtge, V., Ringel, M., Risse, N., Roberts, G. C., Rosenburg, S., Röttenbacher, J., Rückert, J., Schäfer, M., Schaefer, J., Schemann, V., Schirmacher, I., Schmidt, J., Schmidt, S., Schneider, J., Schnitt, S., Schwarz, A., Siebert, H., Sodemann, H., Sperzel, T., Spreen, G., Stevens, B., Stratmann, F., Svensson, G., Tatzelt, C., Tuch, T., Vihma, T., Voigt, C., Volkmer, L., Walbröl, A., Weber, A., Wehner, B., Wetzel, B., Wirth, M., and Zinner, T.: Overview: quasi-Lagrangian observations of Arctic air mass transformations – introduction and initial results of the HALO–(𝒜𝒞)3 aircraft campaign, Atmos. Chem. Phys., 24, 8865–8892, https://doi.org/10.5194/acp-24-8865-2024, 2024. a, b, c, d, e, f, g
Wendisch, M., Kirbus, B., Ori, D., Shupe, M. D., Crewell, S., Sodemann, H., and Schemann, V.: Observed and modeled Arctic airmass transformations during warm air intrusions and cold air outbreaks, Atmos. Chem. Phys., 25, 15047–15076, https://doi.org/10.5194/acp-25-15047-2025, 2025. a, b
Wesche, C., Steinhage, D., and Nixdorf, U.: Polar aircraft Polar5 and Polar6 operated by the Alfred Wegener Institute, Journal of large-scale research facilities, 2, A87, https://doi.org/10.17815/jlsrf-2-153, 2016. a
Wu, P. and Ovchinnikov, M.: Cloud Morphology Evolution in Arctic Cold-Air Outbreak: Two Cases During COMBLE Period, J. Geophys. Res.-Atmos., 127, e2021JD035966, https://doi.org/10.1029/2021JD035966, 2022. a
Xia, Z. and McFarquhar, G. M.: Dependence of Cloud Macrophysical Properties and Phase Distributions on Environmental Conditions Over the North Atlantic and Southern Ocean: Results From COMBLE and MARCUS, J. Geophys. Res.-Atmos., 129, e2023JD039869, https://doi.org/10.1029/2023JD039869, 2024. a
Young, G., Jones, H. M., Choularton, T. W., Crosier, J., Bower, K. N., Gallagher, M. W., Davies, R. S., Renfrew, I. A., Elvidge, A. D., Darbyshire, E., Marenco, F., Brown, P. R. A., Ricketts, H. M. A., Connolly, P. J., Lloyd, G., Williams, P. I., Allan, J. D., Taylor, J. W., Liu, D., and Flynn, M. J.: Observed microphysical changes in Arctic mixed-phase clouds when transitioning from sea ice to open ocean, Atmos. Chem. Phys., 16, 13945–13967, https://doi.org/10.5194/acp-16-13945-2016, 2016. a