the Creative Commons Attribution 4.0 License.
the Creative Commons Attribution 4.0 License.
 | 04 Mar 2026
Aerosol-driven precipitation modification: spatiotemporal heterogeneity in precipitation microphysics and vertical profiles over China's megacity clusters
Heyuan Peng
Zhen Li
Shensen Hu
Junqi Qiao
Xianbin Zhao
As crucial atmospheric components, aerosols influence precipitation through complex microphysical mechanisms and exhibit spatiotemporal heterogeneity. This study investigates aerosol effects on precipitation vertical profiles and microphysical characteristics across four Chinese urban clusters (the Beijing–Tianjin–Hebei (BTH), Yangtze River Delta (YRD), Yangtze River Middle Reaches (YRM), and Pearl River Delta (PRD)), including sensitivities to meteorological factors. Initially, the principal findings elucidate three fundamental attributes of precipitation differences: regional disparities surpass seasonal variations in magnitude; heightened aerosol loadings mitigate regional precipitation discrepancies, particularly during the spring and summer seasons; convective precipitation exhibits greater regional and seasonal variability than stratiform precipitation. Furthermore, the findings indicate that aerosols exert an influence on precipitation through microphysical processes, encompassing the growth via condensation on cloud condensation nuclei, coalescence growth, semi-direct effect, and moisture competition. These phenomena exhibit distinct variations that are influenced by spatial and temporal factors, along with the particular type of aerosols present. Specifically, convective precipitation in the BTH region is dominated by the semi-direct effect and invigoration effect of dust aerosols, whereas the YRD and PRD are more influenced by hygroscopic sea salt aerosols and the YRM by fine aerosol particles. Furthermore, RH promotes condensation and coalescence processes by replenishing water vapor, particularly under low aerosol loading. However, CAPE plays a dual role: it enhances precipitation by intensifying cloud development and suppresses it through particle break-up driven by dynamics. The present study elucidates the mechanisms of spatio–temporal modulation underlying aerosol–precipitation interactions, offering a scientific foundation for the refinement of climate models within urban agglomerations.
- Article
(15558 KB) - Full-text XML
-
Supplement
(16164 KB) - BibTeX
- EndNote


Aerosols modulate clouds and precipitation primarily through Aerosol–Radiation Interactions (ARI) and Aerosol–Cloud Interactions (ACI) (IPCC, 2013, 2021), which subsequently affect the intensity, frequency, and spatiotemporal distribution of precipitation (Rosenfeld et al., 2008). These interactions involve complex multiscale, multi-factor coupling effects with profound implications for regional hydrological cycles, extreme weather events, and climate systems (Li et al., 2016, 2019; Ramanathan et al., 2001; Zhao et al., 2018, 2020). Therefore, elucidating aerosol-driven precipitation mechanisms remains one of the key objectives in atmospheric science (IPCC, 2013, 2021). As a central component of this modulation framework, the ACI describes the process by which aerosols function as ice nuclei (IN) and cloud condensation nuclei (CCN), modifying cloud microphysical processes to indirectly modify the type and distribution of precipitation intensity (IPCC, 2013; Gettelman, 2015). Specifically, these modified cloud microphysical processes include cloud droplet spectrum distribution, phase transition efficiency, and precipitation formation pathways (Xie et al., 2013). The phenomenon known as the Twomey Effect (the First Indirect Effect) describes how higher aerosol loadings increase cloud droplet concentration while decreasing their effective radius (re) and increasing cloud albedo (Twomey, 1974). In addition, the Cloud Lifetime Effect (Second Indirect Effect), aerosol-induced reduction in re, suppresses precipitation initiation, whereas prolonging cloud lifetime (Albrecht, 1989). The subsequent Semi-Direct Effect shortens cloud lifetime through another mechanism: absorptive aerosols within clouds heat the atmosphere by absorbing shortwave radiation, thus promoting droplet evaporation (Ackerman et al., 2000; Huang et al., 2014). Despite the established understanding of primary mechanisms, significant uncertainties remain in quantifying aerosol impacts on precipitation. This complexity stems from the highly nonlinear and diverse nature of aerosol-precipitation responses (Chang et al., 2015), which are modulated by aerosol loading, type, vertical distribution, and local meteorological conditions (Fan et al., 2007; Storer et al., 2010), leading to pronounced regional variations (Li et al., 2025a; Xiao et al., 2025). Furthermore, external synoptic conditions, entrainment, and other in-cloud meteorological factors, particularly that surrounding clouds and challenging to be measured, can affect the aerosol effect on clouds and precipitation (Chen et al., 2025; Lee et al., 2008; Stevens and Feingold, 2009; Sun et al., 2023; Zhao et al., 2024).
Recent research has extensively examined aerosol-induced modifications of precipitation structures in major urban clusters across China (Guo et al., 2018; Sun and Zhao, 2021; Zhao et al., 2025). China's major urban agglomerations, Beijing–Tianjin–Hebei (BTH), Yangtze River Delta (YRD), Pearl River Delta (PRD), and Yangtze River Middle Reaches (YRM), characterized by dense populations, robust economies, and severe aerosol pollution, are critical regions for studying how aerosol effects manifest at regional scales. Previous research has been conducted on aerosol-driven precipitation patterns in more general areas, such as the North China Plain (Sun et al., 2023), South China (Chen et al., 2025), and East China (Wen et al., 2023) under different seasonal and precipitation type conditions (Day et al., 2018; Guo et al., 2019). These studies have consistently confirmed that the modulation effects of aerosols on clouds and precipitation exhibit pronounced regional heterogeneity (Guo et al., 2017, 2019; Li et al., 2019; Sun and Zhao, 2021). However, the underlying physical mechanisms, particularly the cloud microphysical processes responsible for these disparate regional responses, are not yet fully understood. Moreover, numerical models show substantial instability in precipitation capture (Zhang et al., 2024), and simulation capabilities exhibit inherent asymmetries (Snively and Gallus, 2014). The comparability of findings across regions and seasons is often limited by methodological and data source differences, which sustain scientific debates. Adopting a unified analytical framework is therefore essential to reconcile these discrepancies and enable systematic comparison.
The Global Precipitation Measurement (GPM) mission extends and advances the Tropical Rainfall Measuring Mission (TRMM). Compared with TRMM's single-frequency Precipitation Radar (PR), the Dual-frequency Precipitation Radar (DPR) onboard the GPM core observatory demonstrates higher sensitivity and provides more accurate three-dimensional precipitation structure. This increase markedly enhances precipitation detection capabilities at mid-to high latitudes (Hou et al., 2014). Furthermore, comparisons between GPM DPR precipitation data and observations from ground-based radars and meteorological stations (Chandrasekar and Le, 2015; Lasser et al., 2019; Sun et al., 2020) showed strong consistency across all three platforms. Moreover, a robust concordance in surface precipitation patterns and bright band was noted between DPR data and the high-resolution NICAM 3.5 km model (Kotsuki et al., 2023), hence reinforcing data dependability.
Additionally, Modern-Era Retrospective Analysis for Research and Applications Version 2 (MERRA-2) significantly improves the accuracy of aerosol vertical distributions and optical properties through assimilation of multi-source satellite and ground-based observations (Buchard et al., 2017; Chang et al., 2015). Building on the reliable precipitation data from GPM DPR, researchers analyzed aerosol impacts on precipitation vertical profile, microphysical characteristics, and extreme hydrometeorological events using integrated MERRA-2 aerosol and DPR precipitation datasets (Ji and Tian, 2024; Jiang et al., 2023; Sun et al., 2022). Furthermore, compared with the ECMWF Re-Analysis-Interim (ERA-Interim), the European Centre for Medium-Range Weather Forecasts Reanalysis Version 5 (ERA-5) offers significantly improved spatiotemporal resolution, yielding superior environmental parameters (Zhao et al., 2021). This enhancement facilitates its widespread utilization in research investigating the impact of aerosol on precipitation structure (Dong et al., 2018; Guo et al., 2018; Pravia-Sarabia et al., 2023).
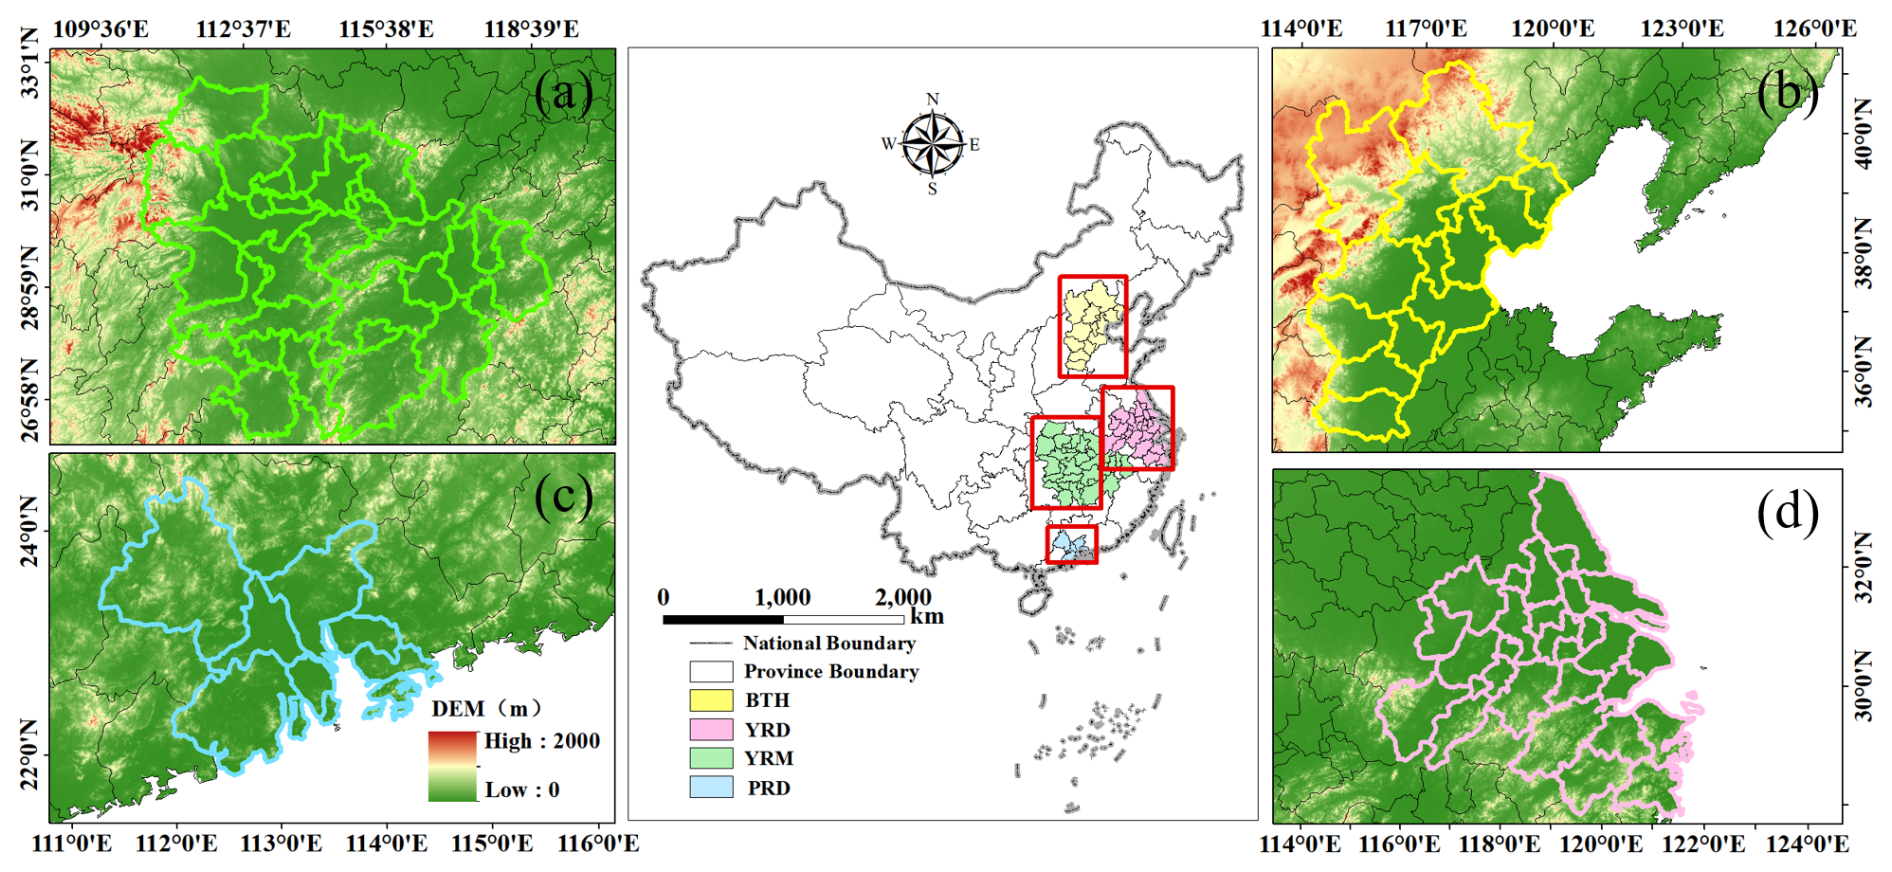
Figure 1Geographical distribution of four urban agglomerations over (a) the Yangtze River Middle Reaches, (b) Beijing–Tianjin–Hebei, (c) Pearl River Delta, and (d) Yangtze River Delta, which is superimposed with elevation. (source: GS(2024) 0650). Publisher's remark: please note that the above figure contains disputed territories.
Peng et al. (2025) conducted a focused investigation into the effects of fine and coarse aerosols on summer precipitation processes within the YRD region. The results indicated that coarse aerosols suppress convective precipitation by competing for moisture, whereas fine aerosols enhance precipitation by forming small droplet clusters with condensational and coalescence growth. However, precipitation characteristics vary significantly across different regions and seasons, which can be attributed to differences in aerosol types, concentrations, and meteorological conditions. Therefore, this study integrates precipitation, aerosol, and environmental data from four major urban agglomerations (the BTH, YRD, YRM, and PRD) between 2014 and 2023. A multi-source DPR-MERRA-2-ERA5 dataset was constructed to systematically analyze the impact of aerosol on precipitation properties and microphysical processes. In addition, this study systematically examines how aerosol-precipitation interactions are modulated by thermodynamic and dynamic conditions. This unified methodology facilitates a comprehensive, cross-regional, and cross-seasonal comparison of aerosol impacts on precipitation and cloud microphysics across China's major urban agglomerations.
The remainder of this paper is organized as follows: Sect. 2 introduces the data and methods. Section 3 examines aerosol influences on precipitation structure and properties. Section 4 conducts an analysis of aerosol effects on the microphysical processes of precipitation. Section 5 investigates meteorological effects on aerosol-precipitation interactions. Section 6 summarizes the conclusions of this study and Sect. 7 discusses the limitations and shortcomings of this research.
2.1 Study area
The YRM urban cluster (Fig. 1a) is situated between 26–32.5° N and 110.5–118.3° E, inside a humid subtropical monsoon region characterized by concentrated summer precipitation. The BTH region (36–41.6° N, 113.5–119.9° E; Fig. 1b) exhibits a temperate semi-humid continental monsoon climate, with summer comprising over 67 % of the annual precipitation and spring characterized by numerous dust events (Zhai et al., 2022). The PRD cluster (21.7–23.8° N, 112–115.4° E; Fig. 1c) exhibits a South Asian tropical marine monsoon climate, characterized by 85 % of annual precipitation occurring from April to September, frequently exacerbated by typhoons (Guo et al., 2018). Dominated by the Taihu Plain (27.9–33.3° N, 117.5–122.7° E; Fig. 1d), the YRD exhibits a humid subtropical monsoon climate characterized by concentrated spring–summer precipitation, including prolonged June–July Meiyu-front rainfall (Liu et al., 2017). Figure 1 shows the spatial distribution of all four urban agglomerations. It is noteworthy that the selected urban agglomerations are primarily situated in plains and basins, thus minimizing the potential confounding effects of complex terrain on the aerosol–cloud–precipitation interactions analyzed in this study.
2.2 GPM DPR Precipitation Data
Mounted on the core satellite, the DPR transmits at the Ku-band (13.6 GHz) and Ka-band (35.5 GHz) frequencies, achieving a nadir horizontal resolution of 5 km to detect three-dimensional precipitation structures from the surface to an altitude of 22 km (Hou et al., 2014). This study utilized the GPM Level 2 DPR (2ADPR) standard product, Version 07, which employs two unique antenna scanning modes: the High-Sensitivity Scan (HS) and the Full Scan (FS). A significant alteration in Version 07, compared to Version 06, entails a shift in the KaPR scanning pattern from the inner swath to the outer swath configuration. This change aligns the KaPR scanning mode with that of KuPR.
This study focuses on liquid precipitation processes detectable by the GPM DPR during spring (March–May), summer (June–August), and autumn (September–November) from 2014 to 2023. The parameters analyzed in this study include: The near-surface Rain Rate (nsRR), Rain Rate (RR), Storm Top Height (STH), Liquid Water Path (LWP), Ice Water Path (IWP), DSD, and radar reflectivity factor (Ze). The DSD includes two parameters: mass-weighted diameter (Dm) and normalized DSD intercepts (Nw).
2.3 MERRA-2 Aerosol Data
This study utilized the MERRA-2 atmospheric reanalysis dataset, updated in 2017 and released by NASA's Global Modeling and Assimilation Office (GMAO). By assimilating multi-source observations with numerical modeling techniques, this dataset characterizes the column mass concentrations of five aerosol types: dust (DU), sea salt (SS), sulfate (SO4), black carbon (BC), and organic carbon (OC), and their corresponding AOD. The data feature a global spatial coverage at a horizontal grid resolution of 0.625° × 0.5° (longitude × latitude), with temporal products available at hourly intervals. It is noteworthy that the matched aerosol data are those within 1 h prior to the onset of precipitation events.
The spatial and seasonal distributions of aerosol composition over China's megacity clusters, are detailed in Figs. S3–S8 in the Supplement. Overall, the BTH region is characterized by a high burden of DUA (Figs. S3–S8b), particularly during spring. In contrast, the PRD region shows a pronounced signal of SSA, especially in spring and summer (Figs. S3–S8d). Figures S3–S8(f and g) show that loadings of both absorbing and scattering aerosols are markedly elevated in the BTH region, in contrast to the discernibly lower concentrations observed in the PRD. These characteristic distributions provide a fundamental basis for interpreting the region-specific aerosol-precipitation mechanisms discussed in subsequent sections.
2.4 ERA-5 Data
Environmental data for this study were acquired from the ERA5 reanalysis dataset. Through the coupled assimilation of multi-source satellite observations, ground-based measurements, and numerical forecasting systems, this product provides multidimensional climate parameters that span the surface-to-stratopause column spatial resolution of 0.25° × 0.25° and temporal resolution of 1 h (Hersbach et al., 2020). This investigation utilizes two key parameters: Relative Humidity (RH) at 850 hPa and Convective Available Potential Energy (CAPE).
2.5 Classification Methods
Prior to data analysis, the DPR, MERRA-2, and ERA5 datasets were subjected to spatiotemporal matching using the best-proximity method. Subsequently, precipitation pixels were screened using the connectivity method (Hu et al., 2022, 2024; Peng et al., 2025; Wang et al., 2024), applying a minimum threshold of four contiguous pixels (nsRR) to define valid precipitation systems (Liu and Zipser, 2015). This study categorized precipitation into stratiform and convective types based on the 2ADPR classification criteria, excluding shallow convection events (defined by the 0° isotherm attitude below STH more than 1 km) from convective precipitation (Liu and Zipser, 2015). It is noteworthy that shallow convection precipitation constitutes a non-negligible proportion of the convective events in our dataset (Table S1 in the Supplement). This prevalence underscores the necessity of our methodological decision to exclude these events. Aerosol classification followed the total AOD thresholds: Low AOD, [0,0.3); Medium AOD, [0.3,0.6); and High AOD, [). In terms of aerosol classification, BCA, OCA, and SO4A were categorized as fine aerosol particles, whereas SSA and DUA were classified as coarse aerosol particles.
Figure S1 illustrates the cumulative distribution functions (CDFs) of the RH and CAPE throughout the four urban agglomerations for meteorological conditioning. Given the higher similarity in RH distributions among the YRD, YRM, and PRD versus distinct BTH characteristics, the YRD–YRM–PRD RH data were unified (red dashed line; Fig. S1a–c). Conversely, the BTH–YRD–YRM exhibited comparable CAPE distributions, and the PRD showed significantly higher values. Thus, the BTH–YRD–YRM CAPE data were combined (red dashed line; Fig. S1d–f). To balance methodological consistency with regional specificity, the classification strategy implemented distinct groupings: RH was classified separately for the BTH region, whereas the YRD, YRM, and PRD shared a unified RH classification. Similarly, CAPE maintained independent classification for the PRD, whereas BTH, YRD, and YRM employed combined CAPE classification, as visualized by the red dashed lines in Fig. S1. Moreover, to prevent feature ambiguity from adjacent samples, three percentile tiers were defined using the CDFs thresholds: low (0 %–30 %), medium (35 %–65 %), and high (70 %–100 %), with 30 %–35 % and 65 %–70 % as buffer zones to avoid adjacent-sample ambiguity.
2.6 Normalized difference calculation
To quantify regional and seasonal differences in precipitation parameters, the BTH region and spring season were set as the benchmark for normalizing variations. The X denote target precipitation parameter, which includes nsRR, STH, LWP, IWP, and precipitation efficiency index (PEI). The fractional changes (DIFFregion, in %) for each parameter in the YRD, YRM, and PRD regions relative to BTH were calculated as follows:
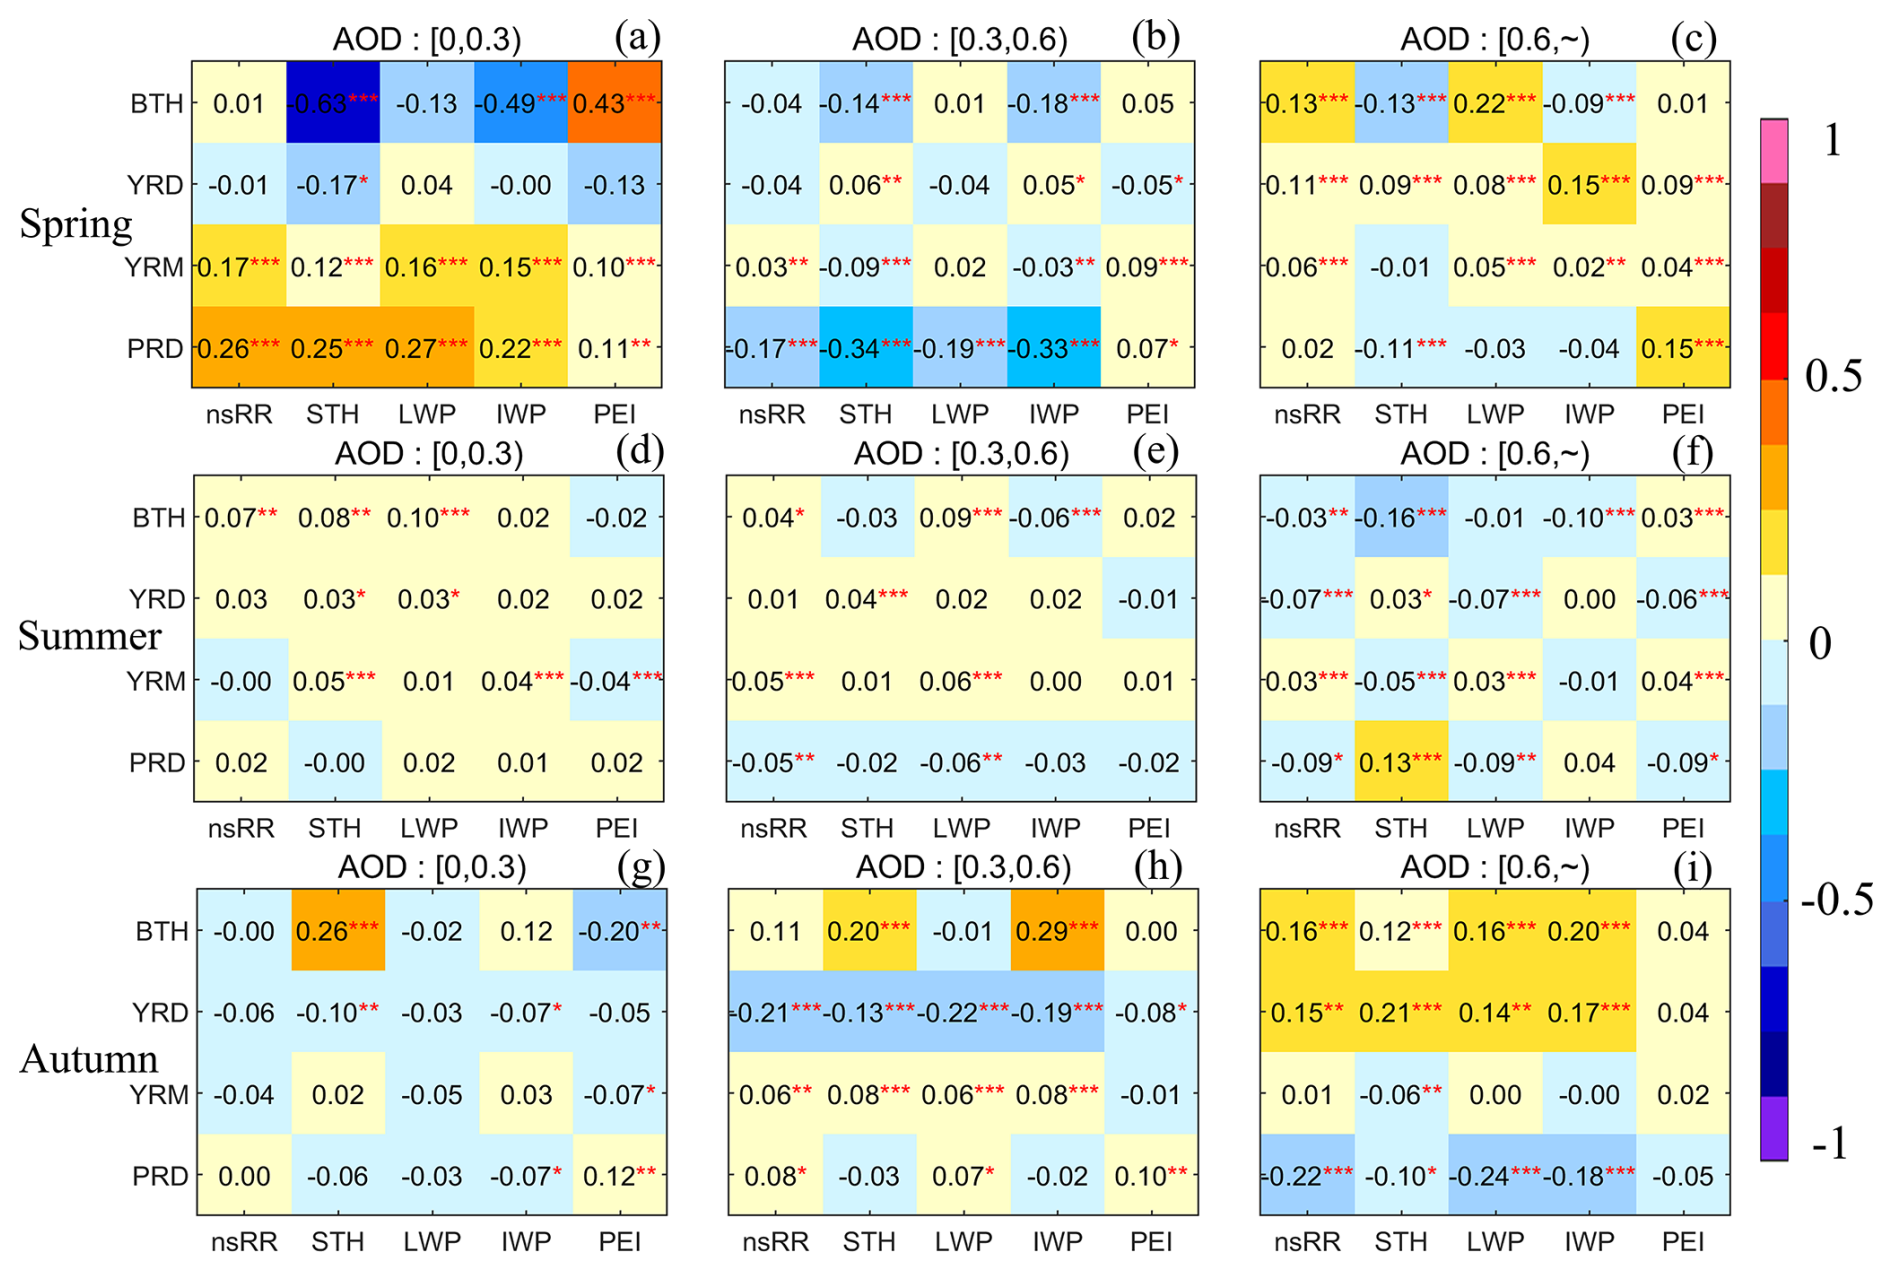
Figure 2Spearman correlation coefficients between AOD and precipitation parameters for convective precipitation across regions and seasons under the three AOD regimes. Color gradients (from yellow to blue) encode the correlation strength and direction, and asterisks denote statistical significance (∗: p<0.05, : p<0.01, : p<0.001).
Beyond regional differences, the fractional seasonal changes (DIFFseason, in %) for precipitation parameters were calculated as:
where DIFFregion represents the normalized differences for the YRD, YRM, and PRD relative to BTH, respectively; DIFFseason denotes the normalized seasonal differences when comparing summer and autumn to spring. XBTH and Xspring represent the reference value of the target precipitation parameter in the BTH and spring, respectively. Xregion denotes the precipitation parameter values for the YRD, YRM, and PRD regions, respectively, and Xseason represents the precipitation parameter values in the seasons being compared to spring.
3.1 Correlation changes of precipitation parameters with aerosols
To investigate aerosol impacts on convective and stratiform precipitation characteristics across the four urban agglomerations, five precipitation parameters were selected: nsRR, STH, LWP, IWP, and the precipitation efficiency index (PEI). The PEI is quantifies the efficiency of cloud water to precipitation conversion, with higher values denoting a greater proportion of cloud water being transformed into rainfall. Following Hu et al. (2022) and scaled by 1000 for enhanced readability, PEI is defined as:
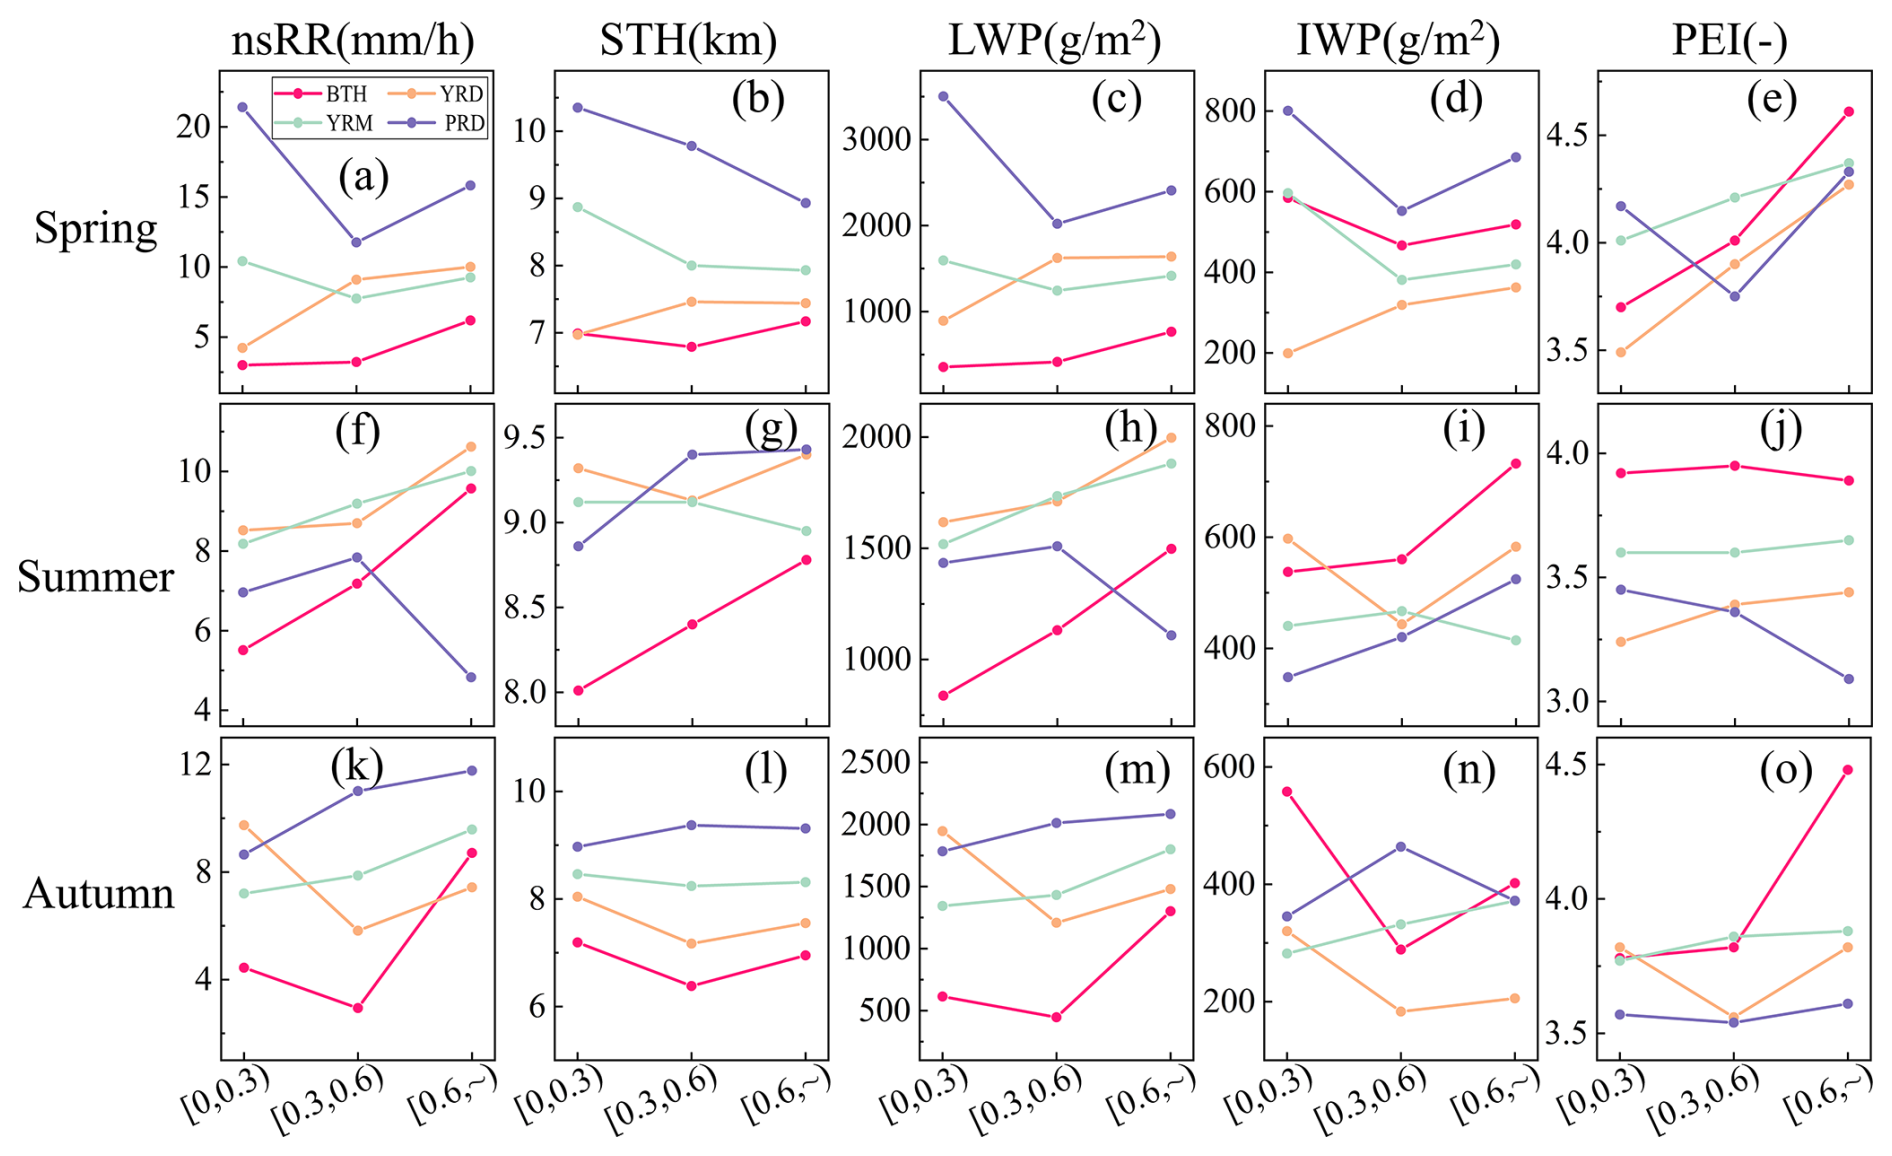
Figure 3Average point line plots of nsRR, STH, LWP, IWP, and PEI under three AOD conditions for convective precipitation across the four regions and three seasons. Each subplot employs color-coding (BTH – red, YRD – yellow, YRM – green, and PRD – purple) with the x-axis denoting AOD bins ([0,0.3), [0.3,0.6), [)) and the y-axis representing parameter magnitudes. “–” indicates dimensionless (after scaling by 1000).
In the resulting heat map of convective precipitation (Fig. 2), individual cells exhibit Spearman correlation coefficients that quantify the relationship between AOD and key meteorological parameters. For spring convective precipitation (Fig. 2a–c), the BTH exhibits significant negative correlations with the STH and IWP under low aerosol loading, whereas showing a significant positive correlation with PEI. The YRD displays patterns similar to those of the BTH: negative correlations at low aerosol loading shift to positive correlations with precipitation parameters as aerosol loading increases. In contrast, both the YRM and PRD show consistently positive correlations under low aerosol loading (Fig. 2a). However, the PRD demonstrates pronounced negative correlations at moderate loading, whereas the YRM maintains positive correlations at high aerosol loading. Summer (Fig. 2d–g): Under low (high) AOD conditions, consistent positive (negative) correlations prevail across all study regions (Fig. 2d). At moderate aerosol loading levels, the PRD shifts to a negative correlation, whereas the other three regions retain a positive correlation (Fig. 2e). Autumn (Fig. 2g–i): the YRD exhibits pronounced negative correlations under low-to-moderate AOD thresholds. Conversely, the BTH and YRD (PRD) demonstrate positive (negative) correlations under high AOD levels. Overall, the precipitation under varying aerosol loading exhibits pronounced seasonal and regional disparities, demonstrating nonlinear characteristics in their relationships.
Spearman correlation coefficients are computed to characterize the precipitation parameters in stratiform precipitation (Fig. S9), similar to that of convective precipitation (Fig. 2). Overall, the PRD exhibits the strongest similarity between the stratiform and convective precipitation parameters in the correlation with AOD. In contrast, the BTH, YRD, and YRM resemble convective precipitation characteristics under moderate to high aerosol loading, but show reduced similarity under low aerosol loading, particularly in the BTH.
Given the dominant roles of DUA in BTH and SSA in PRD (Figs. S2–S8), this study further investigated how these key aerosol types distinctly modulate precipitation. Correlation analyses reveal that DUA is significantly positively correlated with both IWP and STH in the convective precipitation (Fig. S10), indicating an invigoration of ice-phase processes. This suggests that DUA, acting as efficient IN, promote the glaciation and vertical development of convective clouds, consistent with the invigoration effect (Rosenfeld et al., 2008). In contrast, the impact of DUA on stratiform precipitation is substantially weaker and more variable. This promotional mechanism, facilitated by ice-nucleating ability of DUA, stands in contrast to precipitation-suppressing semi-direct effect, highlighting the complex and multi-faceted nature of DUA impacts on different precipitation types.
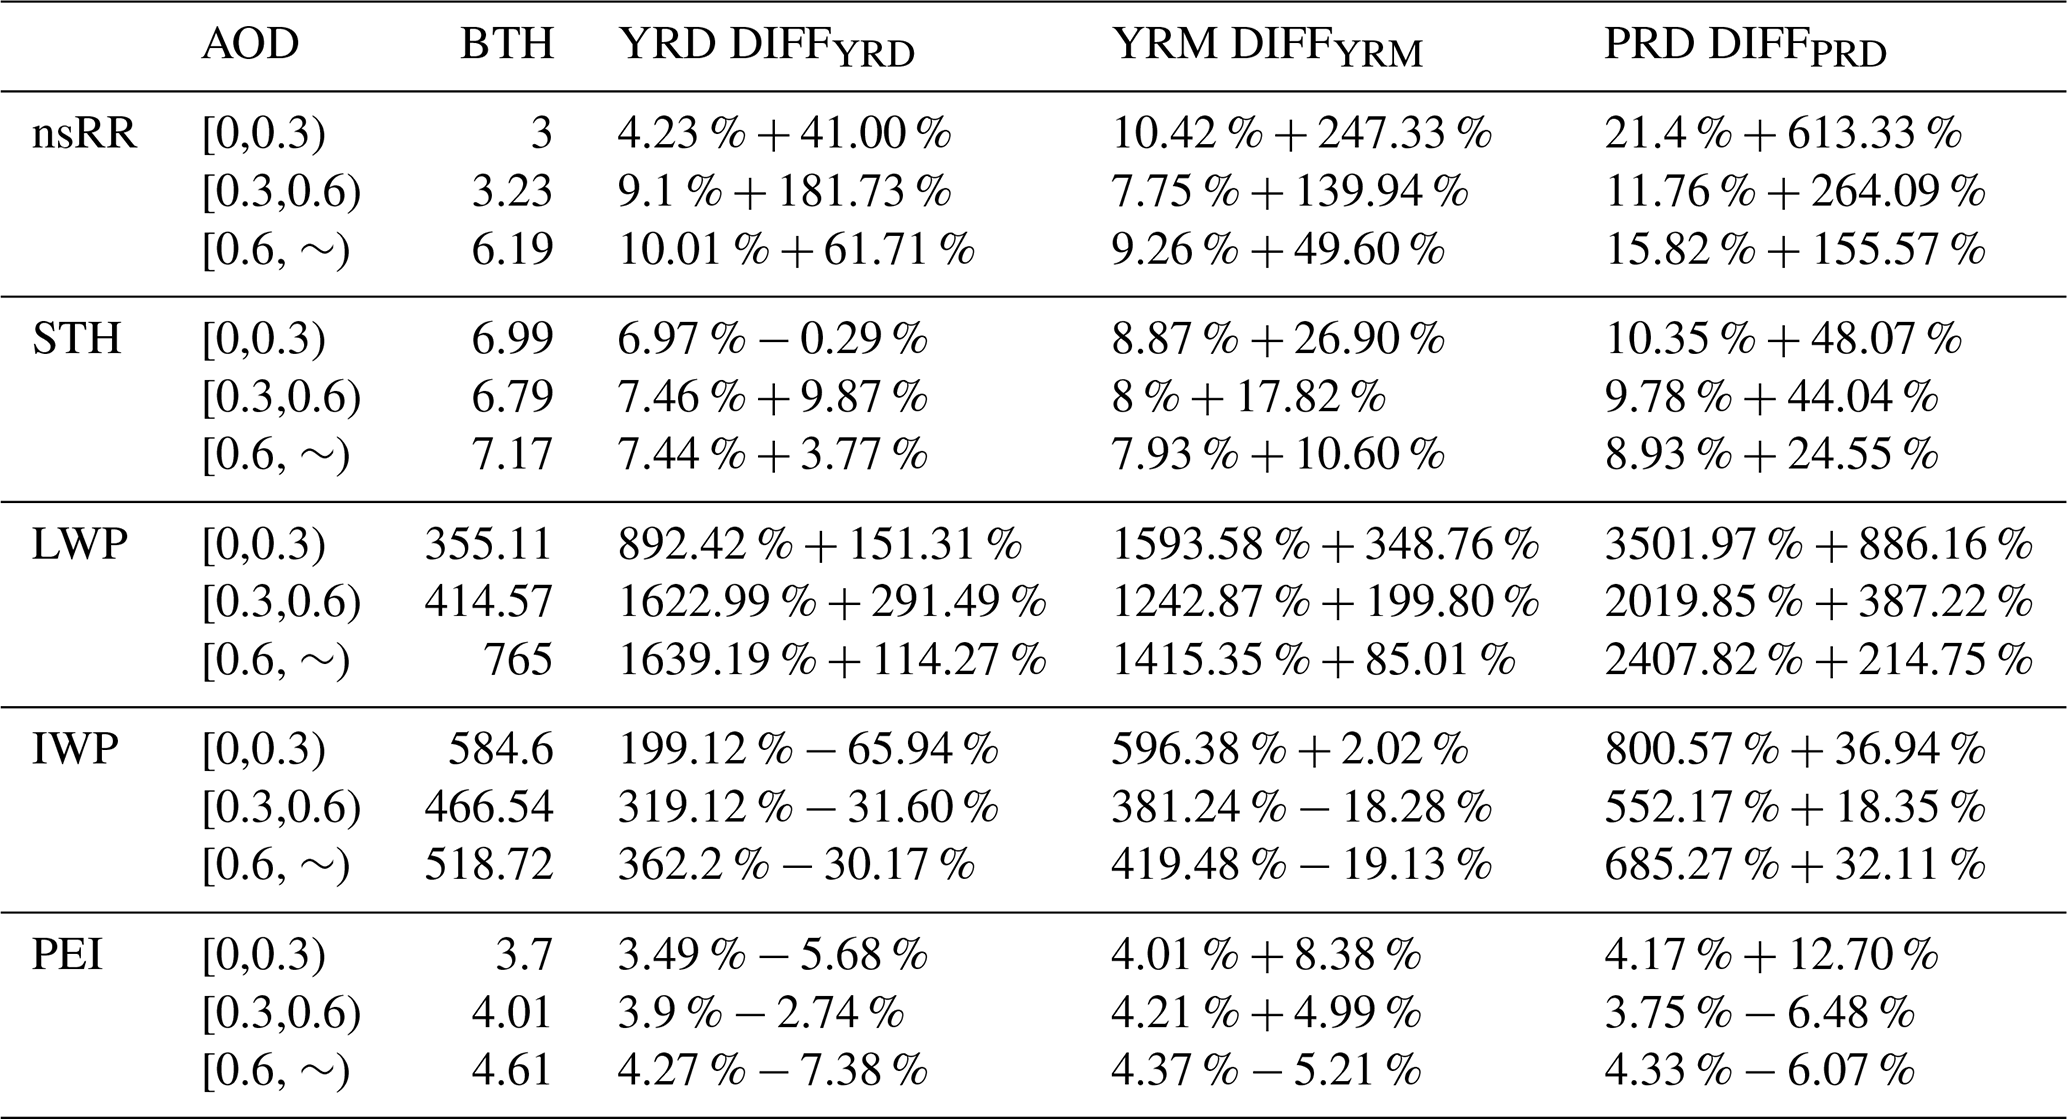
Table 1Normalized regional differences in convective precipitation during the spring season. Units: nsRR (mm h−1), STH (km), LWP (g m−2), IWP (g m−2).
3.2 Changes in the characteristics of precipitation parameters associated with aerosols
Figure 3 illustrates the seasonal mean values of the convective precipitation parameters for nsRR, STH, LWP, IWP, and PEI across AOD intervals. During spring (Fig. 3a–e), the BTH and YRD regions exhibit similar responses, with nsRR, STH, LWP, and PEI demonstrating persistent enhancement as the aerosol burden increases. In contrast, the YRM and PRD manifest nonlinear features: nsRR, LWP, and IWP experience initial suppression before rebounding at elevated AOD levels. Summer observations (Fig. 3f–j) reveal predominantly linear positive relationships between aerosol loading and precipitation parameters in the BTH, YRD, and YRM regions. However, the PRD diverges sharply, displaying inverted V-shaped responses in the nsRR, STH, LWP, and PEI. Autumn analysis (Fig. 3k–o) reveals consistent increases in the YRM and PRD with aerosol enhancement, whereas the BTH and YRD exhibit a pattern of initial decline followed by a subsequent increase.
The regional comparisons indicate that the differences of the precipitation parameters are mitigated under moderate to high aerosol loading conditions (Table 1). For instance, at low aerosol loading, the fractional changes in spring nsRR reach DIFFPRD = 613 % and DIFFYRM = 247.33 %, whereas high aerosol loading reduces these to DIFFPRD = 155 % and DIFFYRM = 49.6 % (Table 1). These results highlight that increasing aerosol loading can moderately alleviate regional disparities in precipitation characteristics. Furthermore, the BTH exhibits notably higher IWP and PEI values, indicating enhanced ice-phase processes and superior precipitation conversion efficiency, as evidenced by the negative DIFFYRD, DIFFYRM, and DIFFPRD values.
To further characterize the stratiform precipitation parameters (nsRR, STH, LWP, IWP, and PEI), the seasonal mean values across aerosol loading levels are presented in Fig. S11 through point-line plots that were formatted consistently with those in Fig. 3.
For spring (Fig. S11a–e), the BTH, YRD, and YRM exhibit continuously increasing trends in nsRR, LWP, and IWP with increasing aerosol loading. Conversely, the PRD shows overall decreasing trends across most precipitation parameters. In summer (Fig. S11f–j), the BTH, YRD, and YRM demonstrate linear increases in nsRR and LWP means as aerosol loading rises. However, the PRD exhibits nonlinear trends: initial increases followed by decreases in nsRR, STH, LWP, and IWP means, a pattern consistent with its convective precipitation behavior. In autumn (Fig. S11k–o): monotonically rising trends in nsRR, LWP, and IWP are shown by the YRD and YRM, whereas the BTH and PRD display decreasing and then increasing trends in nsRR, IWP, and PEI, indicating an increase in aerosol loading. Additionally, the fractional changes in stratiform precipitation indicate that an increase in aerosol loading moderately reduces regional disparities during regional normalized difference comparisons, particularly in the spring and summer (Tables S4–S6). For instance, in the PRD region during spring (Table S4), the DIFFPRD values for IWP are 208.16 %, 141.06 %, and 34.13 %, corresponding to AOD ranges of [0,0.3), [0.3,0.6), and [), respectively. The seasonal normalized differences indicate significant ice-phase processes but weak liquid-phase processes across various regions during spring.To summarize, aerosols influence the average values of precipitation parameters, displaying characteristics that differ across spatiotemporal scales and precipitation types. Furthermore, precipitation parameters exhibit greater regional than seasonal variation. In particular, within the 270 DIFFregion samples, 41 (constituting 15.2 %) exhibited values exceeding 100 %, whereas among the 240 DIFFseason samples, only 10 (representing 4.2 %) demonstrated such a phenomenon (Tables S2–S8). Additionally, convective precipitation shows larger magnitude changes across seasons and regions than stratiform precipitation.
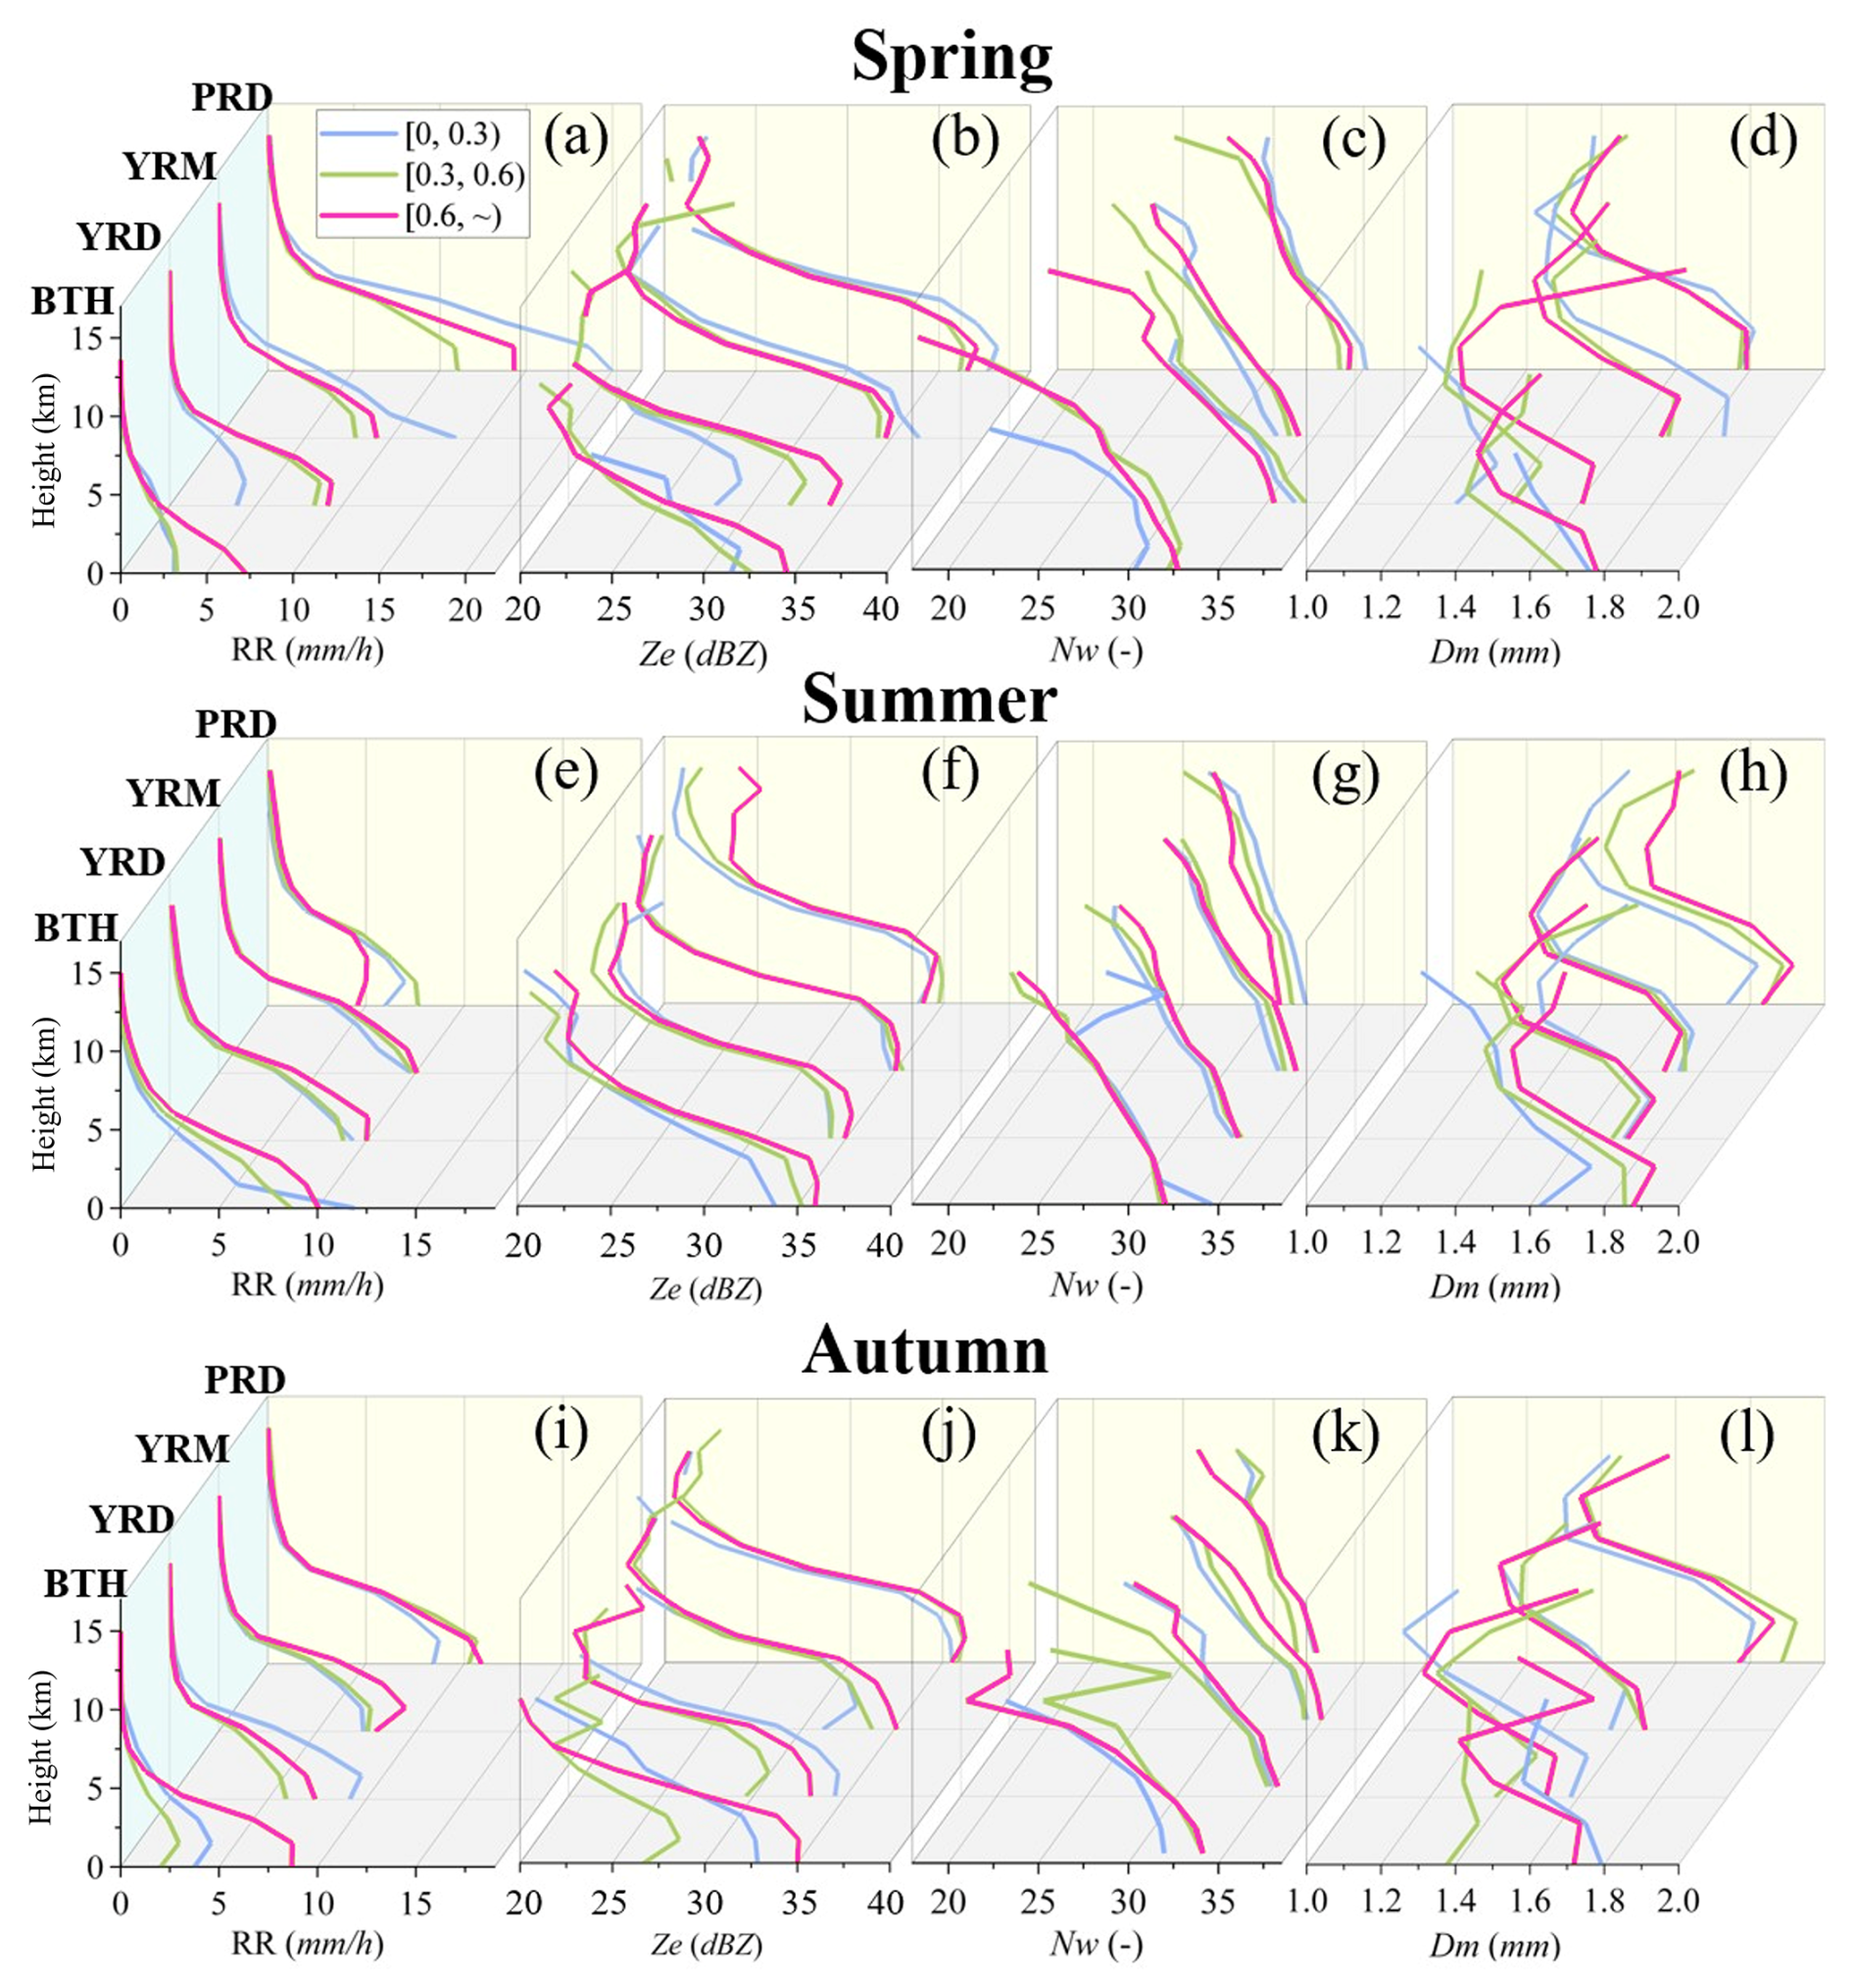
Figure 4Vertical profiles of the average convective precipitation parameters Ze, Dm, Nw and RR for different regions in different seasons under three AOD conditions ([0,0.3) – blue lines; [0.3,0.6) – green lines; [) – magenta lines ). Within each subplot, line profiles are categorized into four regions: BTH, YRD, YRM, and PRD.
3.3 Changes in the vertical profiles of precipitation associated with aerosols
To further investigate the vertical structure of precipitation, Fig. 4 presents the vertical distributions of the mean Ze, Dm, Nw, and RR for convective precipitation under varying AOD loadings and seasons. Overall, the mean Ze, Nw, and RR values generally increase with decreasing height, whereas Dm exhibits an initial decrease followed by an increase. In addition, the PRD displays a markedly higher RR than the BTH, YRD, and YRM in spring, but lower RR in summer. This seasonal contrast may be attributed to the abundant moisture supply during the pre-rainy season in South China (Chen and Luo, 2018), versus significant precipitation suppression in summer caused by hygroscopic aerosol-induced moisture competition (Guo et al., 2017). Furthermore, Chen et al. (2025) observed that a moderate CAPE in the PRD summer may lead to diminished precipitation.
Despite a complex influence that varies with season and precipitation type, DUA in the BTH region exhibit a consistent negative correlation with Nw (Fig. S12b–e). This negative correlation could be attributed to the semi-direct effect of DUA, whereby the absorption of solar radiation heats the atmosphere, thus promoting cloud droplet evaporation and suppressing droplet concentrations. The negative relationship with RR and Dm is particularly evident in stratiform precipitation under low-to-medium aerosol loadings (Fig. S12d). For convective precipitation, the influence of DUA is seasonally modulated, showing a negative correlation in summer but a positive correlation in spring and autumn. Meanwhile, in the PRD region (Fig. S12g–l), SSA during spring and summer are consistently positively correlated with precipitation parameters. These statistically significant relationships further corroborate the proposed type-specific mechanisms.
As shown in Fig. 4a and b, in spring, the RR and Ze for the lower layers (<5 km) increase linearly with aerosol loading in the BTH and YRD but display non-monotonic trends (initial suppression followed by enhancement) in the YRM and PRD, consistent with Fig. 3a–e. In the BTH region, which is characterized by a high concentration of DUA (Figs. S2–S8). Sun and Zhao (2021) attributed similar phenomena to the radiative effect of aerosols enhancing atmospheric instability and triggering earlier precipitation. However, absorptive DUA can also suppress precipitation through the semi-direct effect, whereby radiative heating promotes cloud droplet evaporation. Furthermore, DUA can serve as efficient IN, promoting the glaciation and vertical development of convective clouds. These findings highlight the dual role of DUA, with the net precipitation effect being determined by the balance between invigoration and suppression. The YRD exhibits a more abundant water vapor supply (Fig. S1a): Increased aerosol loadings supply additional CCN and IN, providing more condensation nuclei for cloud droplet formation and thereby enhancing precipitation. With increasing aerosol loadings, the aerosol population in the YRM region shifts from low-concentration large cloud particles to high-concentration small cloud particles dominance (Fig. 4c–d). The resulting reduction in re suppresses initial precipitation, thereby prolonging cloud lifetime, which in turn fosters further cloud development and ultimately enhances precipitation. The PRD precipitation patterns resemble those of the YRM, although hygroscopic SSA exert a stronger influence (Fig. S2a). At low AOD (with an SSA proportion of 26.32 %), moisture from South China's pre-rainy season and hygroscopic giant CCN derived from sea salt promote spring precipitation growth (Guo et al., 2022). As AOD increases, the SSA contribution declines rapidly, weakening its precipitation-promoting effect. However, with further AOD growth, the proportion of fine (notably hygroscopic OCA) aerosols rises (Fig. S2a), supplying more effective CCN to enhance the precipitation. Additionally, under low aerosol loadings, the lower atmosphere in the YRD (YRM) is dominated by high concentrations of smaller (larger) raindrop particles (Fig. 4c and d).
During summer (Fig. 4e–h), average vertical profiles (below 5 km) of RR and Ze in the BTH, YRD, and YRM generally exhibit increasing linear trends with rising aerosol loading. Conversely, the PRD shows an initial increase followed by a decrease, which is consistent with the findings in Fig. 3f–j. Within the BTH, YRD, and YRM, low proportions of hygroscopic giant CCN (SSA) mean increasing aerosols boost Nw and Dm, supplying more CCN and IN for cloud droplet formation. Coupled with ample summer moisture supply and dynamic forcing, cloud droplets are transported to higher altitudes (Fig. 3g), enhancing precipitation. During summer in the PRD, ample moisture is derived from the Indian Ocean. With low aerosol loading, the proportion of sea salt particles is elevated (23.83 %). An increase in giant sea salt CCN loading triggers an anti-Twomey effect, characterized by a rise in Dm and a decline in Nw, leading to intensified precipitation. Nevertheless, as aerosol loading escalates further, fine-mode particles predominate (93.9 %; Fig. S2b), resulting in moisture competition becoming the principal mechanism inhibiting precipitation.
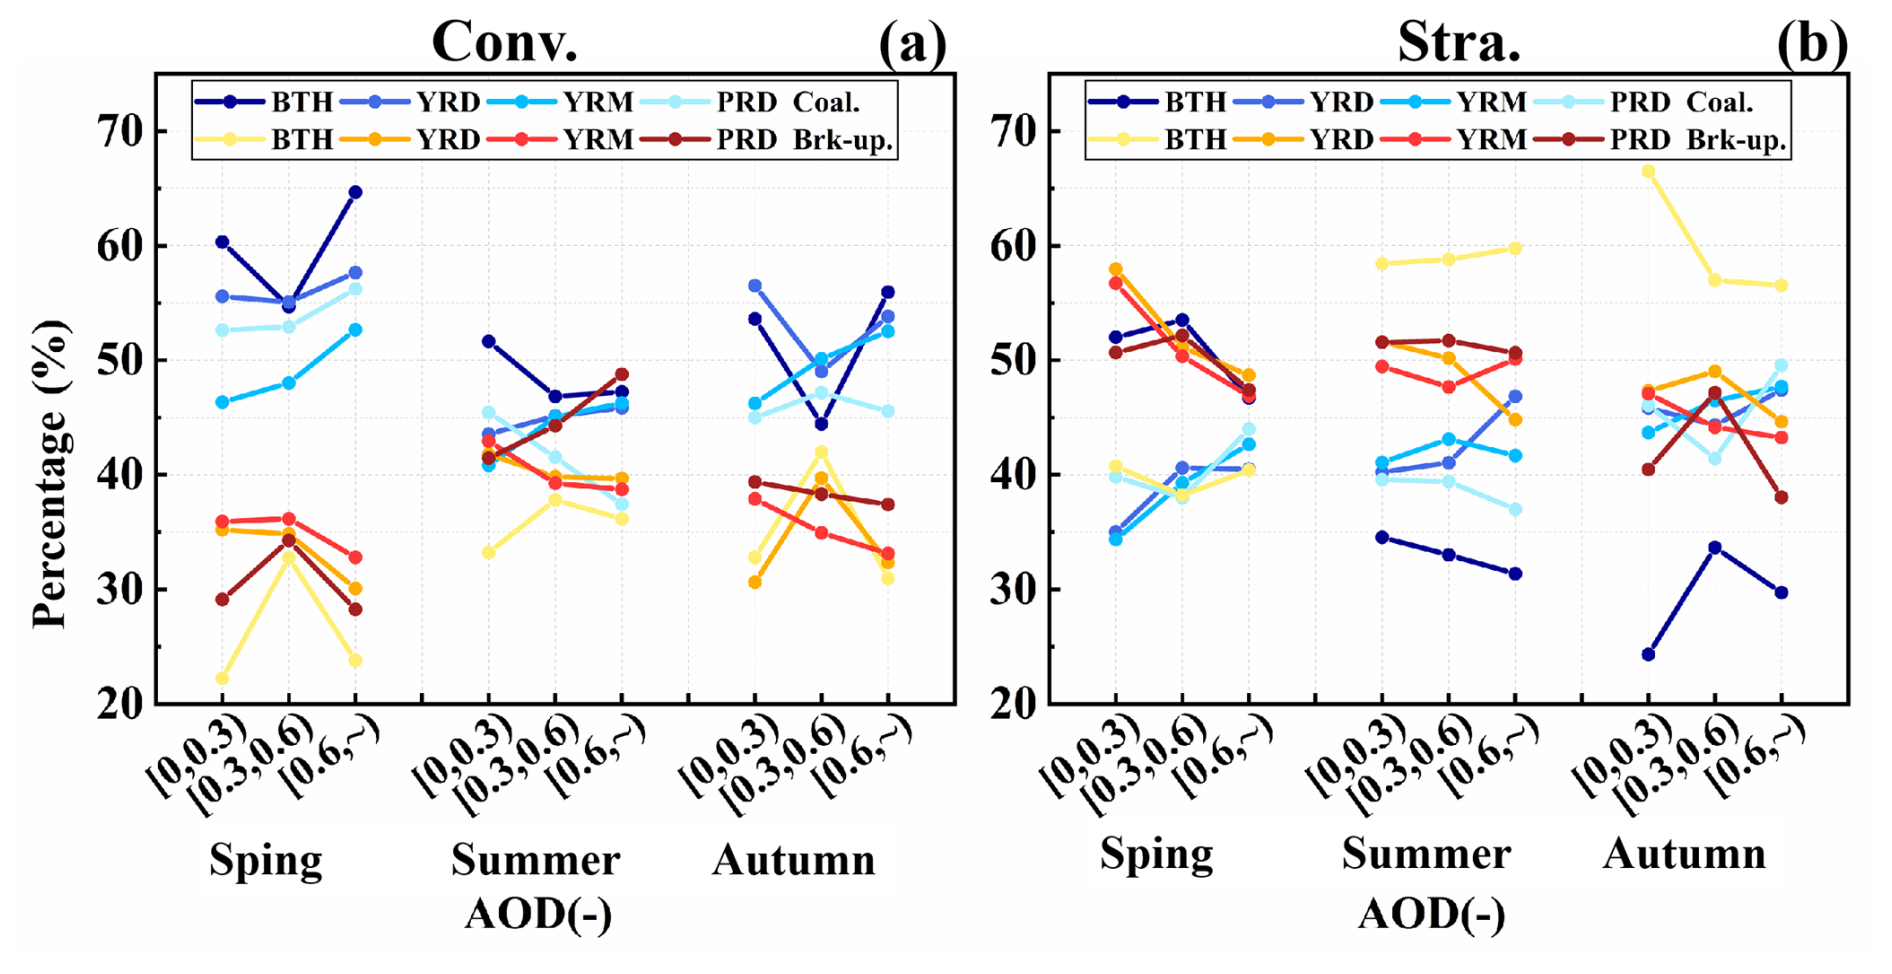
Figure 5Average point line plots of coalescence and break-up processes in precipitation across different regions and seasons (Spr. – Spring, Sum. – Summer, and Aut. – Autumn) under three AOD conditions. Here, (a) represents convective precipitation, and (b) represents stratiform precipitation. And “–” indicates dimensionless.
Consistent with Fig. 3k–o, during autumn the convective precipitation in the BTH and YRD initially decreases and then increases with rising aerosol loading (Fig. 4i–l). The magnitude of this increase is greater in the BTH than in the YRD. Conversely, RR exhibits monotonically increasing trends in the YRM and PRD. The underlying mechanisms are as follows. The BTH and YRD: Initial aerosol increase elevates Nw while reducing Dm (Fig. 4k–l), suppressing precipitation via the Twomey effect. In contrast, the prolonged cloud lifetime promotes further cloud development (Fig. 3l and m; Albrecht, 1989; Rosenfeld et al., 2008; Zhao et al., 2024). Consequently, when aerosol loading continues rising, abundant CCN and IN become available for cloud–precipitation processes, ultimately enhancing precipitation. The YRM and PRD: The monotonic trends stem from greater autumn moisture availability versus the BTH and YRD (Fig. S1c), which supports cloud droplet condensational growth (Fig. 4k and l) and enhances collision–coalescence (Fig. 5a), collectively facilitating precipitation.
To enhance the characterization of the vertical profile and microphysical processes of stratiform precipitation, Fig. S13 displays the mean vertical profiles of Ze, Dm, Nw, and RR, similar to those in Fig. 4. A notable Ze peak at an altitude of 5 km corresponds to the 0 °C bright band signature, which is a distinctive indicator of the hydrometeor phase transition and stratiform precipitation. Figure S13a illustrates that the PRD exhibits declining trends in RR and Ze, diverging from the characteristics of convective precipitation depicted in Fig. 4a and b. In the PRD, increasing aerosol loading induces a Twomey effect: Nw increases, accompanied by a decrease in Dm (Fig. S13c–d). This dominance of particle competition mechanisms at higher AOD loadings aligns with increasing OCA contributions (Fig. S2c–d), as light-absorbing OCAs suppress precipitation via semi-direct effects of shortwave radiation absorption.
During summer (Fig. S13e–h), the BTH region displayed distinct patterns compared to the other three regions: RR decreases with increasing aerosol loading, whereas Ze and Dm increase simultaneously. This suggests that higher aerosol loads increase cloud albedo (Garrett and Zhao, 2006; Twomey, 1974), thereby intensifying the smaller cloud particles evaporation and break-up (Fig. 5b), resulting in a decline in PEI (Fig. S11j). Concurrently, the increased abundance of hygroscopic SO4A further depletes the atmospheric moisture. These combined effects lead to a notable reduction in precipitation within the BTH region. The summer stratiform precipitation responses of the PRD to aerosol loading resemble those of convective precipitation, whereas the YRD and YRM show negligible alterations in the vertical profiles, suggesting a low sensitivity of stratiform precipitation to aerosol loading.
To validate the aforementioned microphysical processes, this study assesses near-surface precipitation mechanisms below the melting layer. The melting layer refers to the region where the ice phase of the hydrometeors transitions to the liquid phase during precipitation (Hu et al., 2024), and the analysis employs the categorization approach established by Kumjian and Prat (2014). This approach employs radar reflectivity () and raindrop size () differences between 1 and 3 km above ground level. These metrics classify processes into four categories: size sorting evaporation, coalescence, break-up, and break-up coalescence balance. The extensive application of this methodology in precipitating cloud systems demonstrates that coalescence and breakup processes are key mechanisms in cloud microphysics (Chen et al., 2025; Hu et al., 2022; Wen et al., 2023; Zhou et al., 2022). Consequently, this analysis focuses exclusively on coalescence and break-up mechanisms. Figure 5 displays the coalescence and break-up processes for convective and stratiform precipitation across regions and seasons.
In convective precipitation (Fig. 5a), coalescence consistently dominates over break-up across all regions, particularly during spring and autumn. With rising AOD concentrations, the YRD, YRM, and PRD exhibit enhanced coalescence in spring, whereas the PRD shows a decreasing-then-increasing trend in coalescence. In summer, the proportions of coalescence and break-up remain comparable, whereas autumn exhibits nonlinear responses in the BTH and YRD.
In stratiform precipitation (Fig. 5b), break-up generally exceeds coalescence, with distinct seasonal patterns: in spring, the BTH exhibits increasing-then-decreasing coalescence, whereas the PRD shows the opposite trend (aligning with divergent RR patterns in Fig. S13a). During summer and autumn, BTH consistently shows notably lower break-up than coalescence, which is one of the reasons why precipitation continues to decline with increasing AOD loading in summer. The specific microphysical influence process is explained in detail in Sect. 3.
5.1 Sensitivity of precipitation macroscopic parameters
Since precipitation processes are equally influenced by thermodynamic and dynamic environments, this study employs RH at 850 hPa as a thermal influence factor and CAPE as a dynamic influence factor to examine aerosol sensitivity to these meteorological elements. Following the classification criteria established in Sect. 2.5, RH and CAPE values were categorized into low, medium, and high levels.
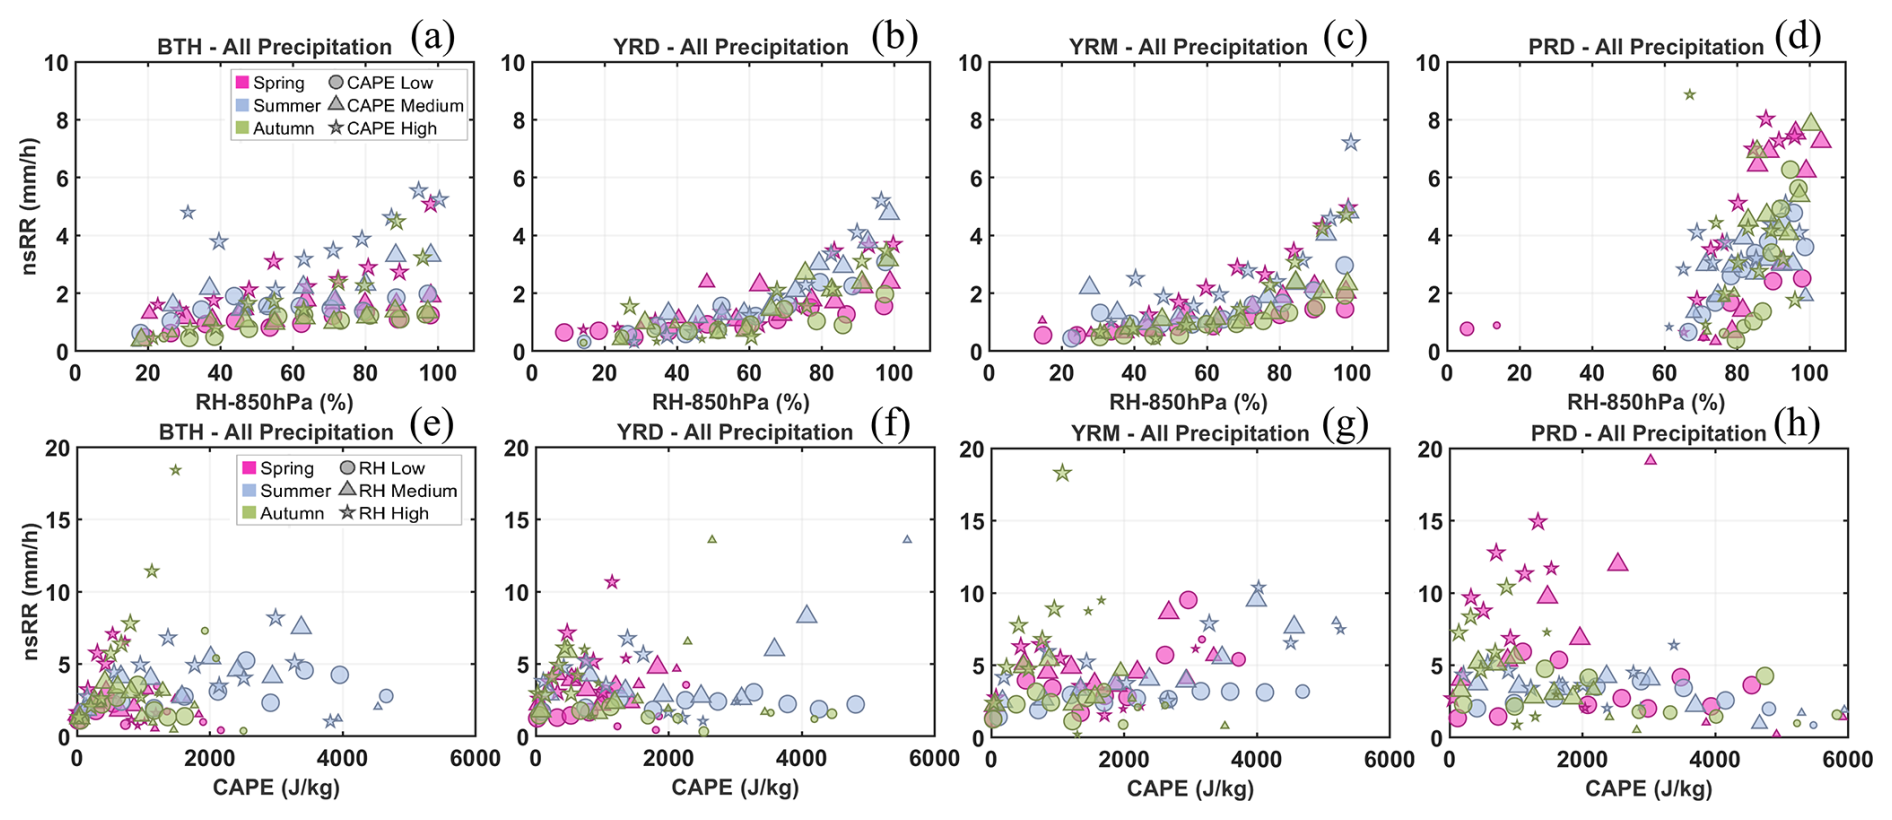
Figure 6nsRR as a function of RH at 850 hPa (CAPE), stratified by season (color) and CAPE (RH) level (symbol), for all precipitation types (convective and stratiform) in the four regions. The symbol size is proportional to the sample size ([0,20), [20,45), [45,90), [)).
First of all, as shown in Fig. 6a–d, an increase in RH generally enhances the near-surface rain rate (nsRR), and the combination of high RH × high CAPE (indicated by ⋆) tends to produce heavier precipitation. However, as the CAPE values (Fig. 6e–h) continue to rise beyond 4000 J kg−1, the nsRR shows a decreasing trend. Moreover, extremely high CAPE values are most often observed alongside moderate to low RH (indicated by ∘ and △) conditions.
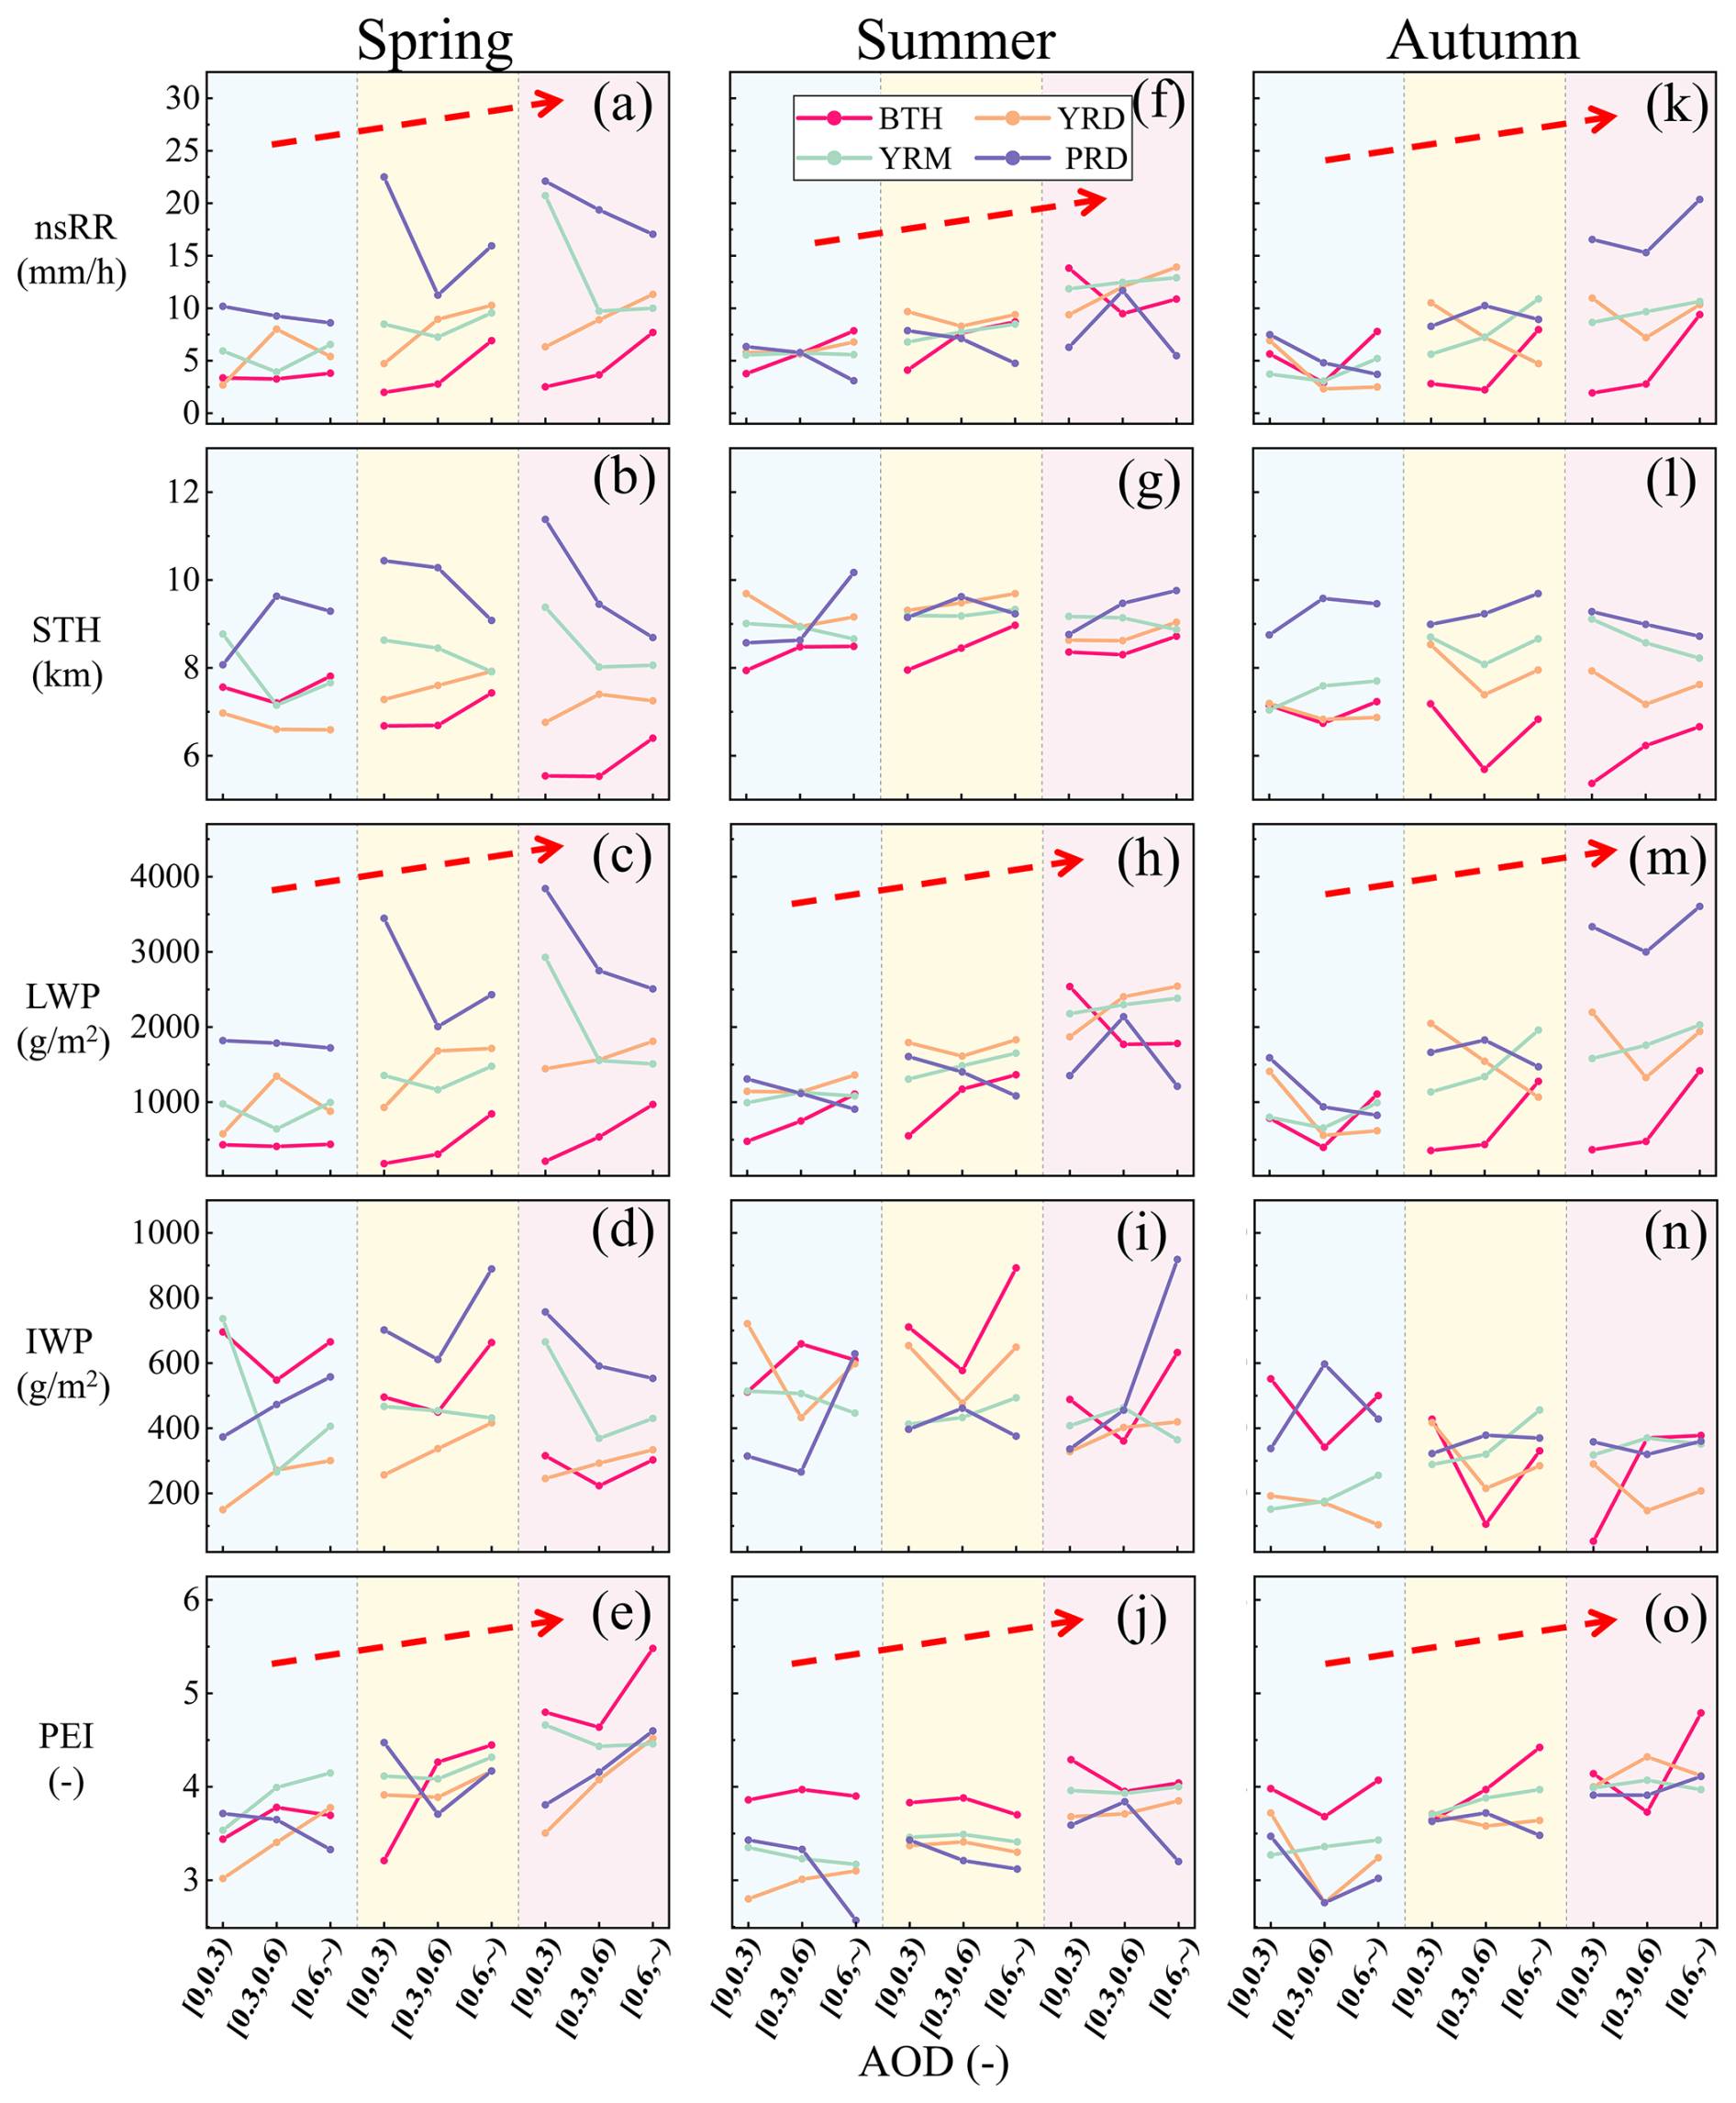
Figure 7Point-line graphs of mean values for convective precipitation parameters (nsRR, STH, LWP, IWP, and PEI) across seasons and regions. The analysis is based on three AOD intervals and various RH conditions. Each subpanel displays RH gradients from left to right: low RH (blue background), medium RH (yellow background), and high RH (red background). The red dashed arrow represents the overall variation trend of precipitation parameters with the increase of RH.
Following the format of Fig. 3, Fig. 7 displayed point-line plots of convective precipitation parameters across regions under different RH and aerosol loading conditions. Notably, higher RH values consistently enhance mean precipitation parameters (nsRR, LWP, PEI) across all regions, whereas STH and IWP show inconsistent seasonal and regional variations. This suggests that elevated RH supplies additional moisture, thereby mitigating moisture competition effects.
In spring (Fig. 7a–e), rising RH values do not interfere with the established trends of the BTH across varying aerosol loadings: nsRR and LWP continue to rise with aerosol loading, yet STH and IWP exhibit persistent decrease-then-increase trajectories. Precipitation parameters in the YRD and YRM remain consistent with the characteristics observed in Fig. 3a–e. By contrast, the PRD displays distinct characteristics under moderate RH conditions. This indicates that aerosols exhibit greater sensitivity to RH in the spring convective precipitation of the PRD, whereas aerosol effects dominate over RH influences in the BTH, YRD, and YRM.
Under high RH during summer (Fig. 7f–j), the BTH response differs from that shown in Fig. 3f–j (characterized by a general increase in macroscopic precipitation parameters with aerosol loading); however, other regions remain consistent with prior trends in Fig. 3f–j. In autumn, observations (Fig. 7k–o) highlight inconsistent aerosol–precipitation relationships across the RH levels in the PRD. By contrast, the BTH, YRD, and YRM maintain nearly identical parameter responses.
The results indicate that RH sensitivity significantly influences aerosol-precipitation effects on convective precipitation in the PRD, whereas aerosol loading is the main factor affecting precipitation parameters in the other three regions.
Figure S14 presents point-line plots illustrating mean precipitation parameters associated with stratiform precipitation. Increased RH consistently enhances these parameters, particularly nsRR, LWP, and PEI, in BTH, YRD, and YRM. However, the PRD exhibits differing parameter responses across seasons under varying relative humidity conditions, similar to convective precipitation, as aerosol loading rises.
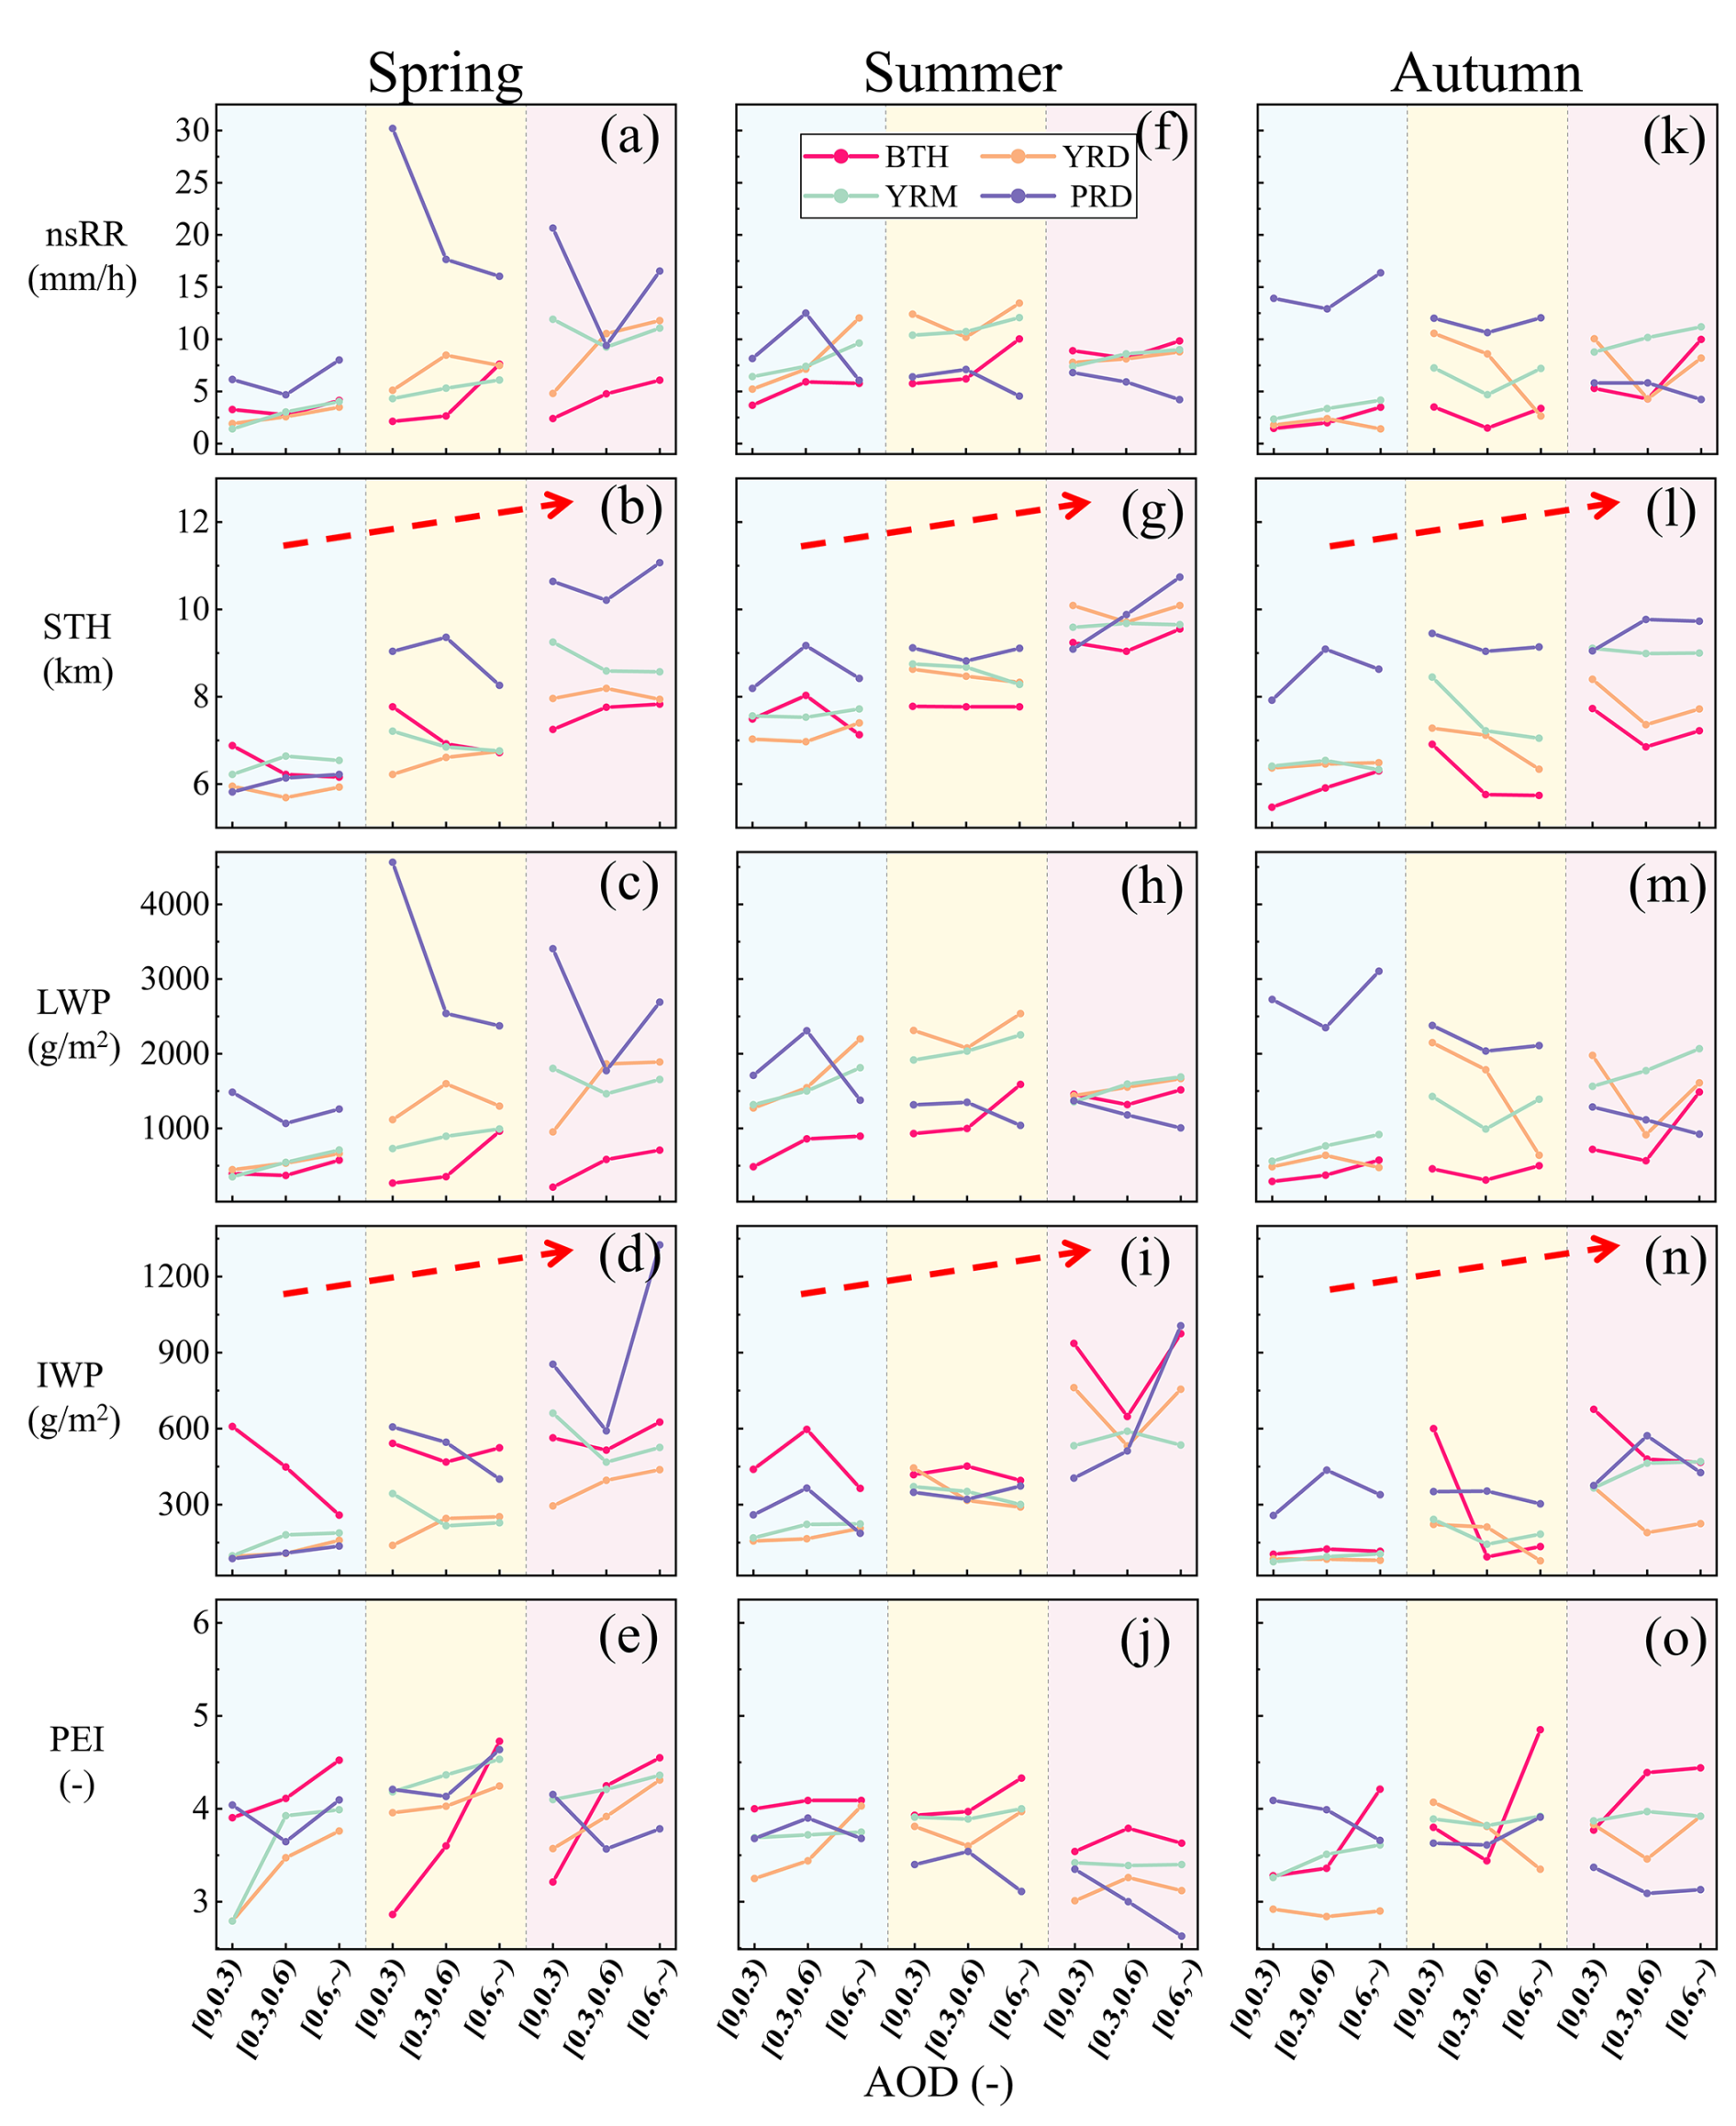
Figure 8Point-line graphs of mean values for convective precipitation parameters across seasons and regions. The analysis is based on three AOD intervals and varying CAPE scenarios. The form of this expression is similar to that shown in Fig. 7.
In addition to the thermodynamic conditions, CAPE was selected as a dynamic factor. Similar to the RH, the precipitation parameter characteristics across regions were investigated under varying CAPE conditions. As indicated by the red dashed arrows in Fig. 8, increasing CAPE values provide favorable dynamic conditions for convective precipitation, leading to rising STH, increased IWP, and enhanced ice-phase processes.
Spring (Fig. 8a–e) shows that in the PRD, the characteristics of nsRR, LWP, and PEI under varying AOD loading remain consistent across different CAPE conditions. In contrast, the BTH, YRD, and YRM exhibit distinct variations in these parameters under different CAPE levels. Summer (Fig. 8f–j) reveals that aerosol effects in the BTH region demonstrate heightened sensitivity to CAPE variations. However, during autumn convective precipitation (Fig. 8k–o), aerosols across the four regions exhibit substantial sensitivity to CAPE, indicating different seasonal response mechanisms to atmospheric instability in these areas.
Figure S8 presents point-line plots of the mean precipitation parameters for stratiform precipitation. Increasing CAPE enhances the STH and IWP parameters, which is consistent with the convective precipitation patterns in Fig. 7.
5.2 Sensitivity of precipitation vertical profiles
Furthermore, to examine aerosol sensitivity to thermodynamic conditions and their effects on the vertical profiles of precipitation components, mean vertical profiles of precipitation parameters (Ze, Dm, Nw, RR) at varying RH levels are illustrated, according to the technique shown in Fig. 4. Notably, as the parameter profile variations in Fig. 5 are concentrated within 0–10 km, the vertical coordinate range is limited to 0–10 km to emphasize the core precipitation processes. Moreover, where the curves intersect, dashed lines are employed to distinguish the selected profiles while maintaining the same representational integrity as the solid lines.
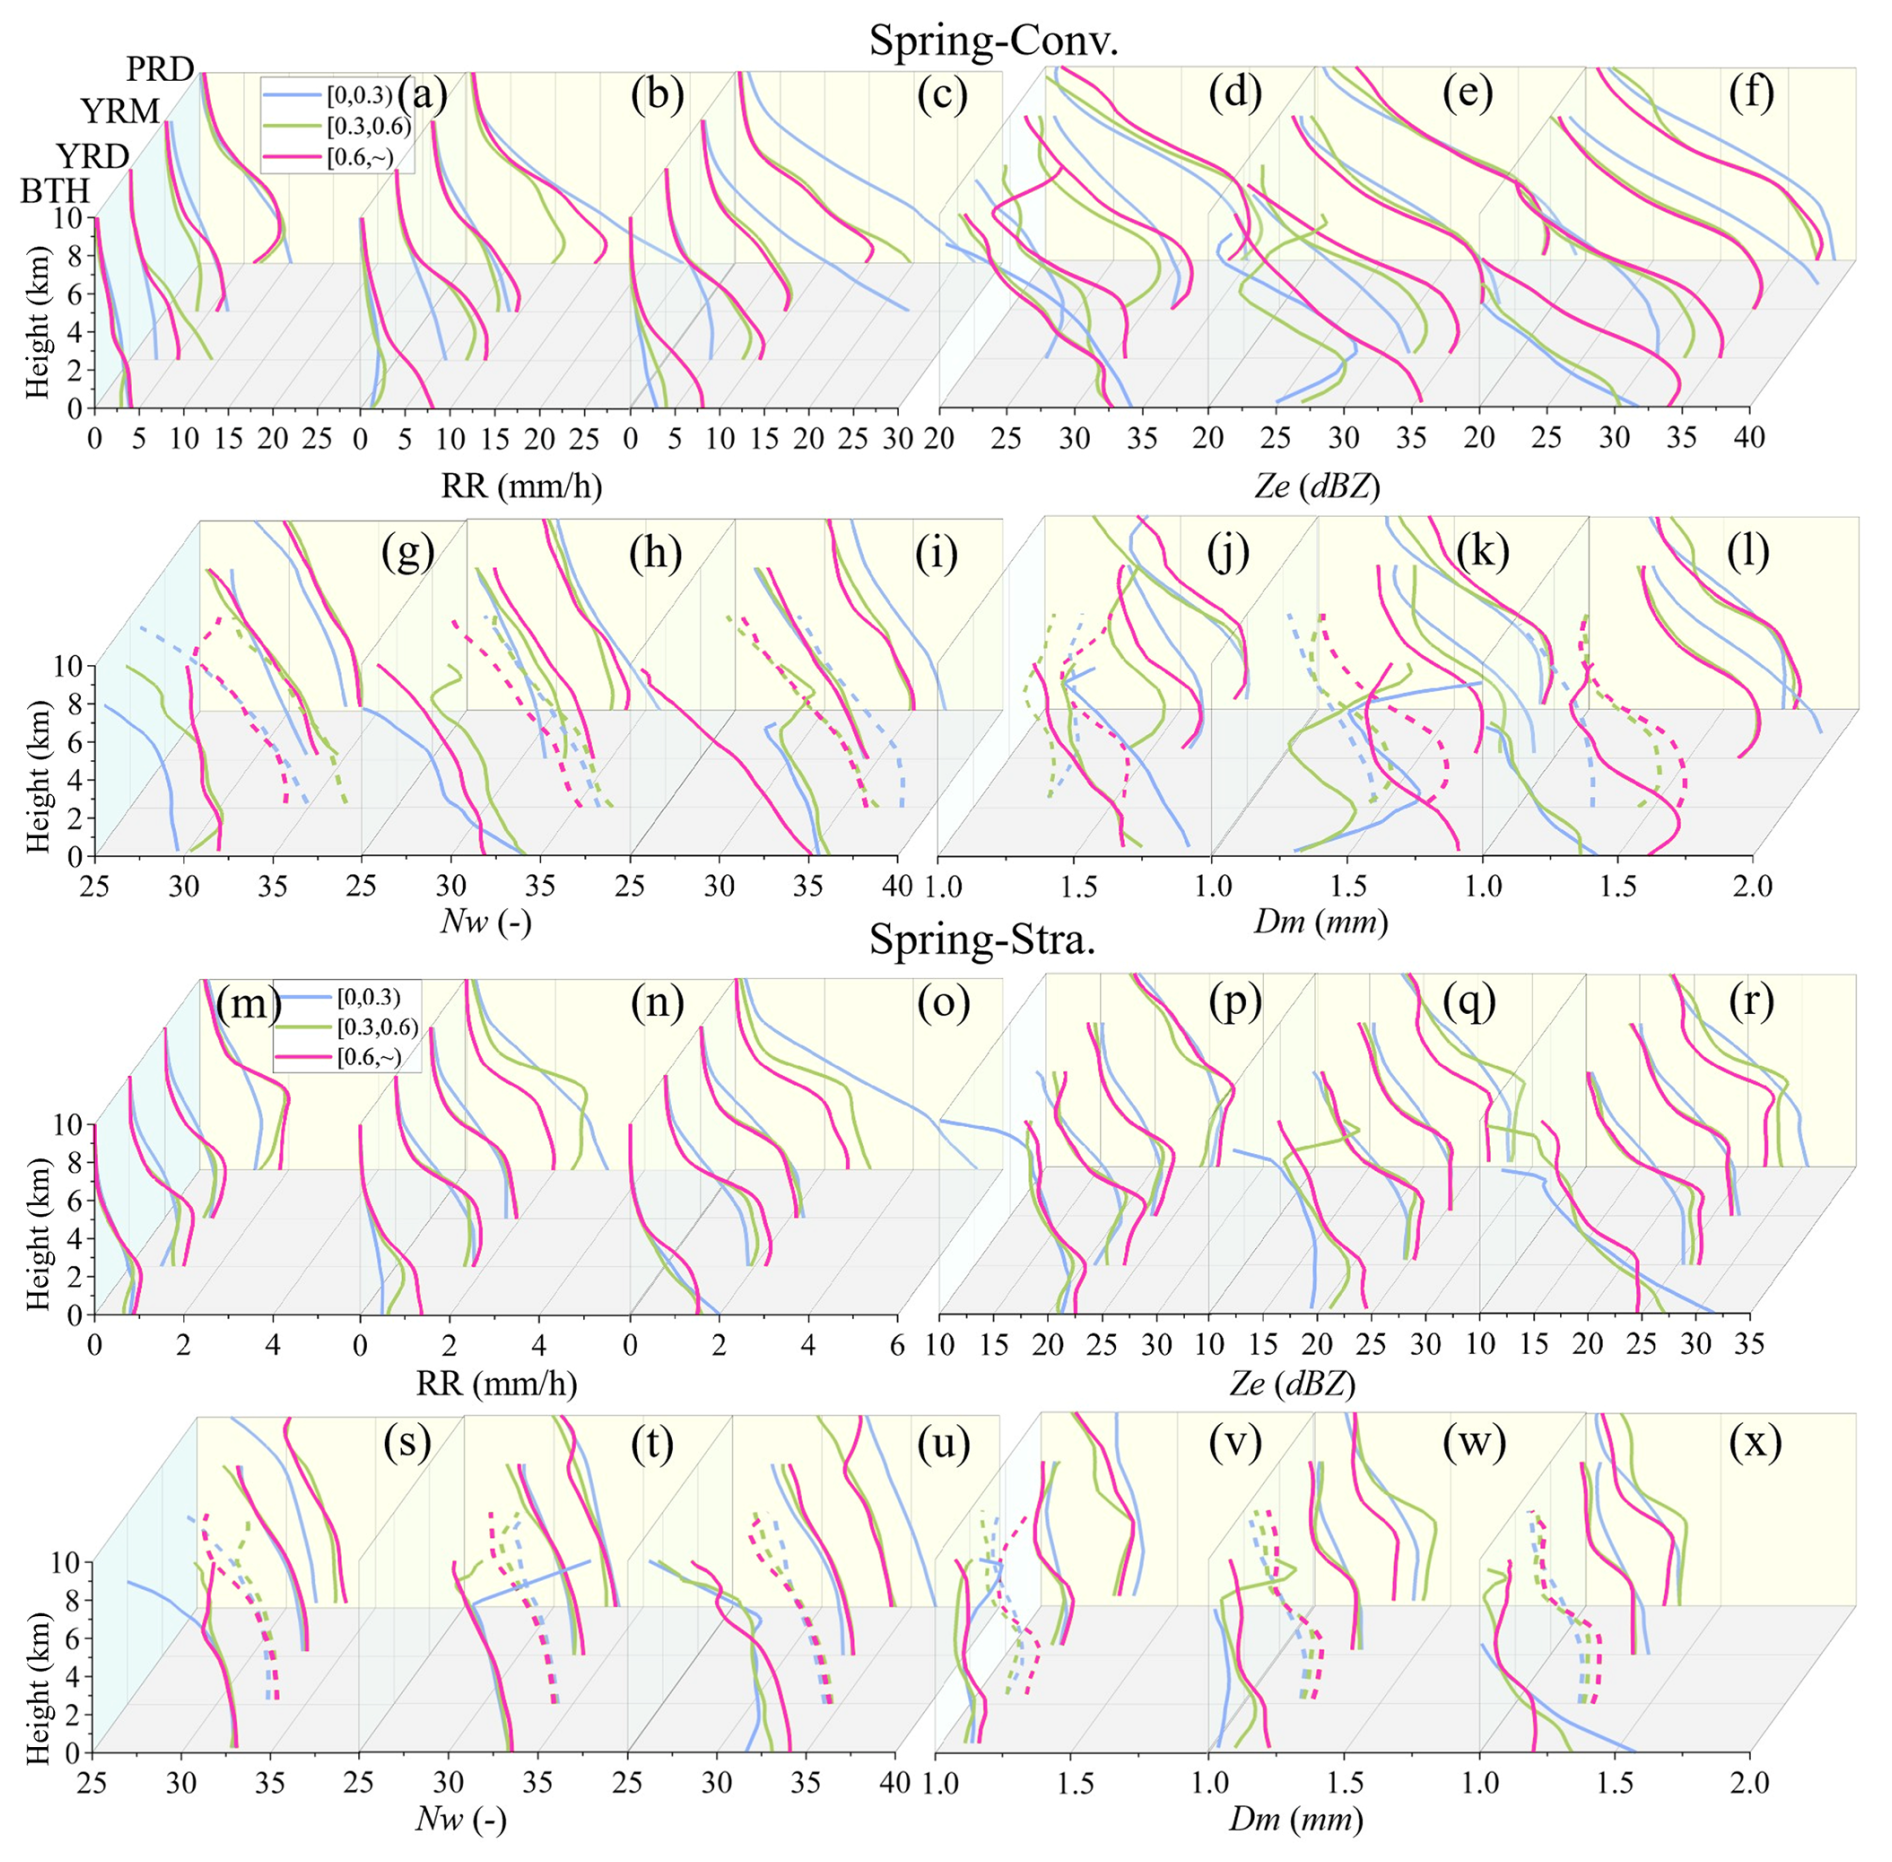
Figure 9Vertical profiles of mean precipitation parameters for convective (a–l) and stratiform (m–x) precipitation in spring across four regions. The profiles are shown under three AOD scenarios and RH conditions (arranged left to right as low, medium, high RH; e.g., panels (a–c) correspond to low, medium, high RH, respectively). To differentiate overlapping curves, selected profiles are plotted as dashed lines while retaining the same representational validity as solid lines.
Spring convective precipitation (Fig. 9a–l) exhibits region-specific responses to RH, and in the BTH and YRD, increasing RH from low to medium ranges significantly elevates precipitation under high aerosol loading but suppresses it under medium loading (Fig. 9a). This discrepancy arises because abundant particles under elevated RH conditions undergo accelerated condensational growth, which increases Dm (Fig. 9f). In contrast, the YRM and PRD show that RH enhancement primarily boosts precipitation, under low aerosol loading (blue curves). This is because in the YRD and YRM, particle competition continues to dominate at high loading, whereas added moisture at low loading facilitates condensational growth and enhances Nw (Fig. 9g).
For the stratiform precipitation (Fig. 9m–x), the BTH, YRD, and YRM show consistent rightward shifts in RR curves across aerosol gradients as RH increases. This suggests that RH enhances moisture availability without modifying microphysical competition mechanisms. The PRD exhibits a response analogous to its convective precipitation feature.
Additionally, similar characteristics are observed in convective and stratiform precipitation during summer (Fig. S16) and autumn (Fig. S17) with variations in RH. In general, increasing RH provides moisture conditions, accelerates cloud particle condensational growth, and simultaneously increases both Dm and Nw, thereby enhancing precipitation. However, this process also depends on the content of CCN and various physical competition mechanisms.
Similarly, vertical profiles of precipitation parameters under varying CAPE conditions are presented. Figure S18 illustrates consistent patterns between convective and stratiform precipitation during spring, echoing the fundamental characteristics in Fig. 8. This consistency suggests that RH and CAPE exert analogous influences on precipitation across aerosol loading gradients during spring.
Summer convective precipitation (Fig. S19a–l) reveals distinct regional responses. In the BTH region, CAPE elevation significantly enhances low-AOD precipitation, likely driven by improved dynamic forcing that promotes cloud development (red point line in Fig. S15g). In contrast, the PRD exhibits pronounced precipitation suppression, most evident under moderate aerosol loading, where heightened CAPE intensifies particle break-up processes (Fig. S21h). These findings indicate that RH and CAPE exert divergent influences across regions. For RH, increasing moisture availability promotes particle growth via condensation under suited particle concentrations, but the Twomey effect dominates under high AOD loading, where particle competition for cloud water prevails. CAPE provides favorable dynamic conditions for cloud development, but simultaneously intensifies particle break-up through dynamic forces, which hinders the constant growth of cloud droplets and suppresses precipitation.
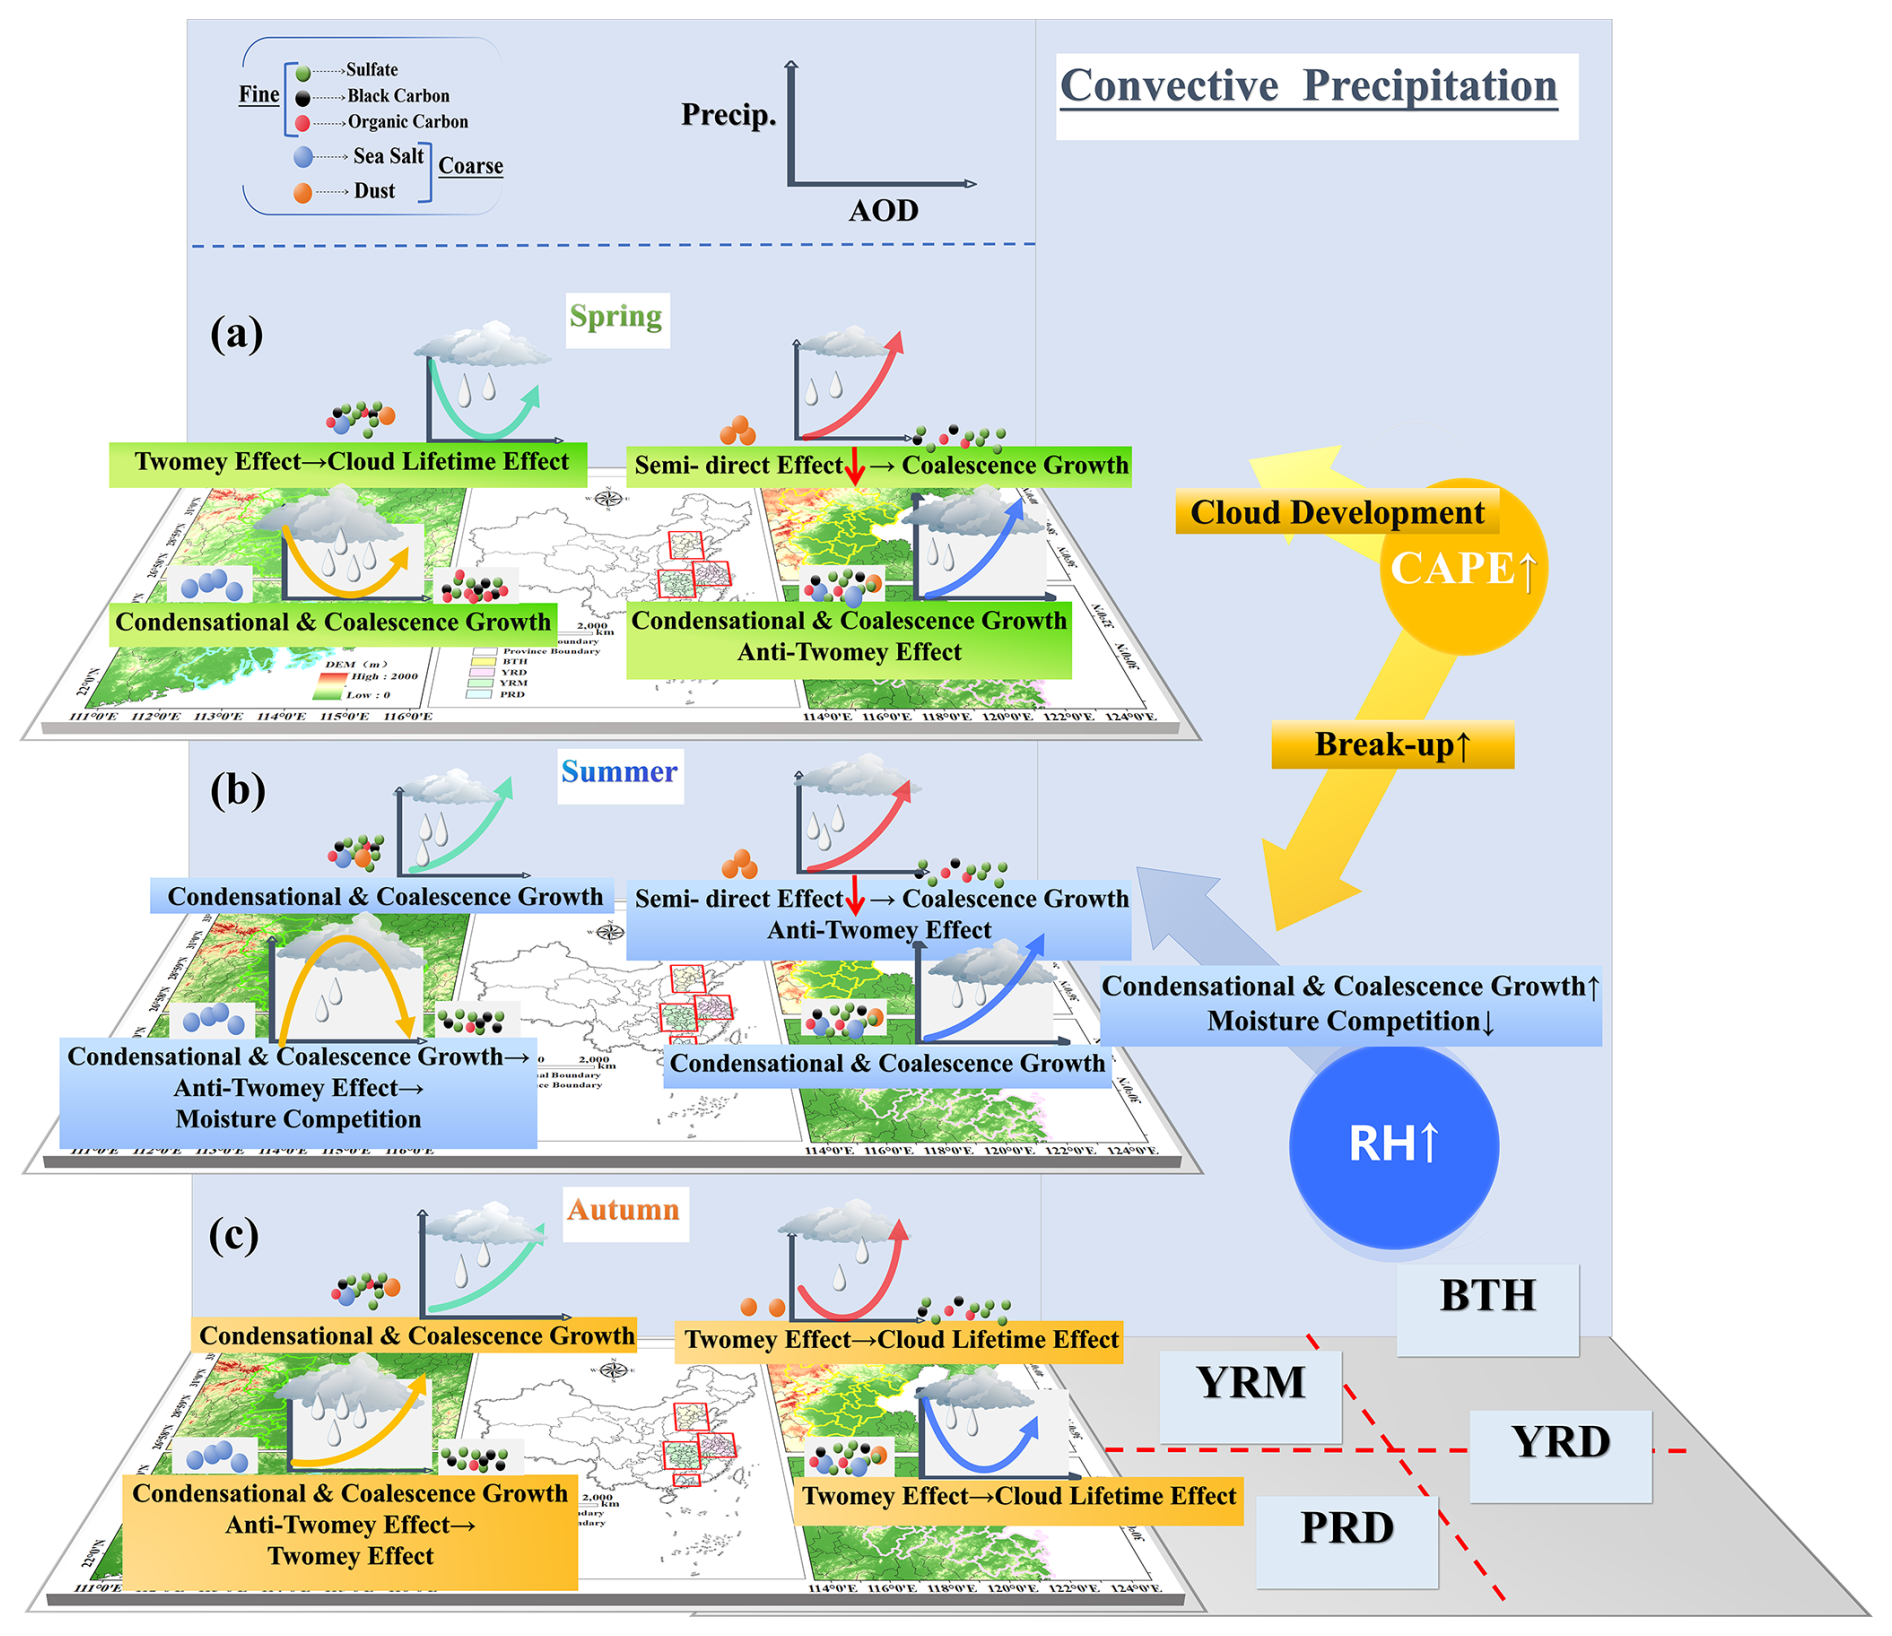
Figure 10Theoretical framework of aerosol impact on convective precipitation in the BTH, YRD, YRM, and PRD: (a) spring, (b) summer, and (c) autumn. Symbol conventions, ↑: Enhancement of process; ↓: Weakening of process; →: Transition from left-side process dominance to right-side process dominance; Right-side CAPE arrows: ↗ promotes precipitation; ↘ suppresses precipitation; Right-side RH arrows: ↗ enhances precipitation processes. Arrow length reflects the relative process intensity.
5.3 Sensitivity of precipitation microphysical processes
To validate the aforementioned inferences, the proportions of break-up and coalescence processes in convective and stratiform precipitation are further investigated. Figure S21 reveals that in convective precipitation, an increase in RH generally correlates with enhanced coalescence (white-green bars in the upper half; the trend is shown by the blue arrows) and reduced break-up (white-green bars in the lower half). Conversely, increasing CAPE is associated with decreased coalescence (green line in the upper half) and intensified break-up (yellow line in the lower half; the trend is shown by the red arrows), particularly in summer and the PRD region. As illustrated in Fig. S22, stratiform precipitation demonstrates similarities to convective precipitation, and the increase in RH makes the enhancement of coalescence processes more universal.
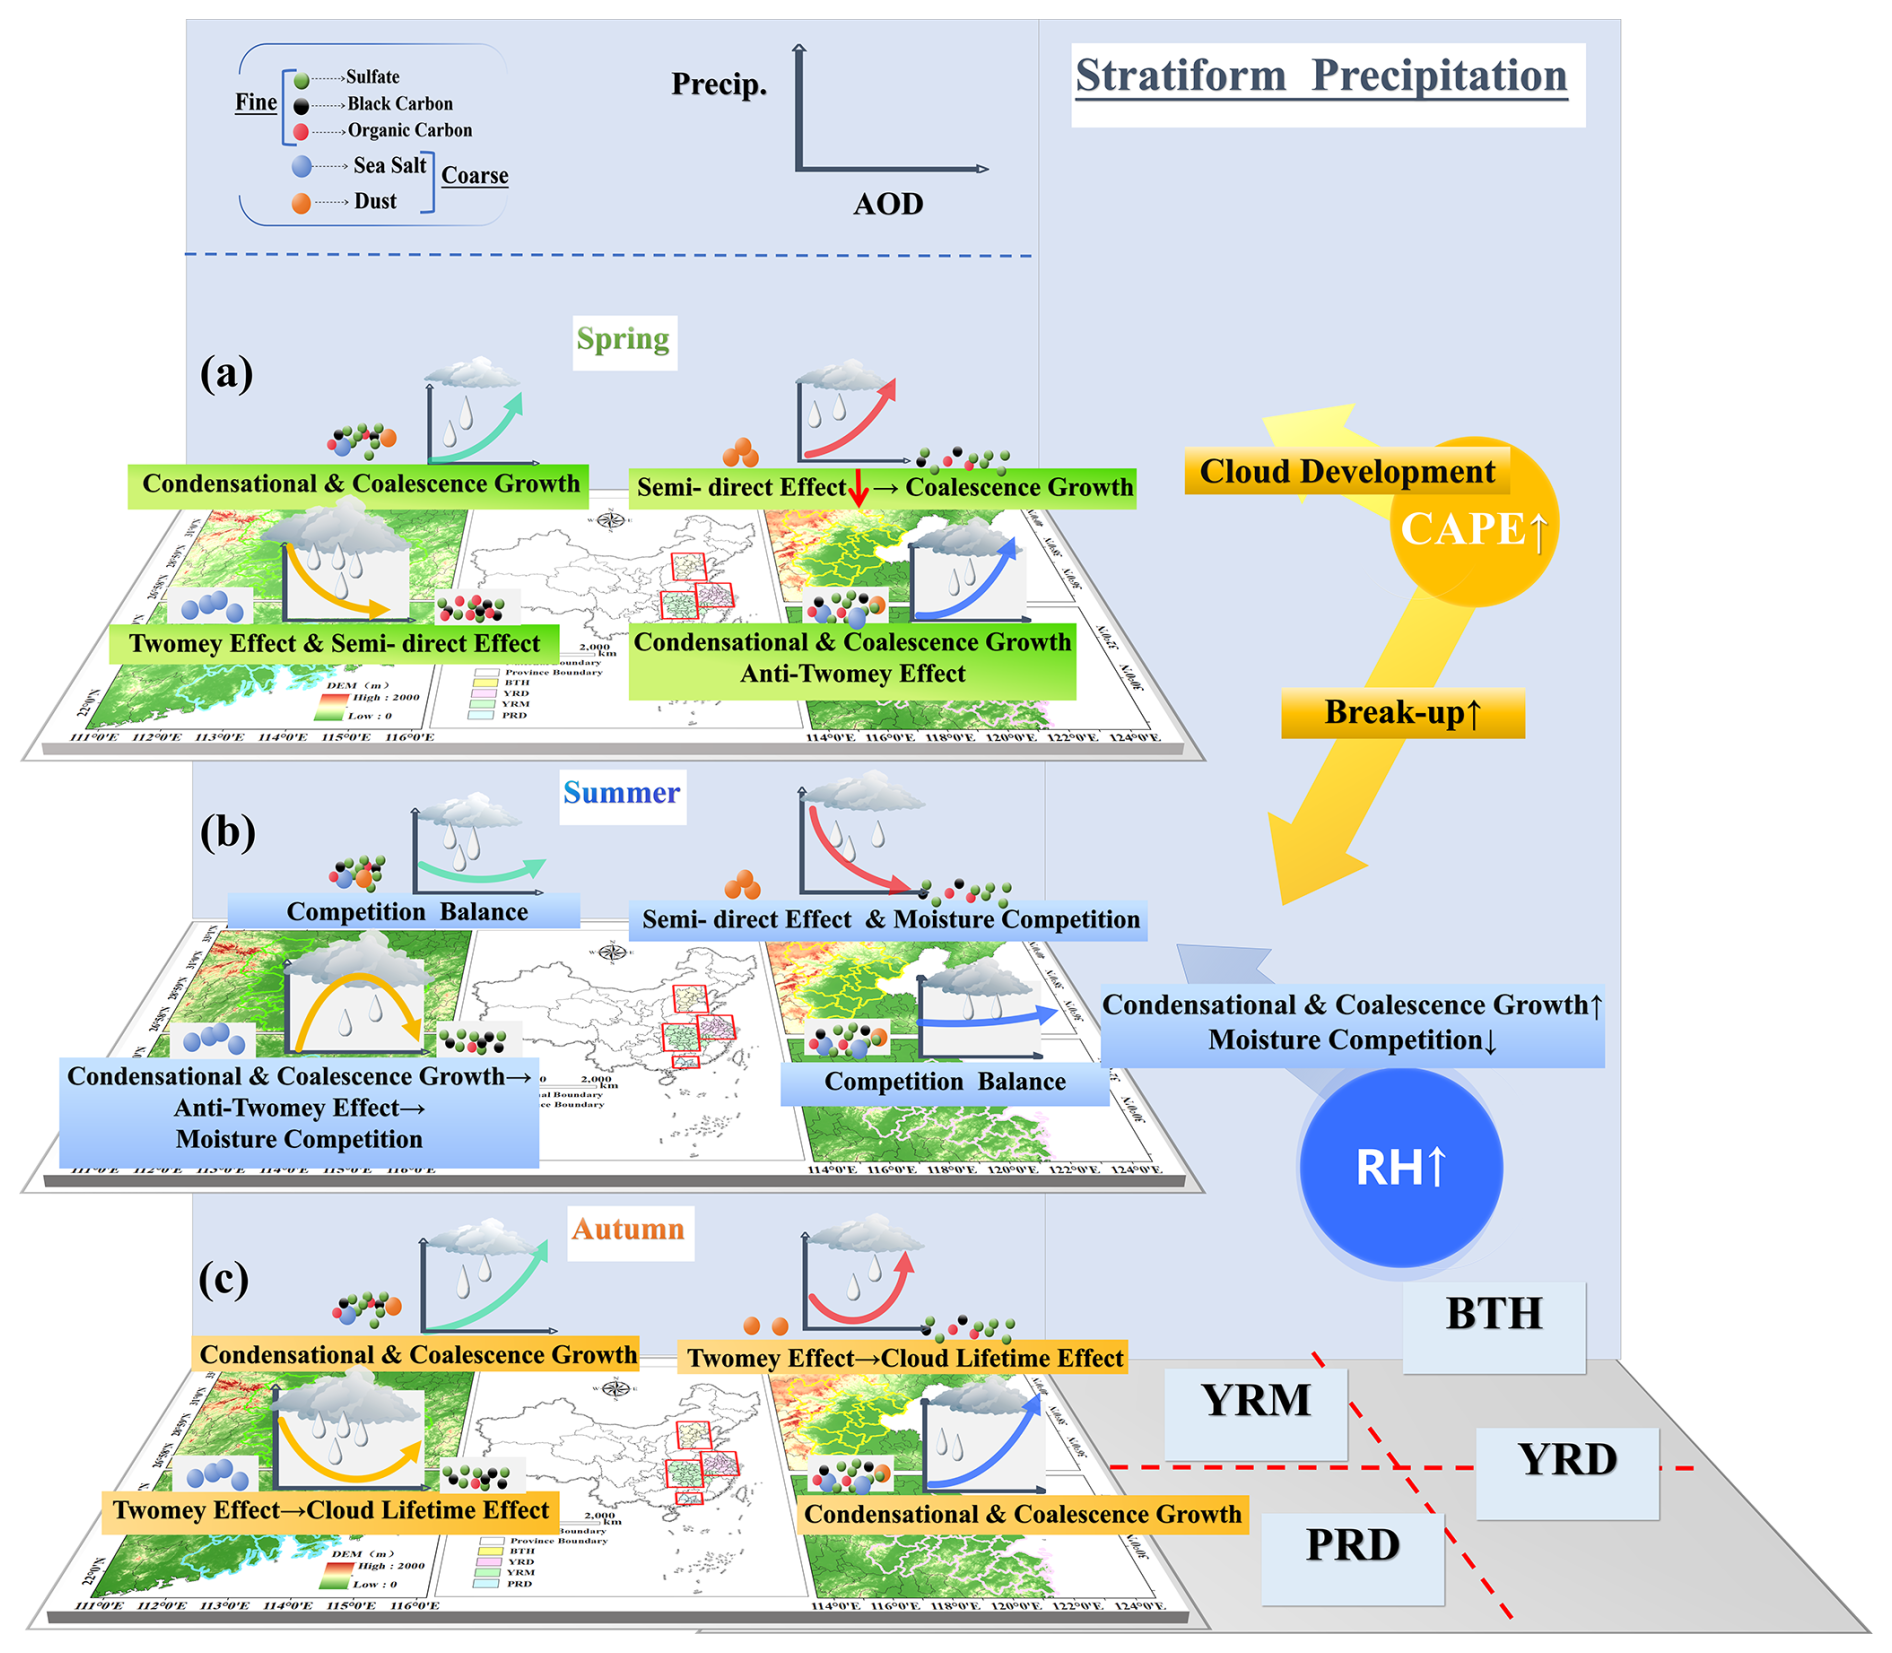
Figure 11Theoretical framework of aerosol impact on stratiform precipitation in the BTH, YRD, YRM, and PRD. The form of this expression is similar to that shown in Fig. 9.
This study systematically examined the impact of aerosols on precipitation parameters, vertical profiles, and microphysical processes in convective and stratiform precipitation across China's four major urban clusters (the BTH, YRD, YRM, and PRD) – during spring, summer, and autumn, utilizing the DPR-MERRA-2-ERA5 dataset. It further explores aerosol sensitivity to RH and CAPE, revealing regional heterogeneity, seasonal dependency, and the underlying microphysical processes of aerosol effects. The research indicates that physical processes, including condensational growth, coalescence growth, semi-direct effects, and moisture competition effects from aerosol-sourced CCN, trigger the Twomey effect, Anti-Twomey effect, and cloud lifetime effect, resulting in varied precipitation alterations. Additionally, an increase in aerosol loading diminishes the regional disparities in precipitation characteristics, with a more pronounced effect during the spring and summer. The precipitation parameters exhibit greater regional variability than seasonal variability, and convective precipitation experiences more significant seasonal and regional changes compared to stratiform precipitation. Based on the findings in Sects. 3–5, the physical mechanisms by which aerosols at varying concentrations influence convective precipitation (Fig. 10) and stratiform precipitation (Fig. 11) are illustrated, with the following specific conclusions:
For convective precipitation (Fig. 10): Precipitation in the BTH region is influenced by seasonal variations in dust aerosols. During spring (Fig. 10a) and summer (Fig. 10b), dust aerosols exert significant impacts, whereas their contributions declines in autumn (Fig. 10c), resulting in distinct precipitation characteristics. Specifically, DUA play a dual role: it suppresses precipitation through the semi-direct effect (by evaporating cloud droplets), yet also invigorates deep convection by serving as efficient IN. This competitive dynamic between the suppression of warm-rain processes and the invigoration of cold-rain processes is central to the complex aerosol-precipitation relationship. In autumn, when the DUA constitutes a minor fraction, rising aerosol loadings initially suppress precipitation through the Twomey effect, while simultaneously promoting cloud development, subsequently enhancing precipitation through increased CCN availability. The YRD exhibits a persistent precipitation increase with increasing aerosol loadings owing to the ample moisture supply. While sharing similar seasonal trends with the BTH, its underlying mechanisms differ significantly: abundant water vapor enables continuous precipitation growth during spring (Fig. 10a) and summer (Fig. 10b), primarily attributable to enhanced droplet condensation and coalescence processes. The PRD exhibits the most pronounced seasonal variability, attributable to shifts in the composition of hygroscopic aerosols (SSA). During spring (Fig. 10a), precipitation in the PRD is significantly higher than in other regions under low aerosol loading due to SSAs. As aerosol loadings increase, diminishing SSA proportion weakens this enhancement until rising hygroscopic organic carbon subsequently reinforces precipitation. In summer (Fig. 10b), sufficient moisture initially promotes droplet growth through condensation-coalescence under low aerosol loadings. However, the subsequent aerosol accumulation intensifies moisture competition and suppresses precipitation. Monsoon-influenced sea-salt high abundance (Xiao et al., 2025) further amplifies this competition effect, resulting in overall lower precipitation rates compared to other regions.
For stratiform precipitation (Fig. 11): Overall, stratiform and convective precipitation share fundamental similarities yet exhibit distinct microphysical processes due to differing cloud formation conditions. With a lower moisture supply than convective systems, stratiform precipitation in the BTH region is suppressed during summer (Fig. 11b) through aerosol semi-direct effects and moisture competition. Similarly, in the PRD, spring precipitation is reduced by organic carbon aerosols (Fig. 11a), which act as both hygroscopic and light-absorbing particles (Zhuang et al., 2025). This occurs when an insufficient moisture supply enhances the radiation-absorbing effect, dominating the precipitation reduction mechanism.
Furthermore, variations in RH and CAPE modulate aerosol-precipitation interactions, as shown in Figs. 10 and 11. Specifically, elevated RH indicates enhanced moisture availability, which facilitates rapid droplet growth through condensation and coalescence under suitable aerosol loading. Regarding dynamic influences, increased CAPE provides favorable conditions for cloud development while simultaneously enhancing droplet break-up through intensified turbulence, hindering cloud droplet growth, and suppressing precipitation, particularly in summer and the PRD region.
Overall, aerosol impacts on precipitation result from complex couplings among regional aerosol composition, moisture transport patterns, atmospheric stability, and precipitation types, generating both linear and nonlinear responses. These complex dynamics establish essential theoretical underpinnings for formulating atmospheric cleanup techniques in significant metropolitan centers, enhancing early warning systems for extreme precipitation occurrences, and refining regional climate models.
Building on the findings of Peng et al. (2025), which investigated the effects of fine and coarse aerosols on summer precipitation structure and microphysics in the YRD region, the present study expands the scope of analysis to examine aerosol impacts on precipitation vertical profiles and microphysical processes across multiple regions and seasons in China. This expanded scope, combined with a unified analytical methodology, enables a systematic cross-regional and cross-seasonal comparison that mitigates inconsistencies often associated with disparate data sources or methods, yielding the following key findings: (1) Enhanced aerosol loading reduces regional precipitation disparities, most pronounced in spring and summer. (2) Precipitation exhibits stronger regional than seasonal variability. (3) The BTH precipitation is dominated by dust aerosols, whereas the YRD and PRD are influenced by sea salt aerosols. These conclusions are primarily derived from analyses of satellite-based datasets, which provide extensive spatial coverage, high spatiotemporal resolution, and continuous temporal monitoring.
The results provide further evidence for several established mechanisms: The dominant role of dust aerosols in the BTH region aligns with existing research (Xi et al., 2024; Xiao et al., 2025), manifesting as impacts on precipitation through ARI (Sun and Zhao, 2021) and semi-direct effects, and also serving as effective IN to promote convective cloud development (Xi et al., 2025). Furthermore, the precipitation-enhancing effect of sea salt aerosols in the PRD region is consistent with prior observations (Chen et al., 2025; Guo et al., 2022).
However, as noted by Stier et al. (2024) and Zhao et al. (2024), aerosol impacts on precipitation remain highly complex, and their net effects are still subject to considerable uncertainty across different scales. Multiple factors are known to modulate precipitation processes, such as vertical wind shear (Riemer et al., 2010), cloud properties (Shao and Liu, 2005; Zhao et al., 2012), and latent heating (Zhu et al., 2025). Therefore, a critical challenge for future research lies in better disentangling the influence of such environmental meteorological factors from the overall aerosol effect.
In addition, it is important to acknowledge that considerable uncertainties persist in satellite data processing and retrieval algorithms, especially under complex atmospheric and surface conditions. Additionally, spatiotemporal resolution and format discrepancies across multisource data introduce unavoidable uncertainties. This study primarily focuses on the vertical structural characteristics of precipitation, whereas the analysis of aerosol data lacks comprehensive three-dimensional matching. Currently, vertical profiling of aerosols relies primarily on aircraft sounding (Zhou et al., 2023) and simulated radar signals (Fajardo-Zambrano et al., 2022), which remain spatially limited. Satellite remote sensing is hindered by inadequate resolution and deficiency in three-dimensional information (Li et al., 2022). However, the successful launch and stable operation of EarthCARE now facilitates accurate three-dimensional vertical profiling of clouds and aerosols via lidar (ATLID) and cloud profiling radar (CPR) (Irbah et al., 2023). The integration of high-precision vertical profiles from ATLID (aerosols), CPR (clouds), and GPM DPR (precipitation) will enable future researchers to quantify how aerosol layers at different altitudes modulate cloud microphysics and precipitation formation (Li et al., 2025b). For instance, this multi-source dataset provides an unprecedented opportunity to systematically unravel the distinct roles aerosols play in the microphysics of different hydrometeor phases, including the ice layer, melting layer, and liquid layer. This layered investigation will provide a clear path toward the mechanistic understanding of aerosol impacts on precipitation evolution, thereby addressing a critical gap stemming from insufficient 3D aerosol–cloud–precipitation co-location. Additionally, a more complete understanding of aerosol-precipitation interactions must account for the complex synergies among environmental factors, leveraging advanced statistical or modeling methods in a multi-factor analytical framework. Notably, as Zhao et al. (2025) revealed distinct aerosol-cloud interaction patterns over land versus ocean in the YRD, the absence of cloud parameter products in this study may inherently limit the depth of the aerosol-precipitation mechanism analysis. This methodological constraint thus necessitates the future integration of high-resolution cloud parameter datasets to refine research findings, enabling a comprehensive exploration of aerosol–cloud–precipitation coupling mechanisms, specifically encompassing dry and wet aerosol removal processes and precipitation feedback loops.
The V07A GPM 2ADPR products used in this paper are openly available at the NASA Goddard Space Flight Center's Precipitation Processing System (PPS) team (https://storm.pps.eosdis.nasa.gov/storm/, last access: 25 February 2026). MERRA-2 data can be downloaded from https://gmao.gsfc.nasa.gov/reanalysis/MERRA-2/data_access/ (last access: 25 February 2026). The ERA5 data can be downloaded from https://cds.climate.copernicus.eu/datasets/reanalysis-era5-pressure-levels?tab=overview (last access: 25 February 2026).
The supplement related to this article is available online at https://doi.org/10.5194/acp-26-3299-2026-supplement.
HP and ZL: Writing–review and editing, Writing–original draft, Visualization, Validation, Methodology, Investigation. XH: Writing–original draft, Validation, Supervision, Software, Resources, Methodology, Investigation, Formal analysis, Data curation, Conceptualization. WA: Writing–review and editing, Project administration. SH and JQ: Writing–review and editing, Investigation. XZ: Writing–review and editing, Funding acquisition, Formal analysis.
The contact author has declared that none of the authors has any competing interests.
Publisher's note: Copernicus Publications remains neutral with regard to jurisdictional claims made in the text, published maps, institutional affiliations, or any other geographical representation in this paper. The authors bear the ultimate responsibility for providing appropriate place names. Views expressed in the text are those of the authors and do not necessarily reflect the views of the publisher.
Zhen Li and Heyuan Peng contributed equally to this work and should be considered as co-first authors. The authors thank the anonymous reviewers for their constructive comments and suggestions, which have greatly improved the quality of this paper.
This paper was edited by Odran Sourdeval and reviewed by four anonymous referees.
This work has been jointly supported by the National Natural Science Foundation of China (grant nos. 42305150).
Ackerman, A. S., Toon, O. B., Stevens, D. E., Heymsfield, A. J., Ramanathan, V., and Welton, E. J.: Reduction of Tropical Cloudiness by Soot, Science, 288, 1042–1047, https://doi.org/10.1126/science.288.5468.1042, 2000.
Albrecht, B. A.: Aerosols, Cloud Microphysics, and Fractional Cloudiness, Science, 245, 1227–1230, https://doi.org/10.1126/science.245.4923.1227, 1989.
Buchard, V., Randles, C. A., Da Silva, A. M., Darmenov, A., Colarco, P. R., Govindaraju, R., Ferrare, R., Hair, J., Beyersdorf, A. J., Ziemba, L. D., and Yu, H.: The MERRA-2 aerosol reanalysis, 1980 onward. Part II: Evaluation and case studies, J. Climate [data set], 30, 6851–6872, https://doi.org/10.1175/JCLI-D-16-0613.1, 2017.
Chandrasekar, V. and Le, M.: Evaluation of profile classification module of GPM-DPR algorithm after launch, in: IGARSS 2015 – 2015 IEEE International Geoscience and Remote Sensing Symposium, Milan, Italy, 5174–5177, https://doi.org/10.1109/igarss.2015.7326999, 2015.
Chang, D., Cheng, Y., Reutter, P., Trentmann, J., Burrows, S. M., Spichtinger, P., Nordmann, S., Andreae, M. O., Pöschl, U., and Su, H.: Comprehensive mapping and characteristic regimes of aerosol effects on the formation and evolution of pyro-convective clouds, Atmos. Chem. Phys., 15, 10325–10348, https://doi.org/10.5194/acp-15-10325-2015, 2015.
Chen, F., Yang, Y., Yu, L., Li, Y., Liu, W., Liu, Y., and Lolli, S.: Distinct effects of fine and coarse aerosols on microphysical processes of shallow-precipitation systems in summer over southern China, Atmos. Chem. Phys., 25, 1587–1601, https://doi.org/10.5194/acp-25-1587-2025, 2025.
Chen, Y. and Luo, Y.: Analysis of Paths and Sources of Moisture for the South China Rainfall during the Presummer Rainy Season of 1979–2014, J. Meteorol. Res., 32, 744–757, https://doi.org/10.1007/s13351-018-8069-7, 2018.
Day, J. A., Fung, I., and Liu, W.: Changing character of rainfall in eastern China, 1951–2007, Proceedings of the National Academy of Sciences, 115, 2016–2021, https://doi.org/10.1073/pnas.1715386115, 2018.
Dong, X., Li, R., Wang, Y., Fu, Y., and Zhao, C.: Potential impacts of sahara dust aerosol on rainfall vertical structure over the atlantic ocean as identified from EOF analysis, JGR Atmospheres, 123, 8850–8868, https://doi.org/10.1029/2018JD028500, 2018.
Fajardo-Zambrano, C. M., Bravo-Aranda, J. A., Granados-Muñoz, M. J., Montilla-Rosero, E., Casquero-Vera, J. A., Rejano, F., Castillo, S., and Alados-Arboledas, L.: Lidar and Radar Signal Simulation: Stability Assessment of the Aerosol–Cloud Interaction Index, Remote Sensing, 14, 1333, https://doi.org/10.3390/rs14061333, 2022.
Fan, J., Zhang, R., Li, G., and Tao, W.: Effects of aerosols and relative humidity on cumulus clouds, J. Geophys. Res., 112, https://doi.org/10.1029/2006jd008136, 2007.
Garrett, T. J. and Zhao, C.: Increased Arctic cloud longwave emissivity associated with pollution from mid-latitudes, Nature, 440, 787–789, https://doi.org/10.1038/nature04636, 2006.
Gettelman, A.: Putting the clouds back in aerosol–cloud interactions, Atmos. Chem. Phys., 15, 12397–12411, https://doi.org/10.5194/acp-15-12397-2015, 2015.
Guo, J., Su, T., Li, Z., Miao, Y., Li, J., Liu, H., Xu, H., Cribb, M., and Zhai, P.: Declining frequency of summertime local-scale precipitation over eastern China from 1970 to 2010 and its potential link to aerosols, Geophysical Research Letters, 44, 5700–5708, https://doi.org/10.1002/2017GL073533, 2017.
Guo, J., Liu, H., Li, Z., Rosenfeld, D., Jiang, M., Xu, W., Jiang, J. H., He, J., Chen, D., Min, M., and Zhai, P.: Aerosol-induced changes in the vertical structure of precipitation: a perspective of TRMM precipitation radar, Atmos. Chem. Phys., 18, 13329–13343, https://doi.org/10.5194/acp-18-13329-2018, 2018.
Guo, J., Su, T., Chen, D., Wang, J., Li, Z., Lv, Y., Guo, X., Liu, H., Cribb, M., and Zhai, P.: Declining Summertime Local-Scale Precipitation Frequency Over China and the United States, 1981–2012: The Disparate Roles of Aerosols, Geophysical Research Letters, 46, 13281–13289, https://doi.org/10.1029/2019GL085442, 2019.
Guo, J., Luo, Y., Yang, J., Furtado, K., and Lei, H.: Effects of anthropogenic and sea salt aerosols on a heavy rainfall event during the early-summer rainy season over coastal Southern China, Atmospheric Research, 265, 105923, https://doi.org/10.1016/j.atmosres.2021.105923, 2022.
Hersbach, H., Bell, B., Berrisford, P., Hirahara, S., Horányi, A., Muñoz-Sabater, J., Nicolas, J., Peubey, C., Radu, R., Schepers, D., Simmons, A., Soci, C., Abdalla, S., Abellan, X., Balsamo, G., Bechtold, P., Biavati, G., Bidlot, J., Bonavita, M., De Chiara, G., Dahlgren, P., Dee, D., Diamantakis, M., Dragani, R., Flemming, J., Forbes, R., Fuentes, M., Geer, A., Haimberger, L., Healy, S., Hogan, R. J., Hólm, E., Janisková, M., Keeley, S., Laloyaux, P., Lopez, P., Lupu, C., Radnoti, G., De Rosnay, P., Rozum, I., Vamborg, F., Villaume, S., and Thépaut, J.: The ERA5 global reanalysis, Q. J. Roy. Meteor. Soc. [data set], 146, 1999–2049, https://doi.org/10.1002/qj.3803, 2020.
Hou, A. Y., Kakar, R. K., Neeck, S., Azarbarzin, A. A., Kummerow, C. D., Kojima, M., Oki, R., Nakamura, K., and Iguchi, T.: The Global Precipitation Measurement Mission, B. Am. Meteorol. Soc. [data set], 95, 701–722, https://doi.org/10.1175/bams-d-13-00164.1, 2014.
Hu, X., Ai, W., Qiao, J., Hu, S., Han, D., and Yan, W.: Microphysics of Summer Precipitation Over Yangtze-Huai River Valley Region in China Revealed by GPM DPR Observation, Earth and Space Science, 9, https://doi.org/10.1029/2021ea002021, 2022.
Hu, X., Ai, W., Qiao, J., and Yan, W.: Insight into global climatology of melting layer: Latitudinal dependence and orographic relief, Theor. Appl. Climatol., 155, 4863–4873, https://doi.org/10.1007/s00704-024-04926-6, 2024.
Huang, J., Wang, T., Wang, W., Li, Z., and Yan, H.: Climate effects of dust aerosols over East Asian arid and semiarid regions, Journal of Geophysical Research: Atmospheres, 119, https://doi.org/10.1002/2014jd021796, 2014.
IPCC: Climate Change 2013: The Physical Science Basis. Contribution of Working Group I to the Fifth Assessment Report of the Intergovernmental Panel on Climate Change, edited by: Stocker, T. F., Qin, D., Plattner, G.-K., Tignor, M., Allen, S. K., Boschung, J., Nauels, A., Xia, Y., Bex, V., and Midgley, P. M., Cambridge University Press, Cambridge, United Kingdom and New York, NY, USA, 1535 pp., https://doi.org/10.1017/CBO9781107415324, 2013.
IPCC: Climate Change 2021: The Physical Science Basis. Contribution of Working Group I to theSixth Assessment Report of the Intergovernmental Panel on Climate Change, edited by: Masson-Delmotte, V., Zhai, P., Pirani, A., Connors, S. L., Péan, C., Berger, S., Caud, N., Chen, Y., Goldfarb, L., Gomis, M. I., Huang, M., Leitzell, K., Lonnoy, E., Matthews, J. B. R., Maycock, T. K., Waterfield, T., Yelekçi, O., Yu, R., and Zhou, B., Cambridge University Press, Cambridge, United Kingdom and New York, NY, USA, 2338 pp., https://doi.org/10.1017/9781009157896, 2021.
Irbah, A., Delanoë, J., van Zadelhoff, G.-J., Donovan, D. P., Kollias, P., Puigdomènech Treserras, B., Mason, S., Hogan, R. J., and Tatarevic, A.: The classification of atmospheric hydrometeors and aerosols from the EarthCARE radar and lidar: the A-TC, C-TC and AC-TC products, Atmos. Meas. Tech., 16, 2795–2820, https://doi.org/10.5194/amt-16-2795-2023, 2023.
Ji, Z. and Tian, S.: A novel potential cause of extreme precipitation in the northwest China, Heliyon, 10, e30826, https://doi.org/10.1016/j.heliyon.2024.e30826, 2024.
Jiang, M., Li, Y., Hu, W., Yang, Y., Brasseur, G., and Zhao, X.: Model-based insights into aerosol perturbation on pristine continental convective precipitation, Atmos. Chem. Phys., 23, 4545–4557, https://doi.org/10.5194/acp-23-4545-2023, 2023.
Kotsuki, S., Terasaki, K., Satoh, M., and Miyoshi, T.: Ensemble-based data assimilation of GPM DPR reflectivity: Cloud microphysics parameter estimation with the nonhydrostatic icosahedral atmospheric model (NICAM), Journal of Geophysical Research: Atmospheres, 128, https://doi.org/10.1029/2022jd037447, 2023.
Kumjian, M. R. and Prat, O. P.: The Impact of Raindrop Collisional Processes on the Polarimetric Radar Variables, Journal of the Atmospheric Sciences, 71, 3052–3067, https://doi.org/10.1175/jas-d-13-0357.1, 2014.
Lasser, M., O, S., and Foelsche, U.: Evaluation of GPM-DPR precipitation estimates with WegenerNet gauge data, Atmos. Meas. Tech., 12, 5055–5070, https://doi.org/10.5194/amt-12-5055-2019, 2019.
Lee, S. S., Donner, L. J., Phillips, V. T. J., and Ming, Y.: The dependence of aerosol effects on clouds and precipitation on cloud-system organization, shear and stability, Journal of Geophysical Research: Atmospheres, 113, https://doi.org/10.1029/2007JD009224, 2008.
Li, J., Carlson, B. E., Yung, Y. L., Lv, D., Hansen, J., Penner, J. E., Liao, H., Ramaswamy, V., Kahn, R. A., Zhang, P., Dubovik, O., Ding, A., Lacis, A. A., Zhang, L., and Dong, Y.: Scattering and absorbing aerosols in the climate system, Nat. Rev. Earth Environ., 3, 363–379, https://doi.org/10.1038/s43017-022-00296-7, 2022.
Li, J., Zhao, C., Sun, Y., Zhao, X., Yang, J., Yang, Y., Chen, A., and Zhou, Y.: Distinct Aerosol Impacts on Local Scale Convective Rainfall Between Sichuan Basin and North China Plain Regions in China, Journal of Geophysical Research: Atmospheres, 130, e2024JD042649, https://doi.org/10.1029/2024JD042649, 2025a.
Li, Z., Lau, W. K.-M., Ramanathan, V., Wu, G., Ding, Y., Manoj, M. G., Liu, J., Qian, Y., Li, J., Zhou, T., Fan, J., Rosenfeld, D., Ming, Y., Wang, Y., Huang, J., Wang, B., Xu, X., Lee, S.-S., Cribb, M., Zhang, F., Yang, X., Zhao, C., Takemura, T., Wang, K., Xia, X., Yin, Y., Zhang, H., Guo, J., Zhai, P. M., Sugimoto, N., Babu, S. S., and Brasseur, G. P.: Aerosol and monsoon climate interactions over asia, Reviews of Geophysics, 54, 866–929, https://doi.org/10.1002/2015RG000500, 2016.
Li, Z., Wang, Y., Guo, J., Zhao, C., Cribb, M. C., Dong, X., Fan, J., Gong, D., Huang, J., Jiang, M., Jiang, Y., Lee, S.-S., Li, H., Li, J., Liu, J., Qian, Y., Rosenfeld, D., Shan, S., Sun, Y., Wang, H., Xin, J., Yan, X., Yang, X., Yang, X., Zhang, F., and Zheng, Y.: East asian study of tropospheric aerosols and their impact on regional clouds, precipitation, and climate (EAST-AIRCPC), Journal of Geophysical Research: Atmospheres, 124, 13026–13054, https://doi.org/10.1029/2019JD030758, 2019.
Li, Z., Ge, S., Hu, X., Ai, W., Tang, J., Qiao, J., Hu, S., Zhao, X., Wu, H., Li, Z., Ge, S., Hu, X., Ai, W., Tang, J., Qiao, J., Hu, S., Zhao, X., and Wu, H.: Preliminary analysis of a novel spaceborne pseudo tripe-frequency radar observations on cloud and precipitation: EarthCARE CPR-GPM DPR coincidence dataset, Remote Sensing, 17, https://doi.org/10.3390/rs17152550, 2025b.
Liu, C. and Zipser, E. J.: The global distribution of largest, deepest, and most intense precipitation systems, Geophysical Research Letters, 42, 3591–3595, https://doi.org/10.1002/2015gl063776, 2015.
Liu, Y., de Leeuw, G., Kerminen, V.-M., Zhang, J., Zhou, P., Nie, W., Qi, X., Hong, J., Wang, Y., Ding, A., Guo, H., Krüger, O., Kulmala, M., and Petäjä, T.: Analysis of aerosol effects on warm clouds over the Yangtze River Delta from multi-sensor satellite observations, Atmos. Chem. Phys., 17, 5623–5641, https://doi.org/10.5194/acp-17-5623-2017, 2017.
Peng, H., Hu, X., Ai, W., Qiao, J., and Zhao, X.: Effects of fine and coarse aerosols on the summer precipitation structure and microphysics over the Yangtze River delta region, Atmospheric Research, 326, 108277, https://doi.org/10.1016/j.atmosres.2025.108277, 2025.
Pravia-Sarabia, E., Montávez, J. P., Halifa-Marin, A., Jiménez-Guerrero, P., and Gomez-Navarro, J. J.: The role of aerosol concentration on precipitation in a winter extreme mixed-phase system: The case of storm filomena, Remote Sensing, 15, 1398, https://doi.org/10.3390/rs15051398, 2023.
Ramanathan, V., Crutzen, P. J., Kiehl, J. T., and Rosenfeld, D.: Aerosols, Climate, and the Hydrological Cycle, Science, 294, 2119–2124, https://doi.org/10.1126/science.1064034, 2001.
Riemer, M., Montgomery, M. T., and Nicholls, M. E.: A new paradigm for intensity modification of tropical cyclones: thermodynamic impact of vertical wind shear on the inflow layer, Atmos. Chem. Phys., 10, 3163–3188, https://doi.org/10.5194/acp-10-3163-2010, 2010.
Rosenfeld, D., Lohmann, U., Raga, G. B., O'Dowd, C. D., Kulmala, M., Fuzzi, S., Reissell, A., and Andreae, M. O.: Flood or Drought: How Do Aerosols Affect Precipitation?, Science, 321, 1309–1313, https://doi.org/10.1126/science.1160606, 2008.
Shao, H. and Liu, G.: Why is the satellite observed aerosol's indirect effect so variable?, Geophysical Research Letters, 32, https://doi.org/10.1029/2005GL023260, 2005.
Snively, D. V. and Gallus, W. A.: Prediction of Convective Morphology in Near-Cloud-Permitting WRF Model Simulations, Weather and Forecasting, 29, 130–149, https://doi.org/10.1175/waf-d-13-00047.1, 2014.
Stevens, B. and Feingold, G.: Untangling aerosol effects on clouds and precipitation in a buffered system, Nature, 461, 607–613, https://doi.org/10.1038/nature08281, 2009.
Stier, P., van den Heever, S. C., Christensen, M. W., Gryspeerdt, E., Dagan, G., Saleeby, S. M., Bollasina, M., Donner, L., Emanuel, K., Ekman, A. M. L., Feingold, G., Field, P., Forster, P., Haywood, J., Kahn, R., Koren, I., Kummerow, C., L'Ecuyer, T., Lohmann, U., Ming, Y., Myhre, G., Quaas, J., Rosenfeld, D., Samset, B., Seifert, A., Stephens, G., and Tao, W.-K.: Multifaceted aerosol effects on precipitation, Nat. Geosci., 17, 719–732, https://doi.org/10.1038/s41561-024-01482-6, 2024.
Storer, R. L., Van Den Heever, S. C., and Stephens, G. L.: Modeling Aerosol Impacts on Convective Storms in Different Environments, Journal of the Atmospheric Sciences, 67, 3904–3915, https://doi.org/10.1175/2010jas3363.1, 2010.
Sun, N., Fu, Y., Zhong, L., and Li, R.: Aerosol effects on the vertical structure of precipitation in east China, npj Clim. Atmos. Sci., 5, 60, https://doi.org/10.1038/s41612-022-00284-0, 2022.
Sun, Y. and Zhao, C.: Distinct impacts on precipitation by aerosol radiative effect over three different megacity regions of eastern China, Atmos. Chem. Phys., 21, 16555–16574, https://doi.org/10.5194/acp-21-16555-2021, 2021.
Sun, Y., Dong, X., Cui, W., Zhou, Z., Fu, Z., Zhou, L., Deng, Y., and Cui, C.: Vertical Structures of Typical Meiyu Precipitation Events Retrieved From GPM-DPR, Journal of Geophysical Research: Atmospheres, 125, https://doi.org/10.1029/2019jd031466, 2020.
Sun, Y., Wang, Y., Zhao, C., Zhou, Y., Yang, Y., Yang, X., Fan, H., Zhao, X., and Yang, J.: Vertical Dependency of Aerosol Impacts on Local Scale Convective Precipitation, Geophysical Research Letters, 50, https://doi.org/10.1029/2022gl102186, 2023.
Twomey, S.: Pollution and the planetary albedo, Atmospheric Environment (1967), 8, 1251–1256, https://doi.org/10.1016/0004-6981(74)90004-3, 1974.
Wang, Z., Hu, X., Ai, W., Qiao, J., and Zhao, X.: Microphysical characteristics of monsoon precipitation over yangtze-and-huai river basin and south China: A comparative study from GPM DPR observation, Remote Sensing, 16, 3433, https://doi.org/10.3390/rs16183433, 2024.
Wen, L., Chen, G., Yang, C., Zhang, H., and Fu, Z.: Seasonal variations in precipitation microphysics over East China based on GPM DPR observations, Atmospheric Research, 293, 106933, https://doi.org/10.1016/j.atmosres.2023.106933, 2023.
Xi, J., Li, R., Fan, X., and Wang, Y.: Aerosol effects on the three-dimensional structure of organized precipitation systems over Beijing-Tianjin-Hebei region in summer, Atmospheric Research, 298, 107146, https://doi.org/10.1016/j.atmosres.2023.107146, 2024.
Xi, J., Wang, Y., Li, R., Wu, B., Fan, X., Ma, X., and Meng, Z.: The impact of Sahara dust aerosols on the three-dimensional structure of precipitation systems of different sizes in spring, EGUsphere [preprint], https://doi.org/10.5194/egusphere-2025-2799, 2025.
Xiao, Y., Zhang, J., Zhu, J., and Dai, Q.: Exploration of aerosol-precipitation relationships under different climate regimes in China, GIScience & Remote Sensing, 62, https://doi.org/10.1080/15481603.2025.2457992, 2025.
Xie, X., Liu, X., Peng, Y., Wang, Y., Yue, Z., and Li, X.: Numerical simulation of clouds and precipitation depending on different relationships between aerosol and cloud droplet spectral dispersion, Tellus B: Chemical and Physical Meteorology, 65, 19054, https://doi.org/10.3402/tellusb.v65i0.19054, 2013.
Zhai, H., Yao, J., Wang, G., and Tang, X.: Spatio-Temporal Characteristics and Variation Pattern of the Atmospheric Particulate Matter Concentration: A Case Study of the Beijing–Tianjin–Hebei Region, China, Atmosphere, 13, 120, https://doi.org/10.3390/atmos13010120, 2022.
Zhang, J., Gao, Z., and Li, Y.: Deep-Learning Correction Methods for Weather Research and Forecasting (WRF) Model Precipitation Forecasting: A Case Study over Zhengzhou, China, Atmosphere, 15, 631, https://doi.org/10.3390/atmos15060631, 2024.
Zhao, C., Klein, S. A., Xie, S., Liu, X., Boyle, J. S., and Zhang, Y.: Aerosol first indirect effects on non-precipitating low-level liquid cloud properties as simulated by CAM5 at ARM sites, Geophysical Research Letters, 39, https://doi.org/10.1029/2012GL051213, 2012.
Zhao, C., Lin, Y., Wu, F., Wang, Y., Li, Z., Rosenfeld, D., and Wang, Y.: Enlarging Rainfall Area of Tropical Cyclones by Atmospheric Aerosols, Geophysical Research Letters, 45, 8604–8611, https://doi.org/10.1029/2018GL079427, 2018.
Zhao, C., Yang, Y., Fan, H., Huang, J., Fu, Y., Zhang, X., Kang, S., Cong, Z., Letu, H., and Menenti, M.: Aerosol characteristics and impacts on weather and climate over the Tibetan Plateau, Natl. Sci. Rev., 7, 492–495, https://doi.org/10.1093/nsr/nwz184, 2020.
Zhao, C., Sun, Y., Yang, J., Li, J., Zhou, Y., Yang, Y., Fan, H., and Zhao, X.: Observational evidence and mechanisms of aerosol effects on precipitation, Science Bulletin, 69, 1569–1580, https://doi.org/10.1016/j.scib.2024.03.014, 2024.
Zhao, J., Li, T., Shi, K., Qiao, Z., and Xia, Z.: Evaluation of ERA-5 precipitable water vapor data in plateau areas: A case study of the northern qinghai-tibet plateau, Atmosphere, 12, 1367, https://doi.org/10.3390/atmos12101367, 2021.
Zhao, X., Zhao, C., Chi, Y., Yang, J., Sun, Y., Yang, Y., and Fan, H.: Different Impacts of Aerosols on Cloud Development over Land and Ocean Regions in East China, Adv. Atmos. Sci., 42, 731–743, https://doi.org/10.1007/s00376-024-4165-z, 2025.
Zhou, J., Zhao, W., Fang, B., Xu, X., Wang, S., Liu, Q., Zhang, W., and Chen, W.: Unmanned-aerial-vehicle-borne cavity enhanced albedometer: A powerful tool for simultaneous in-situ measurement of aerosol light scattering and absorption vertical profiles, Opt. Express, 31, 20518, https://doi.org/10.1364/oe.493696, 2023.
Zhou, L., Xu, G., Xiao, Y., Wan, R., Wang, J., and Leng, L.: Vertical structures of abrupt heavy rainfall events over southwest China with complex topography detected by dual-frequency precipitation radar of global precipitation measurement satellite, Intl Journal of Climatology, 42, 7628–7647, https://doi.org/10.1002/joc.7669, 2022.
Zhu, H., Zhao, H., Yang, S., Zhou, R., Wang, Y., Zou, Y., Zhao, C., and Li, R.: Smoke aerosols elevate precipitation top and latent heat to the upper atmosphere globally, npj Clim. Atmos. Sci., 8, https://doi.org/10.1038/s41612-025-01047-3, 2025.
Zhuang, Y., Lin, T., Zhou, W., Guo, Z., and Wang, F.: Characteristics of temporal variations in organic and elemental carbon aerosols from Eastern China in 2011–2020, Journal of Environmental Sciences, 155, 583–596, https://doi.org/10.1016/j.jes.2024.05.037, 2025.
- Abstract
- Introduction
- Data and Methods
- Influence of aerosols on precipitation structure and properties
- Influence of aerosols on precipitation microphysical processes
- Meteorological effects
- Discussion
- Conclusions
- Data availability
- Author contributions
- Competing interests
- Disclaimer
- Acknowledgements
- Review statement
- Financial support
- References
- Supplement